building communities, building lives. -...
TRANSCRIPT

Building communities, building lives.
Fletcher Building Annual Report 2017

The Kowhai Ridge development in Auckland includes a range of housing solutions from open-market stand-alone homes to 30% housing solutions designed to meet the needs of Community Housing Providers.
The MacKay‘s to Peka Peka expressway separates local and highway traffic and enables safer and shorter trips to and through the Kāpiti Coast.
Helping people into housing
Connecting communities

We are proud of the real differences we make to the lives of the people in the communities we work in. From the houses they live in, the roads they drive on, the buildings they work in, to the schools and hospitals that serve them. We get behind many of the causes, activities and initiatives that matter to people who live in our communities.
Customer first
Ensuring our customers around the world have what they need, when they need it – if not before.

RE:RE:
Impacting individuals,
their families and the wider
community and helping build better lives.

Business overview 04
Chairman's report 10
Business review 14
Building Products 14
International 16
Distribution 18
Construction 20
Residential and Land Development 22
Focus areas 24
Our communities 24
Our people 26
Health and safety 28
Sustainability and environment 30
Governance 32
Board profiles 36
Remuneration report 38
Financial review 44
Trend statement 54
Financial statements 55
Independent auditor's report 97
Regulatory disclosures 101
Investor information 109
Directory 110
Contents
The directors are responsible for preparing the annual report, including the financial statements and ensuring that the financial statements comply with generally accepted accounting practices. The directors believe that proper accounting records have been kept that allow for the determination of the group’s financial position with reasonable accuracy and that the financial statements comply with the requirements of the Companies Act 1993 and the Financial Markets Conduct Act 2013. The financial statements have been independently audited, and the auditor has issued an unqualified audit report.
When used in this annual report, references to the ‘company’ are references to Fletcher BuildingLimited. References to ‘Fletcher Building’ or the ‘group’ are to Fletcher Building Limited, together with its subsidiaries and its interests in associates and joint ventures. All references to financial years (e.g. FY16 and FY17) in this annual report are to the financial year ended 30 June. References to $ and NZ$ are to New Zealand dollars unless otherwise stated.
Any references to documents and information included on external websites, including FletcherBuilding’s website, are provided for convenience alone and none of the documents or other information on those websites is incorporated by reference in this annual report.
You can obtain an electronic copy of this annual report at http://www.fbu.com/investor-centre/reports-and-presentation/
The annual report is dated 16 August 2017 and is signed on behalf of the board by:
Sir Ralph Norris Chairman of Board of Directors
John Judge Director

Driving value
Inputs Value creation
• Firth• Humes• Laminex
• GBC Winstone• Rocla• Iplex• Roof Tile Group• Winstone Wallboards• Formica• Tasman Insulation NZ• Fletcher Insulation
SHARED VISION: Building Better, Together
SHARED VALUES: Be Bold Better Every Day Customer Leading Play Fair
VISION AND VALUES
STRATEGIC PRIORITIES
People Customers
Source and Manufacture
Brand and product portfolio
Innovation
Customer experiences
Raw materials
Plant and machinery
IP and technology
Distribution channels
Investor capital
21,000+ skilled people globally
04 Fletcher Building Annual Report 2017
Business overview

Outputs
Returns for shareholders
Customer engagement
Safe working conditions and rewarding careers for staff
Support for families and communities
Roads, tunnels and other public infrastructure and amenities that drive economies
A more sustainable business
Housing for New Zealand
Employment and investment in local economies
• PlaceMakers• Mico• Steel Distribution• Tradelink• Stramit• Tasman Sinkware
• Infrastructure• Higgins • Building + Interiors• South Pacific• Fletcher Living• Land Development
Efficiencies Profitable growth
BuildDistribute
SHARED VISION: Building Better, Together
SHARED VALUES: Be Bold Better Every Day Customer Leading Play Fair
05 Fletcher Building Annual Report 2017

Where we work
sites423#
sites347#
# These numbers include all head and national offices; sales, manufacturing and distribution sites; branches; showrooms; showhomes; and sites that are a combination of these. The numbers do not include office, project, and construction sites from the Construction division.
06 Fletcher Building Annual Report 2017
Business overview

21,000+
With more than 21,000 people across hundreds of sites globally, the Fletcher Building family is a diverse group of people who use all their experience, skills and individuality in contributing to the company. We are committed to working together to deliver for our customers and supporting our communities.
People
07 Fletcher Building Annual Report 2017

INTERNATIONAL
Our family of internationally recognised brands features in built environments that range from kitchens to commercial buildings.
BUILDING PRODUCTS
From our quarry operations to manufacturing plants, we source and manufacture trusted, high-quality building products.
What we do
At Fletcher Building our vision is Building Better, Together – and this is exactly what our 21,000+ people across the globe are delivering every day. We manufacture and distribute high-quality building products and we build and deliver homes, communities, commercial buildings and major infrastructure projects. At every step our business starts and ends with the customer, and we take great pride in the work we achieve together.
08 Fletcher Building Annual Report 2017
Business overview

DISTRIBUTION
Our network delivers essential building, plumbing and steel products throughout New Zealand and Australia, from frame and truss timber to blocks and fastenings.
CONSTRUCTION
We have more than 100 years’ experience leading commercial and infrastructure projects across New Zealand and the South Pacific – keeping people moving, businesses thriving and cities and economies growing.
RESIDENTIAL AND LAND DEVELOPMENT
We are creating desirable communities for a growing Auckland and transforming the heart of Christchurch.
09 Fletcher Building Annual Report 2017
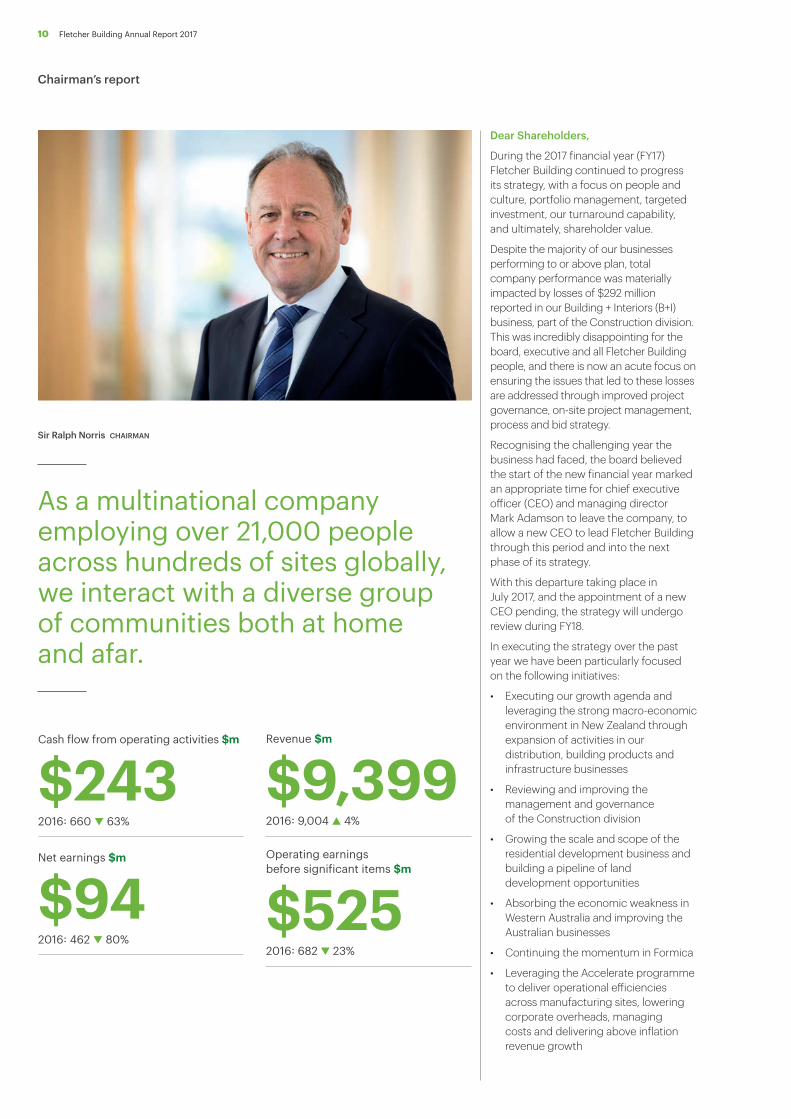
Dear Shareholders,
During the 2017 financial year (FY17) Fletcher Building continued to progress its strategy, with a focus on people and culture, portfolio management, targeted investment, our turnaround capability, and ultimately, shareholder value.
Despite the majority of our businesses performing to or above plan, total company performance was materially impacted by losses of $292 million reported in our Building + Interiors (B+I) business, part of the Construction division. This was incredibly disappointing for the board, executive and all Fletcher Building people, and there is now an acute focus on ensuring the issues that led to these losses are addressed through improved project governance, on-site project management, process and bid strategy.
Recognising the challenging year the business had faced, the board believed the start of the new financial year marked an appropriate time for chief executive officer (CEO) and managing director Mark Adamson to leave the company, to allow a new CEO to lead Fletcher Building through this period and into the next phase of its strategy.
With this departure taking place in July 2017, and the appointment of a new CEO pending, the strategy will undergo review during FY18.
In executing the strategy over the past year we have been particularly focused on the following initiatives:
• Executing our growth agenda and leveraging the strong macro-economic environment in New Zealand through expansion of activities in our distribution, building products and infrastructure businesses
• Reviewing and improving the management and governance of the Construction division
• Growing the scale and scope of the residential development business and building a pipeline of land development opportunities
• Absorbing the economic weakness in Western Australia and improving the Australian businesses
• Continuing the momentum in Formica
• Leveraging the Accelerate programme to deliver operational efficiencies across manufacturing sites, lowering corporate overheads, managing costs and delivering above inflation revenue growth
Sir Ralph Norris CHAIRMAN
As a multinational company employing over 21,000 people across hundreds of sites globally, we interact with a diverse group of communities both at home and afar.
Cash flow from operating activities $m
$2432016: 660 ▼ 63%
Net earnings $m
$942016: 462 ▼ 80%
Revenue $m
$9,3992016: 9,004 ▲ 4%
Operating earnings before significant items $m
$5252016: 682 ▼ 23%
10 Fletcher Building Annual Report 2017
Chairman’s report

• Continuing to build our people capability through ongoing recruitment and employee development and by entrenching the values we launched in 2015
As we continue to progress our strategy we recognise that we do so only with the support of the communities in which we operate.
As we seek to grow our business and deliver value to our shareholders we must also ensure we are delivering value to our communities. And as a company that employs over 21,000 people across hundreds of sites globally, we interact with a diverse group of communities both at home and afar.
We are in the business of building. We make and distribute building products and we build homes, commercial buildings and major infrastructure projects – but through that work we build so much more.
Through our investment in local manufacturing we support employment and economic growth in our home markets. Through our investment in people and diversity we are developing the next generation of leaders. And by thinking globally and acting locally, our individual businesses contribute to the communities they work in every day with their investments, time and resources.
In this year’s annual report we share our financial results and review our business operations for the year, while also celebrating our role in the community and sharing some of the individual stories our businesses have to tell.
We hope to build on this contribution in the year to come, and deliver improved value for our shareholders.
FINANCIAL RESULTS FOR THE YEAR ENDED 30 JUNE 2017
Net earnings for the year ended 30 June 2017 were $94 million, compared with $462 million in the prior year. This year’s result included a large operating loss in the Construction division and significant items totalling $252 million. Net earnings before significant items were $321 million, 23% lower than the comparable figure of $418 million recorded in the 2016 financial year.
Operating earnings (earnings before interest and tax) excluding significant items were $525 million, compared with $682 million in the prior year, reflecting a $204 million loss in the Construction division which more than offset strong
growth in each of the other four operating divisions. The Construction losses were due mainly to two large and highly complex contracts in the B+I business while the Infrastructure, South Pacific and Higgins businesses all performed well.
In New Zealand, earnings benefited from continued demand across the residential building and infrastructure sectors which translated to improved Building Products and Distribution earnings alongside improved operational performance in specific business units. Excluding the results of the B+I business, earnings were up approximately 30% on the prior year.
In Australia, market conditions were mixed, with strong activity in Eastern states offset by ongoing challenging trading conditions in Western Australia. Operating earnings before significant items were flat, once adjusted for divested businesses and the one-off net property gain in Tradelink in the prior year.
In the Rest of World, operating earnings before significant items in local currency increased 73% driven by strong performances in Formica’s Asian operations, alongside the Construction South Pacific business and contributions from the Higgins Fiji operations acquired in July 2016.
LEVERAGING THE STRONG NEW ZEALAND MACRO-ECONOMIC ENVIRONMENT
Throughout FY17 we have benefited from elevated levels of building activity in the commercial, residential and infrastructure sectors in New Zealand.
The Building Products division has seen volumes of selected manufactured goods increase year-on-year due to greater demand for cement, aggregate, concrete, concrete pipes and plasterboard. This has led to high capacity utilisation levels at some manufacturing sites and a very busy period for our sales people. After adjusting for the businesses sold in FY16 revenues were similar to last year and operating earnings before significant items grew 6%.
Following a strong year in FY16, our Distribution division has continued to thrive, with PlaceMakers, Mico and Steel Distribution all achieving record operating earnings. These businesses have prospered in New Zealand due to heightened levels of national building activity, a conscious effort to grow revenues, and careful management of costs.
In the Construction division our Infrastructure business has been working on a number of large roading contracts including the Waterview tunnel, which was opened to traffic in July 2017, and the rebuild of State Highway 1 north of Kaikoura following the November 2016 earthquake, as part of a consortium. Future roading contracts to be funded by the New Zealand Government are likely to further boost our infrastructure project pipeline, although given the size and time to build, some projects will not contribute to earnings until FY19.
MANAGING RISK AROUND COMMERCIAL CONSTRUCTION PROJECTS
In the current environment it is very disappointing to report an operating loss of $204 million in our Construction division. This loss is the result of the performance of the B+I business unit.
B+I losses of $292 million have been primarily driven by underperformance in the management of two key contracts: one in Christchurch and one in Auckland. In both cases the issues we experienced included complex design issues, substandard project management and stretched resourcing in a capacity-constrained New Zealand construction market.
The project in Christchurch is now very close to being finished, meaning the losses included in the 2017 result are unlikely to be extended into FY18. In March 2017 a provision was taken on the Auckland project to cover losses that were expected over the lifetime of the contract. In July 2017 it was announced that this provision was to be extended as further review of the project pointed to the need to extend the construction period, bringing with it additional cost.
We have reviewed and made significant changes and improvements to governance within B+I and appointed new personnel where appropriate to better manage the risk around commercial construction projects. The criteria for bidding on major construction projects have been made more stringent, and internal review processes for proposed and existing projects have also been strengthened.
B+I is now benefiting from new leadership, with David Kennedy appointed general manager in May 2017. David brings with him over 30 years’ international experience in the construction industry across multiple markets. This follows the appointment in March 2017 of Michele Kernahan as chief executive of the Construction division.
11 Fletcher Building Annual Report 2017

In the Construction division more broadly our businesses performed well. The acquisition of Higgins at the start of the financial year has complemented our Infrastructure business to build on the extensive pipeline of projects in New Zealand. The South Pacific construction business has also had a very strong year completing some significant projects across the region.
GROWING THE SCALE AND SCOPE OF THE RESIDENTIAL AND LAND DEVELOPMENT DIVISION
We are pleased with the performance of Fletcher Living in the 2017 financial year, which sold 499 units and reported operating earnings of $76 million, up 3% on last year. The division had planned to build and sell more dwellings, however, delays in accessing available land, constraints around building consents, poor weather and a cooling in the Auckland market near the end of the financial year impacted the quantity ultimately sold. The reduction in volumes versus our target was offset by higher-than-expected margins, as pricing remained robust on key housing developments.
Funds invested in the Residential and Land Development businesses have now reached $541 million, providing a platform for future growth. This investment represents 3,842 lots on the balance sheet, with commitments for a further 2,227. The availability and consenting of land has to date been one of the key constraints on the business.
Where it makes economic sense we will pursue opportunities to undertake social housing projects and work with state funded entities, such as Ōtākaro in Christchurch. We believe we have capacity to build an additional 500 houses per annum in state-funded housing projects.
The Land Development business continues to be a significant contributor to earnings. In the past year we developed and sold five properties that were surplus to the portfolio and generated $54 million of operating earnings, up $44 million on last year and driven mainly by the sale of a large property in Auckland. Whilst this business is inherently variable given it is reliant on the number of properties that become available each year, we believe our pipeline will earn at least $25 million per annum over the next five years.
IMPROVING THE PERFORMANCE OF OUR AUSTRALIAN BUSINESSES
The past year has seen some contrasting economic and demographic trends in the Australian building and construction industry. The states of Victoria, New South Wales and Queensland have proven to be relatively resilient while Western Australia has been weaker and is only now showing signs of stabilising. In local currency, revenues in Western Australia were 21% lower than a year ago, while total revenues in Australia were down 4%. The reduction in revenues primarily reflected the performance of Iplex Australia, Laminex Australia and Fletcher Insulation. While stand-alone housing construction, plus alterations and additions activity, remained robust, the multi-family dwelling market started to fall after a sustained period of growth. Only recently have state-funded projects seen some return in infrastructure activity following the negative impact of the slowdown in investment in the mining and resources sectors.
For the first time since 2014 Iplex Australia reported positive operating earnings reflecting a considerable turnaround from the $27 million loss reported in FY15.
We have started to see some encouraging signs in the turnaround of Tradelink. The business has been focused on expanding its store footprint, increasing profitability, implementing a service guarantee oriented around the core requirements of the trade plumber and reducing the number of loss-making legacy stores.
As part of the regular review of the value of the businesses held on the balance sheet the decision was taken to write down the carrying value of Tradelink and Iplex Australia by $222 million collectively. This reflects the fact that large goodwill balances were recognised following the acquisition of these businesses from Crane in 2011 and the belief that it is likely both of these businesses will take longer to return to mid-cycle earnings than previously expected.
Stramit has continued its steady improvement and achieved excellent operating earnings growth. The improvements have been delivered through a combination of improved steel pricing, improved demand in key sales channels and successful execution of site-specific initiatives.
CONTINUING THE MOMENTUM IN FORMICA
The Formica businesses performed well during the year, building on the momentum that has grown over the past three years. Operating earnings were up 42% with North American operations steady, Formica Asia growing 35% year-on-year and Formica Europe executing a $21 million turnaround from a loss in FY16 to a position of profitability in FY17.
The performance in the European business has been particularly pleasing, benefiting from investment in its North Shields site and, as the only high pressure laminate manufacturer in Britain, a strong competitive position in Britain and mainland Europe post the announcement of Brexit. We have seen the European business modestly increase its market share but believe there is more upside to come.
We continue to believe there is also more growth to come in Asia as Formica looks to further leverage capacity of its Jiujiang plant and increase production efficiencies in Malaysia and Taiwan.
LEVERAGING THE ACCELERATE PROGRAMME
The Accelerate programme is about driving performance improvement in the business by ensuring good ideas and initiatives are acted on quickly and receive the necessary investment. We have further extended the reach of Accelerate into the business by starting to transition some of our programme managers from the central team into specific businesses. This has served to embed Accelerate practices into the culture of the business and gives us confidence that we are on track to deliver the targeted benefits. This result is likely to be driven by higher revenue growth, market share gain, improved gross margins and lower operating costs. Accelerate is complemented by the capability that we have built in key functional areas, particularly around procurement, property management, information technology, manufacturing and supply chain, and sales and marketing.
12 Fletcher Building Annual Report 2017
Chairman’s report
BUILDING OUR PEOPLE CAPABILITY
Continuing to invest in our people and capability is central to better serving our customers and growing returns to our shareholders. These efforts have continued in the last year as we look to improve the health and safety environment for our people, invest in developing talent from within the employee base, build capability across the workforce and foster an environment that encourages people to perform at their highest level.
In the second half of the year we undertook our fifth annual company-wide employee survey, FBuSay. We were pleased to see participation in the survey at record levels (92.1%) and overall group engagement levels increase year-on-year.
DIVIDEND
The total dividend for the year is 39 cents per share, in line with the total dividend last year, despite the reduction in net earnings for the year. This corresponds to a pay-out ratio of 84% of net earnings before significant items, which compares to the target pay-out range of 50 to 75%, in light of the Construction losses being considered as one-off and with a view to our expected positive outlook for the company in FY18.
The dividend will be fully imputed for New Zealand taxation purposes. For FY18, on the basis of current estimates, we expect to be able to fully impute both the interim and final dividends for New Zealand taxation purposes. At this stage we do not have sufficient franking credits to be able to frank the dividend for Australian tax purposes.
TOTAL SHAREHOLDER RETURNS
There was a nil return to shareholders for the year to 30 June 2017 representing a combination of negative share price movement over the year offsetting the dividends paid. Despite gains in the share price early in the year, the expectation of losses in the Construction division drove the share price lower post the interim results in February 2017 and the earnings guidance update in March 2017.
BALANCE SHEET
Maintaining a strong financial position at all times has been a priority in FY17 given the challenges experienced during the year. Investment in the Residential and Land Development division, the acquisition of Higgins, losses incurred in the Construction division and higher
levels of working capital have accounted for a significant amount of outward cash flow and subsequently increased the company’s level of debt. This has been offset to some degree by the strength in trading of the Distribution, Building Products and International divisions, which are highly cash-generative businesses.
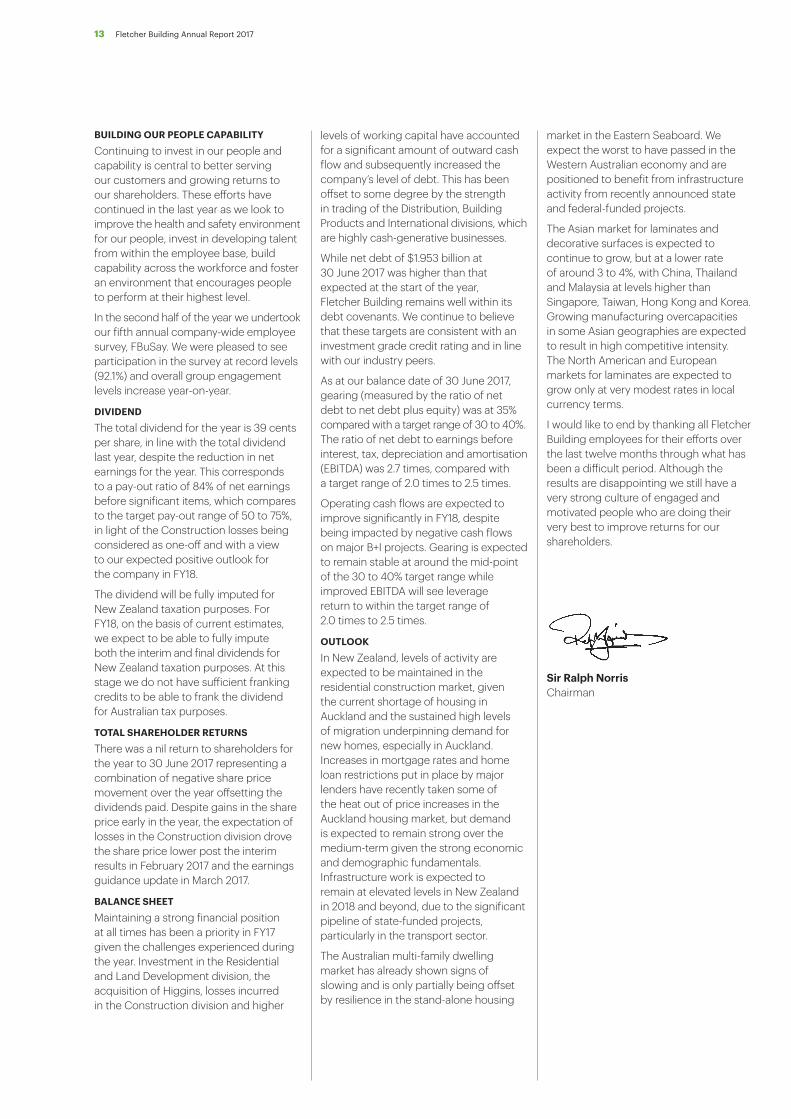
While net debt of $1.953 billion at 30 June 2017 was higher than that expected at the start of the year, Fletcher Building remains well within its debt covenants. We continue to believe that these targets are consistent with an investment grade credit rating and in line with our industry peers.
As at our balance date of 30 June 2017, gearing (measured by the ratio of net debt to net debt plus equity) was at 35% compared with a target range of 30 to 40%. The ratio of net debt to earnings before interest, tax, depreciation and amortisation (EBITDA) was 2.7 times, compared with a target range of 2.0 times to 2.5 times.
Operating cash flows are expected to improve significantly in FY18, despite being impacted by negative cash flows on major B+I projects. Gearing is expected to remain stable at around the mid-point of the 30 to 40% target range while improved EBITDA will see leverage return to within the target range of 2.0 times to 2.5 times.
OUTLOOK
In New Zealand, levels of activity are expected to be maintained in the residential construction market, given the current shortage of housing in Auckland and the sustained high levels of migration underpinning demand for new homes, especially in Auckland. Increases in mortgage rates and home loan restrictions put in place by major lenders have recently taken some of the heat out of price increases in the Auckland housing market, but demand is expected to remain strong over the medium-term given the strong economic and demographic fundamentals. Infrastructure work is expected to remain at elevated levels in New Zealand in 2018 and beyond, due to the significant pipeline of state-funded projects, particularly in the transport sector.
The Australian multi-family dwelling market has already shown signs of slowing and is only partially being offset by resilience in the stand-alone housing
market in the Eastern Seaboard. We expect the worst to have passed in the Western Australian economy and are positioned to benefit from infrastructure activity from recently announced state and federal-funded projects.
The Asian market for laminates and decorative surfaces is expected to continue to grow, but at a lower rate of around 3 to 4%, with China, Thailand and Malaysia at levels higher than Singapore, Taiwan, Hong Kong and Korea. Growing manufacturing overcapacities in some Asian geographies are expected to result in high competitive intensity. The North American and European markets for laminates are expected to grow only at very modest rates in local currency terms.
I would like to end by thanking all Fletcher Building employees for their efforts over the last twelve months through what has been a difficult period. Although the results are disappointing we still have a very strong culture of engaged and motivated people who are doing their very best to improve returns for our shareholders.
Sir Ralph NorrisChairman
13 Fletcher Building Annual Report 2017

Building Products
The Building Products division brings together the group’s interests in the manufacture of building products, which are supplied to a broad range of industries across Australasia.
The division comprises Firth, CSP Pacific, Humes, GBC Winstone, Iplex Pipelines, Winstone Wallboards and Tasman Insulation in New Zealand and Rocla Products, Iplex Pipelines and Fletcher Insulation in Australia. Altus and Sims Pacific Metals are both joint ventures in this division.
HIGHLIGHTS
The New Zealand businesses continued to perform strongly with most achieving high single-digit year-on-year profit growth. We continued to defend our strong market position in the concrete value chain and benefited from strong market conditions across all key New Zealand market segments. Many of our businesses delivered all-time record production.
This year Golden Bay Cement’s Portland plant celebrated 100 years of operation and the completion of a significant multi-year project to enhance its national cement supply chain. This concluded with the successful commissioning of a new 9,000 tonne cement ship and the upgrade of ship loading infrastructure nationally – giving Golden Bay Cement a strong and cost-effective supply capability across all regions in New Zealand. Golden Bay Cement also welcomed a $13.6 million commitment from the New Zealand Government to help upgrade the Portland plant and enable the use of tyre-derived fuel – an innovative use of waste tyre material as both a fuel and ingredient in the manufacture of cement.
Additional highlights include successfully defending or growing market share in all our New Zealand businesses and the formation of the Altus aluminium products joint venture.
In Australia the division has been focused on improving profitability in a challenging market. Whilst Iplex Australia did return to profitability for the first time in three years, performance in the remaining Australian businesses was undermined by internal operating factors, including a protracted three-month strike at Fletcher Insulation’s Dandenong factory. Employees accepted a new enterprise agreement in May 2017, enabling management to improve site flexibility and efficiency, and in turn long-term competitiveness.
FUTURE FOCUS
In New Zealand we will focus on consolidating our market positions and optimising price and margin, whilst de-risking our supply chains to meet peak market volumes cost-effectively with a superior customer experience.
Across the division we continue to build commercial excellence and drive customer service improvements including through digital solutions.
We have made a significant investment in a new Firth masonry production facility, which is currently under construction in Hunua Auckland and will be operational towards the end of 2017. This investment will enable a more sustainable business and better support customer needs.
In Australia we will continue to improve the performance of our turnaround businesses, leveraging the significant improvements made in operating cost structures and delivering superior customer value propositions and service to grow market share. We now believe we have a much stronger platform for broader growth in these businesses in the coming years.
Gross revenue
$2.3bEBIT*
$267mPEOPLE
3,925* EBIT excluding significant items
14 Fletcher Building Annual Report 2017
Business review
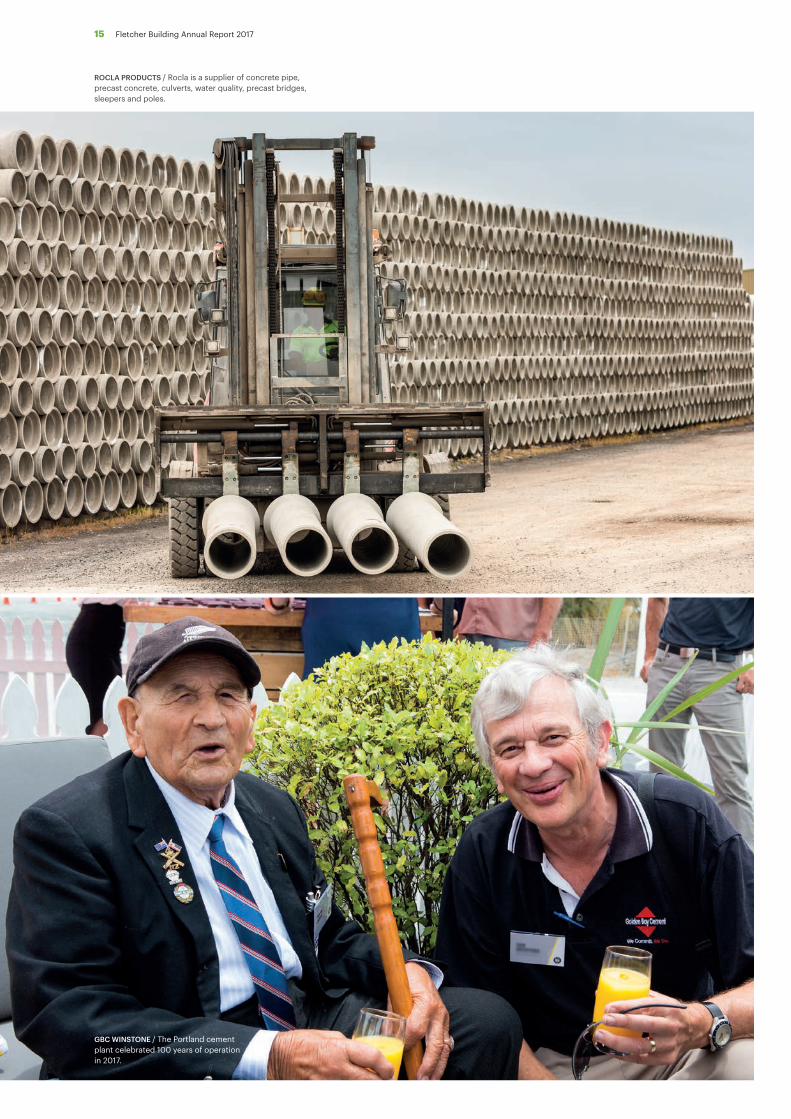
ROCLA PRODUCTS / Rocla is a supplier of concrete pipe, precast concrete, culverts, water quality, precast bridges, sleepers and poles.
GBC WINSTONE / The Portland cement plant celebrated 100 years of operation in 2017.
15 Fletcher Building Annual Report 2017

International
The International division is made up of Formica, Laminex and Roof Tile Group.
Formica produces a range of laminate and surface products for both commercial and residential spaces and manufactures its products in Europe, Asia and North America.
Laminex is an Australian and New Zealand manufacturer and distributor of decorative wood panels and laminate, particle board, medium-density fibreboard and other decorative products.
Roof Tile Group is a supplier of pressed metal roof tiles in North America, Europe, New Zealand, Africa and Asia.
HIGHLIGHTS
During the financial year the International division delivered significant improvements in the financial performance of both Formica Europe and Formica Asia compared with the previous year.
This was achieved with a focus on developing customer-centric, innovative products that seek to keep our businesses at the forefront of a competitive and cost-conscious market. A range of new products was launched during the financial year, including Infiniti, an ultra-matte anti-fingerprint laminate, and a state-of-the-art Laminex Australia HIVE showroom was opened in Sydney. Initial results and feedback on the showroom have been very promising.
After 18 months of planning design and refurbishments, the North Shields manufacturing operations and Formica Europe’s head office and sales teams are now all housed together on one site. The business held an open day with customers, suppliers, and key stakeholders on site to celebrate the completion – over 400 family and friends took a tour of the shop floor and learnt how Formica laminate is produced.
The International division continued its programme of manufacturing and supply chain excellence across its global manufacturing sites. This has resulted in significant efficiency improvements at the high-pressure laminate sites in North Shields and Jiujiang in China, a new capacity upgrade at the Roof Tile Group’s Corona site in California and performance improvements at the particle board site at Dardanup in Western Australia.
During the year the business continued to improve customer service measures, with a focus on lifting customer engagement while investing to improve product performance, through innovation and development.
FUTURE FOCUS
The International division will continue to focus on driving growth through innovation, supported by high levels of customer service and supply chain excellence. This, together with our drive to improve our safety performance and employee engagement, will be key drivers for our businesses.
The business is focused on making capital investment and system improvements to enhance competitiveness and also capture market opportunities. Digital and ERP capability will continue to be a focus area for the business.
From an operational perspective we will continue our investment and upgrade plans at our North Shields laminate facility and leverage capacity in China to support sales growth. Generating cash from working capital improvements remains a key focus. Improvement of our supply chain to fuel our growth ambitions will be reinforced to achieve our cash-generating targets.
Gross revenue
$2.0bEBIT
$169mPEOPLE
5,531
16 Fletcher Building Annual Report 2017
Business review

FORMICA / Formica Infiniti™ Laminate features a soft-to-the-touch matte finish, resists fingerprints, has thermal healing capabilities and built-in antimicrobial surface protection. This technology stops the growth of mildew and mould, which can cause stains and odours.
VOLUNTEERING / Teams in Cincinnati volunteered at the Ronald McDonald House preparing dinner for critically ill children and families staying at the home.
17 Fletcher Building Annual Report 2017

Distribution
The Distribution division is a Trans Tasman portfolio of businesses, incorporating over 440 locations.
PlaceMakers, Mico, and Steel Distribution operate in New Zealand, with Tradelink, Stramit and Tasman Sinkware operating in Australia.
HIGHLIGHTS
The Distribution division achieved record volumes and double-digit operating earnings growth across its PlaceMakers, Mico and Steel Distribution businesses. This strong trading was supported by a continued focus on, and improvements in, customer satisfaction scores and employee engagement.
With the Australian businesses now in year two of the Trans Tasman divisional strategy, we also saw double-digit growth in the operating earnings of Stramit, as well as a market share recovery in Tradelink’s small to medium customer segment base during the second half. The investment in 20 new Tradelink branches during the year and with plans for another 20 new branches in FY18 reinforces our focus on bringing customer service back into the heart of Tradelink and meeting our customers' needs.
A highlight in the year was the Steel Distribution businesses’ market share gains through innovative customer leading services and solutions, evidenced in strong topline and earnings performance, achieved in categories such as special steels and reinforcing, as well as successful growth in engineering and roofing channels. Our customer service focus was also seen in PlaceMakers, with continued year-on-year growth in the Group Home Builder and SME segments of the market, along with market share gains in Mico’s bathroom category offerings, including leveraging our own-branded products of Raymor and Adesso.
During the year the Distribution division acquired the Calder Stewart Roofing business, further expanding our existing roofing offerings within Steel Distribution. Our customer leading focus on value-added installed solutions was also highlighted when PlaceMakers acquired Raylight Aluminium in Christchurch,
expanding our offerings in the windows category. The focus over the last two years to grow PlaceMakers’ installed solutions has delivered robust growth in roof installations in Auckland, Waikato and the Bay of Plenty – with fewer than 100 roofs in FY15 growing to over 1,000 roofs per annum at June 2017.
Our continued focus on operating efficiency has over 20 co-located sites across the New Zealand network, along with over $10 million invested in the current year on machinery automation for our frame and truss and reinforcing businesses. We also successfully relocated Easysteel Christchurch and Fletcher Reinforcing in Auckland to newer and improved facilities, along with a number of other branch refurbishments across our businesses. These improvements across our portfolio will reduce our carbon footprint, with the use of more modern machinery and improving energy efficiency in new and co-located sites.
With customer service being a key focus, we continue to deploy and finesse our differentiated customer service offerings, including improving our customer engagement, core stock availability and key service metrics.
Gross revenue
$3.3bEBIT*
$193mPEOPLE
6,183* EBIT excluding significant items
18 Fletcher Building Annual Report 2017
Business review

STEEL DISTRIBUTION / Calder Stewart Roofing, a New Zealand rollforming business, was acquired in March 2017. It complements our existing roofing offering and sells a unique range of roofing, architectural cladding and solar roofing products across New Zealand to farmers, builders and homeowners.
PLACEMAKERS / In conjunction with Serco, PlaceMakers is helping change lives through providing carpentry training and work placements following release.
FUTURE FOCUS
The Distribution division will continue to focus on being customer leading, while investing in new branches, especially for Tradelink. Category expansions in heating and fastenings in New Zealand, and shed and door offerings by Stramit in Australia, offer opportunities for further growth, along with additional e-commerce and digital offerings being deployed over the coming year. While the Australian businesses expect to be trading in a declining market, our focus on efficiency and profitable market share gains will continue.
“I am an ex-inmate from Wiri Prison. Whilst I was serving, I was given an opportunity of a full-time job in the building industry. I took hold of this opportunity knowing I needed a positive change in my life. Thanks to PlaceMakers they helped make this possible. I have now been an employee of PlaceMakers for six months. It has been a privilege and an honour to be a part of this team/family. Without their help and support I would not be here. I would like to thank everyone from Wiri Prison and PlaceMakers.”
19 Fletcher Building Annual Report 2017
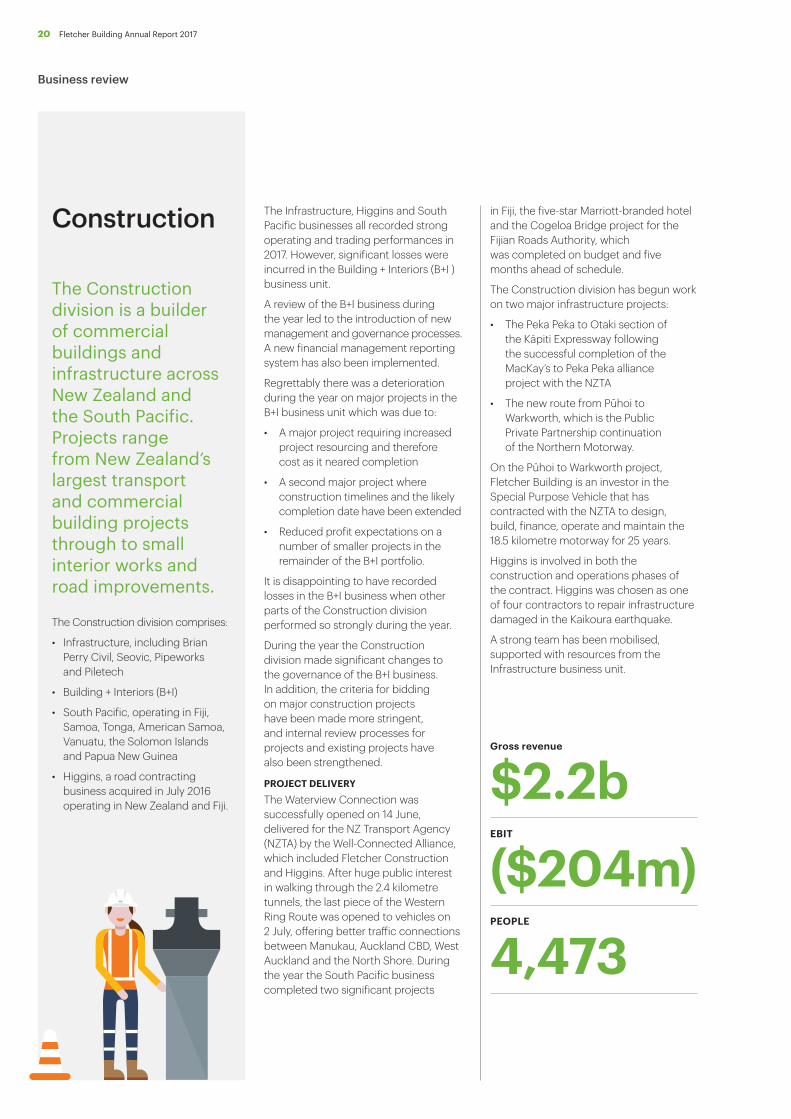
Construction
The Construction division is a builder of commercial buildings and infrastructure across New Zealand and the South Pacific. Projects range from New Zealand’s largest transport and commercial building projects through to small interior works and road improvements.
The Construction division comprises:
• Infrastructure, including Brian Perry Civil, Seovic, Pipeworks and Piletech
• Building + Interiors (B+I)
• South Pacific, operating in Fiji, Samoa, Tonga, American Samoa, Vanuatu, the Solomon Islands and Papua New Guinea
• Higgins, a road contracting business acquired in July 2016 operating in New Zealand and Fiji.
The Infrastructure, Higgins and South Pacific businesses all recorded strong operating and trading performances in 2017. However, significant losses were incurred in the Building + Interiors (B+I ) business unit.
A review of the B+I business during the year led to the introduction of new management and governance processes. A new financial management reporting system has also been implemented.
Regrettably there was a deterioration during the year on major projects in the B+I business unit which was due to:
• A major project requiring increased project resourcing and therefore cost as it neared completion
• A second major project where construction timelines and the likely completion date have been extended
• Reduced profit expectations on a number of smaller projects in the remainder of the B+I portfolio.
It is disappointing to have recorded losses in the B+I business when other parts of the Construction division performed so strongly during the year.
During the year the Construction division made significant changes to the governance of the B+I business. In addition, the criteria for bidding on major construction projects have been made more stringent, and internal review processes for projects and existing projects have also been strengthened.
PROJECT DELIVERY
The Waterview Connection was successfully opened on 14 June, delivered for the NZ Transport Agency (NZTA) by the Well-Connected Alliance, which included Fletcher Construction and Higgins. After huge public interest in walking through the 2.4 kilometre tunnels, the last piece of the Western Ring Route was opened to vehicles on 2 July, offering better traffic connections between Manukau, Auckland CBD, West Auckland and the North Shore. During the year the South Pacific business completed two significant projects
in Fiji, the five-star Marriott-branded hotel and the Cogeloa Bridge project for the Fijian Roads Authority, which was completed on budget and five months ahead of schedule.
The Construction division has begun work on two major infrastructure projects:
• The Peka Peka to Otaki section of the Kāpiti Expressway following the successful completion of the MacKay’s to Peka Peka alliance project with the NZTA
• The new route from Pūhoi to Warkworth, which is the Public Private Partnership continuation of the Northern Motorway.
On the Pūhoi to Warkworth project, Fletcher Building is an investor in the Special Purpose Vehicle that has contracted with the NZTA to design, build, finance, operate and maintain the 18.5 kilometre motorway for 25 years.
Higgins is involved in both the construction and operations phases of the contract. Higgins was chosen as one of four contractors to repair infrastructure damaged in the Kaikoura earthquake.
A strong team has been mobilised, supported with resources from the Infrastructure business unit.
Gross revenue
$2.2bEBIT
($204m)PEOPLE
4,473
20 Fletcher Building Annual Report 2017
Business review

SOUTH PACIFIC / Holiday makers are now enjoying the five-star Marriott-branded Momi Bay Resort in Fiji after its completion in early 2017. The resort includes 114 free-standing bures and 136 standard rooms, three restaurants, two swimming pools, fitness and recreation centres, gift shops, tennis courts and a spa with eight treatment rooms.
INFRASTRUCTURE / Over 60,000 Aucklanders enjoyed walking or cycling through the Waterview tunnels before they were opened to traffic. We delivered the project as part of the Well-Connected Alliance, completing the Western Ring Route.
60,0
00Under the leadership of Michele Kernahan the Construction division continues to focus on customers, including New Zealand’s key infrastructure providers from the central and local government sectors, health and education providers, utilities and commercial property owners.
We expect that the new governance framework, financial systems, and project controls will continue to drive improved performance and better project management across all Construction businesses in the coming year.
In the Construction division more broadly our businesses continue to perform well. The acquisition of Higgins at the start of the financial year has complemented our Infrastructure business to build on the extensive pipeline of projects in New Zealand.
21 Fletcher Building Annual Report 2017
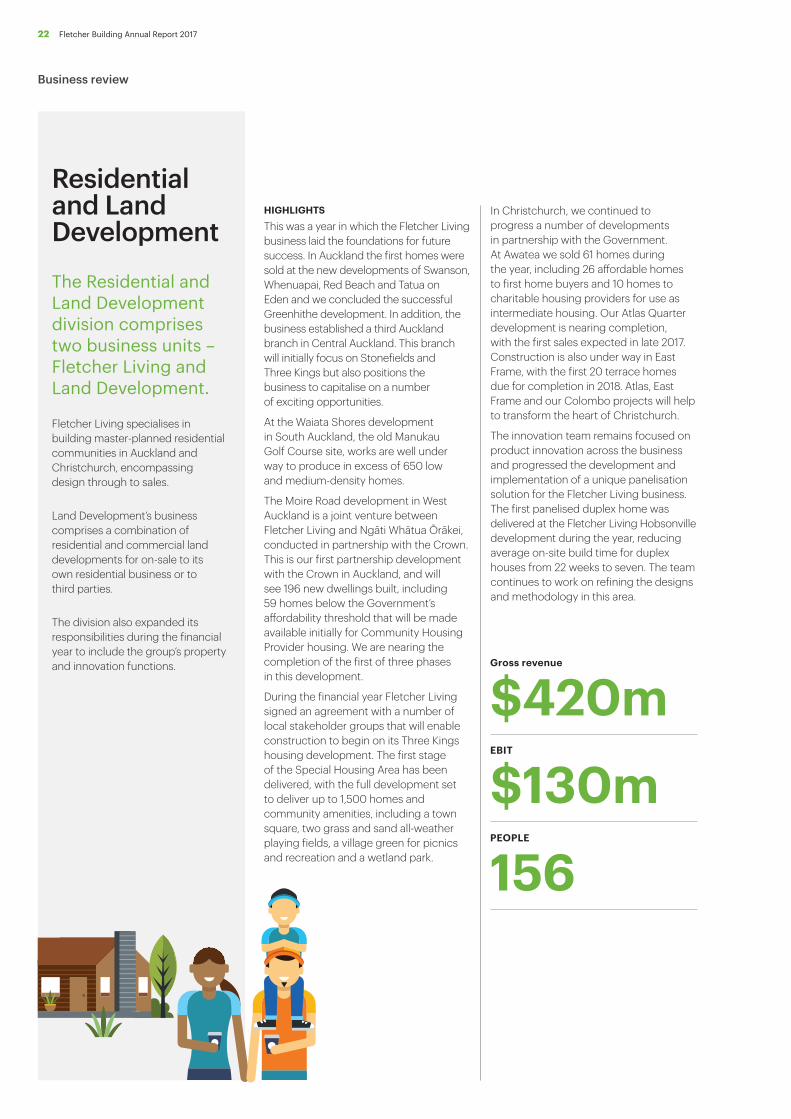
Residential and Land Development
The Residential and Land Development division comprises two business units – Fletcher Living and Land Development.
Fletcher Living specialises in building master-planned residential communities in Auckland and Christchurch, encompassing design through to sales.
Land Development’s business comprises a combination of residential and commercial land developments for on-sale to its own residential business or to third parties.
The division also expanded its responsibilities during the financial year to include the group’s property and innovation functions.
HIGHLIGHTS
This was a year in which the Fletcher Living business laid the foundations for future success. In Auckland the first homes were sold at the new developments of Swanson, Whenuapai, Red Beach and Tatua on Eden and we concluded the successful Greenhithe development. In addition, the business established a third Auckland branch in Central Auckland. This branch will initially focus on Stonefields and Three Kings but also positions the business to capitalise on a number of exciting opportunities.
At the Waiata Shores development in South Auckland, the old Manukau Golf Course site, works are well under way to produce in excess of 650 low and medium-density homes.
The Moire Road development in West Auckland is a joint venture between Fletcher Living and Ngāti Whātua Ōrākei, conducted in partnership with the Crown. This is our first partnership development with the Crown in Auckland, and will see 196 new dwellings built, including 59 homes below the Government’s affordability threshold that will be made available initially for Community Housing Provider housing. We are nearing the completion of the first of three phases in this development.
During the financial year Fletcher Living signed an agreement with a number of local stakeholder groups that will enable construction to begin on its Three Kings housing development. The first stage of the Special Housing Area has been delivered, with the full development set to deliver up to 1,500 homes and community amenities, including a town square, two grass and sand all-weather playing fields, a village green for picnics and recreation and a wetland park.
In Christchurch, we continued to progress a number of developments in partnership with the Government. At Awatea we sold 61 homes during the year, including 26 affordable homes to first home buyers and 10 homes to charitable housing providers for use as intermediate housing. Our Atlas Quarter development is nearing completion, with the first sales expected in late 2017. Construction is also under way in East Frame, with the first 20 terrace homes due for completion in 2018. Atlas, East Frame and our Colombo projects will help to transform the heart of Christchurch.
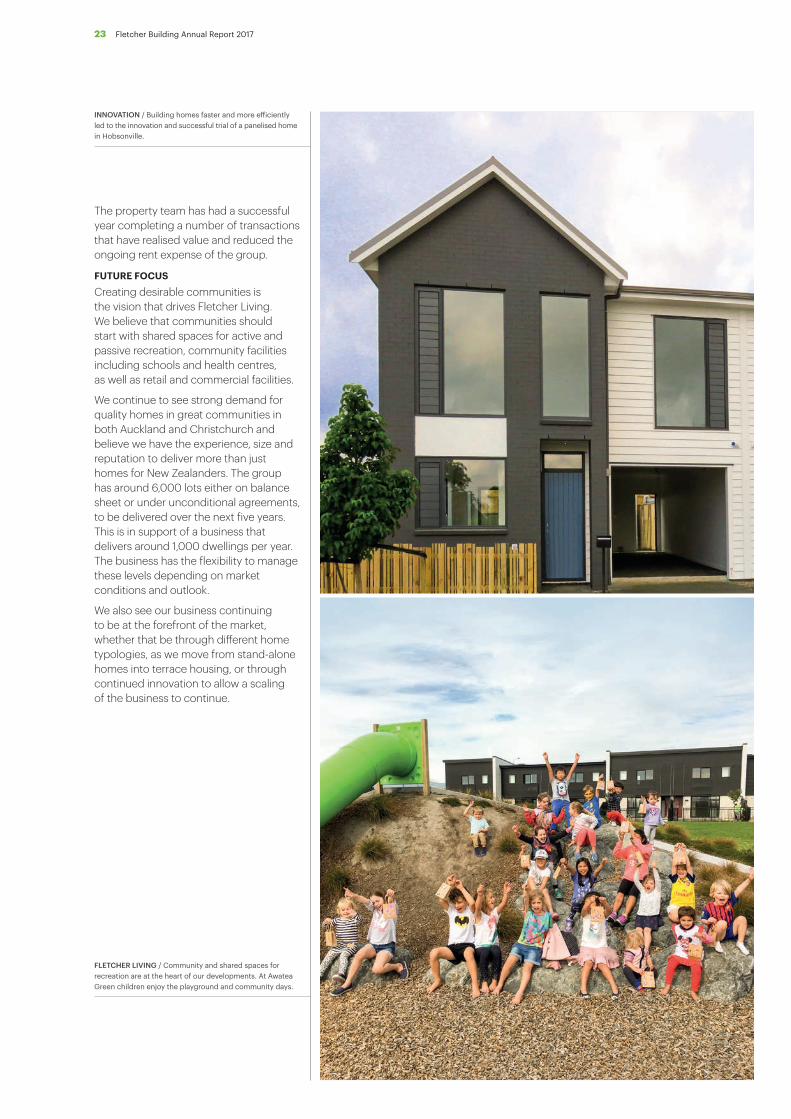
The innovation team remains focused on product innovation across the business and progressed the development and implementation of a unique panelisation solution for the Fletcher Living business. The first panelised duplex home was delivered at the Fletcher Living Hobsonville development during the year, reducing average on-site build time for duplex houses from 22 weeks to seven. The team continues to work on refining the designs and methodology in this area.
Gross revenue
$420mEBIT
$130mPEOPLE
156
22 Fletcher Building Annual Report 2017
Business review
The property team has had a successful year completing a number of transactions that have realised value and reduced the ongoing rent expense of the group.
FUTURE FOCUS
Creating desirable communities is the vision that drives Fletcher Living. We believe that communities should start with shared spaces for active and passive recreation, community facilities including schools and health centres, as well as retail and commercial facilities.
We continue to see strong demand for quality homes in great communities in both Auckland and Christchurch and believe we have the experience, size and reputation to deliver more than just homes for New Zealanders. The group has around 6,000 lots either on balance sheet or under unconditional agreements, to be delivered over the next five years. This is in support of a business that delivers around 1,000 dwellings per year. The business has the flexibility to manage these levels depending on market conditions and outlook.
We also see our business continuing to be at the forefront of the market, whether that be through different home typologies, as we move from stand-alone homes into terrace housing, or through continued innovation to allow a scaling of the business to continue.
INNOVATION / Building homes faster and more efficiently led to the innovation and successful trial of a panelised home in Hobsonville.
FLETCHER LIVING / Community and shared spaces for recreation are at the heart of our developments. At Awatea Green children enjoy the playground and community days.
23 Fletcher Building Annual Report 2017

In the Building Products division, teams from Firth in Auckland volunteered their time, and using their own products, built retaining walls and pathways at Kokako Lodge, a not-for-profit organisation that helps support young people in developing leadership and team work through outdoor education.
In FY17 GBC Winstone has supported more than 25 community programmes across New Zealand and also operates local sponsorship programmes.
In Construction, the Piletech and Brian Perry Civil teams dedicated time, resource and skills to New Zealand charity Sustainable Coastlines helping build its flagship education centre in downtown Auckland. The centre is an education and training space that brings a wide range of sustainability-focused activities to the area. “We ended up utilising a wide range of Piletech skills and contacts. We were able to do some welding, grinding, painting, and helping out with general labouring, as well as moving their water filter system into place,” says Piletech National Operations Manager Daniel Breukelaar. The Auckland-based team for South Pacific also helped Sustainable Coastlines with Motutapu Island beach and Ambury Farm cleanups.
Internationally, the Formica teams across the world also support education, youth development and environmental clean ups. In North America the Cincinnati team helped raise money to send more than 300 youth to Boy Scouts of America summer camps through a dodge ball challenge and the teams in Asia participated in multiple coastal cleanups.
Fletcher Living is active in the communities it works in through a variety of activities. In Auckland we have renewed our sponsorship of the Three Kings United Football Club for another year to 2021 and provided Swanson School with spare materials from our site which they use in their ‘tinkering shed’ for students. In Christchurch one activity was responding to the needs in the community. Fletcher Living Canterbury staff dropped off water and food supplies to the Civil Defence Emergency drop-in centre at Te Hāpaua Halswell, in support of the hundreds of families who were evacuated from or lost their homes owing to the fires in the Christchurch Port Hills.
Our communities
The Distribution division believes that changing individual lives changes communities. This is most evident through the PlaceMakers Auckland Frame and Truss team which has been working in conjunction with Serco Kohuora Auckland South Corrections Facility (Wiri Prison) to train and upskill prison inmates and offer employment opportunities once they have been released.
Tradelink has aligned with Legacy, a charity that provides care for the families of Australians who have given their lives or whose health has suffered during or after service to their country.
Prior to Tradelink’s involvement, Legacy was restricted in how many backyard makeovers it could do owing to lack of resource. The Tradelink team has now completed seven ‘Backyard Blitz’ days across Queensland. Each of the Backyard Blitz days takes about 6-8 hours of physical work to complete, with Tradelink providing tools, equipment and labour. Tradelink employees have also raised more than $16,000 for the organisation through various fundraising activities.
Fletcher Building takes an ‘act local’ approach to supporting community and social programmes in the communities in which we operate. As a group, we support a wide range of community, cultural, educational, environmental and health organisations and initiatives.
Each individual business is encouraged to work with community partners and address needs that make a positive difference to people’s lives. Our local business managers take leadership roles, where appropriate, and take part in many business and industry organisations.
24 Fletcher Building Annual Report 2017
Focus areas

From supporting Boy Scouts of America through dodge ball tournaments to lighting up the local BMX track at Pakuranga, we look to support community projects wherever we operate.
From coastal cleanups, to supporting charities such as Sustainable Coastlines, issues that are important to our communities are important to us.
Act local
Our environment
25 Fletcher Building Annual Report 2017

Our people strategy is focused on building leadership capability, identifying and developing talent across all levels of the company and ensuring that our workplace culture respects diversity and inclusion and is engaging for our employees.
LEADERSHIP, CAPABILITY AND TALENT
Our leadership framework delivered award-winning programmes to over 700 global leaders during the last year and we continue to see our leaders develop. Our Leaders’ Edge programme provides a beneficial environment for our business unit leadership teams to work on strategic business initiatives to support growth in their business units. In addition to our core leadership curriculum we successfully expanded Whakatupu, which is a leadership programme for Māori leaders, to two cohorts for the year.
Over the past year we have provided structured learning opportunities for over 10,000 employees. Our key areas of focus were on the launch of our new safety programme ‘Protect‘, implementation of our Sales Learning Pathway and learning modules for specific business units to support their growth. In New Zealand, over 530 of our employees who work in our manufacturing operations received a National Certificate in Competitive Manufacturing and Supply Chain.
We have taken our third intake of graduates and continue to focus on talent identification, assessment and development to ensure we are providing employees who have aspirations to progress within the company, with every opportunity to do so.
DIVERSITY
Fletcher Building is a diverse company employing people in multiple countries and from many ethnicities. Diversity at Fletcher Building means much more than gender or ethnic considerations to recruitment or talent development.
Our people
Diversity also means employing and utilising a wide range of skill sets and being inclusive of different thinking.
Fletcher Building’s diversity strategy focuses on developing a strong pipeline of diverse talent, creating an inclusive workplace and working with community and government organisations to provide employment opportunities to young people.
MĀORI AND PASIFIKA LEADERSHIP
Ethnic diversity is a critical component of Fletcher Building’s diversity strategy and we believe it is important for our workforce to be representative of our society. While we employ a significant amount of Māori and Pasifika people in New Zealand, these groups remain under-represented at management levels and accordingly, we are investing to develop a deeper talent pipeline of Māori and Pasifika leaders.
Our Whakatupu leadership programme is in its second year and we have delivered programmes to three cohorts over the two years.
Over the past year we have also joined TupuToa as a foundation partner. This organisation provides internship opportunities to Māori and Pasifika undergraduates. The first year of the programme has seen four interns gaining employment opportunities across four companies with a further 11 interns due to start in November.
INVESTING IN OUR FUTURE THROUGH YOUTH
Fletcher Building is committed to providing employment opportunities, targeting unemployed youth and school leavers, particularly in the Auckland region.
In January and February 2017 Fletcher Building welcomed 50 summer interns and 59 graduates as part of our one-year graduate programme. Now in its third year, the programme has been a success. The graduates and interns were based all around New Zealand and worked in a variety of Fletcher Building businesses, the corporate centre and on construction projects such as Commercial Bay, Auckland Prison, Auckland Airport and the Waikato Expressway. This year the programme has been broadened to include graduates based in Australia.
FB PRIDE
Fletcher Building was a principal sponsor of the Auckland Pride Festival and the company’s commitment to diversity has special resonance for employees in the LGBTI community:
Having the Rainbow Tick shows that Fletcher Building is committed to being a great place to work where everyone can be their authentic selves. I’m immensely proud of our landmark of being New Zealand’s first construction and building materials company to get the Rainbow Tick. For me the Rainbow Tick shows that at Fletcher Building we see our diversity as strength and we’re all included here.”JACOB TONERQuality Assurance and Risk Specialist
26 Fletcher Building Annual Report 2017
Focus areas
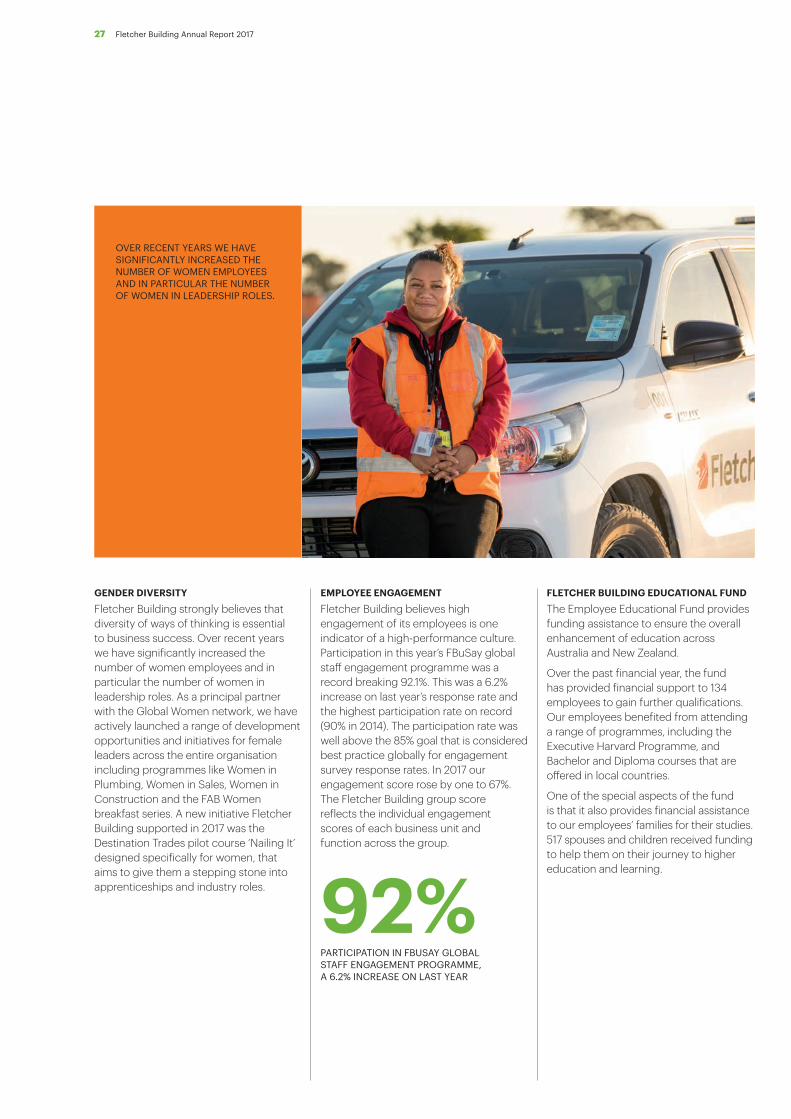
GENDER DIVERSITY
Fletcher Building strongly believes that diversity of ways of thinking is essential to business success. Over recent years we have significantly increased the number of women employees and in particular the number of women in leadership roles. As a principal partner with the Global Women network, we have actively launched a range of development opportunities and initiatives for female leaders across the entire organisation including programmes like Women in Plumbing, Women in Sales, Women in Construction and the FAB Women breakfast series. A new initiative Fletcher Building supported in 2017 was the Destination Trades pilot course ‘Nailing It’ designed specifically for women, that aims to give them a stepping stone into apprenticeships and industry roles. 92%
PARTICIPATION IN FBUSAY GLOBAL STAFF ENGAGEMENT PROGRAMME, A 6.2% INCREASE ON LAST YEAR
EMPLOYEE ENGAGEMENT
Fletcher Building believes high engagement of its employees is one indicator of a high-performance culture. Participation in this year’s FBuSay global staff engagement programme was a record breaking 92.1%. This was a 6.2% increase on last year’s response rate and the highest participation rate on record (90% in 2014). The participation rate was well above the 85% goal that is considered best practice globally for engagement survey response rates. In 2017 our engagement score rose by one to 67%. The Fletcher Building group score reflects the individual engagement scores of each business unit and function across the group.
FLETCHER BUILDING EDUCATIONAL FUND
The Employee Educational Fund provides funding assistance to ensure the overall enhancement of education across Australia and New Zealand.
Over the past financial year, the fund has provided financial support to 134 employees to gain further qualifications. Our employees benefited from attending a range of programmes, including the Executive Harvard Programme, and Bachelor and Diploma courses that are offered in local countries.
One of the special aspects of the fund is that it also provides financial assistance to our employees’ families for their studies. 517 spouses and children received funding to help them on their journey to higher education and learning.
OVER RECENT YEARS WE HAVE SIGNIFICANTLY INCREASED THE NUMBER OF WOMEN EMPLOYEES AND IN PARTICULAR THE NUMBER OF WOMEN IN LEADERSHIP ROLES.
27 Fletcher Building Annual Report 2017

200
6
200
7
200
8
200
9
2010
2011
2012
2013
2014
2015
2016
2017
43.9
TRIFR YEAR ENDED 30 JUNE
YEAR
TRIF
R
0
20
40
10
30
50
60
57.5
25.8
25.2
14.0
11.1
8.5
6.8
6.0
6.4
6.7
6.9
Although the company’s total recordable injury frequency rate (TRIFR) has decreased in recent years, too many people are getting hurt at our sites around the world. In the 2017 financial year 33 people were seriously injured at work.
To further improve our safety culture, in June 2017 Fletcher Building launched a new safety management framework called ‘Protect’. This programme is being rolled out to every business within the group and provides an opportunity to reset and refocus on the primary importance of getting home safe, every day.
Protect will build on the centres of safety excellence that already exist within the business and share them globally. It encompasses a new set of safety rules and standards for all, new digital tools, simplified documentation, standardised learning and a common safety language.
The Protect framework includes:
• Consistent activities across the group
• Global minimum requirements in Environment, Health and Safety standards
• 10 standard safety rules based on the analysis of data from Fletcher Building’s high-risk incidents.
Health and safety
10
The safety of our employees, contractors and communities in which we operate always comes first. Our working environments by their nature expose our employees and contractors to risk. It is therefore critical that we have best practice systems and training in place to identify those risks and implement controls.
Total Recordable Injury Frequency Rates (TRIFR) for FY17
6.9
Protect's comprehensive learning and training programme is designed for the wide variety of responsibilities, skills, literacy levels and languages throughout the company. Protect documentation is being translated into at least 14 languages to suit Fletcher Building employees and country operations.
The Protect framework includes 10 standard safety rules based on the analysis of data from Fletcher Building’s high risk incidents.
28 Fletcher Building Annual Report 2017
Focus areas

Health and safety practitioner of the year
5,00
0
Sarah McDonald, a Fletcher Construction Health and Safety Advisor, was named New Zealand’s Health and Safety Practitioner of the Year at the 2017 Health and Safety Workplace Awards. Sarah was the health and safety advisor for the MacKay‘s to Peka Peka expressway construction project (M2PP).
The citation for the award said she positively influenced health and safety thinking in the wider Wellington region and described her as “…a key player in forging a consistent approach out of the different cultures of the seven Alliance members and 5,000 individual contractors.”
A lot of people say ‘let’s change the culture’. It’s an easy thing to say but harder to achieve without buy-in from the grass roots. We had our systems come from the grass roots and from the contractors. Accomplishing it was amazing.” SARAH McDONALDFletcher Construction Health and Safety Advisor
Sarah said the most important thing about the M2PP safety formula was that it wasn’t just she who had to push safety.
“It’s not just me. It’s the thousands of contractors who believed in it and who wanted to get home safely and return safe in the morning.” Sarah says the project had great leadership from the Alliance but also got buy-in from the ground.
INDIVIDUAL CONTRACTORS
M2PP / Sarah McDonald, third from right, and the M2PP Safety team
29 Fletcher Building Annual Report 2017

Sustainability and environment
We are committed to reducing our impact on the environment. When it comes to environmental management, Fletcher Building thinks globally and acts locally.
GBC WINSTONE / Environmental initiatives include extensive planting and habitat enhancement at Hunua Quarry in Auckland and the relocation of a native gecko population at Belmont Quarry in Wellington for which GBC Winstone was awarded the 2017 gold MIMICO award for Environmental Excellence.
FORMICA NORTH AMERICA / Using recycled leather car seats and other leather offcuts creates a more sustainable new laminate product
30 Fletcher Building Annual Report 2017
Focus areas

Together we strive to be better every day by proactively responding to environmental and sustainability issues. We recognise that sustainability practices need to be embedded into how we work – in our business strategies and plans, in our focus on quality and in our focus on our people. By doing this, we seek to operate a sustainably responsible business.
Our businesses regularly review their social, environmental and economic impacts and risks and assess sustainability trends and issues to determine the influence or impact that their businesses could have. We engage with our employees, stakeholders, communities, customers and suppliers to understand their needs as well as explain the key role that each has in the success of the organisation.
RISK AND INCIDENT MANAGEMENT
As part of the Protect programme outlined in the Health and Safety section on page 28, we have invested in a new Risk and Incident Management Tool (RIMT). The RIMT will offer an improved system for staff – no matter where they work – to log risks or incidents, providing more detailed reporting and improved management of risks and controls. Once the RIMT is in full operation, it will provide Fletcher Building with the ability to better identify, assess and manage a wide variety of risks, including strategic, operational, financial, reputational, environmental, health and safety, and compliance risks.
The investment in RIMT supports our commitment to understand and manage our risks, as well as reduce our impact on the environment. We have a central Environmental, Health and Safety team which supports our businesses, providing direction, education and focus on sustainability but it’s our 30 business units who have the biggest impact. Environmental initiatives are identified, developed and managed by local business leaders and employees so that they are appropriate for the communities and conditions.
350
REDUCING EMISSIONS
Fletcher Building continues to enter and track greenhouse gas emissions in its central database. This analysis provides a tool for determining where our efforts to reduce emissions should be focused.
Cement production accounts for approximately 35% of Fletcher Building's total emissions. We introduced new fuels to reduce reliance on high-emitting fossil fuels and this trend is expected to continue.
Reducing carbon emissions is an important target for all Fletcher Building businesses, including Distribution, which is making advances at its PlaceMakers and Mico sites. Emissions initiatives in this division have resulted in a carbon reduction of more than 650 tonnes so far.
EFFICIENT DISTRIBUTION
GBC Winstone’s new cement bulk carrier, the MV Aotearoa Chief, carries the equivalent of 350 road tankers, diverting a substantial amount of cement transportation from the roads to coastal sea routes. The ship has a ‘best in class’ propulsion system with an optimised energy efficiency design and an advanced flexible fuel injection system.
Close to 50,000 kilometres of truck movements per year have been avoided by Iplex Australia, by thinking smarter about how trucks are loaded with plastic pipes. The new loading technique was previously only used in Queensland but
the company is now expanding it to other sites around the country.
Fletcher Building is focused on:
• Working together to protect the environment
• Reducing the environmental impacts associated with our manufacturing, construction and extraction operations
• Reducing the environmental impacts associated with the distribution and use of our building materials
• Building leadership capability
• Supporting and investing in the communities in which we operate
• Managing health and safety risks across our business
• Working collaboratively with central and local government stakeholders to facilitate employment or training opportunities for disadvantaged youth
• Having workplaces that strive to provide development opportunities for our people, focused on high engagement and high performance.
GBC WINSTONE / New cement bulk carrier, the MV Aotearoa Chief carries the equivalent of 350 road tankers
31 Fletcher Building Annual Report 2017

CORPORATE GOVERNANCE STATEMENT
The board is committed to ensuring that Fletcher Building has appropriate corporate governance arrangements in place and that those arrangements are disclosed in a meaningful way to maximise transparency and investor confidence.
FRAMEWORK
Fletcher Building has securities listed on the Main Board of NZX and on the ASX. Consequently, its corporate governance framework is informed by the principles, guidelines, recommendations and requirements of the NZX Listing Rules, the NZX Corporate Governance Best Practice Code, the Financial Markets Authority’s ‘Corporate Governance in New Zealand Principles and Guidelines’, the ASX Listing Rules and the ASX Corporate Governance Council’s Principles and Recommendations.
Fletcher Building has been granted ASX Foreign Exempt Listing status, with effect from 6 May 2016. As such its disclosure obligations are as required by the NZX Listing Rules and otherwise in accordance with New Zealand law. ASX Foreign Exempt Listed companies are not required to comply with the ASX Corporate Governance Council’s Principles and Recommendations.
Fletcher Building has followed the NZX Corporate Governance Best Practice Code (applicable as at 30 June 2017). Fletcher Building’s corporate governance framework is currently being reviewed in light of the new NZX Corporate Governance Code, which will apply from 1 October 2017.
Shareholders should also refer to details of the board of directors in Board Profiles on pages 36 to 37 and the Remuneration Report on pages 38 to 43. Further information is also available on the company's website at http://www.fbu.com/investor-centre/corporate-governance/
This Corporate Governance Statement is current as at 31 July 2017 and has been approved by the board.
ETHICAL BEHAVIOUR
Code of Conduct
The company has a written Code of Conduct with which all directors, senior executives and employees are required to comply. The Code of Conduct documents minimum standards of ethical behaviour and the company’s expectations on loyalty and conflicts of interest, insider trading, holding of offices in another company or public office, intellectual property and misconduct.
The company also has an internal policy on dealing in the company’s securities by directors and employees.
The Code of Conduct is available on the company’s website.
Anti-bribery and corruption
The company has a written Anti-bribery and Corruption Policy, which provides for a zero-tolerance approach to bribery and corruption, whether in the private or public sector anywhere in the world.
The policy also sets out expectations around giving and receiving gifts, political and charitable donations and dealings with business partners.
Fletcher Building has a free phone and online service (‘FByourCall’) that can be used by any Fletcher Building staff member to report unacceptable, unethical or illegal behaviour in the workplace. This service is operated by external providers, who act as an independent third party to ensure calls are kept anonymous.
Related parties
Fletcher Building does not have any significant related parties with which it does material business.
Government relations
The company engages with Government in New Zealand and Australia in relation to the industries that it operates in and seeks insight and advice on government policy when required. Political donations can only be made with the authority of the board. No political donations were made in the year ended 30 June 2017.
BOARD COMPOSITION AND PERFORMANCE
Roles and responsibilities
The board’s roles and responsibilities are formalised in a Board Charter, which is available on the company’s website. The Board Charter sets out those functions that are delegated to management and those that are reserved for the board. It appoints the company secretary as secretary of the board, accountable directly to the board, through the chairman, on all matters to do with the proper functioning of the board.
Nominations committee
The nominations committee makes recommendations to the board in respect of board and committee composition and, when required, identifies individuals believed to be qualified to become board members. The chairman of the board is the chairman of the nominations committee and all members of the nominations committee are independent directors. The roles and responsibilities are set out in a Nominations Committee Charter, which is available on the company’s website.
Appointment
Before a person is appointed to the board, checks as to the person’s character, experience, education, criminal record and bankruptcy history are conducted. All material information in the company’s possession relevant to whether or not to elect new directors or re-elect those directors who resign by rotation is included in the notice of meeting for the next annual shareholders’ meeting.
Each director has a letter of appointment setting out the terms of his or her appointment. Each senior executive is a party to an employment agreement setting out the terms of his or her employment, including duties, responsibilities and remuneration. Further details of the terms of employment for Mark Adamson (whose employment as chief executive ceased on 20 July 2017) were provided to the NZX and ASX on 18 June 2012.
Director independence
Information on the skills, experience and expertise of current directors and their independence status is contained under ‘Board Profiles’. The company follows recommendations that the chairman be an independent director who is not the same person as the chief executive officer and that a majority of the board are independent directors. The board considers all directors to be independent, with the exception of Mark Adamson (who ceased to be a director on 19 July 2017).
32 Fletcher Building Annual Report 2017
Governance

Diversity Policy
Fletcher Building has a Diversity Policy, which is available on the company’s website. The remuneration committee reviews progress against diversity objectives and initiatives developed by the company to deliver outcomes against the diversity policy. The board is satisfied with the initiatives being implemented by the company and its performance with respect to the Diversity Policy. Further information on diversity initiatives can be found in the Our People section on pages 26 to 27.
The numbers and proportion of women and men within Fletcher Building as at 30 June 2017 are set out in the table below.
2017 2016
WOMEN MEN WOMEN MEN
Board of directors 2 (22%) 7 (78%) 2 (25%) 6 (75%)
Executive committee 2 (20%) 8 (80%) 1 (10%) 9 (90%)
Senior management¹ 16 (26%) 45 (74%) 20 (27%) 53 (73%)
All employees 22% 78% 21% 79%¹ Senior management for these purposes includes any person who reports to a member of the executive committee.
Board Skills Matrix
The board has adopted a Board Skills Matrix which takes account of the breadth of the company’s business interests and the nature of the company’s strategic focus. Skills and diversity that are relatively underweight are considered in making appointments to the board.
INDUSTRY GEOGRAPHY EXPERTISE DIVERSITY
Building products industry Australian business experience Strategy Gender
Construction industry International business experience Management
Distribution industry Finance/Accounting
Legal/Governance
Marketing
Information technology
Supply chain
Director induction and professional development
The board conducts induction and continuing professional development for directors, which includes visits to specific company operations and briefings from key executives and industry experts. Directors are provided with material health and safety information relevant to the business and attend site visits.
Performance
The board carried out a review of its performance and of the committees in mid-2016, with the assistance of an independent consultant. The review process included an online survey, a range of director and management team interviews, an observation of a board meeting, a review of board packs and a board discussion and feedback session.
The board evaluates annually the performance of the chief executive officer and the chief executive officer’s direct reports. The evaluation is based on criteria that include the financial performance of the business and the accomplishment of other non-quantitative objectives established at the beginning of each year. Further information can be found in the Remuneration Report. During the most recent financial year, performance evaluations of senior executives were conducted in accordance with this process.
BOARD COMMITTEES
There are currently four standing committees of the board:
• audit and risk
• remuneration
• nominations and
• safety, health, environment and sustainability.
From time to time, the board may create ad hoc committees to examine specific issues on its behalf.
Each committee is governed by a charter setting out its roles and responsibilities. The charter for each committee is available on the company’s website. Committees do not take action or make decisions on behalf of the board unless specifically mandated by prior board authority to do so. Employees only attend meetings of the audit and risk committee and remuneration committee at the invitation of the particular committee.
33 Fletcher Building Annual Report 2017

The table below shows director membership and attendance at board and committee meetings during the year to 30 June 2017 (both the number of meetings convened at a time when a director was a member of the board or committee and the number of meetings actually attended).
Board Audit and Risk Remuneration Nominations
Safety, Health Environment and
Sustainability
MEMBER ATTENDED MEMBER ATTENDED MEMBER ATTENDED MEMBER ATTENDED MEMBER ATTENDED
Norris 12(C) 12 – 4 – 4 2(C) 2 – 3
Adamson 12 12 – 4 – 4 – – – 3
Carter 12 11 – – 4 4 2 2 – –
Hassall 6 7 1 2 – – 2 2 – –
Jackson 12 12 – – 4(C) 4 2 2 3 3
Judge 12 11 4(C) 4 – – 2 2 – –
Spargo 12 12 4 3 – – 2 2 3(C) 3
Tarrant 12 12 4 4 – – 2 2 3 3
Vamos 12 12 4 4 3 3 2 2 – 1(C) denotes chairman at 30 June 2017
Takeover protocols
The board has established detailed protocols that set out the procedure to be followed if there is a takeover offer for the company, including any communication between company insiders and the bidder.
REPORTING AND DISCLOSURE
Continuous disclosure
The company has in place a Market Disclosure Policy designed to ensure compliance with its continuous disclosure requirements under NZX Listing Rules. The Market Disclosure Policy is available on the company’s website.
Disclosure of codes and charters
The company discloses applicable codes, charters and policies on its website at www.fbu.com/investor-centre
Safeguarding integrity in financial reporting
Prior to approving the full year financial statements, the board received from the chief financial officer a declaration that, in his opinion, the financial records of the entity have been properly maintained and that the financial statements comply with the appropriate accounting standards and give a true and fair view of the financial position and performance of the entity and that the opinion has been formed on the basis of a sound system of risk management and internal control that is operating effectively.
Sustainability
The Sustainability and Environment section on pages 30 to 31 discusses economic, environmental and social sustainability risks and how those risks are managed. Further sustainability information can be found on the company’s website at www.fbu.com
REMUNERATION
Remuneration committee
The board has formed a remuneration committee, which is subject to a formal charter available on the company’s website. The charter sets out the roles and responsibilities of the remuneration committee.
The remuneration committee has three members, whose names and qualifications are presented with directors under ‘Board Profiles’. The committee is chaired by Alan Jackson and all members are non-executive, independent directors. The remuneration committee held four meetings during the year and attendance at those meetings is recorded under the heading ‘Board Committees’ above.
Remuneration Policies
The company has adopted policies for senior executive remuneration, senior manager remuneration and general remuneration.
Remuneration Report
The company’s policies and practices regarding the remuneration of non-executive directors and the remuneration of executive directors and other senior executives are included in the Remuneration Report. The Remuneration Report also includes a discussion of the operation of, and policy for, equity based remuneration.
34 Fletcher Building Annual Report 2017
Governance

RISK MANAGEMENT
Risk
Fletcher Building has a group-wide risk management framework that supports the risk management policy of the group.
The purpose of the risk management framework at Fletcher Building is to ensure that the key risks faced are identified, assessed, controlled, monitored and reported so that the company can achieve its objectives and protect its people, customers and reputation.
The audit and risk committee of the board is responsible for overseeing the risk management framework and to regularly review the risks of Fletcher Building. As part of that responsibility, the audit and risk committee receives regular reports of the material, emerging and existing key risks, the current and target risk ratings, and the measures in place to mitigate the risks.
Fletcher Building has adopted a consistent framework for the management of risk, ensuring the alignment with strategy, business processes, corporate knowledge and technology. The company’s approach aligns with the international risk management framework as established under the International Organisation for Standardisation (ISO) ISO31000:2009 Risk Management – Principles and Guidelines.
Health and safety
The safety, health, environment and sustainability committee of the board is responsible for overseeing the health and safety risk management framework and regularly reviews the health and safety risks within the business.
Fletcher Building launched a new health and safety management framework in 2017 called Protect. Management of health and safety risks are discussed in more detail on page 28.
AUDITORS
The audit and risk committee performs an annual performance assessment of the external auditor to ensure ongoing quality and effectiveness. EY was appointed as external auditor, following a competitive tender process during FY15.
The Auditor Independence Policy includes requirements for the rotation of external audit engagement partners. The Auditor Independence Policy is available at http://www.fbu.com/investor-centre/corporate-governance/. In addition, the policy covers the provision of non-audit services by the company’s auditor. Auditor’s fees and expenses paid to EY are presented within note 27 of the group financial statements included in this annual report. The other work performed by the external auditor beyond the statutory audit was pre-approved in accordance with the Auditor Independence Policy and is not considered to compromise independence as the services did not constitute material sums of money.
The company’s external auditor attends the annual shareholders’ meeting and is available to answer questions from security holders relevant to the audit.
Internal audit
Fletcher Building has an internal audit function, which evaluates and improves the effectiveness of key risk management, control and governance processes. Internal audit develops an annual internal audit plan for approval by the audit and risk committee and is accountable for its implementation. To provide for the independence of the internal audit function, internal audit reports functionally to the audit and risk committee and administratively to the chief financial officer.
SHAREHOLDERS’ RIGHTS AND RELATIONS
Informed shareholders
Fletcher Building maintains a website, that includes information about Fletcher Building’s financial performance, operational activities, corporate governance and other information of specific relevance to investors and stakeholders. Core policies on communicating with shareholders are formalised in a Shareholder Communication Policy, which is available on the website.
The company operates an investor relations programme, which includes scheduled interactions with institutional investors, analysts and other market commentators. Presentations are also disclosed on the company’s website and the NZX and ASX announcement platforms. The chairman meets with major shareholders of the company in New Zealand and Australia on an annual basis. The chief executive officer and chief financial officer attend an analysts’ and investors’ call after release of the interim and full year results and answer questions raised by analysts and investors. The board also obtains annually, research on the perceptions that the New Zealand and Australian investment community have on the company, management and performance.
Electronic communications
Shareholders have the option to receive communications from, and send communications to, Fletcher Building electronically. Shareholders are actively encouraged to take up this option.
Shareholder voting
There have been no major decisions made during the year that would change the nature of Fletcher Building and that would require shareholder approval.
Capital allocation
Significant capital expenditure during the period included:
InitiativeFY17
Capex
Firth – North Island masonry consolidation $22m
GBC Winstone – South Island strategy $21m
Formica Europe – UK development plan $12m
GBC Winstone – Hunua Quarry new pit development $11m
35 Fletcher Building Annual Report 2017

SIR RALPH NORRIS FNZIM, HFIITP, KNZM, Hon.DBus (University of New South Wales)
Independent ChairmanChairman of the Nominations Committee
FIRST APPOINTED 1 APRIL 2014
Sir Ralph Norris retired as managing director and chief executive officer of the Commonwealth Bank of Australia in November 2011 following a 40-year career in the banking sector in Australia and New Zealand, including as chief executive officer of ASB Bank. He is a former chief executive officer of Air New Zealand. Sir Ralph is chairman of Contact and RANQX Holdings and a director of SouthPark Corporation, the Advisory Board of New Zealand Treasury and Fletcher Building Industries. He is a member of the NZ Olympic Advisory Committee, the Juvenile Diabetes Research Foundation Advisory Board, The University of Auckland Council and trustee of Business Mentors New Zealand. He also served as an independent non-executive director of Fletcher Building from 2001 to 2005.
ANTONY CARTER BE (Hons), ME, MPhil (Loughborough)
Independent Non-executive Director Member of the Remuneration and Nominations Committees
FIRST APPOINTED 1 SEPTEMBER 2010
Tony Carter was previously managing director of Foodstuffs (Auckland) and Foodstuffs (New Zealand), New Zealand’s largest retail organisation, and a director of a number of related companies. He has extensive experience in retailing, having joined Foodstuffs in 1994 and from having owned and operated several Mitre 10 hardware stores, and was a director and later chairman of Mitre 10 New Zealand. Tony is chairman of Fisher & Paykel Healthcare, Air New Zealand and the Blues LLP, a director of ANZ Bank New Zealand, Fletcher Building Industries and Avonhead Mall and a trustee of the Maurice Carter Charitable Trust.
DIRECTORS
FROM TOP
Sir Ralph NorrisAntony CarterBruce HassallDr Alan JacksonJohn Judge
Kathryn SpargoCecilia TarrantSteven Vamos
36 Fletcher Building Annual Report 2017
Board profiles

BRUCE HASSALL BCom, FCA (CAANZ)
Independent Non-executive DirectorMember of Audit and Risk and Nominations Committees
FIRST APPOINTED 1 MARCH 2017
Bruce Hassall was the CEO and a senior partner of PwC New Zealand until September 2016 when he ended his 30-year career with them. He was responsible for the executive leadership of PwC New Zealand, including the determination and execution of its strategy in New Zealand and was on PwC's AsiaPac leadership team.
Mr Hassall has considerable experience with both major public and private companies and in a range of industries, including retail, travel, communications, technology, forestry and entertainment sectors. He has M&A, IPO and capital raising experience.
He is an independent non-executive director of the Bank of New Zealand, chairman of The Farmers Trading Company and non-executive director of Prolife Foods and Fletcher Building Industries Limited. He serves as a member of the Advisory Board at The University of Auckland Business School and was a founding board member of the New Zealand China Council. He is a Chartered Accountant and Fellow of CAANZ.
DR ALAN JACKSON BEng (Hons), PhD (Auckland) MBA (IMD Management Institute)
Independent Non-executive Director Chairman of the Remuneration Committee and member of the Safety, Health, Environment and Sustainability and Nominations Committees
FIRST APPOINTED 1 SEPTEMBER 2009
Dr Alan Jackson was until 2009 chairman Australasia, senior vice president and director of The Boston Consulting Group. He has been an international management consultant since 1987 with The Boston Consulting Group and has proven experience at the most senior levels of international and government business. Alan has worked across a range of industries, including resources, diversified industrials, building products and construction sectors, including as chairman of Housing Corporation New Zealand. Alan is a fellow of the Institution of Professional Engineers. He is a director of Delegat’s Group and Fletcher Building Industries and chairman of New Zealand Thoroughbred Racing.
JOHN JUDGE BCom, FCA, FInstD
Independent Non-executive Director Chairman of the Audit and Risk Committee and member of the Nominations Committee
FIRST APPOINTED 9 JUNE 2008
John Judge has considerable experience in Australasian business and brings financial and analytical knowledge to the board. His career includes various roles within Ernst & Young culminating in the position of chief executive of Ernst & Young New Zealand. He is chairman of ANZ Bank New Zealand and the Auckland Arts Festival Trust, a director of Fletcher Building Industries and The New Zealand Initiative and a member of the Otago Business School Board of Advisors.
John Judge retires from the boards of Fletcher Building and Fletcher Building Industries at the conclusion of the 2017 annual shareholders' meeting.
KATHRYN SPARGO LLB (Hons), BA
Independent Non-executive DirectorChairman of the Safety, Health, Environment and Sustainability Committee and member of the Audit and Risk and Nominations Committees
FIRST APPOINTED 1 MARCH 2012
Kate Spargo has extensive business experience from advisory roles on strategic and governance issues, following a career in legal practice in both the public and private sectors. She is a director of Adairs, Sigma Pharmaceuticals, Sonic Healthcare, SMEC Holdings (Australia), Xenith IP and Fletcher Building Industries. She is also a member of the Geelong Football Club board and CoINVEST. Kate is a fellow of the Australian Institute of Company Directors.
CECILIA TARRANT BA, LLB (Hons), LLM (Berkeley)
Independent Non-executive DirectorMember of the Audit and Risk, Safety, Health, Environment and Sustainability and Nominations Committees
FIRST APPOINTED 10 OCTOBER 2011
Cecilia Tarrant has over 20 years of experience in international banking and finance, having worked as a lawyer and an investment banker in the USA and Europe. Prior to returning to New Zealand, she was a managing director at Morgan Stanley in London. Cecilia is a director of Fletcher Building Industries, Seeka Limited and Payments NZ and chairman of the Government Superannuation Fund Authority. She is a member of The University of Auckland Council and a trustee of The University of Auckland Foundation. Cecilia is also an executive- in-residence at The University of Auckland Business School.
STEVEN VAMOS BE (Hons)
Independent Non-executive Director Member of the Audit and Risk, Remuneration and Nominations Committees
FIRST APPOINTED 6 JULY 2015
Steve Vamos has more than 30 years’ experience in the information technology and online media industry. His previous executive roles include, vice president, Worldwide Sales and International Operations for Microsoft Corporation Online Services Group, chief executive officer of Microsoft Australia and New Zealand, chief executive officer of Ninemsn and senior executive roles at Apple and IBM. He is a non-executive director of Telstra and Fletcher Building Industries and is a member of the Advisory Board of the University of Technology Sydney Business School.
37 Fletcher Building Annual Report 2017

The company seeks to ensure that it remunerates management and directors fairly and responsibly. Remuneration policies are designed to attract, retain and motivate talented executives and senior management as a way of enhancing the performance of the company and aligning their interests with the creation of value for shareholders.
EXECUTIVE AND SENIOR MANAGEMENT REMUNERATION
The company’s remuneration strategy aims to attract, retain and motivate high calibre employees at all levels of the organisation, and thereby drive performance and sustained growth in shareholder value. The company’s remuneration committee is kept appraised of relevant market information and best practice, obtaining advice from external advisors when necessary. Remuneration levels are reviewed annually for market competitiveness and alignment with strategic and performance priorities.
The remuneration committee engaged PwC to provide remuneration benchmark data for the chief executive officer and other executive committee roles during the year. The peer group consisted of New Zealand and Australian listed companies of comparable size, complexity and industry to Fletcher Building. An additional global peer group was considered in respect of the chief executive officer role, which included comparable companies from other regions where Fletcher Building has operations.
Total remuneration for executives and senior management comprises:
• fixed remuneration, including the value of base remuneration and any other benefits;
• a short term variable incentive in the form of an annual performance-related cash bonus; and
• participation in the long-term share-based incentive scheme.
For the purposes of determining total remuneration within the executive and senior management group, it is assumed that executives and senior management will on average, achieve their target short-term incentive and 75% of their long-term potential incentives over time, such percentages to be reassessed periodically in the light of the actual earnings achieved over the business cycle.
Fixed remunerationIt is the company’s policy to pay fixed remuneration comparable to the median but total remuneration comparable to the upper quartile for equivalent roles in the country or region in which the employee is located. The New Zealand and Australian peer group data compiled by PwC was used for this comparison for executives based in New Zealand and Australia.
Participation in retirement savings plans is made available to employees as required by remuneration practices in relevant jurisdictions.
Short-term variable incentive Short-term variable incentives (STI) are designed to incentivise growth in earnings and operating cash by rewarding employees’ performance against financial and personal objectives. Short-term variable incentive targets are expressed as a percentage of base remuneration. Participation in the plan is by annual invitation at the discretion of the company, at which time financial targets and personal objectives are established.
Financial component: For the chief executive officer, corporate executives and senior management, the financial target is based on the group EBIT and operating cash. All operating executives and senior management have a proportion of the financial target based on the group EBIT and operating cash. For operating executives, the greater proportion of the financial target is based on division EBIT and operating cash, while for senior management the greater proportion of the financial target is based on the EBIT and funds employed and operating cash for the applicable business unit. The financial targets allow normalisation adjustments as agreed by the remuneration committee in advance for acquisitions, divestments and significant items, such as impairments. Financial targets are set at three levels; a threshold level, which must be met before any STI is paid, a target level and a maximum level, above which the STI paid will remain constant. For FY17, the financial threshold is set at achieving 90% of target. The maximum financial level is set at achieving 110% of target for the chief executive officer, executives and corporate senior management and 120% of target for operating senior management. Achievement of the maximum financial level results in a payment of 150% of the STI for all executives and senior management.
Personal component: Personal objectives comprise several challenging, measurable personal objectives. Objectives are aligned to, and support, the company strategy and are cascaded through the management team according to role. The objectives change from time to time to reinforce company priorities. Mark Adamson’s objectives included employee engagement, safety and business unit performance improvement measures and were approved directly by the chairman. Payment for the personal component is calculated by reference to the individual performance against the personal objectives for the financial year. The maximum uplift for the personal component is set at 150% for all executives. If the threshold financial level of the EBIT-related measure is not met, no personal component of the STI is payable.
38 Fletcher Building Annual Report 2017
Remuneration report

The components of STI by role are as follows:
Personal component
Financial component Total STI
GROUP EBIT/ CASH TARGET
EBIT/FUNDS AND CASH TARGET THRESHOLD % TARGET % MAXIMUM %2
CEO 20 80 0 100 150
Corporate executives 12 48 0 60 90
Operating executives¹ 12 – 16 18 – 24 30 – 40 0 60 – 80 90 – 120
Senior management¹ 4 – 8 8 – 32 0 – 24 0 20 – 40 30 – 60¹ Varies depending on role2 After maximum 150% uplift
In the event of a fatality or serious injury, the board retains the discretion to adjust any or all of the STI payment where it considers it reasonable to do so, having regard to the outcome of the established review process.
The board also has the discretion to require repayment of an employee’s STI for a period of up to three years where the company’s reported financial statements are subsequently restated or there is misconduct that causes a financial trading loss that has not been taken into account in the STI calculations.
Senior executives are contractually required to build and maintain share ownership of 50% of base remuneration or other percentage as notified by the company from time to time (refer to ‘Holding the Company’s Securities’).
Long-term share scheme Long-term performance incentives are designed to align employee remuneration with financial outcomes for shareholders over the longer term. The company has implemented a long-term share scheme (ELSS), targeted at the employees most able to influence financial results. The scheme is a share-based scheme except in circumstances where, owing to regulatory requirements, employees cannot participate fully or at all by way of shares. In such circumstances, the employee receives an equivalent economic entitlement which is paid partially or fully by way of a cash bonus entitlement. Participation in any year is by annual invitation at the discretion of the company.
Under the ELSS, participants purchase shares in the company at the offer price with an interest-free loan. The offer price is established at market value at the time of offer. The shares are held by a trustee on behalf of participants until the end of a restrictive period. If certain performance criteria are met and participants remain employed with the company throughout the restrictive period, a cash bonus is paid to meet the repayment of the interest-free loan and legal title in the shares is then transferred to the participants. To the extent that the performance criteria are not met or the participant ceases to be employed by the company, the shares will be forfeited and proceeds used to repay the interest-free loan.
The performance criteria under the ELSS are split into two components as follows:
• Total shareholder return (TSR) – 50% of shares
The TSR of the group for the period is compared with the total market cap-weighted TSR performance for the same period of a comparator group (excluding the two outliers within the comparator group). The 2016 offer is for the period 1 July 2016 to 30 June 2019, which may be extended for up to one more year until 30 June 2020. The comparator group used for the 2016 offer comprises Adelaide Brighton, Amcor, BlueScope, Boral, Brickworks, CSR, Downer EDI, GWA International, James Hardie, CIMIC, Reece, Sims Group, Spark and Steel & Tube. The entitlement to the TSR tranche is determined as follows:
TSR performance (%) Percentage entitlement %
< 50 nil
50 50
50 – 75 50 – 100 linear pro-rata
> 75 100
• Earnings per share (EPS) – 50% of shares
An EPS target for the year ending 30 June 2019 is set based on a required increase from the year ended 30 June 2016. The EPS for the year ended 30 June 2016, excluding significant items, was 60.6 cents and is required to increase by a minimum of 5% per annum before any of the EPS tranche will vest. The EPS tranche will fully vest if the EPS increases by 8% or more per annum. The entitlement to the EPS tranche over each of the year periods still subject to hurdles is determined as follows:
EPS for year ended 30 June 2019¹ Percentage entitlement %
< 70.1 cents Nil
70.1 cents per share 50
between 70.1 –76.3 cents per share 50 – 100 linear pro-rata
> 76.3 cents per share 100¹ EPS will be adjusted to exclude significant items
39 Fletcher Building Annual Report 2017

The board has retained its discretion to determine the extent to which any shares held in the ELSS should be transferred in any takeover, merger or corporate reconstruction.
The vesting and forfeiture of shares (due to failure to meet performance criteria) relating to the grant under the ELSS over the last six years are as follows:
Date of grant Shares granted Shares vested Shares forfeited EPS Target
October 2016 905,211 70.1 – 76.3
October 2015 3,208,083 67.1 – 73.1
October 2014 815,164 61.0 – 66.4
October 2013 771,038 50.0% 0.0%¹ 55.1 – 63.4
October 2012 1,542,549 50.0% 50.0% 31.5 – 36.2¹ The October 2013 EPS tranche vested in 2016 and the TSR tranche was extended to 30 September 2017.
FBuShareFBuShare is a broad-based employee share plan that aims to promote employee engagement and retention. Employees acquire shares in the company and, if they continue to be employed after a three-year qualification period, they become entitled to receive one award share for every two shares purchased in the first year of the qualification period and still owned at the end of that period. FBuShare does not require any performance criteria to be met. FBuShare has a maximum contribution rate of NZ$5,000 per annum (or the equivalent currency in other countries). Employees in certain countries are invited to participate in an equivalent plan, which replicates the benefits of FBuShare. Directors are not eligible to participate in FBuShare.
CHIEF EXECUTIVE OFFICER’S REMUNERATION
Mark Adamson’s base salary as at 30 June 2017 was $ 2,024,375. The remuneration he received in that year comprised:
Base remuneration $2,024,375
Short-term variable incentive (STI) relating to FY16 – paid September 2016 $2,198,959
Long-term share scheme (ELSS) 2013 – paid October 2016 $1,080,008
Other benefits* $69,392Refer above under ‘Executive and Senior Management Remuneration’ for details of the STI and ELSS.* Includes medical insurance premium and an annual return flight to his home country (the UK) for himself and his immediate family.
No short-term variable incentive was accrued or will be payable to Mark Adamson in respect of the year to 30 June 2017.
Mark Adamson was granted the following long-term incentive during the year. All of his long-term incentives were forfeited upon his employment as chief executive officer ceasing on 20 July 2017.
Long-term share scheme (ELSS) 2016 197,285 shares $ 2,093,194¹Refer above under ‘Executive and Senior Management Remuneration’ for details of the ELSS.¹ Based on a share price of $10.61, being the volume weighted average price for the five business days ended 30 September 2016
As an executive director, Mark Adamson did not receive any further remuneration in his capacity as director of the company, Fletcher Building Industries Limited or other subsidiaries.
2012 Share Options Plan – chief executive officerShareholders approved the issue of up to 1,000,000 options to acquire ordinary shares in the company to Mark Adamson at the annual shareholders’ meeting on 20 November 2012, pursuant to NZX Listing Rule 7.3.1 and ASX Listing Rule 10.14. Each option was issued for no cash consideration. Mark Adamson was the only eligible recipient under the 2012 Share Options Plan.
An initial issue of 500,000 options was made with effect on 1 October 2012 with an initial exercise price of $6.22, being the volume weighted average price of Fletcher Building shares sold on the NZSX in the five business days immediately preceding the announcement of Mark Adamson’s appointment on 18 June 2012. A further issue of 500,000 options was made with effect on 1 October 2015 with an initial exercise price of $6.89, being the volume weighted average price of Fletcher Building shares sold on the NZSX in the five business days immediately preceding 30 September 2015. The exercise price of the options adjusts annually, with effect from the date of grant, by the company's cost of capital less any dividends actually paid.
None of these options was exercised by Mark Adamson and all 1,000,000 options were forfeited upon his employment as chief executive officer ceasing on 20 July 2017.
Cessation of employmentMark Adamson’s employment as chief executive officer ceased on 20 July 2017 in accordance with the severance terms of his employment agreement. Since the commencement of FY18, Mark Adamson was paid his fixed remuneration for the period to 20 July 2017. Upon cessation of his employment, Mark Adamson was paid an amount in accordance with the severance terms in his employment agreement which was equivalent to his fixed remuneration entitlement for a combined period comprising a three-month notice period plus 12 months’ severance and any leave entitlement due to him, such aggregate amount being $2,936,387. The long-term incentives that were forfeited on cessation of his employment had a loan value of $8,014,105.
40 Fletcher Building Annual Report 2017
Remuneration report

NON-EXECUTIVE DIRECTORS’ REMUNERATION
The remuneration scale for non-executive directors was as follows:
2017 Calendar Year 2016 Calendar Year
MEMBERPER ANNUM
CHAIRMAN¹PER ANNUM
MEMBERPER ANNUM
CHAIRMAN¹PER ANNUM
Board of directors $166,000 $440,000 $162,000 $430,000
Audit and risk committee $23,000 $46,000 $23,000 $46,000
Remuneration committee $17,500 $35,000 $17,500 $35,000
Nominations committee $10,000 $10,000
Safety, health, environment and sustainability $17,500 $35,000 $17,500 $35,000
Travel allowance – Australian residents $18,000 $18,000¹ The chairmen’s amounts are not additional to the corresponding member amounts.
All non-executive directors were also paid a non-vouchable expense reimbursement allowance of $5,000 per annum. Where an ad hoc committee is convened, such as for due diligence, additional remuneration may be payable at $1,200 per half day. However, no payments for ad hoc committees were made in the current year. Directors do not receive any further remuneration for also being directors of Fletcher Building Industries Limited, the NZX listed issuer of the group’s debt securities.
Director fees are reviewed annually in the last quarter of the calendar year.
The maximum aggregate remuneration able to be provided to all non-executive directors was set at $2,000,000 at the 2011 annual shareholders’ meeting. The remuneration paid to non-executive directors in the year ended 30 June 2017 was as follows:
Non-executive director Remuneration paid
A J Carter $191,500
A T Jackson $226,500
J F Judge $220,000
R J Norris $435,000
K D Spargo $250,000
C Tarrant $214,500
S M Vamos $229,583
B R Hassall1 $66,333
Total $1,833,4161 Bruce Hassall became a director on 1 March 2017. He is an additional director appointed in anticipation of the retirement of John Judge at the conclusion of the 2017 annual
shareholders’ meeting.
Non-executive directors do not participate in any company share or option plan. However, the Board Charter requires non-executive directors (or their associates) to hold at least 20,000 shares in the company to demonstrate their commitment and alignment with the company. This shareholding can be acquired at any time prior to the annual shareholders' meeting at which they are first subject to re-election. There are no schemes for retirement benefits for non-executive directors.
DIRECTORS’ AND OFFICERS’ INDEMNIFICATION AND INSURANCE
The company has arranged a programme of directors’ and officers’ liability insurance covering directors, executives and employees acting on behalf of the company. Cover is for damages, judgments, fines, penalties, legal costs awarded and defence costs arising from wrongful acts committed whilst acting for the company. Actions not covered include dishonest, fraudulent or malicious acts or omissions, wilful breach of a statute, regulation or a duty to the company, improper use of information to the detriment of the company and breach of professional duty.
The insurance cover is supplemented by an indemnity from the company. However, the indemnity does not cover liabilities that cannot be indemnified under the Companies Act 1993 or other statutes, including liability arising from criminal acts or a failure to act in good faith and in the best interests of the company.
41 Fletcher Building Annual Report 2017

HOLDING THE COMPANY’S SECURITIES
A standard term in the executive and senior management employment contract is a requirement that, over time, executives and senior managers must acquire and maintain a holding in the company’s ordinary shares until such time as the greater of the sum invested or the market value of their shareholding exceeds 50% of their base remuneration. In meeting this obligation, executives and senior managers may not sell any shares that vest under the ELSS until the shareholding equals or exceeds the shareholding threshold. For executives or senior managers who are domiciled outside New Zealand or Australia, any net after-tax payments made under the ELSS are to be used to acquire shares on or before 31 March of the following financial year (i.e. 31 March immediately following the payment from the scheme) until the shareholding equals or exceeds the shareholding threshold. In addition, for members of the executive committee who are domiciled in New Zealand or Australia, if at the time of appointment to an executive role, the greater of the market value or cost of the individual shareholding is less than the value of 10% of nominal base remuneration, the executive is required to apply no less than 25% of the after-tax value of any short-term incentive payment to acquire Fletcher Building Limited shares on or before 31 March of the following financial year (i.e. 31 March immediately following the short-term incentive payment). This requirement applies for the first two years of employment as an executive unless the shareholding equals or exceeds the shareholding threshold.
The company believes this shareholding strengthens the alignment of executives and senior management with the interests of shareholders and puts their own remuneration at risk to long-term company performance. Directors may, in any year at their discretion, ease the share investment percentage required in respect of any incentive payment arising in that year.
Shares issued to executives and senior management under the ELSS, but still subject to the restrictive period, do not count towards the required minimum shareholding. The company does, however, allow New Zealand-based executives or senior management to include an economic exposure to the shares through a defined contribution investment account in the Fletcher Building Retirement Plan, the value of which is calculated by reference to the Fletcher Building share price.
The company has a policy that prohibits entering into transactions in associated products that limit the economic risk of participating in unvested entitlements under equity-based remuneration schemes.
EMPLOYEE REMUNERATION
Section 211(1)(g) of the New Zealand Companies Act 1993 requires disclosure of the number of employees or former employees of the company, not being directors of the company, whose remuneration and any other benefits received by them during the financial year in their capacity as employees, was equal to or exceeded $100,000 per annum and to state the number of such employees or former employees in brackets of $10,000. These amounts are included below and include all applicable employees or former employees of Fletcher Building worldwide. The remuneration amounts include all monetary amounts and benefits actually paid during the financial year, including redundancies and the face value of long-term incentives vested.
42 Fletcher Building Annual Report 2017
Remuneration report

EMPLOYEE REMUNERATION
From NZ$ to NZ$
International business activities
New Zealand business activities Total
100,000 – 110,000 482 430 912
110,000 – 120,000 355 359 714
120,000 – 130,000 234 262 496
130,000 – 140,000 181 202 383
140,000 – 150,000 128 146 274
150,000 – 160,000 107 133 240
160,000 – 170,000 82 92 174
170,000 – 180,000 57 65 122
180,000 – 190,000 72 59 131
190,000 – 200,000 57 49 106
200,000 – 210,000 43 48 91
210,000 – 220,000 37 47 84
220,000 – 230,000 34 35 69
230,000 – 240,000 23 27 50
240,000 – 250,000 14 21 35
250,000 – 260,000 20 22 42
260,000 – 270,000 12 17 29
270,000 – 280,000 11 12 23
280,000 – 290,000 14 14 28
290,000 – 300,000 11 7 18
300,000 – 310,000 6 10 16
310,000 – 320,000 11 14 25
320,000 – 330,000 8 4 12
330,000 – 340,000 2 3 5
340,000 – 350,000 1 1 2
350,000 – 360,000 2 6 8
360,000 – 370,000 4 4 8
370,000 – 380,000 6 4 10
380,000 – 390,000 5 2 7
390,000 – 400,000 3 5 8
400,000 – 410,000 3 6 9
410,000 – 420,000 7 3 10
420,000 – 430,000 6 2 8
430,000 – 440,000 2 1 3
440,000 – 450,000 5 1 6
450,000 – 460,000 2 2 4
460,000 – 470,000 4 2 6
From NZ$ to NZ$
International business activities
New Zealand business activities Total
470,000 – 480,000 3 1 4
480,000 – 490,000 1 1
490,000 – 500,000 1 1
500,000 – 510,000 3 1 4
510,000 – 520,000 1 1
520,000 – 530,000 1 3 4
530,000 – 540,000 2 1 3
540,000 – 550,000 3 1 4
550,000 – 560,000 2 2
560,000 – 570,000 2 2
570,000 – 580,000 1 1
600,000 – 610,000 1 2 3
610,000 – 620,000 2 1 3
620,000 – 630,000 1 1 2
630,000 – 640,000 1 1
640,000 – 650,000 1 1
660,000 – 670,000 2 2
680,000 – 690,000 1 1
700,000 – 710,000 1 1
710,000 – 720,000 2 2
720,000 – 730,000 2 2
780,000 – 790,000 1 1
830,000 – 840,000 1 1
860,000 – 870,000 1 1
900,000 – 910,000 1 1
940,000 – 950,000 1 1
970,000 – 980,000 1 1
1,020,000 – 1,030,000 1 1
1,060,000 – 1,070,000 1 1
1,090,000 – 1,100,000 1 1
1,100,000 – 1,110,000 1 1
1,140,000 – 1,150,000 1 1
1,150,000 – 1,160,000 1 1 2
1,380,000 – 1,390,000 1 1
1,470,000 – 1,480,000 1 1
3,270,000 – 3,280,000 1 1
2,077 2,152 4,229
43 Fletcher Building Annual Report 2017

Fletcher Building posts underlying operating earnings of $525 million
Reported results $m (except where noted)
Year ended30 June
2017
Year ended 30 June
2016Change
%
Total revenue 9,399 9,004 4Operating earnings before significant items 1 525 682 (23)Significant items2 (252) 37 NMOperating earnings (EBIT) 273 719 (62)Funding costs (111) (115) (3)Earnings before tax 162 604 (73)Tax expense (57) (131) (56)Earnings after tax 105 473 (78)Non-controlling interests (11) (11) 0Net earnings 94 462 (80)Net earnings before significant items 321 418 (23)
Earnings per share before significant items (cents) 46.3 60.6 (24)Earnings per share (cents) 13.5 67.0 (80)Dividends declared per share (cents) 39.0 39.0 0Capital expenditure 319 300 6
1 Operating earnings before significant items is a non-GAAP measure used by management to assess the performance of the business and has been derived from Fletcher Building Limited’s group financial statements for the year ended 30 June 2017.
2 Details of significant items can be found in note 4 of the group’s financial statements.
RevenueYear ended
30 June2017
NZ$m
Year ended 30 June
2016NZ$m
Change%
Building Products 2,270 2,449 (7)International 2,017 2,128 (5)Distribution 3,287 3,184 3Residential and Land Development 420 343 22Construction 2,246 1,648 36Other 9 9 0Gross revenue 10,249 9,761 5less intercompany sales (850) (757) 12Group external revenue 9,399 9,004 4
44 Fletcher Building Annual Report 2017
Financial review 2017

Reported operating earnings Operating earnings before significant items1
Year ended 30 June
2017NZ$m
Year ended 30 June
2016NZ$m
Change%
Year ended 30 June
2017NZ$m
Year ended 30 June
2016NZ$m
Change%
Building Products 169 353 (52) 267 274 (3)International 169 103 64 169 133 27Distribution 40 175 (77) 193 176 10Residential and Land Development 130 84 55 130 84 55Construction (204) 78 NM (204) 78 NMCorporate (31) (74) 58 (30) (63) 52Total 273 719 (62) 525 682 (23)Funding costs (111) (115) (3) (111) (115) (3)Earnings before tax 162 604 (73) 414 567 (27)Tax expense (57) (131) (56) (82) (138) (41)Earnings after tax 105 473 (78) 332 429 (23)Non-controlling interests (11) (11) 0 (11) (11) 0Net earnings 94 462 (80) 321 418 (23)
1 Operating earnings before significant items is a non-GAAP measure used by management to assess the performance of the business and has been derived from Fletcher Building Limited’s group financial statements for the year ended 30 June 2017. Details of significant items can be found in note 4 of the group’s financial statements.
Geographic segments
Gross revenue External revenueYear ended
30 June2017
NZ$m
Year ended 30 June
2016NZ$m
Change%
Year ended 30 June
2017NZ$m
Year ended 30 June
2016NZ$m
Change%
New Zealand 6,126 5,438 13 5,381 4,797 12Australia 2,853 3,055 (7) 2,766 2,959 (7)Rest of World 1,270 1,268 0 1,252 1,248 0Total 10,249 9,761 5 9,399 9,004 4
Operating earnings before significant items1
Year ended 30 June
2017NZ$m
Year ended 30 June
2016NZ$m
Change%
New Zealand 282 452 (38)Australia 120 154 (22)Rest of World 123 76 62Total 525 682 (23)
45 Fletcher Building Annual Report 2017

Geographic segments in local currency
Gross revenue External revenue
Year ended30 June
2017
Year ended30 June
2016Change
%
Year ended30 June
2017
Year ended30 June
2016Change
%
Australia (A$m) 2,701 2,809 (4) 2,619 2,721 (4)Rest of World (US$m) 905 850 6 892 837 7
Operating earnings before significant items1
Year ended30 June
2017
Year ended30 June
2016Change
%
Australia (A$m) 114 142 (20)Rest of World (US$m) 88 51 73
1 Operating earnings before significant items is a non-GAAP measure used by management to assess the performance of the business and has been derived from Fletcher Building Limited’s group financial statements for the year ended 30 June 2017. Details of significant items can be found in note 4 of the group’s financial statements.
• External revenue of $9,399 million was $395 million or 4% higher than the prior year. New Zealand revenue increased by $584 million, but was offset by lower revenue in Australia (primarily due to the divestment of Rocla Quarries). In local currencies, revenue increased by 12% in New Zealand, declined by 4% in Australia and increased by 7% in the Rest of World.
• Reported operating earnings before interest and tax of $273 million were 62% lower than the prior year.
• Reported operating earnings include significant items of $252 million relating to:
– $222 million of goodwill and intangible assets have been impaired in the year, with $69 million relating to Iplex Australia and $153 million relating to Tradelink;
– Costs of $17 million relating to site closures in Fletcher Insulation and Rocla Products;
– $12 million relating to the costs associated with prolonged industrial action, which has now been resolved, at one of Fletcher Insulation’s manufacturing sites; and
– Costs of $1 million associated with the acquisition of the Higgins business which was completed during the year.
• Operating earnings before significant items were $525 million, 23% lower than the prior year, primarily due to losses recognised in the B+I business. When adjusting for the impact of these losses, earnings increased approximately 20%.
• In New Zealand, earnings benefited from continued demand across the residential building and infrastructure sectors which translated to improved Building Products, Residential and Distribution earnings alongside improved operational performance in specific business units. Excluding the results of the B+I business, New Zealand earnings were up approximately 30% on the prior year.
• In Australia, market conditions were mixed, with robust activity in Eastern states offset by challenging trading conditions in Western Australia where local currency revenue for the group decreased 21% compared to the prior year. Operating earnings before significant items were flat, once adjusted for divested businesses and the one-off property gain in Tradelink in the prior year.
• In the Rest of World, earnings in local currency increased 73% driven by strong performances in Formica’s Asian operations, and significant year-on-year improvement in Formica Europe, alongside the Construction South Pacific business and contributions from the Higgins Fiji operations acquired in July 2016.
• Funding costs of $111 million were 3% lower than the prior year. Whilst increased interest costs resulted from higher debt levels at the end of the year these were more than offset by the impact of derivative valuation changes in the year.
• The tax expense of $57 million represents an effective tax rate for the year of 35% (2016: 22%) which has been influenced by the significant items reported during the year. Excluding significant items the effective tax rate was 20% and is expected to return to normal levels in FY18.
• Earnings per share were 13.5 cents, a decrease from 67.0 cents per share in the prior year.
• Earnings per share before significant items were 46.3 cents, a decrease from 60.6 cents in the prior year.
• Cash from operations of $243 million, compared with $660 million in the prior year, reflected lower operating earnings, continued investment in residential land and increased working capital across the group as activity levels increased.
46 Fletcher Building Annual Report 2017
Financial review 2017

The following sections provide commentary on individual division results for the year ended 30 June 2017.
Building Products Concrete Pipes & Products, Cement & Aggregates; Building Materials; Plastic Pipes
Year ended30 June
2017NZ$m
Year ended30 June
2016NZ$m
ChangeNZ$m
Change%
Gross revenue 2,270 2,449 (179) (7)External revenue 1,783 1,969 (186) (9)Operating earnings before significant items1 267 274 (7) (3)Significant items2 (98) 79 (177) NMOperating earnings 169 353 (184) (52)Funds 1,666 1,581 85 5
Operating earnings before significant items1
Year ended30 June
2017NZ$m
Year ended30 June
2016NZ$m
Change%
Concrete Pipes & Products 60 59 2Cement & Aggregates 74 68 9Building Materials 102 93 10Plastic Pipes 20 14 43JV Earnings and other 11 18 (39)Subtotal 267 252 6Divested businesses 0 22 NMTotal 267 274 (3)
1 Operating earnings before significant items is a non-GAAP measure used by management to assess the performance of the business and has been derived from Fletcher Building Limited’s group financial statements for the year ended 30 June 2017.
2 Details of significant items can be found in note 4 of the group’s financial statements.
The Building Products division reported gross revenue of $2,270 million compared with $2,449 million in the prior year, a reduction of 7%. Adjusting for divested businesses (Pacific Steel and Rocla Quarries), and changes in Joint Venture accounting (Altus), revenue was flat year-on-year.
Operating earnings before significant items were $267 million, 3% lower than $274 million in the prior year, however, adjusting for divested businesses, operating earnings increased 6% with a number of New Zealand businesses recording record volumes.
Operating earnings before significant items for Concrete Pipes & Products were $60 million, compared to $59 million in the prior year, a 2% increase. The result included a gain from a property sale in New Zealand of $12 million. Excluding the property gain, the New Zealand concrete products business increased earnings by 15%, with ready-mix concrete volumes increasing 3%. New Zealand concrete pipe volumes increased 9%, however, earnings were down $3 million due to margin compression. Concrete pipe volumes in Australia were flat year-on-year, however operating earnings decreased $12 million from the prior year, negatively impacted by lower pricing and operational issues at a key manufacturing site. Interventions to lay foundations for performance improvements in FY18 have been made.
Operating earnings for Cement and Aggregates were $74 million, compared to $68 million in the prior year, a 9% increase. This was primarily driven by New Zealand aggregates volumes which were 29% higher than prior year and a modest increase in cement volumes of 4%, combined with a favourable change in the mix of regional quarrying volumes.
Operating earnings before significant items for the Building Materials businesses were $102 million, compared to $93 million in the prior year, a 10% increase. Plasterboard volumes were up 6% overall, with volumes of performance boards increasing 2%. Whilst New Zealand glasswool volumes remained flat compared to the prior year, the operating earnings of the New Zealand insulation business more than doubled primarily as a result of price increase initiatives and production improvements. Earnings from the Australian insulation business declined $2 million versus the prior year, due mainly to costs associated with key transformation initiatives, including the recommissioning of the Rooty Hill plant in Sydney.
The Plastic Pipes businesses reported $20 million operating earnings before significant items, a $6 million improvement on the prior year. Operating earnings in the New Zealand plastic pipes business increased by $2 million as a result of higher plumbing and civil volumes, favourable product mix and operational efficiencies. In Australia, the plastic pipes business returned to profitability with operating earnings before significant items increasing by $4 million from the prior year. Operating efficiencies and market share gains in the plumbing segment more than offset reduced volumes, which decreased by 1% due to softening demand particularly in the irrigation and mining segments, as well as continued reduction in demand from coal seam gas projects.
Significant items of $98 million reported in the year comprise the impairment of Iplex Australia intangible assets ($69 million), costs relating to the closure of three sites in Australia ($17 million) and costs incurred in Fletcher Insulation as a result of prolonged industrial action at one of the business’s manufacturing sites ($12 million). This compared to a net gain of $79 million in the prior year which was primarily attributable to the sale of Rocla Quarries.
47 Fletcher Building Annual Report 2017

InternationalLaminex; Formica; Roof Tile Group
Year ended30 June
2017NZ$m
Year ended30 June
2016NZ$m
ChangeNZ$m
Change %
Gross revenue 2,017 2,128 (111) (5)External revenue 1,999 2,106 (107) (5)Operating earnings before significant items1 169 133 36 27Significant items2 0 (30) 30 NMOperating earnings 169 103 66 64Funds 1,938 1,902 36 2
Operating earnings before significant items1Year ended
30 June2017
NZ$m
Year ended30 June
2016NZ$m
Change %
Laminex 90 80 13Formica 88 62 42Roof Tile Group 13 14 (7)International divisional costs (22) (23) (4)Total 169 133 27
1 Operating earnings before significant items is a non-GAAP measure used by management to assess the performance of the business and has been derived from Fletcher Building Limited’s group financial statements for the year ended 30 June 2017.
2 Details of significant items can be found in note 4 of the group’s financial statements.
Operating earnings before significant items for the International division increased 27% to $169 million from $133 million in the prior year. This was primarily driven by the turnaround of Formica Europe and improvement of the Laminex businesses.
Laminex’s operating earnings increased by 13% to $90 million compared to $80 million in the prior year.
Operating earnings in Laminex Australia were $76 million, up 6% on the prior year. Gross revenue in Australia decreased by 4% in Australian dollars terms, due largely to continuing weaknesses in the Western Australia residential sector offset by growth in the Eastern states. Operating earnings were positively impacted by optimised pricing, operational efficiency improvements plus continued reductions in overheads, offset in part by increasing energy prices which negatively impacted production costs.
Operating earnings excluding significant items in Laminex New Zealand increased from $8 million to $14 million. Gross revenue in New Zealand increased by 6%. The year-on-year earnings growth was due to strengthening margins, improved share in the decorated board business, as well as improvements in operational efficiency.
Operating earnings excluding significant items for Formica were $88 million, an increase of 42% on the prior year. In local currencies, overall gross revenue was up by 3% on last year.
In North America, operating earnings were $53 million, down by 5% on the prior year. Operating earnings in local currency were in line with the prior year as strong operational performance of the manufacturing plants in the US and Canada was partially offset by unfavourable product and market mix. Gross revenue in local currency increased by 1% on the prior year, supported by volume growth of 3%.
In Asia, operating earnings increased 35% to $31 million driven largely by revenue growth, lower raw material prices and improved manufacturing efficiencies across all four factories in Asia. Gross revenue in local currency was up by 6% on the prior year. The key markets of ASEAN, China and Taiwan generated revenue growth of 13%, 6% and 1% respectively.
In Europe, operating earnings excluding significant items of $4 million was a $21 million improvement on the loss of $17 million in the prior year. This was attributable to a local currency gross revenue increase of 2%, significant improvements in operational performance at the main UK manufacturing plant and continued overhead cost reductions across the business.
Operating earnings in the Roof Tile Group were down by $1 million to $13 million. Gross revenue in local currencies was down by 5% on the prior year driven predominantly by deteriorating economic conditions in Africa, where volumes fell by 31%, with a resulting $5 million decrease in operating earnings. Elsewhere in the core markets of the Americas, Asia and Europe, volumes increased by 8%, 4% and 4% respectively.
48 Fletcher Building Annual Report 2017
Financial review 2017

Distribution NZ Building Supplies; NZ Steel Distribution; Australian Building Supplies; Australian Steel Distribution
Year ended30 June
2017NZ$m
Year ended30 June
2016NZ$m
ChangeNZ$m
Change %
Gross revenue 3,287 3,184 103 3External revenue 3,112 3,026 86 3Operating earnings before significant items1 193 176 17 10Significant items2 (153) (1) (152) NMOperating earnings 40 175 (135) (77)Funds 935 1,001 (66) (7)
Operating earnings before significant items1Year ended
30 June2017
NZ$m
Year ended30 June
2016NZ$m
Change %
NZ Building Supplies 104 85 22NZ Steel Distribution 54 44 23Australian Building Supplies 10 27 (63)Australian Steel Distribution 25 20 25Total 193 176 10
1 Operating earnings before significant items is a non-GAAP measure used by management to assess the performance of the business and has been derived from Fletcher Building Limited’s group financial statements for the year ended 30 June 2017.
2 Details of significant items can be found in note 4 of the group’s financial statements.
The Distribution division reported operating earnings of $40 million, compared with $175 million in the prior year.
This result includes significant items of $153 million relating to the impairment of intangible assets in the Tradelink business.
Operating earnings before significant items for the year were $193 million, an increase of 10% on the prior year. Year-on-year earnings growth was delivered from an increase in local currency gross revenue of 7% in New Zealand and 1% in Australia, alongside both gross margin and operating cost efficiencies.
The New Zealand Building Supplies businesses reported increased operating earnings of 22%. This was achieved through revenue growth of 6% including market share gains, improved gross margins and controlled operating costs, including benefits from ongoing branch co-locations and operating leverage. Continued growth was seen across the NZ regions, with the exception of the Canterbury market which contracted year-on-year as the market resets from the highs of the residential rebuild.
PlaceMakers gross revenue of $1.2 billion was up 6% on the prior year, reflecting growth in core categories such as timber, frame and truss, and insulation, as well as in targeted categories such as fastenings, doors and windows. Mico’s gross revenue also increased by 6% to $250 million, with market share gains in both the bathroom segment and plumbing supplies.
The New Zealand Steel Distribution businesses grew operating earnings before significant items by 23% to $54 million, reflecting profitable market share gains across all business groupings. These gains, along with improved margins and cost control led to the double-digit growth in operating earnings.
In Australian Building Supplies, Tradelink’s operating earnings before significant items were $5 million, $17 million lower than the prior year. The prior year result included a $14 million net gain from property sales offset by one-off costs. The recessionary effects in Western Australia affected the underlying performance of the business, with local currency gross revenue flat despite traction in both new stores and in the small and medium enterprise customer segment.
Australian Steel Distribution’s focus on efficiency and cost control increased operating earnings by 25% alongside growth in key target market segments, including sheds, residential and commercial projects.
Across the division, a focus on targeted growth and operating improvements during the year saw 20 new Tradelink branches open in Australia and significant refurbishment and reinvestment in over 20 branches across the NZ business units.
49 Fletcher Building Annual Report 2017

Residential and Land DevelopmentNZ Residential; Land Development
Year ended30 June
2017NZ$m
Year ended30 June
2016NZ$m
ChangeNZ$m
Change%
Gross revenue 420 343 77 22External revenue 420 343 77 22Operating earnings 130 84 46 55Funds 541 355 186 52
Operating earningsYear ended
30 June2017
NZ$m
Year ended30 June
2016NZ$m
Change%
NZ Residential 76 74 3Land Development 54 10 NMTotal 130 84 55
The Residential and Land Development division reported operating earnings of $130 million, a 55% increase on the prior year.
Gross revenue for the year was $420 million, up from $343 million in the prior year.
NZ Residential operating earnings were $76 million, 3% higher than the prior year. There was an increase in the volumes of units sold to 499 in FY17. This reflected a higher number of sales in the new developments of Swanson, Whenuapai, Beachlands and Red Beach offsetting a decrease in volumes sold at the highly successful developments of Greenhithe and Stonefields.
The Christchurch business continued to progress a number of developments in partnership with the Crown. At Awatea, 60 homes were sold during the year, including 26 affordable homes to first home buyers and 10 homes to charitable housing providers for use as intermediate housing. In addition, we sold a number of units at the private developments of Longhurst and Farringdon.
Overall, NZ Residential sales volumes were behind expectations due to the delayed delivery of land. Average margins, however, were ahead of expectations, driven by continued strong Auckland pricing. The rate of increase in the residential market has slowed since January, signalling a return to more normal market conditions.
Land Development operating earnings were $54 million. This business comprises a combination of residential and commercial land developments for on sale to third parties. This included the sale of the final lot at the James Fletcher Drive development and the sale of the first lot at the Wiri North development.
Whilst Land Development earnings will be irregular in nature, it is anticipated that the business will earn at least $25 million per annum over the next five years.
At year end there were 3,842 lots on balance sheet with a further 2,227 lots under unconditional agreements, to be delivered over the next five years.
Funds employed increased to $541 million from $355 million in the prior year. This was driven by a combination of development work on previously acquired residential sites; an increase in work in progress as the business builds its volumes, in particular in medium-rise apartment delivery, and the settlement of lots purchased from other developers in Beachlands, Penihana, Hobsonville and Whenuapai.
50 Fletcher Building Annual Report 2017
Financial review 2017
Construction Construction New Zealand; Construction South Pacific
Year ended30 June
2017NZ$m
Year ended30 June
2016NZ$m
ChangeNZ$m
Change%
Gross revenue 2,246 1,648 598 36External revenue 2,085 1,560 525 34Operating earnings (204) 78 (282) NMFunds 174 (18) 192 NM
Operating earnings
Year ended30 June
2017NZ$m
Year ended30 June
2016NZ$m
Change%
Construction New Zealand (241) 58 NMConstruction South Pacific 37 20 85Total (204) 78 NM
The Construction division reported an operating loss of $204 million compared with operating earnings of $78 million in the prior year. The result includes a positive contribution of $39 million from the Higgins contracting business which was acquired in July 2016.
The Infrastructure, Higgins and South Pacific businesses all recorded strong operating and trading performances in 2017. However, the Building and Interiors (B+I) business unit recorded an operating loss of $292 million, due to losses identified on two large and highly complex projects, and a number of smaller construction jobs.
During the year, following the identification of losses on one major project, a thorough review of the B+I business was undertaken and led to the introduction of new management and governance processes along with the implementation of a new financial management reporting system. These new governance processes along with ongoing project reviews, have indicated significantly higher costs to complete projects across the portfolio, and have also enabled improved quantification of remaining risks. In addition, the detailed review by new management has led to downward revisions in expected profits on a number of smaller projects.
The Infrastructure business reported operating earnings of $31 million, compared with $35 million in the prior year. Work on two major road contracts, the Waterview tunnel in Auckland and the MacKay’s to Peka Peka project north of Wellington, reached practical completion during the year. Financial close was achieved on the 18.5 kilometres Pūhoi to Warkworth motorway to extend Auckland’s Northern Motorway, with completion scheduled for late 2021. This project, which has been procured as a PPP (Private Public Partnership), has a total value across all partners of $710 million. The project partners comprise Fletcher Construction, Higgins and Acciona. Work also started on the design and construct continuation of the Kāpiti Expressway, from Peka Peka to Otaki.
Higgins recorded operating earnings of $39 million from its New Zealand and Fiji operations, which was ahead of forecasts established during the acquisition process. Higgins has been fully integrated into the Construction division and has continued to operate very successfully under existing management while leveraging Fletcher Building’s scale and structure. In late November 2016, Higgins was one of four parties asked to join the North Canterbury Transport Infrastructure Rebuild Alliance (NCTIR) to perform recovery works in response to the Kaikoura earthquakes. A strong team has been mobilised, supported with resources from the Infrastructure business unit, and significant progress has been made in restoring road and rail connections in the upper South Island region.
Construction South Pacific reported operating earnings of $37 million, an increase from $20 million in the prior year. The increase in earnings includes a contribution from Higgins Fijian operations, together with the declaration of final margins on several key projects in Papua New Guinea and American Samoa as these reached the end of their defects liability periods. In Fiji, work on the Momi Bay Resort was completed, while further work was undertaken on a hotel development in Papua New Guinea.
51 Fletcher Building Annual Report 2017

Group Cash FlowYear ended
30 June2017
NZ$m
Year ended30 June
2016NZ$m
ChangeNZ$m
Operating earnings before significant items1 525 682 (157)Depreciation and amortisation 203 194 9 Less cash tax paid (99) (97) (2) Less interest paid (125) (118) (7) Provisions, significant items and other (85) (99) 14 Results from operations before working capital movements 419 562 (143) Land and developments (99) (66) (33) Other working capital movements (77) 164 (241)Cash flows from operating activities 243 660 (417)
1 Operating earnings before significant items is a non-GAAP measure used by management to assess the performance of the business and has been derived from Fletcher Building Limited’s group financial statements for the year ended 30 June 2017. Details of significant items can be found in note 4 of the group’s financial statements.
Detailed disclosure of the above line items is included in Fletcher Building Limited’s group financial statements which have been released with this Management Commentary.
Cash flows from operating activities of $243 million were 63% lower than the prior year. Cash flows from operations before working capital movements were $419 million, down from $562 million due to lower earnings resulting from the construction losses. The working capital movement was also adverse, with continued investment in residential land ($99 million) and increased inventory and debtors balances ($165 million), resulting from higher activity levels along with large receivables in our Residential and Developments business at year end. Contracts cash flow was positive reflecting the losses recognised but not incurred as cash in the Construction business.
Capital expenditure
Year ended30 June
2017NZ$m
Year ended30 June
2016NZ$m
Change NZ$m
Capital expenditure 319 300 19
Capital expenditure was $319 million, compared with $300 million in the prior year. Of this total, $182 million was for stay-in-business capital projects and $137 million related to new growth initiatives. The increased capital expenditure in FY17 was due principally to investment in the Formica UK manufacturing site and the Cement and Aggregates business, especially quarry stripping and the Golden Bay Cement supply chain.
For 2018, capital expenditure is expected to be in the range of $275 million to $325 million.
52 Fletcher Building Annual Report 2017
Financial review 2017

FundingTotal available funding as at 30 June 2017 was $2,666 million. Of this, $536 million was undrawn and there was an additional $219 million of cash on hand. Drawn debt facilities maturing within the next 12 months total $198 million and a further $71 million of capital notes are subject to interest rate and term reset.
The group’s gearing1 at 30 June 2017 was 35.3% compared with 27.3% at 30 June 2016. Gearing has returned to the target range following completion of the Higgins acquisition.
The group’s leverage2 at 30 June 2017 was 2.7 times compared with 1.6 times at 30 June 2016. Whilst just outside the target range of 2.0–2.5 times, the expectation is that this will return to within the range in 2018.
The average maturity of the debt is 4.7 years and the hedged currency split is 34% Australian dollar; 49% New Zealand dollar; 10% US dollar; and 7% spread over various other currencies.
Approximately 44% of all borrowings have fixed interest rates with an average duration of 3.8 years and a rate of 5.9%. Inclusive of floating rate borrowings, the average interest rate on the debt is approximately 4.8%.
Interest coverage3 at 30 June 2017 was 4.7 times compared with 5.9 times at 30 June 2016.
1 Interest bearing net debt (including capital notes) to interest bearing net debt (including capital notes) and equity.
2 Interest bearing net debt (including capital notes) to EBITDA before significant items.
3 EBIT before significant items to total interest paid including capital notes interest.
Dividend The 2017 final dividend is 19 cents per share. In line with the group’s tax crediting policy announced in August 2016, the final dividend will be fully imputed with New Zealand tax credits and unfranked for Australian tax purposes. The imputed amount per share on the dividend is 7.3889 cents.
As a fully imputed dividend, a supplementary dividend is payable to non-New Zealand non-portfolio shareholders and has the effect of removing or reducing the cost of New Zealand non-resident withholding tax (NRWT). For most Australian resident shareholders receiving a supplementary dividend, the after tax return of the fully imputed dividend is equivalent to receiving a 41% franked dividend.
The dividend will be paid on 11 October 2017 to holders registered as at 5.00 pm Friday 22 September 2017 (NZT). The shares will be quoted on an ex dividend basis from 21 September 2017 on the NZX and ASX.
The interim dividend of 20 cents per share was paid on 12 April 2017 and the inputed amount per share on the interim dividend was 7.7778 cents.
Dividend Reinvestment PlanFletcher Building shareholders (excluding those in jurisdictions where the issue of shares is not permitted by law) can participate in a Dividend Reinvestment Plan (“the Plan”), under which they have the opportunity to reinvest their dividends in additional shares. The Plan will be operative for this dividend payment. There will be no discount to the price applied to ordinary shares issued. Documentation for participation is available from the share registry or the website www.fbu.com and must be received by the registry before 5.00 pm Monday 25 September 2017. The price used to determine entitlements under the Plan is the average of the individual daily volume weighted average sale prices of price-setting trades of the company’s shares sold on the NZX on each of the five business days from and including the ex dividend date of 21 September 2017. The new shares will rank equally with existing shares and will be issued on the dividend payment date of 11 October 2017.
Dividend PolicyFletcher Building seeks to maintain dividends through economic cycles, and to progressively grow the dividend over the medium term. The target dividend pay-out ratio, in the range of 50 to 75% of net earnings (before significant items), is intended to provide sufficient flexibility for dividends to be maintained despite variations in economic conditions. Maintenance of a dividend in this range will be subject to there being no material adverse change in circumstances or outlook. In determining a dividend for any year a number of factors is taken into consideration, including current and forecast earnings and operating cash flows, capital requirements and the company's debt equity position.
Beyond dividends, Fletcher Building will consider other means of distribution, should cash flows and future investment requirements allow.
Fletcher Building’s policy on franking and imputation is to fully impute both the interim and final dividend with New Zealand tax credits each year (or to the maximum extent possible) and fully frank the final dividend with Australian tax credits where possible.
Fletcher Building expects to be able to impute both interim and final dividends for at least the next two years, subject to the overall financial performance of the group.
53 Fletcher Building Annual Report 2017

June 2017
June 2016
June 2015
June 2014
June 2013
June 2012
June 2011
June 2010
June 2009
June 2008
NOTES 8 3 2 1
NZ$M NZ$M NZ$M NZ$M NZ$M NZ$M NZ$M NZ$M NZ$M NZ$M
Financial performance – ReportedOperating sales/revenue 9,399 9,004 8,661 8,401 8,517 8,839 7,416 6,799 7,103 7,091
Earnings before interest and taxation (EBIT) 273 719 503 592 569 403 492 521 159 768
Net earnings 94 462 270 339 326 185 283 272 (46) 467
Cash flow from operations 243 660 575 489 559 448 402 522 533 434
Earnings per share – basic (cents per share) 13.5 67.0 39.2 49.3 47.6 27.2 45.0 44.9 (8.7) 93.2
Dividends for the period (cents per share) 39.0 39.0 37.0 36.0 34.0 34.0 33.0 29.0 38.0 48.5
Financial performance – before significant itemsEarnings before interest and taxation (EBIT) 525 682 653 624 569 556 596 521 558 768
Net earnings 321 418 399 362 326 317 359 301 314 467
Earnings per share – basic (cents per share) 46.3 60.6 58.0 52.7 47.6 46.5 57.1 49.7 59.7 93.2
Dividends for the period (cents per share) 39.0 39.0 37.0 36.0 34.0 34.0 33.0 29.0 38.0 48.5
Balance sheetCurrent assets 3,419 3,222 3,272 2,958 2,868 3,112 3,104 2,317 2,255 2,549
Non-current assets 4,254 4,045 4,229 3,983 4,257 4,367 4,388 3,397 3,550 3,686
Total assets 7,673 7,267 7,501 6,941 7,125 7,479 7,492 5,714 5,805 6,235
Current liabilities 1,996 1,997 1,947 1,596 1,557 1,936 1,700 1,384 1,313 1,436
Non-current liabilities 2,097 1,557 1,844 1,891 2,014 2,091 2,092 1,307 1,508 2,043
Total liabilities 4,093 3,554 3,791 3,487 3,571 4,027 3,792 2,691 2,821 3,479
Capital 2,678 2,650 2,633 2,624 2,606 2,582 2,553 1,912 1,895 1,364
Reserves 878 1,041 1,050 795 913 838 1,113 1,077 1,057 1,351
Minority equity 24 22 27 35 35 32 34 34 32 41
Total equity 3,580 3,713 3,710 3,454 3,554 3,452 3,700 3,023 2,984 2,756
Total liabilities and equity 7,673 7,267 7,501 6,941 7,125 7,479 7,492 5,714 5,805 6,235
Other financial dataReturn on average funds (%)4 4.9 13.4 9.6 11.7 10.8 7.4 10.6 12.7 3.4 19.0
Return on average equity (%)5 2.5 12.4 7.7 9.9 9.4 5.2 8.2 9.1 (1.6) 19.0
Return on average funds - before significant items (%)4 9.4 12.7 12.5 12.3 10.8 10.2 12.8 12.7 11.9 19
Return on average equity - before significant items (%)5 8.7 11.6 11.3 10.5 9.4 9.0 10.4 10 10.8 19
Gearing (%)6 35.3 27.3 31.8 32.3 33.5 37.4 34.3 26.8 31.1 40.1
Net tangible assets per share ($) 2.70 2.87 2.80 2.60 2.61 2.65 2.71 2.90 2.80 2.90
Market capitalisation (NZ$m) 5,561 5,942 5,593 6,060 5,784 4,009 5,850 4,763 3,967 3,197
Total shareholders' return (%)7 0 11 (3) 9 51 (27) 14 24 14 (43)
1 The Formica Corporation group was acquired on 2 July 2007. 2 The Crane group was acquired with an effective acquisition date of 28 March 2011. 3 The June 2012 balance sheet has been restated following revisions to IAS 19 Employee Benefits adopted by the group.4 EBIT to average funds (net debt and equity less deferred tax asset).5 Net earnings to average shareholders' funds.6 Net debt (borrowings less cash and deposits) to net debt and equity.7 Share price movement in year and gross dividend received, to opening share price. 8 Higgins Group Holdings Limited was acquired on 29 July 2016.
54 Fletcher Building Annual Report 2017
Trend statement

The accompanying notes form part of and are to be read in conjunction with these financial statements.
Income statementFor the year ended 30 June 2017
Fletcher Building Group NOTES
Year endedJune 2017
NZ$M
Year endedJune 2016
NZ$M
Sales 9,399 9,004
Cost of goods sold (7,319) (6,767)
Gross margin 2,080 2,237
Selling and marketing expenses (903) (933)
Administration expenses (680) (636)
Share of profits of associates and joint ventures 25 20 12
Other gains and losses 3 8 2
Significant items 4 (252) 37
Earnings before interest and taxation (EBIT) 273 719
Funding costs 14 (111) (115)
Earnings before taxation 162 604
Taxation expense 28 (57) (131)
Earnings after taxation 105 473
Earnings attributable to non-controlling interests (11) (11)
Net earnings attributable to the shareholders 94 462
Net earnings per share (cents) 6Basic 13.5 67.0
Diluted 13.5 65.4
Weighted average number of shares outstanding (millions of shares) 6Basic 694 690
Diluted 694 736
Dividends declared per share (cents) 7 39.0 39.0
On behalf of the Board, 16 August 2017
Sir Ralph Norris John JudgeChairman of Directors Director
55 Fletcher Building Annual Report 2017
Financial statements 2017

The accompanying notes form part of and are to be read in conjunction with these financial statements.
Statement of comprehensive incomeFor the year ended 30 June 2017
Fletcher Building Group
Year endedJune 2017
NZ$M
Year endedJune 2016
NZ$M
Net earnings – parent interest 94 462
Net earnings – non-controlling interests 11 11
Net earnings 105 473
Other comprehensive incomeItems that do not subsequently get reclassified to profit or loss:
Movement in pension reserve 44 (36)
44 (36)
Items that may be reclassified subsequently to profit or loss:Movement in cash flow hedge reserve (7) 15
Movement in currency translation reserve (17) (186)
(24) (171)
Other comprehensive income 20 (207)
Total comprehensive income for the year 125 266
56 Fletcher Building Annual Report 2017
Financial statements 2017

Statement of movements in equityFor the year ended 30 June 2017
Fletcher Building Group NO
TES
Shar
e ca
pita
lN
Z$M
Reta
ined
ear
ning
sN
Z$M
Shar
e-ba
sed
paym
ents
rese
rve
NZ$
M
Cas
h flo
w h
edge
re
serv
eN
Z$M
Cur
renc
y tr
ansl
atio
n re
serv
eN
Z$M
Pens
ion
rese
rve
NZ$
M
Tota
lN
Z$M
Non
-con
trol
ling
inte
rest
sN
Z$M
Tota
l equ
ityN
Z$M
Total equity at 30 June 2015 2,633 1,199 15 (10) (83) (71) 3,683 27 3,710
Total comprehensive income for the year 462 15 (186) (36) 255 11 266
Movement in non-controlling interests (16) (16)
Issue of shares 23 27 27 27
Dividends paid to shareholders of the parent 7 (262) (262) (262)
Movement in share-based payment reserve (2) (2) (2)
Movement in treasury stock 23 (10) (10) (10)
Total equity at 30 June 2016 2,650 1,399 13 5 (269) (107) 3,691 22 3,713
Total comprehensive income for the year 94 (7) (17) 44 114 11 125 Movement in non-controlling interests (9) (9)Issue of shares 23 31 31 31 Dividends paid to shareholders of the parent 7 (277) (277) (277)Movement in share-based payment reserve Movement in treasury stock 23 (3) (3) (3)Total equity at 30 June 2017 2,678 1,216 13 (2) (286) (63) 3,556 24 3,580
The accompanying notes form part of and are to be read in conjunction with these financial statements.
57 Fletcher Building Annual Report 2017

The accompanying notes form part of and are to be read in conjunction with these financial statements.
Balance sheetAs at 30 June 2017
Fletcher Building Group NOTESJune 2017
NZ$MJune 2016
NZ$M
AssetsCurrent assets:Cash and deposits 8 219 356
Current tax assets 28 15 2
Derivatives 16 8 23
Debtors 9 1,525 1,362
Inventories 10 1,652 1,479
Total current assets 3,419 3,222
Non-current assets:Property, plant and equipment 20 2,214 1,972
Goodwill 21 1,069 1,083
Intangible assets 22 609 632
Investments in associates and joint ventures 25 146 135
Retirement plan assets 29 71 41
Other investments 2 2
Derivatives 16 91 156
Deferred tax assets 28 52 24
Total non-current assets 4,254 4,045
Total assets 7,673 7,267
LiabilitiesCurrent liabilities:Creditors and accruals 11 1,406 1,342
Provisions 12 70 67
Current tax liabilities 28 30 26
Derivatives 16 7 21
Construction contracts 13 214 128
Borrowings 15 269 413
Total current liabilities 1,996 1,997
Non-current liabilities:Creditors and accruals 11 36 37
Provisions 12 25 24
Retirement plan liabilities 29 38 73
Deferred tax liabilities 28 47 58
Derivatives 16 48 26
Borrowings 15 1,903 1,339
Total non-current liabilities 2,097 1,557
Total liabilities 4,093 3,554
EquityCapital 23 2,678 2,650
Reserves 878 1,041
Shareholders' funds 3,556 3,691
Non-controlling interests 24 24 22
Total equity 3,580 3,713
Total liabilities and equity 7,673 7,267
58 Fletcher Building Annual Report 2017
Financial statements 2017

The accompanying notes form part of and are to be read in conjunction with these financial statements.
Statement of cash flowsFor the year ended 30 June 2017
Fletcher Building Group
Year endedJune 2017
NZ$M
Year endedJune 2016
NZ$M
Cash flow from operating activities
Receipts from customers 9,303 9,056
Dividends received 11 10
Total received 9,314 9,066
Payments to suppliers, employees and others 8,847 8,191
Interest paid 125 118
Income tax paid 99 97
Total applied 9,071 8,406
Net cash from operating activities 243 660
Cash flow from investing activities
Sale of property, plant and equipment 26 53
Sale of investments 3 1
Sale of subsidiaries/businesses 205
Total received 29 259
Purchase of property, plant and equipment 319 300
Purchase of subsidiaries/businesses 321 7
(Cash)/debt in subsidiaries acquired (4)Total applied 636 307
Net cash from investing activities (607) (48)
Cash flow from financing activities
Net debt draw down 476 Issue of capital notes 35 10
Total received 511 10
Net debt repayment 196
Repurchase of capital notes 19 15
Treasury stock purchased 3 16
Distribution to non-controlling interests 14 18
Dividends 246 235
Total applied 282 480
Net cash from financing activities 229 (470)
Net movement in cash held (135) 142
Add opening cash deposits 356 228
Effect of exchange rate changes on net cash (2) (14)
Closing cash and liquid deposits 219 356
59 Fletcher Building Annual Report 2017
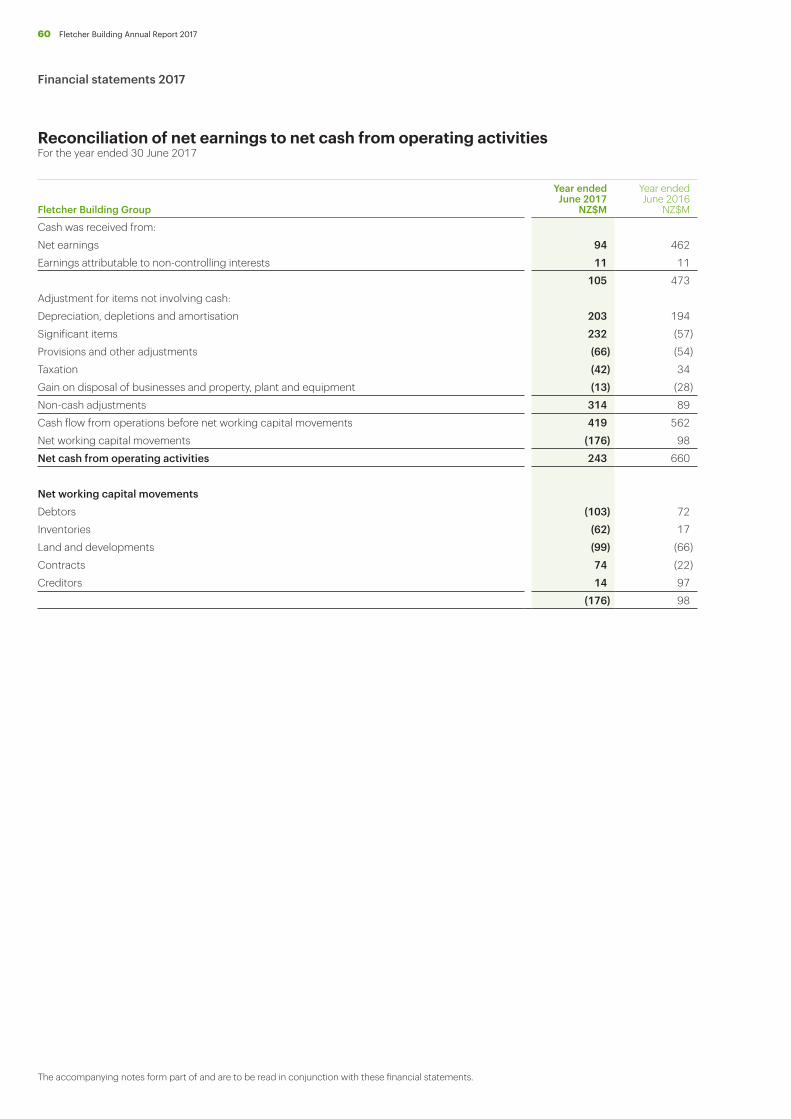
The accompanying notes form part of and are to be read in conjunction with these financial statements.
Reconciliation of net earnings to net cash from operating activitiesFor the year ended 30 June 2017
Fletcher Building Group
Year endedJune 2017
NZ$M
Year endedJune 2016
NZ$M
Cash was received from:
Net earnings 94 462
Earnings attributable to non-controlling interests 11 11
105 473
Adjustment for items not involving cash:
Depreciation, depletions and amortisation 203 194
Significant items 232 (57)
Provisions and other adjustments (66) (54)
Taxation (42) 34
Gain on disposal of businesses and property, plant and equipment (13) (28)
Non-cash adjustments 314 89
Cash flow from operations before net working capital movements 419 562
Net working capital movements (176) 98
Net cash from operating activities 243 660
Net working capital movementsDebtors (103) 72
Inventories (62) 17
Land and developments (99) (66)
Contracts 74 (22)
Creditors 14 97
(176) 98
60 Fletcher Building Annual Report 2017
Financial statements 2017

1. Statement of accounting policies
General information The financial statements presented are those of Fletcher Building Limited (the company) and its subsidiaries (the group). The group is primarily involved in the manufacturing and distribution of building materials and residential and commercial construction.
Fletcher Building Limited is a company domiciled in New Zealand. The registered office of the company is 810 Great South Road, Penrose, Auckland.
The company is registered under the Companies Act 1993 and is a Financial Markets Conduct Act 2013 reporting entity in terms of the Financial Reporting Act 2013. The group is a profit-oriented entity.
Basis of presentationThese financial statements have been prepared in accordance with Generally Accepted Accounting Practice in New Zealand, which is the New Zealand equivalent to International Financial Reporting Standards (NZ IFRS). They also comply with International Financial Reporting Standards.
These financial statements are presented in New Zealand dollars ($), which is the group’s functional and presentation currency and rounded to the nearest million unless otherwise stated.
The financial statements comprise the income statement, statement of comprehensive income, statement of movements in equity, balance sheet, statement of cash flows, and statement of accounting policies, as well as the notes to these financial statements.
Accounting conventionThe financial statements are based on the general principles of historical cost accounting, except that certain financial assets and liabilities, as described below are stated at their fair value.
The accounting policies have been applied consistently by all group entities throughout all periods presented, except as disclosed below in, 'Changes in accounting policies'.
Accounting policies are disclosed within each of the applicable notes to the financial statements and are marked with this icon.
Critical accounting estimates and judgementsThe preparation of financial statements in conformity with NZ IFRS requires the directors to make estimates and assumptions that affect the reported amounts of assets and liabilities, disclosure of contingent assets and liabilities at the date of the financial statements and the reported amounts of sales and expenses during the reporting period. Estimates and judgements are continually evaluated and are based on historical experience and other factors, including expectations of future events that are believed to be reasonable under the circumstances. Actual results could differ from those estimates. The estimates and assumptions are reviewed on an ongoing basis.
The estimates and judgements that are critical to the determination of the amounts reported in the financial statements have been disclosed with the relevant notes in the financial statements and are marked with this icon or where applied to the financial statements as a whole, are detailed below.
Basis of consolidationThe consolidated financial statements comprise the company and its subsidiaries and the group’s interest in associates, partnerships and joint arrangements. Intercompany transactions are eliminated in preparing the consolidated financial statements.
SubsidiariesSubsidiaries are all entities over which the group has control. The group controls an entity when the group is exposed to, or has rights to, variable returns from its involvement with the entity and has the ability to affect those returns through its power to direct the activities of the entity. Subsidiaries are included in the consolidated financial statements using the acquisition method of consolidation, from the date control commences until the date control ceases.
Translation of the financial statements of foreign operationsThe assets and liabilities of the group’s overseas operations are translated into New Zealand currency at the rates of exchange ruling at balance date. The revenue and expenditure of these entities are translated using an average exchange rate reflecting an approximation of the appropriate transaction rates. Exchange variations arising on the translation of these entities and other currency instruments designated as hedges of such investments are recognised directly in the currency translation reserve. The cumulative exchange variations would be reclassified subsequently to earnings if the overseas operation to which the reserve relates were to be sold or otherwise disposed of.
Foreign currency transactions Transactions in foreign currencies are translated at exchange rates at the date of the transactions.
Monetary assets and liabilities in foreign currencies at balance date are translated at the rates of exchange ruling at balance date.
Foreign exchange gains and losses resulting from the settlement of such transactions are recognised in earnings, except where deferred in other comprehensive income as qualifying cash flow hedges and qualifying net investment hedges.
Non-monetary assets and liabilities in foreign currencies are translated at the exchange rates in effect when the amounts of these assets and liabilities were determined.
Revenue recognition policyRevenue is recognised in accordance with the terms of sale when the benefits of ownership and risk of loss passes to the customer.
Sale of goodsRevenue is recognised when the significant risks and rewards of ownership have been transferred to the customer, recovery of the consideration is probable, the associated costs and possible return of goods can be estimated reliably, there is no continuing management involvement with the goods and the amount of revenue can be measured reliably. Revenue is measured net of returns, trade discounts and volume rebates. The timing of the transfer of risks and rewards varies depending on the individual terms of the sales agreement. For most sales, the transfer usually occurs when the product is delivered to the customer; however, for some international shipments the transfer occurs on loading the goods onto the relevant carrier at the port. Generally, for such products the customer has no right of return.
61 Fletcher Building Annual Report 2017
Notes to the financial statements 2017
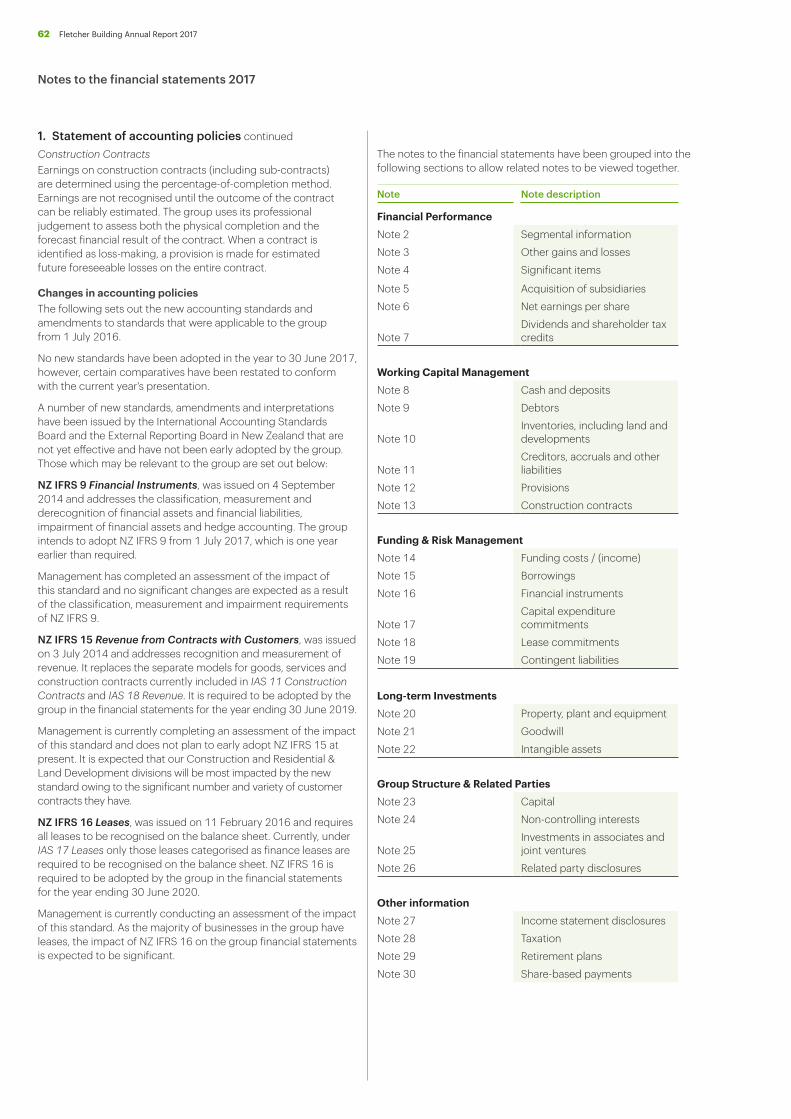
Construction ContractsEarnings on construction contracts (including sub-contracts) are determined using the percentage-of-completion method. Earnings are not recognised until the outcome of the contract can be reliably estimated. The group uses its professional judgement to assess both the physical completion and the forecast financial result of the contract. When a contract is identified as loss-making, a provision is made for estimated future foreseeable losses on the entire contract.
Changes in accounting policiesThe following sets out the new accounting standards and amendments to standards that were applicable to the group from 1 July 2016.
No new standards have been adopted in the year to 30 June 2017, however, certain comparatives have been restated to conform with the current year's presentation.
A number of new standards, amendments and interpretations have been issued by the International Accounting Standards Board and the External Reporting Board in New Zealand that are not yet effective and have not been early adopted by the group. Those which may be relevant to the group are set out below:
NZ IFRS 9 Financial Instruments, was issued on 4 September 2014 and addresses the classification, measurement and derecognition of financial assets and financial liabilities, impairment of financial assets and hedge accounting. The group intends to adopt NZ IFRS 9 from 1 July 2017, which is one year earlier than required.
Management has completed an assessment of the impact of this standard and no significant changes are expected as a result of the classification, measurement and impairment requirements of NZ IFRS 9.
NZ IFRS 15 Revenue from Contracts with Customers, was issued on 3 July 2014 and addresses recognition and measurement of revenue. It replaces the separate models for goods, services and construction contracts currently included in IAS 11 Construction Contracts and IAS 18 Revenue. It is required to be adopted by the group in the financial statements for the year ending 30 June 2019.
Management is currently completing an assessment of the impact of this standard and does not plan to early adopt NZ IFRS 15 at present. It is expected that our Construction and Residential & Land Development divisions will be most impacted by the new standard owing to the significant number and variety of customer contracts they have.
NZ IFRS 16 Leases, was issued on 11 February 2016 and requires all leases to be recognised on the balance sheet. Currently, under IAS 17 Leases only those leases categorised as finance leases are required to be recognised on the balance sheet. NZ IFRS 16 is required to be adopted by the group in the financial statements for the year ending 30 June 2020.
Management is currently conducting an assessment of the impact of this standard. As the majority of businesses in the group have leases, the impact of NZ IFRS 16 on the group financial statements is expected to be significant.
The notes to the financial statements have been grouped into the following sections to allow related notes to be viewed together.
Note Note description
Financial PerformanceNote 2 Segmental information Note 3 Other gains and losses
Note 4 Significant items
Note 5 Acquisition of subsidiaries
Note 6 Net earnings per share
Note 7Dividends and shareholder tax credits
Working Capital ManagementNote 8 Cash and deposits
Note 9 Debtors
Note 10Inventories, including land and developments
Note 11Creditors, accruals and other liabilities
Note 12 Provisions
Note 13 Construction contracts
Funding & Risk ManagementNote 14 Funding costs / (income)
Note 15 Borrowings
Note 16 Financial instruments
Note 17Capital expenditure commitments
Note 18 Lease commitments
Note 19 Contingent liabilities
Long-term InvestmentsNote 20 Property, plant and equipment
Note 21 Goodwill
Note 22 Intangible assets
Group Structure & Related PartiesNote 23 Capital
Note 24 Non-controlling interests
Note 25Investments in associates and joint ventures
Note 26 Related party disclosures
Other informationNote 27 Income statement disclosures
Note 28 Taxation
Note 29 Retirement plans
Note 30 Share-based payments
1. Statement of accounting policies continued
62 Fletcher Building Annual Report 2017
Notes to the financial statements 2017

Financial PerformanceThis section explains the results and performance of the group, including the segmental analysis, details of significant items, earnings per share and dividends.
2. Segmental informationSegmental information is presented in respect of the group’s industry and geographical segments. The use of industry segments as the primary format is based on the group’s management and internal reporting structure, which recognises groups of assets and operations with similar risks and returns. Inter-segment pricing is determined on an arm’s length basis.
Industry segments
Year ended
June 2017NZ$M
Gross sales
June 2016NZ$M
Gross sales
June 2017NZ$M
External sales
June 2016NZ$M
External sales
Building Products 2,270 2,449 1,783 1,969
International 2,017 2,128 1,999 2,106
Distribution 3,287 3,184 3,112 3,026
Residential & Land Development 420 343 420 343
Construction 2,246 1,648 2,085 1,560
Other 9 9
Group 10,249 9,761 9,399 9,004
less intercompany sales (850) (757)
Group external sales 9,399 9,004 9,399 9,004
EBIT before significant
items
EBIT before significant
items
Significant items in EBIT
(Note 4)
Significant items in EBIT
(Note 4)
Building Products 267 274 (98) 79
International 169 133 (30)
Distribution 193 176 (153) (1)
Residential & Land Development 130 84
Construction (204) 78
Other (30) (63) (1) (11)
Group 525 682 (252) 37
Significant items (note 4) (252) 37
Earnings before interest and taxation (EBIT) per income statement 273 719
Depreciation, depletion and
amortisation expense
Depreciation, depletion and
amortisation expense
Capital expenditure
Capital expenditure
Building Products 77 80 129 100
International 65 67 86 86
Distribution 27 29 56 52
Residential & Land Development
Construction 20 8 28 25
Other 14 10 20 37
Group 203 194 319 300
Funds* Funds*
Building Products 1,666 1,581
International 1,938 1,902
Distribution 935 1,001
Residential & Land Development 541 355
Construction 174 (18)
Other (including debt and taxation) (1,674) (1,108)
Group 3,580 3,713 * Funds represent the external assets and liabilities of the group and are used for internal reporting purposes.
63 Fletcher Building Annual Report 2017

Geographic segments
Year ended
June 2017NZ$M
External sales
June 2016NZ$M
External sales
June 2017NZ$M
Funds*
June 2016NZ$M
Funds*
New Zealand 5,381 4,797 2,428 2,001
Australia 2,766 2,959 1,787 1,962
North America 459 479 306 292
Asia 296 299 466 484
Europe 300 323 354 318
Other jurisdictions 197 147 61 (41)
Debt and taxation (1,822) (1,303)
Group 9,399 9,004 3,580 3,713
EBIT before significant
items
EBIT before significant
items
Significant items in EBIT
(Note 4)
Significant items in EBIT
(Note 4)
New Zealand 282 452 (1) (9)
Australia 120 154 (251) 73
North America 48 53
Asia 38 29
Europe (26) (27)
Other 37 20
Group 525 682 (252) 37
Significant items (note 4) (252) 37
Earnings before interest and taxation (EBIT) per income statement 273 719
Non-current assets+
Non-current assets+
New Zealand 1,577 1,183
Australia 1,426 1,630
North America 298 312
Asia 425 435
Europe 271 252
Other 43 12
Group 4,040 3,824
* Funds represent the external assets and liabilities of the group and are used for internal reporting purposes.
+ Excludes deferred tax assets, retirement plan surplus and financial instruments.
Description of industry segmentsBuilding Products The Building Products division is a manufacturer, distributor and marketer of building products used both
commercially and in residential markets primarily in New Zealand and Australia.
International The International division includes laminates and panels businesses that manufacture and distribute decorative surface laminates in Australia, New Zealand, North America, Europe and Asia, and roof tiling businesses that operate in New Zealand, Asia, Europe and USA.
Distribution The Distribution division consists of building, plumbing, pipeline and steel distribution businesses in Australia and New Zealand.
Residential & Land Development
The Residential & Land Development division operates in New Zealand and is both a residential home builder and develops land holdings for both residential and commercial use.
Construction The Construction division is a builder and maintainer of commercial buildings and infrastructure across New Zealand and the South Pacific.
2. Segmental information continued
64 Fletcher Building Annual Report 2017
Notes to the financial statements 2017

3. Other gains and losses
Other gains and losses includes gains from sale of assets, redundancy and restructuring costs and other gains and losses other than those disclosed in note 4 Significant Items.
Fletcher Building Group
Year endedJune 2017
NZ$M
Year endedJune 2016
NZ$M
Other gains and (losses) include the following:
Gain on sale of assets 13 28
Redundancies and restructuring costs (8) (20)
Other 3 (6)
8 2
4. Significant items
Transactions are classified as significant items when they meet certain criteria approved by the group’s Audit and Risk Committee. Significant items are determined in accordance with the principles of consistency, relevance and clarity. Transactions considered for classification as significant items include acquisition and disposal costs; impairment or reversal of impairment of assets; business integration; and transactions or events outside of the group’s ongoing operations that have a significant impact on reported profit.
Fletcher Building Group – June 2017
Business acquisition
expenses (1) NZ$M
Site closure costs (2)
NZ$MImpairments (3)
NZ$MOther (4)
NZ$MTotal
NZ$M
Building Products (17) (69) (12) (98)Distribution (153) (153)Corporate (1) (1)Total significant items before taxation (1) (17) (222) (12) (252)Tax benefit / (charge) on above items 5 16 4 25 Total significant items after taxation (1) (12) (206) (8) (227)
2017(1) On 29 July 2016 the group acquired the New Zealand road construction and maintenance business Higgins Group Holdings Limited
('Higgins') and other related assets, together with Higgins’ Fiji contracting business. Costs of $1 million associated with the transaction were incurred in the year. Refer note 5 for further details.
(2) The group has recognised a charge of $17 million for costs associated with site closures (this includes $4 million of impairments of plant and machinery):
• $10 million relating to the closure of Fletcher Insulation's Homebush site in Australia announced in December 2016;
• $7 million relating to two site closures in the Rocla Products business.
(3) During the year the group has recognised a $222 million impairment charge, relating to businesses where the carrying amount exceeded the recoverable amount:
• $153 million relating to Tradelink where goodwill and other intangibles have been impaired;
• $69 million relating to Iplex Australia where goodwill and brands have been impaired. Offsetting the impairment of brands is an $11 million reversal of the associated deferred tax liability through tax expense.
(4) The group has recognised a charge of $12 million relating to the costs associated with prolonged industrial action during the year at a Fletcher Insulation site in Australia.
65 Fletcher Building Annual Report 2017

Fletcher Building Group – June 2016
Business acquisition /
disposal income and expenses (1)
NZ$M
Site closure costs (2)
NZ$MImpairments (3)
NZ$MOther (4)
NZ$MTotal
NZ$M
Building Products 90 (11) 79
International (4) (26) (30)
Distribution (1) (1)
Corporate (5) (6) (11)
Total significant items before taxation 85 (16) (26) (6) 37
Tax benefit / (charge) on above items (1) 5 1 2 7
Total significant items after taxation 84 (11) (25) (4) 44
2016(1) On 18 August 2015, the group entered into an agreement to sell the operations of Rocla Quarry Products to Hanson Construction
Materials Pty Limited. The transaction, which had been subject to ACCC clearance, completed on 29 January 2016.
The aggregate consideration received for the entire Rocla Quarry Products business was $212 million, and $205 million after transaction costs. The gain on sale after tax amounted to $80 million.
On 2 February 2016, the group entered into an agreement to acquire the New Zealand road construction and maintenance business Higgins Group Holdings Limited ('Higgins') and other related assets, together with Higgins’ Fiji contracting business. At 30 June 2016, the transaction remained conditional on regulatory approval and the transaction completed on 29 July 2016.
During the year ended 30 June 2016, expenses associated with the transaction were incurred amounting to $5 million.
On 17 February 2016, the group entered into an agreement to create a 50-50 joint venture between its Fletcher Aluminium windows and doors business and NALCO, the new entity being Altus NZ Limited (previously known as Fanalco Limited). The transaction completed on 30 June 2016. As a result a $5 million gain before tax arose on divestment of the Fletcher Aluminium business to the joint venture.
(2) The group recognised a charge of $16 million for costs associated with closing a number of sites across the group.
(3) A strategic review of the Formica India manufacturing business was completed during the year ended 30 June 2016. The review identified that medium-term earnings prospects had deteriorated and the group has recorded an impairment expense of $26 million, comprising write-offs of goodwill, property, plant and equipment and working capital to estimated recoverable values.
(4) The group incurred total expenses of $6 million during the year ended 30 June 2016 investigating and resolving certain payroll system issues in the group related to the calculation of bereavement leave, alternative holidays, public holidays and sick leave.
4. Significant items continued
66 Fletcher Building Annual Report 2017
Notes to the financial statements 2017

5. Acquisition of subsidiariesOn 29 July 2016, the group acquired the New Zealand road construction and maintenance business Higgins Group Holdings Limited ('Higgins') and other related assets, together with Higgins' Fiji contracting business.
The acquisition will deliver a stronger proposition and level of capability in the roading and infrastructure market, and provide further benefit for a number of group businesses through operational synergies.
In the 11 months to 30 June 2017, the acquired Higgins businesses have contributed $475 million of revenue and $43 million of EBIT to the group. This is materially the same as the proforma 12-month contribution.
The fair value exercise for Higgins has now been completed. The following are the values recognised in the financial statements:
Provisional value at acquisition
dateNZ$M
Fair value adjustments
NZ$M
Fair value recognised in
the financial statements
NZ$M
AssetsProperty, plant and equipment 123 (12) 111
Intangible assets 21 21
Cash 4 4
Trade and other receivables 59 59
Inventories 12 (1) 11
198 8 206
LiabilitiesTrade and other payables 43 43
Deferred tax liabilities 7 7
43 7 50
Total identifiable net assets at fair value 155 1 156
Non-controlling interest of a specific investment held by Higgins (1) (1)
Goodwill arising on acquisition 157 (1) 156
Purchase consideration transferred 311 311
Analysis of cash flow on acquisition:
Net cash acquired with the subsidiary (included in cash flows from investing activities) 4 4
Cash paid (311) (311)
Net cash flow on acquisition (307) (307)
Acquisition related costsThe group incurred acquisition related costs of $1 million in the current period. These costs have been included within significant items (note 4) (June 2016: $5 million).
Other acquisitionsDuring the year the group also completed three smaller separate acquisitions. The aggregate total identifiable net assets at fair value was $7 million with a total aggregate cash consideration paid of $10 million, resulting in $3 million of goodwill.
67 Fletcher Building Annual Report 2017

6. Net earnings per share
Earnings per share is the portion of a company's profit allocated to each outstanding ordinary share and is calculated by dividing the earnings attributable to shareholders by the weighted average of ordinary shares on issue during the year excluding treasury stock. Earnings per share serves as an indicator of the group's profitability.
The diluted net earnings per share calculation uses the weighted average number of shares as determined for basic net earnings per share, adjusted for dilutive securities. Capital notes and options are convertible into the company's shares and may therefore result in dilutive securities for purposes of determining the diluted net earnings per share. Fletcher Building may, at its option, purchase or redeem the capital notes for cash at the principal amount plus any accrued but unpaid interest.
Fletcher Building GroupYear ended
June 2017Year endedJune 2016
Net earnings per share (cents)
Basic 13.5 67.0
Diluted 13.5 65.4
NZ$M NZ$M
NumeratorNet earnings 94 462
Numerator for basic earnings per share 94 462
Dilutive capital notes distribution 19
Numerator for diluted net earnings per share 94 481
Denominator (millions of shares)Denominator for basic net earnings per share 694 690
Conversion of dilutive capital notes 46
Denominator for diluted net earnings per share 694 736
The effect of significant items (note 4) on earnings per share is as follows:
Net earnings per income statement 94 462
Significant items (note 4) 227 (44)
Net earnings before significant items 321 418
Basic earnings per share before significant items (cents) 46.3 60.6
68 Fletcher Building Annual Report 2017
Notes to the financial statements 2017

7. Dividends and shareholder tax credits
Dividends
Fletcher Building Group
Year endedJune 2017
NZ$M
Year endedJune 2016
NZ$M
Dividends of 20 cents per share paid to shareholders in October 2016 (October 2015: 19 cents per share) 139 131
Dividends of 20 cents per share paid to shareholders in April 2017 (April 2016: 19 cents per share) 139 131
278 262
Subsequent to the balance sheet date, on 16 August 2017, the directors declared a dividend in respect of the year ended 30 June 2017 of 19.0 cents per share, payable on 11 October 2017. These financial statements do not reflect this dividend declared. This results in total dividends declared for the financial year of 39.0 cents per share.
Shareholder tax credits
Imputation and franking credits allow the company to transfer the benefit from the tax it has paid in New Zealand and Australia respectively to its shareholders when it pays dividends.
Fletcher Building Group
Year endedJune 2017
NZ$M
Year endedJune 2016
NZ$M
Imputation credit accountImputation credits at the beginning of the year 29 1
Taxation paid 53 65
Imputation credits attached to dividends paid (78) (37)
4 29
A$M A$M
Franking credit account Franking credits at the beginning of the year 26 26
Taxation paid (2) (5)
Franking credits received 3 5
27 26
69 Fletcher Building Annual Report 2017

Working Capital ManagementThis section provides details of the key elements of working capital which includes cash, receivables, inventories and short term liabilities.
8. Cash and deposits
Cash and deposits comprise cash and demand deposits with banks or other financial institutions and highly liquid investments that are readily convertible to cash.
Fletcher Building GroupJune 2017
NZ$MJune 2016
NZ$M
Cash and bank balances 206 147
Short-term deposits 13 209
Cash and deposits 219 356
Cash and deposits include the group's share of amounts held by joint operations of $28 million (2016: $16 million). At 30 June 2017, approximately $19 million (2016: $35 million) of total cash and deposits were held in subsidiaries that operate in countries where exchange controls and other legal restrictions apply and are not immediately available for general use by the group.
9. Debtors
Debtors are valued at estimated net realisable value. The valuation is net of a specific provision maintained for doubtful debts. All known losses are written off to earnings in the period in which it becomes apparent that the debts are not collectable. Trade debtors normally have 30 to 90 day terms.
Fletcher Building GroupJune 2017
NZ$MJune 2016
NZ$M
Trade debtors 1,100 969
Contract debtors 221 181
Contract retentions 25 28
Less provision for doubtful debts (19) (21)
Trade and contract debtors 1,327 1,157
Other receivables 198 205
1,525 1,362
Current 1,107 970
0 – 30 days over standard terms 165 134
31 – 60 days over standard terms 26 24
61+ days over standard terms 48 50
Provision (19) (21)
Trade and contract debtors 1,327 1,157
70 Fletcher Building Annual Report 2017
Notes to the financial statements 2017

10. Inventories, including land and developments
Inventories are valued at the lower of cost or net realisable value, determined principally on the first-in, first-out basis. Cost includes direct manufacturing costs and manufacturing overheads at normal operating levels.
Included in inventories are land and developments which are stated at the lower of cost and net realisable value. Cost includes the cost of acquisition and development. Costs incurred after completion of development are expensed as incurred.
Fletcher Building GroupJune 2017
NZ$MJune 2016
NZ$M
Raw materials 478 517
Work in progress 283 171
Finished goods 849 746
Consumable stores and spare parts 42 45
1,652 1,479
Inventories held at cost 1,524 1,332
Inventories held at net realisable value 128 147
1,652 1,479
Land and developments to the value of $540 million are included above (June 2016: $441 million) of which $198 million is expected to be held for greater than 12 months (June 2016: $256 million). The group also has conditional commitments for the purchase of land to be used for residential construction totalling $254 million (June 2016: $281 million), of which $100 million is expected to be delivered in the year to 30 June 2018.
11. Creditors, accruals and other liabilities
Trade creditors and other liabilities are stated at cost or estimated liability where accrued.Employee entitlements include annual leave which is recognised on an accrual basis and the liability for long service leave which is measured as the present value of expected future payments to be made in respect of services provided by employees.
Assumptions in determining long service leave relate to the discount rate, estimates relating to the expected future long service leave entitlements, future salary increases, attrition rates and mortality.
Fletcher Building GroupJune 2017
NZ$MJune 2016
NZ$M
Trade creditors 994 944
Contract retentions 46 40
Accrued interest 32 30
Other liabilities 152 138
Employee entitlements 206 215
Workers' compensation schemes 12 12
1,442 1,379
Current portion 1,406 1,342
Non-current portion 36 37
Carrying amount at the end of the year 1,442 1,379
The non-current portion of creditors and accruals relates to long service employee entitlement obligations and deferred land payments.
71 Fletcher Building Annual Report 2017

12. Provisions
A provision is recognised when the group has a current obligation and it is probable that an economic benefit will be required to settle it.
The following are the significant categories of provisions held by the group:
RestructuringRestructuring provisions are recognised when the group is demonstrably committed, without realistic possibility of withdrawal, to a formal detailed plan to restructure a business or site. Costs relating to ongoing activities are not provided for.
Warranty and environmentalWarranty provisions represent an estimate of potential liability for future rectification work in respect of products sold and services provided. Environmental provisions represent an estimate for future liabilities relating to environmental obligations.
OtherOther provisions relate to various miscellaneous matters, across the group, none of which are individually material.
Management consults with legal counsel on matters related to litigation. In respect of all claims and litigation, the group provides for anticipated costs in line with the accounting policy stated above. Reference should also be made to note 19.
Fletcher Building Group Restructuring
NZ$M
Warranty and environmental
NZ$M Other NZ$M
TotalNZ$M
June 2017Carrying amount at the beginning of the year 13 28 50 91 Currency translation Charged to earnings 10 17 26 42 Settled or utilised (14) (11) (21) (35)Released to earnings (1) (2) (3)
8 34 53 95
June 2016Carrying amount at the beginning of the year 14 34 68 116
Currency translation (1) (2) (3)
Charged to earnings 7 14 25 46
Settled or utilised (7) (17) (41) (65)
Released to earnings (1) (2) (3)
13 28 50 91
Fletcher Building GroupJune 2017
NZ$MJune 2016
NZ$M
Current portion 70 67
Non-current portion 25 24
Carrying amount at the end of the year 95 91
During the year the group utilised $14 million (30 June 2016: $7 million) in respect of restructuring obligations at certain businesses. The remaining balance is expected to be utilised in the next year.
Warranty and environmental provisions are expected to be utilised over the next three years.
72 Fletcher Building Annual Report 2017
Notes to the financial statements 2017

13. Construction contracts
Construction work in progress is stated at cost plus profit recognised to date, less progress billings and any provision for future foreseeable losses. Cost includes all expenditure directly related to specific projects and an allocation of fixed and variable overheads incurred in the group’s contract activities based on normal operating capacity.
Estimates and judgements are made relating to a number of factors when assessing Construction Contracts. These include recovery of pre-contract costs, assessment of future costs following changes in the scope of work, contract programmes, maintenance and defects liabilities, performance bonuses or penalties and changes in costs in determining the amount of revenue and margin to be recognised at each reporting date. Recognition of additional revenues that flow from contract variations and claims, that at reporting date may have not yet been presented to or accepted and approved by customers, also requires significant judgement.
Fletcher Building GroupJune 2017
NZ$MJune 2016
NZ$M
Gross construction work in progress plus margin/loss to date 5,877 3,695
Progress billings (6,091) (3,823)
(214) (128)
Construction contracts with net work in progress 62 48
Construction contracts with billing in advance of cost and margin or provisions for future foreseeable losses (276) (176)
Carrying amount at the end of the year (214) (128)
Included in sales is $2,081 million of contract revenue (June 2016: $1,546 million).
73 Fletcher Building Annual Report 2017

14. Funding costs/(income)
Net funding costs comprise interest expense, interest income, amortisation of prepaid expenses and gains/losses on certain financial instruments that are recognised in earnings.
Fletcher Building Group
Year endedJune 2017
NZ$M
Year endedJune 2016
NZ$M
Interest expense
Loans and derivatives 85 72
Capital notes 24 26
Other (5) 10
Interest income
Cash and deposits (2) (1)
102 107
Bank fees, registry and issue expenses 9 8
Funding costs 111 115
Included in interest expense is the net settlement of the group's interest derivatives. This consisted of $37 million of interest income and $40 million of interest expense (2016: $43 million interest income; $44 million interest expense). For items applying fair value hedges, the gains or losses on the hedging instrument and on the hedged item net to zero.
15. Borrowings
Interest-bearing borrowings are initially recognised at fair value on transaction date, less directly attributable transaction costs, and subsequently measured at amortised cost using the effective interest rate method.
Fletcher Building GroupJune 2017
NZ$MJune 2016
NZ$M
Private placements 139 272
Other loans 59 73
Capital notes 71 68
Current borrowings 269 413
Bank loans 389 119
Private placements 1,123 896
Other loans 62 8
Capital notes 329 316
Non-current borrowings 1,903 1,339
Carrying value of borrowings (as per balance sheet) 2,172 1,752
Less impact of debt hedging activities (included within derivatives) (42) (84)
Borrowings after impact of hedging activities 2,130 1,668
Less fair value adjustment included in borrowings (52)
Borrowings excluding derivative adjustments 2,130 1,616
Total available funding 2,666 2,224
Unutilised banking facilities 536 608
The undrawn facilities have a weighted average maturity of 3.0 years (June 2016: 2.4 years).
Funding and Risk ManagementThis section includes details on the group's funding and outlines the market, credit and liquidity risks that the group is exposed to and how these risks are managed, including the use of derivative financial instruments.
74 Fletcher Building Annual Report 2017
Notes to the financial statements 2017

Fletcher Building GroupJune 2017
NZ$MJune 2016
NZ$M
Net DebtCash and cash equivalents 219 356
Current borrowings (269) (413)
Non-current borrowings (1,903) (1,339)
Net debt (1,953) (1,396)
Bank loans At 30 June 2017 the group had a syndicated revolving credit facility on an unsecured, negative pledge and borrowing covenant basis, with ANZ Bank New Zealand Limited, The Bank of Tokyo-Mitsubishi UFJ Ltd, Bank of New Zealand, Commonwealth Bank of Australia, Citibank N.A., The Hongkong and Shanghai Banking Corporation Limited and Westpac New Zealand Limited. The funds under this facility can be borrowed in United States, Australian and New Zealand dollars. The borrowing covenants relate to net debt to EBITDA and interest cover and at 30 June 2017, and throughout the year, the group was in compliance with the covenants.
Private placements The group has borrowed funds from private investors (primarily US & Japanese based) on an unsecured, negative pledge and borrowing covenant basis. These borrowings comprise A$231 million, US$582 million, C$15 million, EUR41 million, GBP10 million and YEN10,000 million with maturities between 2017 and 2028. The borrowing covenants relate to net debt to EBITDA and interest cover and at 30 June 2017, and throughout the year, the group was in compliance with the covenants.
Other loans At 30 June 2017 the group had $1 million (June 2016: $1 million) of loans that are secured against the subsidiaries' own balance sheet or against specific assets and had unsecured loans at 30 June 2017 of $120 million (June 2016: $80 million) some of which were subject to the negative pledge. Other loans include bank overdrafts, short-term loans, working capital facilities, financial leases and amortising loans.
Capital notes Capital notes are long-term fixed rate unsecured subordinated debt instruments. On each election date the coupon rate and term to the next election date of that series of the capital notes are reset. Holders may then choose either to keep their capital notes on the new terms or to convert the principal amount and any interest into shares, at approximately 98% of the current market price. Instead of issuing shares to holders who choose to convert, Fletcher Building may, at its option, purchase or redeem the capital notes for cash at the principal amount plus any interest.
Under the terms of the capital notes, non-payment of interest is not an act of default although unpaid interest is accrued and is interest bearing at the same rate as the principal of the capital notes. Fletcher Building Limited has covenanted not to pay dividends to its shareholders while interest due and payable on these capital notes has not been paid.
The capital notes do not carry voting rights and do not participate in any change in value of the issued shares of Fletcher Building Limited. If the principal amount of the capital notes held at 30 June 2017 were to be converted to Fletcher Building shares, 50 million (June 2016: 45 million) would be issued at a share price as at 30 June 2017 of $7.99 (June 2016: $8.58).
As at 30 June 2017 the group held $100 million (30 June 2016: $116 million) of its own capital notes.
Fair value adjustment included in borrowings This is the revaluation of certain borrowings that have been designated in fair value hedge relationships for changes in benchmark interest rates.
Credit rating The company has not sought and does not hold a credit rating from an accredited rating agency.
Negative pledge The group borrows certain funds based on a negative pledge arrangement. The negative pledge includes a cross guarantee between a number of wholly-owned subsidiaries and ensures that external senior indebtedness ranks equally in all respects and includes the covenant that security can be given only in very limited circumstances. At 30 June 2017 the group had debt subject to the negative pledge of $1,650 million (June 2016: $1,163 million).
75 Fletcher Building Annual Report 2017
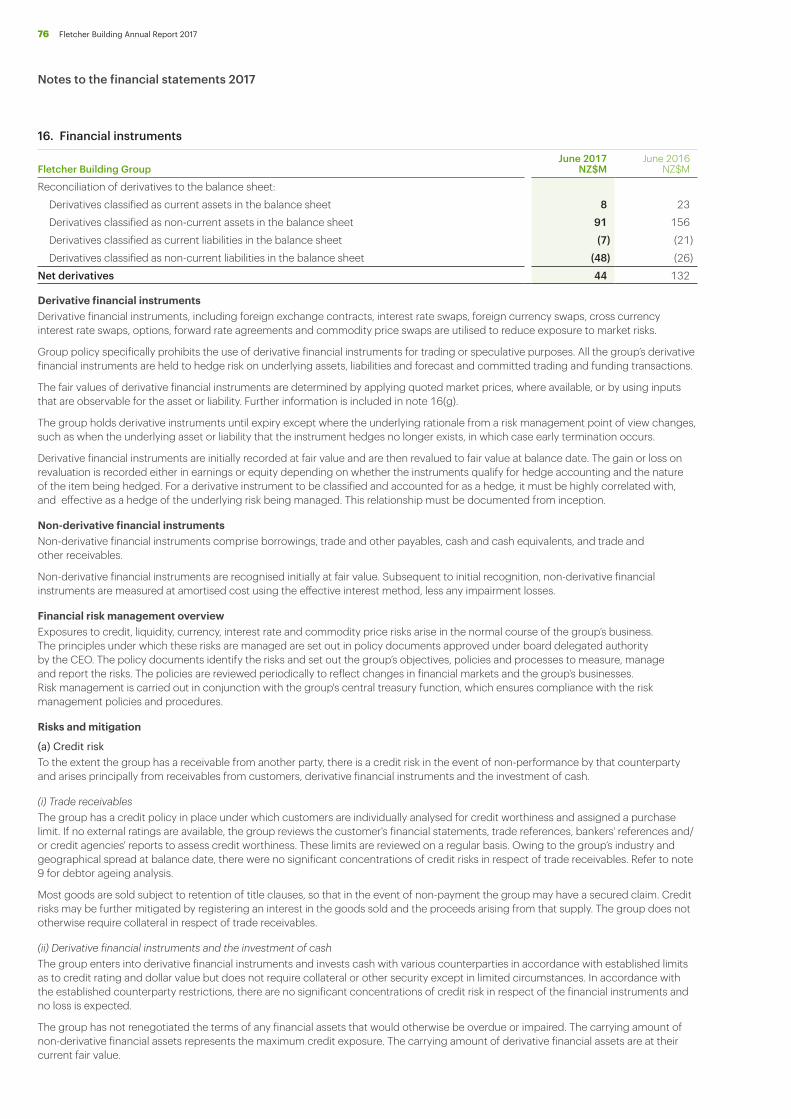
16. Financial instruments
Fletcher Building GroupJune 2017
NZ$MJune 2016
NZ$M
Reconciliation of derivatives to the balance sheet:
Derivatives classified as current assets in the balance sheet 8 23
Derivatives classified as non-current assets in the balance sheet 91 156
Derivatives classified as current liabilities in the balance sheet (7) (21)
Derivatives classified as non-current liabilities in the balance sheet (48) (26)
Net derivatives 44 132
Derivative financial instrumentsDerivative financial instruments, including foreign exchange contracts, interest rate swaps, foreign currency swaps, cross currency interest rate swaps, options, forward rate agreements and commodity price swaps are utilised to reduce exposure to market risks.
Group policy specifically prohibits the use of derivative financial instruments for trading or speculative purposes. All the group’s derivative financial instruments are held to hedge risk on underlying assets, liabilities and forecast and committed trading and funding transactions.
The fair values of derivative financial instruments are determined by applying quoted market prices, where available, or by using inputs that are observable for the asset or liability. Further information is included in note 16(g).
The group holds derivative instruments until expiry except where the underlying rationale from a risk management point of view changes, such as when the underlying asset or liability that the instrument hedges no longer exists, in which case early termination occurs.
Derivative financial instruments are initially recorded at fair value and are then revalued to fair value at balance date. The gain or loss on revaluation is recorded either in earnings or equity depending on whether the instruments qualify for hedge accounting and the nature of the item being hedged. For a derivative instrument to be classified and accounted for as a hedge, it must be highly correlated with, and effective as a hedge of the underlying risk being managed. This relationship must be documented from inception.
Non-derivative financial instrumentsNon-derivative financial instruments comprise borrowings, trade and other payables, cash and cash equivalents, and trade and other receivables.
Non-derivative financial instruments are recognised initially at fair value. Subsequent to initial recognition, non-derivative financial instruments are measured at amortised cost using the effective interest method, less any impairment losses.
Financial risk management overviewExposures to credit, liquidity, currency, interest rate and commodity price risks arise in the normal course of the group’s business. The principles under which these risks are managed are set out in policy documents approved under board delegated authority by the CEO. The policy documents identify the risks and set out the group’s objectives, policies and processes to measure, manage and report the risks. The policies are reviewed periodically to reflect changes in financial markets and the group’s businesses. Risk management is carried out in conjunction with the group's central treasury function, which ensures compliance with the risk management policies and procedures.
Risks and mitigation
(a) Credit riskTo the extent the group has a receivable from another party, there is a credit risk in the event of non-performance by that counterparty and arises principally from receivables from customers, derivative financial instruments and the investment of cash.
(i) Trade receivables The group has a credit policy in place under which customers are individually analysed for credit worthiness and assigned a purchase limit. If no external ratings are available, the group reviews the customer's financial statements, trade references, bankers' references and/or credit agencies' reports to assess credit worthiness. These limits are reviewed on a regular basis. Owing to the group’s industry and geographical spread at balance date, there were no significant concentrations of credit risks in respect of trade receivables. Refer to note 9 for debtor ageing analysis.
Most goods are sold subject to retention of title clauses, so that in the event of non-payment the group may have a secured claim. Credit risks may be further mitigated by registering an interest in the goods sold and the proceeds arising from that supply. The group does not otherwise require collateral in respect of trade receivables.
(ii) Derivative financial instruments and the investment of cashThe group enters into derivative financial instruments and invests cash with various counterparties in accordance with established limits as to credit rating and dollar value but does not require collateral or other security except in limited circumstances. In accordance with the established counterparty restrictions, there are no significant concentrations of credit risk in respect of the financial instruments and no loss is expected.
The group has not renegotiated the terms of any financial assets that would otherwise be overdue or impaired. The carrying amount of non-derivative financial assets represents the maximum credit exposure. The carrying amount of derivative financial assets are at their current fair value.
76 Fletcher Building Annual Report 2017
Notes to the financial statements 2017

(b) Liquidity riskLiquidity risk is the risk that the group will encounter difficulty in meeting its financial commitments as they fall due. The group manages its liquidity risk by maintaining a target level of undrawn committed credit facilities and a spread of the maturity dates of the group's debt facilities. The group reviews its liquidity requirements on an ongoing basis.
The following maturity analysis table sets out the remaining contractual undiscounted cash flows, including estimated interest payments for non-derivative financial liabilities and derivative financial instruments. Creditors and accruals are excluded from this analysis as they are not part of the group's assessment of liquidity risk because these are offset by debtors with similar payment terms.
Fletcher Building Group – June 2017
Contractual cash flows
NZ$M
Up to 1 YearNZ$M
1-2 YearsNZ$M
2-5 YearsNZ$M
Over 5 Years
NZ$M
Bank loans 389 374 15 Capital notes 400 71 98 231 Private placements 1,262 139 363 760 Other loans 121 59 3 19 40 Non-derivative financial liabilities – principal cash flows 2,172 269 475 628 800 Gross settled derivatives – to pay 1,041 60 981 Gross settled derivatives – to receive (1,083) (80) (1,003)Debt derivatives financial instruments – principal cash flows (42) (20) (22)Total principal cash flows 2,130 269 475 608 778
Contractual interest cash flows 542 100 87 178 177
Total contractual cash flows 2,672 369 562 786 955
Fletcher Building Group – June 2016
Contractual cash flows
NZ$M
Up to 1 YearNZ$M
1-2 YearsNZ$M
2-5 YearsNZ$M
Over 5 Years
NZ$M
Bank loans 119 119
Capital notes 384 68 66 250
Private placements 1,168 272 138 202 556
Other loans 81 73 2 6
Non-derivative financial liabilities – principal cash flows 1,752 413 206 577 556
Gross settled derivatives – to pay 1,096 761 335
Gross settled derivatives – to receive (1,180) (763) (417)
Debt derivatives financial instruments – principal cash flows (84) (2) (82)
Total principal cash flows 1,668 411 206 577 474
Contractual interest cash flows 328 77 63 52 136
Total contractual cash flows 1,996 488 269 629 610
77 Fletcher Building Annual Report 2017

16. Financial instruments continued
(c) Foreign currency risk
(i) Currency translation riskCurrency translation risk arises from net investments in foreign operations. It is the group's policy to hedge this foreign currency translation risk by borrowing in the currency of the asset in proportion to the group's long-term debt to debt plus equity ratio. This reduces the variability in the debt to debt plus equity ratio due to currency translation. Where the underlying debt in any currency does not equate to the required proportion of total debt, debt derivatives, such as foreign exchange forwards, swaps and cross currency interest rate swaps are entered into for up to 11 years. Net investment, cash flow and fair value hedge accounting is applied to these instruments.
The group’s exposure to foreign currency risk on foreign currency borrowings after hedging is summarised as follows:
Fletcher Building GroupJune 2017
NZ$MJune 2016
NZ$M
Australian dollar 729 753
Euro 68 70
British pound 36 22
United States dollar 221 221
Indian rupee 11 12
Canadian dollar 16 16
Fijian dollar 13 Currency translation risk – Foreign currency borrowings 1,094 1,094
New Zealand dollar 1,036 522
2,130 1,616
(ii) Currency transaction riskCurrency transaction risk arises from committed or highly probable trade and capital expenditure transactions that are denominated in currencies other than the operation's functional currency. The objective in managing this risk is to reduce the variability from changes in currency exchange rates on the operation's income and cash flow to acceptable parameters. It is group policy that no currency exchange risk may be entered into or allowed to remain outstanding should it arise on committed transactions.
When exposures are incurred by operations in currencies other than their functional currency, foreign exchange forwards and swaps are entered into to eliminate the exposure. The majority of these transactions have maturities of less than one year. Cash flow hedge accounting is applied to forecast transactions. The main currencies hedged are the Australian dollar, the United States dollar, the Japanese yen, the Euro and the British pound. The gross value of these foreign exchange derivatives at 30 June 2017 was $434 million (June 2016: $744 million).
(d) Interest rate riskInterest rate risk is the risk that the value of a financial instrument or cash flows associated with the instrument will change due to changes in market interest rates and arises primarily from the group’s interest bearing borrowings. The group manages the fixed interest rate component of its debt and capital notes obligations and aims to maintain this ratio between 40 to 70% and at 30 June 2017 the group was within the range at 44% fixed (June 2016: 61% fixed). The position in this range is managed depending upon underlying interest rate exposures and economic conditions. Cross currency interest rate swaps, interest rate swaps, forward rate agreements and options are entered into to manage this position. The financial instruments entered into are in Australian dollars, United States dollars, Japanese Yen and New Zealand dollars and will mature over the next 12 years.
Hedge accounting is applied on these instruments for floating-to-fixed instruments as cash flow hedges or for fixed-to-floating instruments as fair value hedges.
Interest rate repricingThe following tables set out the interest rate repricing profile of interest bearing financial assets and liabilities. The group's overall weighted average interest rate excluding fees is 4.76% (June 2016: 5.4%).
Fletcher Building GroupJune 2017
NZ$MJune 2016
NZ$M
Floating 1,192 623
Fixed up to 1 year 100 330
Fixed 1-2 years 237 95
Fixed 2-5 years 462 464
Fixed over 5 years 139 104
Total financial liabilities 2,130 1,616
Floating financial assets (219) (356)
78 Fletcher Building Annual Report 2017
Notes to the financial statements 2017

(e) Commodity price riskCommodity price risk arises from committed or highly probable trade and capital expenditure transactions that are linked to traded commodities. Where possible the group manages its commodity price risks through negotiated supply contracts and, for certain commodities, by using commodity price swaps and options. The group manages its commodity price risk depending on the underlying exposures, economic conditions and access to active derivatives markets. Currently the group's guideline is to hedge up to 50% of certain New Zealand business units' electricity requirements for up to 12 months. Cash flow hedge accounting is applied to commodity derivative contracts.
At balance date, the notional value of fixed electricity exposure was $4 million, the fair value was as follows:
Fletcher Building GroupJune 2017
NZ$MJune 2016
NZ$M
Fixed up to 1 year 1Total 1
NZ$/MWh NZ$/MWh
Average hedge price 77 82
(f) Sensitivity analysisThe numbers in the sensitivity analysis for foreign currency risk, interest rate risk and commodity price risk have not been adjusted for tax and are based only on the group's financial instruments held at balance date and assume that all other variables remain constant, except for the change in the chosen risk variable.
(i) Foreign currency riskIt is estimated a 10% weakening of the New Zealand dollar against the major foreign currencies the group is exposed to on the net assets of its foreign operations would result in an increase to equity of approximately $190 million (June 2016: $220 million) and no material impact on earnings.
(ii) Interest rate riskIt is estimated a 100 basis point increase in interest rates would result in an increase in the group's interest costs in a year by approximately $11.9 million on the group's debt portfolio exposed to floating rates at balance date (June 2016: $6.2 million).
(iii) Commodity price riskIt is estimated a 10% increase in the New Zealand electricity spot price at balance date would not materially impact the group's earnings or equity position.
(g) Fair values
Fair value hedgesWhere a derivative financial instrument is designated as a hedge of a recognised asset or liability, or of a firm commitment, any gain or loss is recognised directly in earnings, together with any changes in the fair value of the hedged risk.
Cash flow hedgesWhere a derivative financial instrument is designated as a hedge of the variability in cash flows of assets or liabilities, or of a highly probable forecasted transaction, the effective part of any gain or loss is recognised directly in the cash flow hedge reserve within equity and the ineffective part is recognised immediately in earnings. The effective portion is transferred to earnings when the underlying cash flows affect earnings.
Net investment hedges Where the derivative financial instruments are designated as a hedge of a net investment in a foreign operation, the derivative financial instruments are accounted for on the same basis as cash flow hedges through the currency translation reserve within equity. There are no outstanding hedges as at 30 June 2017.
Derivatives that do not qualify for hedge accountingWhere a derivative financial instrument does not qualify for hedge accounting, or where hedge accounting has not been elected, any gain or loss is recognised directly in earnings.
79 Fletcher Building Annual Report 2017

The estimated fair value measurements for financial assets and liabilities compared to their carrying values in the balance sheet, are as follows:
Fletcher Building Group June 2017 June 2016
Classification
Carrying value
NZ$MFair value
NZ$M
Carrying value
NZ$MFair value
NZ$M
Bank loans Amortised cost 389 389 119 119
Private placements Amortised cost 1,262 1,322 1,168 1,239
Other loans Amortised cost 121 121 81 81
Capital notes Amortised cost 400 411 384 402
Borrowings 2,172 2,243 1,752 1,841
Forward exchange contracts – fair value hedge Fair value through P&L 1 1
Forward exchange contracts – net investment hedge Fair value through Equity (4) (4)
Forward exchange contracts – cash flow hedge Fair value through Equity 6 6
Cross currency interest rate swaps – cash flow hedge Fair value through Equity 1 1 (22) (22)
Cross currency interest rate swaps – fair value hedge Fair value through P&L (41) (41) (108) (108)
Interest rate swaps – fair value hedge Fair value through P&L (9) (9) (17) (17)
Interest rate swaps – cash flow hedge Fair value through Equity 6 6 12 12
Electricity price swaps – cash flow hedge Fair value through Equity (1) (1)Net derivatives (44) (44) (132) (132)
Creditors and accruals Amortised cost 1,442 1,442 1,380 1,380
Debtors Loans and receivables (1,525) (1,525) (1,362) (1,362)
Cash and liquid deposits Cash (219) (219) (356) (356)
Total financial instruments 1,826 1,897 1,282 1,371
Fair value measurement
All of the group's derivatives are in designated hedge relationships and are measured and recognised at fair value. All derivatives are level 2 valuations based on accepted valuation methodologies. Forward exchange fair value is calculated using quoted forward exchange rates and discounted using yield curves derived from quoted interest rates matching maturity of the contract. The fair value of electricity price swaps is measured using a derived forward curve and discounted using yield curves derived from quoted interest rates matching the maturity of the contract.
Interest rate derivatives are calculated by discounting the future principal and interest cash flows at current market interest rates that are available for similar financial instruments.
(Level 1) Quoted prices (unadjusted) in active markets for identical assets or liabilities.
(Level 2) Inputs that are observable for the asset or liability, either directly (as prices) or indirectly (derived from prices) other than quoted prices included within level 1.
(Level 3) Inputs for the asset or liability that are not based on observable market data (unobservable inputs).
Fair value disclosuresThe fair values of borrowings used for disclosure are measured under level 2, by discounting future principal and interest cash flows at the current market interest rate plus an estimated credit margin that is available for similar financial instruments with a similar credit profile to the group.
The interest rates across all currencies used to discount future principal and interest cash flows are between 1.69% and 9.98% (June 2016: 1.42% and 8.79%) including margins, for both accounting and disclosure purposes.
(h) Capital risk managementThe group's objectives when managing capital are to safeguard the group's ability to continue as a going concern to provide returns to shareholders and benefits for other stakeholders and to maintain an optimal capital structure to reduce the cost of capital.
To maintain or adjust the capital structure, the group may adjust the amount of dividends paid to shareholders, return capital to shareholders, issue new shares or sell assets to reduce debt.
The group monitors capital on the basis of net debt to net debt plus equity and the target gearing range is 30 to 40%. A target leverage range has been introduced that reflects the ratio of debt to cash flow. Expressed as a ratio of net debt to EBITDA, the target range is 2.0 times to 2.5 times. It is intended that the group will not be materially outside the target gearing and leverage ranges on a long-term basis.
16. Financial instruments continued
80 Fletcher Building Annual Report 2017
Notes to the financial statements 2017

17. Capital expenditure commitments
Capital expenditure commitments are those where future expenditure has either been committed or has received board approval at year end, but not provided for in the financial statements.
Fletcher Building GroupJune 2017
NZ$MJune 2016
NZ$M
Committed at year end 79 404
Approved by the directors but uncommitted at year end 64 40
143 444
18. Lease commitments
Leases under which a significant proportion of the risks and rewards of ownership are retained by the lessor are classified as operating leases. Payments made under operating leases (net of any incentives received) are recognised as an expense in the Statement of Financial Performance on a straight-line basis over the term of the lease. Expenditure arising from operating leasing commitments is written off to earnings in the period in which it is incurred.
Expected future minimum lease payments on non-cancellable leases:
Fletcher Building GroupJune 2017
NZ$MJune 2016
NZ$M
Within one year 183 171
Within two years 135 138
Within three years 111 105
Within four years 96 81
Within five years 75 65
After five years 199 226
799 786
Operating lease commitments relate mainly to occupancy leases of buildings.
19. Contingent liabilities
Contingent liabilities are subject to uncertainty or cannot be reliably measured and are not provided for. Disclosures as to the nature of any contingent liabilities are set out below. Judgements and estimates are applied to determine the probability that an outflow of resources will be required to settle an obligation. These are made based on a review of the facts and circumstances surrounding the event and advice from both internal and external parties.
Provision has been made in the ordinary course of business for all known and probable future claims. Contingent liabilities arise in respect of the following categories:
Fletcher Building GroupJune 2017
NZ$MJune 2016
NZ$M
Contingent liabilities with respect to guarantees extended on trading transactions, performance bonds and other transactions 389 289
Letters of credit 9 2
81 Fletcher Building Annual Report 2017

20. Property, plant and equipment
Property, plant and equipment comprise the following categories:• Land
• Buildings
• Plant and machinery
• Fixtures and equipment
• Resource extraction
• Leased assets (leased under a finance lease arrangement).
Land, buildings, plant and machinery, finance leased assets and fixtures and equipment are stated at cost, less accumulated depreciation.
The cost of purchasing land, buildings, plant and machinery, fixtures and equipment is the value of the consideration given to acquire the assets and the value of other directly attributable costs that have been incurred in bringing the assets to the location and the condition necessary for their intended service, including subsequent expenditure.
The costs of self-constructed assets include, where appropriate, the costs of all materials used in construction, direct labour on the project, site preparation and installation costs, costs of obtaining resource consents, financing costs attributable to the project, variable and fixed overheads and unrecovered operating costs incurred during planned commissioning. Costs cease to be capitalised as soon as the asset is in the location and condition necessary for it to be capable of operating in the manner intended by management. All feasibility costs are expensed as incurred.
Resource extraction assets are held at historic cost and depleted over the shorter of the life of the site or right to use period. Site development costs incurred in order to commence extraction are capitalised as resource extraction assets.
Impairment is deemed to occur when the recoverable amount of an asset falls below its carrying value. The recoverable amount is determined to be the greater of the fair value, less disposal costs or the sum of expected future discounted net cash flows arising from the ownership of the asset. Future net cash flows take into account the remaining useful life and the expected period of continued ownership, including any intended disposals, and any costs or proceeds expected to eventuate at the end of the remaining useful life or the end of the expected period of continued ownership.
For the purposes of considering whether there has been an impairment, assets are grouped at the lowest level for which there are identifiable cash inflows that are largely independent of the cash flows of other groups of assets. When the book value of a group of assets exceeds the recoverable amount, an impairment loss arises and is recognised in earnings immediately.
Leases in which the group assumes substantially all the risks and rewards of ownership are classified as finance leases and are measured at the lower of their fair value or the present value of the minimum lease payments at the inception of the lease.
Finance leases are capitalised to reflect the borrowings incurred and the cost of the asset acquired. Such obligations are classified within borrowings. The finance cost portion of lease payments is expensed to the income statement over the lease period. The leased asset is depreciated on a straight line basis over the estimated useful life of the asset with regard to residual values.
Depreciation of property, plant and equipment and amortisation of definite lived intangible assets are calculated on the straight line method. Expected useful lives, which are regularly reviewed, typically range between:
Buildings 30-50 years
Plant and machinery 5-15 years
Fixtures and equipment 2-7 years
Leased assets capitalised 3-30 years
Intangible assets, including software (note 22) 5-15 years
Long-term InvestmentsThis section details the long-term assets of the group, including property, plant and equipment and intangible assets.
82 Fletcher Building Annual Report 2017
Notes to the financial statements 2017

Fletcher Building GroupLand
NZ$MBuildings
NZ$M
Plant &machinery
NZ$M
Fixtures & equipment
NZ$M
Resourceextraction
NZ$M
Leased assetsNZ$M
TotalNZ$M
Gross value at 1 July 2016 272 469 2,419 470 67 1 3,698Additions 24 192 55 22 42 335Acquisitions 6 4 91 3 11 115Disposals (3) (11) (52) (31) (5) (102)Currency translation 1 (3) (8) 1 (9)Gross value at 30 June 2017 276 483 2,642 498 95 43 4,037
Accumulated depreciation at 1 July 2016 (155) (1,244) (315) (11) (1) (1,726)Disposals 8 52 25 3 88Impairments in the income statement (note 4) (4) (4)Depreciation expense (16) (135) (30) (5) (186)Currency translation 1 3 1 5Accumulated depreciation at 30 June 2017 (162) (1,328) (319) (13) (1) (1,823)
Net book value at 30 June 2017 276 321 1,314 179 82 42 2,214
Gross value at 1 July 2015 310 520 2,548 478 116 2 3,974
Additions 3 6 165 65 17 256
Disposals (18) (29) (180) (56) (64) (1) (348)
Transfer of land assets to inventory (6) (6)
Currency translation (17) (28) (114) (17) (2) (178)
Gross value at 30 June 2016 272 469 2,419 470 67 1 3,698
Accumulated depreciation at 1 July 2015 (165) (1,291) (344) (14) (2) (1,816)
Disposals 22 134 48 7 1 212
Impairments in the income statement (note 4) (3) (12) (15)
Depreciation expense (17) (130) (29) (4) (180)
Currency translation 8 55 10 73
Accumulated depreciation at 30 June 2016 (155) (1,244) (315) (11) (1) (1,726)
Net book value at 30 June 2016 272 314 1,175 155 56 1,972
As at 30 June 2017 property, plant and equipment includes $226 million of assets under construction that are not depreciated until they are commissioned and brought into use (June 2016: $164 million).
83 Fletcher Building Annual Report 2017

21. Goodwill
Goodwill arises when the group acquires another business to the extent of the excess of the cost of the acquisition over the fair value of the assets and liabilities of the acquired business. Fair values are assigned to the identifiable assets and liabilities of subsidiaries and associates of the group at the date they are acquired.
Goodwill, which has an indefinite life, is stated at cost, less any impairment losses. Goodwill is allocated to cash-generating units (CGUs) and is not amortised but is tested annually for impairment, and when an indication of impairment exists. Goodwill in respect of associates is included in the carrying amount of associates. Any discount on acquisition is recognised directly in earnings.
Impairment is deemed to occur when the recoverable amount of an asset falls below its carrying value. The recoverable amount is determined to be the greater of the fair value, less disposal costs or the sum of expected future discounted net cash flows arising from the ownership of the asset. Future net cash flows take into account the remaining useful life and the expected period of continued ownership, including any intended disposals, and any costs or proceeds expected to eventuate at the end of the remaining useful life or the end of the expected period of continued ownership.
For the purposes of considering whether there has been an impairment, assets are grouped at the lowest level for which there are identifiable cash flows that are largely independent of the cash flows of other groups of assets. When the book value of a group of assets exceeds the recoverable amount, an impairment loss arises and is recognised in earnings immediately.
Assessing the carrying value of goodwill requires management to estimate future cash flows to be generated by the related cash-generating unit. The key assumptions used in the value-in-use models include the expected rate of growth of revenues and earnings, the terminal growth rate and the appropriate discount rate to apply.
Goodwill was tested for impairment in June 2017. Each CGU that carries goodwill is valued on a value-in-use or fair value less costs of disposal basis using a discounted cash flow model. Management has used its past experience of sales growth, operating costs and margin, and external sources of information where appropriate, to determine their expectations for the future. These cash flow projections are principally based on the group's three-year strategic plan approved by the directors, which has been extended for a further two years. Cash flows beyond five years have been extrapolated using estimated terminal growth rates, which do not exceed the long-term average growth rate for the industries and countries in which the business units operate. The terminal growth rates used range from 2.5% to 3.0% (2016: 2.5% to 3.0%), with the majority of the business units using 2.5% (2016: 2.5%).
The cash flows are discounted using a nominal rate after tax of 9.5% (2016: 9.5%) for New Zealand, 8.5% (2016: 8.5%) for Australia, 7.0% (2016: 7.0%) for Europe, 8.0% (2016: 8.0%) for North America and 9.0% (2016: 9.0%) for Asia, reflecting the risk profile of each business and for the regions in which the CGUs operate. The valuation models used are most sensitive to changes in the terminal year earnings and cash flows.
Sensitivity to reasonably possible changes in assumptionsThe group has identified two business units that face particular challenges: Tradelink and Iplex Australia. In particular the Australian economy has experienced mixed market conditions in the past year and faces uncertain growth in the short-term, making it difficult to predict future profitability. Management's previous expectations of improvement in earnings of these business units justified the prior carrying values. Given the uncertain outlook for the Australian economy, management has revised its expectations as to the business units' sustainable mid-cycle earnings, as well as the time now expected to attain the required improvement in earnings. This has led to a reduction of the value-in-use of each business unit, based on an 8.5% nominal, after tax discount rate. Intangible assets of $153 million and $69 million have been impaired within the Tradelink and Iplex Australia business units respectively. Management has identified a number of strategies and initiatives to achieve an appropriate improvement in their EBIT. If this improvement does not eventuate, there may be a need for further impairment.
The impairment assessment confirmed that, for all other business units, the recoverable amounts exceed carrying values as at 30 June 2017. With the exception of Formica Europe and Formica Asia, management considers that no reasonably possible change in assumptions would cause the carrying amount to exceed the recoverable amount.
For Formica Asia, which has goodwill of $250 million and brands of $nil, a reduction of 15% in the expected level of terminal EBIT, a 0.8% increase in the post-tax discount rate, or a 1.0% decrease in terminal growth rate would result in the elimination of the $60 million excess of recoverable amount over carrying amount. For Formica Europe, which has goodwill of $83 million, and brands of $13 million, a 28% reduction in the expected level of terminal EBIT or a 1.7% increase in the post-tax discount rate would result in the elimination of the $135 million excess of recoverable amount over carrying amount. For Rocla Products, which has goodwill of $10 million and brands of $21 million, a reduction of 26% in the expected level of terminal EBIT, or a 1.6% increase in the post-tax discount rate would result in the elimination of the $61 million excess of recoverable amount over carrying amount.
84 Fletcher Building Annual Report 2017
Notes to the financial statements 2017

Fletcher Building GroupJune 2017
NZ$MJune 2016
NZ$M
Goodwill acquired at cost 1,526 1,367
Accumulated currency translation (32) (30)
Accumulated impairment (425) (254)
Goodwill at the end of the year 1,069 1,083
Goodwill at the beginning of the year 1,083 1,131
Acquired during the year (note 5) 159Impairments in the income statement (note 4) (171) (3)
Currency translation (2) (45)
1,069 1,083
Goodwill by significant cash-generating units (CGUs)The goodwill allocated to significant CGUs accounts for 68% (2016: 66%) of the total carrying value of goodwill. The remaining 'other' CGUs, which comprise 25 (2016: 23) in total, are each less than 8% of total carrying value (2016: 8%).
June 2017NZ$M
June 2016NZ$M
Formica Asia 250 256
Higgins Construction 144 Laminex Australia 154 153
Iplex New Zealand 105 105
Tradelink 60 196
Other 356 373
1,069 1,083
22. Intangible assets
Intangible assets acquired separately are measured on initial recognition at cost. Following initial recognition, intangible assets are carried at cost less any accumulated amortisation and accumulated impairment losses.
Intangible assets with indefinite useful lives are not amortised but are tested for impairment annually, either individually or at the CGU level. Definite lived intangible assets are amortised on a straight-line basis.
Expenditure on research activities is recognised in earnings as incurred. Significant development expenditure is recognised as an asset if certain criteria, relating to technical feasibility and future economic benefits, are met. All other development expenditure is recognised in the income statement as incurred.
Fletcher Building GroupJune 2017
NZ$MJune 2016
NZ$M
Brands 461 478
Other intangible assets 148 154
609 632
85 Fletcher Building Annual Report 2017

Brands
Brands for which all relevant factors indicate there is no limit to the foreseeable net cash flows are considered to have an indefinite useful life and are held at cost and are not amortised but are subject to an annual impairment test.
Brands are considered to have an indefinite useful life as there are no factors that indicate that there is a limit on their capacity to generate foreseeable cash flows. Factors considered before arriving at this conclusion are whether the businesses that own the brands are going concerns, whether there is any evidence of obsolescence due to changes in either technology or regulatory conditions, whether the businesses are trading profitably and whether there are any other market-based indications.
Assessing the carrying value of indefinite life brands requires management to estimate future cash flows to be generated by the related brand. The key assumptions used in the value-in-use models include the expected rate of growth of revenues and earnings, the terminal growth rate and the appropriate discount rate to apply.
BrandsJune 2017
NZ$MJune 2016
NZ$M
Brands at the beginning of the year 478 503
Acquired during the year (note 5) 21Impairments in the income statement (note 4) (36)Currency translation (2) (25)
461 478
June 2017NZ$M
June 2016NZ$M
Formica 134 138
Laminex Australia 120 119
Tradelink 51 50
Other 156 171
461 478
Brands have been tested for impairment in June 2017. Each CGU that carries a brand value, and is determined to be not separately identifiable, has prepared a discounted cash flow of the CGU on a value-in-use or fair value less costs of disposal basis as described in note 21. The impairment review confirmed that, for all intangible assets (excluding certain goodwill, brands and other intangible assets for which impairments are disclosed in this note and note 21), the recoverable amounts exceeded carrying values as at 30 June 2017.
Sensitivity analysis was performed on the key assumptions used in the value-in-use and fair value less costs of disposal calculations and further disclosure has been made for certain CGUs in note 21.
The following significant brand assets account for 66% (2016: 64%) of the total carrying value of brands. The remaining 'other' brand assets are each less than 9% of total carrying value (2016: 8%).
Other intangible assetsJune 2017
NZ$MJune 2016
NZ$M
Other intangible assets at cost 256 230
Currency translation (8) (8)
Accumulated amortisation (100) (68)
Other intangible assets at the end of the year 148 154
Other intangible assets at the beginning of the year 154 129
Additions 26 44
Impairments in the income statement (note 4) (15)Amortisation expense (17) (14)
Currency translation (5)
148 154
As at 30 June 2017 other intangible assets includes $22 million of assets being developed (June 2016: $23 million).
22. Intangible assets continued
86 Fletcher Building Annual Report 2017
Notes to the financial statements 2017

Group Structure and Related PartiesThis section details the group's capital, non-controlling interest of subsidiaries, investments in associates and joint ventures and information relating to transactions with other group entities.
23. Capital
Ordinary shares are classified as shareholders’ funds. Costs directly attributable to the issue of new shares or options are shown in shareholders’ funds as a reduction from the proceeds. Where a member of the group purchases the company’s share capital, the consideration paid is deducted from shareholders' funds. Acquired shares are classified as treasury stock and presented as a deduction from share capital under the treasury stock method, as if the shares were cancelled, until they are reissued or otherwise disposed of.
Fletcher Building GroupJune 2017
NZ$MJune 2016
NZ$M
Reported capital at the beginning of the year, including treasury stock 2,680 2,653
Issue of shares 31 27
Reported capital at the end of the year, including treasury stock 2,711 2,680
Treasury stock (33) (30)
Capital 2,678 2,650
All ordinary shares are issued and fully paid and carry equal rights in respect of voting, dividend payments and distribution upon winding up.
Fletcher Building GroupJune 2017
NZ$MJune 2016
NZ$M
Number of ordinary shares:Number of shares on issue at the beginning of the year 692,501,249 688,763,361
Shares issued under the dividend reinvestment plan 3,419,925 3,737,888
Total number of shares on issue 695,921,174 692,501,249
Less shares accounted for as treasury stock (4,129,695) (4,232,334)
691,791,479 688,268,915
24. Non-controlling interests
Non-controlling interests are allocated their share of profit for the year in the income statement and are presented separately within equity in the balance sheet. The effect of all transactions with non-controlling interests that change the group’s ownership interest but do not result in a change in control are recorded in equity.
Fletcher Building GroupJune 2017
NZ$MJune 2016
NZ$M
Share capital 13 13
Reserves 11 9
Non-controlling interests 24 22
87 Fletcher Building Annual Report 2017

25. Investments in associates and joint ventures
Investments in associates are measured using the equity method. The equity method has been used for associate entities over which the group has significant influence but not control.
A joint arrangement is an arrangement where two or more parties have joint control. The group classifies its joint arrangements as either joint operations or joint ventures depending on the legal, contractual and other rights and obligations.
Where the interest in the joint arrangement is in the net residual value of the business, the arrangement is a joint venture. Joint ventures are accounted for using the equity method. Under the equity method of accounting, investments in joint ventures are initially recognised at cost. Subsequent to initial recognition, the consolidated financial statements include the group’s share of profit or loss and other comprehensive income of equity-accounted investees.
Where the group has rights to the assets and obligations for the liabilities of the joint arrangement, this is a joint operation. The group recognises its share of assets, liabilities, revenue and expenses of each joint operation.
Fletcher Building GroupJune 2017
NZ$MJune 2016
NZ$M
Carrying amount of associates/joint ventures:Carrying amount at the beginning of the year 135 98
New investment in associates/joint ventures 2 59
Share of profits of associates/joint ventures 20 12
Sale of investment in associates/joint ventures (1) (19)
Currency translation 1 (5)
Distributions from associates/joint ventures (11) (10)
Investment in associates and joint ventures 146 135
Investment by associate/joint venture:Wespine Industries Pty Limited 45 43
Hexion Australia Pty Ltd 19 17
Altus NZ Limited 56 49
Other 26 26
146 135
Associate and joint venture information:Balance sheet information for associates and joint ventures – 100%Assets 314 319
Liabilities (126) (127)
Equity 188 192
Equity – Fletcher Building share 89 90
Goodwill acquired at cost 53 43
Loans to associates and joint ventures 4 2
Investment in associates and joint ventures 146 135
Equity-accounted earnings comprise:Sales – 100% 249 252
Earnings before taxation – 100% 37 35
Earnings before taxation – Fletcher Building share 22 17
Taxation expense (2) (5)
Earnings after taxation – Fletcher Building share 20 12
88 Fletcher Building Annual Report 2017
Notes to the financial statements 2017

26. Related party disclosures
The disclosures below set out transactions and outstanding balances that group companies and other related parties have with each other. Transactions with related parties are conducted on normal business terms.
Key management personnel are defined as the executive committee and Board of Directors.
Trading activities with related parties
Sales to related
partiesNZ$M
Purchases from related
partiesNZ$M
Amounts owing from
related parties (included
within debtors)NZ$M
Amounts owing to
related parties (included
within creditors)
NZ$M
Fletcher Building Group – 2017Wespine Industries Pty Limited and Hexion Australia Pty Ltd 36 12Dongwha New Zealand Limited 15 1Fletcher Construction Alliances 72 2
Fletcher Building Group – 2016Sims Pacific Metals Limited 26
Wespine Industries Pty Limited and Hexion Australia Pty Ltd 34 7
Dongwha New Zealand Limited 15 1
Fletcher Construction Alliances 105 5
Fletcher Building GroupJune 2017
NZ$MJune 2016
NZ$M
Key management personnel compensationDirectors' fees 2 2
Executive committee remuneration paid, payable or provided for:
Short-term employee benefits 13 17
Termination benefits 2
Share-based payments 3 1
Fletcher Building Retirement PlanAs at 30 June 2017, Fletcher Building Nominees Limited (the New Zealand retirement plan) held $2,600,000 of shares and $15,000,000 of capital notes in Fletcher Building (June 2016: $4,200,000 of shares; $18,500,000 of capital notes).
89 Fletcher Building Annual Report 2017

Other informationThis section provides additional disclosures required that are not covered in the previous sections.
27. Income statement disclosures
Fletcher Building Group
Year endedJune 2017
NZ$M
Year endedJune 2016
NZ$M
The following items are specific disclosures required to be made and are included within the income statement:
Net periodic pension cost 10 10
Employee-related short-term costs(1) 1,728 1,648
Other long-term employee-related benefits 66 71
Research and development expenditure 3 1
Amortisation of intangibles 17 14
Bad debts written off 4 6
Donations(2) and sponsorships 2 1
Maintenance and repairs 149 142
Operating lease expense 183 197
(1) Short-term employee benefits for the executive committee included in the above is disclosed in note 26.
(2) The group made no political donations during the year.
Auditor's fees
NZ$000's NZ$000's
Auditor's fees and expenses payable for:
Audit and review of the financial statements – EY 3,689 3,266
All other services performed – EY(3) 572 854
(3) Fees paid to the auditor during the year for other services are mainly with respect to tax advisory services.
90 Fletcher Building Annual Report 2017
Notes to the financial statements 2017

28. Taxation
Taxation expense
Income tax expense comprises current and deferred tax.
The provision for current tax is the estimated amount due for payment by the group during the next 12 months. The provision for deferred tax has been calculated using the balance sheet liability method.
Deferred tax is recognised on the temporary difference between the carrying amount of assets and liabilities and their taxable value except for when the deferred tax liability arises from the initial recognition of goodwill or an asset or liability in a transaction that is not a business combination and, at the time of the transaction, affects neither the accounting profit nor taxable profit or loss. Deferred tax assets are not recognised on temporary differences and tax losses unless recovery is considered probable. There are no significant deferred tax liabilities in respect of the undistributed profits of subsidiaries and associates.
Judgements are required about the application of income tax legislation. These judgements and assumptions are subject to risk and uncertainty, hence there is a possibility that changes in circumstances will alter expectation, which may impact the amount of current and deferred tax assets and liabilities recognised in the balance sheet and the amount of other tax losses and temporary differences not yet recognised. In such circumstances, some or all of the carrying amounts of recognised tax assets and liabilities may require adjustment, resulting in a corresponding credit or charge to the income statement.
Below is the reconciliation of earnings before taxation to taxation expense:
Fletcher Building Group
Year endedJune 2017
NZ$M
Year endedJune 2016
NZ$M
Earnings before taxation 162 604
Taxation at 28 cents per dollar 45 169
Adjusted for:
Lower tax rate in overseas jurisdictions (4)Non-assessable income (20) (15)
Non-deductible expenses 50 14
Tax losses for which no deferred tax asset was recognised 5 14
Utilisation of previous unrecognised tax losses (34)
Tax in respect of prior years (1) 7
Other permanent differences (18) (24)
57 131
Tax on earnings before significant items 82 138
Tax benefit on significant items (25) (7)
57 131
Total current taxation expense 56 135
Total deferred taxation expense/(benefit) 1 (4)
57 131
91 Fletcher Building Annual Report 2017

Taxation balancesBelow is a reconciliation of the current tax balances:
Fletcher Building GroupJune 2017
NZ$MJune 2016
NZ$M
Current tax assets/(liabilities)Included within the balance sheet as follows:
Current tax assets 15 2
Current tax liabilities (30) (26)
(15) (24)
Opening provision for current tax assets/(liabilities) (24) (5)
Currency translation
Taxation expense (56) (135)
Transfer (from) / to deferred taxation (42) 10
Non-controlling interest share of taxation expense 4 4
Tax recognised directly in reserves 4 5
Net tax payments 99 97
(15) (24)
Provision for deferred tax assets/(liabilities)Included within the balance sheet as follows:
Deferred tax assets 52 24
Deferred tax liabilities (47) (58)
5 (34)
Opening provision for deferred tax assets/(liabilities) (34) (25)
Taxation (expense)/benefit (1) 4
Deferred tax on acquisitions (7)Transfer (from)/to current tax 42 (10)
Tax recognised directly in reserves 5 (3)
5 (34)
Composed of:Provisions 154 112
Inventories 18 20
Debtors 4 5
Property, plant and equipment (74) (68)
Brands (138) (148)
Tax losses 40 27
Pensions (1) 7
Other 2 11
5 (34)
The group has recognised certain tax losses available in Australia, USA and Germany on the basis that the respective companies will have future assessable income. The tax losses have been recognised on the basis of the forecast earnings set out in the companies' strategic plans. The group reviews future loss utilisations at each reporting period.
The group has unrecognised tax losses in France, Spain, Sweden, UK, India and China of $124 million representing $445 million of gross tax losses (June 2016: $116 million, $419 million gross tax losses).
28. Taxation continued
92 Fletcher Building Annual Report 2017
Notes to the financial statements 2017

29. Retirement plansFletcher Building Limited is the principal sponsoring company of a plan that provides retirement and other benefits to employees of the group in New Zealand. Participation in this plan has been closed for a number of years, although defined contribution savings plans have been made available. Various defined benefit and defined contribution plans exist in Australia following the acquisition of Crane, Amatek, Tasman Building Products, and the Laminex groups which companies contribute to on behalf of their employees. Various defined benefit plans and medical plans exist in other countries as a result of the acquisition of the Formica group, which companies contribute to on behalf of their employees. Where the plans have a deficit in their funded status, the companies are making additional contributions, as recommended by the trustees of the plans, to improve the funded status.
The group’s plan assets and liabilities in respect of individual retirement plans are calculated separately for each plan by an independent actuary, as being the fair value of the plan’s assets less the present value of the future obligations to the members. The value of the asset recognised cannot exceed the present value of any future refunds from the plans or reductions in future contributions to the plans, unless a constructive right to a refund of the surplus exists, in which case the amount to be refunded is recognised as an asset. In the group’s balance sheet, plans that are in a surplus position are not offset with plans that are in a liability position.
Obligations for contributions to defined contribution plans are recognised in earnings as incurred. The actuarial cost of providing benefits under defined benefit plans is expensed as it accrues over the service life of the employees, after taking account of the income expected to be earned by the assets owned by the plans.
All retirement plan related actuarial gains or losses are recognised in other comprehensive income in the pension reserve in the year in which they arise.
Principal assumptions made in the actuarial calculation of the defined benefit obligation relate to the discount rate, rate of salary inflation and life expectancy.
The calculation of the defined benefit obligations are based on years of service and the employees' compensation during their years of employment. Contributions are intended to provide not only for benefits attributed to service to date but also for those expected to be earned in the future. These obligations are accounted for in accordance with NZ IAS 19 Employee Benefits, which has the effect of recognising the volatility in the returns earned by the plans in the pension reserve.
The following table provides the weighted average assumptions used to develop the net periodic pension cost and the actuarial present value of projected benefit obligations for the group's plans:
2017%
2016%
Assumed discount rate on benefit obligations 2.79 2.80
Annual rate of increase in future compensation levels 2.43 2.68
Expected returns on plan assets have been determined by the independent actuaries as the weighted average of the expected return after tax and investment fees for each asset class by the target allocation of assets to each class.
During the year the group contributed $nil (2016: $1 million) in respect of its Australian defined benefit plans and $29 million (2016: $21 million) in respect of its Formica defined benefit and medical plans. It contributed $48 million (2016: $48 million) in respect of its defined contribution plans worldwide, including KiwiSaver.
Fletcher Building Limited has an obligation to ensure that the funding ratio of the New Zealand plan's assets is at least 115% of the plan's actuarial liability. This is based upon any two consecutive annual actuarial valuations as calculated by the plan's actuary. This calculation is done on the plan's funding basis, which is completed in accordance with NZ IAS 26 Retirement Benefit Plans. At 31 March 2017, the value of the plan assets was 146% of the actuarial liability and the funded surplus was $88 million (31 March 2016: 140%, $78 million).
The group expects to contribute at least $22 million to its overseas defined benefit plans during the year to 30 June 2018.
93 Fletcher Building Annual Report 2017

Fletcher Building GroupJune 2017
NZ$MJune 2016
NZ$M
Net periodic pension costService cost 8 9 Net interest cost 2 1 Net periodic pension cost – recognised in earnings before interest and taxation 10 10
Recognised net asset/(liability)Assets of plans 827 783Projected benefit obligation (793) (812)Funded surplus/(obligation) 34 (29)Asset ceiling effect (1) (3)Recognised net asset/(liability) 33 (32)
Recognised net asset/(liability) by jurisdiction:New Zealand plan 54 30 Australian plans 17 11 Retirement plan assets – recognised within non-current assets 71 41 Other overseas plans (38) (73)Retirement plan liabilities – recognised within non-current liabilities (38) (73)Recognised net asset/(liability) 33 (32)
Movement in recognised net asset/(liability)Recognised net liability at the beginning of the year (32) (3)Currency translation 2 6Actuarial movements for the year 44 (46)Net periodic pension cost (10) (10)Employer contributions 29 21 Recognised net asset/(liability) 33 (32)
Assets of the plansAssets of plans at the beginning of the year 783 851 Actual return on assets 87 34 Total contributions 32 24 Benefit payments (59) (63)Currency translation (16) (63)
827 783
Assets of the plans consist of:Australasian equities 65 80 International equities 311 344 Property 35 38 Bonds 314 263 Cash and short-term deposits 55 48 Other assets 47 10
827 783
Projected benefit obligationProjected benefit obligation as at the beginning of the year (812) (845)Service cost (10) (9)Interest cost (22) (29)Member contributions (3) (3)Actuarial loss arising on changes in demographic assumptions 10 Actuarial loss arising on changes in financial assumptions (26) (66)Actuarial gain arising on other assumptions – experience adjustments (6) 9 Benefit payments 59 63 Currency translation 17 68
(793) (812)
29. Retirement plans continued
94 Fletcher Building Annual Report 2017
Notes to the financial statements 2017

30. Share-based payments
Long-term share schemeThe group has a long-term share-based performance incentive scheme targeted at selected employees (invited to participate at the discretion of the company) most able to influence the results of the group.
The long-term share scheme introduced in 2008 allows scheme participants to acquire shares in the company at market price, funded by an interest-free loan from the group. The scheme participants are entitled to vote on the shares and to receive cash dividends, the proceeds of which are used to reduce the loans. The shares are held in trust for scheme participants by the trustee, Fletcher Building Share Schemes Limited. Payment of half of any entitlement under the long-term share scheme is dependent upon the group's total shareholder return (TSR) achieving or exceeding 50% of the total market cap-weighted TSR performance of a comparative group of companies over a three-year restricted period.
Payment of the other half of any entitlement is dependent upon the group achieving an earnings per share target. Additionally, in respect of the entitlement that is dependent on the group's TSR, the three-year restrictive period is automatically extended for up to one year if the group's TSR is less than 50% of the total market cap-weighted TSR performance of the comparator group. Scheme participants can elect to extend the restrictive period for up to one year if the group's TSR is between the 51st and 75th percentile. No extension is permitted for the entitlement that is dependent upon achieving an earnings per share target.
At the end of the restrictive period or any extension, the group will pay a bonus to the scheme participants to the extent that performance targets have been met, the after-tax amount of which will be generally sufficient for the scheme participants to repay the balance of the loan in respect of the shares that are to be transferred. Owing to the integrated nature of the scheme, for accounting purposes the group accounts for the incentive scheme as being equity-settled. If the performance obligations are not met or are only partially met, the trustee will acquire the beneficial interest in some or all of the relevant shares. The loan provided in respect of those shares that do not transfer to the scheme participants (the forfeited shares) will be novated to the trustee and will be fully repaid by the transfer of the forfeited shares.
The group will recognise an expense in earnings, with a corresponding increase in the share-based payments reserve, over the restrictive period. If the performance targets based on total shareholder return are not met and the legal ownership of the shares does not transfer to the scheme participants, the amount in the share-based payments reserve will remain in equity and will not be released to earnings. If the performance targets based on earnings per share are not met and the shares do not transfer, the amount in the share-based payments reserve will be released to earnings.
The group accounts for the share schemes under the treasury stock method. The receivable owing from scheme participants, representing the shares in the company held by the trustee, is deducted from the group’s paid up capital. The shares are deducted from equity until the end of the restrictive period, at which point they transfer to scheme participants or beneficial ownership of the shares transfers to the trustee.
The following are details with regard to the scheme:
2016Award
2015Award
2014Award
2013Award
Grant date 1 October 2016 1 October 2015 1 October 2014 1 October 2013
Number of shares granted 905,211 3,208,083 815,164 771,038
Market price per share at grant date $10.61 $6.89 $8.79 $9.52
Total value at grant date $9,604,289 $22,103,692 $7,165,291 $7,340,282
Vesting date 30 September 2019 30 September 2018 30 September 2017 30 September 2016
Number of shares:
Number of shares originally granted 905,211 3,208,083 815,164 771,038
Less forfeited over life of scheme (51,346) (586,343) (300,722) (384,770)
Less vested over life of scheme (906) (20,501) (17,479) (207,734)
Number of shares held at 30 June 2017 852,959 2,601,239 496,963 178,534
June 2017NZ$M
June 2016NZ$M
Total fair value expense in year for executive performance share scheme 12 15
Amount recognised at year end for related bonus payable 20 22
Fair value has been determined using Monte Carlo valuation methodology.
95 Fletcher Building Annual Report 2017

Share optionsOn 1 October 2012 the company issued 500,000 options under the executive option scheme to Mark Adamson. At 30 June 2017 the exercise price of these share options was $7.14. The restrictive period ended on 1 October 2015 and the final exercise date was to be 1 October 2018.
On 1 October 2015 the company issued a further 500,000 options under the executive option scheme to Mark Adamson. At 30 June 2017 the exercise price of these share options was $7.22. The restrictive period ends on 1 October 2018 and the final exercise date was to be 1 October 2021.
None of these options have been exercised by Mark Adamson and all 1,000,000 options were forfeited upon his employment as chief executive officer ceasing on 20 July 2017.
Employee share purchase scheme – FBuShareThe global employee share purchase scheme, FBuShare, allows eligible group employees to regularly save up to NZ$5,000 per annum of their after-tax pay and purchase shares in the company (purchased shares) at market prices. At the end of rolling three-year qualification periods, and provided they remain employed by a group company, employees will be awarded one free award share for every two purchased shares acquired in the first year of each three-year qualification period and still held at the end of those periods.
Dividends payable will be re-invested in additional shares. Employees will receive award shares on any additional shares, subject to the same conditions set out above. The employees are responsible for any income tax liability payable on dividends and on the value of any award shares.
At the end of each three-year qualification period, employees may continue to hold any purchased, additional and award shares or they may sell some or all of the shares.
The group accrues the liability to pay for award shares over the three-year qualification periods.
30. Share-based payments continued
96 Fletcher Building Annual Report 2017
Notes to the financial statements 2017

Independent Auditor’s ReportTo the Shareholders of Fletcher Building Limited
REPORT ON THE FINANCIAL STATEMENTS
OPINION We have audited the financial statements of Fletcher Building Limited and its subsidiaries (together “the group”), on pages 55 to 96, which comprise the balance sheet of the group as at 30 June 2017, and the income statement, statement of comprehensive income, statement of movements in equity and statement of cash flows for the year then ended of the group, and notes to the financial statements including a summary of significant accounting policies.
In our opinion, the financial statements on pages 55 to 96 present fairly, in all material respects, the financial position of the group as at 30 June 2017 and its financial performance and its cash flows for the year then ended in accordance with New Zealand equivalents to International Financial Reporting Standards and International Financial Reporting Standards.
This report is made solely to the company’s shareholders, as a body. Our audit has been undertaken so that we might state to the company’s shareholders those matters we are required to state to them in an auditor’s report and for no other purpose. To the fullest extent permitted by law, we do not accept or assume responsibility to anyone other than the company and the company’s shareholders as a body, for our audit work, for this report, or for the opinions we have formed.
BASIS FOR OPINION We conducted our audit in accordance with International Standards on Auditing (New Zealand). Our responsibilities under those standards are further described in the Auditor’s Responsibilities for the Audit of the Financial Statements section of our report.
We are independent of the group in accordance with Professional and Ethical Standard 1 (revised) Code of Ethics for Assurance Practitioners issued by the New Zealand Auditing and Assurance Standards Board, and we have fulfilled our other ethical responsibilities in accordance with these requirements.
We believe that the audit evidence we have obtained is sufficient and appropriate to provide a basis for our opinion.
EY has provided tax advisory, tax compliance and other assurance services to the group. We have no other relationship with, or interest in, Fletcher Building Limited or any of its subsidiaries. Partners and employees of our firm may deal with the group on normal terms within the ordinary course of trading activities of the business of the group.
KEY AUDIT MATTERS Key audit matters are those matters that, in our professional judgement, were of most significance in our audit of the financial statements of the current year. These matters were addressed in the context of our audit of the financial statements as a whole, and in forming our opinion thereon, but we do not provide a separate opinion on these matters. For each matter below, our description of how our audit addressed the matter is provided in that context.
We have fulfilled the responsibilities described in the Auditor’s Responsibilities for the audit of the financial statements section of the audit report, including in relation to these matters. Accordingly, our audit included the performance of procedures designed to respond to our assessment of the risks of material misstatement of the financial statements. The results of our audit procedures, including the procedures performed to address the matters below, provide the basis for our audit opinion on the accompanying financial statements.
97 Fletcher Building Annual Report 2017

Key audit matter How we addressed the key audit matter
RECOGNITION OF CONSTRUCTION CONTRACT REVENUE
A substantial amount of the group’s revenue relates to revenue from construction contracts. Where these contracts have a long-term duration, revenue and margin are recognised based on the stage of completion of individual contracts. This is calculated on the proportion of total costs incurred at the reporting date compared to the group’s estimation of total costs of the contract. We focused on these types of contracts due to the high level of estimation involved, in particular relating to:
• forecasting total cost to complete at initiation of the contract, including the estimation of cost contingencies for contracting risks;
• revisions to total forecast costs for certain events or conditions that occur during the performance of the contract, or are expected to occur to complete the contract; and
• the recognition of variations and claims, based on an assessment by the group as to whether it is probable that the amount will be approved by the customer and therefore recovered.
Refer to note 13 ‘Construction contracts’.
In performing our audit procedures we:
• understood the group’s design of relevant controls in respect of the recognition of revenue from construction. As part of this process we identified controls including:
– the preparation, review and authorisation of monthly valuation reports for construction contracts; and
– the comprehensive project reviews that are undertaken by group management.
• attended a sample of site visits across the group’s sites to enhance our understanding of the group’s contracting processes, the consistency of their application, and to discuss directly with project management the risks and opportunities in relation to individual contracts.
• selected a sample of contracts for testing based on a number of quantitative and qualitative factors which may indicate that a greater level of judgement is required in recognising revenue, including:
– history of issues identified;
– significant unapproved changes; variations and claims;
– delay risk;
– high potential impact and high likelihood of risk events;
– material new contracts;
– high value contracts; and
– loss making contracts.
• For the sample of contracts selected the following procedures were performed:
– obtained an understanding of the contract terms and conditions to evaluate whether these were reflected in the group’s estimate of forecast costs and revenue;
– tested a sample of costs incurred to date and agreed these to supporting documentation;
– assessed the forecast costs to complete through enquiries with project managers and finance personnel;
– tested contractual entitlement for changes, variations and claims recognised within contract revenue to supporting documentation and by reference to the underlying contract;
– evaluated significant exposures to liquidated damages for late delivery of contract works;
– evaluated the probability of recovery of outstanding amounts by reference to the status of contract negotiations, historical recoveries and other supporting documentation; and
– evaluated contract performance in the period since year end to audit opinion date to confirm the group’s year end revenue recognition judgements.
98 Fletcher Building Annual Report 2017
Independent auditor's report

Key audit matter How we addressed the key audit matter
GOODWILL AND OTHER INTANGIBLE ASSETS IMPAIRMENT ASSESSMENTS
The group holds goodwill and other intangible assets which are carried at $1.7 billion at 30 June 2017.
The recoverable amount of goodwill and other intangible assets is determined each reporting period by reference to valuations prepared using discounted cash flow models (‘DCF models’).
DCF models contain significant judgement and estimation in respect of future cash flow forecast, discount rate and terminal growth rate assumptions. Changes in certain assumptions can lead to significant changes in the assessment of the recoverable amount.
Notes 21 and 22 of the financial statements disclose the key assumptions adopted and the sensitivity to reasonable changes in key assumptions which would reduce the recoverable amount and/or create additional impairments at certain cash generating units (‘CGUs’).
In performing our audit procedures we:
• understood the group’s goodwill impairment assessment process and identified controls;
• assessed the group’s determination of CGUs based on our understanding of the nature of the group’s business units;
• obtained the group’s DCF models and agreed amounts to a combination of the board approved FY18 budget and the FY19- FY20 strategic plan;
• assessed key inputs to the DCF models including forecast revenue, costs, capital expenditure, discount rates and terminal growth rates;
• assessed the accuracy of previous group forecasting to inform our evaluation of forecasts included in the DCF models;
• involved our valuation specialists, for those CGUs with a higher risk of impairment, to recalculate the group’s discount rates. Valuation specialists were also involved in assessing the DCF models for valuation methodology, including the treatment of assumptions for capital expenditure, working capital, terminal value and the net present value calculation; and
• performed sensitivity analysis on higher risk CGUs in two main areas being the discount rate and forecast earnings.
TREASURY – DERIVATIVE VALUATION AND HEDGE ACCOUNTING
The group manages its economic risks through the use of derivative financial instruments (‘derivatives’) which primarily consist of interest rate swaps, foreign exchange contracts and cross currency interest rate swaps.
Fair value movements in the derivatives are driven by movement in the financial markets.
These complex transactions may have a significant economic effect and have extensive accounting and reporting obligations.
Note 16 of the financial statements discloses the fair value of the group’s derivative assets and liabilities outstanding at balance date.
In performing our audit procedures we:
• understood the group’s processes and identified its controls for recording, managing and reporting the terms and conditions of its derivatives;
• involved our treasury specialists to evaluate the accuracy with which the group revalues derivatives;
• confirmed the existence of derivatives directly with counterparties at balance date;
• tested the calculation of fair value movements on derivatives during the period to assess whether these movements were appropriately recognised in the Income Statement, the Statement of Comprehensive Income or deferred in accordance with the group’s accounting policy; and
• performed hedge effectiveness testing across a sample of the hedged portfolio to confirm the group’s hedging documentation is in place, accurate and appropriate to support the hedge designation.
99 Fletcher Building Annual Report 2017

INFORMATION OTHER THAN THE FINANCIAL STATEMENTS AND AUDITOR’S REPORTThe directors of the company are responsible for the Annual Report, which includes information other than the financial statements and auditor’s report.
Our opinion on the financial statements does not cover the other information and we do not and will not express any form of assurance conclusion thereon.
In connection with our audit of the financial statements, our responsibility is to read the other information and, in doing so, consider whether the other information is materially inconsistent with the financial statements or our knowledge obtained in the audit, or otherwise appears to be materially misstated.
If, based on the work we have performed on the other information, we conclude that there is a material misstatement of this other information, we are required to report that fact. We have nothing to report in this regard.
DIRECTORS’ RESPONSIBILITIES FOR THE FINANCIAL STATEMENTSThe directors are responsible, on behalf of the entity, for the preparation and fair presentation of the financial statements in accordance with New Zealand equivalents to International Financial Reporting Standards and International Financial Reporting Standards, and for such internal control as the directors determine is necessary to enable the preparation of financial statements that are free from material misstatement, whether due to fraud or error.
In preparing the financial statements, the directors are responsible for assessing the group’s ability to continue as a going concern, disclosing, as applicable, matters related to going concern and using the going concern basis of accounting unless the directors either intend to liquidate the group or to cease operations, or has no realistic alternative but to do so.
AUDITOR’S RESPONSIBILITIES FOR THE AUDIT OF THE FINANCIAL STATEMENTS Our objectives are to obtain reasonable assurance about whether the financial statements as a whole are free from material misstatement, whether due to fraud or error, and to issue an auditor’s report that includes our opinion. Reasonable assurance is a high level of assurance, but is not a guarantee that an audit conducted in accordance with International Standards on Auditing (New Zealand) will always detect a material misstatement when it exists. Misstatements can arise from fraud or error and are considered material if, individually or in the aggregate, they could reasonably be expected to influence the economic decisions of users taken on the basis of these financial statements.
A further description of the auditor’s responsibilities for the audit of the financial statements is located at External Reporting Board’s website: https://www.xrb.govt.nz/standards-for-assurance-practitioners/auditors-responsibilities. This description forms part of our auditor’s report.
The engagement partner on the audit resulting in this independent auditor’s report is Simon O’Connor.
Ernst & YoungAuckland
16 August 2017
100 Fletcher Building Annual Report 2017
Independent auditor's report

Directors’ relevant interests in equity securities at 30 June 2017
Relevant interests at 30 June 2017
ORDINARY SHARES CAPITAL NOTES
M D Adamson1 3,108,278
A J Carter 54,744 150,000
A T Jackson 20,000
J F Judge 58,278 200,000
R J Norris 26,753
K D Spargo 25,000
C Tarrant 24,571
S M Vamos 5,500
Total 3,323,124 350,000¹ Includes 1,000,000 options over ordinary shares, and an interest in 1,061,652 shares under the long-term share scheme, all of which were forfeited upon the end of Mark Adamson’s employment with the company on 20 July 2017.
DIRECTORS’ INTERESTS REGISTER
Directors disclosed, pursuant to section 140 of the Companies Act, the following changes in their interests during the year ended 30 June 2017:
Director Interests disclosed
A J Carter Appointed advisory board member – Capital Training LimitedAppointed director of Foodstuffs Protection Trust
B R Hassall Chairman of The Farmers’ Trading Company LtdDirector of Bank of New Zealand LtdDirector of BNZ Insurance Services LtdDirector of BNZ Life Insurance LtdDirector of Prolife Foods LtdMember of Advisory Board at the University of Auckland Business School
A T Jackson Resigned as director of MBA Partnerships Limited
R J Norris Appointed director of The Parenting Place
K D Spargo Appointed director of ColNVEST Limited (not for profit)Appointed director of Xenith IP LimitedResigned as director of UGL Limited
C Tarrant Resigned as director of SCA Property Group Trustee NZ LimitedAppointed director of Payments NZ LimitedAppointed director of Seeka LimitedAppointed chairman of Government Superannuation Fund Authority
S M Vamos Appointed director of Divvy Parking Limited
101 Fletcher Building Annual Report 2017
Regulatory disclosures

Directors disclosed, pursuant to section 148 of the Companies Act, the following acquisitions and dispositions of relevant interests in Fletcher Building shares during the year ended 30 June 2017:
Name Relevant interests in shares
DATE TRANSACTION NUMBER CONSIDERATION
M D Adamson 12 Oct 2016 Acquisition under DRP 16,405 $173,155
14 Oct 2016 Forfeiture of beneficial interest under share scheme
73,144 502,499
30 Nov 2016 Acquisition of beneficial interest under share scheme
197,285 $2,093,194
12 April 2017 Acquisition under DRP 23,828 $190,386
J F Judge 12 Oct 2016 Acquisition under DRP ¹ 26 $279
12 April 2017 Acquisition under DRP¹ 36 $284
R J Norris 12 Oct 2016 Acquisition under DRP¹ 60 $633
12 April 2016 Acquisition under DRP¹ 81 $642
C Tarrant 12 Oct 2016 Acquisition under DRP 374 $3,944
12 Oct 2016 Acquisition under DRP¹ 43 $446
12 April 2017 Acquisition under DRP 502 $4,013
12 April 2017 Acquisition under DRP1 57 $455¹ Includes non-beneficial interests
Directors disclosed, for the purposes of sections 161 and 162 (as applicable) of the Companies Act, the following interests:
Director Nature of interest
All directors Directors’ and officers’ insurance effected for the period 1 July 2017 – 30 June 2018.
Non-executive directors Payment of director fees to non-executive directors to increase from 1 January 2017. Base director fees to increase to $166,000 and chairman’s remuneration to continue to be paid at a ratio of 2.5 times that of the base fee for non-executive directors, inclusive of the nominations committee fee.
STOCK EXCHANGE LISTINGS
The company’s shares are listed on the Main Board of NZX Limited (NZX) and on the ASX. Fletcher Building changed its listing category on ASX to ASX Foreign Exempt Listing, effective 6 May 2016. Fletcher Building must comply with the NZX Listing Rules but is exempt from almost all of ASX Listing Rules. In accordance with ASX Listing Rule 1.15.3, Fletcher Building confirms that it has complied with the NZX Listing Rules during FY17.
102 Fletcher Building Annual Report 2017
Regulatory disclosures

20 LARGEST SHAREHOLDINGS AS AT 31 JULY 2017
Name Number of Shares % of Shares
New Zealand Central Securities Depository Limited 341,158,752 49.02
HSBC Custody Nominees (Australia) Limited 68,398,002 9.82
JPMorgan Nominees Australia Limited 31,902,251 4.58
National Nominees Limited 25,977,216 3.73
Citicorp Nominees Pty Limited 16,504,052 2.37
FNZ Custodians Limited 10,892,583 1.56
JBWere (NZ) Nominees Limited 6,883,668 0.98
BNP Paribas Nominees Pty Ltd 6,548,040 0.94
Custodial Services Limited 4,697,052 0.67
Citicorp Nominees Pty Limited 4,533,748 0.65
BNP Paribas Noms Pty Ltd 4,241,715 0.60
Southern Steel Group Pty Limited 3,876,365 0.55
New Zealand Depository Nominee Limited 3,199,182 0.45
Forsyth Barr Custodians Limited 2,862,126 0.41
Fletcher Building Share Schemes Limited 2,697,000 0.38
UBS Nominees Pty Limited 2,649,024 0.38
Custodial Services Limited 2,609,522 0.37
Investment Custodial Services Limited 2,335,322 0.33
Navigator Australia Ltd 2,281,746 0.32
PT (Booster Investments) Nominees Limited 2,110,992 0.30
New Zealand Central Securities Depository Limited provides a custodial depository service that allows electronic trading of securities to its members. It does not have a beneficial interest in these shares. Its major holdings of Fletcher Building shares are:
Name Number of Shares % of Shares
HSBC Nominees (New Zealand) Limited 81,667,090 11.74
HSBC Nominees (New Zealand) Limited A/C State Street 67,690,301 9.73
JPMorgan Chase Bank Na NZ Branch-Segregated Clients Acct 54,433,529 7.82
Citibank Nominees (New Zealand) Limited 43,696,822 6.28
Accident Compensation Corporation 18,680,115 2.68
HSBC Nominees A/C NZ Superannuation Fund Nominees Limited 12,530,577 1.80
BNP Paribas Nominees (NZ) Limited 11,708,775 1.68
Guardian Nominees No 2 A/C Westpac W/S Enhanced Cash Trust 8,742,344 1.26
ANZ Wholesale Australasian Share Fund 8,032,845 1.15
BNP Paribas Nominees (NZ) Limited 7,573,148 1.09
TEA Custodians Limited Client Property Trust Account 6,180,006 0.89
ANZ Custodial Services New Zealand Limited 5,237,873 0.75
National Nominees New Zealand Limited 4,689,174 0.67
BNP Paribas Nominees (NZ) Limited 3,083,285 0.44
BNP Paribas Nominees (NZ) Limited 2,230,723 0.32
103 Fletcher Building Annual Report 2017
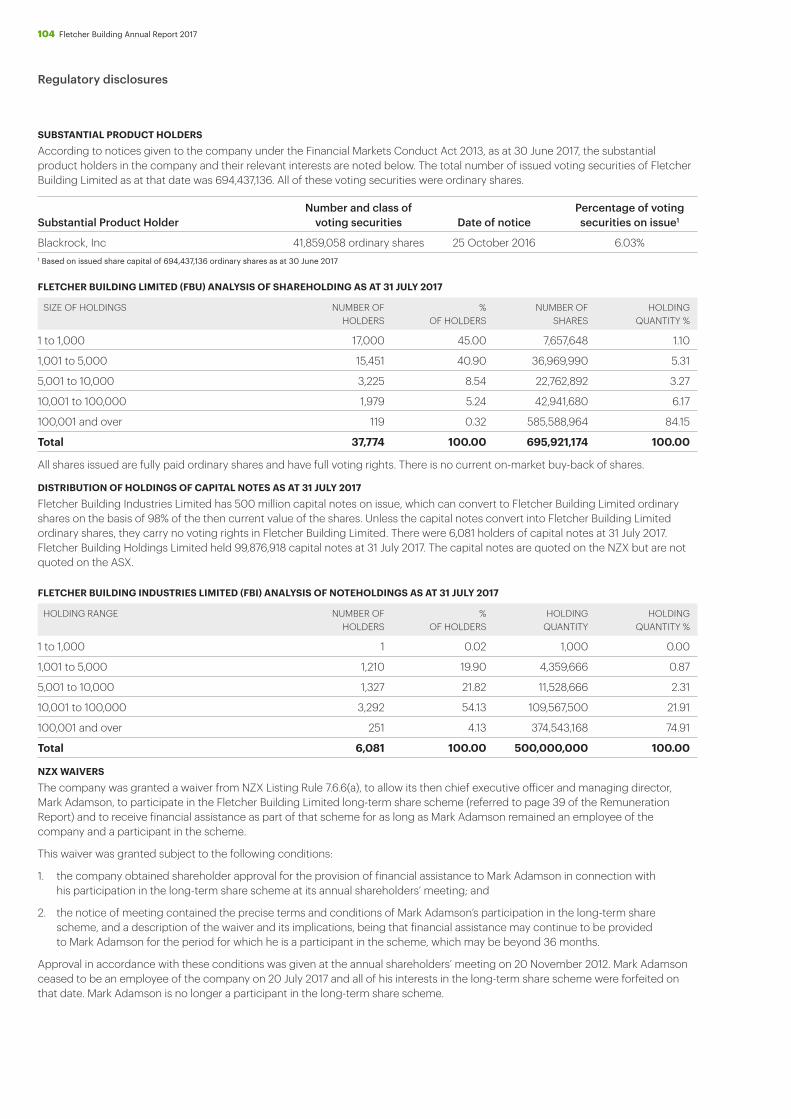
SUBSTANTIAL PRODUCT HOLDERS
According to notices given to the company under the Financial Markets Conduct Act 2013, as at 30 June 2017, the substantial product holders in the company and their relevant interests are noted below. The total number of issued voting securities of Fletcher Building Limited as at that date was 694,437,136. All of these voting securities were ordinary shares.
Substantial Product HolderNumber and class of
voting securities Date of noticePercentage of voting securities on issue1
Blackrock, Inc 41,859,058 ordinary shares 25 October 2016 6.03%1 Based on issued share capital of 694,437,136 ordinary shares as at 30 June 2017
FLETCHER BUILDING LIMITED (FBU) ANALYSIS OF SHAREHOLDING AS AT 31 JULY 2017
SIZE OF HOLDINGS NUMBER OF HOLDERS
% OF HOLDERS
NUMBER OF SHARES
HOLDING QUANTITY %
1 to 1,000 17,000 45.00 7,657,648 1.10
1,001 to 5,000 15,451 40.90 36,969,990 5.31
5,001 to 10,000 3,225 8.54 22,762,892 3.27
10,001 to 100,000 1,979 5.24 42,941,680 6.17
100,001 and over 119 0.32 585,588,964 84.15
Total 37,774 100.00 695,921,174 100.00
All shares issued are fully paid ordinary shares and have full voting rights. There is no current on-market buy-back of shares.
DISTRIBUTION OF HOLDINGS OF CAPITAL NOTES AS AT 31 JULY 2017
Fletcher Building Industries Limited has 500 million capital notes on issue, which can convert to Fletcher Building Limited ordinary shares on the basis of 98% of the then current value of the shares. Unless the capital notes convert into Fletcher Building Limited ordinary shares, they carry no voting rights in Fletcher Building Limited. There were 6,081 holders of capital notes at 31 July 2017. Fletcher Building Holdings Limited held 99,876,918 capital notes at 31 July 2017. The capital notes are quoted on the NZX but are not quoted on the ASX.
FLETCHER BUILDING INDUSTRIES LIMITED (FBI) ANALYSIS OF NOTEHOLDINGS AS AT 31 JULY 2017
HOLDING RANGE NUMBER OF HOLDERS
% OF HOLDERS
HOLDING QUANTITY
HOLDING QUANTITY %
1 to 1,000 1 0.02 1,000 0.00
1,001 to 5,000 1,210 19.90 4,359,666 0.87
5,001 to 10,000 1,327 21.82 11,528,666 2.31
10,001 to 100,000 3,292 54.13 109,567,500 21.91
100,001 and over 251 4.13 374,543,168 74.91
Total 6,081 100.00 500,000,000 100.00
NZX WAIVERS
The company was granted a waiver from NZX Listing Rule 7.6.6(a), to allow its then chief executive officer and managing director, Mark Adamson, to participate in the Fletcher Building Limited long-term share scheme (referred to page 39 of the Remuneration Report) and to receive financial assistance as part of that scheme for as long as Mark Adamson remained an employee of the company and a participant in the scheme.
This waiver was granted subject to the following conditions:
1. the company obtained shareholder approval for the provision of financial assistance to Mark Adamson in connection with his participation in the long-term share scheme at its annual shareholders’ meeting; and
2. the notice of meeting contained the precise terms and conditions of Mark Adamson’s participation in the long-term share scheme, and a description of the waiver and its implications, being that financial assistance may continue to be provided to Mark Adamson for the period for which he is a participant in the scheme, which may be beyond 36 months.
Approval in accordance with these conditions was given at the annual shareholders’ meeting on 20 November 2012. Mark Adamson ceased to be an employee of the company on 20 July 2017 and all of his interests in the long-term share scheme were forfeited on that date. Mark Adamson is no longer a participant in the long-term share scheme.
104 Fletcher Building Annual Report 2017
Regulatory disclosures

Fletcher Building Limited
A CarterA JacksonJ JudgeK SpargoC TarrantR NorrisM AdamsonS VamosB Hassall
AHI Roofing (Malaysia) SDN BHD
I Bin HarunC BoltR AaronD Schulz
AHI Roofing (Middle East) Limited
G Bollman (R)C BoltF IrazustaB McKenzie
AHI Roofing Gyarto Es Kereskedelmi Korlatolt Felelossegu Tarasag
O Pascutiu (R)C BoltD Schulz
AHI Roofing Limited
G Bollman (R)C BoltF IrazustaB McKenzie
AHI Roofing Proizvodnja In Distribucija Stresnih Sistemov D.O.O.
O Pascutiu (R)C BoltK Szekeres
SUBSIDIARIES
Section 211(2) of the New Zealand Companies Act 1993 requires the company to disclose, in relation to its subsidiaries, the total remuneration and value of other benefits received by directors and former directors and particulars of entries in the interests registers made during the year ended 30 June 2017.
No employee of Fletcher Building appointed as a director of Fletcher Building Limited or its subsidiaries receives or retains any remuneration or other benefits, as a director. The remuneration and other benefits of such employees, received as employees, are included in the relevant bandings for remuneration disclosed under Employee Remuneration.
Except where shown below, no other director of any subsidiary company within the group receives director’s fees or other benefits as a director.
The persons listed below respectively held office as directors of Fletcher Building Limited and its subsidiary companies as at 30 June 2017 or in the case of those persons with the letter (R) after their name ceased to hold office during the year. Alternate directors are indicated by the letter (A) after their name.
Except where shown below, Fletcher Building's indirect ownership interest as at 30 June 2017 was 100%.
Amatek Holdings Pty Limited
D Le Quesne (R)G Bollman (R)S Lo RiccoB McKenzie
Amatek Industries Pty Limited
D Le Quesne (R)G Bollman (R)S Lo RiccoB McKenzie
Amatek Investments Pty Limited
D Le Quesne (R)G Bollman (R)S Lo RiccoB McKenzie
Approach Signs Limited
C BoltB McKenzieG Darlow (R)M Kernahan
Austral Bronze Crane Copper Pty Limited
G Bollman (R)S Lo RiccoN Sumich (R)B McKenzie
Australian Construction Products Pty Limited
C BoltM Lukban (R)B Nicholson
Australian Fibre Glass Pty Limited
D Le QuesneS Lo Ricco
Bandelle Pty Limited
D Le QuesneS Lo Ricco
Baron Insulation Pty Ltd
G Bollman (R)J HollisB McKenzie
Boden Building Supplies Limited (65%)
P BodenD FradgleyB McEwen
Building Choices Limited (75%)
D CloseD FradgleyB McEwen
Building Prefabrication Solutions Limited
G Bollman (R)D FradgleyB McKenzie
Cameron Building Supplies Limited (75%)
D CameronD FradgleyB McEwen
Caravan Components Pty Limited
D Le QuesneS Lo Ricco
Cleaver Building Supplies Limited (60%)
M CleaverD FradgleyB McEwen
Consort Laminates Limited
P Hall (R)N MasonP Rush
Crane Enfield Metals Pty Limited
G Bollman (R)S Lo RiccoB McKenzie
Crane Group Pty Limited
D Le Quesne (R)G Bollman (R)S Lo RiccoB McKenzie
Crevet Pty Ltd
G Bollman (R)S Lo RiccoN Sumich (R)B McKenzie
Crevet Pipelines Pty Ltd
G Bollman (R)N SumichB McKenzie
CTCI Pty Limited (80%)
E WoldhuisG Bollman (R)A WebsterM Kernahan (R)B McKenzieG Andrew (A)
Cullen Building Supplies Limited
R Cullen (R)D Fradgley
Davis & Casey Building Supplies Limited (65%)
T DavisD FradgleyB McEwen
Decra Roofing Systems, Inc.
G Bollman (R)C Bolt (R)D SchulzB McKenzieF Irazusta
Delcon Holdings (No. 1) Limited
G Bollman (R)C BoltB McKenzie
Delcon Holdings (No. 2) Limited
G Bollman (R)C BoltB McKenzie
Delcon Holdings (No. 3) Limited
G Bollman (R)C BoltB McKenzie
Delcon Holdings (No. 8) Limited
G Bollman (R)C BoltM CrockettB McKenzie
Delcon Holdings (No. 11) Limited
G Bollman (R)C BoltD FradgleyB McKenzie
ee-Fit Pty Limited
G Bollman (R)J HollisB McKenzie
EFA Technologies Pty Limited
C BoltS Lo Ricco
Evans Building Supplies Limited
M Evans (R)D Fradgley
105 Fletcher Building Annual Report 2017
Company and subsidiary directors and company ownership interests

FBHS (Aust) Pty Limited
G Bollman (R)P TudorB McKenzie
FBII (Puhoi) Limited
C BoltB McKenzieG Darlow (R)M Kernahan
FBII (Schools 3) Limited
C BoltB McKenzieG Darlow (R)M Kernahan
FBSOL Pty Limited
G Bollman (R)P TudorB McKenzie
Fletcher Building (Australia) Pty Limited
D Le QuesneG Bollman (R)C BoltS Lo RiccoB McKenzie
Fletcher Building (Fiji) Limited
A KumarC WhiteA Brown (R)C BoltB Leach
Fletcher Building Holdings Limited
G Bollman (R)C BoltB McKenzie
Fletcher Building Holdings New Zealand Limited
G Bollman (R)C BoltB McKenzie
Fletcher Building Holdings USA Inc.
M QuintG Bollman (R)B McKenzie
Fletcher Building Industries Limited
A CarterA JacksonJ JudgeK SpargoC TarrantR NorrisM AdamsonS VamosB Hassall
Fletcher Building Infrastructure Investments Limited
C BoltB McKenzieG Darlow (R)M Kernahan
Fletcher Building Nominees Limited
J McDonaldG NiccolM FarrellC MunkowitsJ ChapmanP Demarie-CrookH McKenzie
Fletcher Building Products Limited
G Bollman (R)C BoltM CrockettB McKenzie
Fletcher Building Products Australia Pty Limited
G Bollman (R)S Lo RiccoB McKenzie
Fletcher Building Share Schemes Limited
G NiccolJ McDonald
Fletcher Building Trading (Shanghai) Company Limited
C Rawlinson (R)P Wilson (R)G Bollman (R)C BoltL FinneyP KreutzS Lewis
Fletcher Challenge Building Bolivia S.A.
M BinnsK CowieH Ritchie
Fletcher Challenge Building UK Limited
J Ollard (R)N MasonP Foreman
Fletcher Challenge Finance Investments Limited
C BoltG Bollman (R)B McKenzie
Fletcher Challenge Forest Industries Limited
M August (R)J Ollard (R)N MasonP Foreman
Fletcher Challenge Industries S.A.
M BinnsK CowieH Ritchie
Fletcher Concrete (Fiji) Limited
A KumarA Brown (R)C WhiteC BoltB Leach
Fletcher Concrete and Infrastructure Limited
G Bollman (R)C BoltM CrockettB McKenzie
Fletcher Construction (Nouvelle Caledonie) S.A.R.L.
A Brown
Fletcher Construction (Solomon Islands) Limited
A BrownC White
Fletcher Construction Company (Fiji) Limited
A Brown (R)J MatthewsB Leach
Fletcher Distribution Limited
C BoltD FradgleyG Bollman (R)B McEwenB McKenzie
Fletcher Insulation Pty Limited
J HollisG Bollman (R)B McKenzie
Fletcher Morobe Construction Limited
A BrownK FletcherL Mathias
Fletcher Property Developments UK Limited
M August (R)J Ollard (R)N MasonP Foreman
Fletcher Property Investments UK Limited
M August (R)J Ollard (R)N MasonP Foreman
Fletcher Property Limited
G Bollman (R)C BoltB McKenzie
Fletcher Residential Limited
G Bollman (R)C BoltS EvansB McKenzie
Fletcher Steel Limited
G Bollman (R)C BoltD FradgleyB McKenzie
FM Holdings Inc.
L BoxM QuintG Bollman (R)F IrazustaB McKenzie
Forman Building Systems Limited
G Bollman (R)C BoltD FradgleyB McKenzie
Forman Group Limited
G Bollman (R)C BoltD FradgleyG Darlow (R)B McKenzieM Kernahan
Forman Manufacturing Limited
G Bollman (R)C BoltD FradgleyB McKenzie
Formica (Asia) Ltd
C Rawlinson (R)P Wilson (R)D RenM KhanJ Michel
Formica (China) Trading Co., Ltd
C Rawlinson (R)P Wilson (R)P ListM KhanJ Michel
Formica (Malaysia) Sdn. Bhd.
J Yang (R)C Chiu (R)C Rawlinson (R)P Wilson (R)S Muangmek (R)CH HengJ MichelD WongM Khan
Formica (Singapore) Pte. Ltd
C Chang (R)C Rawlinson (R)P Wilson (R)N TayC Chen(R)M KhanJ MichelD Wong
Formica (Thailand) Co., Ltd (94.99%)
W KunanantakulS MahacharoenkeatC Rawlinson (R)P Wilson (R)M KhanJ Michel
Formica Canada Inc.
L Box C SarrazinM Quint
Formica Corporation
M AdamsonL BoxM QuintG Bollman (R)B McKenzieF Irazusta
Formica Danmark A/S
I DelenN MasonP Foreman
Formica de Mexico SA DE CV
L Box M QuintB Strobel
Formica Decorative Materials (China) Co. Ltd
C Rawlinson (R)P Wilson (R)P ListM KhanJ Michel
Formica Finance Limited
P Hall (R)N Mason R PollingtonP Rush
Formica Global LLC
L BoxM QuintB StrobelR Rosado Jr.
Formica Holdco UK Limited
P Hall (R)N MasonR PollingtonP Rush
106 Fletcher Building Annual Report 2017
Company and subsidiary directors

Formica Holdings B.V.
L BoxS Lo Ricco
Formica Holding Corp.
L BoxM QuintG Bollman (R)F IrazustaB McKenzie
Formica Holding GmbH
H BenderK Vollmer
Formica Holdings Limited
P Hall (R)N Mason R PollingtonP Rush
Formica II Corporation
L BoxM QuintG Bollman (R)F IrazustaB McKenzie
Formica Iki Oy
R PollingtonN MasonL Box P Foreman
Formica International LLC
L BoxM QuintB StrobelR Rosado Jr.
Formica Korea Corporation
T RenC Rawlinson (R)P Wilson
Formica Laminates (India) Private Limited
L Box N MasonR PollingtonS Bidani
Formica Limited
L BoxP ForemanP Hall (R)N MasonR PollingtonG Bollman (R)B McKenzieP Rush
Formica B.V. (previously Formica Middle East B.V.)
N MasonP Foreman
Formica Norge A/S
I DelenN Mason
Formica PSM Limited
P Hall (R)N MasonP Rush
Formica S.A. (Spain)
P Hall (R)H RuloffsN Mason
Formica S.A.S (France) (99.99%)
N MasonP ForemanF Irazusta
Formica Skandinavien AB
I DelenN Mason
Formica SP.zo.O.
N MasonP Foreman
Formica Taiwan Corporation
T RenC Rawlinson (R)P Wilson (R)M KhanJ Michel
Gatic Pty Limited
G Bollman (R)N SumichB McKenzie
Geoff Brown Building Supplies Limited (75%)
G BrownD FradgleyB McEwen
Geraldton Independant Building Supplies Pty Limited
G Bollman (R)M Kernahan (R)A Webster (R)B McKenzieJ Burgess
Graeme Joy Building Supplies Limited (65%)
G JoyD FradgleyB McEwen
Gravure et Polissage de Surfaces Metalliques (99.88%)
N MasonP Foreman
Higgins Contractors Limited
C BoltB McKenzieG Darlow (R)M Kernahan
Higgins Group Holdings Limited
C BoltB McKenzieG Darlow (R)M Kernahan
Homapal GmbH
H Bender
Home&Dry Limited
G Bollman (R)C BoltM CrockettB McKenzie
Iplex Pipelines Australia Pty Limited
G Bollman (R)N SumichB McKenzie
Iplex Pipelines NZ Limited
C Bolt G Bollman (R)M CrockettB McKenzie
Iplex Properties Pty. Limited
G Bollman (R)N SumichB McKenzie
Jeffcoats Building Supplies Ltd (83%)
B McEwenD FradgleyR Jeffcoat
John Cockburn Building Supplies Limited
J Cockburn (R)D FradgleyB McEwen
Kemsley Fields Limited (56.8%)
D GibsonJ Ollard (R)R SmothersN Mason
Ken Jones Building Supplies Limited
K Jones (R)D FradgleyB McEwen
Kenna Building Supplies Limited (75%)
L KennaD FradgleyB McEwen
Key Plastics Pty. Ltd.
G Bollman (R)N SumichB McKenzie
Kimura Building Supplies (2016) Limited (75%)
J KimuraD FradgleyB McEwen
Kingston Bridge Engineering Pty Ltd
G Bollman (R)N SumichB McKenzie
Kinsey Kydd Building Supplies Limited (75%)
S KinseyD FradgleyB McEwen
Koning Building Supplies Limited (75%)
J KoningD FradgleyB McEwen
Kusabs Building Supplies Limited (75%)
G KusabsD FradgleyB McEwen
Laminates Acquisition Co.
L BoxM Quint G Bollman (R)F IrazustaB McKenzie
Laminates Holdings Pty Limited
G Bollman (R)M Kernahan (R)A Webster (R)J BurgessB McKenzie
Laminex Finance Pty Limited
D Le QuesneS Lo Ricco
Laminex Group (N.Z.) Limited
G Bollman (R)C BoltF IrazustaB McKenzie
Laminex Group Pty Limited
G Bollman (R)M Kernahan (R)B McKenzieA Webster (R)J Burgess
Laminex Overseas Holdings Pty Limited
D Le QuesneS Lo Ricco
Laminex US Holdings Pty Limited
D Le QuesneS Lo Ricco
Leary Building Supplies Limited (75%)
B LearyD FradgleyB McEwen
Macready Building Supplies Limited (60%)
J MacreadyD FradgleyB McEwen
Master Roads and Services Limited (51%)
G Darlow (R)M KernahanK Lotu-ligaD GeorM HallT Heyward
Matt Orr Building Supplies Limited (75%)
M OrrD FradgleyB McEwen
Mico New Zealand Limited
D FradgleyG Bollman (R)C BoltB McKenzie
Milnes Holdings Limited
G Bollman (R)N Sumich (R)S Lo RiccoB McKenzie
Monday Company Limited
D Hargovind (FJ$2,500)I JonesA Kumar
Morinda Australia Pty Limited
G Bollman (R)P TudorB McKenzie
New Zealand Ceiling & Drywall Supplies Limited (90%)
D ThomasC Bolt
Ngapo-Kimura Building Supplies Limited
J Ngapo-Kimura (R)D FradgleyB McEwen
107 Fletcher Building Annual Report 2017
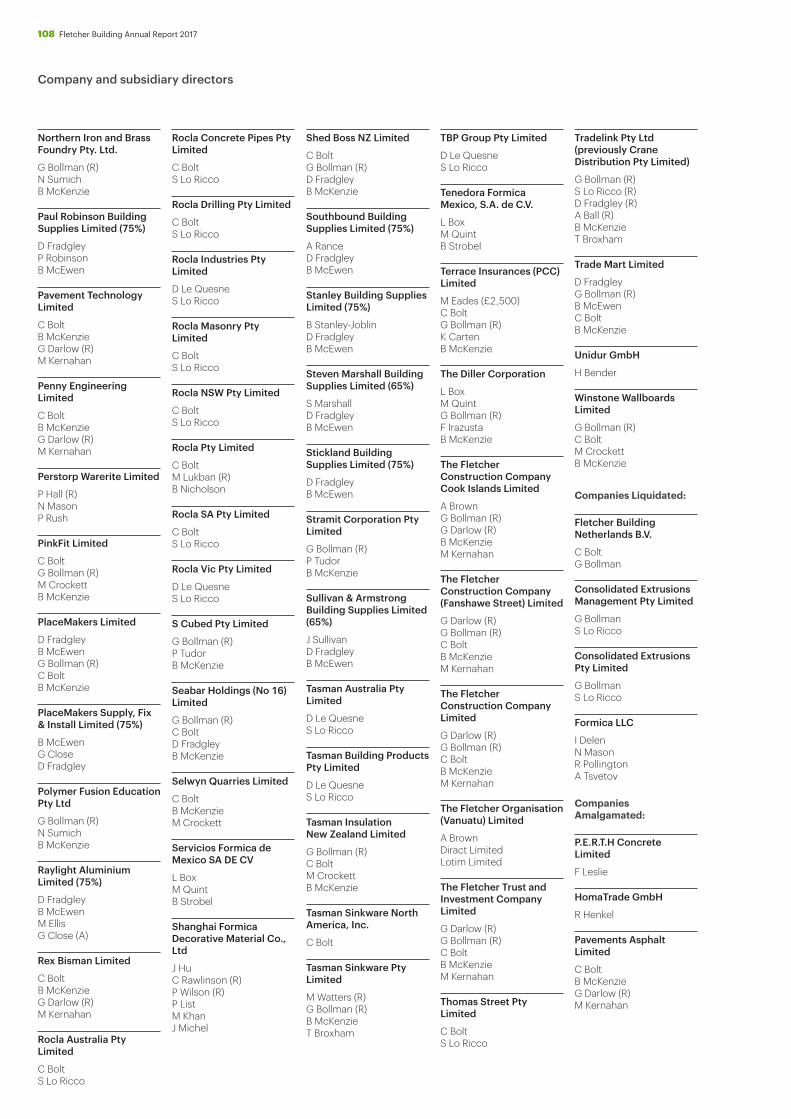
Northern Iron and Brass Foundry Pty. Ltd.
G Bollman (R)N SumichB McKenzie
Paul Robinson Building Supplies Limited (75%)
D FradgleyP RobinsonB McEwen
Pavement Technology Limited
C BoltB McKenzieG Darlow (R)M Kernahan
Penny Engineering Limited
C BoltB McKenzieG Darlow (R)M Kernahan
Perstorp Warerite Limited
P Hall (R)N Mason P Rush
PinkFit Limited
C Bolt G Bollman (R)M CrockettB McKenzie
PlaceMakers Limited
D FradgleyB McEwenG Bollman (R)C BoltB McKenzie
PlaceMakers Supply, Fix & Install Limited (75%)
B McEwenG CloseD Fradgley
Polymer Fusion Education Pty Ltd
G Bollman (R)N SumichB McKenzie
Raylight Aluminium Limited (75%)
D FradgleyB McEwenM EllisG Close (A)
Rex Bisman Limited
C BoltB McKenzieG Darlow (R)M Kernahan
Rocla Australia Pty Limited
C BoltS Lo Ricco
Rocla Concrete Pipes Pty Limited
C BoltS Lo Ricco
Rocla Drilling Pty Limited
C BoltS Lo Ricco
Rocla Industries Pty Limited
D Le Quesne S Lo Ricco
Rocla Masonry Pty Limited
C BoltS Lo Ricco
Rocla NSW Pty Limited
C BoltS Lo Ricco
Rocla Pty Limited
C BoltM Lukban (R)B Nicholson
Rocla SA Pty Limited
C BoltS Lo Ricco
Rocla Vic Pty Limited
D Le QuesneS Lo Ricco
S Cubed Pty Limited
G Bollman (R)P TudorB McKenzie
Seabar Holdings (No 16) Limited
G Bollman (R)C BoltD FradgleyB McKenzie
Selwyn Quarries Limited
C BoltB McKenzieM Crockett
Servicios Formica de Mexico SA DE CV
L Box M QuintB Strobel
Shanghai Formica Decorative Material Co., Ltd
J HuC Rawlinson (R)P Wilson (R)P ListM KhanJ Michel
Shed Boss NZ Limited
C BoltG Bollman (R)D FradgleyB McKenzie
Southbound Building Supplies Limited (75%)
A RanceD FradgleyB McEwen
Stanley Building Supplies Limited (75%)
B Stanley-JoblinD FradgleyB McEwen
Steven Marshall Building Supplies Limited (65%)
S MarshallD FradgleyB McEwen
Stickland Building Supplies Limited (75%)
D FradgleyB McEwen
Stramit Corporation Pty Limited
G Bollman (R)P TudorB McKenzie
Sullivan & Armstrong Building Supplies Limited (65%)
J SullivanD FradgleyB McEwen
Tasman Australia Pty Limited
D Le QuesneS Lo Ricco
Tasman Building Products Pty Limited
D Le QuesneS Lo Ricco
Tasman Insulation New Zealand Limited
G Bollman (R)C BoltM CrockettB McKenzie
Tasman Sinkware North America, Inc.
C Bolt
Tasman Sinkware Pty Limited
M Watters (R)G Bollman (R)B McKenzieT Broxham
TBP Group Pty Limited
D Le QuesneS Lo Ricco
Tenedora Formica Mexico, S.A. de C.V.
L Box M QuintB Strobel
Terrace Insurances (PCC) Limited
M Eades (£2,500)C BoltG Bollman (R)K CartenB McKenzie
The Diller Corporation
L BoxM QuintG Bollman (R)F IrazustaB McKenzie
The Fletcher Construction Company Cook Islands Limited
A BrownG Bollman (R)G Darlow (R)B McKenzieM Kernahan
The Fletcher Construction Company (Fanshawe Street) Limited
G Darlow (R)G Bollman (R)C BoltB McKenzieM Kernahan
The Fletcher Construction Company Limited
G Darlow (R)G Bollman (R)C BoltB McKenzieM Kernahan
The Fletcher Organisation (Vanuatu) Limited
A BrownDiract LimitedLotim Limited
The Fletcher Trust and Investment Company Limited
G Darlow (R)G Bollman (R)C BoltB McKenzieM Kernahan
Thomas Street Pty Limited
C BoltS Lo Ricco
Tradelink Pty Ltd (previously Crane Distribution Pty Limited)
G Bollman (R)S Lo Ricco (R)D Fradgley (R)A Ball (R)B McKenzieT Broxham
Trade Mart Limited
D FradgleyG Bollman (R)B McEwenC BoltB McKenzie
Unidur GmbH
H Bender
Winstone Wallboards Limited
G Bollman (R)C BoltM CrockettB McKenzie
Companies Liquidated:
Fletcher Building Netherlands B.V.
C BoltG Bollman
Consolidated Extrusions Management Pty Limited
G BollmanS Lo Ricco
Consolidated Extrusions Pty Limited
G BollmanS Lo Ricco
Formica LLC
I DelenN MasonR PollingtonA Tsvetov
Companies Amalgamated:
P.E.R.T.H Concrete Limited
F Leslie
HomaTrade GmbH
R Henkel
Pavements Asphalt Limited
C BoltB McKenzieG Darlow (R)M Kernahan
108 Fletcher Building Annual Report 2017
Company and subsidiary directors

Investor information
As at 30 June 2017, Fletcher Building held an indirect ownership interest in the following associates and joint ventures
COMPANY NAME OWNERSHIP %
Altera Apartments General Partner Ltd 50%
Altus NZ Ltd 50%
Bellus Apartments General Partner Ltd 50%
Byfords Readi-Mix Ltd 50%
Cromwell Certified Concrete Ltd 50%
Dongwha New Zealand Ltd 50%
Greenraft Ltd 33%
Hexion Australia Pty Ltd 50%
Ilico Apartments General Partner Ltd 50%
Interpipe Holdings Limited 50%
JFC Pumps Ltd 50%
ANNUAL SHAREHOLDERS’ MEETING
The annual shareholders’ meeting of Fletcher Building Limited will be held at the Auckland War Memorial Museum, Event Centre, Level 3, at 10.30am on Wednesday 25 October 2017.
FINAL DIVIDEND INFORMATION
The company has declared a final dividend for the year of 19 cents per share payable on 11 October 2017. This is in addition to the interim dividend of 20 cents per share paid on 12 April 2017. The final dividend has imputation credits attached at a 28% tax rate. There are no Australian franking credits attached.
DIVIDEND REINVESTMENT PLAN
Fletcher Building shareholders (excluding those in jurisdictions where the issue of shares is not permitted by law) can participate in a Dividend Reinvestment Plan, under which they have the opportunity to reinvest their dividends in additional shares. To participate, please contact the share registry. The Dividend Reinvestment Plan will operate for the FY17 final dividend. Your election notice must be received by the share registry by no later than 25 September 2017 in order to participate in the Dividend Reinvestment Plan in respect of the FY17 final dividend.
FURTHER INFORMATION ONLINE
Details on Fletcher Building, its governance policies, and its operations for the year ended 30 June 2017 can be viewed on the Fletcher Building website at fbu.com. This website contains all announcements to NZX and ASX and financial presentations made by the company.
SHAREHOLDER COMMUNICATIONS
The company is not required to send printed copies of the annual report and half year review to shareholders. Instead, Fletcher Building sends an annual review which is a summary of the company’s operational and financial activities for the year. Shareholders can view the annual report and half year review on the company’s website. In addition, shareholders have a right to receive a copy of these reports on request.
DIRECT CREDITING OF DIVIDENDS
To minimise the risk of fraud and misplacement of dividend cheques, we strongly recommend that shareholders have all payments made by way of direct credit to their nominated New Zealand or Australian bank account. This can be done by simply giving the share registry written notice.
SHARE REGISTRIES
Details of the company’s share registries are given in the Directory on the inside back cover of this report.
Shareholders with enquiries about share transactions, changes of address or dividend payments should contact the share registry in the country in which their shares are registered.
COMPANY NAME OWNERSHIP %
Kaipara Water Transport Ltd 25%
Oamaru Shingle Supplies Ltd 33%
Rangitikei Aggregates Ltd 50%
Regional Resources NW Pty Ltd 50%
Rodney Aggregates Supplies Ltd 50%
Saltus Apartments General Partner Ltd 50%
Sims Pacific Metals Ltd 50%
South Pacific Cement Limited 14.85%
Trench Shoring New Zealand Ltd 50%
Verto Apartments General Partner Ltd 50%
Wespine Industries Pty Ltd 50%
109 Fletcher Building Annual Report 2017
Associates and joint ventures
Registered offices
Fletcher Building Limited
In New Zealand:Fletcher Building LimitedPrivate Bag 92 114Auckland 1142New Zealand
Fletcher House 810 Great South RoadPenrose, Auckland 1061New ZealandT. +64 9 525 9000
In Australia:Locked Bag 3501North Ryde BCNSW 1670, Australia
Level 468 Waterloo RoadMacquarie Park, NSW 2113, AustraliaT. +61 2 8986 0900ARBN 096 046 936
Shareholder enquiriesChanges of address, payment instructions and investment portfolios can be viewed and updated online: investorcentre.com/nzEnquiries may be addressed to the Share Registrar, Computershare Investor Services:
New ZealandComputershare Investor Services LimitedPrivate Bag 92 119Auckland 1142New Zealand
Level 2, 159 Hurstmere RoadTakapuna, Auckland 0622New ZealandT. +64 9 488 8777F. +64 9 488 8787E. [email protected]
AustraliaComputershare Investor Services Pty LimitedGPO Box 3329Melbourne, VIC 3001, Australia
Yarra Falls, 452 Johnston StreetAbbotsford, VIC 3067, AustraliaT. 1800 501 366 (within Australia)T. +61 3 9415 4083 (outside Australia)F. +61 3 9473 2500
Other investor enquiriesFletcher Building LimitedPrivate Bag 92 114Auckland 1142, New ZealandT. +64 9 525 9000E. [email protected]
Company secretaryCharles Bolt
Other informationfbu.com
110 Fletcher Building Annual Report 2017
Directory

insightcreative.co.nz
FL
E07
1
