building better · with a 75-year history of driving innovation in metalworking and maintenance,...
TRANSCRIPT

2016 ANNUAL REPORT
BUILDINGBETTER

BUILDING BETTER With a 75-year history of driving innovation in metalworking and maintenance,
repair and operations (MRO) product distribution and services, MSC continues to
expand its role well beyond selling industrial supplies.
We help our customers drive greater productivity, profitability and growth with more than one million
products, inventory management and other supply chain solutions, and deep expertise across indus-
tries. Our experienced team of more than 6,000 associates is dedicated to working side by side with
our customers to help drive results for their businesses—from keeping operations running efficiently
today to continuously rethinking, retooling and optimizing for a more productive tomorrow.
Financial Highlights2.00
2.25
2.50
2.75
3.00
201620152014
$2.00
$2.25
$2.50
$2.75
$3.00
201620152014
NET SALES (IN BILLIONS)
300
325
350
375
400
201620152014
$300
$325
$350
$375
$400
201620152014
OPERATING INCOME (IN MILLIONS)
NET SALES (IN BILLIONS) OPERATING INCOME (IN MILLIONS)
0
100
200
300
400
500
201620152014
$100
0
$200
$300
$400
$500
201620152014
CASH FLOW FROM OPERATIONS (IN MILLIONS)
3.5
3.6
3.7
3.8
201620152014
$3.50
$3.60
$3.70
$3.80
201620152014
DILUTED EARNINGS PER SHARE
CASH FLOW FROM OPERATIONS (IN MILLIONS)
DILUTED EARNINGS PER SHARE

MSC Industrial Supply Co. 1
Erik Gershwind, President and Chief Executive Officer
Dear Shareholders,
Since our humble beginning in 1941 when my grandfa-
ther Sid Jacobson founded MSC, our focus has been
on enabling our customers to drive greater productivity,
profitability and growth. Our business has transformed
dramatically over the years as we have evolved to
address the changing needs of our customers and the
markets that we serve. Today, we continue to build
on our rich history, affirming our commitment to our
customers, suppliers, shareholders, associates and the
communities in which we live and work. Our vision,
however, remains the same—to drive results for our
customers’ businesses, from keeping operations running
efficiently today to continuously rethinking, retooling
and optimizing for a more productive tomorrow.
In fiscal 2016, we continued to execute against our key
priorities, delivering a diversified, high-quality range of
products, services and solutions to our customers. Our
ability to partner with our customers and help them
maximize their returns on spend and enhance supply
chain efficiencies has become increasingly important
and central to our success, particularly given the chal-
lenged macroeconomic backdrop of recent years.
Over the past year, we generated results reflective of
solid execution and our commitment to operational
excellence despite the ongoing headwinds of an
extremely difficult demand environment and soft pric-
ing, which have been primarily driven by the ongoing
effects of low oil prices and the strong U.S. dollar on
the manufacturing economy. Against the backdrop
of these challenges, our performance in fiscal 2016
was highlighted by the following developments: First,
we continued our share gains, building on our leader-
ship position in metalworking, as well as developing a
leadership position in our Class C inventory business.
Second, we achieved sustained gross margin stabiliza-
tion even in the face of a very soft price environment.
Third, we realized significant benefits from our pro-
ductivity initiatives and strong expense controls, lean-
ing out our cost structure and significantly improving
the leverage in our business model. Also, we did not
take our eye off the future and the exciting growth
opportunities that we see ahead. We continued to
invest in our growth programs and foster the talent,
resources, portfolio and infrastructure required to
address the ever-evolving needs of our customers.
Efficient, rapid distribution of the products that our
customers need to keep their businesses running is
core to our business, as is delivering expertise in
streamlining procurement and optimizing inventory
management. We continue to grow into these exciting
opportunities, leveraging the market-leading experience
of our team to not only meet this need, but also to
anticipate emerging demands and shape the trends of
tomorrow. We are proud of the success that we have
had in enhancing our e-commerce platforms, expanding
our vending network, and leveraging new technologies
to streamline distribution.
Our customers recognize the advantage of working
with an industry leader such as MSC as we enable our
customers to drive efficiency and productivity across
their businesses. Our solutions approach is core to a
value proposition at MSC that smaller competitors
simply cannot match. This focus has served us well in
strengthening our customer relationships across our
history, and is continuing to pay dividends as others
turn to us for the same support. In this way, we will
propel our performance when industry growth returns.
In addition to investing in our product and service
offering to support our customers, we continue work-
ing to deliver attractive returns for our shareholders.

Looking back on fiscal 2016, we would like to thank
our customers for looking to our team at MSC to help
drive their growth and our partners for working closely
with us to provide the best solutions and products
available in the market. We also would like to recog-
nize our associates who have worked tirelessly this
year to serve our customers, deliver share gains, and
lead our ongoing drive to operational excellence. The
changes that our people are making to our business
continue to strengthen our position in the markets
that we serve. As we look to the future, it is the drive,
ingenuity and expertise of our associates that give us
great confidence. Finally, we thank our shareholders
for supporting our vision for the Company.
Respectfully,
Erik Gershwind
President and Chief Executive Officer
2 2o16 Annual Report
BUILDING PRODUCTIVE PARTNERSHIPS We’re only successful when our key stakeholders win. That’s why we’re focused on building productive partnerships that lift others to new heights.
Our associates share their rich expertise and insight not only to keep our customers’ manufacturing
operations up and running, but to improve their efficiency and performance. Whether it’s a small shop
that needs smart business solutions to help them compete, a mid-sized business looking to improve pro-
ductivity, or a large company working to reduce total cost of ownership, we partner to solve their toughest
MRO and operational challenges. We also are dedicated to driving the growth and success of our supplier
partners, developing and enabling our talented associates so they can realize their full potential, and
improving the quality of life for others in the many communities where we operate. As we do these
things, we contribute to a successful industrial economy. Sound like we’re more than an industrial
supply company? We strive to be, but it’s more meaningful to hear what some of our stakeholders say
about partnering with MSC:
Our actions to stabilize gross margins and reduce
operating costs enabled us to slightly improve our
Operating Margin to 13.1% despite the significant head-
wind of lower sales. This year marked our thirteenth
year of distributing quarterly dividends, with dividend
growth every year. In all, we distributed a total of $106
million in dividends over the full fiscal year 2016 and
we repurchased a total of 5.3 million shares primarily
through the Dutch tender completed in the third quarter.
Between dividends and share buybacks, we returned
nearly $500 million to our shareholders in fiscal 2016
and we remain committed to a balanced capital allo-
cation strategy going forward.
In fiscal 2017, we will remain diligent in managing those
levers under our control to drive profitability and pro-
mote efficiency and productivity across the business.
Even as we confront ongoing softness in pricing and
demand against the backdrop of challenged end mar-
kets, we are confident in our position and ability to
achieve growth when conditions improve.

Joe Gibbs Racing (JGR) is one of the winningest teams in NASCAR with four NASCAR champion-ships over the past two decades. JGR builds its cars from the ground up each week, with 90 per-cent of the parts manufactured in-house. That’s cutting a lot of metal, so getting the part right every time is critical to winning races. JGR relies on MSC’s metalworking experts to be part of its crew, providing the right products and technical support. MSC also has helped JGR reduce its on-site inventory and costs through customized vending and inventory management solutions.
“ MSC is right here by our side providing product and technical support—and a compet-itive edge to help us win races.”
Providing manufacturing customers with the right industrial supplies and solutions is often about having relationships with top suppliers. As Kennametal’s top metalworking distributor, MSC has worked hand-in-glove with Kennametal to deliver big cost savings to customers for years. In one case, MSC and Kennametal analyzed a customer’s processes and recommended an entirely new tool design customized to the client’s exacting needs. The new design reduced tool wear, improved cutting rates and resulted in tooling savings of more than $175,000 annu-ally. The MSC-Kennametal team also staged a half-day training seminar to ensure the customer received optimum performance from the new tool design.
“MSC has taken our relationship from good to great.”
Mark BringleDirector, Technical Sponsorship & MarketingJoe Gibbs Racing
“MSC helps us win races.”
Longer-Lasting Tools…and Relationships
Chuck ByrnesVice President, Kennametal Inc. &
President, Industrial Segment
MSC Industrial Supply Co. 3

MSC’s goal is to attract, develop and retain a talented team of associates inspired by our pur-pose of providing greater value to our stakeholders. For Mika Cardwell, a nine-year MSC associ-ate, that means honing her interpersonal skills and business expertise so she can improve relationships with the suppliers she partners with to drive success every day. Highly committed to her personal development, Mika takes advantage of the many formal and informal learning opportunities through MSC University and has completed a number of courses. Her personal performance and achievements resulted in her recently being promoted to product manager.
“At MSC, I have the opportunity to learn, take risks and develop my career.”
Mika CardwellProduct Manager
MSC Industrial Supply Co.
4 2o16 Annual Report
Anthony grew up in a single-parent home with three siblings where physical and mental abuse was commonplace. With few positive role models in his life, he went down the wrong path, was arrested and incarcerated. Today, Anthony’s life is full of promise. He has a trade and a career as a steelworker after graduating from United Way of Long Island’s YouthBuild program. He comes home each day to his wife and family and has set goals to further his education, buy a home and own his own business. Anthony is one of 300 young people, all with similar positive outcomes, who MSC has helped through $250,000 in contributions to United Way of Long Island. MSC’s philosophy of investing in well-run organizations pays long-term dividends in our communities.
“ MSC’s support has been critical to transforming the lives of young people and their futures.”
Theresa A. RegnantePresident & CEOUnited Way of Long Island
The Opportunity to Learn and Grow
Investing in Our Communities

2016 FORM 10-K

UNITED STATES SECURITIES AND EXCHANGE COMMISSION
WASHINGTON, D.C. 20549 __________________________________
FORM 10-K _______________________________________________________
(Mark One)
ANNUAL REPORT PURSUANT TO SECTION 13 OR 15(d) OF THE SECURITIES EXCHANGE ACT OF 1934
For the fiscal year ended September 3, 2016 OR
TRANSITION REPORT PURSUANT TO SECTION 13 OR 15(d) OF THE SECURITIES EXCHANGE ACT OF 1934
For the transition period from to
Commission file number 1-14130 __________________________________
MSC INDUSTRIAL DIRECT CO., INC. (Exact Name of Registrant as Specified in Its Charter)
__________________________________
New York (State or Other Jurisdiction of Incorporation or Organization)
11-3289165 (I.R.S. Employer
Identification No.)
75 Maxess Road, Melville, New York (Address of Principal Executive Offices)
11747
(Zip Code)
(516) 812-2000 (Registrant’s telephone number, including area code)
__________________________________ Securities registered pursuant to Section 12(b) of the Act:
Title of Each Class Name of Each Exchange on Which Registered Class A Common Stock, par value $.001 The New York Stock Exchange
Securities registered pursuant to Section 12(g) of the Act: None __________________________________
Indicate by check mark if the registrant is a well-known seasoned issuer, as defined in Rule 405 of the Securities Act. Yes No
Indicate by check mark if the registrant is not required to file reports pursuant to Section 13 or Section 15(d) of the Act. Yes No
Indicate by check mark whether the registrant (1) has filed all reports required to be filed by Section 13 or 15(d) of the Securities Exchange Act of 1934 during the preceding 12 months (or for such shorter period that the registrant was required to file such reports), and (2) has been subject to such filing requirements for the past 90 days. Yes No
Indicate by check mark whether the registrant has submitted electronically and posted on its corporate Website, if any, every Interactive Data File required to be submitted and posted pursuant to Rule 405 of Regulation S-T during the preceding 12 months (or for such shorter period that the registrant was required to submit and post such files). Yes No
Indicate by check mark if disclosure of delinquent filers pursuant to Item 405 of Regulation S-K is not contained herein, and will not be contained, to the best of registrant’s knowledge, in definitive proxy or information statements incorporated by reference in Part III of this Form 10-K or any amendment to this Form 10-K.
Indicate by check mark whether the registrant is a large accelerated filer, an accelerated filer, a non-accelerated filer, or a smaller reporting company. See the definitions of “large accelerated filer,” “accelerated filer” and “smaller reporting company” in Rule 12b-2 of the Exchange Act. (Check one):
Large accelerated filer Accelerated filer Non-accelerated filer (Do not check if a smaller
reporting company)
Smaller reporting company
Indicate by check mark whether the registrant is a shell company (as defined in Rule 12b-2 of the Exchange Act). Yes No The aggregate market value of Class A common stock held by non-affiliates of the registrant as of February 27, 2016 was approximately
$3,297,929,466. As of October 17, 2016, 44,647,764 shares of Class A common stock and 11,933,233 shares of Class B common stock of the registrant were outstanding.
DOCUMENTS INCORPORATED BY REFERENCE
The registrant’s Proxy Statement for its 2017 annual meeting of shareholders is hereby incorporated by reference into Part III of this Annual Report on Form 10-K.

i
MSC INDUSTRIAL DIRECT CO., INC.
TABLE OF CONTENTS
Page PART I
FORWARD-LOOKING STATEMENTS 1
ITEM 1. BUSINESS 1
ITEM 1A. RISK FACTORS 8
ITEM 1B. UNRESOLVED STAFF COMMENTS 13
ITEM 2. PROPERTIES 13
ITEM 3. LEGAL PROCEEDINGS 14
ITEM 4. MINE SAFETY DISCLOSURES 14
PART II
ITEM 5. MARKET FOR REGISTRANT’S COMMON EQUITY, RELATED STOCKHOLDER MATTERS AND ISSUER PURCHASES OF EQUITY SECURITIES 15
ITEM 6. SELECTED FINANCIAL DATA 17
ITEM 7. MANAGEMENT’S DISCUSSION AND ANALYSIS OF FINANCIAL CONDITION AND RESULTS OF OPERATIONS 18
ITEM 7A. QUANTITATIVE AND QUALITATIVE DISCLOSURES ABOUT MARKET RISK 29
ITEM 8. FINANCIAL STATEMENTS AND SUPPLEMENTARY DATA 30
ITEM 9. CHANGES IN AND DISAGREEMENTS WITH ACCOUNTANTS ON ACCOUNTING AND FINANCIAL DISCLOSURE 57
ITEM 9A. CONTROLS AND PROCEDURES 57
ITEM 9B. OTHER INFORMATION 60
PART III
ITEM 10. DIRECTORS, EXECUTIVE OFFICERS AND CORPORATE GOVERNANCE 60
ITEM 11. EXECUTIVE COMPENSATION 60
ITEM 12. SECURITY OWNERSHIP OF CERTAIN BENEFICIAL OWNERS AND MANAGEMENT AND RELATED STOCKHOLDER MATTERS 60
ITEM 13. CERTAIN RELATIONSHIPS AND RELATED TRANSACTIONS, AND DIRECTOR INDEPENDENCE 60
ITEM 14. PRINCIPAL ACCOUNTANT FEES AND SERVICES 60
PART IV ITEM 15. EXHIBITS AND FINANCIAL STATEMENT SCHEDULES 61
SIGNATURES 62

1
PART I.
FORWARD-LOOKING STATEMENTS Except for historical information contained herein, certain matters included in this Annual Report on Form 10-K are, or may be deemed to be forward-looking statements within the meaning of Section 21E of the Securities Exchange Act of 1934 and Section 27A of the Securities Act of 1933. The words “will,” “may,” “designed to,” “believe,” “should,” “anticipate,” “plan,” “expect,” “intend,” “estimate” and similar expressions identify forward-looking statements, which speak only as of the date of this annual report. These forward-looking statements are contained principally under Item 1, “Business,” and under Item 7, “Management’s Discussion and Analysis of Financial Condition and Results of Operations.” Because these forward-looking statements are subject to risks and uncertainties, actual results could differ materially from the expectations expressed in the forward-looking statements. Important factors that could cause actual results to differ materially from the expectations reflected in the forward-looking statements include those described in Item 1A, “Risk Factors” and Item 7, “Management’s Discussion and Analysis of Financial Condition and Results of Operations.” In addition, new risks emerge from time to time and it is not possible for management to predict all such risk factors or to assess the impact of such risk factors on our business. Given these risks and uncertainties, the reader should not place undue reliance on these forward-looking statements. We undertake no obligation to update or revise these forward-looking statements to reflect subsequent events or circumstances. ITEM 1. BUSINESS.
General
MSC Industrial Direct Co., Inc. (together with its subsidiaries, “MSC,” the “Company,” “we,” “our,” or “us”) is a leading North American distributor of metalworking and maintenance, repair and operations (“MRO”) products and services.
With a 75-year history of driving innovation in industrial product distribution, we help solve our manufacturing customers’ metalworking, MRO and operational challenges. Our team of more than 6,000 associates brings deep expertise and insight to not only keep our customers’ manufacturing operations up and running, but also improve their efficiency, productivity and profitability through our technical metalworking expertise and inventory management and other supply chain solutions.
We serve a broad range of customers throughout the United States, Canada and the United Kingdom, from individual machine shops, to Fortune 100 manufacturing companies, to government agencies such as the General Services Administration and the Department of Defense. We operate a sophisticated network of 12 customer fulfillment centers (eight in the United States, three in Canada and one in the United Kingdom) and 85 branch offices (84 in the United States and one in the U.K.) Our primary customer fulfillment centers are located in or near Harrisburg, PA; Atlanta, GA; Elkhart, IN; Reno, NV; and Columbus, OH. In addition, we operate seven smaller customer fulfillment centers in or near Hanover Park, IL; Dallas, TX; Shelbyville, KY (repackaging and replenishment center); Wednesbury, U.K.; Edmonton, Alberta; Beamsville, Canada; and Moncton, Canada.
We offer more than 1 million stock-keeping units (SKUs) through our website, mscdirect.com, as well as through our 4,500-plus page master catalog, known throughout the MRO industry as “The Big Book” and a variety of specialty and promotional catalogs, brochures and flyers. We carry many of the products we sell in our inventory, so orders for these in-stock products are processed and fulfilled the day the order is received. We offer next-day delivery nationwide for qualifying orders placed by 8 p.m. Eastern Time (excluding our Class C Solutions Group (“CCSG”) business).
Exclusive of U.K. operations, more than 360,000 active customers purchased at least one item during the past 12 months from MSC. Our customers can choose among many convenient ways to place orders: mscdirect.com, eProcurement platforms, call centers or direct communication with our outside sales associates.
We endeavor to save our customers money when they partner with us for their MRO and metalworking product needs. We do this in multiple ways:
• our experienced team of more than 6,000 associates includes customer care team members, metalworking
specialists and technical support teams, and sales associates focused on driving our customers’ success by reducing their operational costs;

2
• our robust systems and transactional data enable us to provide insights to our customers to help them take cost out of their supply chains and operations;
• our extensive product inventory enables customers to deal with fewer suppliers, streamlining their purchasing work and reducing their administrative costs;
• timely shipping enables our customers to reduce their inventory investment and carrying costs;
• we simplify the purchasing process by consolidating multiple purchases into a single order, providing a single invoice for multiple purchases over time, and offering direct shipments to specific departments and people at one or more facilities. This reduces our customers’ administrative costs;
• we provide extensive eCommerce capabilities: sophisticated search and transaction capabilities, access to real-time inventory, customer-specific pricing, workflow management tools, customized reporting and other features. We can also interface directly with many purchasing portals, such as ARIBA and Perfect Commerce, in addition to ERP Procurement Solutions, such as Oracle and SAP; and
• with MSC’s inventory management solutions, our customers can carry less inventory and still dramatically reduce situations when a critical item is out of stock.
Industry Overview MSC operates in a large, fragmented industry. National, regional and local distributors, retail outlets, small distributorships, online distributors, direct mail suppliers, large warehouse stores and manufacturers’ own sales forces all serve MRO customers. Nearly every industrial and service business has an ongoing need for MRO supplies. These businesses, with the exception of the largest industrial plants, often do not have the resources to manage and monitor their MRO inventories effectively. They spend more than necessary to purchase and track their supplies, providing an opportunity for MSC to serve as their one-stop MRO product supplier. Even the larger facilities often store their supplies in multiple locations, so they often carry excess inventories and duplicate purchase orders. In many organizations, multiple people often acquire the same item in small quantities via expensive, one-off purchases, resulting in higher purchasing costs and administrative efforts to keep track of supplies. With limited capital availability, and limited eCommerce capabilities and operating leverage, smaller suppliers to the industrial market are under increasing pressure to consolidate and/or curtail services and product lines to remain competitive. Their challenge represents MSC’s opportunity. Market surveys validate that we continue to capture increased market share by providing lower total purchasing costs, broader product selection and a higher level of service to our customers.
We improve purchasing efficiency and reduce costs for our customers because they can consolidate suppliers, purchase orders and invoices, reduce inventory tracking, stocking decisions, purchases and out-of-stock situations, and adopt sophisticated inventory management solutions, including Vendor Managed Inventory (“VMI”), Customer Managed Inventory (“CMI”) and vending solutions. Business Strategy MSC’s business strategy is based on helping our customers become more productive and profitable by reducing their total cost for obtaining, using and maintaining MRO supplies. Our strategy includes the following key elements: Inventory Management Solutions. Our approach starts with a thorough customer assessment. Our expert associates develop and recommend solutions that provide exceptional value to the customer. Depending on the customer’s size and needs, we customize options to address complexity and processes, as well as specific product, technical issues and cost targets. The options might include eProcurement, CMI, VMI, vending, tool crib control, or part-time or full-time on-site resources. Our world-class sourcing, logistics and business systems provide predictable, reliable and scalable service. Broad Selection of Products. Customers want a full range of product options, even as they look to reduce the number of suppliers they partner with. We provide “good-better-best” alternatives, comprising a spectrum of brand name,

3
MSC exclusive brand and generic MRO products. MSC’s broad selection of products enables customers to choose the right combination of price and quality on every purchase to meet their needs. Same-Day Shipping and Next-Day Delivery. We guarantee same-day shipping of our core metalworking and MRO products, enabling customers to reduce supply inventories. We fulfill our same-day shipment guarantee about 99% of the time. We know that our customers value this service, because areas accessible by next-day delivery tend to generate significantly greater sales for MSC than areas where next-day delivery is not available. Superior Customer Service. Our commitment to customer service starts with our over 6,000 associates who share their deep expertise and knowledge of metalworking and MRO products to help our customers achieve greater success. We invest in sophisticated information systems and provide extensive training for our associates so they can better support our customers. Using our proprietary customer support software, our in-bound sales representatives can inform customers on a real-time basis of product availability; recommend substitute products; verify credit information; receive special, custom or manufacturer direct orders; cross-check inventory items using previously entered customer product codes; and arrange or provide technical assistance. We offer customized billing; customer savings reports; electronic data interchange ordering; eCommerce capabilities; bulk discounts; and stocking of specialty items requested by customers.
Technical Support. We provide technical support and one-on-one service through our field and customer care center representatives. We have a dedicated team of nearly 100 metalworking specialists, who work with customers to improve their manufacturing processes and efficiency, as well as a technical support team that provides assistance to our sales teams and customers via phone and email. Our customers recognize the value of a distributor that can provide technical support to improve their operations and productivity. Commitment to Technological Innovation. We embrace technological innovations to support our growth, improve customer service and reduce our operating costs. The innovations make our buying practices more effective, improve our automated inventory replenishment and streamline order fulfillment. MSC’s proprietary software helps our customers and sales representatives determine the availability of products in stock in real time and evaluate alternative products and pricing. Our website, mscdirect.com (“MSC website”) contains a searchable online catalog with electronic ordering capabilities. The MSC website also offers an array of services, workflow management tools and related information. Our information systems help improve turnover and customer service while cutting costs. We also continually upgrade our distribution methods and systems and provide comprehensive electronic ordering capabilities (“EDI” and “XML”) to support our customers’ purchase order processing. We continue to invest in our VMI, CMI and vending solutions that streamline customer replenishment and trim our customers’ inventories. Our vending solutions include different kinds of machines, such as storage lockers or carousels, which can stand alone or be combined with other machines. MSC vending machines use network or web-based software to enable customers to gain inventory visibility, save time and drive profitability.
Advanced Technologies and www.mscdirect.com. The MSC website is available 24 hours a day, seven days a week, providing personalized real-time inventory availability, superior search capabilities, online bill payment, delivery tracking status and other enhancements, including work-flow management tools. The user-friendly search engine allows customers to find SKUs by keyword, part description, competitive part number, vendor number or brand. The MSC website is a key component of our strategy to reduce customers’ transaction costs and delivery time.
Competitive Pricing. Customers increasingly evaluate their total cost of ownership of industrial supplies and recognize that price is an important aspect of their procurement costs. We make sure our pricing is competitive while reflecting the value that we bring through our comprehensive service.
Growth Strategy
We continue to show share gains as indicated by growth rates from the markets we serve. Our growth strategy includes a number of strategies to continue to gain market share.
Expanding and enhancing our metalworking capabilities to aggressively penetrate customers in heavy and light manufacturing. MSC is a leading distributor of metalworking products in the United States. We have continued to expand our metalworking sales team, increase technical support and enhance supplier relationships. We are developing high-performance metalworking products marketed under MSC exclusive brands, providing high-value product alternatives for our customers. Our metalworking field specialists and centralized technical support team members have diverse backgrounds in machining, programming, management and engineering. They help our customers select the right tool for the job from our deep supplier base.

4
Expanding programs for government and national account customers. Although MSC has been providing MRO
and metalworking supplies to the commercial sector for 75 years, we have more recently focused on potential government customers and have a large, growing contract business with numerous federal, state, and local/education agencies. We also are attracting government contractor customers and the U.S. Postal Service. We have developed customized government and national account programs. Even with our recent success, we see plenty of opportunity for additional growth.
We provide customized national account programs for larger customers, often as enterprise-wide engagements.
These national account customers value our ability to support their procurement needs electronically to reduce their transactional costs. Our dedicated national account managers and operations experts provide supply chain solutions that reduce these customers’ total costs of ownership through increased visibility into their MRO purchases and improved management. We demonstrate these savings through detailed reporting at both the enterprise and site level.
Increasing the size and improving the productivity of our direct sales force. We have invested resources to give our sales representatives more time with our customers and provide increased support during the MRO purchasing process. Our field sales and service associate headcount was 2,370 and our in-bound sales representative headcount was 1,079 at September 3, 2016. We believe that our sales force investment has played a critical role in boosting our market share.
Increasing sales from existing customers and generating new customers with various value-added programs. Our value-added programs include business needs analysis, inventory management solutions and workflow management tools. Our customers particularly value our industrial vending solutions that can accommodate a range of products from precision cutting tools to MRO supplies.
Increasing the number of product lines and productive SKUs. We are increasing the breadth and depth of our product offerings and pruning non-value-added SKUs. In fiscal year 2016, we added approximately 150,000 SKUs, net of SKU removals, to our searchable database on www.mscdirect.com. This increase brought MSC’s total, active, saleable SKU count to approximately 1,500,000 SKUs. We plan to continue adding online SKUs in fiscal 2017.
The most recent MSC catalog issued in October 2016 merchandises approximately 500,000 core metalworking and
MRO products, which are included in the SKU totals above. Approximately 18% of these SKUs are MSC exclusive brands. We have also begun to leverage the depth and breadth of MSC’s product portfolio within our CCSG sales channel and have extended full access of MSC catalog SKUs to the CCSG sales team.
Improving our marketing programs. MSC has built an extensive buyer database, which we use to prospect for new customers. We deliver our master catalogs to the best prospects. We supplement our master catalogs with direct mail, digital and search engine marketing, and email. Our industry-specific expertise allows us to focus our outreach on the most promising growth areas.
Enhancing eCommerce capabilities. MSC’s website is a proprietary, business-to-business, horizontal marketplace serving the metalworking and MRO market. All qualified orders placed online at mscdirect.com are backed by our same-day shipping guarantee, unless otherwise stated. The MSC website utilizes the same highly trained sales force and support services as MSC’s traditional business, so our customers enjoy added convenience without sacrificing customized service. MSC’s website is a key component of our strategy to reduce customers’ transaction costs and internal requisition time. Most orders move directly from the customer’s desktop to our customer fulfillment center floor, removing human error, reducing handling costs and speeding up the transaction flow. MSC continues to evaluate the MSC website and solicit customer feedback, making on-going improvements to ensure that the MSC website remains a premier website in our marketplace. In June 2016, Internet Retailer magazine recognized MSC as the “B2B eCommerce Player of the Year,” citing MSC’s online purchasing experience for customers as a factor for the award. Internet Retailer also ranked MSC as the 30th largest e-retailer based on annual revenue generated from online sales, growth over the previous five years, and key metrics such as customer conversion rates and average order value by category. Our marketing campaigns continue to raise awareness and drive volume to the MSC website. In addition, many large customer accounts transact business with MSC using eProcurement solution providers that sell a suite of eCommerce products. We have associations with many of these providers and continue to evaluate and expand our eProcurement capabilities.
Improving our excellent customer support service. MSC consistently receives high customer satisfaction ratings,
according to customer surveys. We don’t just strive to meet our customers’ service needs, we work to anticipate them. This focus on our customers’ needs makes us stand apart in the market. We use customer comment cards, surveys and other customer outreach tools, using their feedback to drive the next generation of improvements to the customer experience.

5
Selectively pursuing strategic acquisitions. We actively pursue strategic acquisitions that expand or complement our business in new and existing markets or further enhance the value and offerings we provide. We completed our acquisition of Barnes Distribution North America, which we now call CCSG, in fiscal year 2013. We believe the highly fragmented nature of the MRO supply industry will continue to provide acquisition opportunities. We expect that any future acquisitions will be financed with internally generated funds and/or additional debt. Products
Our broad range of MRO products includes cutting tools, measuring instruments, tooling components, metalworking products, fasteners, flat stock, raw materials, abrasives, machinery hand and power tools, safety and janitorial supplies, plumbing supplies, materials handling products, power transmission components, and electrical supplies. Our large and growing number of SKUs makes us an increasingly valuable partner to our customers as they look to trim their supplier base. Our assortment from multiple product suppliers, prices and quality levels enables our customers to select from “good-better-best” options on nearly all their purchases. We stand apart from our competitors by offering name brand, exclusive brand, and generic products; depth in our core product lines; and competitive pricing.
We purchase substantially all of our products directly from approximately 3,000 suppliers. No single supplier
accounted for more than 6% of our total purchases in fiscal 2016, fiscal 2015, or fiscal 2014.
Customer Fulfillment Centers
A significant number of our products are carried in stock. Approximately 79% of sales are fulfilled from our 12 customer fulfillment centers and 85 branch offices. Some specialty or custom items and very large orders are shipped directly from the manufacturer. We manage our primary customer fulfillment centers via computer-based SKU tracking systems and radio frequency devices that locate specific stock items to make the selection process more efficient.
Sales and Marketing We serve individual machine shops, Fortune 100 companies, government agencies and manufacturers of all sizes. We focus on relatively higher-margin, lower-volume products. With the addition of our CCSG business, we have increased our presence in the fastener and Class C (“Consumables”) product categories and significantly increased our presence in the VMI space. VMI involves not only the selling of the maintenance consumables by our associates, but also the management of appropriate stock levels for the customer, writing the necessary replenishment orders, putting away the stock, and maintaining a clean and organized inventory area. We serve durable and non-durable goods manufacturing (which accounted for a substantial portion of our revenue in fiscal 2016), education, and health care markets, among others. We also have government and national account programs designed to address the needs of these customers. Federal government customers include large and small military bases, Veterans Affairs hospitals, federal correctional facilities, the U.S. Postal Service and the Department of Defense. We have individual state contracts but also are engaged in several state cooperatives. Our national account program also includes Fortune 1000 companies, large privately held companies, and international companies doing business in the United States. We have identified hundreds of additional national account prospects and have given our sales team tools to ensure we are targeting prospective customers that best fit the MSC model. We have implemented advanced analytics and significantly increased the return on our direct marketing investments designed to acquire new customers and increase our share of business with current customers. While master catalogs, promotional catalogs and brochures continue to play an important role in our efforts, we accelerated a shift to search engine marketing, email marketing and online advertising to address changes in our customers’ buying behavior. We use our own database of over 3 million contacts together with external mailing lists to target buyers with the highest likelihood to buy from MSC. By applying new analytics and moving expenditures to more efficient online tactics, we reduced publication circulation while significantly increasing revenue contribution. Our sales representatives are highly trained individuals who build relationships with customers, assist customers in reducing costs, provide technical support, coordinate special orders and shipments with vendors and update customer account profiles in our information systems databases. Our approach is based on the ability of the sales representative, armed with our comprehensive databases as a resource, to respond effectively to the customer’s needs. When a customer places a call to MSC, the sales representative on the other end of the line has immediate access to that customer’s company and specific

6
buyer profile, which includes billing and purchasing track records and plant and industry information. Meanwhile, the sales representative has access to inventory levels on every SKU we carry. Our in-bound sales representatives at our customer care centers undergo an intensive seven-week training course, followed up by regular on-site training seminars and workshops. They are monitored and evaluated at regular intervals, and they receive technical training from our in-house specialists and product vendors. We maintain a separate technical support group dedicated to answering customer inquiries, assisting them with product operation and finding the most efficient solutions to manufacturing problems. As of September 3, 2016, we had 2,370 field sales and service associates working throughout North America and the U.K. Our field sales representatives are responsible for increasing sales per customer and servicing existing accounts. They are a touch point with the customer and provide MSC with feedback on the competitive landscape and purchasing trends. Branch Offices We operate 85 branch offices. There are 84 branch offices within the United States located in 39 states, and one location in the U.K. We have experienced higher sales growth and market penetration in areas around our branch offices and believe they play an integral role in obtaining new accounts and penetrating existing ones. During fiscal 2016, we were able to consolidate some branch offices that were relatively close in proximity in order to gain leverage, operational effectiveness and cost savings. There were no new branch openings during fiscal 2016. Publications
Our primary reference publications are our master catalogs, which are supported by specialty and promotional catalogs and brochures. MSC produces two annual catalogs: the MSC Big Book, which contains a comprehensive offering across all product lines, and the MSC Metalworking catalog. We use specialty and promotional publications to target customers in specific areas, such as metal fabrication, facilities management, safety and janitorial. Specialty and promotional catalogs, targeted to our best prospects, offer a more focused selection of products at a lower catalog production cost and more efficient use of advertising space.
We periodically balance ongoing strategies to improve direct marketing productivity and increase return on advertising dollars spent against programs to increase revenue and lifetime value. As such, our mailing volume will fluctuate from year to year.
Fiscal Years Ended (1)
September 3,
2016 (53 weeks)
August 29,
2015 (52 weeks)
August 30,
2014 (52 weeks)
Number of publication titles 94 98 101 Number of publications mailed 16,851,194 18,265,589 18,152,000
(1) Excludes U.K. operations. Customer Service One of our goals is to make purchasing our products as convenient as possible. Customers submit more than 50% of our orders digitally through our technology platform (website, vending machines, and eProcurement). The remaining orders are placed via telephone, fax and mail. The efficient handling of orders is a critical aspect of our business. Order entry and fulfillment occurs at each of our branches and our main customer care centers, mostly located at our customer fulfillment centers. Customer care phone representatives enter orders into computerized order processing systems. In the event of a local or regional breakdown, a call can usually be re-routed to an alternative location. When an order enters the system, a credit check is performed; if the credit is approved, the order is usually transmitted to the customer fulfillment center closest to the customer. Customers are invoiced for merchandise, shipping and handling promptly after shipment. Information Systems Our information systems enable us to centralize management of key functions, including communication links between customer fulfillment centers, inventory and accounts receivable, purchasing, pricing, sales and distribution, and the

7
preparation of daily operating control reports. These systems help us ship on a same-day basis, respond quickly to order changes, provide a high level of customer service, and reduce costs. Our eCommerce environment is built upon a combined platform of our own intellectual property, state-of-the-art software from the world’s leading internet technology providers and world-class product data. This powerful combination of resources helps us deliver a superior online shopping experience with extremely high levels of reliability. Most of our information systems operate in real time over a wide area network, letting each customer fulfillment center and branch office share information and monitor daily progress on sales activity, credit approval, inventory levels, stock balancing, vendor returns, order fulfillment and other performance measures. We maintain a sophisticated buying and inventory management system that monitors all of our SKUs and automatically purchases inventory from vendors for replenishment based on projected customer ordering models. We also maintain an Electronic Data Interchange (“EDI”) purchasing program with our vendors to boost order placement efficiency, reduce order cycle processing time, and increase order accuracy. In addition to developing the proprietary computer software programs for use in the customer service and distribution operations, we also provide a comprehensive EDI and Extensible Markup Language (“XML”) ordering system to support our customer-based purchase order processing. We also maintain a proprietary hardware and software platform to support our VMI program, which allows customers to integrate scanner-accumulated orders directly into our Sales Order Entry system and website. Our CMI program enables customers to simply and effectively replenish inventory by submitting orders directly to our website. Our customized vending systems are used by customers in manufacturing plants across the United States to help them achieve supply chain and shop floor optimization, through inventory management and reduced tooling and labor costs. Our VMI, CMI and vending capabilities function directly as front-end ordering systems for our e-Portal based customers. These solutions take advantage of advanced technologies built upon the latest innovations in wireless and cloud based computing. Our core business systems run in a highly distributed computing environment and utilize world-class software and hardware platforms from key partners. We utilize disaster recovery techniques and procedures, which are consistent with best practices in enterprise IT. Given such a distributed IT environment, we regularly review and upgrade our systems. We believe that our current systems and practice of implementing regular updates are adequate to support our current needs. In fiscal 2016, we initiated the upgrade of our core financial systems, including the receivables, payables, treasury, fixed assets and general ledger. With the advent of advanced mobile technologies such as smart phones and tablets, access to information and decision-making can now be made anytime, anywhere. Recognizing this need, we have deployed technology to securely manage and maintain access to enterprise information from mobile devices that meet our security standards. Our sales representatives are equipped with proprietary mobile technology that allows them to tap into MSC’s supply chain directly from our customers’ manufacturing plants and make sure that critical inventory is always on site and available. In addition, we are enhancing our customer websites and portals to reflect this new mobile reality at a pace in line with customer adoption of mobile technology. Competition The MRO supply industry is a large, fragmented industry that is highly competitive. We face competition from traditional channels of distribution, such as retail outlets; small dealerships; regional or national distributors utilizing direct sales forces; manufacturers of MRO supplies; large warehouse stores; and larger direct mail distributors. We also face emerging competitors primarily in the online distribution space that compete with price transparency. We believe that sales of MRO supplies will become more concentrated over the next few years, which may make MRO supply distribution more competitive. Some of our competitors challenge us with a large variety of product offerings, financial resources, services or a combination of all of these factors. In the industrial products market, customer purchasing decisions are based primarily on one or more of the following criteria: price, product selection, product availability, technical support relationship, level of service and convenience. We believe we compete effectively on all such criteria. Seasonality
During any given time period, we may be impacted by our industrial customers’ plant shutdowns (particularly during the summer months or our fourth fiscal quarter). In addition, we may be impacted by weather-related disruptions.

8
Compliance with Health and Safety and Environmental Protection Laws
Our operations are subject to and affected by a variety of federal, state, local and non-U.S. health and safety and environmental laws and regulations relating to the discharge, treatment, storage, disposal, investigation and remediation of certain materials, substances and wastes. We continually assess our compliance status and management of environmental matters to ensure that our operations are in compliance with all applicable environmental laws and regulations.
Operating and maintenance costs, associated with environmental compliance and management of sites, are a normal
and recurring part of our operations. With respect to all other matters that may currently be pending, in the opinion of management, based on our analysis of relevant facts and circumstances, compliance with applicable environmental laws is not likely to have a material adverse effect upon our capital expenditures, earnings or competitive position.
Associates As of September 3, 2016, we employed 6,462 associates, which includes our U.K. and Canada operations. No associate is represented by a labor union. We consider our relationships with associates to be good and have experienced no work stoppages. Available Information
We file annual, quarterly and current reports, and other reports and documents with the Securities and Exchange Commission (the “SEC”). The public may read and copy any materials we file with the SEC at the SEC’s Public Reference Room at Station Place, 100 F Street, N.E., Washington, D.C. 20549. The public may obtain information on the operation of the Public Reference Room by calling the SEC at 1-800-SEC-0330. The SEC also maintains an Internet site that contains reports, proxy and information statements, and other information regarding issuers that file electronically with the SEC. The address of that website is www.sec.gov.
The Company’s Internet address is www.mscdirect.com. We make available on or through our investor relations page on our website, free of charge, our Annual Report on Form 10-K, quarterly reports on Form 10-Q, current reports on Form 8-K, and beneficial ownership reports on Forms 3, 4, and 5 and amendments to those reports as soon as reasonably practicable after this material is electronically filed with or furnished to the SEC. We also make available, on our website, the charters of the committees of our Board of Directors and Management’s Code of Ethics, the Code of Business Conduct and Corporate Governance Guidelines pursuant to SEC requirements and New York Stock Exchange listing standards. Information on our website does not constitute a part of this Annual Report on Form 10-K. ITEM 1A. Risk Factors In addition to the other information in this Annual Report on Form 10-K, the following factors should be considered in evaluating the Company and its business. Our future operating results depend upon many factors and are subject to various risks and uncertainties. The known material risks and uncertainties which may cause our operating results to vary from anticipated results or which may negatively affect our operating results and profitability are as follows: Our business depends heavily on the operating levels of our customers and the economic factors that affect them.
Many of the primary markets for the products and services we sell are subject to cyclical fluctuations that affect demand for goods and materials that our customers produce. Consequently, demand for our products and services has been and will continue to be influenced by most of the same economic factors that affect demand for and production of our customers’ products.
When, as occurred in the latest economic downturn, customers or prospective customers reduce production levels because of lower demand or tight credit conditions, their need for our products and services diminishes. Selling prices and terms of sale come under pressure, adversely affecting the profitability and the durability of customer relationships. Credit losses increase as well. Volatile economic and credit conditions also make it more difficult for distributors, as well as customers and suppliers, to forecast and plan future business activities.
In addition, as various sectors of our industrial customer base face increased foreign competition, and in fact lose business to foreign competitors or shift their operations overseas in an effort to reduce expenses, we may face increased difficulty in growing and maintaining our market share and growth prospects.

9
Changes in our customer and product mix, or adverse changes to the cost of goods we sell, could cause our gross margin percentage to fluctuate, or decrease. From time to time, we have experienced changes in our customer mix and in our product mix. Changes in our customer mix have resulted from geographic expansion, daily selling activities within current geographic markets, and targeted selling activities to new customers. Changes in our product mix have resulted from marketing activities to existing customers and needs communicated to us from existing and prospective customers as well as from business acquisitions. As our large account customer program sales grow, we will face continued pressures on maintaining gross margin because these customers receive lower pricing due to their higher sales volumes. In addition, our continued expansion of our vending program has placed pressure on our gross margin. There can be no assurance that we will be able to maintain our historical gross margins. In addition, we may also be subject to price increases from vendors that we may not be able to pass along to our customers. We operate in a highly competitive industry. The MRO supply industry, although consolidating, still remains a large, fragmented industry that is highly competitive. We face competition from traditional channels of distribution such as retail outlets, small dealerships, regional or national distributors utilizing direct sales forces, manufacturers of MRO supplies, large warehouse stores and larger direct mail distributors. We believe that sales of MRO supplies will become more concentrated over the next few years, which may make the industry more competitive. Our competitors challenge us with a greater variety of product offerings, financial resources, services or a combination of all of these factors. In addition, we also face the risk of companies which operate primarily outside of our industry entering our marketplace. We also face emerging competitors participating primarily in the online distribution space that compete with price transparency. Increased competition from online retailers (particularly those major internet providers who can offer a wide range of products and rapid delivery), and the adoption by competitors of aggressive pricing strategies and sales methods, could cause us to lose market share or reduce our prices, adversely affecting our sales, margins and profitability. Our industry is consolidating which could adversely affect our business and financial results. The business of selling MRO supplies in North America is currently undergoing some consolidation. This consolidation is being driven by customer needs. Customers are increasingly aware of the total costs of fulfillment, and of their need to have consistent sources of supply at multiple locations. Consistent sources of supply provide not just reliable product quantities, but also consistent pricing, quality and service capabilities. We believe these customer needs could result in fewer suppliers as the industry consolidates, and as the remaining suppliers become larger and capable of being a consistent source of supply. Traditional MRO suppliers are attempting to consolidate the market through internal expansion, through acquisitions or mergers with other industrial and construction suppliers, or through a combination of both. This consolidation allows suppliers to improve efficiency and spread fixed costs over a greater number of sales, and to achieve other benefits derived from economies of scale. The trend of our industry toward consolidation could cause the industry to become more competitive as greater economies of scale are achieved by competitors, or as competitors with new lower cost business models are able to operate with lower prices and gross profit on products. These trends may adversely affect our sales, margins and profitability. Volatility in commodity and energy prices may adversely affect operating margins. In times of commodity and energy price increases, we may be subject to price increases from our vendors and freight carriers that we may be unable to pass along to our customers. Raw material costs used in our vendors’ products (steel, tungsten, etc.) and energy costs may increase, which may result in increased production costs for our vendors. The fuel costs of our independent freight companies have been volatile. Our vendors and independent freight carriers typically look to pass increased costs along to us through price increases. When we are forced to accept these price increases, we may not be able to pass them along to our customers, resulting in lower operating margins. In addition to increases in commodity and energy prices, decreases in those costs, particularly if severe, could also adversely impact us by creating deflation in selling prices, which could cause our gross profit margin to deteriorate, or by negatively impacting customers in certain industries, which could cause our sales to those customers to decline.
10
As a United States government contractor, we are subject to certain laws and regulations which may increase our costs of doing business and which subject us to certain compliance requirements and potential liabilities. As a supplier to the United States government, we must comply with certain laws and regulations, including the Trade Agreements Act, the Buy American Act and the Federal Acquisition Regulation, relating to the formation, administration and performance of United States government contracts. These laws and regulations affect how we do business with government customers, and in some instances, impose added compliance and other costs on our business. From time to time, we are subject to governmental or regulatory inquiries or audits relating to our compliance with these laws and regulations. A violation of specific laws and regulations could result in the imposition of fines and penalties or the termination of our United States government contracts and could harm our reputation and cause our business to suffer. Our business is exposed to the credit risk of our customers which could adversely affect our operating results. We perform periodic credit evaluations of our customers’ financial condition and collateral is generally not required. Receivables are generally due within thirty days. We evaluate the collectability of accounts receivable based on numerous factors, including past transaction history with customers and their creditworthiness and we provide a reserve for accounts that we believe to be uncollectible. A significant deterioration in the economy could have an adverse effect on the servicing of these accounts receivable, which could result in longer payment cycles, increased collection costs and defaults. The risk of cancellation or rescheduling of orders may cause our operating results to fluctuate. The cancellation or rescheduling of orders may cause our operating results to fluctuate. Although we strive to maintain ongoing relationships with our customers, there is an ongoing risk that orders may be cancelled or rescheduled due to fluctuations in our customers’ business needs or purchasing budgets, including changes in national and local government budgets. Additionally, although our customer base is diverse, ranging from individual machine shops to Fortune 100 companies and large governmental agencies, the cancellation or rescheduling of significant orders by larger customers may still have a material adverse effect on our operating results from time to time. Work stoppages and other disruptions, including those due to extreme weather conditions, at transportation centers or shipping ports may adversely affect our ability to obtain inventory and make deliveries to our customers. Our ability to provide same-day shipping and next-day delivery of our core metalworking and MRO products is an integral component of our overall business strategy. Disruptions at transportation centers or shipping ports, due to labor stoppages or severe weather conditions affect both our ability to maintain core products in inventory and deliver products to our customers on a timely basis, which may in turn adversely affect our customer relationships and results of operations. In addition, severe weather conditions, including winter storms, could adversely affect demand for our products in particularly hard hit regions and impact our sales. The terms of our credit facility and senior notes impose operating and financial restrictions on us, which may limit our ability to respond to changing business and economic conditions.
We currently have a $650.0 million unsecured term loan and revolving loan credit facility, with the right to increase the aggregate amount available to be borrowed by an additional $200.0 million, in $50.0 million increments, subject to lending group approval. In addition, we have outstanding $175.0 million aggregate principal amount of senior notes. The term loan facility matures on, and the revolving loan facility is available through April 22, 2018. The senior notes mature in July 2023 ($75.0 million) and July 2026 ($100.0 million). We are subject to various operating and financial covenants under the credit facility and senior notes which restrict our ability to, among other things, incur additional indebtedness, make particular types of investments, incur certain types of liens, engage in fundamental corporate changes, enter into transactions with affiliates or make substantial asset sales. Any failure to comply with these covenants may constitute a breach under the credit facility and senior notes, which could result in the acceleration of all or a substantial portion of any outstanding indebtedness and termination of revolving credit commitments under the facility. Our inability to maintain our credit facility could materially adversely affect our liquidity and our business. Disruptions of our information systems could adversely affect us.
We believe that our information technology (“IT”) systems are an integral part of our business and growth strategies. We depend upon our IT systems to help process orders, to manage inventory and accounts receivable collections, to manage financial reporting, to purchase, sell and ship products efficiently and on a timely basis, to maintain cost-effective operations, to operate our websites and to help provide superior service to our customers. Our IT systems may be vulnerable to damage or disruption caused by circumstances beyond our control, such as catastrophic events, power outages, natural

11
disasters, computer system or network failures, computer viruses, physical or electronic break-ins, and cyber-attacks. The failure of our IT systems to perform as we anticipate could disrupt our business and could result in transaction errors, loss of data, processing inefficiencies, downtime, litigation, substantial remediation costs (including potential liability for stolen assets or information and the costs of repairing system damage), and the loss of sales and customers. In addition, changes to our information systems could disrupt our business operations. Any one or more of these consequences could have a material adverse effect on our business, financial condition and results of operations.
An inability to successfully manage the upgrade of our core financial systems could adversely affect our operations and operating results.
We are in the process of upgrading our core financial systems. This upgrade will affect many of our existing operating and financial systems. This is an important undertaking both financially and from a management and personnel perspective. Should the upgrade not be implemented successfully and within budget, or if the system does not perform in a satisfactory manner, it could be disruptive and adversely affect our operations and results of operations, including our ability to report accurate and timely financial results.
Our success is dependent on certain key personnel. Our success depends largely on the efforts and abilities of certain key senior management. The loss of the services of one or more of such key personnel could have a material adverse effect on our business and financial results. We do not maintain any key-man insurance policies with respect to any of our executive officers. Our business depends on our ability to retain and to attract qualified sales and customer service personnel. There are significant costs associated with hiring and training sales and customer service professionals. We greatly benefit from having associates who are familiar with the products we sell and their applications, as well as with our customer and supplier relationships. We could be adversely affected by a shortage of available skilled workers or the loss of a significant number of our sales or customer service professionals. The loss of key suppliers or supply chain disruptions could adversely affect our operating results.
We believe that our ability to offer a combination of well-known brand name products and competitively priced exclusive brand products is an important factor in attracting and retaining customers. Our ability to offer a wide range of products and services is dependent on obtaining adequate product supply and services from our key suppliers. The loss of, or a substantial decrease in the availability of products or services from key suppliers at competitive prices, or the loss of a key brand could cause our revenues and profitability to decrease. In addition, supply interruptions could arise due to transportation disruptions, labor disputes or other factors beyond our control. Disruptions in our supply chain could result in a decrease in revenues and profitability. Opening or expanding our customer fulfillment centers exposes us to risks of delays and may affect our operating results. In the future, as part of our long-term strategic planning, we may open new customer fulfillment centers to improve our efficiency, geographic distribution and market penetration and intend to make, as we have in the past, capital improvements and operational enhancements to certain of our existing customer fulfillment centers. Moving or opening customer fulfillment centers and effecting such improvements requires a substantial capital investment, including expenditures for real estate and construction, and opening new customer fulfillment centers requires a substantial investment in inventory. In addition, the opening of new customer fulfillment centers would have an adverse impact on distribution expenses as a percentage of sales, inventory turnover and return on investment in the periods prior to and for some time following the commencement of operations of each new customer fulfillment center. Additionally, until sales volumes mature at new customer fulfillment centers, operating expenses as a percentage of sales may be adversely impacted. Further, substantial or unanticipated delays in the commencement of operations at new customer fulfillment centers could have a material adverse effect on our geographic expansion and may impact results of operations. An interruption of operations at our headquarters or customer fulfillment centers could adversely impact our business. Our business depends on maintaining operations at our co-located headquarters and customer fulfillment centers. A serious, prolonged interruption due to power outage, telecommunications outage, terrorist attack, earthquake, hurricane, fire, flood or other natural disaster, or other interruption could have a material adverse effect on our business and financial results.

12
We are subject to litigation risk due to the nature of our business, which may have a material adverse effect on our business.
From time to time, we are involved in lawsuits or other legal proceedings that arise from business transactions. These may, for example, relate to product liability claims, commercial disputes, or employment matters. In addition, we could face claims over other matters, such as claims arising from our status as a government contractor, intellectual property matters, or corporate or securities law matters. The defense and ultimate outcome of lawsuits or other legal proceedings may result in higher operating expenses, which could have a material adverse effect on our business, financial condition, or results of operations.
We may encounter difficulties with acquisitions, which could harm our business.
We have completed several acquisitions of businesses and we expect to continue to pursue strategic acquisitions that we believe will either expand or complement our business in new or existing markets or further enhance the value and offerings we are able to provide to our existing or future potential customers.
Acquisitions involve numerous risks and challenges, including the following: • diversion of management’s attention from the normal operation of our business; • potential loss of key associates and customers of the acquired companies; • difficulties managing and integrating operations in geographically dispersed locations; • the potential for deficiencies in internal controls at acquired companies; • increases in our expenses and working capital requirements, which reduce our return on invested capital; • lack of experience operating in the geographic market or industry sector of the acquired business; and • exposure to unanticipated liabilities of acquired companies. To integrate acquired businesses, we must implement our management information systems, operating systems and
internal controls, and assimilate and manage the personnel of the acquired operations. The difficulties of this integration may be further complicated by geographic distances. The integration of acquired businesses may not be successful and could result in disruption to other parts of our business.
We are subject to environmental, health and safety laws and regulations. We are subject to federal, state, local, foreign and provincial environmental, health and safety laws and regulations. Fines and penalties may be imposed for non-compliance with applicable environmental, health and safety requirements and the failure to have or to comply with the terms and conditions of required permits. The failure by us to comply with applicable environmental, health and safety requirements could result in fines, penalties, enforcement actions, third party claims for property damage and personal injury, requirements to clean up property or to pay for the costs of cleanup, or regulatory or judicial orders requiring corrective measures, which could have a material adverse effect on our business, financial condition, or results of operations. Goodwill and indefinite-lived intangible assets recorded as a result of our acquisitions could become impaired. As of September 3, 2016, our combined goodwill and indefinite-lived intangible assets amounted to $638.2 million. To the extent we do not generate sufficient cash flows to recover the net amount of any investments in goodwill and other indefinite-lived intangible assets recorded, the investment could be considered impaired and subject to write-off. We expect to record further goodwill and other indefinite-lived intangible assets as a result of future acquisitions we may complete. Future amortization of such assets or impairments, if any, of goodwill or indefinite-lived intangible assets would adversely affect our results of operations in any given period. Our common stock price may be volatile. We believe factors such as fluctuations in our operating results or the operating results of our competitors, changes in economic conditions in the market sectors in which our customers operate, notably the durable and non-durable goods

13
manufacturing industry, which accounted for a substantial portion of our revenue for fiscal year 2016, fiscal year 2015 and fiscal year 2014, and changes in general market conditions, could cause the market price of our Class A common stock to fluctuate substantially. Our principal shareholders exercise significant control over us. We have two classes of common stock. Our Class A common stock has one vote per share and our Class B common stock has ten votes per share. As of October 17, 2016, the Chairman of our Board of Directors, his sister, certain of their family members including our President and Chief Executive Officer, and related trusts collectively owned 100% of the outstanding shares of our Class B common stock and approximately 2.5% of the outstanding shares of our Class A common stock, giving them control over approximately 73.4% of the combined voting power of our Class A common stock and our Class B common stock. Consequently, such shareholders will be in a position to elect all of the directors of the Company and to determine the outcome of any matter submitted to a vote of the Company’s shareholders for approval, including amendments to our certificate of incorporation and our amended and restated by-laws, any proposed merger, consolidation or sale of all or substantially all of our assets and other corporate transactions. Because this concentrated control could discourage others from initiating any potential merger, takeover or other change of control transaction that may otherwise be beneficial to our shareholders, the market price of our Class A common stock could be adversely affected. ITEM 1B. UNRESOLVED STAFF COMMENTS. None. ITEM 2. PROPERTIES. We have customer fulfillment centers in or near the following locations:
Approx. Operational Leased/ Location Sq. Ft. Date Owned Atlanta, Georgia 721,000 1990 Owned (1) Elkhart, Indiana 545,000 1996 Owned Harrisburg, Pennsylvania 821,000 1997 Owned Reno, Nevada 419,000 1999 Owned Wednesbury, United Kingdom 75,000 1998 Leased Columbus, Ohio 468,000 2014 Owned Hanover Park, Illinois 182,000 2003 Leased Dallas, Texas 135,000 2003 Leased Edmonton, Canada 32,000 2007 Leased Beamsville, Canada 85,000 2004 Owned Moncton, Canada 16,000 1981 Owned Shelbyville, Kentucky(2) 110,000 1973 Owned
(1) The Customer Fulfillment Center which had been previously leased from a related party was purchased in August 2016. (2) Repackaging and replenishment center.
We maintain 84 branch offices within the United States located in 39 states and one branch office located in the U.K. The branches range in size from 1,800 to 25,000 square feet. The leases for these branch offices will expire at various periods between September 2016 and August 2026. The aggregate annual lease payments on these branch offices and the leased customer fulfillment centers in fiscal 2016 were approximately $12.4 million.
We maintain our co-located headquarters at a 170,000 square foot facility that we own in Melville, New York and a 162,000 square foot facility that we own in Davidson, North Carolina. In addition, we maintain office space in a 50,000 square foot facility that we lease in Southfield, Michigan. We believe that our existing facilities are adequate for our current needs and will be adequate for the foreseeable future; we also expect that suitable additional space will be available as needed.
In order to support our growth strategy and maintain our signature service model as we grow, we recently built a
new customer fulfillment center in Columbus, Ohio. We began operations on September 30, 2014.

14
ITEM 3. LEGAL PROCEEDINGS.
There are various claims, lawsuits, and pending actions against the Company incidental to the operation of its business. Although the outcome of these matters is currently not determinable, management does not expect that the ultimate costs to resolve these matters will have a material adverse effect on the Company’s consolidated financial position, results of operations, or liquidity.
ITEM 4. MINE SAFETY DISCLOSURES Not applicable.

15
PART II.
ITEM 5. MARKET FOR REGISTRANT’S COMMON EQUITY, RELATED STOCKHOLDER MATTERS AND
ISSUER PURCHASES OF EQUITY SECURITIES. MSC’s Class A common stock is traded on the New York Stock Exchange (the “NYSE”) under the symbol “MSM”. MSC’s Class B common stock is not traded in any public market. The following table sets forth the range of the high and low sales prices as reported by the NYSE and cash dividends per share for the period from August 31, 2014 to September 3, 2016:
Dividend Per Share Price of Class A Common Stock Common Stock Fiscal Year Ended September 3, 2016 High Low Class A & Class B First Quarter – November 28, 2015 $ 68.18 $ 58.17 $ 0.43 Second Quarter – February 27, 2016 70.86 54.19 0.43 Third Quarter – May 28, 2016 78.35 68.34 0.43 Fourth Quarter – September 3, 2016 75.99 67.74 0.43 Dividend Per Share Price of Class A Common Stock Common Stock Fiscal Year Ended August 29, 2015 High Low Class A & Class B(1) First Quarter – November 29, 2014 $ 91.91 $ 77.52 $ 3.40 Second Quarter – February 28, 2015 83.03 72.92 0.40 Third Quarter – May 30, 2015 74.13 68.16 0.40 Fourth Quarter – August 29, 2015 72.40 64.50 0.40
(1) In the first quarter of fiscal 2015, the Company paid a special cash dividend of $3.00 per share.
In 2003, our Board of Directors instituted a policy of paying regular quarterly cash dividends to our shareholders. The Company paid total annual cash dividends of $1.72 and $4.60 per share for fiscal 2016 and fiscal 2015, respectively. This policy is reviewed periodically by the Board of Directors. On October 27, 2016, the Board of Directors declared a quarterly cash dividend of $0.45 per share, payable on November 29, 2016 to shareholders of record at the close of business on November 15, 2016. The dividend will result in a payout of approximately $25.5 million, based on the number of shares outstanding at October 17, 2016.
On October 17, 2016, the last reported sales price for MSC’s Class A common stock on the NYSE was $72.72 per share. The approximate number of holders of record of MSC’s Class A common stock as of October 17, 2016 was 647. The number of holders of record of MSC’s Class B common stock as of October 17, 2016 was 61.
Purchases of Equity Securities The following table sets forth repurchases by the Company of its outstanding shares of Class A common stock, during the quarter ended September 3, 2016:
Period
Total Number of Shares
Purchased(1)
Average Price Paid Per
Share(2)
Total Number of Shares Purchased as Part of Publicly Announced Plans or Programs(3)
Maximum Number of
Shares that May Yet Be Purchased Under the
Plans or Programs 05/29/16-06/28/16 145 $ 75.66 — 1,444,034 06/29/16-07/28/16 130 71.88 — 1,444,034 07/29/16-09/03/16 5,008,635 72.50 — 1,444,034 Total 5,008,910 $ 72.50 —
16
(1) During the three months ended September 3, 2016, 35,582 shares of our Class A common stock were purchased by the
Company as payment to satisfy our associate’s tax withholding liability associated with our share-based compensation program and are included in the total number of shares purchased. In addition, 4,973,328 shares of our Class A common stock purchased pursuant to the tender offer and stock purchase described below also are included in the table.
(2) Activity is reported on a trade date basis. (3) During fiscal 1999, our Board of Directors established the MSC Stock Repurchase Plan, which we refer to as the
Repurchase Plan. The total number of shares of our Class A common stock initially authorized for future repurchase was set at 5,000,000 shares. On January 8, 2008, our Board of Directors reaffirmed and replenished the Repurchase Plan and set the total number of shares of Class A common stock authorized for future repurchase at 7,000,000 shares. On October 21, 2011, the Board of Directors reaffirmed and replenished the Repurchase Plan and set the total number of shares of Class A common stock authorized for future repurchase at 5,000,000 shares. As of September 3, 2016, the maximum number of shares that may yet be repurchased under the Repurchase Plan was 1,444,034 shares. There is no expiration date for the Repurchase Plan.
In August 2016, the Company completed its “modified Dutch auction” tender offer and purchased 3,821,279 shares
of the Company’s Class A common stock that were validly tendered and not validly withdrawn at a price of $72.50 per share. The Company also completed its stock purchase of an aggregate of 1,152,049 shares of its Class A common stock from certain of its Class B shareholders at a purchase price of $72.50 per share. See Note 9 “Shareholders’ Equity” in the Notes to the Consolidated Financial Statements for more information about the tender offer and the stock purchase.
Performance Graph The following stock price performance graph and accompanying information is not deemed to be “soliciting material” or to be “filed” with the SEC, nor shall such information be incorporated by reference into any filings under the Securities Act of 1933, as amended, or under the Securities Exchange Act of 1934, as amended, which we refer to as the Exchange Act, or be subject to the liabilities of Section 18 of the Exchange Act, regardless of any general incorporation language in any such filing. The following graph compares the cumulative total return on an investment in our common stock with the cumulative total return of an investment in each of the S&P Midcap 400 Index and the Dow Jones US Industrial Supplier Index.
The graph assumes $100 invested at the closing price of our Class A common stock on the New York Stock Exchange and each index on August 27, 2011 and assumes that all dividends paid on such securities during the applicable fiscal years were reinvested. Indices are calculated on a month-end basis. The comparisons in this table are based on historical data and are not intended to forecast or to be indicative of the possible future performance of our Class A common stock.

17
Cumulative Total Stockholder Return for the Period from August 27, 2011 through September 3, 2016
8/27/2011 9/1/2012 8/31/2013 8/30/2014 8/29/2015 9/3/2016 MSC Industrial Direct Co., Inc. 100.00 119.15 132.79 159.93 126.82 143.06 S&P Midcap 400 100.00 118.05 146.04 179.99 181.19 204.02 Dow Jones US Industrial Supplier 100.00 131.32 148.55 154.22 128.43 137.42 ITEM 6. SELECTED FINANCIAL DATA. The following selected financial information is qualified by reference to, and should be read in conjunction with, the Company’s consolidated financial statements and the notes thereto, and “Management’s Discussion and Analysis of Financial Condition and Results of Operations” contained elsewhere herein. The selected consolidated income statement data for the fiscal years ended September 3, 2016, August 29, 2015 and August 30, 2014 and the selected consolidated balance sheet data as of September 3, 2016 and August 29, 2015 are derived from MSC’s audited consolidated financial statements which are included elsewhere herein. The selected consolidated income statement data for the fiscal years ended August 31, 2013 and September 1, 2012, and the selected consolidated balance sheet data as of August 30, 2014, August 31, 2013, and September 1, 2012 are derived from MSC’s audited consolidated financial statements not included herein.

18
Fiscal Years Ended
September 3, 2016
(53 weeks)
August 29, 2015
(52 weeks)
August 30, 2014
(52 weeks)
August 31, 2013
(52 weeks)
September 1, 2012
(53 weeks) (In thousands, except per share data)
Consolidated Income Statement Data: Net sales $ 2,863,505 $ 2,910,379 $ 2,787,122 $ 2,457,649 $ 2,355,918 Gross profit 1,288,858 1,316,575 1,286,256 1,118,516 1,078,203 Operating expenses 912,898 937,046 903,072 732,990 665,987 Income from operations 375,960 379,529 383,184 385,526 412,216 Income taxes 140,515 141,833 143,458 145,434 153,111 Net income 231,216 231,308 236,067 237,995 259,031 Net income per common share: Basic 3.78 3.75 3.78 3.77 4.12 Diluted 3.77 3.74 3.76 3.75 4.09 Weighted average common shares outstanding: Basic 60,908 61,292 62,026 62,695 62,434 Diluted 61,076 61,487 62,339 63,011 62,803 Cash dividends declared per common share(3) $ 1.72 $ 4.60 $ 1.32 $ 1.20 $ 1.00
Consolidated Balance Sheet Data (at period end): Working capital(4) $ 502,889 $ 610,089 $ 652,601 $ 680,292 $ 749,784 Total assets(4) 2,064,951 2,100,186 2,059,377 1,941,232 1,444,172 Short-term debt including capital lease and financing obligations(4) 267,050 213,165 96,479 13,802 819 Long-term debt including capital lease obligations, net of current maturities(4)
339,772 214,119 239,215 240,177 1,673 Deferred income taxes and tax uncertainties 148,201 131,210 112,785 97,475 85,061 Shareholders’ equity 1,098,376 1,332,870 1,398,563 1,390,383 1,187,111
Selected Operating Data:(1), (2) Active customers(5), (6) 366 366 364 322 325 Approximate Number of SKUs 1,150 1,000 850 685 600 Orders shipped(5) 6,861 6,626 6,630 5,957 6,150 Number of publications mailed(5) 16,851 18,266 18,152 16,308 18,032 Number of publication titles (not in thousands)(5) 94 98 101 95 100
(1) See “Management’s Discussion and Analysis of Financial Condition and Results of Operations—General.” (2) CCSG data is included in Selected Operating Data beginning in fiscal 2014. (3) In the first quarter of fiscal 2015, the Company paid a special cash dividend of $3.00 per share. (4) Prior periods have been adjusted to reflect the adoption of Accounting Standards Update (“ASU”) No. 2015-03,
Simplifying the Presentation of Debt Issuance Costs (Subtopic 835-30). See Note 2 to the Consolidated Financial Statements.
(5) Excludes U.K. operations. (6) Defined as customers that have made at least one purchase in the last twelve months.
ITEM 7. MANAGEMENT’S DISCUSSION AND ANALYSIS OF FINANCIAL CONDITION AND RESULTS OF OPERATIONS.
Overview
MSC Industrial Direct Co., Inc. (together with its subsidiaries, “MSC,” the “Company,” “we,” “our,” or “us”) is a leading North American distributor of a broad range of metalworking and maintenance, repair, and operations (“MRO”) products and services. We help our customers drive greater productivity, profitability and growth with more than one million products, inventory management and other supply chain solutions, and deep expertise from 75 years of working with customers across industries. We continue to implement our strategies to gain market share, generate new customers, increase sales to existing customers, and diversify our customer base.

19
Our experienced team of over 6,000 associates works with our customers to help drive results for their businesses, from keeping operations running efficiently today to continuously rethinking, retooling, and optimizing for a more productive tomorrow. We offer approximately 1,150,000 stock-keeping units (“SKUs”) through our master catalogs; weekly, monthly and quarterly specialty and promotional catalogs; brochures; and the Internet, including our website, mscdirect.com (the “MSC website”). We service our customers from 12 customer fulfillment centers (eight customer fulfillment centers are located within the United States which includes five primary customer fulfillment centers, one is located in the United Kingdom (the “U.K.”), and three are located in Canada) and 85 branch offices. Many of our products are carried in stock, and orders for these in-stock products are typically fulfilled the day on which the order is received.
Our field sales and service associate headcount was 2,370 at September 3, 2016, compared to 2,377 at August 29,
2015 and 2,301 at August 30, 2014. Beginning in fiscal 2016, we have adjusted this headcount metric in the current and prior years disclosed to include both field sales associates and service personnel. We believe this better reflects our company as a sales and service organization given our increased concentration in inventory management solutions, including Vendor Managed Inventory (“VMI”) systems and vending machine systems. Prior year numbers have been restated to conform to the fiscal 2016 presentation. We will continue to manage our sales and service headcount based on economic conditions and our business plans.
The waterfall chart below displays a three-year comparison of our net sales:
(1) Pricing includes changes in customer and product mix, discounting and other items. (2) Fiscal 2016 includes a 53rd week during the reporting period. Business Environment
We utilize various indices when evaluating the level of our business activity. Approximately 68% of our revenues came from sales in the manufacturing sector (53% heavy manufacturing and 15% light manufacturing) in our fiscal year 2016, including certain national account customers. Through statistical analysis, we have found the strongest correlation between our customers’ activity and the Metalworking Business Index (“MBI”). The MBI measures the economic activity of the metalworking industry, focusing only on durable goods manufacturing. Another index we previously used was

20
the Institute for Supply Management’s Purchasing Manager’s Index (“PMI”). However, recent analysis has shown only a small correlation between the PMI and our net sales. For both indices, a value below 50.0 generally indicates contraction and a value above 50.0 generally indicates expansion. The MBI and PMI indices over each of the last three months of our fiscal year and the averages for our fiscal 2016 fourth quarter and full fiscal year 2016 were as follows:
Period MBI PMI June 44.4 53.2
July 45.3 52.6
August 48.7 49.4 Fiscal 2016 Q4 average 46.1 51.7
Fiscal 2016 full year average 45.4 50.2 The MBI has increased steadily throughout our fourth quarter, rising from 44.4 to 48.7. This implies a continued,
but slower contraction in the metalworking manufacturing environment. Details released with the September MBI of 48.4 indicate contraction for the eighteenth consecutive month, including contraction in new orders and backlog.
We will continue to monitor the current economic conditions for its impact on our customers and markets and
continue to assess both risks and opportunities that may affect our business.
Results of Operations
Fiscal Year Ended September 3, 2016 Compared to the Fiscal Year Ended August 29, 2015 The table below summarizes the Company’s results of operations both in dollars (in thousands) and as a percentage
of net sales for the periods indicated:
Fiscal Years Ended September 3, 2016 August 29, 2015 (53 weeks) (52 weeks) Change
$ % $ % $ % Net sales $ 2,863,505 100.0% $ 2,910,379 100.0% $ (46,874) (1.6)% Cost of goods sold 1,574,647 55.0% 1,593,804 54.8% (19,157) (1.2)%
Gross profit 1,288,858 45.0% 1,316,575 45.2% (27,717) (2.1)% Operating expenses 912,898 31.9% 937,046 32.2% (24,148) (2.6)%
Income from operations 375,960 13.1% 379,529 13.0% (3,569) (0.9)% Total other expense (4,229) (0.1)% (6,388) (0.2)% 2,159 (33.8)%
Income before provision for income
371,731 13.0% 373,141 12.8% (1,410) (0.4)% Provision for income taxes 140,515 4.9% 141,833 4.9% (1,318) (0.9)%
Net income $ 231,216 8.1% $ 231,308 7.9% $ (92) (0.0)% Net Sales Net sales decreased 1.6% or approximately $46.9 million, for the fiscal year ended 2016. We estimate that this
decrease in net sales is comprised of: (i) approximately $82.0 million of lower sales volume; (ii) approximately $13.6 million from pricing, which includes changes in customer and product mix, discounting and other items; (iii) approximately $7.3 million from unfavorable foreign currency fluctuations; partially offset by (iv) approximately $56.0 million in sales attributable to an extra week in fiscal 2016. Of the total decrease in net sales, sales other than to our government and national account programs (“Large Account Customers”) decreased by approximately $72.2 million, partially offset by an increase of sales to our Large Account Customers of approximately $25.3 million.
The table below shows the change in our fiscal quarterly and annual 2016 average daily sales by total company and
by customer type compared to the same periods in the prior fiscal year:

21
Average Daily Sales Percentage Change (unaudited)
2016 vs. 2015 Fiscal Period
Thirteen
Week Period Ended Fiscal
Q1
Thirteen
Week Period Ended Fiscal
Q2
Thirteen
Week Period Ended Fiscal
Q3
Fourteen
Week Period Ended Fiscal
Q4
Fiscal Year
Ended % of Total Business
Total Company (3.3) % (3.2) % (3.9) % (3.6) % (3.5) % Manufacturing Customers(1) (4.9) % (5.6) % (6.8) % (6.1) % (5.8) % 68 % Non-Manufacturing Customers(1) 1.3 % 2.6 % 2.6 % 3.3 % 2.5 % 32 %
(1) Excludes U.K. operations.
Exclusive of customers in the U.K., average order size decreased to approximately $412 in fiscal 2016 as compared
to $417 in fiscal 2015. We believe that our ability to transact business with our customers through various electronic portals and directly
through the MSC website gives us a competitive advantage over smaller suppliers. Sales made through our eCommerce platforms, including sales made through Electronic Data Interchange (“EDI”) systems, VMI systems, Extensible Markup Language ordering based systems, vending machine systems, hosted systems and other electronic portals, represented 58.2% of consolidated net sales in fiscal 2016, compared to 55.6% of consolidated net sales in fiscal 2015. This increase was primarily associated with the MSC website, EDI, and vending machine systems.
Gross Profit
Gross profit margin was 45.0% in fiscal 2016 as compared to 45.2% in fiscal 2015. The decline was primarily a result of changes in pricing and customer mix.
Operating Expenses Operating expenses decreased 2.6% to $912.9 million in fiscal 2016, as compared to $937.0 million in fiscal 2015
despite having a 53rd week in fiscal 2016. This decrease was primarily the result of cost savings initiatives implemented throughout the full fiscal 2016, including lower payroll costs and discretionary spending. As a result, spending on items such as outside personnel, advertising, professional fees, and travel and entertainment expenses decreased compared to fiscal 2015. While lower volume did contribute a portion of the operating expense reduction, volume related expenses such as freight reduced faster than sales. These decreases were partially offset by increases in medical costs. Also, approximately $1.1 million of expenses related to non-recurring integration costs and restructuring charges associated with the CCSG acquisition and approximately $3.4 million of executive separation costs were included in operating expenses for fiscal year 2015.
Operating expenses represented approximately 31.9% of net sales in fiscal 2016, as compared to approximately 32.2% in fiscal 2015, respectively. Excluding the reduction in non-recurring charges discussed above, operating expenses as a percentage of net sales in fiscal 2016 remained below the prior fiscal year level. This is due to the cost savings initiatives mentioned above.
Payroll and payroll related costs represented approximately 55.0% of total operating expenses in fiscal 2016, as
compared to approximately 53.3% in fiscal 2015. Included in these costs are salary, incentive compensation, sales commission and fringe benefit costs. An increase in fringe benefit costs was the main driver for the increase in payroll and payroll related costs in fiscal 2016 as compared to fiscal 2015. Effective January 1, 2016, the Company transitioned from a self-insured plan to a fully insured private healthcare exchange. As a result of associates anticipating this transition, the Company experienced increased medical costs towards the end of calendar year 2015. These increases were offset by lower payroll costs, including sales commissions and overtime costs.
Freight expense was approximately $118.2 million in fiscal 2016, as compared to $123.9 million in fiscal 2015. The
primary driver of this decrease was decreased sales.

22
Income from Operations Income from operations decreased 0.9% to $376.0 million in fiscal 2016, as compared to $379.5 million in fiscal
2015. This decrease was primarily attributable to a decrease in gross profit, offset in part by a decrease in operating expenses described above. Income from operations as a percentage of net sales increased to 13.1% in fiscal 2016 as compared to 13.0% for the prior fiscal year primarily due to a decrease in operating expenses as discussed above, partially offset by a decrease in gross margin.
Other Expense
The decrease in other expense in fiscal 2016 compared to fiscal 2015 was primarily due to decreases in interest expense resulting from lower Credit Facility balances during the first three quarters of fiscal 2016.
Provision for Income Taxes Our fiscal 2016 effective tax rate was 37.8% as compared to 38.0% in fiscal 2015. This fluctuation resulted from
changes in the tax laws, income allocation and regulations in the various jurisdictions in which we operate and expiring statutes of limitations.
Net Income
The factors which affected net income for fiscal 2016 as compared to the prior period have been discussed above.
Fiscal Year Ended August 29, 2015 Compared to the Fiscal Year Ended August 30, 2014 The table below summarizes the Company’s results of operations both in dollars (in thousands) and as a percentage
of net sales for the periods indicated:
Fiscal Years Ended August 29, 2015 August 30, 2014 (52 weeks) (52 weeks) Change
$ % $ % $ % Net sales $ 2,910,379 100.0% $ 2,787,122 100.0% $ 123,257 4.4% Cost of goods sold 1,593,804 54.8% 1,500,866 53.9% 92,938 6.2%
Gross profit 1,316,575 45.2% 1,286,256 46.1% 30,319 2.4% Operating expenses 937,046 32.2% 903,072 32.4% 33,974 3.8%
Income from operations 379,529 13.0% 383,184 13.7% (3,655) (1.0)% Total other expense (6,388) (0.2)% (3,659) (0.1)% (2,729) 74.6%
Income before provision for income
373,141 12.8% 379,525 13.6% (6,384) (1.7)% Provision for income taxes 141,833 4.9% 143,458 5.1% (1,625) (1.1)%
Net income $ 231,308 7.9% $ 236,067 8.5% $ (4,759) (2.0)%
Net Sales Net sales increased 4.4%, or approximately $123.3 million, for the fiscal year ended 2015. We estimate that this
$123.3 million increase in net sales is comprised of: (i) approximately $135.1 million of higher sales volume; partially offset by (ii) $3.7 million from pricing, which includes changes in customer and product mix, discounting and other items; and (iii) approximately $8.1 million from unfavorable foreign currency fluctuations. Of the above $123.3 million increase in net sales, our Large Account Customers increased by approximately $108.0 million and there was an increase in our remaining business of approximately $15.3 million.
The table below shows the change in our fiscal quarterly and annual 2015 average daily sales by total company and
by customer type compared to the same periods in the prior fiscal year:

23
Average Daily Sales Percentage Change (unaudited)
2015 vs. 2014 Fiscal Period
Thirteen
Week Period Ended Fiscal
Q1
Thirteen
Week Period Ended Fiscal
Q2
Thirteen
Week Period Ended Fiscal
Q3
Thirteen
Week Period Ended Fiscal
Q4
Fiscal Year
Ended % of Total Business
Total Company 7.8 % 6.8 % 3.5 % 0.1 % 4.4 % Manufacturing Customers(1) 4.8 % 4.1 % 1.2 % (1.8) % 2.0 % 70 % Non-Manufacturing Customers(1) 15.6 % 14.0 % 10.1 % 5.4 % 11.0 % 30 %
(1) Excludes U.K. operations.
Exclusive of customers in the U.K., average order size increased to approximately $417 in fiscal 2015 as compared
to $409 in fiscal 2014. Sales made through our eCommerce platforms represented 55.6% of consolidated net sales in fiscal 2015, compared
to 48.0% of consolidated net sales in fiscal 2014. This increase was primarily associated with the MSC website, EDI, and vending machine systems.
Gross Profit Gross profit margin was 45.2% in fiscal 2015 as compared to 46.1% in fiscal 2014. The decline in gross profit
margin was primarily a result of increases in product costs, changes in pricing, customer and product mix and growth in our vending program sales.
Operating Expenses
Operating expenses increased 3.8% to $937.0 million in fiscal 2015, as compared to $903.1 million in fiscal 2014. The increase is primarily the result of increased payroll and payroll related costs to support our increased revenues, increased depreciation expense associated primarily with our infrastructure and other growth investments, and increased advertising costs related to additional advertising activities. This increase was partially offset by a decrease in the incentive compensation accrual, in addition to decreases in non-recurring integration costs and restructuring charges associated with the CCSG acquisition and in relocation expenses associated with the establishment of our co-located headquarters in Davidson, North Carolina. Approximately $1.1 million and $11.8 million of expenses related to non-recurring integration costs and restructuring charges associated with the CCSG acquisition were included in operating expenses in fiscal years 2015 and 2014, respectively. Approximately $3.4 million and $3.0 million of executive separation costs were included in operating expenses for fiscal years 2015 and 2014, respectively. In addition, approximately $2.6 million of expenses associated with the establishment of our co-located headquarters in Davidson, North Carolina were included in operating expenses in fiscal 2014.
Operating expenses represented approximately 32.2% of net sales in fiscal 2015, as compared to approximately 32.4% in fiscal 2014. Excluding the reduction in the non-recurring charges discussed above, operating expenses as a percentage of net sales in fiscal 2015 increased as compared to the prior fiscal year.
Payroll and payroll related costs represented approximately 53.3% of total operating expenses in fiscal 2015, as compared to approximately 53.5% in fiscal 2014. Included in these costs are salary, incentive compensation, sales commission and fringe benefit costs. Salary, incentive compensation and sales commission increased in fiscal 2015 as compared to the prior fiscal year, primarily due to an increase in salaries as a result of an increase in our staffing levels primarily related to sales associates and other program development and volume related positions to support our growth initiatives as well as significant investments in vending programs. Fringe benefit costs increased as a result of increased medical costs of our self-insured group health plan. There was an increase in the number of participants in the plan as a result of the increases in headcount discussed above, which resulted in an increase in the number of medical claims filed. The number of medical claims filed increased 7.0% in fiscal 2015 as compared to fiscal 2014. In addition, the average cost per claim increased by 5.3% in fiscal 2015 as compared to fiscal 2014. These increases were partially offset by a decrease in the incentive compensation accrual.

24
Freight expense was approximately $123.9 million in fiscal 2015, as compared to $119.8 million in fiscal 2014. The primary driver of this increase was increased sales.
Income from Operations
Income from operations decreased 1.0% to $379.5 million in fiscal 2015, as compared to $383.2 million in fiscal 2014. The decrease was primarily attributable to the increase in operating expenses described above, offset in part by an increase in gross profit. Income from operations as a percentage of net sales decreased to 13.0% in fiscal 2015 as compared to 13.7% for fiscal 2014 primarily due to a decrease in the gross profit margin as discussed above.
Other Expense
The increase in other expense in fiscal 2015 compared to fiscal 2014 was primarily due to increases in interest expense due to borrowings under our Credit Facility in fiscal 2015.
Provision for Income Taxes Our fiscal 2015 effective tax rate was 38.0% as compared to 37.8% in fiscal 2014. This fluctuation resulted from
changes in the tax laws, income allocation and regulations in the various jurisdictions in which we operate and expiring statutes of limitations.
Net Income
The factors which affected net income for fiscal 2015 as compared to the prior period have been discussed above. Liquidity and Capital Resources
September 3, August 29, 2016 2015 $ Change
Total debt $ 606,822 $ 427,284 $ 179,538 Less: Cash and cash equivalents (52,890) (38,267) (14,623) Net debt $ 553,932 $ 389,017 $ 164,915 Equity $ 1,098,376 $ 1,332,870 $ (234,494)
As of September 3, 2016, we held $52.9 million in cash, substantially all with well-known financial institutions.
Historically, our primary capital needs have been to fund our working capital requirements necessitated by our sales growth, the costs of acquisitions, adding new products, new facilities, facility expansions, investments in vending solutions, technology investments, and productivity investments. Cash generated from operations, together with borrowings under credit facilities, have been used to fund these needs, to repurchase shares of our Class A common stock, and to pay dividends. At September 3, 2016, total borrowings outstanding, representing amounts due under the Credit Facility and Private Placement Debt (discussed below), as well as all capital leases and financing arrangements, were approximately $607.8 million. At August 29, 2015, total borrowings outstanding, representing amounts due under the Credit Facility and all capital leases and financing arrangements, were approximately $428.3 million. As a distributor, maintaining adequate working capital to meet our customer needs is paramount. For the fiscal year ended September 3, 2016, working capital management was the main contributor to the increase in the generation of cash flow. Our cash flow from operations is generally utilized to meet capital expenditure commitments for property, plant and equipment which typically consist of information technology assets, warehouse equipment, office furniture and fixtures, building and leasehold improvements, construction and expansion, and vending machines. Therefore, the amount of cash consumed or generated by operations other than from net earnings will primarily be due to changes in working capital mostly due to the rate of increases or decreases in sales. We believe, based on our current business plan, that our existing cash, funds available under our revolving credit facility, and cash flow from operations will be sufficient to fund our planned capital expenditures and operating cash requirements for at least the next 12 months. We are continuing to take advantage of our strong balance sheet, which enables us to maintain optimal inventory and service levels to meet customer demands, while many of our smaller competitors in our fragmented industry continue to

25
have difficulties in offering competitive service levels. We also believe that customers will continue to seek cost reductions and shorter cycle times from their suppliers. Our business model focuses on providing overall procurement cost reduction and just-in-time delivery to meet our customers’ needs. We focus on offering inventory, process and procurement solutions that reduce MRO supply chain costs and improve plant floor productivity for our customers. We will seek to continue to drive cost reduction throughout our business through cost saving strategies and increased leverage from our existing infrastructure, and continue to provide additional procurement cost savings solutions to our customers through technology such as our Customer Managed Inventory (“CMI”), VMI, and vending programs.
The table below summarizes information regarding the Company’s liquidity and capital resources:
Fiscal Years Ended September 3, August 29, August 30,
2016 2015 2014
(Amounts in thousands) Net cash provided by operating activities $ 401,103 $ 249,791 $ 272,406 Net cash used in investing activities $ (87,930) $ (51,405) $ (94,206) Net cash used in financing activities $ (298,368) $ (207,045) $ (187,039) Effect of foreign exchange rate changes on cash and cash equivalents $ (182) $ (228) $ 117
Net increase (decrease) in cash and cash equivalents $ 14,623 $ (8,887) $ (8,722) Tender Offer and Stock Purchase
In August 2016, the Company completed its “modified Dutch auction” tender offer and purchased 3.8 million shares
of the Company’s Class A common stock that were validly tendered and not validly withdrawn at a price of $72.50 per share. The Company also completed its stock purchase of an aggregate of 1.2 million shares of its Class A common stock certain of its Class B shareholders at a purchase price of $72.50 per share. See Note 9 “Shareholders’ Equity” in the Notes to the Consolidated Financial Statements for more information about the tender offer and the stock purchase.
Operating Activities Net cash provided by operating activities for the fiscal years ended September 3, 2016 and August 29, 2015 was
$401.1 million and $249.8 million, respectively. There are various increases and decreases contributing to this change. Decreases in inventories and accounts receivable as a result of decreased sales volume contributed to the majority of the increase in net cash provided by operating activities.
Net cash provided by operating activities for the fiscal years ended August 29, 2015 and August 30,
2014 was $249.8 million and $272.4 million, respectively. There are various increases and decreases contributing to this change. An increase in inventories to support increased sales volume contributed to the majority of the decrease in net cash provided by operating activities.
Fiscal Years Ended September 3, August 29, August 30,
2016 2015 2014
(Dollars in thousands) Working Capital $ 502,889 $ 610,089 $ 652,601 Current Ratio 2.1 2.4 3.1
The decrease in working capital and the current ratio at September 3, 2016 compared to August 29, 2015 is primarily related to the decreases in inventories, as well as additional borrowings under the revolving loan facility in fiscal 2016. The decrease in working capital and the current ratio at August 29, 2015 compared to August 30, 2014 is primarily

26
related to the additional borrowings under the revolving loan facility in fiscal 2015, partially offset by the increase in inventories.
Investing Activities Net cash used in investing activities for the fiscal years ended September 3, 2016 and August 29, 2015 was
$87.9 million and $51.4 million, respectively. The increase in net cash used in investing activities resulted primarily from cash used of approximately $33.7 million for the purchase of the Atlanta Customer Fulfillment Center (“Atlanta CFC”) and the real property on which the Atlanta CFC is situated.
Net cash used in investing activities for the fiscal years ended August 29, 2015 and August 30, 2014 was $51.4
million and $94.2 million, respectively. The decrease in net cash used in investing activities resulted primarily from cash used of approximately $25.0 million for investment in available for sale securities during fiscal 2014, relating to the Columbus-Franklin County Finance Authority arrangement to construct our new customer fulfillment center in Columbus, Ohio. In addition, cash used for expenditures for property, plant, and equipment decreased primarily due to the outfit of this new customer fulfillment center, which occurred principally in fiscal 2014.
Financing Activities Net cash used in financing activities for the fiscal years ended September 3, 2016 and August 29, 2015 was $298.4
million and $207.0 million, respectively. The major components contributing to the use of cash for fiscal 2016 were repurchases of shares of Class A common stock of $383.8 million, mostly related to our tender offer and stock purchase referenced above, repayments on the Credit Facility of $301.0 million related to both the revolving loan facility and term loan facility, and cash dividends paid of $105.8 million. This was partially offset by borrowings under the revolving loan facility and Private Placement Debt in the amount of $305.0 million and $175.0 million, respectively.
Net cash used in financing activities for the fiscal years ended August 29, 2015 and August 30, 2014 was $207.0
million and $187.0 million, respectively. The major components contributing to the use of cash for fiscal 2015 were cash dividends paid of $284.2 million, repayments on the Credit Facility of $243.0 million related to both the revolving loan facility and term loan, and the repurchase of shares of Class A common stock of $33.4 million. This was partially offset by borrowings under the revolving loan facility in the amount of $336.0 million.
Long-term Debt Credit Facility In April 2013, in connection with the acquisition of CCSG, we entered into a $650.0 million credit facility (the
“Credit Facility”). See Note 8 “Debt and Capital Lease Obligations” in the Notes to the Consolidated Financial Statements for more information about the Credit Facility.
During fiscal 2016, we borrowed $305.0 million under the revolving loan facility and repaid $276.0 million of the revolving loan facility and $25.0 million of the term loan facility. As of September 3, 2016, there were $187.5 million and $217.0 million of borrowings outstanding under the term loan facility and the revolving credit facility, respectively, of which $267.0 million represents current maturities. As of August 29, 2015, there were $212.5 million and $188.0 million of borrowings outstanding under the term loan facility and the revolving credit facility, respectively, of which $213.0 million represents current maturities.
At September 3, 2016, we were in compliance with the operating and financial covenants of the Credit Facility. The
Company repaid borrowings of $66.0 million under the revolving loan facility and $12.5 million under the term loan facility in September and October 2016. The current unused balance of $249.0 million of the revolving loan facility is available for working capital purposes, if necessary.
Private Placement Debt In July 2016, in connection with our tender offer and stock purchase, we completed the issuance and sale of
unsecured senior notes. See Note 8 “Debt and Capital Lease Obligations” in the Notes to the Consolidated Financial Statements for more information about this transaction.

27
Capital Expenditures Infrastructure Investments In August 2016, we purchased the Atlanta CFC and the real property on which the Atlanta CFC is situated for a
purchase price of $33.7 million. The Atlanta CFC had previously been leased since 1989. See Note 2 “Summary of Significant Accounting Policies” in the Notes to the Consolidated Financial Statements for more information about this transaction.
In connection with our new customer fulfillment center in Columbus, Ohio, we spent approximately $3.3 million in
fiscal 2015 for costs to outfit the facility. We completed construction and began operations on September 30, 2014. Upgrade of Core Financial Systems In fiscal 2016, we initiated the upgrade of our core financial systems, including the receivables, payables, treasury,
fixed assets and general ledger. Capital expenditures relating to this project were approximately $6.6 million in fiscal 2016. We expect to incur capital expenditures between $11.0 million and $13.0 million in fiscal 2017. We expect to complete this project in Spring 2017. Related Party Transactions Atlanta CFC Purchase
In August 2016, the Company’s subsidiary, Sid Tool Co., Inc. completed a transaction with Mitchmar Atlanta Properties, Inc. to purchase the Company’s Atlanta Customer Fulfillment Center (“Atlanta CFC”) and the real property on which the Atlanta CFC is situated for a purchase price of $33.7 million. See Note 2 “Summary of Significant Accounting Policies” in the Notes to the Consolidated Financial Statements for more information about this transaction.
Stock Purchase Agreement In August 2016, the Company entered into a stock purchase agreement with the holders of the Company’s Class B
common stock. See Note 2 “Summary of Significant Accounting Policies” in the Notes to the Consolidated Financial Statements for more information about the stock purchase. Contractual Obligations The following table summarizes our contractual obligations at September 3, 2016 (in thousands):
Contractual Obligations Total Less than 1
year 1 – 3 years 3 – 5 years More than 5
years Operating lease obligations(1) $ 32,031 $ 12,081 $ 13,353 $ 5,168 $ 1,429 Capital lease obligations and financing obligations, net of interest(2) 28,268 471 690 27,107 — Maturities of long-term debt obligations, net of interest 579,500 267,000 137,500 — 175,000 Estimated interest on debt, capital lease and financing obligations(3) 48,210 7,927 11,816 9,992 18,475
Total contractual obligations $ 688,009 $ 287,479 $ 163,359 $ 42,267 $ 194,904
(1) Certain of our operations are conducted on leased premises. These leases (most of which require us to provide for the payment of real estate taxes, insurance and other operating costs) are for varying periods, the longest extending to the fiscal year 2026. In addition, we are obligated under certain equipment and automobile operating leases, which expire on varying dates through fiscal 2020.
(2) As of September 3, 2016, the Company has entered into various capital leases and financing obligations for certain information technology equipment, which expire on varying dates through fiscal 2020. In addition, included in this table is the long-term capital lease with the Columbus-Franklin County Finance Authority entered into in connection with the construction of the Company’s customer fulfillment center in Columbus, Ohio.
(3) Assumed interest rate of 1.52% through the maturity date which was the applicable borrowing rate for the Company for any borrowings outstanding under the Credit Facility at September 3, 2016. Fixed interest rates of 2.65% and 2.90% were used through the maturity dates on the Private Placement Debt.

28
The Company has recorded a non-current liability of $4.7 million for tax uncertainties and interest for the fiscal year
ended September 3, 2016. This amount is excluded from the table above, as the Company cannot make reliable estimates of these cash flows by period. See Note 6 to the Consolidated Financial Statements.
Off-Balance Sheet Arrangements We have not entered into any off-balance sheet arrangements. Critical Accounting Estimates We make estimates, judgments and assumptions in determining the amounts reported in the condensed consolidated financial statements and accompanying notes. Estimates are based on historical experience and on various other assumptions that are believed to be reasonable under the circumstances. The estimates are used to form the basis for making judgments about the carrying values of assets and liabilities and the amount of revenues and expenses reported that are not readily apparent from other sources. Actual results may differ from these estimates. Our significant accounting policies are described in the notes to the consolidated financial statements. The accounting policies described below are impacted by our critical accounting estimates.
Allowance for Doubtful Accounts
We perform periodic credit evaluations of our customers’ financial condition and collateral is generally not required. The Company considers several factors to estimate the allowance for uncollectible accounts receivable including the age of the receivables and the historical ratio of actual write-offs to the age of the receivables. The analyses performed also take into consideration economic conditions that may have an impact on a specific industry, group of customers or a specific customer. Based on our analysis of actual historical write-offs of uncollectible accounts receivable, the Company’s estimates and assumptions have been materially accurate in regards to the valuation of its allowance for doubtful accounts. For fiscal years 2016, 2015 and 2014, actual results did not vary materially from estimated amounts.
Inventory Valuation Reserve We establish inventory valuation reserves for shrinkage and slow-moving or obsolete inventory. The analysis
includes inventory levels, sales information, inventory count adjustments, and the on-hand quantities relative to the sales history for the product.
Inventories consist of merchandise held for resale and are stated at the lower of weighted average cost or market. We evaluate the recoverability of our slow-moving or obsolete inventories at least quarterly. We estimate the recoverable cost of such inventory by product type while considering factors such as its age, historic and current demand trends, the physical condition of the inventory, as well as assumptions regarding future demand. Our ability to recover our cost for slow-moving or obsolete inventory can be affected by such factors as general market conditions, future customer demand and relationships with suppliers.
Goodwill and Indefinite-Lived Intangible Assets The purchase price of an acquired company is allocated between intangible assets and the net tangible assets of the
acquired business with the residual of the purchase price recorded as goodwill. The determination of the value of the intangible assets acquired involves certain judgments and estimates. These judgments can include, but are not limited to, the cash flows that an asset is expected to generate in the future and the appropriate weighted average cost of capital.
At September 3, 2016, our goodwill totaled $624.1 million and our indefinite-lived intangible assets totaled $14.1
million. The Company annually reviews goodwill at the reporting unit level and intangible assets that have indefinite lives for impairment in its fiscal fourth quarter and when events or changes in circumstances indicate the carrying value of these assets might exceed their current fair values. Goodwill and indefinite-lived intangible assets are tested for impairment by first evaluating qualitative factors to determine whether it is more likely than not that the fair value of the reporting unit and indefinite-lived intangible assets are less than their carrying values. If it is concluded that this is the case, it is necessary to perform the currently prescribed quantitative impairment test. Otherwise, the quantitative impairment test is not required. We conducted our qualitative assessment of goodwill and intangibles in the fiscal fourth quarters of 2016 and 2015. The results of the assessments indicated that based on the qualitative assessment of goodwill and intangible assets that have indefinite lives, it was not likely that the fair values are less than the carrying amounts.

29
Income Taxes The Company recognizes deferred tax assets and liabilities for the expected future tax consequences of events that
have been included in the financial statements or tax returns. Under this method, deferred tax assets and liabilities are determined based on the differences between the financial reporting and tax basis of assets and liabilities, using enacted tax rates in effect for the year in which the differences are expected to reverse. The tax balances and income tax expense recognized by the Company are based on management’s interpretations of the tax laws of multiple jurisdictions. Income tax expense reflects the Company’s best estimates and assumptions regarding, among other items, the level of future taxable income, interpretation of tax laws and uncertain tax positions.
Other Other significant accounting policies, not involving the same level of measurement uncertainties as those discussed
above, are nevertheless important to an understanding of the financial statements. Policies such as revenue recognition, depreciation, intangibles, long-lived assets and warranties require judgments on complex matters that are often subject to multiple external sources of authoritative guidance such as the Financial Accounting Standards Board (the “FASB”) and the SEC. Possible changes in estimates or assumptions associated with these policies are not expected to have a material effect on the financial condition or results of operations of the Company. More information on these additional accounting policies can be found in Note 2 to the Consolidated Financial Statements. Recently Issued Accounting Pronouncements
Refer to Note 2 to the Consolidated Financial Statements.
ITEM 7A. QUANTITATIVE AND QUALITATIVE DISCLOSURES ABOUT MARKET RISK.
Interest Rate Risks In April 2013, in connection with the acquisition of CCSG, we entered into a $650.0 million credit facility (the
“Credit Facility”). See Note 8 “Debt and Capital Lease Obligations” in the Notes to the Consolidated Financial Statements for more information about the Credit Facility.
Borrowings under our Credit Facility are subject to fluctuations in the interest rate, which have a corresponding effect on our interest expense. A 100 basis point increase or decrease in interest rates would impact our interest costs by approximately $2.7 million under our current capital structure. We have monitored and will continue to monitor our exposure to interest rate fluctuations.
In addition, our interest income is most sensitive to changes in the general level of interest rates. In this regard,
changes in interest rates affect the interest earned on our cash. We do not currently use interest rate derivative instruments to manage exposure to interest rate changes.
Foreign Currency Risks
Approximately 97% of our sales are denominated in U.S. dollars and are primarily from customers in the United States. As a result, currency fluctuations are currently not material to our operating results. To the extent that we engage in more significant international sales in the future, an increase in the value of the U.S. dollar relative to foreign currencies could make our products less competitive in international markets. We have monitored and will continue to monitor our exposure to currency fluctuations.

30
ITEM 8. FINANCIAL STATEMENTS AND SUPPLEMENTARY DATA.
INDEX TO CONSOLIDATED FINANCIAL STATEMENTS
PAGE
REPORT OF INDEPENDENT REGISTERED PUBLIC ACCOUNTING FIRM
31
CONSOLIDATED BALANCE SHEETS AT SEPTEMBER 3, 2016 AND AUGUST 29, 2015
32
CONSOLIDATED STATEMENTS OF INCOME FOR THE FISCAL YEARS ENDED SEPTEMBER 3, 2016, AUGUST 29, 2015 AND AUGUST 30, 2014
33
CONSOLIDATED STATEMENTS OF COMPREHENSIVE INCOME FOR THE FISCAL YEARS ENDED SEPTEMBER 3, 2016, AUGUST 29, 2015 AND AUGUST 30, 2014
34
CONSOLIDATED STATEMENTS OF SHAREHOLDERS’ EQUITY FOR THE FISCAL YEARS ENDED SEPTEMBER 3, 2016, AUGUST 29, 2015 AND AUGUST 30, 2014
35
CONSOLIDATED STATEMENTS OF CASH FLOWS FOR THE FISCAL YEARS ENDED SEPTEMBER 3, 2016, AUGUST 29, 2015 AND AUGUST 30, 2014
37
NOTES TO CONSOLIDATED FINANCIAL STATEMENTS
38

31
Report of Independent Registered Public Accounting Firm The Board of Directors and Shareholders of MSC Industrial Direct Co., Inc. We have audited the accompanying consolidated balance sheets of MSC Industrial Direct Co., Inc. and Subsidiaries (the “Company”) as of September 3, 2016 and August 29, 2015, and the related consolidated statements of income, comprehensive income, shareholders’ equity, and cash flows for each of the three fiscal years in the period ended September 3, 2016. Our audits also included the financial statement schedule listed in the Index at Item 15(a). These financial statements and schedule are the responsibility of the Company's management. Our responsibility is to express an opinion on these financial statements and schedule based on our audits. We conducted our audits in accordance with the standards of the Public Company Accounting Oversight Board (United States). Those standards require that we plan and perform the audit to obtain reasonable assurance about whether the financial statements are free of material misstatement. An audit includes examining, on a test basis, evidence supporting the amounts and disclosures in the financial statements. An audit also includes assessing the accounting principles used and significant estimates made by management, as well as evaluating the overall financial statement presentation. We believe that our audits provide a reasonable basis for our opinion. In our opinion, the financial statements referred to above present fairly, in all material respects, the consolidated financial position of MSC Industrial Direct Co., Inc. and Subsidiaries at September 3, 2016 and August 29, 2015, and the consolidated results of their operations and their cash flows for each of the three fiscal years in the period ended September 3, 2016, in conformity with U.S. generally accepted accounting principles. Also, in our opinion, the related financial statement schedule, when considered in relation to the basic financial statements taken as a whole, presents fairly in all material respects the information set forth therein. We also have audited, in accordance with the standards of the Public Company Accounting Oversight Board (United States), MSC Industrial Direct Co., Inc. and Subsidiaries’ internal control over financial reporting as of September 3, 2016, based on criteria established in Internal Control-Integrated Framework issued by the Committee of Sponsoring Organizations of the Treadway Commission (2013 Framework) and our report dated November 1, 2016 expressed an unqualified opinion thereon. /s/ Ernst & Young LLP Jericho, New York November 1, 2016

32
MSC INDUSTRIAL DIRECT CO., INC. AND SUBSIDIARIES
CONSOLIDATED BALANCE SHEETS (In thousands, except share data)
September 3, August 29, 2016 2015
ASSETS
CURRENT ASSETS: Cash and cash equivalents $ 52,890 $ 38,267 Accounts receivable, net of allowance for doubtful accounts of $12,353 and $11,312, respectively
392,463 403,468 Inventories 444,221 506,631 Prepaid expenses and other current assets 45,290 39,067 Deferred income taxes 46,627 44,643 Total current assets 981,491 1,032,076
Property, plant and equipment, net 320,544 291,156 Goodwill 624,081 623,626 Identifiable intangibles, net 105,307 119,805 Other assets 33,528 33,523
Total assets $ 2,064,951 $ 2,100,186 LIABILITIES AND SHAREHOLDERS’ EQUITY
CURRENT LIABILITIES: Revolving credit note $ 217,000 $ 188,000 Current maturities of long-term debt 50,050 25,165 Accounts payable 110,601 114,328 Accrued liabilities 100,951 94,494 Total current liabilities 478,602 421,987
Long-term debt, net of current maturities 339,772 214,119 Deferred income taxes and tax uncertainties 148,201 131,210
Total liabilities 966,575 767,316 COMMITMENTS AND CONTINGENCIES SHAREHOLDERS' EQUITY
Preferred stock; $0.001 par value; 5,000,000 shares authorized; none issued and outstanding
— — Class A common stock (one vote per share); $0.001 par value; 100,000,000 shares authorized; 52,992,682 and 56,400,070 shares issued, respectively
53 56 Class B common stock (ten votes per share); $0.001 par value; 50,000,000 shares authorized; 11,933,233 and 13,295,747 shares issued and outstanding, respectively
12 13
Additional paid-in capital 584,017 604,905 Retained earnings 1,040,148 1,232,381 Accumulated other comprehensive loss (19,098) (17,252) Class A treasury stock, at cost, 8,344,514 and 8,037,696 shares, respectively (506,756) (487,233)
Total shareholders’ equity 1,098,376 1,332,870 Total liabilities and shareholders’ equity $ 2,064,951 $ 2,100,186
See accompanying notes to consolidated financial statements.

33
MSC INDUSTRIAL DIRECT CO., INC. AND SUBSIDIARIES
CONSOLIDATED STATEMENTS OF INCOME (In thousands, except net income per share data)
For the Fiscal Years Ended September 3, August 29, August 30, 2016 2015 2014 (53 weeks) (52 weeks) (52 weeks) NET SALES $ 2,863,505 $ 2,910,379 $ 2,787,122 COST OF GOODS SOLD 1,574,647 1,593,804 1,500,866
Gross profit 1,288,858 1,316,575 1,286,256 OPERATING EXPENSES 912,898 937,046 903,072
Income from operations 375,960 379,529 383,184 OTHER INCOME (EXPENSE):
Interest expense (5,807) (6,340) (3,874) Interest income 654 771 414 Other income (expense), net 924 (819) (199) Total other expense (4,229) (6,388) (3,659)
Income before provision for income taxes 371,731 373,141 379,525 Provision for income taxes 140,515 141,833 143,458
Net income $ 231,216 $ 231,308 $ 236,067 PER SHARE INFORMATION: Net income per common share:
Basic $ 3.78 $ 3.75 $ 3.78 Diluted $ 3.77 $ 3.74 $ 3.76
Weighted average shares used in computing net income per common share:
Basic 60,908 61,292 62,026 Diluted 61,076 61,487 62,339
See accompanying notes to consolidated financial statements.

34
MSC INDUSTRIAL DIRECT CO., INC. AND SUBSIDIARIES
CONSOLIDATED STATEMENTS OF COMPREHENSIVE INCOME (In thousands)
For the Fiscal Years Ended September 3, August 29, August 30, 2016 2015 2014 (53 weeks) (52 weeks) (52 weeks) Net income, as reported $ 231,216 $ 231,308 $ 236,067 Foreign currency translation adjustments (1,846) (12,198) (627) Comprehensive income $ 229,370 $ 219,110 $ 235,440
See accompanying notes to consolidated financial statements.

35
MSC INDUSTRIAL DIRECT CO., INC. AND SUBSIDIARIES
CONSOLIDATED STATEMENTS OF SHAREHOLDERS’ EQUITY FOR THE FISCAL YEARS ENDED SEPTEMBER 3, 2016 (53 weeks), AUGUST 29, 2015 (52 weeks), AND AUGUST 30, 2014 (52 weeks),
(In thousands)
Class A Common Stock
Class B Common Stock
Additional
Accumulated Other
Class A Treasury Stock
Shares Amount Shares Amount Paid-In Capital
Retained Earnings
Comprehensive Loss Shares
Amount at Cost Total
BALANCE at August 31, 2013 54,634 $ 55 14,141 $ 14 $ 528,770 $ 1,132,868 $ (4,427) 5,341 $ (266,897) $ 1,390,383 Exchange of Class B common stock for Class A common stock 845 1 (845) (1) — — — — — — Exercise of common stock options, including income tax benefits of $5,573
402 — — — 26,020 — — — — 26,020
Common stock issued under associate stock purchase plan — — — — 1,992 — — (54) 2,006 3,998 Issuance of restricted common stock, net of cancellations 99 — — — — — — — — — Shares issued from restricted stock units, including dividend equivalent units — — — — 260 — — — — 260 Stock-based compensation — — — — 16,688 — — — — 16,688 Purchase of treasury stock — — — — — — — 2,370 (191,359) (191,359) Cash dividends paid on Class A common stock — — — — — (64,393) — — — (64,393) Cash dividends paid on Class B common stock — — — — — (18,214) — — — (18,214) Dividend equivalent units declared — — — — — (260) — — — (260) Foreign currency translation adjustment — — — — — — (627) — — (627) Net income — — — — — 236,067 — — — 236,067 BALANCE at August 30, 2014 55,980 $ 56 13,296 $ 13 $ 573,730 $ 1,286,068 $ (5,054) 7,657 $ (456,250) $ 1,398,563 Exercise of common stock options, including income tax benefits of $3,299
185 — — — 14,418 — — — — 14,418
Common stock issued under associate stock purchase plan — — — — 1,854 — — (63) 2,431 4,285 Issuance of restricted common stock, net of cancellations 97 — — — — — — — — — Shares issued from restricted stock units, including dividend equivalent units 138 — — — 708 — — — — 708 Stock-based compensation — — — — 14,195 — — — — 14,195

36
Purchase of treasury stock — — — — — — — 444 (33,414) (33,414) Cash dividends paid on Class A common stock — — — — — (223,071) — — — (223,071) Cash dividends paid on Class B common stock — — — — — (61,160) — — — (61,160) Dividend equivalent units declared — — — — — (764) — — — (764) Foreign currency translation adjustment — — — — — — (12,198) — — (12,198) Net income — — — — — 231,308 — — — 231,308 BALANCE at August 29, 2015 56,400 $ 56 13,296 $ 13 $ 604,905 $ 1,232,381 $ (17,252) 8,038 $ (487,233) $ 1,332,870 Exchange of Class B common stock for Class A common stock 1,363 1 (1,363) (1) — — — — — — Exercise of common stock options, including income tax benefits of $830
144 1 — — 8,239 — — — — 8,240
Common stock issued under associate stock purchase plan — — — — 1,649 — — (64) 2,435 4,084 Issuance of restricted common stock, net of cancellations (15) — — — — — — — — — Shares issued from restricted stock units, including dividend equivalent units 74 — — — 147 — — — — 147 Stock-based compensation — — — — 13,985 — — — — 13,985 Purchase of treasury stock — — — — — — — 5,344 (384,111) (384,111) Retirement of treasury stock (4,973) (5) (44,908) (317,240) (4,973) 362,153 — Cash dividends paid on Class A common stock — — — — — (83,000) — — — (83,000) Cash dividends paid on Class B common stock — — — — — (22,778) — — — (22,778) Dividend equivalent units declared — — — — — (431) — — — (431) Foreign currency translation adjustment — — — — — — (1,846) — — (1,846) Net income — — — — — 231,216 — — — 231,216 BALANCE at September 3, 2016 52,993 $ 53 11,933 $ 12 $ 584,017 $ 1,040,148 $ (19,098) 8,345 $ (506,756) $ 1,098,376
See accompanying notes to consolidated financial statements.

37
MSC INDUSTRIAL DIRECT CO., INC. AND SUBSIDIARIES
CONSOLIDATED STATEMENTS OF CASH FLOWS FOR THE FISCAL YEARS ENDED SEPTEMBER 3, 2016, AUGUST 29, 2015 AND AUGUST 30, 2014
(In thousands)
For the Fiscal Years Ended September 3, August 29, August 30, 2016 2015 2014 (53 weeks) (52 weeks) (52 weeks)
CASH FLOWS FROM OPERATING ACTIVITIES: Net income $ 231,216 $ 231,308 $ 236,067 Adjustments to reconcile net income to net cash provided by operating activities:
Depreciation and amortization 71,930 69,729 64,946 Stock-based compensation 13,985 14,195 16,688 Loss on disposal of property, plant, and equipment 752 1,453 2,361 Provision for doubtful accounts 6,997 6,665 4,629 Deferred income taxes and tax uncertainties 15,007 15,035 11,829 Excess tax benefits from stock-based compensation (1,536) (3,956) (5,480) Changes in operating assets and liabilities, net of amounts associated with business acquired:
Accounts receivable 2,595 (29,347) (41,460) Inventories 61,047 (59,008) (30,342) Prepaid expenses and other current assets (6,303) 1,268 (6,319) Other assets 142 (1,354) 1,857 Accounts payable and accrued liabilities 5,271 3,803 17,630 Total adjustments 169,887 18,483 36,339 Net cash provided by operating activities 401,103 249,791 272,406
CASH FLOWS FROM INVESTING ACTIVITIES: Expenditures for property, plant and equipment (87,930) (51,405) (70,617) Investment in available for sale securities — — (25,023) Cash used in business acquisitions, net of cash received — — 1,434 Net cash used in investing activities (87,930) (51,405) (94,206)
CASH FLOWS FROM FINANCING ACTIVITIES: Repurchases of common stock (383,798) (33,414) (191,359) Payments of regular cash dividends (105,778) (98,828) (82,607) Payment of special cash dividend — (185,403) — Payments on capital lease and financing obligations (1,090) (2,290) (1,851) Excess tax benefits from stock-based compensation 1,536 3,956 5,480 Proceeds from sale of Class A common stock in connection with associate stock purchase plan 4,084 4,285 3,998 Proceeds from exercise of Class A common stock options 7,410 11,119 20,447 Borrowings under financing obligations 453 530 1,353 Borrowings under Credit Facility 305,000 336,000 135,000 Proceeds from Private Placement Loan 175,000 — — Private Placement Loan financing costs (185) — — Payment of notes payable and revolving credit note under the Credit Facility (301,000) (243,000) (77,500) Net cash used in financing activities (298,368) (207,045) (187,039)
Effect of foreign exchange rate changes on cash and cash equivalents (182) (228) 117 Net increase (decrease) in cash and cash equivalents 14,623 (8,887) (8,722) CASH AND CASH EQUIVALENTS, beginning of the year 38,267 47,154 55,876 CASH AND CASH EQUIVALENTS, end of the year $ 52,890 $ 38,267 $ 47,154 SUPPLEMENTAL DISCLOSURES OF CASH FLOW INFORMATION:
Cash paid for income taxes $ 127,965 $ 122,988 $ 128,558 Cash paid for interest $ 4,986 $ 5,843 $ 3,087
See accompanying notes to consolidated financial statements.

38
MSC INDUSTRIAL DIRECT CO., INC. AND SUBSIDIARIES NOTES TO CONSOLIDATED FINANCIAL STATEMENTS
(Dollar amounts and shares in thousands, except per share data)
1. BUSINESS
MSC Industrial Direct Co., Inc. (together with its subsidiaries, the “Company” or “MSC”) is a distributor of metalworking and maintenance, repair and operations (“MRO”) supplies with co-located headquarters in Melville, New York and Davidson, North Carolina. The Company has an additional office support center in Southfield, Michigan and serves primarily domestic markets through its distribution network of 85 branch offices and 12 customer fulfillment centers.
2. SUMMARY OF SIGNIFICANT ACCOUNTING POLICIES
Principles of Consolidation
The accompanying consolidated financial statements include the accounts of MSC and its subsidiaries, all of which are wholly owned. All intercompany balances and transactions have been eliminated in consolidation.
Fiscal Year
The Company’s fiscal year is on a 52 or 53 week basis, ending on the Saturday closest to August 31st of each year. The financial statements for fiscal year 2016 contain activity for 53 weeks while 2015 and 2014 contain activity for 52 weeks. Unless the context requires otherwise, references to years contained herein pertain to the Company’s fiscal year.
Use of Estimates
The preparation of financial statements, in conformity with accounting principles generally accepted in the United
States, requires management to make estimates and assumptions that affect the reported amounts of assets and liabilities and disclosure of contingent assets and liabilities at the date of the financial statements and the reported amounts of revenues and expenses during the reporting period. Actual results could differ from those estimates and assumptions used in preparing the accompanying consolidated financial statements.
Cash and Cash Equivalents
The Company considers all short-term, highly liquid investments with maturities of three months or less at the date
of purchase to be cash equivalents. Cash and cash equivalents are carried at cost, which approximates fair value.
Concentrations of Credit Risk
The Company’s mix of receivables is diverse, with approximately 366,000 active customer accounts (customers that have made at least one purchase in the last 12 months) at September 3, 2016 (excluding U.K. operations). The Company sells its products primarily to end-users. The Company’s customer base represents many diverse industries primarily concentrated in the United States. The Company performs periodic credit evaluations of its customers’ financial condition and collateral is generally not required. Receivables are generally due within 30 days. The Company evaluates the collectability of accounts receivable based on numerous factors, including past transaction history with customers and their creditworthiness and provides a reserve for accounts that are potentially uncollectible.
The Company’s cash include deposits with commercial banks. The terms of these deposits and investments provide
that all monies are available to the Company upon demand. The Company maintains the majority of its cash with high quality financial institutions. Deposits held with banks may exceed insurance limits. While MSC monitors the creditworthiness of these commercial banks and financial institutions, a crisis in the United States financial systems could limit access to funds and/or result in a loss of principal.

39
Allowance for Doubtful Accounts
The Company establishes reserves for customer accounts that are deemed uncollectible. The method used to estimate the allowances is based on several factors, including the age of the receivables and the historical ratio of actual write-offs to the age of the receivables. These analyses also take into consideration economic conditions that may have an impact on a specific industry, group of customers or a specific customer. While the Company has a broad customer base, representing many diverse industries primarily in all regions of the United States, a general economic downturn could result in higher than expected defaults, and therefore, the need to revise estimates for bad debts.
Inventory Valuation
Inventories consist of merchandise held for resale and are stated at the lower of weighted average cost or market. The Company evaluates the recoverability of our slow-moving or obsolete inventories quarterly. The Company estimates the recoverable cost of such inventory by product type while considering such factors as its age, historic and current demand trends, the physical condition of the inventory, as well as assumptions regarding future demand. The Company’s ability to recover its cost for slow-moving or obsolete inventory can be affected by such factors as general market conditions, future customer demand, and relationships with suppliers. Substantially all of the Company’s inventories have demonstrated long shelf lives and are not highly susceptible to obsolescence. In addition, many of the Company’s inventories are eligible for return under various supplier rebate programs.
Property, Plant and Equipment
Property, plant and equipment and capitalized computer software are stated at cost less accumulated depreciation.
Expenditures for maintenance and repairs are charged to expense as incurred; costs of major renewals and improvements are capitalized. At the time property and equipment are retired or otherwise disposed of, the cost and accumulated depreciation are eliminated from the asset and accumulated depreciation accounts and the profit or loss on such disposition is reflected in income.
Depreciation and amortization of property, plant and equipment are computed for financial reporting purposes on
the straight-line method based on the estimated useful lives of the assets. Leasehold improvements are amortized over either their respective lease terms or their estimated lives, whichever is shorter. Estimated useful lives range from three to forty years for leasehold improvements and buildings and three to twenty years for furniture, fixtures, and equipment.
Capitalized computer software costs are amortized using the straight-line method over the estimated useful life.
These costs include purchased software packages, payments to vendors and consultants for the development, implementation or modification of purchased software packages for Company use, and payroll and related costs for employees associated with internal-use software projects. Capitalized computer software costs are included within property, plant and equipment on the Company’s consolidated balance sheets.
Goodwill and Other Intangible Assets
The Company’s business acquisitions typically result in the recording of goodwill and other intangible assets, which
affect the amount of amortization expense and possibly impairment write-downs that the Company may incur in future periods. Goodwill represents the excess of the purchase price paid over the fair value of the net assets acquired in connection with business acquisitions. Goodwill increased $455 in fiscal 2016, related to foreign currency translation adjustments. The Company annually reviews goodwill and intangible assets that have indefinite lives for impairment in its fiscal fourth quarter and when events or changes in circumstances indicate the carrying values of these assets might exceed their current fair values. Goodwill and indefinite-lived intangible assets are tested for impairment by first evaluating qualitative factors to determine whether it is more likely than not that the fair value of the reporting unit and indefinite-lived intangible assets are less than their carrying value. If it is concluded that this is the case, it is necessary to perform the currently prescribed quantitative impairment test. Otherwise, the quantitative impairment test is not required. Based on the qualitative assessment of goodwill performed by the Company in its respective fiscal fourth quarters, there was no indicator of impairment of goodwill for fiscal years 2016, 2015 and 2014. Based on the qualitative assessment of intangible assets that have indefinite lives performed by the Company in its fiscal fourth quarters of 2016 and 2015 and the quantitative assessment performed by the Company in its fiscal fourth quarter of 2014, there were no indicators of impairment of intangible assets that have indefinite lives.

40
The components of the Company’s other intangible assets for the fiscal years ended September 3, 2016 and August
29, 2015 are as follows:
For the Fiscal Years Ended September 3, 2016 August 29, 2015
Weighted Average Useful Life (in years)
Gross Carrying Amount
Accumulated Amortization
Gross Carrying Amount
Accumulated Amortization
Customer Relationships 5 - 18 $ 175,160 $ (85,316) $ 175,160 $ (73,508) Contract Rights 10 23,100 (23,100) 23,100 (21,368) Trademark 1 - 5 3,613 (2,282) 2,900 (1,609) Trademarks Indefinite 14,132 — 15,130 — Total $ 216,005 $ (110,698) $ 216,290 $ (96,485)
For fiscal years 2016 and 2015 the Company recorded approximately $112 and $212 of intangible assets, respectively, consisting of the registration and application of new trademarks. During fiscal 2016, approximately $397 in gross intangible assets, and any related accumulated amortization, were written off related to trademarks that are no longer being utilized. The Company’s amortizable intangible assets are recorded on a straight-line basis, including customer relationships, as it approximates customer attrition patterns and best estimates the use pattern of the asset. Amortization expense of the Company’s intangible assets was $14,478, $16,580, and $16,851 during fiscal years 2016, 2015, and 2014, respectively. Estimated amortization expense for each of the five succeeding fiscal years is as follows:
Fiscal Year 2017 $8,006 2018 7,804 2019 7,338 2020 6,485 2021 5,799 Impairment of Long-Lived Assets
The Company periodically evaluates the net realizable value of long-lived assets, including definite lived intangible assets and property and equipment, relying on a number of factors, including operating results, business plans, economic projections, and anticipated future cash flows. Impairment is assessed by evaluating the estimated undiscounted cash flows over the asset’s remaining life. If estimated cash flows are insufficient to recover the investment, an impairment loss is recognized. No impairment loss was required to be recorded by the Company during fiscal years 2016, 2015 and 2014.
Deferred Catalog Costs
The costs of producing and distributing the Company’s principal catalogs are deferred ($5,174 and $4,948 at September 3, 2016 and August 29, 2015, respectively) and included in other assets in the Company’s consolidated balance sheets. These costs are charged to expense over the period that the catalogs remain the most current source of sales, which is typically one year or less from the date the catalogs are mailed. The costs associated with brochures and catalog supplements are charged to expense as distributed. The total amount of advertising costs, net of co-operative advertising income from vendor sponsored programs, included in operating expenses in the consolidated statements of income, was approximately $19,242, $24,101 and $20,799 during the fiscal years 2016, 2015, and 2014, respectively.
Revenue Recognition
The Company recognizes revenue when persuasive evidence of an arrangement exists, delivery has occurred or services have been rendered, the sales price is fixed or determinable, and collectability is reasonably assured. In most cases, these conditions are met when the product is shipped to the customer or services have been rendered. The Company reports its sales net of the amount of actual sales returns and the amount of reserves established for anticipated sales returns based upon historical return rates. Sales tax collected from customers is excluded from net sales in the accompanying consolidated statements of income.

41
Vendor Consideration
The Company records cash consideration received for advertising costs incurred to sell the vendor’s products as a
reduction of the Company’s advertising costs and is reflected in operating expenses in the consolidated statements of income. In addition, the Company receives volume rebates from certain vendors based on contractual arrangements with such vendors. Rebates received from these vendors are recognized as a reduction to the cost of goods sold in the consolidated statements of income when the inventory is sold.
Product Warranties
The Company generally offers a maximum one-year warranty, including parts and labor, for some of its machinery
products. The specific terms and conditions of those warranties vary depending upon the product sold. The Company may be able to recoup some of these costs through product warranties it holds with its original equipment manufacturers, which typically range from thirty to ninety days. In general, many of the Company’s general merchandise products are covered by third party original equipment manufacturers’ warranties. The Company’s warranty expense has been minimal.
Shipping and Handling Costs
The Company includes shipping and handling fees billed to customers in net sales and shipping and handling costs
associated with outbound freight in operating expenses in the accompanying consolidated statements of income. The shipping and handling costs in operating expenses were approximately $118,174, $123,900, and $119,796 during fiscal years 2016, 2015, and 2014, respectively.
Stock-Based Compensation
In accordance with Accounting Standards Codification (“ASC”) Topic 718, “Compensation — Stock Compensation” (“ASC 718”), the Company estimates the fair value of share-based payment awards on the date of grant. The value of awards that are ultimately expected to vest is recognized as an expense over the requisite service periods. The fair value of our restricted stock awards and units is based on the closing market price of our common stock on the date of grant. We estimated the fair value of stock options granted using a Black-Scholes option-pricing model. This model requires us to make estimates and assumptions with respect to the expected term of the option, the expected volatility of the price of our common stock and the expected forfeiture rate. The fair value is then amortized on a straight-line basis over the requisite service periods of the awards, which is generally the vesting period.
The expected term is based on the historical exercise behavior of grantees, as well as the contractual life of the
option grants. The expected volatility factor is based on the volatility of the Company's common stock for a period equal to the expected term of the stock option. In addition, forfeitures of share-based awards are estimated at the time of grant and revised, if necessary, in subsequent periods if actual forfeitures differ from those estimates. We use historical data to estimate pre-vesting option and restricted stock award and unit forfeitures and record stock-based compensation expense only for those awards that are expected to vest.
Treasury Stock The Company accounts for treasury stock under the cost method, using the first-in, first-out flow assumption, and is
included in “Class A treasury stock, at cost” on the accompanying consolidated balance sheets. When the Company reissues treasury stock, the gains are recorded in additional paid-in capital (“APIC”), while the losses are recorded to APIC to the extent that the previous net gains on the reissuance of treasury stock are available to offset the losses. If the loss is larger than the previous gains available, then the loss is recorded to retained earnings. When treasury stock is retired, the par value of the repurchased shares is deducted from common stock and the excess repurchase price over par is deducted by allocation to both APIC and retained earnings. The amount allocated to APIC is calculated as the original cost of APIC per share outstanding using the first-in, first-out flow assumption and is applied to the number of shares repurchased. Any remaining amount is allocated to retained earnings.

42
Related Party Transactions Atlanta CFC Purchase
In August 2016, the Company’s subsidiary, Sid Tool Co., Inc. (“Sid Tool”) completed a transaction with Mitchmar
Atlanta Properties, Inc. (“Mitchmar”) to purchase our Atlanta CFC and the real property on which the Atlanta CFC is situated for a purchase price of $33,650. Sid Tool had leased the Atlanta CFC from Mitchmar since 1989. Mitchmar is owned by Mitchell Jacobson, the Company’s Chairman, and his sister, Marjorie Gershwind Fiverson, and two family related trusts, and the beneficiaries of one of such trusts include the children of Erik Gershwind, the Company’s Chief Executive Officer. The purchase price was determined by an independent appraisal process, as provided in the lease agreement for the Atlanta facility.
The transaction was approved by the Company’s Board of Directors upon the recommendation of a special
committee of independent directors which was responsible for evaluating the terms of the transaction. Both the Company’s Board of Directors and the special committee determined that the transaction was in the best interests of the Company and its shareholders. The special committee was advised by independent counsel in connection with its evaluation and negotiation of the terms of the transaction and the purchase agreement.
We paid rent under an operating lease to Mitchmar of approximately $2,110, $2,318 and $2,297, respectively, for
fiscal years 2016, 2015 and 2014 in connection with our occupancy of our Atlanta CFC.
Stock Purchase Agreement In July 2016, the Company entered into an agreement (the “Stock Purchase Agreement”) with Mitchell Jacobson,
the Company’s Chairman, his sister, Marjorie Gershwind Fiverson, Erik Gershwind, the Company’s President and Chief Executive Officer, and two other beneficial owners (collectively, the “Sellers”) of the Company’s Class B common stock. Pursuant to the Stock Purchase Agreement, each Seller agreed to sell or cause to be sold by trusts or other entities on whose behalf such Seller acted, and the Company agreed to purchase, an aggregate number of shares of Class A common stock, at the price per share to be paid by the Company in the Company’s “modified Dutch auction” tender offer commenced on July 7, 2016, such that the Sellers’ aggregate percentage ownership and voting power in the Company would remain substantially the same as prior to the tender offer. The Sellers also agreed not to participate in the tender offer. The Stock Purchase Agreement was approved by the Nominating and Corporate Governance Committee of the Company’s Board of Directors, as well as by the disinterested members of the Company’s Board of Directors. On August 19, 2016, pursuant to the Stock Purchase Agreement, the Company purchased an aggregate of 1,152 shares of its Class A common stock from the Sellers and/or such trusts or other entities at a purchase price of $72.50 per share, for an aggregate purchase price of approximately $83,524. The purchase price per share paid to the sellers pursuant to the Stock Purchase Agreement was equal to the purchase price per share paid to shareholders whose shares were purchased in the Company’s tender offer.
Fair Value of Financial Instruments
The carrying values of the Company’s financial instruments, including cash, receivables, accounts payable and
accrued liabilities approximate fair value because of the short maturity of these instruments. In addition, based on borrowing rates currently available to the Company for borrowings with similar terms, the carrying values of the Company’s capital lease obligations also approximate fair value. The fair value of the Company’s taxable bonds are estimated based on observable inputs in non-active markets. Under this method, the Company’s fair value of the taxable bonds was not significantly different than the carrying value at September 3, 2016 and August 29, 2015. The fair values of the Company’s long-term debt, including current maturities are estimated based on quoted market prices for the same or similar issues or on current rates offered to the Company for debt of the same remaining maturities. Under this method, the Company’s fair value of any long-term obligations was not significantly different than the carrying values at September 3, 2016 and August 29, 2015.
Foreign Currency
The local currency is the functional currency for all of MSC’s operations outside the United States. Assets and
liabilities of these operations are translated to U.S. dollars at the exchange rate in effect at the end of each period. Income statement accounts are translated at the average exchange rate prevailing during the period. Translation adjustments arising from the use of differing exchange rates from period to period are included as a component of other comprehensive income within shareholders’ equity. Gains and losses from foreign currency transactions are included in net income for the period.

43
Income Taxes
The Company has established deferred income tax assets and liabilities for temporary differences between the
financial reporting bases and the income tax bases of its assets and liabilities at enacted tax rates expected to be in effect when such assets or liabilities are realized or settled pursuant to the provisions of ASC Topic 740, “Income Taxes” (“ASC 740”), which prescribes a comprehensive model for the financial statement recognition, measurement, classification, and disclosure of uncertain tax positions. For those benefits to be recognized, a tax position must be more-likely-than-not to be sustained upon examination by taxing authorities. The amounts of unrecognized tax benefits, exclusive of interest and penalties that would affect the effective tax rate were $4,432 and $4,693 as of September 3, 2016 and August 29, 2015, respectively.
Comprehensive Income
Comprehensive income consists of consolidated net income and foreign currency translation adjustments. Foreign
currency translation adjustments included in comprehensive income were not tax effected as investments in international affiliates are deemed to be permanent.
Geographic Regions
The Company’s sales and assets are predominantly generated from United States locations. Sales and assets related to the United Kingdom (the “U.K.”) and Canada branches are not significant to the Company’s total operations. For fiscal 2016, U.K. and Canadian operations represented approximately 3% of the Company’s consolidated net sales.
Segment Reporting
The Company utilizes the management approach for segment disclosure, which designates the internal organization that is used by management for making operating decisions and assessing performance as the source of our reportable segments. The Company’s results of operations are reviewed by the Chief Executive Officer on a consolidated basis and the Company operates in only one segment. Substantially all of the Company’s revenues and long-lived assets are in the United States. We do not disclose revenue information by product category as it is impracticable to do so as a result of our numerous product offerings and the way our business is managed.
Recently Adopted Accounting Pronouncements Presentation of Debt Issuance Costs In April 2015, the Financial Accounting Standards Board (“FASB”) issued Accounting Standards Update (“ASU”)
No. 2015-03, Simplifying the Presentation of Debt Issuance Costs (Subtopic 835-30), which requires that debt issuance costs related to a recognized debt liability be presented in the balance sheet as a direct deduction from the carrying amount of that debt liability. For public business entities, the ASU is effective for financial statements issued for fiscal years beginning after December 15, 2015, and interim periods within those fiscal years. Entities should apply the new guidance on a retrospective basis, wherein the balance sheet of each individual period presented should be adjusted to reflect the period-specific effects of applying the new guidance. The FASB allowed early adoption of this standard, and therefore, the Company adopted ASU 2015-03 during the fourth quarter of fiscal 2016. As a result of adopting this standard on a retrospective basis, $1,020 of debt issuance costs that were previously presented in long-term other assets as of August 29, 2015 are now included within current maturities of long-term debt and long-term debt, net of current maturities.
Accounting Pronouncements Not Yet Adopted Share-based Payments In March 2016, the FASB issued ASU No. 2016-09, Improvements to Employee Share-Based Payment Accounting,
which includes provisions intended to simplify various aspects related to how share-based payments are accounted for and presented in the financial statements. This ASU is effective for annual reporting periods beginning after December 15, 2016, and interim periods within that reporting period. Early adoption is permitted. The new standard is effective for the Company for its fiscal 2018 first quarter. The Company is currently evaluating the impact the adoption of the pronouncement may have on its financial position, results of operations or cash flows.

44
Leases In February 2016, the FASB issued ASU No. 2016-02, Leases (Topic 842), to increase transparency and
comparability by providing additional information to users of financial statements regarding an entity's leasing activities. ASU 2016-02 requires reporting entities to recognize lease assets and lease liabilities on the balance sheet for substantially all lease arrangements. ASU 2016-02 is effective for annual reporting periods, and interim periods therein, beginning after December 15, 2018. The new standard is effective for the Company for its fiscal 2020 first quarter. The guidance will be applied on a modified retrospective basis beginning with the earliest period presented. The Company is currently evaluating this standard to determine the impact of adoption on its consolidated financial statements.
Deferred Taxes In November 2015, the FASB issued ASU No. 2015-17, Balance Sheet Classification of Deferred Taxes. This
update requires an entity to classify deferred tax liabilities and assets as non-current within a classified balance sheet. ASU 2015-17 is effective for annual reporting periods, and interim periods therein, beginning after December 15, 2016. This update may be applied either prospectively to all deferred tax liabilities and assets or retrospectively to all periods presented. Early application is permitted. The new standard is effective for the Company for its fiscal 2018 first quarter. The Company does not expect adoption of ASU 2015-17 to have a material impact on its financial position, results of operations or cash flows.
Simplifying the Measurement of Inventory In July 2015, the FASB issued ASU No. 2015-11, Simplifying the Measurement of Inventory (Topic 330), which
requires an entity to measure inventory at the lower of cost or net realizable value, which consists of the estimated selling prices in the ordinary course of business, less reasonably predictable cost of completion, disposal, and transportation. For public entities, the updated guidance is effective for fiscal years beginning after December 15, 2016, including interim periods within those fiscal years. The guidance is to be applied prospectively with earlier application permitted as of the beginning of an interim or annual reporting period. The new standard is effective for the Company for its fiscal 2018 first quarter. The Company does not expect adoption of ASU 2015-11 to have a material impact on its financial position, results of operations or cash flows.
Revenue from Contracts with Customers In May 2014, the FASB issued ASU No. 2014-09, Revenue from Contracts with Customers (Topic 606), which
requires an entity to recognize the amount of revenue to which it expects to be entitled for the transfer of promised goods or services to customers. The ASU will replace most existing revenue recognition guidance in GAAP when it becomes effective. The new standard is effective for the Company for its fiscal 2019 first quarter. Early application is permitted. The standard permits the use of either the retrospective or cumulative effect transition method. The Company is evaluating the effect that ASU 2014-09 will have on its consolidated financial statements and related disclosures. The Company has neither selected a transition method, nor determined the impact that the adoption of the pronouncement may have on its financial position, results of operations or cash flows.
Reclassifications Certain prior year amounts have been reclassified to conform to the fiscal 2016 presentation. These reclassifications
did not have a material impact on the presentation of the consolidated financial statements. See “Recently Adopted Accounting Pronouncements” above regarding the impact of our adoption of ASU 2015-03 upon the classification of debt issuance costs in our consolidated balance sheets.
3. FAIR VALUE Fair value accounting standards define fair value as the price that would be received to sell an asset or paid to transfer a liability in an orderly transaction between market participants at the measurement date. The following fair value hierarchy prioritizes the inputs used to measure fair value into three levels, with Level 1 being of the highest priority. The three levels of inputs used to measure fair value are as follows:
Level 1—Observable inputs that reflect quoted prices (unadjusted) for identical assets or liabilities in active markets.

45
Level 2—Include other inputs that are directly or indirectly observable in the marketplace. Level 3—Unobservable inputs which are supported by little or no market activity.
As of September 3, 2016 and August 29, 2015, the Company did not have any cash equivalents.
In connection with the construction of the Company’s customer fulfillment center in Columbus, Ohio, the Company entered into an arrangement during fiscal 2013 with the Columbus-Franklin County Finance Authority (“Finance Authority”) which provides savings on state and local sales taxes imposed on construction materials to entities that finance the transactions through them. Under this arrangement, the Finance Authority issued taxable bonds to finance the structure and site improvements of the Company’s customer fulfillment center. The bonds ($27,022 at both September 3, 2016 and August 29, 2015) are classified as available for sale securities in accordance with ASC Topic 320. The securities are recorded at fair value in Other Assets in the Consolidated Balance Sheet. The fair values of these securities are based on observable inputs in non-active markets, which are therefore classified as Level 2 in the hierarchy. The Company did not record any gains or losses on these securities during fiscal year 2016. The outstanding principal amount of each bond bears interest at the rate of 2.4% per year. Interest is payable on a semiannual basis in arrears on each interest payment date.
In addition, based on borrowing rates currently available to the Company for borrowings with similar terms, the
carrying values of the Company’s capital lease obligations also approximate fair value. The fair value of the Company’s long-term debt, including current maturities, is estimated based on quoted market prices for the same or similar issues or on current rates offered to the Company for debt of the same remaining maturities. The carrying amount of the Company’s debt at September 3, 2016, approximates its fair value.
The Company’s financial instruments, other than those presented in the disclosure above, include cash, receivables, accounts payable, and accrued liabilities. Management believes the carrying amount of the aforementioned financial instruments is a reasonable estimate of fair value as of September 3, 2016 and August 29, 2015 due to the short-term maturity of these items. During the fiscal years ended September 3, 2016 and August 29, 2015, the Company had no measurements of non-financial assets or liabilities at fair value on a non-recurring basis subsequent to their initial recognition. 4. NET INCOME PER SHARE
The Company’s non-vested restricted stock awards contain non-forfeitable rights to dividends and meet the criteria of a participating security as defined by ASC 260, “Earnings Per Share”. Under the two-class method, net income per share is computed by dividing net income allocated to common shareholders by the weighted average number of common shares outstanding for the period. In applying the two-class method, net income is allocated to both common shares and participating securities based on their respective weighted average shares outstanding for the period.
The following table sets forth the computation of basic and diluted net income per common share under the two-
class method for the fiscal years ended September 3, 2016, August 29, 2015 and August 30, 2014, respectively:
For the Fiscal Years Ended September 3, August 29, August 30, 2016 2015 2014 (53 weeks) (52 weeks) (52 weeks)
Net income as reported $ 231,216 $ 231,308 $ 236,067
Less: Distributed net income available to participating securities (308) (1,350) (481) Less: Undistributed net income available to participating securities (601) — (1,146)
Numerator for basic net income per share:
Undistributed and distributed net income available to common shareholders $ 230,307 $ 229,958 $ 234,440
Add: Undistributed net income allocated to participating securities 601 — 1,146 Less: Undistributed net income reallocated to participating securities (600) — (1,140)

46
Numerator for diluted net income per share:
Undistributed and distributed net income available to common shareholders $ 230,308 $ 229,958 $ 234,446
Denominator: Weighted average shares outstanding for basic net income per share 60,908 61,292 62,026 Effect of dilutive securities 168 195 313 Weighted average shares outstanding for diluted net income per share 61,076 61,487 62,339
Net income per share Two-class method: Basic $ 3.78 $ 3.75 $ 3.78 Diluted $ 3.77 $ 3.74 $ 3.76
Antidilutive stock options of 843 and 678 were not included in the computation of diluted earnings per share for the fiscal years ended September 3, 2016 and August 29, 2015. There were no antidilutive stock options included in the computation of diluted earnings per share for the fiscal year ended August 30, 2014.
5. PROPERTY, PLANT AND EQUIPMENT
The following is a summary of property, plant and equipment and the estimated useful lives used in the computation of depreciation and amortization:
September 3, August 29, Number of Years 2016 2015 Land — $ 27,205 $ 20,783 Building and improvements 3 - 40 178,828 150,870 Leasehold improvements The lesser of lease term or 31.5 2,551 4,384 Furniture, fixtures and equipment 3 - 20 172,347 165,589 Computer systems, equipment and software 3 - 5 317,096 289,873 698,027 631,499 Less: accumulated depreciation and amortization 377,483 340,343 Total $ 320,544 $ 291,156
The amount of capitalized interest, net of accumulated amortization, included in property, plant and equipment was $796 and $847 at September 3, 2016 and August 29, 2015, respectively.
Depreciation expense was $57,052, $52,799 and $47,729 for the fiscal years ended September 3, 2016, August 29,
2015, and August 30, 2014, respectively.
6. INCOME TAXES
The provision for income taxes is comprised of the following:
For the Fiscal Years Ended September 3, August 29, August 30, 2016 2015 2014 Current:
Federal $ 109,699 $ 109,575 $ 115,186 State and local 15,621 17,339 16,528
125,320 126,914 131,714 Deferred:
Federal 13,993 13,987 10,369 State and local 1,202 932 1,375
15,195 14,919 11,744 Total $ 140,515 $ 141,833 $ 143,458
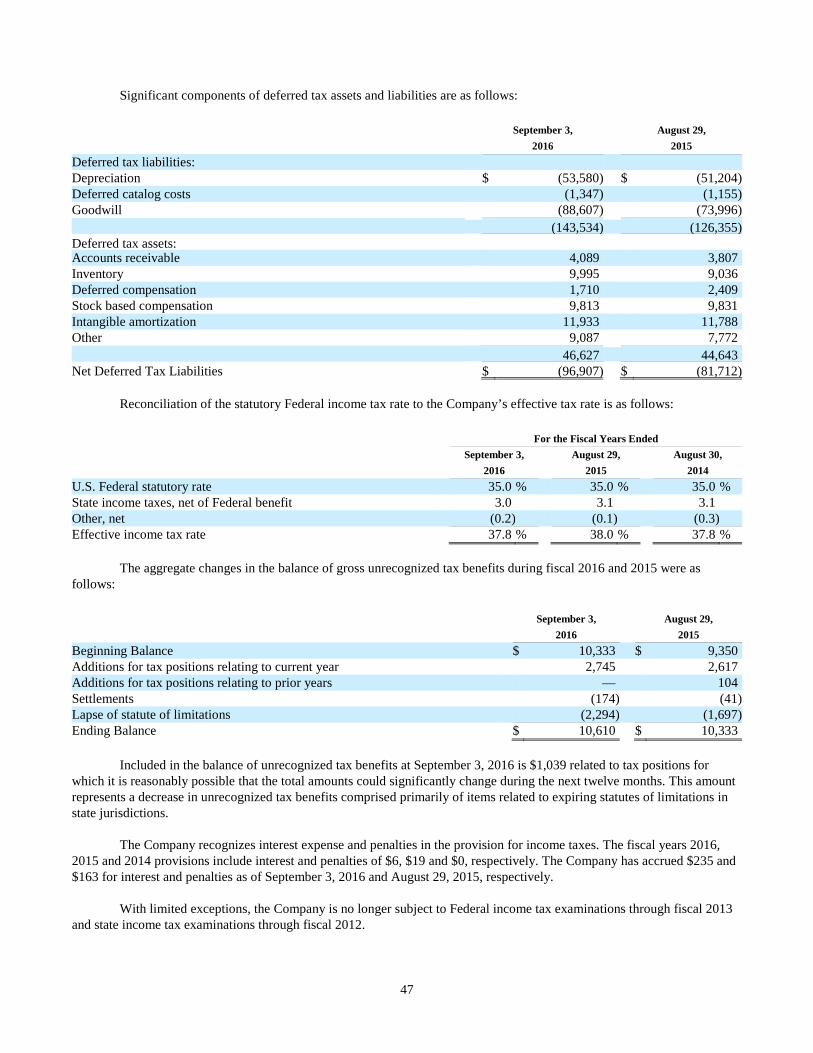
47
Significant components of deferred tax assets and liabilities are as follows:
September 3, August 29, 2016 2015 Deferred tax liabilities: Depreciation $ (53,580) $ (51,204) Deferred catalog costs (1,347) (1,155) Goodwill (88,607) (73,996) (143,534) (126,355) Deferred tax assets: Accounts receivable 4,089 3,807 Inventory 9,995 9,036 Deferred compensation 1,710 2,409 Stock based compensation 9,813 9,831 Intangible amortization 11,933 11,788 Other 9,087 7,772 46,627 44,643 Net Deferred Tax Liabilities $ (96,907) $ (81,712)
Reconciliation of the statutory Federal income tax rate to the Company’s effective tax rate is as follows:
For the Fiscal Years Ended September 3, August 29, August 30, 2016 2015 2014 U.S. Federal statutory rate 35.0 % 35.0 % 35.0 % State income taxes, net of Federal benefit 3.0 3.1 3.1 Other, net (0.2) (0.1) (0.3) Effective income tax rate 37.8 % 38.0 % 37.8 %
The aggregate changes in the balance of gross unrecognized tax benefits during fiscal 2016 and 2015 were as follows:
September 3, August 29, 2016 2015 Beginning Balance $ 10,333 $ 9,350 Additions for tax positions relating to current year 2,745 2,617 Additions for tax positions relating to prior years — 104 Settlements (174) (41) Lapse of statute of limitations (2,294) (1,697) Ending Balance $ 10,610 $ 10,333
Included in the balance of unrecognized tax benefits at September 3, 2016 is $1,039 related to tax positions for which it is reasonably possible that the total amounts could significantly change during the next twelve months. This amount represents a decrease in unrecognized tax benefits comprised primarily of items related to expiring statutes of limitations in state jurisdictions.
The Company recognizes interest expense and penalties in the provision for income taxes. The fiscal years 2016,
2015 and 2014 provisions include interest and penalties of $6, $19 and $0, respectively. The Company has accrued $235 and $163 for interest and penalties as of September 3, 2016 and August 29, 2015, respectively.
With limited exceptions, the Company is no longer subject to Federal income tax examinations through fiscal 2013
and state income tax examinations through fiscal 2012.

48
7. ACCRUED LIABILITIES
Accrued liabilities consist of the following:
September 3, August 29, 2016 2015 Accrued payroll and fringe $ 31,416 $ 25,597 Accrued bonus 12,728 12,820 Accrued sales, property and income taxes 13,541 12,259 Accrued sales rebates and returns 14,206 13,394 Accrued other 29,060 30,424 Total accrued liabilities $ 100,951 $ 94,494
8. DEBT AND CAPITAL LEASE OBLIGATIONS
Debt at September 3, 2016 and August 29, 2015 consisted of the following:
September 3, August 29, 2016 2015 Credit Facility: Revolver $ 217,000 $ 188,000 Term loan 187,500 212,500 Private Placement Debt:
Senior notes, series A 75,000 - Senior notes, series B 100,000 -
Capital lease and financing obligations 28,268 27,804 Less: unamortized debt issuance costs (946) (1,020) Total debt $ 606,822 $ 427,284 Less: current maturities of long-term debt(1) (267,050) (213,165) Long-term debt $ 339,772 $ 214,119
(1) Net of unamortized debt issuance costs expected to be amortized in the next twelve months.
Credit Facility In April 2013, in connection with the acquisition of its Class C Solutions Group, the Company entered into a new
$650,000 credit facility (the “Credit Facility”). The Credit Facility, which matures in April 2018, provides for a five-year unsecured revolving loan facility in the aggregate amount of $400,000 and a five-year unsecured term loan facility in the aggregate amount of $250,000.
The Credit Facility also permits the Company, at its request, and upon the satisfaction of certain conditions, to add
one or more incremental term loan facilities and/or increase the revolving loan commitments in an aggregate amount not to exceed $200,000. Subject to certain limitations, each such incremental term loan facility or revolving commitment increase will be on terms as agreed to by the Company, the Administrative Agent and the lenders providing such financing.
Borrowings under the Credit Facility bear interest, at the Company’s option, either at (i) the LIBOR (London
Interbank Offered Rate) rate plus the applicable margin for LIBOR loans ranging from 1.00% to 1.375%, based on the Company’s consolidated leverage ratio; or (ii) the greatest of (a) the Administrative Agent’s prime rate in effect on such day, (b) the federal funds effective rate in effect on such day, plus 0.50% and (c) the LIBOR rate that would be calculated as of such day in respect of a proposed LIBOR loan with a one-month interest period, plus 1.00%, plus, in the case of each of clauses (a) through (c), an applicable margin ranging from 0.00% to 0.375%, based on the Company’s consolidated leverage ratio. The Company is required to pay a quarterly undrawn fee ranging from 0.10% to 0.20% per annum on the unutilized portion of the Credit Facility based on the Company’s consolidated leverage ratio. The Company is also required to pay quarterly letter of credit usage fees ranging between 1.00% to 1.375% (based on the Company’s consolidated leverage ratio) on the amount of the daily average outstanding letters of credit, and a quarterly fronting fee of 0.125% per annum on the

49
undrawn and unexpired amount of each letter of credit. The applicable borrowing rate for the Company for any borrowings outstanding under the Credit Facility at September 3, 2016 was 1.52%, which represented LIBOR plus 1.00%. Based on the interest period the Company selects, interest may be payable every one, two, three or six months. Interest is reset at the end of each interest period. The Company currently elects to have loans under the Credit Facility bear interest based on LIBOR with one-month interest periods.
The Credit Facility contains several restrictive covenants including the requirement that the Company maintain a
maximum consolidated leverage ratio of total indebtedness to EBITDA of no more than 3.00 to 1.00, and a minimum consolidated interest coverage ratio of EBITDA to total interest expense of at least 3.00 to 1.00, during the term of the Credit Facility. Borrowings under the Credit Facility are guaranteed by certain of the Company’s subsidiaries.
During fiscal 2016, the Company borrowed $305,000 under the revolving loan facility and repaid $276,000 and
$25,000 of the revolving loan facility and term loan facility, respectively. During fiscal 2015, the Company borrowed $336,000 under the revolving loan facility and repaid $218,000 and $25,000 of the revolving loan facility and term loan facility, respectively.
At September 3, 2016 and August 29, 2015, the Company was in compliance with the operating and financial
covenants of the Credit Facility.
Private Placement Debt In July 2016, in connection with the Company’s “modified Dutch auction” tender offer, the Company completed the
issuance and sale of the following unsecured senior notes (collectively “Private Placement Debt”):
• $75,000 aggregate principal amount of 2.65% Senior Notes, Series A, due July 28, 2023 (“Senior notes, series A”); and
• $100,000 aggregate principal amount of 2.90% Senior Notes, Series B, due July 28, 2026 (“Senior notes, series B”)
The Private Placement Debt is due, in full, on the stated maturity dates. Interest is payable semi-annually at the fixed stated interest rates. The Private Placement Debt contains several restrictive covenants including the requirement that the Company maintain a maximum consolidated leverage ratio of total indebtedness to EBITDA (earnings before interest expense, taxes, depreciation, amortization and stock based compensation) of no more than 3.00 to 1.00, and a minimum consolidated interest coverage ratio of EBITDA to total interest expense of at least 3.00 to 1.00, during the term of the Private Placement Debt. At September 3, 2016, the Company was in compliance with the operating and financial covenants of the Private Placement Debt.
Maturities of debt, excluding capital lease and financing obligations, as of September 3, 2016 are as follows:
Maturities of Fiscal Year Debt 2017 $ 267,000 2018 137,500 2019 — 2020 — 2021 — Thereafter 175,000 Total $ 579,500

50
Capital Lease and Financing Obligations
In connection with the construction of the Company’s customer fulfillment center in Columbus, Ohio, the Finance Authority holds the title to the building and entered into a long-term lease with the Company. The lease has a 20-year term with a prepayment option without penalty between 7 and 20 years. At the end of the lease term, the building’s title is transferred to the Company for a nominal amount when the principal of and interest on the bonds have been fully paid. The lease has been classified as a capital lease in accordance with ASC Topic 840. At September 3, 2016 and August 29, 2015, the capital lease obligation was approximately $27,022. Under this arrangement, the Finance Authority has issued taxable bonds to finance the structure and site improvements of the Company’s customer fulfillment center in the amount of $27,022 outstanding at both September 3, 2016 and August 29, 2015.
From time to time, the Company enters into capital leases and financing arrangements to purchase certain
equipment. The equipment acquired from these vendors is paid over a specified period of time based on the terms agreed upon. During the fiscal year ended September 3, 2016, the Company entered into a capital lease and various financing obligations for certain information technology equipment totaling $1,321 and $453, respectively. During the fiscal year ended August 29, 2015, the Company entered into various capital leases and financing obligations for certain information technology equipment totaling $530.
The gross amount of property and equipment acquired under these capital leases and financing agreements at September 3, 2016 and August 29, 2015 was approximately $30,298 and $32,535, respectively. Related accumulated amortization totaled $2,878 and $4,815 as of September 3, 2016 and August 29, 2015, respectively. Amortization expense of property and equipment acquired under these capital leases and financing arrangements was approximately $2,073 for the fiscal year ended 2016.
At September 3, 2016, approximate future minimum payments under capital leases and financing arrangements are as follows:
Fiscal Year
Payments under capital leases and
financing arrangements 2017 $ 1,120 2018 993 2019 993 2020 27,324 Total minimum lease payments $ 30,430 Less: amount representing interest 2,162 Present value of minimum lease payments $ 28,268 Less: current portion 471 Long-term capital leases and financing arrangements $ 27,797
9. SHAREHOLDERS’ EQUITY
Treasury Stock Purchases
In July 2016, the Company commenced a tender offer to purchase for cash up to $300,000 in value of shares of its Class A common stock through a “modified Dutch auction” tender offer at a price per share of not less than $66.00 and not greater than $72.50 (the “Tender Offer”). In addition, the Company entered into a stock purchase agreement with the holders of the Company’s Class B common stock (the “Class B Holders”) to purchase (the “Stock Purchase”) from the Class B Holders a pro rata number of shares at the price per share to be paid by the Company in the Tender Offer, such that the Class B Holders’ percentage ownership and voting power in the Company would remain substantially the same as prior to the Tender Offer. The Class B Holders also agreed not to participate in the Tender Offer.
In August 2016, the Company completed the Tender Offer and purchased 3,821 shares of the Company’s Class A common stock that were validly tendered and not validly withdrawn at a price of $72.50 per share. The Company also completed the Stock Purchase of an aggregate of 1,152 shares of its Class A common stock from the Class B Holders at a

51
purchase price of $72.50 per share. In total, as a result of the Tender Offer and Stock Purchase, the Company purchased 4,973 shares at a price of $72.50 per share for an aggregate cost of $360,566, excluding fees and expenses. The Company incurred costs of $1,587 in connection with the Tender Offer and Stock Purchase resulting in a total cost of $362,153, or $72.82 per share for the shares repurchased, which were recorded to treasury stock. The Company retired all 4,973 shares purchased as a result of the Tender Offer and Stock Purchase.
During fiscal 1999, the Board of Directors established the MSC Stock Repurchase Plan (the “Repurchase Plan”). In 2011, the Board of Directors reaffirmed and replenished the Repurchase Plan so that the total number of shares of Class A common stock authorized for future repurchase was 5,000 shares. As of September 3, 2016, the maximum number of shares that may yet be repurchased under the Repurchase Plan was 1,444 shares. The Repurchase Plan allows the Company to repurchase shares at any time and in any increments it deems appropriate in accordance with Rule 10b-18 under the Securities Exchange Act of 1934, as amended. During fiscal 2016 and 2015, the Company repurchased 5,344 shares and 444 shares, respectively, of its Class A common stock for $384,111 and $33,414, respectively. 72 and 112 of these shares were repurchased by the Company to satisfy the Company’s associates’ tax withholding liability associated with its share-based compensation program during fiscal 2016 and 2015, respectively. Shares of the Company’s common stock purchased pursuant to the Tender Offer and the Stock Purchase, as well as shares purchased to satisfy the Company’s associates’ tax withholding liability associated with its share-based compensation program did not reduce the number of shares that may be repurchased under the Repurchase Plan.
The Company reissued 64 and 63 shares of treasury stock during fiscal 2016 and 2015, respectively, to fund the
Associate Stock Purchase Plan (See Note 10).
Common Stock
Each holder of the Company’s Class A common stock is entitled to one vote for each share held of record on the applicable record date on all matters presented to a vote of shareholders, including the election of directors. The holders of Class B common stock are entitled to ten votes per share on the applicable record date and are entitled to vote, together with the holders of the Class A common stock, on all matters which are subject to shareholder approval. Holders of Class A common stock and Class B common stock have no cumulative voting rights or preemptive rights to purchase or subscribe for any stock or other securities and there are no redemption or sinking fund provisions with respect to such stock.
The holders of the Company’s Class B common stock have the right to convert their shares of Class B common
stock into shares of Class A common stock at their election and on a one-to-one basis, and all shares of Class B common stock convert into shares of Class A common stock on a one to-one basis upon the sale or transfer of such shares of Class B common stock to any person who is not a member of the Jacobson or Gershwind families or any trust not established principally for members of the Jacobson or Gershwind families or to any person who is not an executor, administrator or personal representative of an estate of a member of the Jacobson or Gershwind families.
Preferred Stock The Company has authorized 5,000 shares of preferred stock. The Company’s Board of Directors has the authority
to issue the shares of preferred stock. Shares of preferred stock may have priority over the Company’s Class A common stock and Class B common stock with respect to dividend or liquidation rights, or both. As of September 3, 2016, there were no shares of preferred stock issued or outstanding.
Cash Dividend
In 2003, the Board of Directors instituted a policy of regular quarterly cash dividends to shareholders. This policy is reviewed regularly by the Board of Directors.
On October 27, 2016, the Board of Directors declared a quarterly cash dividend of $0.45 per share, payable on
November 29, 2016 to shareholders of record at the close of business on November 15, 2016. The dividend will result in a payout of approximately $25,461 based on the number of shares outstanding at October 17, 2016.

52
10. ASSOCIATE BENEFIT PLANS The Company accounts for all share-based payments in accordance with ASC 718. Stock-based compensation
expense included in operating expenses for the fiscal years ended September 3, 2016, August 29, 2015 and August 30, 2014 was as follows:
For the Fiscal Years Ended September 3, August 29, August 30, 2016 2015 2014
Stock options $ 4,382 $ 4,614 $ 5,324 Restricted share awards 6,112 8,139 8,898 Restricted stock units 3,205 1,105 2,167 Associate Stock Purchase Plan 286 337 299 Total 13,985 14,195 16,688 Deferred income tax benefit (5,206) (5,266) (6,227) Stock-based compensation expense, net $ 8,779 $ 8,929 $ 10,461
Stock Compensation Plans
2015 Omnibus Incentive Plan
At the Company’s annual meeting of shareholders held on January 15, 2015, the shareholders approved the MSC Industrial Direct Co., Inc. 2015 Omnibus Incentive Plan (“2015 Omnibus Plan”). The 2015 Omnibus Plan replaced the Company’s 2005 Omnibus Incentive Plan (the “Prior Plan”) and beginning January 15, 2015, all awards are granted under the 2015 Omnibus Plan. Awards under the 2015 Omnibus Plan may be made in the form of stock options, stock appreciation rights, restricted stock, restricted stock units, other share-based awards, and performance cash, performance shares or performance units. All outstanding awards under the Prior Plan will continue to be governed by the terms of the Prior Plan. Upon approval of the 2015 Omnibus Plan, the maximum aggregate number of shares of common stock authorized to be issued under the 2015 Omnibus Plan was 5,217 shares, of which 4,911 authorized shares of common stock were remaining as of September 3, 2016.
Stock Options
A summary of the status of the Company’s stock options at September 3, 2016 and changes during the fiscal year then ended is presented in the table and narrative below:
2016
Shares
Weighted-Average
Exercise Price Outstanding - beginning of year 1,274 $ 73.10
Granted 586 58.90 Exercised (144) 51.47 Canceled/Forfeited (71) 74.68 Outstanding - end of year 1,645 $ 69.86
Exercisable - end of year 626 $ 71.78
The total intrinsic value of options exercised during the fiscal years ended September 3, 2016, August 29, 2015 and August 30, 2014 was $3,129, $3,390, and $13,988, respectively. The unrecognized share-based compensation cost related to stock option expense at September 3, 2016 was $7,088 and will be recognized over a weighted average of 2.4 years.
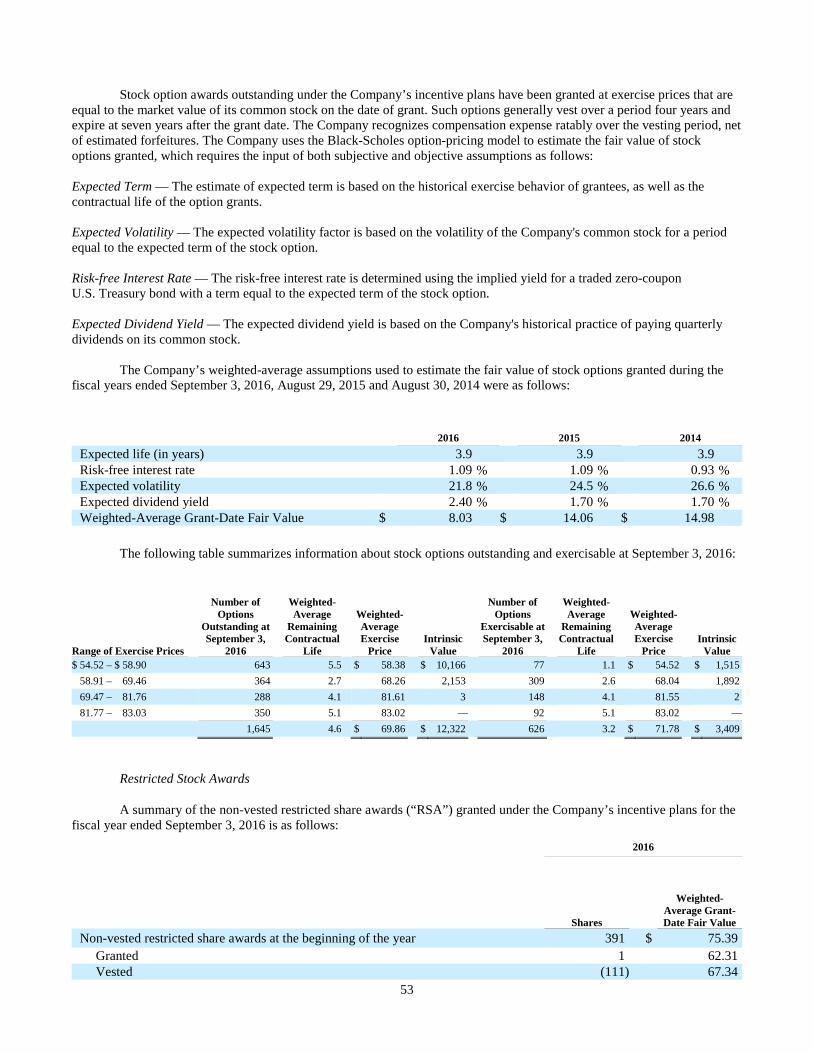
53
Stock option awards outstanding under the Company’s incentive plans have been granted at exercise prices that are equal to the market value of its common stock on the date of grant. Such options generally vest over a period four years and expire at seven years after the grant date. The Company recognizes compensation expense ratably over the vesting period, net of estimated forfeitures. The Company uses the Black-Scholes option-pricing model to estimate the fair value of stock options granted, which requires the input of both subjective and objective assumptions as follows:
Expected Term — The estimate of expected term is based on the historical exercise behavior of grantees, as well as the contractual life of the option grants.
Expected Volatility — The expected volatility factor is based on the volatility of the Company's common stock for a period equal to the expected term of the stock option.
Risk-free Interest Rate — The risk-free interest rate is determined using the implied yield for a traded zero-coupon U.S. Treasury bond with a term equal to the expected term of the stock option.
Expected Dividend Yield — The expected dividend yield is based on the Company's historical practice of paying quarterly dividends on its common stock.
The Company’s weighted-average assumptions used to estimate the fair value of stock options granted during the
fiscal years ended September 3, 2016, August 29, 2015 and August 30, 2014 were as follows:
2016 2015 2014
Expected life (in years) 3.9 3.9 3.9 Risk-free interest rate 1.09 % 1.09 % 0.93 % Expected volatility 21.8 % 24.5 % 26.6 % Expected dividend yield 2.40 % 1.70 % 1.70 % Weighted-Average Grant-Date Fair Value $ 8.03 $ 14.06 $ 14.98
The following table summarizes information about stock options outstanding and exercisable at September 3, 2016:
Range of Exercise Prices
Number of Options
Outstanding at September 3,
2016
Weighted-Average
Remaining Contractual
Life
Weighted-Average Exercise
Price Intrinsic
Value
Number of Options
Exercisable at September 3,
2016
Weighted-Average
Remaining Contractual
Life
Weighted-Average Exercise
Price Intrinsic
Value $ 54.52 – $ 58.90 643 5.5 $ 58.38 $ 10,166 77 1.1 $ 54.52 $ 1,515 58.91 – 69.46 364 2.7 68.26 2,153 309 2.6 68.04 1,892 69.47 – 81.76 288 4.1 81.61 3 148 4.1 81.55 2 81.77 – 83.03 350 5.1 83.02 — 92 5.1 83.02 —
1,645 4.6 $ 69.86 $ 12,322 626 3.2 $ 71.78 $ 3,409
Restricted Stock Awards
A summary of the non-vested restricted share awards (“RSA”) granted under the Company’s incentive plans for the fiscal year ended September 3, 2016 is as follows:
2016
Shares
Weighted-Average Grant-Date Fair Value
Non-vested restricted share awards at the beginning of the year 391 $ 75.39 Granted 1 62.31 Vested (111) 67.34

54
Canceled/Forfeited (16) 78.55 Non-vested restricted share awards at the end of the year 265 $ 78.58
The fair value of each RSA is the closing stock price on the New York Stock Exchange of the Company’s Class A
common stock on the date of grant. Upon vesting, a portion of the RSA may be withheld to satisfy the minimum statutory withholding taxes. The remaining RSAs will be settled in shares of the Company’s Class A common stock after the vesting period.
The fair value of shares vested during the fiscal years ended September 3, 2016, August 29, 2015 and August 30,
2014 was $7,518, $8,107 and $14,214, respectively.
The unrecognized compensation cost related to the non-vested RSAs at September 3, 2016 is $9,284 and will be recognized over a weighted-average period of 2.2 years.
Restricted Stock Units
A summary of the Company’s non-vested restricted stock unit (“RSU”) award activity for the fiscal year ended September 3, 2016 is as follows:
2016
Shares
Weighted-Average Grant-Date Fair
Value Non-vested restricted stock unit awards at the beginning of the year 62 $ 55.09
Granted 207 58.83 Vested (63) 54.69 Canceled/Forfeited (8) 58.81
Non-vested restricted stock unit awards at the end of the year 198 $ 58.98
The fair value of each RSU is the closing stock price on the New York Stock Exchange of the Company’s Class A common stock on the date of grant. Upon vesting, a portion of the RSU award may be withheld to satisfy the minimum statutory withholding taxes. The remaining RSUs will be settled in shares of the Company’s Class A common stock after the vesting period. These awards accrue dividend equivalents on outstanding units (in the form of additional stock units) based on dividends declared on the Company’s Class A common stock and these additional RSUs are subject to the same vesting periods as the RSUs in the underlying award. The dividend equivalents are not included in the RSU table above.
The unrecognized compensation cost related to the RSUs at September 3, 2016 was $8,448 and is expected to be
recognized over a period of 3.9 years. Associate Stock Purchase Plan
The Company has established a qualified Associate Stock Purchase Plan, the terms of which allow for eligible
associates (as defined in the Associate Stock Purchase Plan) to participate in the purchase of up to a maximum of 5 shares of the Company’s Class A common stock at a price equal to 90% of the closing price at the end of each stock purchase period. On January 7, 2009, the shareholders of the Company approved an increase to the authorized but unissued shares of the Class A common stock of the Company reserved for sale under the Associate Stock Purchase Plan from 800 to 1,150 shares. On January 15, 2015, the shareholders of the Company approved an increase to the authorized but unissued shares of the Class A common stock of the Company reserved for sale under the Associate Stock Purchase Plan from 1,150 to 1,500 shares. As of September 3, 2016, approximately 239 shares remain reserved for issuance under this plan. Associates purchased approximately 64 and 63 shares of common stock during fiscal 2016 and 2015 at an average per share price of $61.87 and $66.96, respectively.

55
Savings Plan
The Company maintains a defined contribution plan with both a profit sharing feature and a 401(k) feature which covers all associates who have completed at least one month of service with the Company. For fiscal years 2016, 2015, and 2014, the Company contributed $6,594, $6,665 and $6,174, respectively, to the plan. The Company contributions are discretionary. 11. COMMITMENTS AND CONTINGENCIES
Leases
Certain of the operations of the Company are conducted on leased premises. The leases (most of which require the Company to provide for the payment of real estate taxes, insurance and other operating costs) are for varying periods, the longest extending to the fiscal year 2026. Some of the leased premises contain multiple renewal provisions, exercisable at the Company’s option, as well as escalation clauses. In addition, the Company is obligated under certain equipment and automobile operating leases, which expire on varying dates through fiscal 2020. At September 3, 2016, approximate minimum annual rentals on all such leases are as follows:
Fiscal Year Total Rental Payments 2017 $ 12,081 2018 7,456 2019 5,897 2020 3,308 2021 1,860 Thereafter 1,429 Total $ 32,031
Total rental expense (exclusive of real estate taxes, insurance and other operating costs) for all operating leases for fiscal years 2016, 2015 and 2014 was approximately $13,428, $14,504 and $16,329, respectively, including approximately $1,044, $2,401 and $2,297, respectively, paid to a related party. As a result of the purchase of our Atlanta CFC, which was previously leased with a related party, rental expense was partially offset by the release of a deferred rent liability during fiscal 2016. See Note 2 “Summary of Significant Accounting Policies” for more information about this transaction. 12. LEGAL PROCEEDINGS
There are various claims, lawsuits, and pending actions against the Company incidental to the operation of its business. Although the outcome of these matters is currently not determinable, management does not expect that the ultimate costs to resolve these matters will have a material adverse effect on the Company’s consolidated financial position, results of operations, or liquidity.

56
13. SUMMARY OF QUARTERLY RESULTS (UNAUDITED)
The following table sets forth unaudited financial data for each of the Company’s last eight fiscal quarters.
Fiscal Year Ended September 3, 2016 Fiscal Year Ended August 29, 2015
First
Quarter Second Quarter
Third Quarter
Fourth Quarter
First Quarter
Second Quarter
Third Quarter
Fourth Quarter
(Unaudited) Consolidated Income Statement Data:
Net sales $ 706,819 $ 684,117 $ 727,495 $ 745,074 $ 731,091 $ 706,400 $ 745,483 $ 727,405 Gross profit 318,972 308,791 327,028 334,067 330,149 320,874 338,417 327,135 Income from operations 90,388 80,542 105,784 99,246 93,971 85,874 104,244 95,440 Net income 55,029 49,525 64,816 61,846 57,417 51,527 63,342 59,022 Net income per share:
Basic 0.89 0.81 1.06 1.03 0.92 0.84 1.03 0.96 Diluted 0.89 0.80 1.05 1.02 0.91 0.83 1.03 0.96
57
ITEM 9. CHANGES IN AND DISAGREEMENTS WITH ACCOUNTANTS ON ACCOUNTING AND FINANCIAL DISCLOSURE.
None.
ITEM 9A. CONTROLS AND PROCEDURES. Evaluation of Disclosure Controls and Procedures Under the supervision and with the participation of the Company’s management, including the Company’s Chief Executive Officer and Chief Financial Officer, the Company has evaluated the effectiveness of the Company’s disclosure controls and procedures (as defined in Rule 13a-15(e) under the Exchange Act) as of September 3, 2016. Based on that evaluation, the Company’s Chief Executive Officer and Chief Financial Officer concluded that, as of September 3, 2016, such disclosure controls and procedures were effective in ensuring that information required to be disclosed by the Company in reports that it files or submits under the Securities Exchange Act of 1934, as amended, is (i) recorded, processed, summarized and reported within the time periods specified in the Securities and Exchange Commission’s rules and forms and (ii) accumulated and communicated to our management, including our principal executive officer and principal financial officer, as appropriate to allow timely decisions regarding required disclosure. Management’s Annual Report on Internal Control over Financial Reporting Management is responsible for establishing and maintaining adequate internal control over financial reporting as defined in Rules 13a-15(f) and 15d-15(f) under the Securities Exchange Act of 1934. The Company’s internal control over financial reporting is designed to provide reasonable assurance regarding the reliability of financial reporting and the preparation of financial statements for external purposes in accordance with generally accepted accounting principles. The Company’s internal control over financial reporting includes those policies and procedures that:
(i) pertain to the maintenance of records that, in reasonable detail, accurately and fairly reflect the transactions and dispositions of the Company’s assets;
(ii) provide reasonable assurance that transactions are recorded as necessary to permit preparation of financial statements in accordance with generally accepted accounting principles, and that receipts and expenditures of the Company are being made only in accordance with authorizations of the Company’s management and directors; and
(iii) provide reasonable assurance regarding prevention or timely detection of unauthorized acquisition, use or
disposition of the Company’s assets that could have a material effect on the financial statements.
Because of its inherent limitations, internal control over financial reporting may not prevent or detect misstatements. Also, projections of any evaluation of effectiveness to future periods are subject to the risk that controls may become inadequate because of changes in conditions, or that the degree of compliance with the policies or procedures may deteriorate. Management assessed the effectiveness of the Company’s internal control over financial reporting as of September 3, 2016. In making this assessment, management used the criteria set forth by the Committee of Sponsoring Organizations of the Treadway Commission (COSO) in Internal Control—Integrated Framework (2013 Framework). Based on this assessment, management determined that the Company maintained effective internal control over financial reporting as of September 3, 2016. Attestation Report of the Independent Registered Public Accounting Firm
The effectiveness of the Company’s internal control over financial reporting as of September 3, 2016 has been audited by Ernst & Young LLP, an independent registered public accounting firm, as stated in their report which appears in this Item under the heading “Report of Independent Registered Public Accounting Firm.”

58
Changes in Internal Control Over Financial Reporting
There were no changes in the Company’s internal control over financial reporting that occurred during the quarter ended September 3, 2016 that have materially affected, or are reasonably likely to materially affect, its internal control over financial reporting. In fiscal 2016, the Company initiated the upgrade of its core financial systems including the receivables, payables, treasury, fixed assets and general ledger and expects to complete these implementations in fiscal 2017. Changes in the Company’s key business applications and financial processes as a result of the continuing implementation of its core financial systems and other business systems are being evaluated by management. The Company is designing processes and internal controls to address changes in the Company’s internal control over financial reporting as a result of the core financial systems implementation. This ongoing implementation presents risks to maintain adequate internal controls over financial reporting.

59
Report of Independent Registered Public Accounting Firm The Board of Directors and Shareholders of MSC Industrial Direct Co., Inc. We have audited MSC Industrial Direct Co., Inc. and Subsidiaries’ (the “Company”) internal control over financial reporting as of September 3, 2016, based on criteria established in Internal Control—Integrated Framework issued by the Committee of Sponsoring Organizations of the Treadway Commission (2013 framework) (the COSO criteria). The Company’s management is responsible for maintaining effective internal control over financial reporting, and for its assessment of the effectiveness of internal control over financial reporting included in the accompanying Management’s Annual Report on Internal Control over Financial Reporting. Our responsibility is to express an opinion on the Company’s internal control over financial reporting based on our audit. We conducted our audit in accordance with the standards of the Public Company Accounting Oversight Board (United States). Those standards require that we plan and perform the audit to obtain reasonable assurance about whether effective internal control over financial reporting was maintained in all material respects. Our audit included obtaining an understanding of internal control over financial reporting, assessing the risk that a material weakness exists, testing and evaluating the design and operating effectiveness of internal control based on the assessed risk, and performing such other procedures as we considered necessary in the circumstances. We believe that our audit provides a reasonable basis for our opinion. A company’s internal control over financial reporting is a process designed to provide reasonable assurance regarding the reliability of financial reporting and the preparation of financial statements for external purposes in accordance with generally accepted accounting principles. A company’s internal control over financial reporting includes those policies and procedures that (1) pertain to the maintenance of records that, in reasonable detail, accurately and fairly reflect the transactions and dispositions of the assets of the company; (2) provide reasonable assurance that transactions are recorded as necessary to permit preparation of financial statements in accordance with generally accepted accounting principles, and that receipts and expenditures of the company are being made only in accordance with authorizations of management and directors of the company; and (3) provide reasonable assurance regarding prevention or timely detection of unauthorized acquisition, use, or disposition of the company’s assets that could have a material effect on the financial statements. Because of its inherent limitations, internal control over financial reporting may not prevent or detect misstatements. Also, projections of any evaluation of effectiveness to future periods are subject to the risk that controls may become inadequate because of changes in conditions, or that the degree of compliance with the policies or procedures may deteriorate. In our opinion, the Company maintained, in all material respects, effective internal control over financial reporting as of September 3, 2016, based on the COSO criteria. We also have audited, in accordance with the standards of the Public Company Accounting Oversight Board (United States), the consolidated balance sheets of the Company as of September 3, 2016 and August 29, 2015 and the related consolidated statements of income, comprehensive income, shareholders’ equity, and cash flows for each of the three fiscal years in the period ended September 3, 2016 of the Company and our report dated November 1, 2016 expressed an unqualified opinion thereon. /s/ Ernst & Young LLP Jericho, New York November 1, 2016

60
ITEM 9B. OTHER INFORMATION. None.
PART III.
ITEM 10. DIRECTORS, EXECUTIVE OFFICERS AND CORPORATE GOVERNANCE. Information called for by Item 10 is set forth under the headings “Election of Directors” and “Corporate Governance” in the Company’s Proxy Statement for the annual meeting of shareholders to be held in January 2017, or the 2016 Proxy Statement, which is incorporated herein by this reference. ITEM 11. EXECUTIVE COMPENSATION. Information called for by Item 11 is set forth under the headings “Executive Compensation”, “Corporate Governance—Compensation Committee.” “Compensation Committee Report” and “Director Compensation” in the 2016 Proxy Statement, which is incorporated herein by this reference. ITEM 12. SECURITY OWNERSHIP OF CERTAIN BENEFICIAL OWNERS AND MANAGEMENT AND
RELATED STOCKHOLDER MATTERS. Information called for by Item 12 is set forth under the headings “Security Ownership of Certain Beneficial Owners and Management” and “Equity Compensation Plan Information” in the 2016 Proxy Statement, which is incorporated herein by this reference. ITEM 13. CERTAIN RELATIONSHIPS AND RELATED TRANSACTIONS, AND DIRECTOR INDEPENDENCE. Information called for by Item 13 is set forth under the heading “Certain Relationships and Related Person Transactions” and “Corporate Governance” in the 2016 Proxy Statement, which is incorporated herein by this reference. ITEM 14. PRINCIPAL ACCOUNTANT FEES AND SERVICES. Information called for by Item 14 is set forth under the heading “Ratification of Appointment of Independent Registered Public Accounting Firm” in the 2016 Proxy Statement, which is incorporated herein by this reference.
61
PART IV.
ITEM 15. EXHIBITS AND FINANCIAL STATEMENT SCHEDULES. (a)(1) Index to Financial Statements Financial statements filed as a part of this report are listed on the “Index to Consolidated Financial Statements” at page 30 herein. (a)(2) Financial Statement Schedules For the three fiscal years ended September 3, 2016.
Page Schedule II—Valuation and Qualifying Accounts S-1
All other schedules have been omitted because the information is not applicable or is presented in the Consolidated Financial Statements or Notes thereto.
(a)(3) Exhibits
Exhibits are filed with this report or incorporated by reference to the Exhibit Index immediately preceding the exhibits attached to this Annual Report on Form 10-K.

62
SIGNATURES
Pursuant to the requirements of Section 13 or 15(d) of the Securities Exchange Act of 1934, the Registrant has duly caused this report to be signed on its behalf by the undersigned, thereunto duly authorized.
MSC INDUSTRIAL DIRECT CO., INC.
By: /s/ ERIK GERSHWIND Erik Gershwind
Chief Executive Officer (Principal Executive Officer)
Dated: November 1, 2016
Pursuant to the requirements of the Securities Exchange Act of 1934, this report has been signed below by the following persons on behalf of the registrant and in the capacities and on the dates indicated.
-
Signature Title Date
/s/ MITCHELL JACOBSON Mitchell Jacobson
Chairman of the Board of Directors November 1, 2016
/s/ ERIK GERSHWIND Erik Gershwind
President and Chief Executive Officer and Director (Principal Executive Officer)
November 1, 2016
/s/ RUSTOM JILLA Rustom Jilla
Executive Vice President and Chief Financial Officer (Principal Financial Officer and Principal Accounting Officer)
November 1, 2016
/s/ JONATHAN BYRNES Jonathan Byrnes
Director November 1, 2016
/s/ ROGER FRADIN Roger Fradin
Director November 1, 2016
/s/ LOUISE GOESER Louise Goeser
Director November 1, 2016
/s/ MICHAEL KAUFMANN Michael Kaufmann
Director November 1, 2016
/s/ DENIS KELLY Denis Kelly
Director November 1, 2016
/s/ STEVEN PALADINO Steven Paladino
Director November 1, 2016
/s/ PHILIP PELLER Philip Peller
Director November 1, 2016

S-1
MSC INDUSTRIAL DIRECT CO., INC. AND SUBSIDIARIES SCHEDULE II VALUATION AND QUALIFYING ACCOUNTS
(In thousands)
Description
Balance at Beginning of
Year
Charged to Costs and Expenses
Charged to Other
Accounts Deductions(2) Balance at
End of Year Deducted from asset accounts: For the fiscal year ended August 30, 2014 Allowance for doubtful accounts(1) $ 7,523 $ 4,629 $ — $ 2,842 $ 9,310 Deducted from asset accounts: For the fiscal year ended August 29, 2015 Allowance for doubtful accounts(1) $ 9,310 $ 6,665 $ — $ 4,663 $ 11,312 Deducted from asset accounts: For the fiscal year ended September 3, 2016 Allowance for doubtful accounts(1) $ 11,312 $ 6,997 $ — $ 5,956 $ 12,353
(1) Included in accounts receivable. (2) Comprised of uncollected accounts charged against the allowance.

II-1
EXHIBIT INDEX
Exhibit No.
Description
2.01 Stock Purchase Agreement by and among JLK Direct Distribution, Inc., Kennametal Inc., MSC Industrial Direct Co., Inc. and MSC Acquisition Corp. VI dated as of March 15, 2006 (incorporated by reference to Exhibit 2.1 to the Registrant’s Current Report on Form 8-K filed with the SEC on March 16, 2006) (SEC File No. 001-14130).
2.02 Asset Purchase Agreement, dated February 22, 2013, between MSC Industrial Direct Co., Inc. and Barnes Group Inc. (incorporated by reference to Exhibit 2.1 to the Registrant’s Current Report on Form 8-K filed with the SEC on February 26, 2013) (SEC File No. 001-14130).
3.01 Certificate of Incorporation of the Registrant.* 3.02 Amended and Restated By-laws of the Registrant (incorporated by reference to Exhibit 3.1 to the Registrant’s
Current Report on Form 8-K, filed with the SEC on October 26, 2012) (SEC File No. 001-14130). 4.01 Specimen Class A Common Stock Certificate.* 4.02 Note Purchase Agreement, dated July 28, 2016, by and among MSC Industrial Direct Co., Inc. and the
purchasers named therein (incorporated by reference to Exhibit (b)(2) to the Registrant’s Schedule TO-I/A filed with the SEC on July 28, 2016) (SEC File No. 005-44935).
4.03 Form of Form of 2.65% Senior Note, Series A, due July 28, 2023 (included in Exhibit 4.02). 4.04 Form of Form of 2.90% Senior Note, Series B, due July 28, 2026 (included in Exhibit 4.02).
10.01 Amended and Restated Change in Control Agreement, dated December 3, 2014 between MSC Industrial Direct Co., Inc. and Erik Gershwind (incorporated by reference to Exhibit 10.1 to the Registrant’s Current Report on Form 8-K filed with the SEC on December 3, 2014) (SEC File No. 001-14130).†
10.02 Amended and Restated Change in Control Agreement, dated December 3, 2014 between MSC Industrial Direct Co., Inc. and Douglas Jones (incorporated by reference to Exhibit 10.3 to the Registrant’s Current Report on Form 8-K filed with the SEC on December 3, 2014) (SEC File No. 001-14130).†
10.03 Amended and Restated Change in Control Agreement, dated December 3, 2014 between MSC Industrial Direct Co., Inc. and Steve Armstrong (incorporated by reference to Exhibit 10.7 to the Registrant’s Quarterly Report on Form 10-Q filed with the SEC on April 9, 2015) (SEC File No. 001-14130).†
10.04
Amended and Restated Change in Control Agreement, dated December 3, 2014 between MSC Industrial Direct Co., Inc. and Charles Bonomo (incorporated by reference to Exhibit 10.8 to the Registrant’s Quarterly Report on Form 10-Q filed with the SEC on April 9, 2015) (SEC File No. 001-14130).†
10.05 Change in Control Agreement, dated December 3, 2014 between MSC Industrial Direct Co., Inc. and Kari Heerdt (incorporated by reference to Exhibit 10.9 to the Registrant’s Quarterly Report on Form 10-Q filed with the SEC on April 9, 2015) (SEC File No. 001-14130).†
10.06 Amended and Restated Change in Control Agreement, dated December 3, 2014 between MSC Industrial Direct Co., Inc. and Christopher Davanzo (incorporated by reference to Exhibit 10.10 to the Registrant’s Quarterly Report on Form 10-Q filed with the SEC on April 9, 2015) (SEC File No. 001-14130).†
10.07 Change in Control Agreement, dated September 24, 2015 between MSC Industrial Direct Co., Inc. and Rustom Jilla (incorporated by reference to Exhibit 10.1 to the Registrant’s Current Report on Form 8-K filed with the SEC on September 24, 2015) (SEC File No. 001-14130).†
10.08 Amended and Restated Change in Control Agreement, dated December 3, 2014 between MSC Industrial Direct Co., Inc. and Gregory Polli (incorporated by reference to Exhibit 10.1 to the Registrant’s Quarterly Report on Form 10-Q filed with the SEC on April 6, 2016) (SEC File No. 001-14130).†
10.09 Change in Control Agreement, dated March 31, 2016 between MSC Industrial Direct Co., Inc. and Steven Baruch (incorporated by reference to Exhibit 10.2 to the Registrant’s Quarterly Report on Form 10-Q filed with the SEC on April 6, 2016) (SEC File No. 001-14130).†
10.10 Change in Control Agreement, dated March 31, 2016 between MSC Industrial Direct Co., Inc. and David Wright (incorporated by reference to Exhibit 10.3 to the Registrant’s Quarterly Report on Form 10-Q filed with the SEC on April 6, 2016) (SEC File No. 001-14130).†
10.11 Agreement of Lease, dated as of July 13, 1989, by and between Mitchmar Atlanta Properties, Inc. and Sid Tool Co., Inc. (incorporated by reference to Exhibit 10.1 to the Registrant’s Current Report on Form 8-K filed with the SEC on April 7, 2008) (SEC File No. 001-14130).
10.12 First Amendment to Lease, dated as of August 10, 1996, by and between Mitchmar Atlanta Properties, Inc. and Sid Tool Co., Inc. (incorporated by reference to Exhibit 10.2 to the Registrant’s Current Report on Form 8-K filed with the SEC on April 7, 2008) (SEC File No. 001-14130).

II-2
Exhibit No.
Description
10.13 Second Amendment to Lease, dated as of May 7, 2003, by and between Mitchmar Atlanta Properties, Inc. and Sid Tool Co., Inc. (incorporated by reference to Exhibit 10.3 to the Registrant’s Current Report on Form 8-K filed with the SEC on April 7, 2008) (SEC File No. 001-14130).
10.14 Third Amendment to Lease Agreement, dated as of November 11, 2003, by and between Mitchmar Atlanta Properties, Inc. and Sid Tool Co., Inc. (incorporated by reference to Exhibit 10.4 to the Registrant’s Current Report on Form 8-K filed with the SEC on April 7, 2008) (SEC File No. 001-14130).
10.15 Fourth Amendment of Lease Agreement, dated as of March 17, 2007, by and between Mitchmar Atlanta Properties, Inc. and Sid Tool Co., Inc. (incorporated by reference to Exhibit 10.5 to the Registrant’s Current Report on Form 8-K filed with the SEC on April 7, 2008) (SEC File No. 001-14130).
10.16 Fifth Amendment of Lease Agreement, dated as of March 25, 2008, by and between Mitchmar Atlanta Properties, Inc. and Sid Tool Co., Inc. (incorporated by reference to Exhibit 10.6 to the Registrant’s Current Report on Form 8-K filed with the SEC on April 7, 2008) (SEC File No. 001-14130).
10.17 MSC Industrial Direct Co., Inc. Amended and Restated Associate Stock Purchase Plan (incorporated by reference to Exhibit 4.04 to the Registrant’s Registration Statement on Form S-8 (333-201523) filed with the SEC on January 15, 2015).†
10.18 Executive Incentive Compensation Recoupment Policy (incorporated by reference to Exhibit 10.3 to the Registrant’s Quarterly Report on Form 10-Q filed with the SEC on January 7, 2010) (SEC File No. 001-14130).†
10.19 Restricted Stock Unit Agreement awarded to David Sandler, dated October 19, 2010 (incorporated by reference to Exhibit 10.01 to the Registrant’s Current Report on Form 8-K filed with the SEC on October 21, 2010) (SEC File No. 001-14130).†
10.20 Second Amended and Restated Agreement dated October 19, 2010 between the Registrant and David Sandler (incorporated by reference to Exhibit 10.02 to the Registrant’s Current Report on Form 8-K filed with the SEC on October 21, 2010) (SEC File No. 001-14130).†
10.21 Summary of Non-Executive Directors’ Compensation (incorporated by reference to Exhibit 10.2 to the Registrant’s Quarterly Report on Form 10-Q filed with the SEC on January 7, 2016) (SEC File No. 001-14130).†
10.22 MSC Industrial Direct Co., Inc. 2005 Omnibus Incentive Plan, as amended through November 13, 2014 (incorporated by reference to Exhibit 10.2 of the Registrant’s Quarterly Report on Form 10-Q filed with the SEC on January 8, 2015) (SEC File No. 001-14130).†
10.23 MSC Industrial Direct Co., Inc. 2015 Omnibus Incentive Plan (incorporated by reference to Exhibit 99.01 to the Registrant’s Registration Statement on Form S-8 (333-201522) filed with the SEC on January 15, 2015).†
10.24 Form of Non-Qualified Stock Option Agreement under the MSC Industrial Direct Co., Inc. 2005 Omnibus Incentive Plan (incorporated by reference to Exhibit 10.3 to the Registrant’s Quarterly Report on Form 10-Q filed with the SEC on April 7, 2011) (SEC File No. 001-14130).†
10.25 Form of Restricted Stock Award under the MSC Industrial Direct Co., Inc. 2005 Omnibus Incentive Plan (incorporated by reference to Exhibit 10.4 to the Registrant’s Quarterly Report on Form 10-Q filed with the SEC on April 7, 2011) (SEC File No. 001-14130).†
10.26 Form of Non-Qualified Stock Option Agreement under the MSC Industrial Direct Co., Inc. 2015 Omnibus Incentive Plan (incorporated by reference to Exhibit 10.3 to the Registrant’s Quarterly Report on Form 10-Q filed with the SEC on January 7, 2016) (SEC File No. 001-14130).†
10.27 Form of Restricted Stock Unit Agreement under the MSC Industrial Direct Co., Inc. 2015 Omnibus Incentive Plan (incorporated by reference to Exhibit 10.4 to the Registrant’s Quarterly Report on Form 10-Q filed with the SEC on January 7, 2016) (SEC File No. 001-14130).†
10.28 MSC Industrial Direct Relocation Policy (incorporated by reference to Exhibit 10.02 to the Registrant’s Current Report on Form 8-K filed with the SEC on March 30, 2011) (SEC File No. 001-14130).†
10.29 Relocation Reimbursement Agreement & Policy Acknowledgment (incorporated by reference to Exhibit 10.03 to the Registrant’s Current Report on Form 8-K filed with the SEC on March 30, 2011) (SEC File No. 001-14130).†
10.30 Form of Director and Executive Officer Indemnification Agreement (incorporated by reference to Exhibit 10.1 to the Registrant’s Current Report on Form 8-K filed with the SEC on January 25, 2016).†
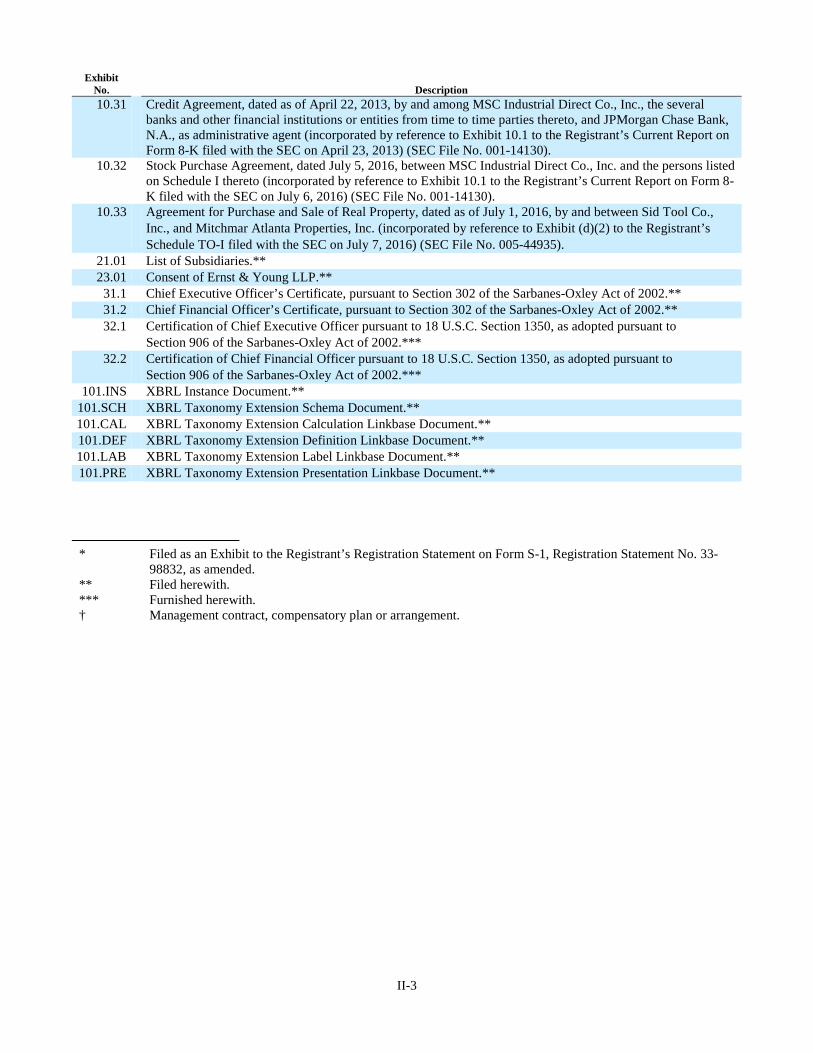
II-3
Exhibit No.
Description
10.31
Credit Agreement, dated as of April 22, 2013, by and among MSC Industrial Direct Co., Inc., the several banks and other financial institutions or entities from time to time parties thereto, and JPMorgan Chase Bank, N.A., as administrative agent (incorporated by reference to Exhibit 10.1 to the Registrant’s Current Report on Form 8-K filed with the SEC on April 23, 2013) (SEC File No. 001-14130).
10.32 Stock Purchase Agreement, dated July 5, 2016, between MSC Industrial Direct Co., Inc. and the persons listed on Schedule I thereto (incorporated by reference to Exhibit 10.1 to the Registrant’s Current Report on Form 8-K filed with the SEC on July 6, 2016) (SEC File No. 001‐14130).
10.33 Agreement for Purchase and Sale of Real Property, dated as of July 1, 2016, by and between Sid Tool Co., Inc., and Mitchmar Atlanta Properties, Inc. (incorporated by reference to Exhibit (d)(2) to the Registrant’s Schedule TO-I filed with the SEC on July 7, 2016) (SEC File No. 005-44935).
21.01 List of Subsidiaries.** 23.01 Consent of Ernst & Young LLP.**
31.1 Chief Executive Officer’s Certificate, pursuant to Section 302 of the Sarbanes-Oxley Act of 2002.** 31.2 Chief Financial Officer’s Certificate, pursuant to Section 302 of the Sarbanes-Oxley Act of 2002.** 32.1 Certification of Chief Executive Officer pursuant to 18 U.S.C. Section 1350, as adopted pursuant to
Section 906 of the Sarbanes-Oxley Act of 2002.*** 32.2 Certification of Chief Financial Officer pursuant to 18 U.S.C. Section 1350, as adopted pursuant to
Section 906 of the Sarbanes-Oxley Act of 2002.*** 101.INS XBRL Instance Document.**
101.SCH XBRL Taxonomy Extension Schema Document.** 101.CAL XBRL Taxonomy Extension Calculation Linkbase Document.** 101.DEF XBRL Taxonomy Extension Definition Linkbase Document.** 101.LAB XBRL Taxonomy Extension Label Linkbase Document.** 101.PRE XBRL Taxonomy Extension Presentation Linkbase Document.**
* Filed as an Exhibit to the Registrant’s Registration Statement on Form S-1, Registration Statement No. 33-98832, as amended.
** Filed herewith. *** Furnished herewith. † Management contract, compensatory plan or arrangement.

EXHIBIT 21.01
SUBSIDIARIES OF MSC INDUSTRIAL DIRECT CO., INC.
CORPORATION
STATE OF INCORPORATION
Sid Tool Co., Inc. New York Primeline International, Inc. New York MSC Services Corp. New York Swiss Precision Instruments Inc. California Enco Manufacturing Company, Inc. New York J&L America, Inc. Michigan MSC Acquisition Corp VI New York MSC Contract Management, Inc. New York MSC Foreign Properties Corporation Delaware American Specialty Grinding Co., Inc. Massachusetts MSC Acquisition Corp VII New York Mission Real Estate Acquisition Company Delaware MSC Industrial Supply ULC Canada MSC Acquisition Corp III New York

EXHIBIT 23.01
CONSENT OF INDEPENDENT REGISTERED PUBLIC ACCOUNTING FIRM We consent to the incorporation by reference in the following Registration Statements:
(1) Registration Statement (Form S-8 No. 333-48901), pertaining to the MSC Industrial Direct 401(k) Plan;
(2) Registration Statement (Form S-8 No. 333-70293), pertaining to the Associate Stock Purchase Plan;
(3) Registration Statement (Form S-8 No. 333-130899 and Form S-8 No. 333-164362), pertaining to the 2005
Omnibus Incentive Plan;
(4) Registration Statement (Form S-8 No. 333-156850 and Form S-8 No. 333-201523), pertaining to the MSC
Industrial Direct Co., Inc. Amended and Restated Associate Stock Purchase Plan; and
(5) Registration Statement (Form S-8 No. 333-201522), pertaining to the 2015 Omnibus Incentive Plan
of our reports dated November 1, 2016, with respect to the consolidated financial statements and schedule of MSC Industrial Direct Co., Inc. and Subsidiaries and the effectiveness of internal control over financial reporting of MSC Industrial Direct Co., Inc. and Subsidiaries, included in this Annual Report (Form 10-K) of MSC Industrial Direct Co., Inc. for the year ended September 3, 2016. /s/ Ernst & Young LLP Jericho, New York November 1, 2016

EXHIBIT 31.1 CERTIFICATIONS
I, Erik Gershwind, certify that:
1. I have reviewed this Annual Report on Form 10-K of MSC Industrial Direct Co., Inc.;
2. Based on my knowledge, this report does not contain any untrue statement of a material fact or omit to state a material fact necessary to make the statements made, in light of the circumstances under which such statements were made, not misleading with respect to the period covered by this report;
3. Based on my knowledge, the financial statements, and other financial information included in this report, fairly present in all material respects the financial condition, results of operations and cash flows of the registrant as of, and for, the periods presented in this report;
4. The registrant’s other certifying officer and I are responsible for establishing and maintaining disclosure controls and procedures (as defined in Exchange Act Rules 13a-15(e) and 15d-15(e)) and internal control over financial reporting (as defined in Exchange Act Rules 13a-15(f) and 15d-15(f)) for the registrant and have:
(a) Designed such disclosure controls and procedures, or caused such disclosure controls and procedures to be designed under our supervision, to ensure that material information relating to the registrant, including its consolidated subsidiaries, is made known to us by others within those entities, particularly during the period in which this report is being prepared;
(b) Designed such internal control over financial reporting, or caused such internal control over financial reporting to be designed under our supervision, to provide reasonable assurance regarding the reliability of financial reporting and the preparation of financial statements for external purposes in accordance with generally accepted accounting principles;
(c) Evaluated the effectiveness of the registrant’s disclosure controls and procedures and presented in this report our conclusions about the effectiveness of the disclosure controls and procedures, as of the end of the period covered by this report based on such evaluation; and
(d) Disclosed in this report any changes in the registrant’s internal control over financial reporting that occurred during the registrant’s most recent fiscal quarter (the registrant’s fourth fiscal quarter in the case of an annual report) that has materially affected, or is reasonably likely to materially affect, the registrant’s internal control over financial reporting; and
5. The registrant’s other certifying officer and I have disclosed, based on our most recent evaluation of internal control over financial reporting, to the registrant’s auditors and the audit committee of the registrant’s board of directors (or persons performing the equivalent functions):
(a) All significant deficiencies and material weaknesses in the design or operation of internal control over financial reporting which are reasonably likely to adversely affect the registrant’s ability to record, process, summarize and report financial information; and
(b) Any fraud, whether or not material, that involves management or other employees who have a significant role in the registrant’s internal control over financial reporting.
Date: November 1, 2016
/s/ ERIK GERSHWIND Erik Gershwind
President and Chief Executive Officer (Principal Executive Officer)

EXHIBIT 31.2
CERTIFICATIONS
I, Rustom Jilla, certify that:
1. I have reviewed this Annual Report on Form 10-K of MSC Industrial Direct Co., Inc.;
2. Based on my knowledge, this report does not contain any untrue statement of a material fact or omit to state a material fact necessary to make the statements made, in light of the circumstances under which such statements were made, not misleading with respect to the period covered by this report;
3. Based on my knowledge, the financial statements, and other financial information included in this report, fairly present in all material respects the financial condition, results of operations and cash flows of the registrant as of, and for, the periods presented in this report;
4. The registrant’s other certifying officer and I are responsible for establishing and maintaining disclosure controls and procedures (as defined in Exchange Act Rules 13a-15(e) and 15d-15(e)) and internal control over financial reporting (as defined in Exchange Act Rules 13a-15(f) and 15d-15(f)) for the registrant and have:
(a) Designed such disclosure controls and procedures, or caused such disclosure controls and procedures to be designed under our supervision, to ensure that material information relating to the registrant, including its consolidated subsidiaries, is made known to us by others within those entities, particularly during the period in which this report is being prepared;
(b) Designed such internal control over financial reporting, or caused such internal control over financial reporting to be designed under our supervision, to provide reasonable assurance regarding the reliability of financial reporting and the preparation of financial statements for external purposes in accordance with generally accepted accounting principles;
(c) Evaluated the effectiveness of the registrant’s disclosure controls and procedures and presented in this report our conclusions about the effectiveness of the disclosure controls and procedures, as of the end of the period covered by this report based on such evaluation; and
(d) Disclosed in this report any changes in the registrant’s internal control over financial reporting that occurred during the registrant’s most recent fiscal quarter (the registrant’s fourth fiscal quarter in the case of an annual report) that has materially affected, or is reasonably likely to materially affect, the registrant’s internal control over financial reporting; and
5. The registrant’s other certifying officer and I have disclosed, based on our most recent evaluation of internal control over financial reporting, to the registrant’s auditors and the audit committee of the registrant’s board of directors (or persons performing the equivalent functions):
(a) All significant deficiencies and material weaknesses in the design or operation of internal control over financial reporting which are reasonably likely to adversely affect the registrant’s ability to record, process, summarize and report financial information; and
(b) Any fraud, whether or not material, that involves management or other employees who have a significant role in the registrant’s internal control over financial reporting.
Date: November 1, 2016
/s/ RUSTOM JILLA Rustom Jilla
Executive Vice President and Chief Financial Officer (Principal Financial Officer)
EXHIBIT 32.1
CERTIFICATION PURSUANT TO SECTION 906 OF THE SARBANES-OXLEY ACT OF 2002
In connection with the Annual Report on Form 10-K of MSC Industrial Direct Co., Inc. (the “Company”) for the fiscal year ended September 3, 2016, as filed with the Securities and Exchange Commission on the date hereof (the “Report”), I, Erik Gershwind, Chief Executive Officer of the Company, certify, pursuant to Section 906 of the Sarbanes-Oxley Act of 2002, that:
(1) the Report fully complies with the requirements of Section 13(a) or 15(d) of the Securities Exchange Act of 1934; and
(2) the information contained in the Report fairly presents, in all material respects, the financial condition and results of operations of the Company.
Date: November 1, 2016
/s/ ERIK GERSHWIND Erik Gershwind
President and Chief Executive Officer (Principal Executive Officer)
A signed original of this written statement required by Section 906 has been provided to MSC Industrial Direct Co., Inc. and will be retained by it and furnished to the Securities and Exchange Commission or its staff upon request.
EXHIBIT 32.2
CERTIFICATION PURSUANT TO SECTION 906 OF THE SARBANES-OXLEY ACT OF 2002
In connection with the Annual Report on Form 10-K of MSC Industrial Direct Co., Inc. (the “Company”) for the fiscal year ended September 3, 2016, as filed with the Securities and Exchange Commission on the date hereof (the “Report”), I, Rustom Jilla, Chief Financial Officer of the Company, certify, pursuant to Section 906 of the Sarbanes-Oxley Act of 2002, that:
(1) the Report fully complies with the requirements of Section 13(a) or 15(d) of the Securities Exchange Act of 1934; and
(2) the information contained in the Report fairly presents, in all material respects, the financial condition and results of operations of the Company.
Date: November 1, 2016
/s/ RUSTOM JILLA Rustom Jilla
Chief Financial Officer (Principal Financial Officer)
A signed original of this written statement required by Section 906 has been provided to MSC Industrial Direct Co., Inc. and will be retained by it and furnished to the Securities and Exchange Commission or its staff upon request.

CORPORATE INFORMATION
Board of DirectorsJonathan Byrnes Senior Lecturer Massachusetts Institute of Technology
Roger Fradin Vice Chairman Honeywell International Inc.
Erik Gershwind President and Chief Executive Officer MSC Industrial Supply Co.
Louise Goeser President and Chief Executive Officer Grupo Siemens S.A. de C.V. (Siemens Mesoamerica)
Mitchell Jacobson Non-Executive Chairman of the Board MSC Industrial Supply Co.
Michael Kaufmann Chief Financial Officer Cardinal Health, Inc.
Denis Kelly Managing Partner Scura Paley LLC
Steven Paladino Executive Vice President and Chief Financial Officer Henry Schein, Inc.
Philip Peller Independent Director Retired Partner, Arthur Andersen LLP
Executive OfficersErik Gershwind President and Chief Executive Officer
Rustom Jilla Executive Vice President and Chief Financial Officer
Douglas Jones Executive Vice President and Chief Supply Chain Officer
Steve Armstrong Senior Vice President, General Counsel and Corporate Secretary
Steven Baruch Senior Vice President and Chief Strategy & Marketing Officer
Charles Bonomo Senior Vice President and Chief Information Officer
Christopher Davanzo Senior Vice President, Finance and Corporate Controller
Kari Heerdt Senior Vice President and Chief People Officer
Gregory Polli Senior Vice President, Product Management
David Wright Senior Vice President, Sales
Corporate InformationANNUAL MEETING
The 2017 Annual Meeting of
Shareholders will be held at:
Hilton Long Island/Huntington
598 Broad Hollow Road
Melville, New York 11747
on Thursday, January 26, 2017 at 9 a.m.
COMPANY HEADQUARTERS
MSC Industrial Supply Co.
75 Maxess Road
Melville, New York 11747
MSC Industrial Supply Co.
525 Harbour Place Drive
Davidson, North Carolina 28036
WEBSITE
www.mscdirect.com
INVESTOR RELATIONS CONTACT
John Chironna
MSC Industrial Supply Co.
(704) 987-5231
Copies of our Annual Report on
Form 10-K for the fiscal year ended
September 3, 2016 are available
without charge, upon request.
INDEPENDENT REGISTERED PUBLIC
ACCOUNTING FIRM
Ernst & Young LLP
Jericho, New York
LEGAL COUNSEL
Curtis, Mallet-Prevost, Colt & Mosle LLP
New York, New York
REGISTRAR AND TRANSFER AGENT
Computershare Trust Company, N.A.
c/o Computershare Investor Services
P.O. Box 30202
College Station, Texas 77842-9909
COMMON STOCK LISTED
MSC Industrial Supply Co.’s Class A
common stock is traded on the
New York Stock Exchange under
the symbol “MSM.”
DIVIDEND POLICY
The Company has instituted a policy
of regular quarterly cash dividends to
shareholders. Currently, the quarterly
dividend rate is $0.45 per share, or
$1.80 per share annually.
Ann
ual R
ep
ort
De
sig
n b
y C
urra
n &
Co
nno
rs, I
nc. /
ww
w.c
urra
n-c
onn
ors
.co
m

MSC INDUSTRIAL SUPPLY CO.75 Maxess RoadMelville, New York 11747516.812.2000
www.mscdirect.com
NYSE listed: MSM