building an lca inventory
TRANSCRIPT

Building an LCA Inventory:A Worked Example on a CO2 to Fertilizer Process
SUPPORTED BY
Technisc�I '
Universit�; • ,j Berlin
RWIHAACHEN UNIVERSllY
The University Of Sheffield. GLOBAL CO,
INITIATIVE UNIVERSITY OF MICHIGAN

Published April 2020 This work is available under DOI 10.3998/2027.42/154989 and can be downloaded via http://hdl.handle.net/2027.42/154989
Main Contributors
The University of Sheffield
Ana Villa Zaragoza
Stephen McCord
Peter Styring
Further Contributions
Institute for Advanced Sustainability Studies e.V. Potsdam
Lorenzo Cremonese
Till Strunge
Global CO2 Initiative
Volker Sick

Foreword
Climate change is one of the largest challenges of our time. It is proven that excess amounts of carbon
dioxide that humanity has added to the atmosphere plays a key role, and left unaddressed, this will alter
ecosystems and fundamentally change life as we know it. Under the auspices of the UN Framework
Convention on Climate Change and through the Paris Agreement, there is a commitment to keep global
temperature increase to well below two degrees Celsius. Meeting this goal will require a variety of
strategies including increased renewable power generation and broad scale electrification, increased
energy efficiency, and carbon-negative technologies. Carbon-negative technologies serve two purposes,
as a climate mitigation tool near term, and to create a new carbon economy that recycles carbon over the
long term- balancing emissions of still essential industrial sectors such as cement and steel. Overall,
carbon-negative technologies are a valuable strategy in an overall portfolio of approaches to stabilize the
atmospheric carbon dioxide concentration at a level that supports human life on Earth.
Increased attention is being paid to the notion that carbon dioxide can become a valuable resource
instead of being a waste product with severe negative consequences to the earth’s climate. New
technologies, new use cases, interest from the investment community, and growing legislative support
poise the use of a carbon dioxide feedstock as a viable economic and societal opportunity.
But not all that glitters is gold! Thorough assessment of the environmental and economic benefits of new
technologies is paramount prior to deployment. Transparent and consistent life cycle assessments and
techno-economic assessments must provide unbiased information to decision makers to enable sound
decisions on investments, deployments, and public support for such.
International demand from government bodies, industry, investors, non-profits, and researchers for
harmonized approaches to conduct life cycle assessments and techno-economic assessments for carbon
dioxide utilization led us to coordinate and fund an international effort to develop and disseminate
Guidelines for TEA & LCA for CO2 Utilization. First published in 2018, these Guidelines have found
widespread attention and use. A growing list of case studies, and worked examples, is made available to
illustrate how to use these Guidelines.
We hope that this case study will be useful to you and we will be grateful for any feedback!
Abbreviations
ADP: Abiotic depletion potential
AP: Acidification potential
EP: Eutrophication potential
FAETP: Freshwater aquatic ecotoxicity potential
GHG: Greenhouse gases
GWP: Global warming potential
HTP Human toxicity potential
LCA: Life cycle assessment
LCI: Life cycle inventory
LCIA: Life cycle impact assessment
MAETP: Marine aquatic ecotoxicity potential
NPK: Nitrogen, phosphorus, potassium
POCP: Photochemical ozone creation potential
ODP: Ozone layer depletion potential
TETP: Terrestic ecotoxicity potential
TRL: Technology readiness level
This worked example is part of a series of worked examples produced in support of the “Techno-
Economic Assessment & Life Cycle Assessment Guidelines for CO2 Utilization”. These guidelines,
further worked examples and other associated documents can be found online at:
https://deepblue.lib.umich.edu/handle/2027.42/145423
More details on the Global CO2 initiative can be found online at:
https://www.globalco2initiative.org/
*This worked example can be read independently of or in conjunction with:
“Interpretation of LCA results: A worked example on a CO2 to fertilizer process”

Contents Foreword ....................................................................................................................................................... 1
Abbreviations ................................................................................................................................................ 2
1. Introduction ........................................................................................................................................... 4
2. Goal definition........................................................................................................................................ 5
3. Scope definition and system boundaries ............................................................................................... 6
3.1 defining boundaries ............................................................................................................................. 7
3.2 Solving multifunctionality .................................................................................................................. 11
3.3 Data quality ........................................................................................................................................ 13
4. Life cycle inventory (LCI) ......................................................................................................................... 14
4.1 inventory for CO2 based fertilizer production .................................................................................... 17
4.2 inventory for Conventional fertilizer production ............................................................................... 19
4.3 Inventory for field production............................................................................................................ 20
4.4 Inventories from commercial database ............................................................................................. 22
4.5 Inventories from public available sources.......................................................................................... 22
5. Life cycle impact assessment ................................................................................................................... 24
5.1 Cradle to grave impact assessment results ........................................................................................ 24
5.1.1 CO2 based fertilizer production assessment scenarios ................................................................ 26
5.1.2 Ammonium nitrate (AN), npk, organic fertilizer production and Fertilizer-mix assessment
scenarios .............................................................................................................................................. 30
5.2 Cradle to gate impact assessment results.......................................................................................... 32
5.2.1 CO2 based fertilizer production assessment scenarios-Cradle to gate ........................................ 33
5.2.2 Ammonium nitrate (AN), npk, organic fertilizer production and Fertilizer-mix assessment
scenarios .............................................................................................................................................. 35
6. Conclusions ............................................................................................................................................. 36
7. References ............................................................................................................................................... 37
1. Introduction
The Techno economic assessment & life cycle assessment guidelines for CO2 utilization were published in
2018 (Zimmermann, et al., 2018). Alongside this, life cycle assessment (LCA) worked examples have also
been produced to show the application of these guidelines to practical cases. Each worked example
highlights specific facets of the guidelines by sharing notes, tips and suggestions on how to address the
challenges of building a LCA for CO2 utilization. This worked example draws attention to the life cycle
inventory and impact assessment phase and the challenges of collecting/selecting data. To arrive at this
point, the first steps in LCA construction are also considered, this includes: setting a goal and a scope for
the study; determining system boundaries; identifying limitations; solving multifunctionality and identifying
data quality issues. Notes with suggestions for conducting all parts of the LCA before arriving to life cycle
inventory are also given in this worked example. The main goal of this work is to be used as a teaching
example that illustrates LCA construction and should not be considered as an actual LCA study with results
that can be used for public or private comparisons. The product under assessment is a CO2 based fertilizer
that uses carbon dioxide captured from a power generating facility. Field trials have suggested that the
compound costs, looks and spreads the same as common fertilizers such as ammonium nitrate, all of these
are adjudged to be important factors for marketing perspectives. Other potential benefits include water
and nutrient retention, soil carbon replenishment, raising pH and temperature of the soil and boosting
microbial activity. Whilst there is preliminary information on the potential environmental benefits of using
this CO2 based fertilizer, there is no full LCA study available yet.
World consumption of fertilizer is mainly driven by three fertilizer nutrients, nitrogen, phosphate and
potassium (in the form of potash). The FAO estimated in its 2020 world fertilizer trends and outlook report
that fertilizer consumption reached 186.67 million tonnes in 2016 and was forecast to grow annually on
average by 1.5% (N), 2.2% (P) and 2.4% (K) from 2015 to 2020 (FAO, 2017). In Europe: France, Germany
and the UK represent 40 % of the fertilizer market which equals 10 % of the total use at global level in
volume, with nitrogen being the most used nutrient in the EU by volume. Fertilizer Europe estimates that
75% of the cultivated agricultural land (Fertilizers Europe, 2000) is fertilized with mineral fertilizers with
around half of the fertilizer used applied on cereals. Alongside consumption and demand, fertilizer
production and application has an impact on the environment. Production of nitrogen based fertilizers is
energy intensive, with this traditionally being associated with significant GHG emissions (natural gas is
typically used as both an energy vector and a source of hydrogen). Urea emits less carbon dioxide during
the production phase than nitrate based products but releases carbon dioxide during the nitrification
process. Nitrate based products can have negative environmental impacts beyond the often discussed
associated GHG emissions, for example losses of ammonia through volatilization can lead to issues in
increasing eco-toxicity. Fertilizer application also has an impact to the environment; more than 90% of EU
ammonia emissions come from agriculture, of which 80% comes from manure and 20% from mineral
fertilizer (European Commision, 2019). The demand and supply for fertilizers and the environmental
impacts associated with it, make this is a suitable product to assess in this worked example as there is much
information readily available for reference products.

The following sections include an LCA study for a CO2 based fertilizer from goal definition to life impact
assessment. Further information on interpretation can be found in another worked example included in
this series “LCA Interpretation: worked example for CO2 based fertilizer”.
2. Goal definition
1. The goal of this life cycle assessment (LCA) is to compare whether there are quantifiable
environmental benefits when using a nitrogen based fertilizer produced from recovered CO2 (called
CO2 based fertilizer from here on) in place of using fertilizer derived from fossil carbon sources (also
known as reference products). The study considers production and application in the UK, in the
year 2019.
2. This study is a worked example targeted at a general audience that wishes to understand how to
apply the Techno-Economic Assessment & Life Cycle Assessment Guidelines for CO2 Utilization
(Zimmermann, et al., 2018) (from now on referred to as only “the guidelines” in this work). The
results should not be used in comparative assertions or quoted by third parties.
3. In this worked example the stakeholder wishes to introduce a new bio-fertilizer to the market. This
biofertilizer relies on CO2 captured from anaerobic digestion that reacts with aqueous ammonia
and calcium nitrate to produce a fertilizer with 10 % N, 0.6 % P and 0.3 K content. If this biofertilizer
is a successful example of a CO2 utilization technology, then at the very least, carbon emissions
shall not be worse than the alternative processes. If carbon emissions are at least neutral, then all
other possible environmental impacts also shall be screened.
4. For purposes of this worked example, the final product is classified and treated as a CO2 based
chemical.

3. Scope definition and system boundaries
1. The functional unit is stated as: The fertilizer product needed to produce the same grain yield over
1 ha of winter wheat in the UK (Considering a temperate climate and a PH soil of < 7). Reference
flow: 1 kg of fertilizer.
2. Biogas gas is excluded from the scope of the functional unit as it is not our goal to compare energy
supply but the fertilizer product instead. However, biogas production is still part of the system as a
co-product and allocated as such.
3. The CO2 based fertilizer will have a different composition and chemical structure than conventional
fertilizers, thus in following the guidelines recommendations, the basis for comparison is technical
performance and the system boundaries are cradle to grave. There is also the alternative of a
preliminary study where the system boundaries can be set at cradle to farm gate.
In this example the stakeholder has limited information on farming and harvest performance of
their CO2 based fertilizer and has run field tests at a small scale.
The initial report from field trials states: “That the CO2 based product provides useful yield benefits in a variety of cereal crops; and, as a source of N, the CO2 based product is comparable to a commercial fertilizer, but may have additional benefits above the provision of N”
For the purpose of this example, a conservative approach was taken where the CO2 based product
behaved the same as a commercial fertilizer once it was applied to the field. Further tests need to
be carried out to confirm the benefits of the product versus a commercial ammonium nitrate
fertilizer (used for field trials) and other similar fertilizers. This would indicate that this LCA is best
suited as a preliminary study. As part of the worked example both cradle to gate and cradle to
grave (with supplementary data) will be assessed to give further insights on how the interpretation
of the results varies as you shift boundaries (Refer to LCA Interpretation: worked example for CO2
based fertilizer production). Cradle to grave is still to be considered the main system boundary.
4. The products under assessment are the following:
CO2 based fertilizer (NPK 10 0.6 0.3)
Ammonium nitrate from a large fertilizer producer (33.5 N) (CF Fertilizers UK limited, 2019)
NPK from a large fertilizer producer (NPK 15 15 15) (Yara, 2019)
Ammonium nitrate from Fertilizer Europe (33.5 N) (Fertilizers Europe, 2000)
NPK from Fertilizer Europe (NPK 15 15 15) (Fertilizers Europe, 2000)

Cattle manure (organic fertilizer) from commercial LCI database (Nemecek, 2007)
Mineral fertilizer from commercial LCI database (Nemecek, 2007)
Note:
There were no commercial fertilizers found that have the same composition as the CO2 based fertilizer, thus
the functional unit refers to grain yield and not to final product quantities. Ammonium nitrate was assessed
as it was the stakeholders’ choice of fertilizer for field trials, NPK fertilizers were also assessed as the CO2
based product is labeled as a compound fertilizer. The data obtained for these products is limited to data
disclosed to the public. There were no personal communications with the companies behind these products.
Cattle manure is also included to study the environmental impact differences between mineral and a
commonly used organic fertilizer. For most of these products only the carbon footprint was available, the
limitations of this are taken into consideration for the inventory, impact assessment and interpretation stages
(Refer to LCA Interpretation: worked example for CO2 based fertilizer production).
3.1 DEFINING BOUNDARIES
There are three main processes throughout the supply chain of the CO2 based fertilizer product: anaerobic
digestion, biofertilizer production and field production. Each stage has different inputs and outputs and
these can vary depending on the specific technologies used for each process. This leads to a wide system
with many alternatives as shown in Figure 1 and 2.
As an example, in Figure 1 the anaerobic digestion process can use biomass that has been pre-treated in 4
different ways, the digestate can be processed in 3 different ways for 3 different uses and biogas can either
be upgraded to biomethane or for heat in power (CHP) with 5 final destination usage options. Biofertilizer
itself can be produced either by chemical, thermal, physical and biological routes.

Figure 1 - Process stages for bio-fertilizer production with biomass pre-treatment options, digestate conversion and biogas uses and
other process inputs and outputs
Once the biofertilizer is at the farm gate, there is the comparison with other types of fertilizes both mineral
and inorganic, the method for fertilizer application, the type of crop and other inputs associated with the
fertilizer of choice (Figure 2).

At the initial assessment stage refining the boundaries can seem overwhelming, what should be assessed
and what should not? What if by not assessing a process alternative a significant impact is omitted? Whilst
in an ideal assessment all variables and alternatives would be captured within the system boundary, in
practice this is often not possible (due to issues such as time constraints, budget limitations, limited
personnel, the size of the system keeps expanding, etc.). In this situation it is useful to return to the goal
to clarify what is the purpose of the study, modify it if necessary or use it to highpoint where the system
boundaries should be. In this example, it was useful to highlight in red (Figure 1 and Figure 2) the two main
routes under study:
1. Anaerobic digestion → Digestate/biogas/flue gas for fertilizer production through chemical route →
fertilizer application
2. Mineral and organic fertilizer production → Fertilizer application
Figure 2 - Inputs and outputs for field production adapted from Ecoinvent “Life Cycle Inventories of agricultural production systems”
(Nemecek, 2007)

From this, the boundaries of the system can be simplified (Figure 3 and 4) and also include CO2 sources as
suggested in the guidelines.
Note:
While the other process alternatives do not disappear, they can either be set outside of the boundaries or
they can be used as part of a scenario analysis if this is part of the assessment. Whilst all process alternatives
Figure 3 - Simplified boundaries of CO2 utilization process for CO2 based fertilizer and application
Figure 4 Simplified boundaries of conventional process for fertilizer production and application

might not be of interest to the stakeholder, knowing the environmental impacts of these can be useful for
sensitivity analysis that in turn increase the robustness of the study.
3.2 SOLVING MULTIFUNCTIONALITY
In this worked example there are two main products to consider: biogas and biofertilizer. Approximately
93 % of the thermal energy capacity from CHP is used for the mixer-dryer stage in biofertilizer production,
therefore biogas is considered to be the co-product and bio-fertilizer the product. No further information
was provided by the stakeholder on the use of the remaining thermal energy. It is assumed that it is used
in localized buildings and other parts of the plant. However, an alternative scenario is also presented to
show the difference between methods for solving cases of multifunctionality.
For the first arrangement (and the one used as the scenario study for assessment), all of the biogas is used
within the bio-fertilizer plant and localized buildings. There is no upgrading to biomethane for public grid
use or fuel for transport. It is assumed that the anaerobic digester is part of the biofertilizer plant. The
comparison between the CO2 utilization process and the conventional route is as shown in Figure 5, where
biogas from anaerobic digestion is an intermediate flow in the biofertilizer plant.
In this scenario (Figure 5), no further allocation would be needed if it is assumed that the outputs of the
anaerobic digestion were going to be used for biofertilizer production and for no other purpose such as
feeding into de public grid since its planning stage. However, this can also lead to questioning whether this
is the best use of the energy provided by the AD process. Whilst it is not the aim of this work to discuss how
Figure 5 - Scenario where the CO2 utilization process includes biogas production as an economic flow
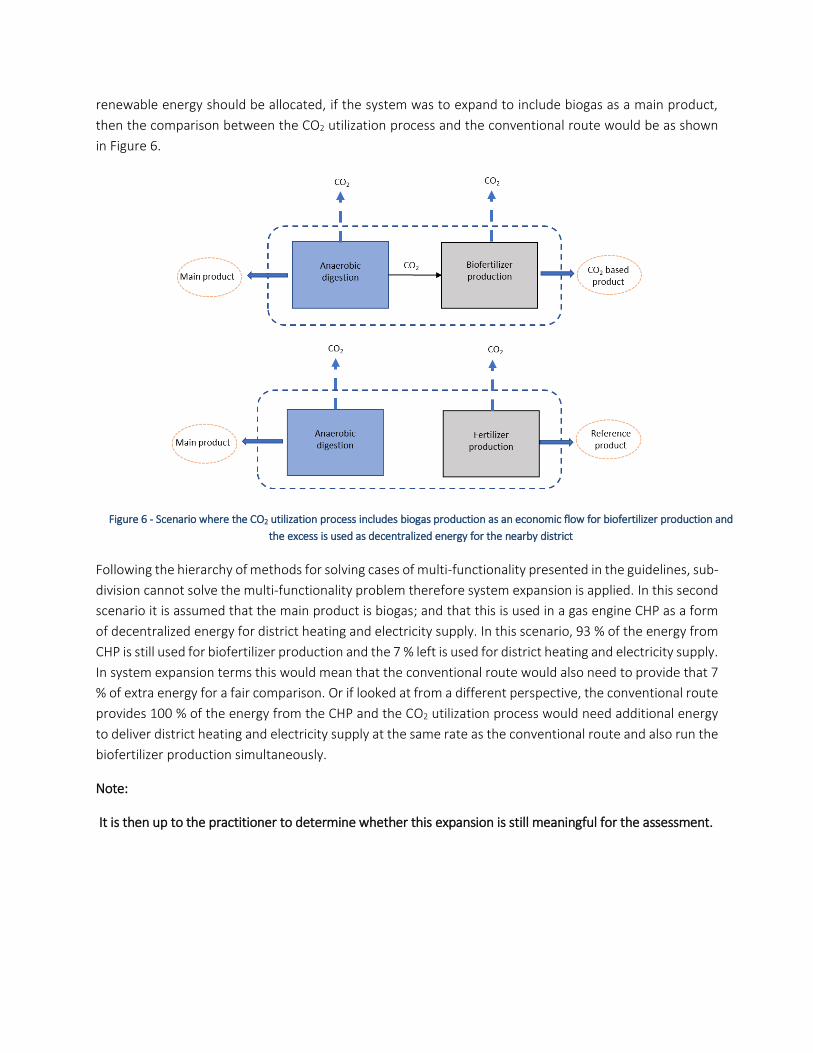
renewable energy should be allocated, if the system was to expand to include biogas as a main product,
then the comparison between the CO2 utilization process and the conventional route would be as shown
in Figure 6.
Following the hierarchy of methods for solving cases of multi-functionality presented in the guidelines, sub-
division cannot solve the multi-functionality problem therefore system expansion is applied. In this second
scenario it is assumed that the main product is biogas; and that this is used in a gas engine CHP as a form
of decentralized energy for district heating and electricity supply. In this scenario, 93 % of the energy from
CHP is still used for biofertilizer production and the 7 % left is used for district heating and electricity supply.
In system expansion terms this would mean that the conventional route would also need to provide that 7
% of extra energy for a fair comparison. Or if looked at from a different perspective, the conventional route
provides 100 % of the energy from the CHP and the CO2 utilization process would need additional energy
to deliver district heating and electricity supply at the same rate as the conventional route and also run the
biofertilizer production simultaneously.
Note:
It is then up to the practitioner to determine whether this expansion is still meaningful for the assessment.
Figure 6 - Scenario where the CO2 utilization process includes biogas production as an economic flow for biofertilizer production and
the excess is used as decentralized energy for the nearby district

3.3 DATA QUALITY
The CO2 based fertilizer production data is obtained through a combination of information giving directly
by the stakeholder, commercial databases such as Ecoinvent and available literature (journals, NGOs,
industry and government reports). For the conventional fertilizer production routes, data was obtained
from company websites and supplemented with literature.
As this is a worked example (and not a ISO compliant full study), the inventory used for this work should
not be used for comparative studies and further data quality assessment techniques should be applied (e.g.
representativeness, completeness, uncertainty, etc.) Table 1 shows basic references on data collected for
this example.
Table 1 - Data collected and source used for products under assessment by process stage
Data collected Source
Anaerobic digestion
Treatment of biowaste by anaerobic digestion Ecoinvent database version 3.4
CO2 based process Information provided by stakeholder
Fertilizer production
Ammonium nitrate fertlizers Company website
NPK fertlizers Company website
Fertilizers Europe Online report
CO2 based process Information provided by stakeholder
Field production
Production of wheat, inorganics Ecoinvent database version 3.4
Production of wheat, organics Ecoinvent database version 3.4
EMEP/EEA guidebook 2016 Online report
Global database of GHG emission related to feed crops, FAO
Online report
4. Life cycle inventory (LCI)
The inventory includes the flow diagrams of CO2 based fertilizer production, commercial production of
ammonium nitrate, NPK and organic fertilizer. There is also a process description of alternatives under
assessment and an input/output table with environmental flows for each process. If there is data that is
subject to confidentiality agreements and needs to be excluded from this inventory, this is mentioned
throughout the report.
When collecting secondary data for each process stage, the LCA practitioner will come across multiple
sources of information that can have many similarities between the processes for which data is being
collected. However, often there exists some differences between these processes e.g. location specific,
technological or temporal variations on the technology & ultimately the respective inventory. This can lead
to the “picking and mixing” of datasets to complete an inventory for a given process. In turn, this can lead
to multiple inventories of the same process (as different practitioners may select different elements to “fill
in” the missing parts) that may or may not produce a significant difference in the impact assessment (i.e.
the sensitivity of individual varying aspects will be a deciding factor on how detrimental “picking and
mixing” is).
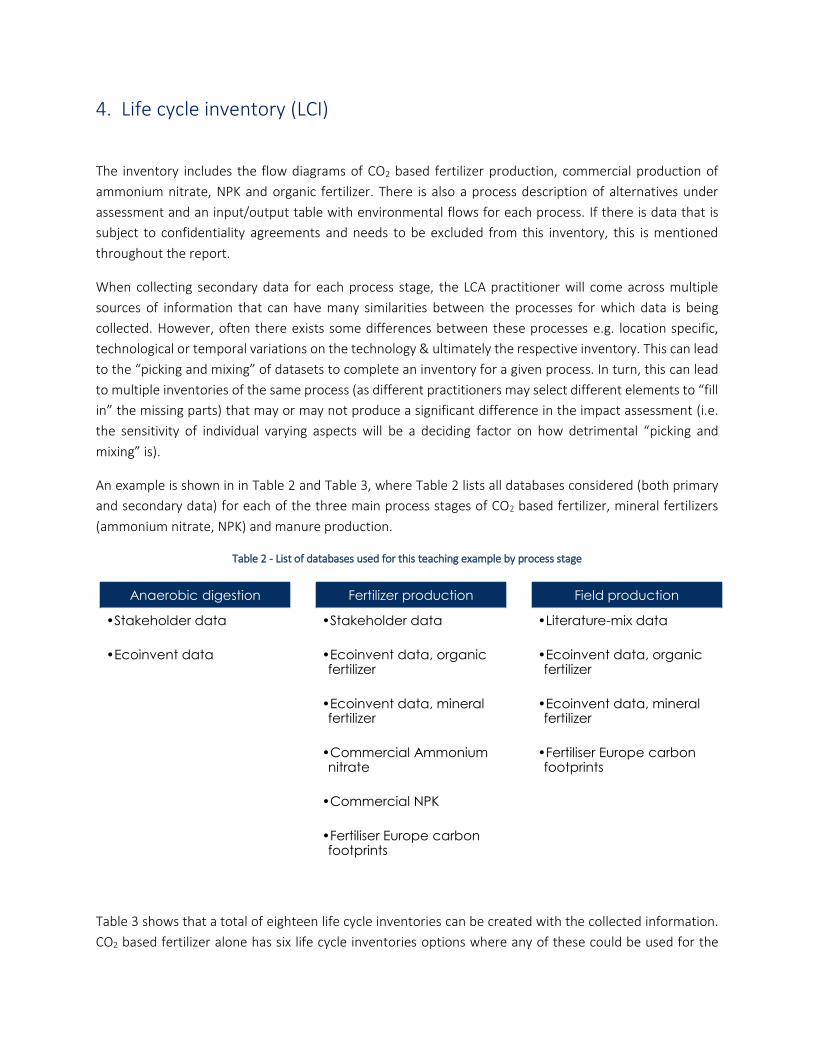
An example is shown in in Table 2 and Table 3, where Table 2 lists all databases considered (both primary
and secondary data) for each of the three main process stages of CO2 based fertilizer, mineral fertilizers
(ammonium nitrate, NPK) and manure production.
Table 2 - List of databases used for this teaching example by process stage
Table 3 shows that a total of eighteen life cycle inventories can be created with the collected information.
CO2 based fertilizer alone has six life cycle inventories options where any of these could be used for the
Anaerobic digestion
•Stakeholder data
•Ecoinvent data
Fertilizer production
•Stakeholder data
•Ecoinvent data, organic fertilizer
•Ecoinvent data, mineral fertilizer
•Commercial Ammonium nitrate
•Commercial NPK
•Fertiliser Europe carbon footprints
Field production
•Literature-mix data
•Ecoinvent data, organic fertilizer
•Ecoinvent data, mineral fertilizer
•Fertiliser Europe carbon footprints

final impact assessment. Which of the six options should be used? Would choosing one over the other lead
to an erroneous interpretation? Do any of these options truly reflect the process under study after “picking
and mixing data”? The guidelines provide us with useful information on how to bridge data gaps with
estimation methods. To show the applicability of this methods, all eighteen LCI combinations will be
assessed and interpreted to gain understanding on how to build an LCI for CO2 utilization. For simplification,
the LCIs created will be referred from now on as “assessment scenarios” (should not be confused with
scenario planning).
Note:
Eighteen life cycle inventories is not the maximum number of inventories available for this process, the
number increases as more databases are added. This is only an example to show the sensitivity of LCI data
collection.
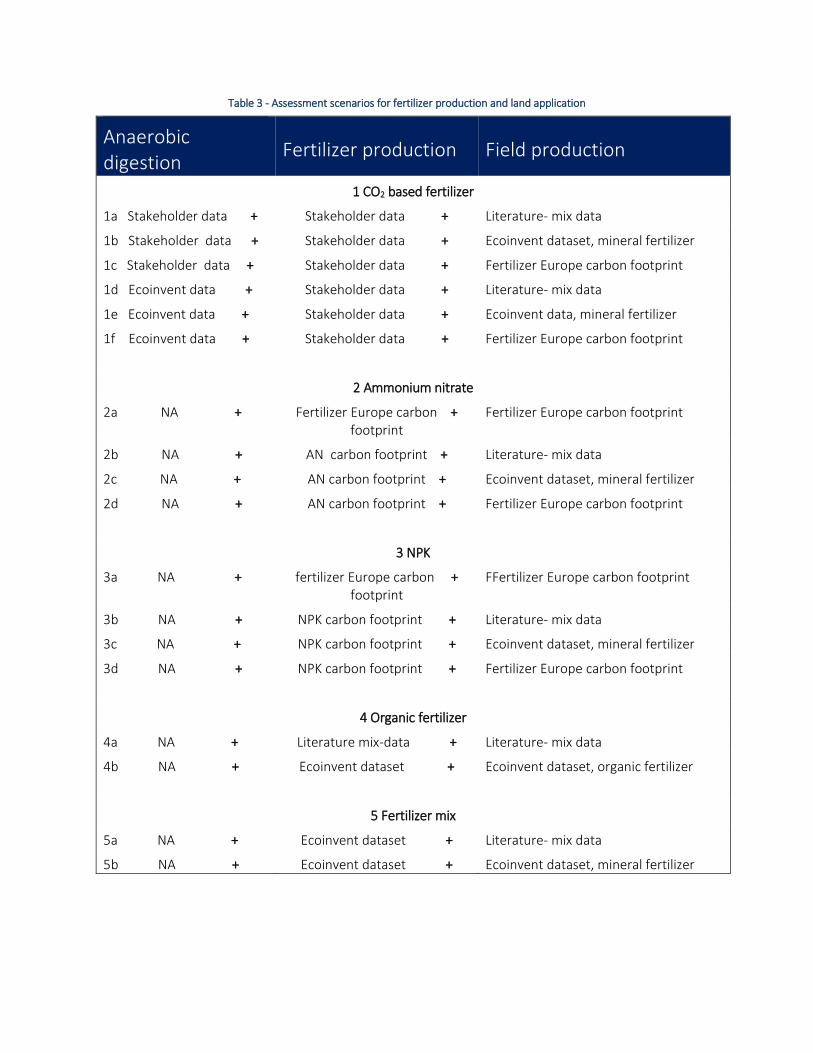
Table 3 - Assessment scenarios for fertilizer production and land application
Anaerobic digestion
Fertilizer production Field production
1 CO2 based fertilizer
1a Stakeholder data + Stakeholder data + Literature- mix data
1b Stakeholder data + Stakeholder data + Ecoinvent dataset, mineral fertilizer
1c Stakeholder data + Stakeholder data + Fertilizer Europe carbon footprint
1d Ecoinvent data + Stakeholder data + Literature- mix data
1e Ecoinvent data + Stakeholder data + Ecoinvent data, mineral fertilizer
1f Ecoinvent data +
Stakeholder data + Fertilizer Europe carbon footprint
2 Ammonium nitrate
2a NA + Fertilizer Europe carbon + footprint
Fertilizer Europe carbon footprint
2b NA + AN carbon footprint + Literature- mix data
2c NA + AN carbon footprint + Ecoinvent dataset, mineral fertilizer
2d NA +
AN carbon footprint + Fertilizer Europe carbon footprint
3 NPK
3a NA + fertilizer Europe carbon + footprint
FFertilizer Europe carbon footprint
3b NA + NPK carbon footprint + Literature- mix data
3c NA + NPK carbon footprint + Ecoinvent dataset, mineral fertilizer
3d NA +
NPK carbon footprint + Fertilizer Europe carbon footprint
4 Organic fertilizer
4a NA + Literature mix-data + Literature- mix data
4b NA +
Ecoinvent dataset + Ecoinvent dataset, organic fertilizer
5 Fertilizer mix
5a NA + Ecoinvent dataset + Literature- mix data
5b NA + Ecoinvent dataset + Ecoinvent dataset, mineral fertilizer

4.1 INVENTORY FOR CO2 BASED FERTILIZER PRODUCTION
Anaerobic digestate waste is transformed into high-grade compound fertilizer. This process is based on
blending three constituents: biomass, ammonia and CO2. The CO2 is drawn post-combustion from a bio
gas separator and reacted with ammonia and calcium nitrate to produce a solution of ammonium nitrate
and calcium carbonate. This solution is mixed with dried solids from the anaerobic digestion plant and the
blend goes through a pelletizing plant to make pellets. The product is bagged for storage and or/shipping
on lorries. The fertilizer can be spread with a spinner on fields. Figure 7 shows the flow diagram of this
process.
Figure 7 - Flow diagram of CO2 based fertilizer production (cradle to farm gate)
Anaerobic digestion
Mixing/drying
Bio
mas
s
Flu
e ga
s
Pelletizer
Fert
ilize
r
CO2 capture
Ammonia Calcium nitrate Water
Ammonium nitrate,
calcium carbonate
Bagger Fertilizer, solid
Gas venting
Hot water
Shipping fertilizer
product
Water
CO2

The information provided by the stakeholder includes: a process flow diagram, mass and energy balance
sheet, description of the CO2 based fertilizer production process, transport distance from gate to farm
(return trip) and initial results for field trials of fertilizer use in cereal crops.
Information not given by the stakeholder: inputs to the anaerobic digestion plant, infrastructure data and
detailed field emissions of fertilizer use in in cereal crops. Limited information on direct emissions
throughout the process and hot water disposal.
Inputs and outputs for anaerobic digestion plant and bio-fertilizer production are shown in Table 4 and 5
scaled to 1 ton of fertilizer produced per day.
Table 4 - Inputs and outputs for anaerobic digestion plant for CO2 based fertilizer production
Table 5 - Inputs and outputs for biofertilizer production process stage for CO2 based fertilizer
Anaerobic digestion plant: scale 1 ton of fertilizer Output Quantity Unit
Digestate 1148 kg
Flue gas 1516 MJ
Thermal energy 0.66 MWh
Biofertilizer production: scale 1 ton of fertilizer
Input Quantity Unit
Digestate 1148 kg
Water 123 kg
Calcium nitrate redacted kg
Ammonia redacted kg
Thermal energy 0.587 MWh
Electricity 0.194 MWh
Output Quantity Unit
NPK Fertilizer 1000 kg
Flue gas 1476 kg
Biomass water 2114 m3
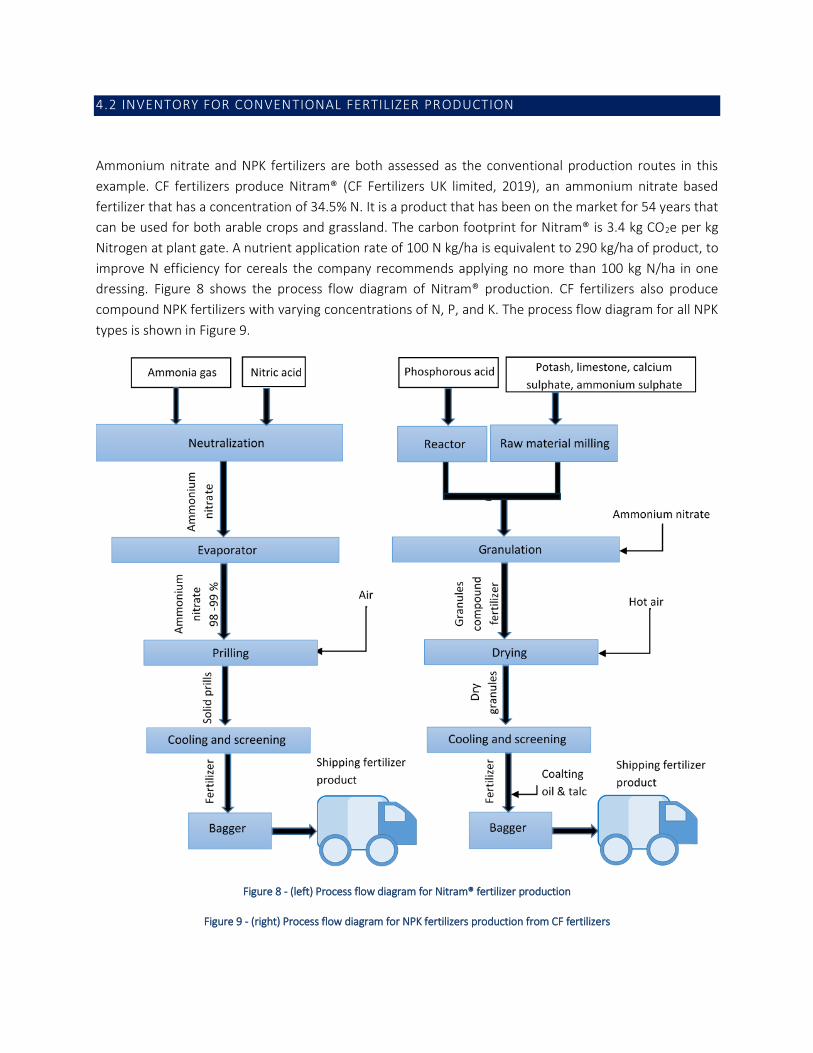
4.2 INVENTORY FOR CONVENTIONAL FERTILIZER PRODUCTION
Ammonium nitrate and NPK fertilizers are both assessed as the conventional production routes in this
example. CF fertilizers produce Nitram® (CF Fertilizers UK limited, 2019), an ammonium nitrate based
fertilizer that has a concentration of 34.5% N. It is a product that has been on the market for 54 years that
can be used for both arable crops and grassland. The carbon footprint for Nitram® is 3.4 kg CO2e per kg
Nitrogen at plant gate. A nutrient application rate of 100 N kg/ha is equivalent to 290 kg/ha of product, to
improve N efficiency for cereals the company recommends applying no more than 100 kg N/ha in one
dressing. Figure 8 shows the process flow diagram of Nitram® production. CF fertilizers also produce
compound NPK fertilizers with varying concentrations of N, P, and K. The process flow diagram for all NPK
types is shown in Figure 9.
Figure 8 - (left) Process flow diagram for Nitram® fertilizer production
Figure 9 - (right) Process flow diagram for NPK fertilizers production from CF fertilizers

Information gathered on the product: Only information available to the public, this includes a general
process flow diagram, product description, carbon footprint, application rates, bag size and
recommendations for application to crops. All information available from company website.
Information not specified: mass and energy balance sheets, infrastructure data, detailed emissions
information for the production of fertilizer and for the use of it on cereal crops.
Yara (another fertilizer producing company) also offer a 33.5% N fertilizer called YaraBela EXTRAN© and
YaraMila© for 15% N 15% P 15% K NPK option (Yara, 2019). Similar to CF fertilizers, the main environmental
information given to the public is the carbon footprint. 1.25 kg CO2e/kg of product (max) for Yarabela
EXTRAN© and 0.80 kg CO2 eq/kg of product for YaraMila©
Note:
Full inventories should be obtained whenever possible. However, it can be difficult to collect detailed
information from other companies for comparative studies. This often is the case for CO2 utilization
technologies, where one of the most common research questions is whether a CO2 utilization based product
or service is environmentally beneficial compared to the same product or service derived from fossil carbon
sources. In this instance, it is necessary to have both the inventory for the CO2 utilization process and the
fossil carbon source process.
If no other information but the carbon footprint is available for comparison, this should be used as a best
case scenario. If the best case scenario does not offer environmental benefits (the carbon footprint for the
CO2 utilization process is larger than the fossil carbon source process). As more information is available, more
impact categories can be compared between CO2 utilization technologies and fossil fuel based processes.
4.3 INVENTORY FOR FIELD PRODUCTION
The stakeholder has carried out cereal field trials for their CO2 based fertilizer. The trials are of limited
scope, but showed that yields were enhanced compared with Nitram® applications on the same day at a
similar N level of 6.3 % for winter wheat. The cereal trials were carried out on plots of at least 2 ha. There
is no further information available on CO2 based fertilizer soil application and performance.
Note:
Since there is a lack of information available for field production for the CO2 utilization process, data is
collected from secondary sources. The limitations of using secondary data should be mentioned and
secondary data should be replaced with primary as soon as it is available. As mentioned in the scope definition
and boundaries, the assessment is suited for cradle to gate as a preliminary study if no field data is available,
or for this example as cradle to grave to show the use of multiple inventories for the same process.
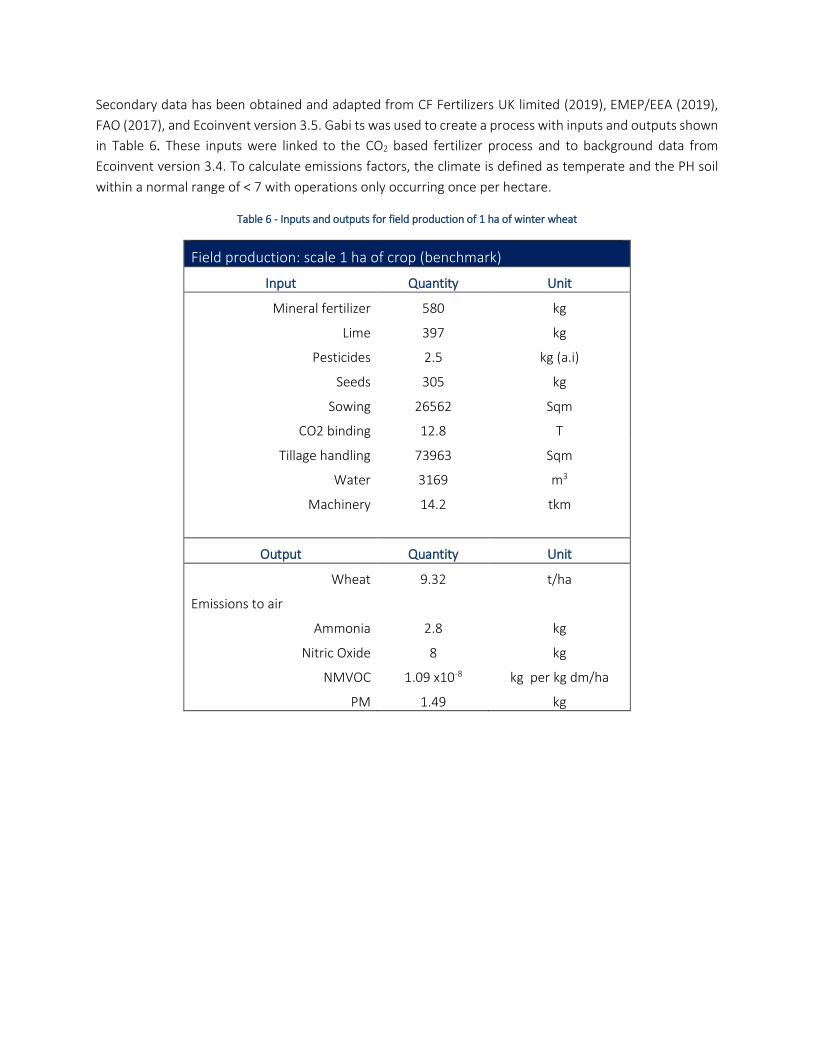
Secondary data has been obtained and adapted from CF Fertilizers UK limited (2019), EMEP/EEA (2019),
FAO (2017), and Ecoinvent version 3.5. Gabi ts was used to create a process with inputs and outputs shown
in Table 6. These inputs were linked to the CO2 based fertilizer process and to background data from
Ecoinvent version 3.4. To calculate emissions factors, the climate is defined as temperate and the PH soil
within a normal range of < 7 with operations only occurring once per hectare.
Table 6 - Inputs and outputs for field production of 1 ha of winter wheat
Field production: scale 1 ha of crop (benchmark)
Input Quantity Unit
Mineral fertilizer 580 kg
Lime 397 kg
Pesticides 2.5 kg (a.i)
Seeds 305 kg
Sowing 26562 Sqm
CO2 binding 12.8 T
Tillage handling 73963 Sqm
Water 3169 m3
Machinery 14.2 tkm
Output Quantity Unit
Wheat
Emissions to air
9.32 t/ha
Ammonia 2.8 kg
Nitric Oxide 8 kg
NMVOC 1.09 x10⁻⁸ kg per kg dm/ha
PM 1.49 kg

4.4 INVENTORIES FROM COMMERCIAL DATABASE
Ecoinvent v 3.4 is used for anaerobic digestion and production of wheat using mineral and organic fertilizer.
The anaerobic digestion model used is “Treatment of biowaste by anaerobic digestion”. In this process the
mineral content of the biomass is 15 % N, 8 % P2O5, 12 % K2O. The dataset includes the infrastructure for
the pre-treatment process, digestion of bio-waste and treatment of the fermented material (de-watering
and post composting). The plant has a yearly capacity of 10,000 tonnes with a lifetime of 25 years. The
technology is a thermophile, single state digestion with post composting. Energy demand and process
emissions of the plant are also included.
The LCI for the production of wheat using mineral fertilizer from Ecoinvent v 3.5 has a cradle to farm gate
boundary and includes all machine operations and corresponding machine infrastructure and sheds.
Machine operations are soil cultivation, sowing, fertilization, irrigation, weed control, pest and pathogen
control, combine-harvest and transport from field to farm. The fertilizer used is a combination of
ammonium nitrate, ammonium, sulfate, urea, and ammonia, N, P2O and K2O. (There are no further
specifications on the type of fertilizer used). The pesticide, herbicide and insecticide composition is not
specified; however, it has traces of thiocarbomates, sulfonylureas, acetamide-anillide, organophosphorus
and benzoic compounds. It also has glyphosate, triazine and phenoxy compound as herbicides. Direct field
emissions are included. This activity ends after harvest and drying of grains at the farm gate.
The Ecoinvent v 3.5 for the production of wheat using organic fertilizer model is also used in this worked
example. This model includes average distances and does not provide further manure details. The dataset
includes all machine operations and corresponding machine infrastructure and sheds. Machine operations
are soil cultivation, sowing, fertilization, irrigation, weed control, pest and pathogen control, combine-
harvest and transport from field to farm. Further, direct field emissions are included. This activity ends after
harvest and drying of grains at the farm gate. Extra information for organic fertilizer production is obtained
from Aguirre Villegas & Larson (2017).
These databases are purchasable and can be used for gate-to-gate inventory estimation with a yield of 95%
based on a stoichiometric mass balance as mentioned in the guidelines.
4.5 INVENTORIES FROM PUBLIC AVAILABLE SOURCES
Other inventories considered for this worked example include the carbon footprint information available
from Fertilizers Europe (Fertilizers Europe, 2000) and the BAT model for ammonium nitrate production also
from Fertilizers Europe. A summary of the carbon footprints used by Fertilizers Europe is shown in Table 7.
Note:
Carbon footprints are not aligned with carbon emissions reported by both CF fertilizers and Yara. Fertilizers
Europe report a lower carbon footprint at plant gate than the values reported by fertilizer companies.

However, the last carbon footprint report publicly available by Fertilizers Europe is from 2011 and might not
reflect current practices. The LCA practitioner should consider the representativeness of the inventory based
on the active years of the dataset. In this worked example, the stakeholder is using the Fertilizers Europe
data to compare their own carbon footprint performance and therefore it is included as part of this
assessment while also stating the limitations of this comparison.
Table 7 - Carbon footprints of fertilizer product and fertilizer use provided by Fertilizers Europe (2011)
Fertilizer product
Nutrient content
Fertilizer production
Fertilizer use
Fertilizer product + use
(At plant gate) (Soil effects) Total Total
kg CO2 eq/kg product
kg CO2 eq/kg
product
kg CO2 eq/kg
nutrient
Ammonium nitrate AN 33.5 % N 1.18 1.89 3.06 9.14
Calcium ammonium nitrate CAN 27 % N 1 1.38 2.4 8.88
Calcium nitrate CN 15.5 % N 0.68 0.81 1.5 9.67
Urea Urea 46 % N 0.91 4.22 5.15 11.19
NPK 15-15-15 NPK 15 % N, 15 %
P2O5, 15 % K20 0.76 0.85 1.61 10.71

5. Life cycle impact assessment
Impact assessment results are shown throughout this part of the assessment. As mentioned in the
guidelines only the results should be presented without interpretation or analysis. The way that results are
shown can vary from report to report as there is no definitive way to present them. However, there are
many suggestions available from general LCA literature on how to display these in a concise way without
omitting results. The methods shown in the technical report by the JRC are used in this section (Zampori L.,
2016). The problem-oriented LCA method called “CML method” is also used to express the emissions to
the environment through environmental impact categories. This particular method was chosen by
following the suggestions in the guidelines.
A note is attached to each set of results presented in this worked example with further comments on how
these results are shown in this part of this assessment. Interpretation and analysis can be found in LCA
Interpretation: worked example for CO2 based fertilizer production report.
5.1 CRADLE TO GRAVE IMPACT ASSESSMENT RESULTS
Figure 10 - Climate change impact category results for all eighteen life cycle inventories with cradle to grave boundary assuming the
stakeholder’s product requires the supply of 200 kg of N to field per hectare of winter wheat crop.
0.00
2000.00
4000.00
6000.00
8000.00
10000.00
12000.00
KG
CO
2EQ
.
ASSESSMENT SCENARIOS
1A 1B 1C 1D 1E 1F 2A 2B 2C 2D 3A 3B 3C 3D 4A 4B 5A 5B

Figure 11 - Climate change impact category results for all eighteen life cycle inventories with cradle to grave boundary assuming the
stakeholder’s product requires the supply of 580 kg of product to field per hectare of winter wheat crop.
Figure 12 - Climate change impact category results for all eighteen life cycle inventories with cradle to grave boundary assuming the
stakeholder’s product requires the supply of 325 kg of product to field per hectare of winter wheat crop.
Note:
The graphs only show climate change impact category results as it is the category with sufficient information
to compare all inventories across. The goal and scope of the study can be modified if necessary, as conducting
an LCA is an iterative process.
0
1000
2000
3000
4000
5000
6000
7000
8000
kg C
O2
eq.
Assessment scenarios
1A 1B 1C 1D 1E 1 F 2A 2B 2C 2D 3A 3B 3C 3D 4A 4B 5A 5B
0.00
1000.00
2000.00
3000.00
4000.00
5000.00
6000.00
7000.00
8000.00kg
CO
2eq
.
Assessment scenarios
1A 1B 1C 1D 1E 1F 2A 2B 2C 2D 3A 3B 3C 3D 4A 4B 5A 5B
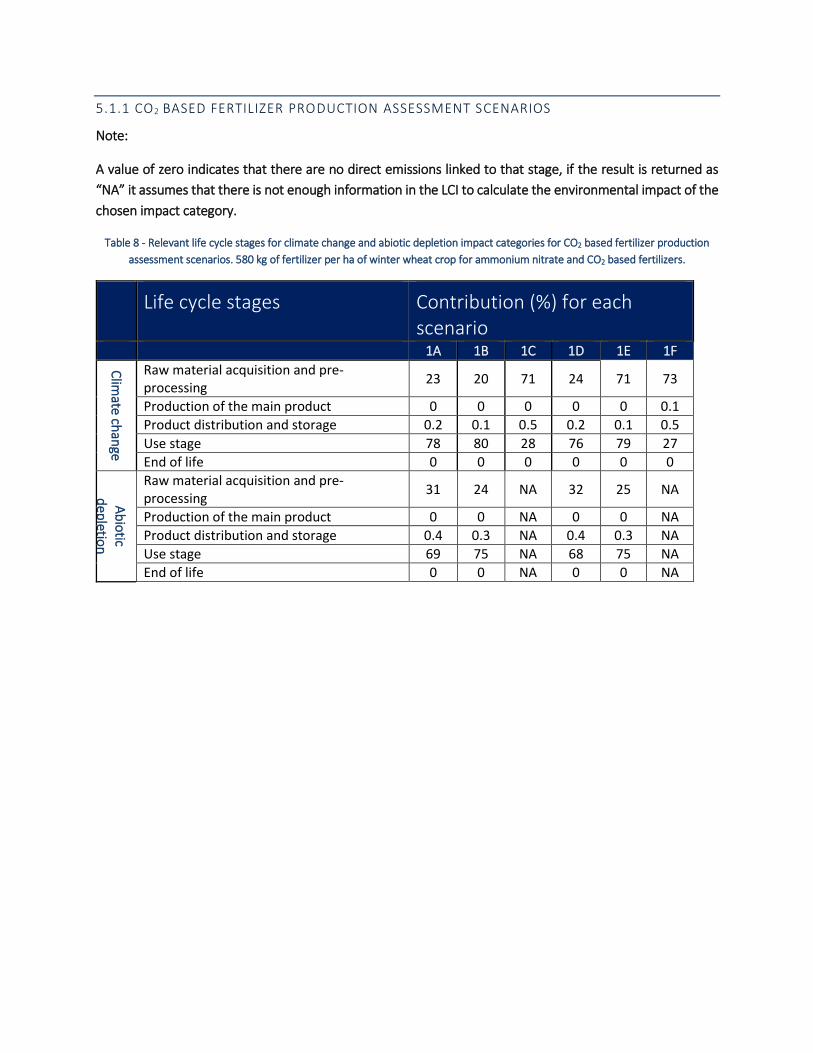
5.1.1 CO2 BASED FERTILIZER PRODUCTION ASSESSMENT SCENARIOS
Note:
A value of zero indicates that there are no direct emissions linked to that stage, if the result is returned as
“NA” it assumes that there is not enough information in the LCI to calculate the environmental impact of the
chosen impact category.
Table 8 - Relevant life cycle stages for climate change and abiotic depletion impact categories for CO2 based fertilizer production
assessment scenarios. 580 kg of fertilizer per ha of winter wheat crop for ammonium nitrate and CO2 based fertilizers.
Life cycle stages Contribution (%) for each scenario
1A 1B 1C 1D 1E 1F
Clim
ate chan
ge
Raw material acquisition and pre-processing
23 20 71 24 71 73
Production of the main product 0 0 0 0 0 0.1
Product distribution and storage 0.2 0.1 0.5 0.2 0.1 0.5
Use stage 78 80 28 76 79 27
End of life 0 0 0 0 0 0
Ab
iotic
dep
letion
Raw material acquisition and pre-processing
31 24 NA 32 25 NA
Production of the main product 0 0 NA 0 0 NA
Product distribution and storage 0.4 0.3 NA 0.4 0.3 NA
Use stage 69 75 NA 68 75 NA
End of life 0 0 NA 0 0 NA

Table 9 - Relevant processes for climate change and abiotic depletion impact categories for CO2 based fertilizer production
assessment scenarios. 580 kg of fertilizer per ha of winter wheat crop for ammonium nitrate and CO2 based fertilizer.
Note:
The cut-off for accounted impacts was set at 80 % following the methodology of (Zampori L., 2016). This
means that all major environmental impact contributions from a process are shown. For most assessment
scenarios in this worked example the majority of the impacts fall within 5 processes.
Most relevant processes Contribution (%) for each scenario 1A 1B 1C 1D 1E 1F
Clim
ate chan
ge
Calcium nitrate production 19 16 57 18 16 55
Ammonia production 4 4 13 4 4 12
Wheat production 39 36 28 41 36 27
Treatment of biowaste 0 0 0 2 1 5
Irrigation to field 25 21 0 25 21 0
Harvesting 0 6 0 0 6 0
Wheat seed production 5 4 0 5 4 0
Other processes 8 13 2 5 13 2
Total impacts 100 100 100 100 100 100
Ab
iotic d
epletio
n
Calcium nitrate production 18 15 59 18 14 57
Ammonia production 12 9 37 12 9 36
Harvesting 0 12 0 0 11 0
Tillage, harrowing 4 4 0 4 4 0
Irrigation to field 48 38 0 47 37 0
Tillage, ploughing 3 2 0 3 2 0
Wheat seed production 5 4 0 5 4 0
Other processes 9 17 3 10 18 7
Total impacts 100 100 100 100 100 100

Table 10 - Elementary flows for main processes that contribute to climate change for CO2 based fertilizer production assessment
scenarios. 580 kg of fertilizer per ha of winter wheat crop for ammonium nitrate and CO2 based fertilizer.
Assessm
ent
Scenario
s
Process Contribution (%)to elementary flows
Emissions
to air
Emissions to fresh water
Emissions to sea water
Emissions to agricultural
soil
Emissions to
industrial soil
1A
Calcium nitrate production 15 9 39 21 23
Ammonia production 9 2 7 14 12
Wheat production 0 0 0 0 0
Treatment of biowaste 0 0 0 0 0
Irrigation to field 49 69 21 18 24
Harvesting 0 0 0 0 0
Wheat seed production 9 5 14 17 15
All other processes 18 15 20 30 26
Total 100 100 100 100 100
1B
Calcium nitrate production 12 9 31 8 25
Ammonia production 0 0 0 0 0
Wheat production 41 9 0 62 0
Treatment of biowaste 0 0 0 0 0
Irrigation to field 23 57 13 4 16
Harvesting 7 5 30 8 18
Wheat seed production 4 5 9 4 10
All other processes 14 15 18 14 32
Total 100 100 100 100 100
1C
Calcium nitrate production 35 80 80 58 62
Ammonia production 19 17 14 37 33
Wheat production 43 0 0 0 0
Treatment of biowaste 0 0 0 0 0
Irrigation to field 0 0 0 0 0
Harvesting 0 0 0 0 0
Wheat seed production 0 0 0 0 0
All other processes 3 3 6 4 5
Total 100 100 100 100 100
1D
Calcium nitrate production 14 9 37 21 23
Ammonia production 8 2 6 13 12
Wheat production 0 0 0 0 0
Treatment of biowaste 10 0 5 2 1
Irrigation to field 44 68 20 17 24
Harvesting 0 0 0 0 0

Note: Elementary flows are calculated as the percentage of the total emissions for each assessment scenario.
All other processes are those that fall outside the relevant process categories for climate change. Top
contributor for each elementary flow and assessment scenario is highlighted in blue.
Table 11 - Impact contributions of environmental quantities for each assessment scenario using the CML method. 580 kg of
fertilizer per ha of winter wheat crop for ammonium nitrate and CO2 based fertilizer.
Wheat seed production 8 5 13 16 15
All other processes 16 15 19 30 25
Total 100 100 100 100 100
1E
Calcium nitrate production 7 7 24 5 15
Ammonia production 4 2 4 3 8
Wheat production 39 9 0 62 0
Treatment of biowaste 5 0 4 0 0
Irrigation to field 22 57 13 4 16
Harvesting 7 5 29 8 18
Wheat seed production 4 5 8 4 10
All other processes 14 15 19 14 33
Total 100 100 100 100 100
1F
Calcium nitrate production 28 78 72 54 60
Ammonia production 16 16 12 35 32
Wheat production 35 0 0 0 0
Treatment of biowaste 19 3 11 5 0
Irrigation to field 0 0 0 0 0
Harvesting 0 0 0 0 0
Wheat seed production 0 0 0 0 0
All other processes 2 3 5 5 8
Total 100 100 100 100 100
Environmental quantities Contribution (%) for each scenario 1A 1B 1C 1D 1E 1F Total
ADP elements 20 24 6 20 24 6 100
ADP fossil 19 24 6 19 25 6 100
AP 13 33 4 14 33 4 100
EP 9 37 3 9 37 3 100
FAETP inf. 16 31 3 16 31 3 100
GWP 100 years 30 27 -5 29 25 -6 100
GWP 100 years, excl biogenic carbon
20 23 6 20 23 7 100
HTP inf. 17 26 5 17 26 9 100
MAETP inf. 21 24 5 21 25 5 100
ODP, steady state 18 24 7 18 25 7 100
POCP 18 27 3 19 28 4 100
TETP inf. 4 45 1 4 45 1 100

Note:
The CML method is used to calculate all environmental impacts as suggested by the guidelines. The LCI for
this worked example allows only to show the aggregated results of environmental quantities as there is not
enough in depth data for further analysis. The implications of this in the outcome of the study are discussed
in the LCA Interpretation: worked example for CO2 based fertilizer production.
5.1.2 AMMONIUM NITRATE (AN), NPK, ORGANIC FERTILIZER PRODUCTION AND FERTILIZER-
MIX ASSESSMENT SCENARIOS
Table 12 - Relevant life cycle stages for climate change and abiotic depletion impact categories for ammonium nitrate (AN)
fertilizers production assessment scenarios. 580 kg of fertilizer per ha of winter wheat crop.
Table 13 - Relevant life cycle stages for climate change and abiotic depletion impact categories for NPK fertilizers production
assessment scenarios. 325 kg of fertilizer per ha of winter wheat crop.
Life cycle stages Contribution (%) for each scenario
2A 2B 2C 2D
Clim
ate ch
ange
Raw material acquisition and pre-processing 0 0 0 0
Production of the main product 39 32 28 64
Product distribution and storage 0 0 0 0
Use stage 61 68 72 36
End of life 0 0 0 0
Ab
iotic
dep
letion
Raw material acquisition and pre-processing NA NA NA NA
Production of the main product NA NA NA NA
Product distribution and storage NA NA NA NA
Use stage NA NA NA NA
End of life NA NA NA NA
Life cycle stages Contribution (%) for each scenario
3A 3B 3C 3D
Clim
ate ch
ange
Raw material acquisition and pre-processing 0 0 0 0
Production of the main product 32 6 5 48
Product distribution and storage 0 0 0 0
Use stage 68 94 95 52
End of life 0 0 0 0
Fossil
dep
letion
Raw material acquisition and pre-processing NA NA NA NA
Production of the main product NA NA NA NA
Product distribution and storage NA NA NA NA
Use stage NA NA NA NA
End of life NA NA NA NA

Table 14 - Relevant life cycle stages for climate change and abiotic depletion impact categories for organic and mineral fertilizer
production assessment scenarios for the production 1 ha of winter wheat crop.
Note:
A different rate of fertilizer is applied to the field depending on the type of fertilizer. To be able to compare
between scenarios functionality has to be the same, thus using the crop yield as the functional unit in all
cradle to grave assessment scenarios.
There are no further results shown for these assessment scenarios as commercial databases are aggregated.
The benefit and drawbacks of having aggregated results are discussed in LCA Interpretation: worked example
for CO2 based fertilizer production.
Life cycle stages Contribution (%) for each scenario
4A 4B 5A 5B
Clim
ate chan
ge
Raw material acquisition and pre-processing
0 0 0 0
Production of the main product 15 0 28 0
Product distribution and storage 0 0 0 0
Use stage 85 100 72 100
End of life 0 0 0 0
Fossil d
epletio
n
Raw material acquisition and pre-processing
NA 0 0 0
Production of the main product NA 0 32 0
Product distribution and storage NA 0 0 0
Use stage NA 100 68 100
End of life NA 0 0 0

5.2 CRADLE TO GATE IMPACT ASSESSMENT RESULTS
Figure 13 - Climate change impact category results for all eighteen life cycle inventories with cradle to farm gate boundary with a
reference flow of 1 kg of fertilizer.
Note:
As with cradle to grave, only climate change impact category results can be shown across all eighteen
inventories. Data for other environmental quantities is either not publicly available, inconsistent or
incomplete. LCA Interpretation: worked example for CO2 based fertilizer production analyses this further.
0
1
2
3
4
5
6
7
8
9
kg C
O2
eq
.
Assessment scenarios
1A 1B 1C 1D 1E 1F 2A 2B 2C 2D 3A 3B 3C 3D 4A 4B 5A 5B

5.2.1 CO2 BASED FERTILIZER PRODUCTION ASSESSMENT SCENARIOS-CRADLE TO GATE
Table 15 - Relevant life cycle stages for climate change and abiotic depletion impact categories for CO2 based fertilizer production
assessment scenarios per reference flow of 1 kg of fertilizer. produced.
Table 16 - Relevant processes for climate change and abiotic depletion impact categories for CO2 based fertilizer production
assessment scenarios per reference flow of 1 kg of fertilizer produced.
Life cycle stages Contribution (%) for each scenario 1A 1B 1C 1D 1E 1F
Clim
ate chan
ge
Raw material acquisition and pre-processing
99.2 99.2 99.2 99.2 99.2 99.2
Production of the main product 0.2 0.2 0.2 0.2 0.2 0.2
Product distribution and storage 0.7 0.7 0.7 0.6 0.6 0.6
Use stage 0 0 0 0 0 0
End of life 0 0 0 0.01 0.01 0.01
Ab
iotic
dep
letion
Raw material acquisition and pre-processing
99 99 99 99 99 99
Production of the main product 0 0 0 0 0 0
Product distribution and storage 1 1 1 1 1 1
Use stage 0 0 0 0 0 0
End of life 0 0 0 0 0 0
Most relevant processes Contribution (%) for each scenario 1A 1B 1C 1D 1E 1F
Clim
ate chan
ge
Calcium nitrate production 18 18 18 75 75 75
Ammonia production 80 80 80 17 17 17
Transport to farm gate 1 1 1 1 1 1
Treatment of biowaste 0 0 0 6 6 6
Other processes 2 2 2 2 2 2
Total impacts 100 100 100 100 100 100
Ab
iotic d
epletio
n
Calcium nitrate production 59 59 59 57 57 57
Ammonia production 37 37 37 36 36 36
Transport to farm gate 1 1 1 1 1 1
Treatment of biowaste 0 0 0 4 4 4
Total impacts 2 2 2 2 2 2
Total impacts 100 100 100 100 100 100
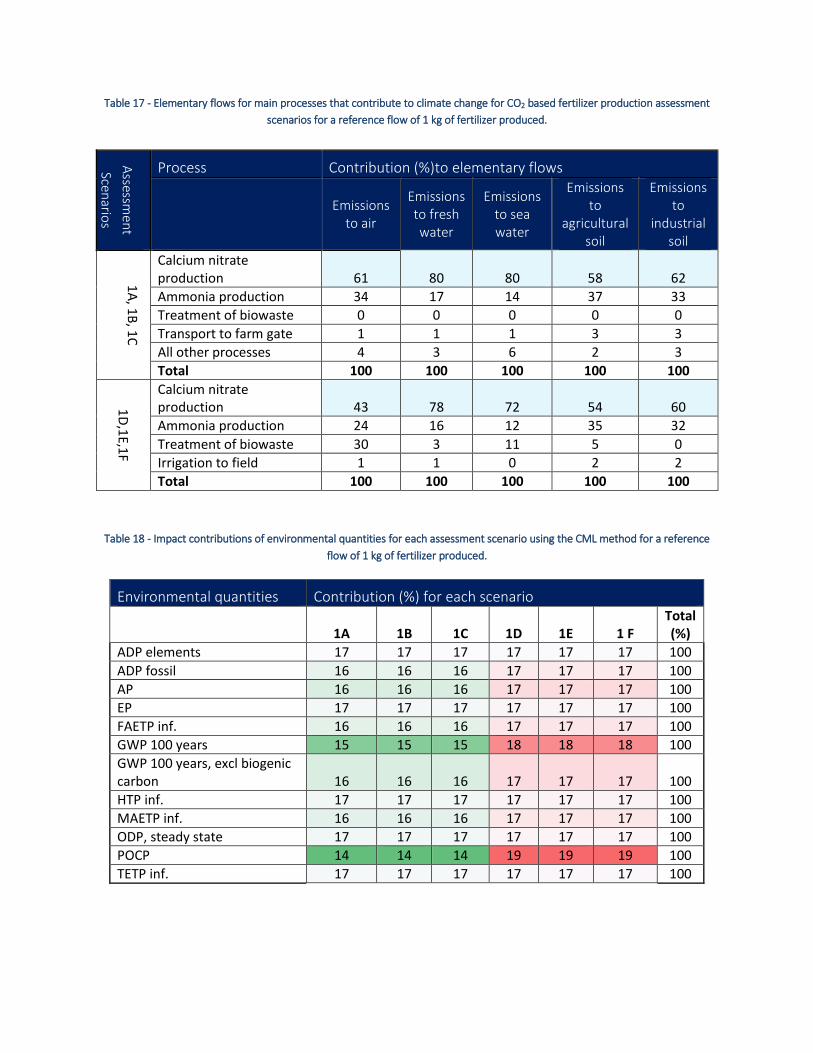
Table 17 - Elementary flows for main processes that contribute to climate change for CO2 based fertilizer production assessment
scenarios for a reference flow of 1 kg of fertilizer produced.
Table 18 - Impact contributions of environmental quantities for each assessment scenario using the CML method for a reference
flow of 1 kg of fertilizer produced.
Assessm
ent
Scenario
s
Process Contribution (%)to elementary flows
Emissions
to air
Emissions to fresh water
Emissions to sea water
Emissions to
agricultural soil
Emissions to
industrial soil
1A
, 1B, 1
C
Calcium nitrate production 61 80 80 58 62
Ammonia production 34 17 14 37 33
Treatment of biowaste 0 0 0 0 0
Transport to farm gate 1 1 1 3 3
All other processes 4 3 6 2 3
Total 100 100 100 100 100
1D
,1E,1
F
Calcium nitrate production 43 78 72 54 60
Ammonia production 24 16 12 35 32
Treatment of biowaste 30 3 11 5 0
Irrigation to field 1 1 0 2 2
Total 100 100 100 100 100
Environmental quantities Contribution (%) for each scenario
1A 1B 1C 1D 1E 1 F Total (%)
ADP elements 17 17 17 17 17 17 100
ADP fossil 16 16 16 17 17 17 100
AP 16 16 16 17 17 17 100
EP 17 17 17 17 17 17 100
FAETP inf. 16 16 16 17 17 17 100
GWP 100 years 15 15 15 18 18 18 100
GWP 100 years, excl biogenic carbon 16 16 16 17 17 17 100
HTP inf. 17 17 17 17 17 17 100
MAETP inf. 16 16 16 17 17 17 100
ODP, steady state 17 17 17 17 17 17 100
POCP 14 14 14 19 19 19 100
TETP inf. 17 17 17 17 17 17 100
Note:
The method used in Section 4.1.2 to obtain results and display them, is also used for the cradle to gate
assessment. Use stage is not accounted for and the most relevant processes change with a smaller boundary.
All inputs and outputs are scaled down to produce and transport 1 kg of fertilizer to the farm gate.
5.2.2 AMMONIUM NITRATE (AN), NPK, ORGANIC FERTILIZER PRODUCTION AND FERTILIZER-
MIX ASSESSMENT SCENARIOS
If the LCI inventories for other reference processes presented in this work are used as shown, then there is
little un-aggregated information available to show contributions to life cycle stages, processes and
reference flow. At this point, the scope and the goal of the study should be revised and adjusted as
necessary. This could lead to further research to expand the current inventories. Alternatively, if aggregated
results are sufficient without the need for hot-spot analysis of reference technologies then there is no need
for changes in the goal and scope. Further discussion in LCA Interpretation: worked example for CO2 based
fertilizer production.
6. Conclusions
This worked example shows the applicability of the “the guidelines” to a CO2 utilization technology with a
focus on life cycle inventory and life cycle impact assessment phases. The product under assessment is a
CO2 based fertilizer that uses recovered carbon dioxide from industrial power generators. The goal of the
LCA study is to compare whether there are reductions in environmental impact when using the CO2 based
fertilizer compared to fertilizer produced from fossil carbon sources. The boundaries of the study are cradle
to grave with a second example of cradle to farm gate boundaries for preliminary studies. The functional
unit is stated as: The fertilizer product needed to produce the same grain yield over 1 ha of winter wheat
in the UK (Considering a temperate climate and a pH soil of < 7) with a reference flow of 1 kg.
A specific aim of this work was to document the results of “picking and mixing” data for the life cycle
inventory phase. Results from this worked example showed that “picking and mixing data” leads to multiple
inventories of the same process. In this case, eighteen different inventories (refer to as “assessment
scenarios” in the study) were created from five types of fertilizer product: CO2 based, ammonium nitrate,
NPK, organic and mineral fertilizer. Data was collected from commercial LCI databases, from the
stakeholder, company websites for reference products and a mix of literature sources. This illustrated the
many possible options in which the LCA practitioner can arrive at different results in the impact assessment
phase and how this will be reflected in the interpretation (refer to “LCA Interpretation: worked example
for CO2 based fertilizer” for more information on the interpretation phase). The stakeholders mainly
provided gate to gate data as field trials are in early stages, for the reference products only the carbon
footprint is disclosed to the public directly from the fertilizer companies, the LCIs from commercial
databases have full inventories but have generic/and or different processes to the CO2 based and reference
product, and lastly, data from literature is mixed from different products/processes/studies. This created
an ideal setup for “picking and mixing” data that is often seen in LCAs for CO2 utilization technologies as
there are few (if any) full inventories with environmental data for both the product under study and the
reference product.
As mentioned above, this resulted in the production of eighteen assessment scenarios each with their own
life cycle impact assessment for both cradle to grave and cradle to gate boundaries. For CO2 based fertilizer
product there are six assessment scenarios with three different field application rates. For ammonium
nitrate and NPK fertilizers there are four assessment scenarios for each and two assessment scenarios for
both organic and mineral fertilizers. The life cycle impact assessment is split into life cycle stages, relevant
process stages, elementary flows and environmental quantities following the methods shown in a guide to
interpret life cycle results published by the JRC. The LCIA results are dependent on the inventory, thus not
all eighteen assessment scenarios will have the same split of stages/processes/elementary flows or
environmental quantities.
All results from the LCIA phase are used for the second worked example “LCA Interpretation: worked
example for CO2 based fertilizer”.

7. References Aguirre Villegas, H., & Larson, R. (2017). Evaluating greenhouse gas emissions from dairy manure
management practices using survey data and lifecycle tools. Journal of Cleaner Production, 143,
169-179.
CF Fertilizers UK limited. (2019). CF Fertilizers. Retrieved September 12, 2019, from
https://www.cffertilisers.co.uk/fertiliser-products/nitrogen/nitram/
EMEP/EEA. (2019). EMEP/EEA air pollutant emission inventory guidebook 2019. Luxembourg: European
Environment Agency. Retrieved from https://www.eea.europa.eu/publications/emep-eea-
guidebook-2019
European Commision. (2019). Fertiliser in the EU Prices, trade and use. Brusseles. Retrieved from
https://ec.europa.eu/info/sites/info/files/food-farming-fisheries/farming/documents/market-
brief-fertilisers_june2019_en.pdf
FAO. (2017). Global database of GHG emissions related to feed crops. Rome: Food and Agriculture
Organization of the United Nations. Retrieved from http://www.fao.org/3/a-i8275e.pdf
FAO. (2017). World fertilizer trends and outlook to 2020. Rome: Food and Agriculture Organization of the
United Nations. Retrieved from http://www.fao.org/3/a-i6895e.pdf
Fertilizers Europe. (2000). Best available techniques for pollution prevention and control in the European
fertlizer industry. Brussels: Fertilizers europe. Retrieved from
https://www.fertilizerseurope.com/wp-content/uploads/2019/08/Booklet_1_final.pdf
Nemecek, T. K. (2007). Life cycle inventories of agricultural production systems. Zurich and Dubendorf:
Ecoinvent. Retrieved from https://db.ecoinvent.org/reports/15_Agriculture.pdf
Yara. (2019). Yara. Retrieved August 15 , 2019, from https://www.yara.com/crop-nutrition/products-and-
solutions/global-fertilizer-brands/
Zampori L., S. E. (2016). Guide for interpreting life cycle assessment result. Brussels: European Comission.
Retrieved from https://publications.jrc.ec.europa.eu/repository/bitstream/JRC104415/lb-na-
28266-en-n.pdf
Zimmermann, A., Wunderlich, J., Buchner, G., Müller, L., Armstrong, K., Michailos, S., . . . Williams, E.
(2018). Techno-Economic Assessment & Life Cycle Assessment Guidelines for CO2 Utilization.
doi:10.3998/2027.42/145436