building an information infrastructure to support microbial metagenomic sciences
TRANSCRIPT
“Building an Information Infrastructure to Support Microbial Metagenomic Sciences"
Presentation for the Microbe Project Interagency Team
[www.microbeproject.gov]
UCSD
La Jolla, CA
January 14, 2006
Dr. Larry Smarr
Director, California Institute for Telecommunications and Information Technology;
Harry E. Gruber Professor,
Dept. of Computer Science and Engineering
Jacobs School of Engineering, UCSD
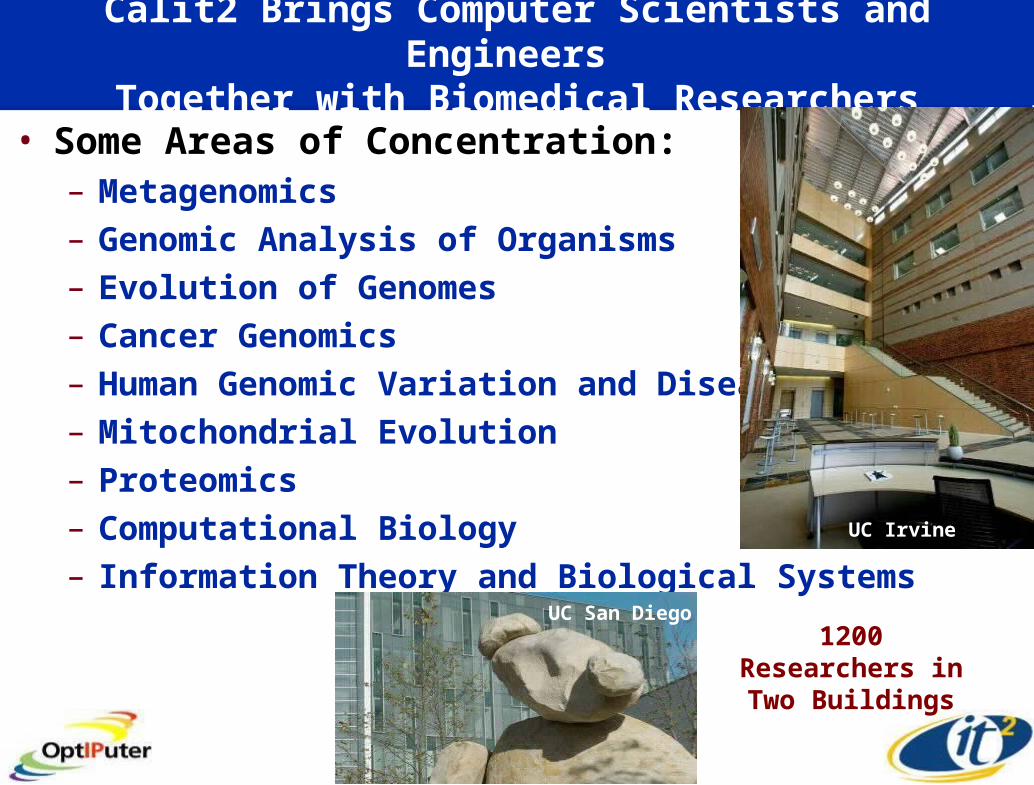
Calit2 Brings Computer Scientists and Engineers Together with Biomedical Researchers
• Some Areas of Concentration:– Metagenomics– Genomic Analysis of Organisms– Evolution of Genomes– Cancer Genomics– Human Genomic Variation and Disease– Mitochondrial Evolution– Proteomics– Computational Biology– Information Theory and Biological Systems
UC San Diego
UC Irvine
1200 Researchers in Two Buildings

PI Larry Smarr

Announcing Tuesday January 17, 2006
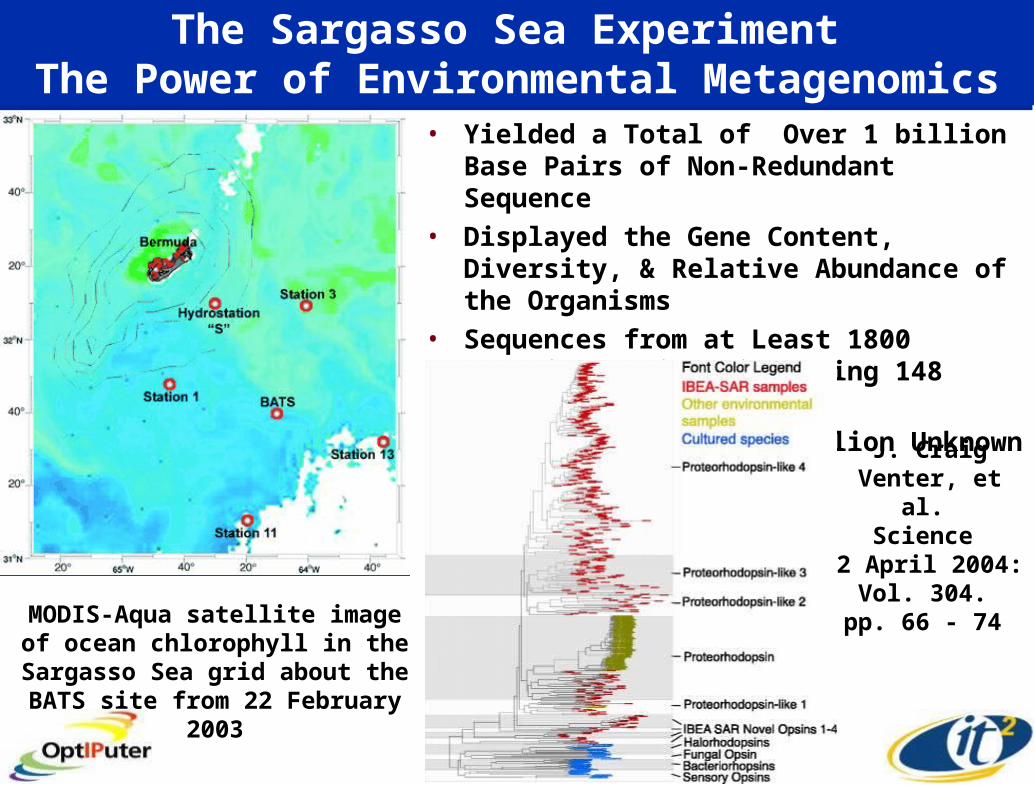
The Sargasso Sea Experiment The Power of Environmental Metagenomics
• Yielded a Total of Over 1 billion Base Pairs of Non-Redundant Sequence
• Displayed the Gene Content, Diversity, & Relative Abundance of the Organisms
• Sequences from at Least 1800 Genomic Species, including 148 Previously Unknown
• Identified over 1.2 Million Unknown Genes
MODIS-Aqua satellite image of ocean chlorophyll in the Sargasso Sea grid about the BATS site from
22 February 2003
J. Craig Venter, et al.
Science 2 April 2004:
Vol. 304. pp. 66 - 74
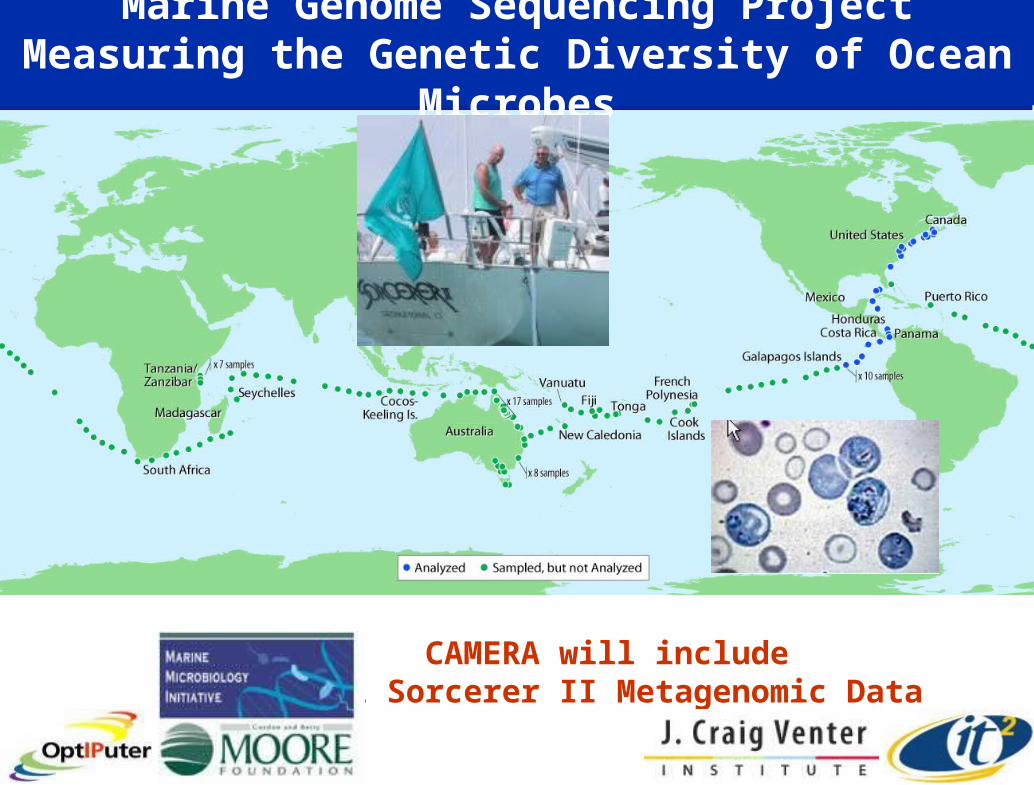
Marine Genome Sequencing ProjectMeasuring the Genetic Diversity of Ocean Microbes
CAMERA will include All Sorcerer II Metagenomic Data

Evolution is the Principle of Biological Systems:Most of Evolutionary Time Was in the Microbial World
You Are
Here
Source: Carl Woese, et al
Much of Genome Work Has
Occurred in Animals

Major New Science Challenge: Understanding the Transition from Collective to Species Evolution
“Bacteria naturally reside in communities, in ecosystems. It is hard to find a bacterial niche that does not comprise hundreds or thousands of different species, all interacting in intricate delicate ways, to make a fascinatingly complex and stable whole.”
“In an era of rampant horizontal gene transfer, organismal evolution would be basically collective. It is the community of organisms that evolves, not the various individual organismal types.”
“This shift from a primitive genetic free-for-all to modern organisms must by all account have been one of the most profound happenings in the whole of evolutionary history.”
--Carl Woese , Evolving Biological Organization in Microbial Phylogeny and Evolution, ed. Jan Sapp (2005)

Genomic Data Is Growing Rapidly, But Metagenomics Will Vastly Increase The Scale…
GenBank Protein Data Bank
www.rcsb.org/pdb/holdings.htmlwww.ncbi.nlm.nih.gov/Genbank
100 Billion Bases!
Total Data < 1TB
35,000 Structures
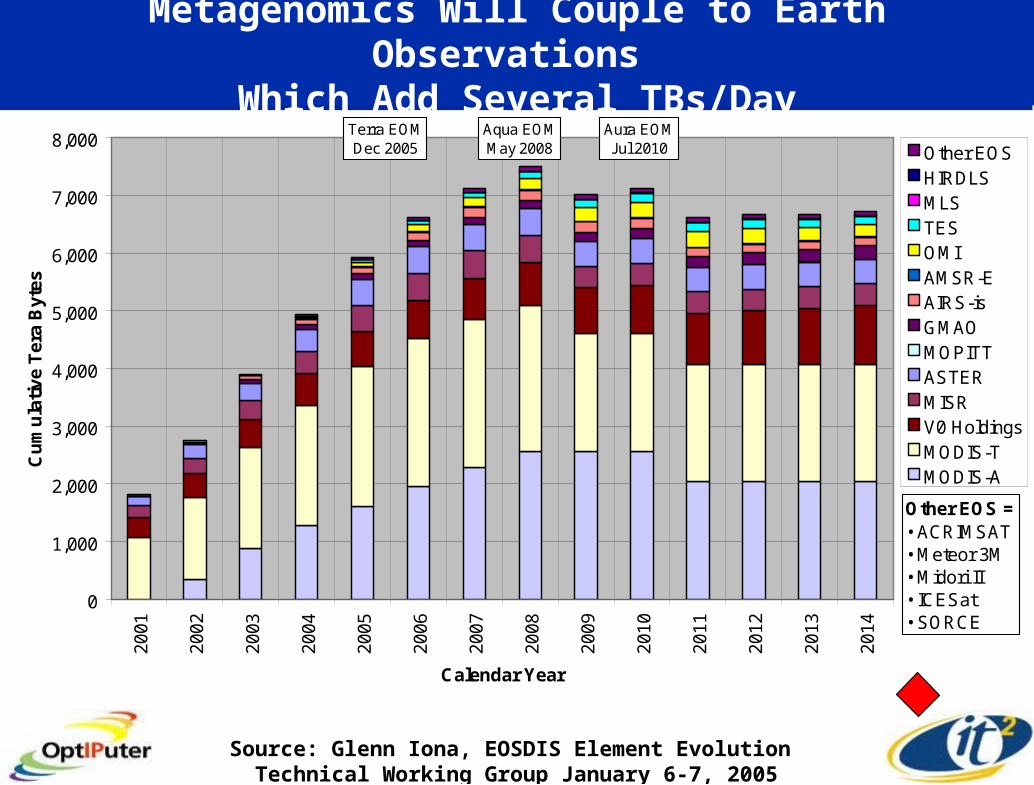
Metagenomics Will Couple to Earth Observations Which Add Several TBs/Day
0
1,000
2,000
3,000
4,000
5,000
6,000
7,000
8,00020
01
2002
2003
2004
2005
2006
2007
2008
2009
2010
2011
2012
2013
2014
Calendar Year
Cu
mu
lati
ve T
era
Byt
es
Other EOSHIRDLSMLSTESOMIAMSR-EAIRS-isGMAOMOPITTASTERMISRV0 HoldingsMODIS-TMODIS-A
Other EOS =• ACRIMSAT• Meteor 3M• Midori II• ICESat• SORCE
file name: archive holdings_122204.xlstab: all instr bar
Terra EOMDec 2005
Aqua EOMMay 2008
Aura EOMJul 2010
NOTE: Data remains in the archive pending transition to LTA
Source: Glenn Iona, EOSDIS Element Evolution Technical Working Group January 6-7, 2005

Optical Networks Are Becoming the 21st Century Cyberinfrastructure Driver
Scientific American, January 2001
Number of Years0 1 2 3 4 5
Pe
rfo
rma
nc
e p
er
Do
llar
Sp
en
t
Data Storage(bits per square inch)
(Doubling time 12 Months)
Optical Fiber(bits per second)
(Doubling time 9 Months)
Silicon Computer Chips(Number of Transistors)
(Doubling time 18 Months)
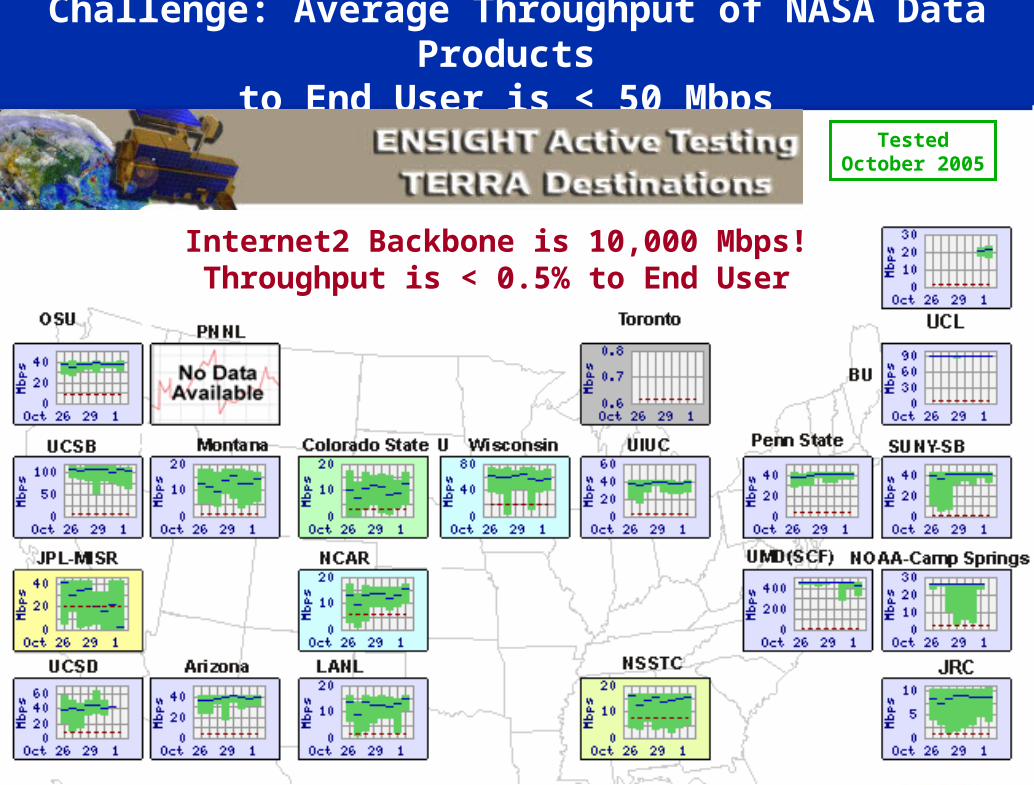
Challenge: Average Throughput of NASA Data Products to End User is < 50 Mbps
TestedOctober 2005
http://ensight.eos.nasa.gov/Missions/icesat/index.shtml
Internet2 Backbone is 10,000 Mbps!Throughput is < 0.5% to End User
fc *
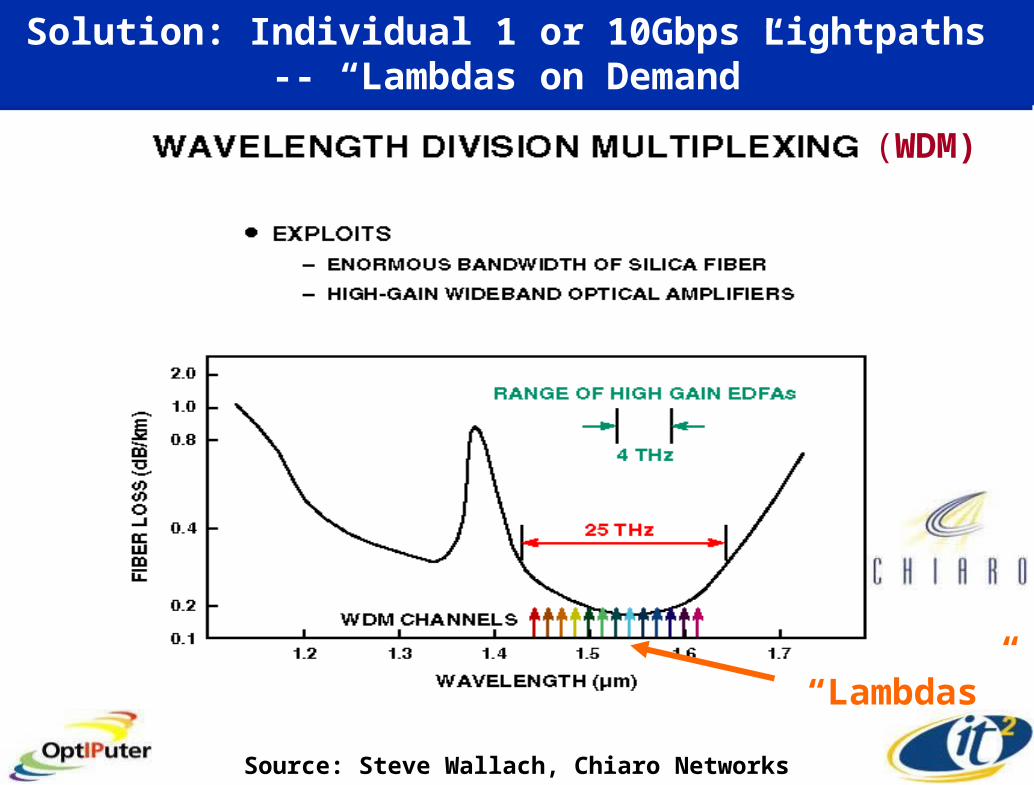
Solution: Individual 1 or 10Gbps Lightpaths -- “Lambdas on Demand”
(WDM)
Source: Steve Wallach, Chiaro Networks
“Lambdas”
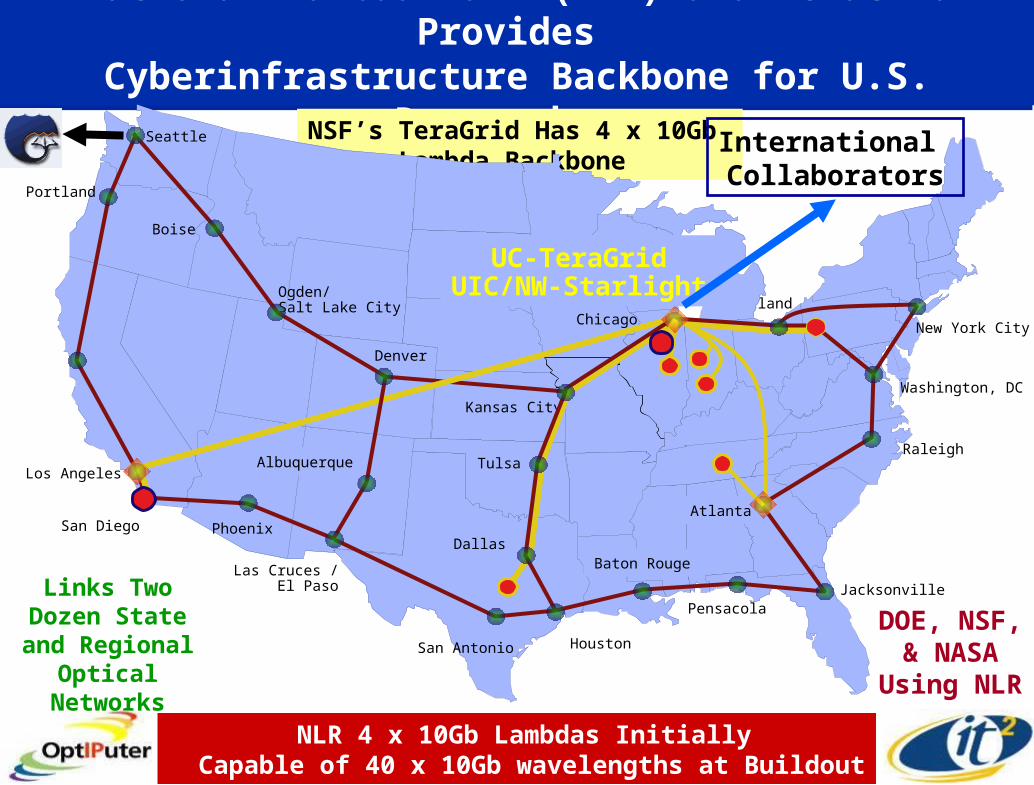
National Lambda Rail (NLR) and TeraGrid Provides Cyberinfrastructure Backbone for U.S. Researchers
NLR 4 x 10Gb Lambdas Initially Capable of 40 x 10Gb wavelengths at Buildout
NSF’s TeraGrid Has 4 x 10Gb Lambda Backbone
Links Two Dozen State and Regional Optical
Networks
DOE, NSF, & NASA
Using NLR
San Francisco Pittsburgh
Cleveland
San Diego
Los Angeles
Portland
Seattle
Pensacola
Baton Rouge
HoustonSan Antonio
Las Cruces /El Paso
Phoenix
New York City
Washington, DC
Raleigh
Jacksonville
Dallas
Tulsa
Atlanta
Kansas City
Denver
Ogden/Salt Lake City
Boise
Albuquerque
UC-TeraGridUIC/NW-Starlight
Chicago
International Collaborators

chance2 10Gig (eth1 Intel Pro/10GbE)5 August 2005
chance1 10Gig (eth1 Intel Pro/10GbE)5 August 2005
DRAGON 10Gig DWDM XFP 5 August 2005
15
GSFC Scientific and Engineering Network (SEN)Mrtg-based `Daily' Graph (5 Minute Average)
Bits per second In and Out On Selected Interfaces
On August 5, 2005, GSFC’s Bill Fink simultaneously conducted two 15-minute-duration UDP-based 4.5-Gbps flow tests, with one flow between GSFC-UCSD and the other between GSFC-StarLight/Chicago. This filled both the NLR/WASH-STAR and DRAGON/channel49 lambdas to 90% of capacity. Flows were also tested in both directions. He measured greater than 9-Gbps aggregate in each direction and no-to-negligible packet losses.
Lambdas Give End Users Sustained ~ 10 Gbps Data Flow Rates
200 Times Faster Than Standard
Internet2!
Source: Pat Gary, NASA GSFC

September 26-30, 2005Calit2 @ University of California, San Diego
California Institute for Telecommunications and Information Technology
Global Connections Between University Research Centers at 10Gbps
iGrid
2005T H E G L O B A L L A M B D A I N T E G R A T E D F A C I L I T Y
Maxine Brown, Tom DeFanti, Co-Chairs
www.igrid2005.org
21 Countries Driving 50 Demonstrations1 or 10Gbps to Calit2@UCSD Building
Sept 2005
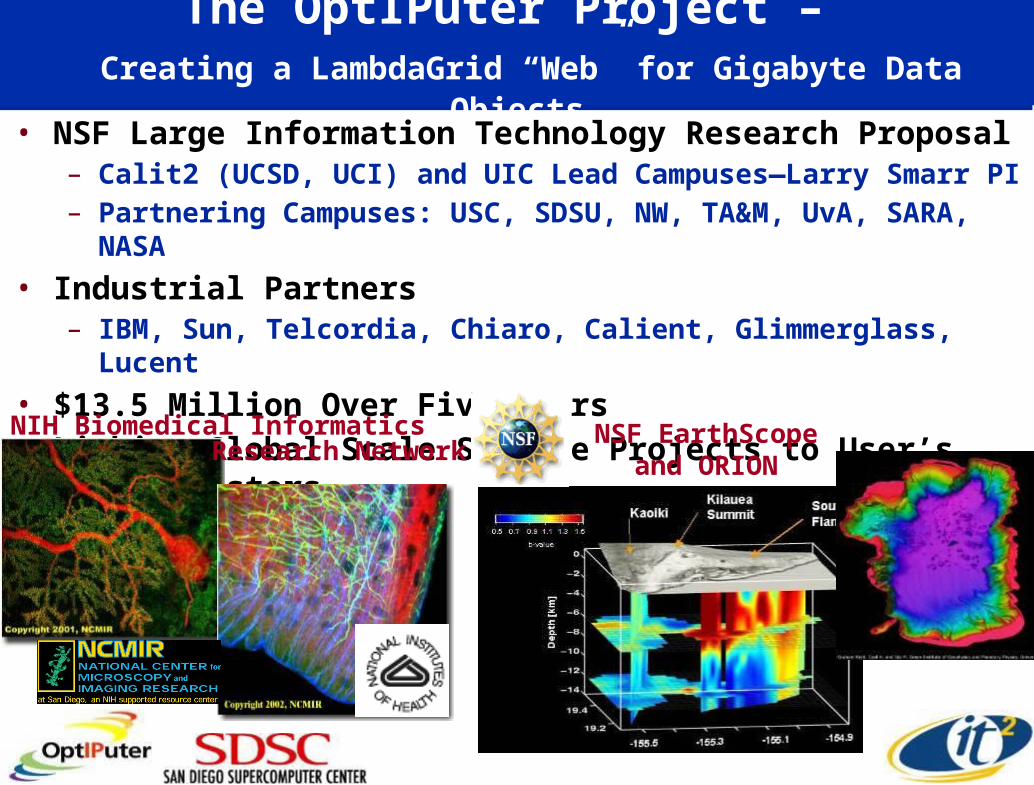
The OptIPuter Project – Creating a LambdaGrid “Web” for Gigabyte Data Objects
• NSF Large Information Technology Research Proposal– Calit2 (UCSD, UCI) and UIC Lead Campuses—Larry Smarr PI– Partnering Campuses: USC, SDSU, NW, TA&M, UvA, SARA, NASA
• Industrial Partners– IBM, Sun, Telcordia, Chiaro, Calient, Glimmerglass, Lucent
• $13.5 Million Over Five Years• Linking Global Scale Science Projects to User’s Linux ClustersNIH Biomedical Informatics NSF EarthScope
and ORIONResearch Network

What is the OptIPuter?
• Applications Drivers Interactive Analysis of Large Data Sets
• OptIPuter Nodes Scalable PC Clusters with Graphics Cards
• IP over Lambda Connectivity Predictable Backplane
• Open Source LambdaGrid Middleware Network is Reservable
• Data Retrieval and Mining Lambda Attached Data Servers
• High Defn. Vis., Collab. SW High Performance Collaboratory
See Nov 2003 Communications of the ACM for Articles on OptIPuter Technologies
www.optiputer.net

End User Device: Tiled Wall Driven by OptIPuter Graphics Cluster
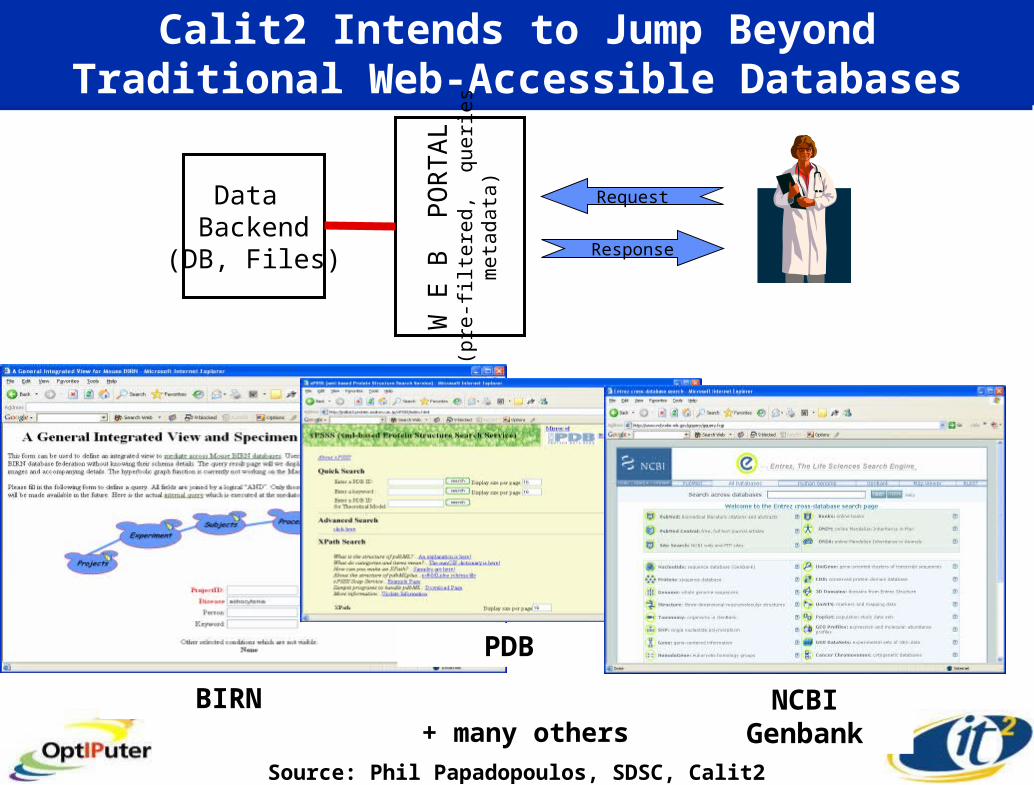
Calit2 Intends to Jump BeyondTraditional Web-Accessible Databases
Data Backend
(DB, Files)
W E
B P
OR
TA
L(p
re-f
ilte
red
, q
ue
rie
sm
eta
da
ta)
Response
Request
BIRN
PDB
NCBI Genbank+ many others
Source: Phil Papadopoulos, SDSC, Calit2
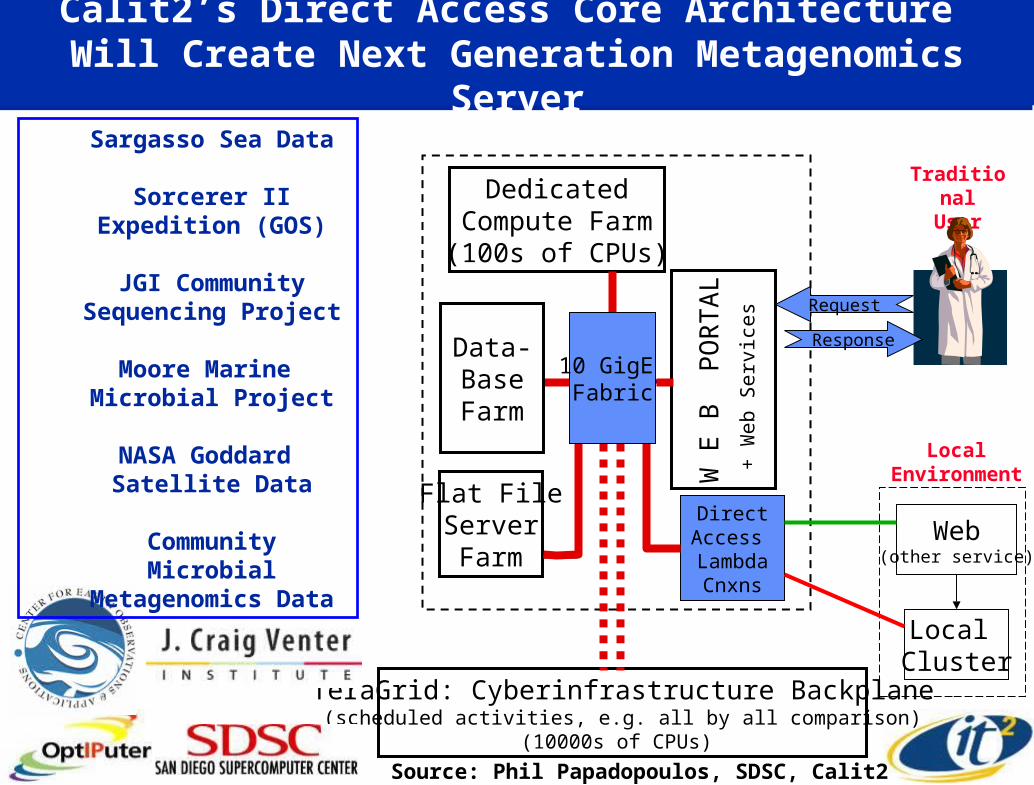
Flat FileServerFarm
W E
B P
OR
TA
L
TraditionalUser
Response
Request
DedicatedCompute Farm(100s of CPUs)
TeraGrid: Cyberinfrastructure Backplane(scheduled activities, e.g. all by all comparison)
(10000s of CPUs)
Web(other service)
Local Cluster
LocalEnvironment
DirectAccess LambdaCnxns
Data-BaseFarm
10 GigE Fabric
Calit2’s Direct Access Core Architecture Will Create Next Generation Metagenomics Server
Source: Phil Papadopoulos, SDSC, Calit2+
We
b S
erv
ice
s
Sargasso Sea Data
Sorcerer II Expedition (GOS)
JGI Community Sequencing Project
Moore Marine Microbial Project
NASA Goddard Satellite Data
Community Microbial Metagenomics Data

First Implementation of the CAMERA Complex
Compute Database &Storage
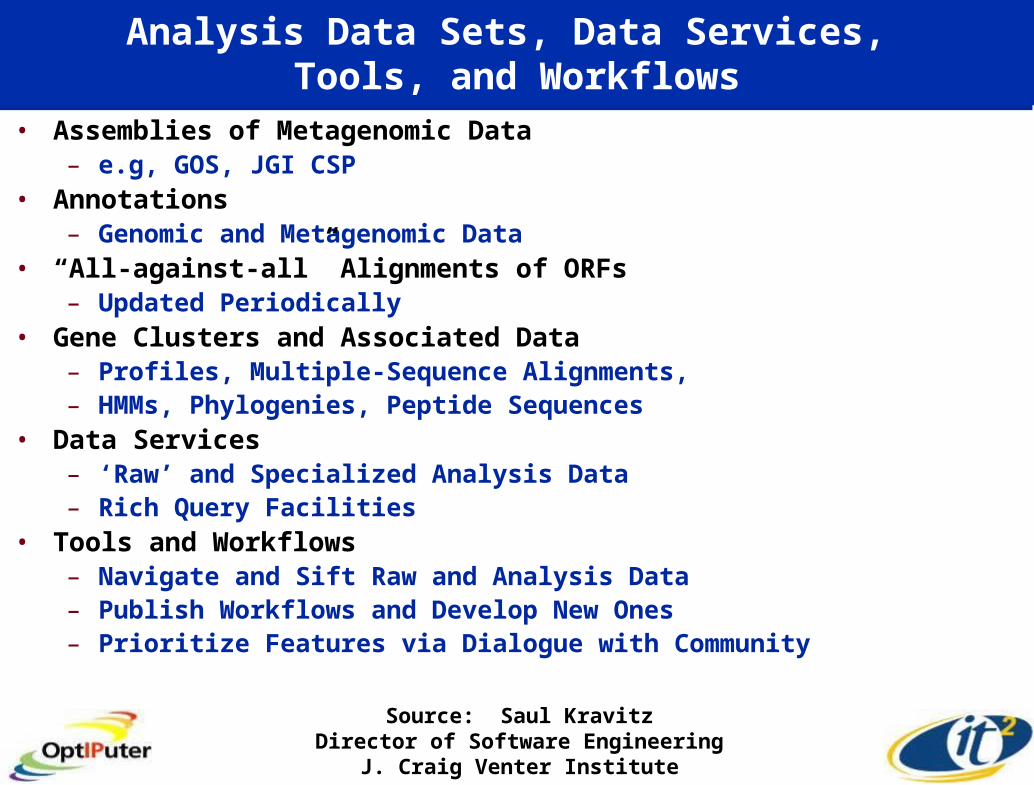
Analysis Data Sets, Data Services, Tools, and Workflows
• Assemblies of Metagenomic Data– e.g, GOS, JGI CSP
• Annotations– Genomic and Metagenomic Data
• “All-against-all” Alignments of ORFs– Updated Periodically
• Gene Clusters and Associated Data– Profiles, Multiple-Sequence Alignments, – HMMs, Phylogenies, Peptide Sequences
• Data Services– ‘Raw’ and Specialized Analysis Data– Rich Query Facilities
• Tools and Workflows– Navigate and Sift Raw and Analysis Data– Publish Workflows and Develop New Ones– Prioritize Features via Dialogue with Community
Source: Saul KravitzDirector of Software Engineering
J. Craig Venter Institute
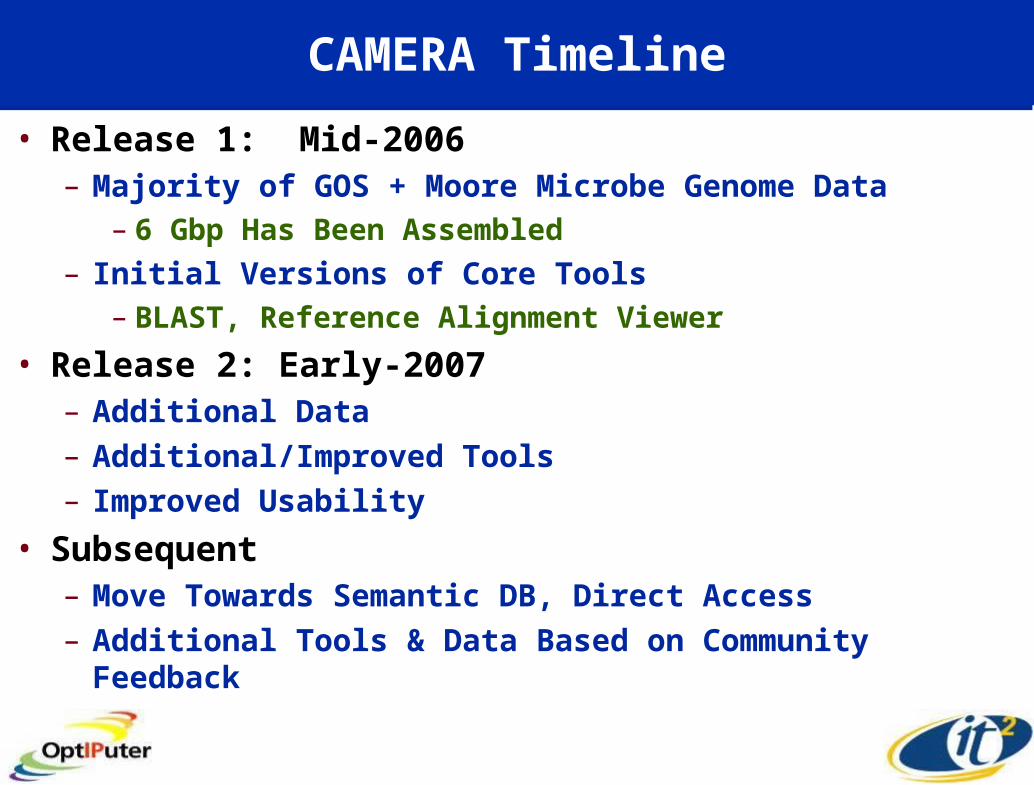
CAMERA Timeline
• Release 1: Mid-2006– Majority of GOS + Moore Microbe Genome Data
– 6 Gbp Has Been Assembled
– Initial Versions of Core Tools– BLAST, Reference Alignment Viewer
• Release 2: Early-2007– Additional Data– Additional/Improved Tools– Improved Usability
• Subsequent– Move Towards Semantic DB, Direct Access– Additional Tools & Data Based on Community Feedback

The Bioinformatics Core of the Joint Center for Structural Genomics will be Housed in the Calit2@UCSD Building
Extremely Thermostable -- Useful for Many Industrial Processes (e.g. Chemical and Food)
173 Structures (122 from JCSG)
• Determining the Protein Structures of the Thermotoga Maritima Genome • 122 T.M. Structures Solved by JCSG (75 Unique In The PDB) • Direct Structural Coverage of 25% of the Expressed Soluble Proteins• Probably Represents the Highest Structural Coverage of Any Organism
Source: John Wooley, UCSD

Web PortalRich Clients
Providing Integrated Grid Software and Infrastructure for Multi-Scale BioModeling
Telescience Portal
Grid Middleware and Web Services
Workflow
MiddlewarePMV ADT
Vision Continuity
APBSCommand
Grid and Cluster Computing Applications Infrastructure
Rocks Grid of ClustersAPBS Continuity
Gtomo2TxBRAutodockGAMESS
QMView
National Biomedical Computation Resource an NIH supported resource center
Located in Calit2@UCSD Building

Prochlorococcus Microbacterium
Burkholderia
Rhodobacter SAR-86
unknown
unknown
Metagenomics “Extreme Assembly” Requires Large Amount of Pixel Real Estate
Source: Karin RemingtonJ. Craig Venter Institute
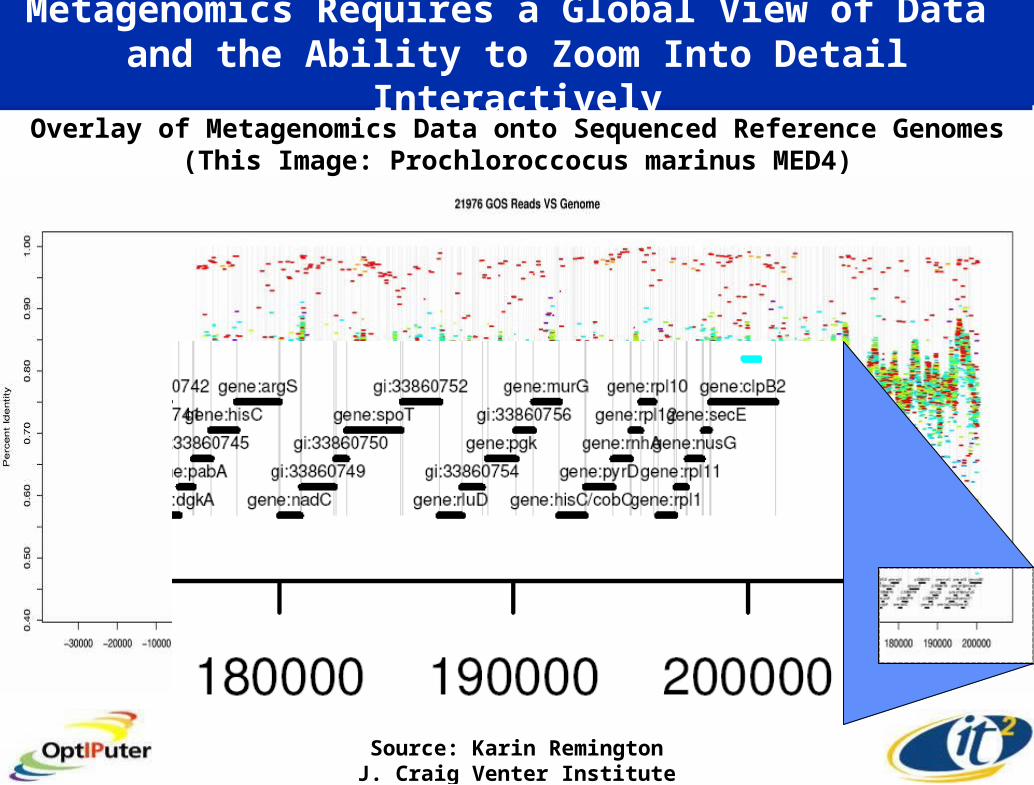
Metagenomics Requires a Global View of Data and the Ability to Zoom Into Detail Interactively
Overlay of Metagenomics Data onto Sequenced Reference Genomes(This Image: Prochloroccocus marinus MED4)
Source: Karin RemingtonJ. Craig Venter Institute

The OptIPuter – Creating High Resolution Portals Over Dedicated Optical Channels to Global Science Data
Green: Purkinje CellsRed: Glial CellsLight Blue: Nuclear DNA
Source: Mark
Ellisman, David Lee,
Jason Leigh
300 MPixel Image!
Calit2 (UCSD, UCI) and UIC Lead Campuses—Larry Smarr PIPartners: SDSC, USC, SDSU, NW, TA&M, UvA, SARA, KISTI, AIST

Scalable Displays Allow Both Global Content and Fine Detail
Source: Mark
Ellisman, David Lee,
Jason Leigh
30 MPixel SunScreen Display Driven by a 20-node Sun Opteron Visualization Cluster
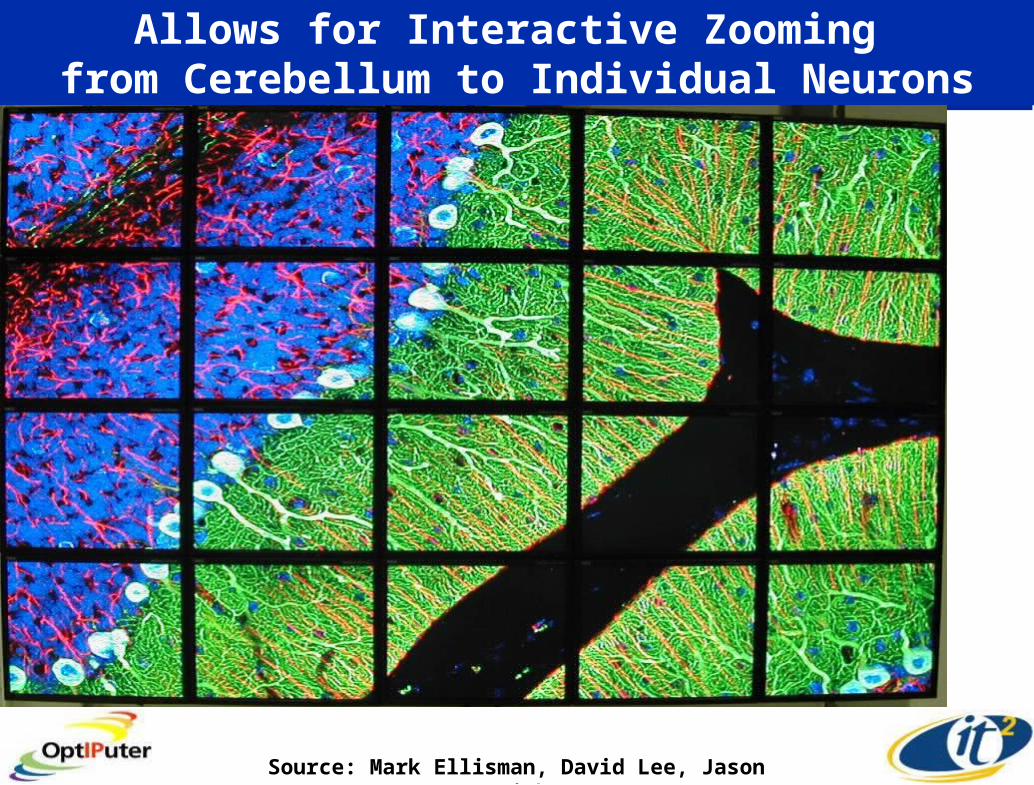
Allows for Interactive Zooming from Cerebellum to Individual Neurons
Source: Mark Ellisman, David Lee, Jason Leigh

The OptIPuter Enabled Collaboratory:Remote Researchers Jointly Exploring Complex Data
New Home of SDSC/Calit2 Synthesis Center
Calit2/EVL/NCMIR Tiled Displays with HD Video
Source: Chaitan Baru, SDSC
Source: Mark Ellisman, NCMIR

Eliminating Distance to Unify Remote Laboratories
HDTV Over Lambda
OptIPuter Visualized
Data
SIO/UCSD
NASA Goddard
www.calit2.net/articles/article.php?id=660
August 8, 2005
25 Miles
Venter Institute

Calit2/SDSC Proposal to Create a UC Cyberinfrastructure
of “On-Ramps” to National LambdaRail ResourcesOptIPuter + CalREN-XD + TeraGrid = “OptiGrid”
Source: Fran Berman, SDSC , Larry Smarr, Calit2
Creating a Critical Mass of End Users on a Secure LambdaGrid
UC San Francisco
UC San Diego
UC Riverside
UC Irvine
UC Davis
UC Berkeley
UC Santa Cruz
UC Santa Barbara
UC Los Angeles
UC Merced
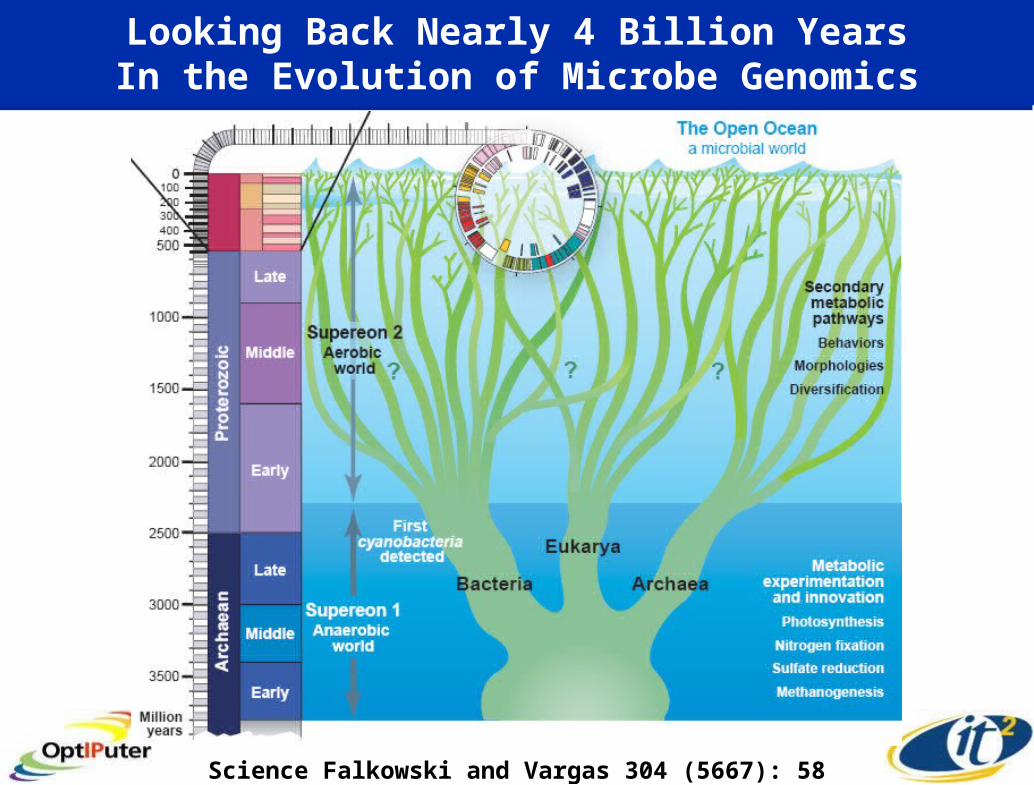
Looking Back Nearly 4 Billion YearsIn the Evolution of Microbe Genomics
Science Falkowski and Vargas 304 (5667): 58