building a resilient us equity portfolio for the post
TRANSCRIPT

Building a Resilient US Equity Portfolio for the Post-COVID Era
Dan diBartolomeo
Webinar September 2021
www.northinfo.com Slide 2
IntroductionD
US equity markets have been quite volatile over the past couple years as the world struggles to contain the COVID 19 pandemic.
Over recent years “sustainable investing” and the application of ESG disciplines has become an increasingly popular conception of how equity capital should be invested.
A natural question is what sort of portfolio might offer the greatest resilience against poor performance arising from the number of issues that are currently “front of mind” for investors.
In this presentation we will consider several different ideas of what “resilience” might mean for US equity investors and provide illustrative portfolios for each theme.
www.northinfo.com Slide 3
Based on different concepts of “resilience” we will produce several example portfolios that may be of special interest for the post COVID era
All exemplars will have certain common properties• All firms will be drawn from the S&P
500 index• All portfolios will hold 100 or fewer
firms• All portfolios must have a tracking
error of 4% annually or less to the S&P 500 as the benchmark index.
Our Empirical Framework to Weather the Storm
www.northinfo.com Slide 4
One way to think about resilience is to form a portfolio from companies that are least likely to be in distress during unfavorable conditions, whether purely economic or arising from some exogenous effect such as war or pandemic.
We published our model of corporate sustainability • diBartolomeo, Dan, “Equity Risk, Default Risk,
Default Correlation and Corporate Sustainability”, Journal of Investing, Winter 2010.
• The underlying model is similar to Merton (JoF, 1974) wherein the equity of a firm is equated to a perpetual call option on the firm’s assets.
• Due to limited liability of corporate shareholders, the same problem can be treated as a put option in which firm assets are delivered to lenders.
• The output metric is a half life. A score of 30 implies that a firm has a 50% chance of surviving 30 years into the future.
• Data is available monthly from 1992 to date
Resilience as Survival in Unfavorable Conditions
www.northinfo.com Slide 5
Could “Survivalist Views” Hurt Performance?
While avoiding investment in companies that don’t go bankrupt sounds prima faciaappealing, we must at least consider the
possibility that some firms might survive in the long run by being pathologically
conservative and never growing.
• A manifestation of “Nothing ventured, nothing gained”
• There is evidence in the real estate markets that US states that discourage real estate speculation (“flipping”) through taxation have had the lowest rates of property appreciation.
We studied this issue by creating portfolios that were intentionally survivorship biased.
• We formulated portfolios from firms that had survived at least twenty- five years without changing the primary line of business.
• Several studies including ours found an annual equity alpha of around 3% for survivors (if you know who they will be in advance) in the US
• Northfield News December 2018.pub (northinfo.com)
www.northinfo.com Slide 6
A “Sustainability” Portfolio as of August 31, 2021
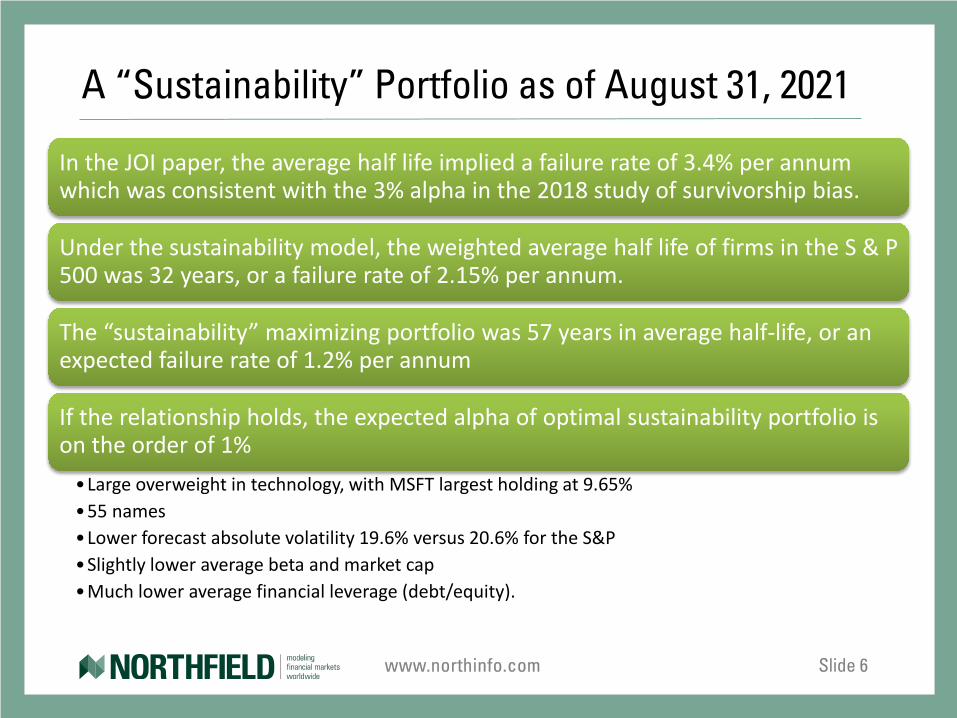
In the JOI paper, the average half life implied a failure rate of 3.4% per annum which was consistent with the 3% alpha in the 2018 study of survivorship bias.
Under the sustainability model, the weighted average half life of firms in the S & P 500 was 32 years, or a failure rate of 2.15% per annum.
The “sustainability” maximizing portfolio was 57 years in average half-life, or an expected failure rate of 1.2% per annum
If the relationship holds, the expected alpha of optimal sustainability portfolio is on the order of 1%
•Large overweight in technology, with MSFT largest holding at 9.65%•55 names•Lower forecast absolute volatility 19.6% versus 20.6% for the S&P•Slightly lower average beta and market cap•Much lower average financial leverage (debt/equity).
www.northinfo.com Slide 7
Assuming Investors Care a Lot About Big Events
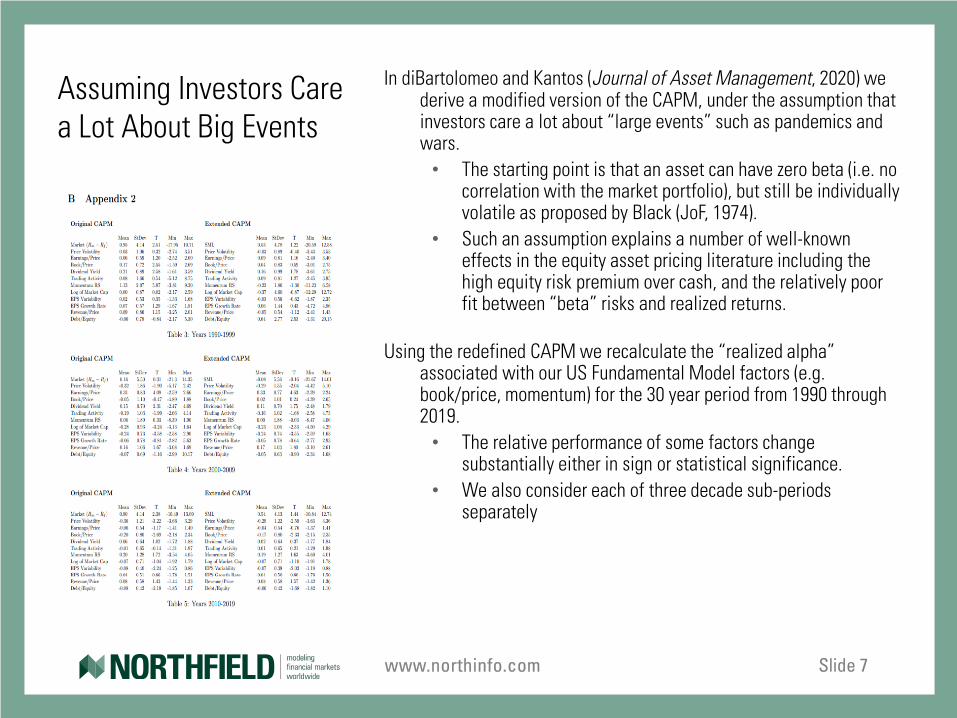
In diBartolomeo and Kantos (Journal of Asset Management, 2020) we derive a modified version of the CAPM, under the assumption that investors care a lot about “large events” such as pandemics and wars.
• The starting point is that an asset can have zero beta (i.e. no correlation with the market portfolio), but still be individually volatile as proposed by Black (JoF, 1974).
• Such an assumption explains a number of well-known effects in the equity asset pricing literature including the high equity risk premium over cash, and the relatively poor fit between “beta” risks and realized returns.
Using the redefined CAPM we recalculate the “realized alpha” associated with our US Fundamental Model factors (e.g. book/price, momentum) for the 30 year period from 1990 through 2019.
• The relative performance of some factors change substantially either in sign or statistical significance.
• We also consider each of three decade sub-periods separately
www.northinfo.com Slide 8
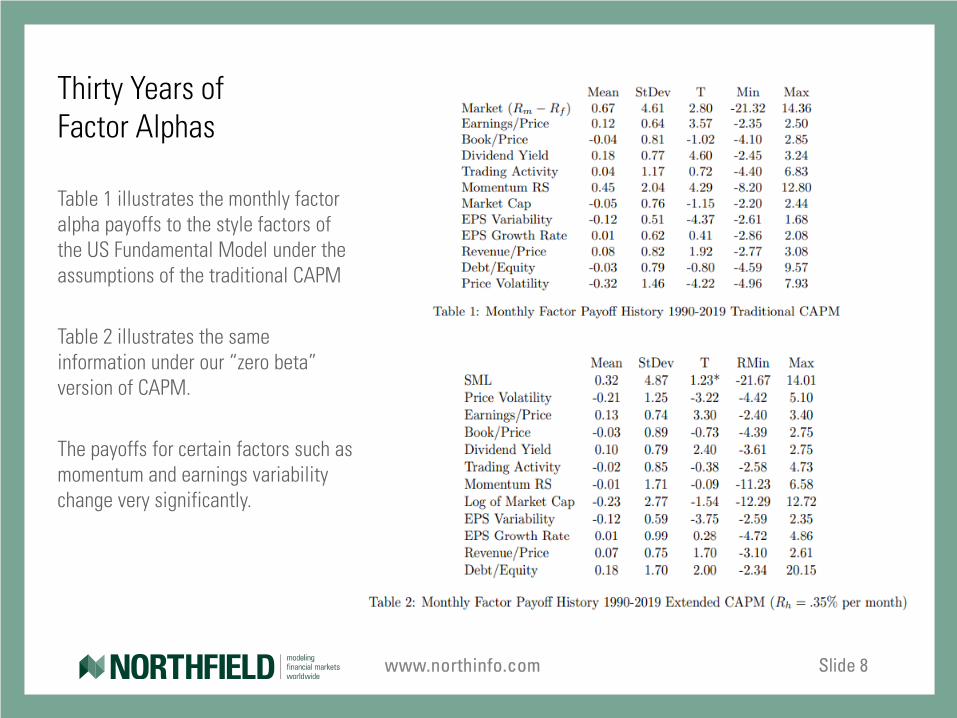
Thirty Years of Factor Alphas
Table 1 illustrates the monthly factor alpha payoffs to the style factors of the US Fundamental Model under the assumptions of the traditional CAPM
Table 2 illustrates the same information under our “zero beta” version of CAPM.
The payoffs for certain factors such as momentum and earnings variability change very significantly.
www.northinfo.com Slide 9
Optimal Real Alpha Portfolio As of August 31, 2021
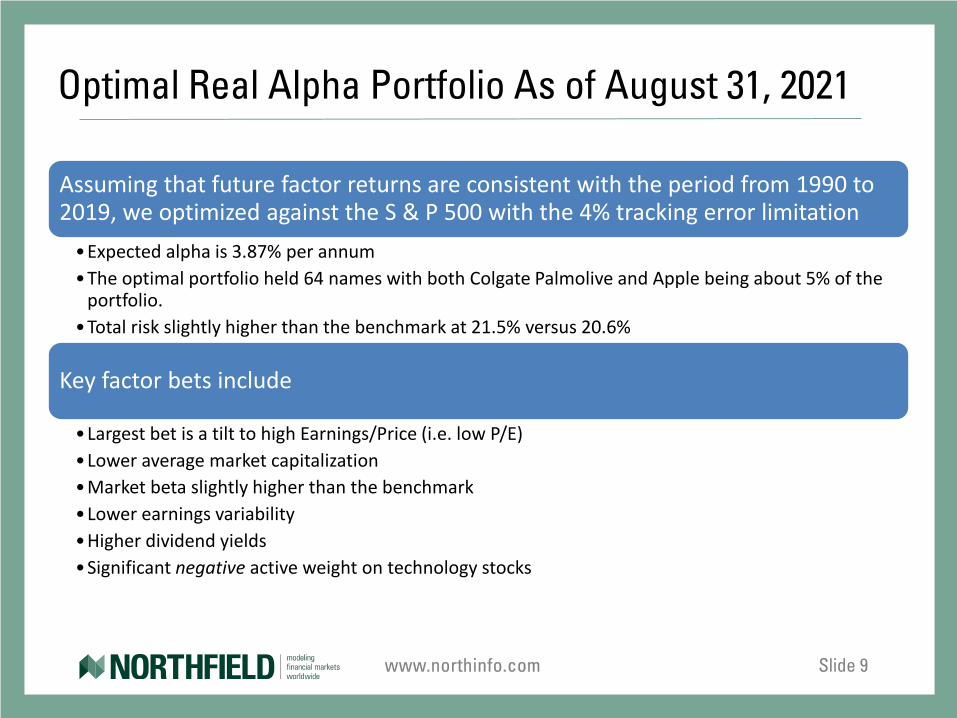
Assuming that future factor returns are consistent with the period from 1990 to 2019, we optimized against the S & P 500 with the 4% tracking error limitation
•Expected alpha is 3.87% per annum•The optimal portfolio held 64 names with both Colgate Palmolive and Apple being about 5% of the
portfolio. •Total risk slightly higher than the benchmark at 21.5% versus 20.6%
Key factor bets include
•Largest bet is a tilt to high Earnings/Price (i.e. low P/E)•Lower average market capitalization•Market beta slightly higher than the benchmark•Lower earnings variability•Higher dividend yields•Significant negative active weight on technology stocks
www.northinfo.com Slide 10
In 2021 we published “The Four Horseman of the Investment Apocalypse” in the Journal of Performance Measurement.
The four are identified as War, Pandemic, Climate Change, and Corruption
Of these War and Pandemic represent “fast” events, while Climate Change and Corruption are defined as “slow events”
The Four Horseman of the Investment Apocalypse
www.northinfo.com Slide 11
A Climate Change Portfolio
Unless you want to make active bets, the most obvious strategy to deal with
climate change is to remove companies related to fossil fuels as either producers or heavy consumers from your portfolio.
• Businesses sensitive to the cost of fossil fuels will be negatively correlated with fossil energy producers
• Some businesses that are negatively correlated with oil prices aren’t obvious.
• The strongest negative correlations arise in “big box” retailers like Walmart and Home Depot where both consumer spending and operating expenses are impacted by energy costs.
We published early two papers on the dominance of the fossil fuels on the
relative performance of SRI/ESG portfolios. About 80% explanatory
power
• Kurtz, Lloyd and Dan diBartolomeo. "Socially Screened Portfolios: An Attribution Analysis Of Relative Performance," Journal of Investing, 1996, v5(3,Fall), 35-41.
• diBartolomeo and Dan and Lloyd Kurtz. “Long Term Performance of a Social Investment Universe”, Journal of Investing, Fall 2011.
www.northinfo.com Slide 12
The “No Carbon” Portfolio For Climate Change
In this case we are removing all securities associated with fossil fuel production from the portfolio while trying to minimize the tracking error relative to the S&P benchmark index.
• With the entire oil sector removed and the 100 “maximum number of firms” constraint in place, the minimum tracking error achievable is 1.1% per annum. • Note that this level of tracking error is on the same order as different representations of
US large capitalization stocks (e.g. Russell 1000, S&P 500, Dow Jones, Wilshire) • The optimal portfolio uses the full 100 positions available. • The absolute volatility is slightly higher (less diversification from 100 positions) at 21.3%
compared to 20.6% for the benchmark.
Largest positions are tech firms and “seemingly unrelated” to fossil energy
• Apple, Microsoft, Amazon, Alphabet, Facebook
www.northinfo.com Slide 13
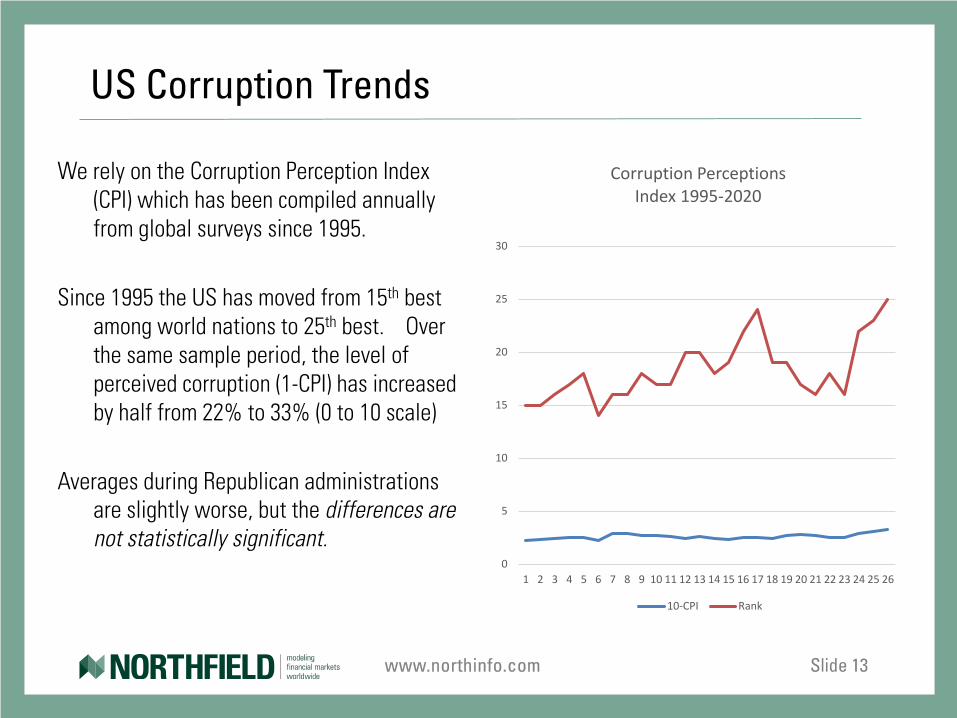
We rely on the Corruption Perception Index (CPI) which has been compiled annually from global surveys since 1995.
Since 1995 the US has moved from 15th best among world nations to 25th best. Over the same sample period, the level of perceived corruption (1-CPI) has increased by half from 22% to 33% (0 to 10 scale)
Averages during Republican administrations are slightly worse, but the differences are not statistically significant.
US Corruption Trends
0
5
10
15
20
25
30
1 2 3 4 5 6 7 8 9 10 11 12 13 14 15 16 17 18 19 20 21 22 23 24 25 26
Corruption PerceptionsIndex 1995-2020
10-CPI Rank
www.northinfo.com Slide 14
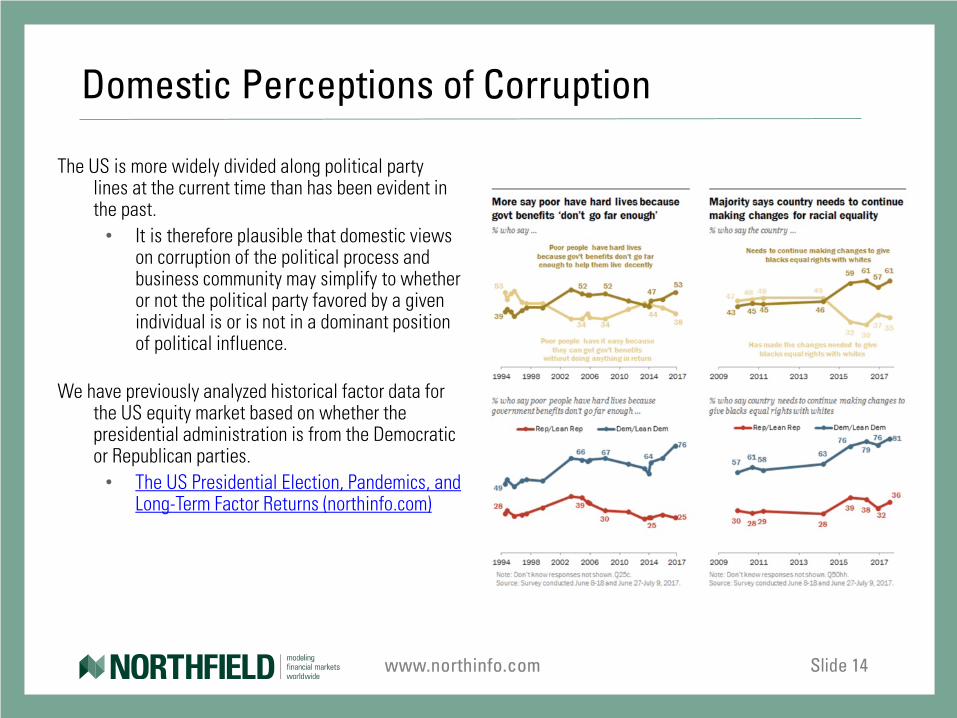
The US is more widely divided along political party lines at the current time than has been evident in the past.
• It is therefore plausible that domestic views on corruption of the political process and business community may simplify to whether or not the political party favored by a given individual is or is not in a dominant position of political influence.
We have previously analyzed historical factor data for the US equity market based on whether the presidential administration is from the Democratic or Republican parties.
• The US Presidential Election, Pandemics, and Long-Term Factor Returns (northinfo.com)
Domestic Perceptions of Corruption
www.northinfo.com Slide 15
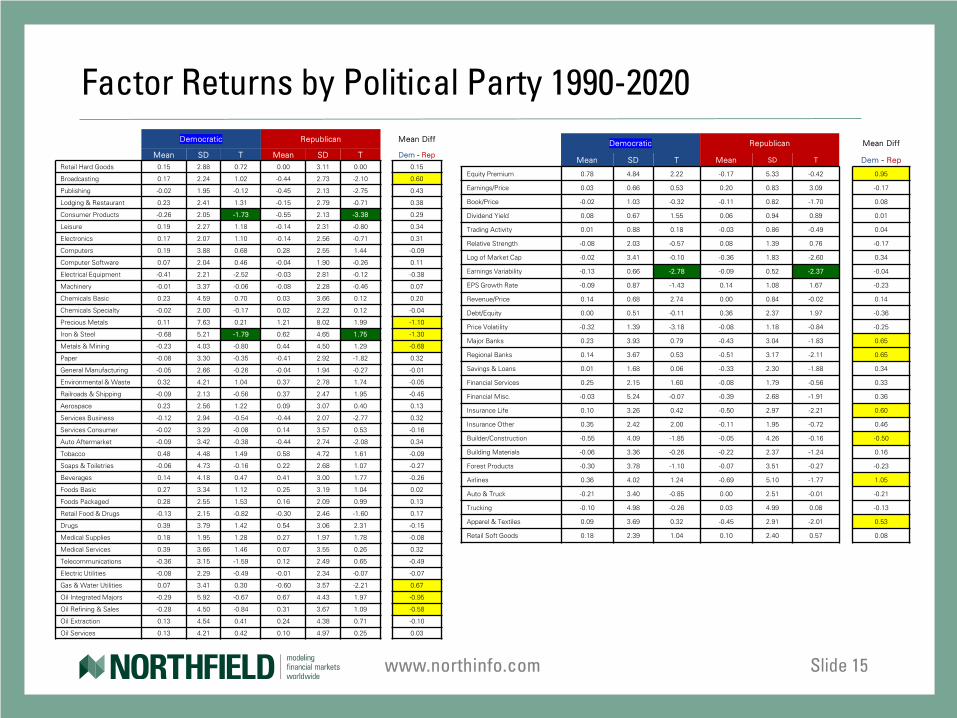
Factor Returns by Political Party 1990-2020Democratic Republican Mean Diff
Mean SD T Mean SD T Dem - Rep
Retail Hard Goods 0.15 2.88 0.72 0.00 3.11 0.00 0.15
Broadcasting 0.17 2.24 1.02 -0.44 2.73 -2.10 0.60
Publishing -0.02 1.95 -0.12 -0.45 2.13 -2.75 0.43
Lodging & Restaurant 0.23 2.41 1.31 -0.15 2.79 -0.71 0.38
Consumer Products -0.26 2.05 -1.73 -0.55 2.13 -3.38 0.29
Leisure 0.19 2.27 1.18 -0.14 2.31 -0.80 0.34
Electronics 0.17 2.07 1.10 -0.14 2.56 -0.71 0.31
Computers 0.19 3.88 0.68 0.28 2.55 1.44 -0.09
Computer Software 0.07 2.04 0.46 -0.04 1.90 -0.26 0.11
Electrical Equipment -0.41 2.21 -2.52 -0.03 2.81 -0.12 -0.38
Machinery -0.01 3.37 -0.06 -0.08 2.28 -0.46 0.07
Chemicals Basic 0.23 4.59 0.70 0.03 3.66 0.12 0.20
Chemicals Specialty -0.02 2.00 -0.17 0.02 2.22 0.12 -0.04
Precious Metals 0.11 7.63 0.21 1.21 8.02 1.99 -1.10
Iron & Steel -0.68 5.21 -1.79 0.62 4.65 1.75 -1.30
Metals & Mining -0.23 4.03 -0.80 0.44 4.50 1.29 -0.68
Paper -0.08 3.30 -0.35 -0.41 2.92 -1.82 0.32
General Manufacturing -0.05 2.66 -0.26 -0.04 1.94 -0.27 -0.01
Environmental & Waste 0.32 4.21 1.04 0.37 2.78 1.74 -0.05
Railroads & Shipping -0.09 2.13 -0.56 0.37 2.47 1.95 -0.45
Aerospace 0.23 2.56 1.22 0.09 3.07 0.40 0.13
Services Business -0.12 2.94 -0.54 -0.44 2.07 -2.77 0.32
Services Consumer -0.02 3.29 -0.08 0.14 3.57 0.53 -0.16
Auto Aftermarket -0.09 3.42 -0.38 -0.44 2.74 -2.08 0.34
Tobacco 0.48 4.48 1.49 0.58 4.72 1.61 -0.09
Soaps & Toiletries -0.06 4.73 -0.16 0.22 2.68 1.07 -0.27
Beverages 0.14 4.18 0.47 0.41 3.00 1.77 -0.26
Foods Basic 0.27 3.34 1.12 0.25 3.19 1.04 0.02
Foods Packaged 0.28 2.55 1.53 0.16 2.09 0.99 0.13
Retail Food & Drugs -0.13 2.15 -0.82 -0.30 2.46 -1.60 0.17
Drugs 0.39 3.79 1.42 0.54 3.06 2.31 -0.15
Medical Supplies 0.18 1.95 1.28 0.27 1.97 1.78 -0.08
Medical Services 0.39 3.66 1.46 0.07 3.55 0.26 0.32
Telecommunications -0.36 3.15 -1.59 0.12 2.49 0.65 -0.49
Electric Utilities -0.08 2.29 -0.49 -0.01 2.34 -0.07 -0.07
Gas & Water Utilities 0.07 3.41 0.30 -0.60 3.57 -2.21 0.67
Oil Integrated Majors -0.29 5.92 -0.67 0.67 4.43 1.97 -0.95
Oil Refining & Sales -0.28 4.50 -0.84 0.31 3.67 1.09 -0.58
Oil Extraction 0.13 4.54 0.41 0.24 4.38 0.71 -0.10
Oil Services 0.13 4.21 0.42 0.10 4.97 0.25 0.03
Democratic Republican Mean Diff
Mean SD T Mean SD T Dem - Rep
Equity Premium 0.78 4.84 2.22 -0.17 5.33 -0.42 0.95
Earnings/Price 0.03 0.66 0.53 0.20 0.83 3.09 -0.17
Book/Price -0.02 1.03 -0.32 -0.11 0.82 -1.70 0.08
Dividend Yield 0.08 0.67 1.55 0.06 0.94 0.89 0.01
Trading Activity 0.01 0.88 0.18 -0.03 0.86 -0.49 0.04
Relative Strength -0.08 2.03 -0.57 0.08 1.39 0.76 -0.17
Log of Market Cap -0.02 3.41 -0.10 -0.36 1.83 -2.60 0.34
Earnings Variability -0.13 0.66 -2.78 -0.09 0.52 -2.37 -0.04
EPS Growth Rate -0.09 0.87 -1.43 0.14 1.08 1.67 -0.23
Revenue/Price 0.14 0.68 2.74 0.00 0.84 -0.02 0.14
Debt/Equity 0.00 0.51 -0.11 0.36 2.37 1.97 -0.36
Price Volatility -0.32 1.39 -3.18 -0.08 1.18 -0.84 -0.25
Major Banks 0.23 3.93 0.79 -0.43 3.04 -1.83 0.65
Regional Banks 0.14 3.67 0.53 -0.51 3.17 -2.11 0.65
Savings & Loans 0.01 1.68 0.06 -0.33 2.30 -1.88 0.34
Financial Services 0.25 2.15 1.60 -0.08 1.79 -0.56 0.33
Financial Misc. -0.03 5.24 -0.07 -0.39 2.68 -1.91 0.36
Insurance Life 0.10 3.26 0.42 -0.50 2.97 -2.21 0.60
Insurance Other 0.35 2.42 2.00 -0.11 1.95 -0.72 0.46
Builder/Construction -0.55 4.09 -1.85 -0.05 4.26 -0.16 -0.50
Building Materials -0.06 3.36 -0.26 -0.22 2.37 -1.24 0.16
Forest Products -0.30 3.78 -1.10 -0.07 3.51 -0.27 -0.23
Airlines 0.36 4.02 1.24 -0.69 5.10 -1.77 1.05
Auto & Truck -0.21 3.40 -0.85 0.00 2.51 -0.01 -0.21
Trucking -0.10 4.98 -0.26 0.03 4.99 0.08 -0.13
Apparel & Textiles 0.09 3.69 0.32 -0.45 2.91 -2.01 0.53
Retail Soft Goods 0.18 2.39 1.04 0.10 2.40 0.57 0.08
www.northinfo.com Slide 16
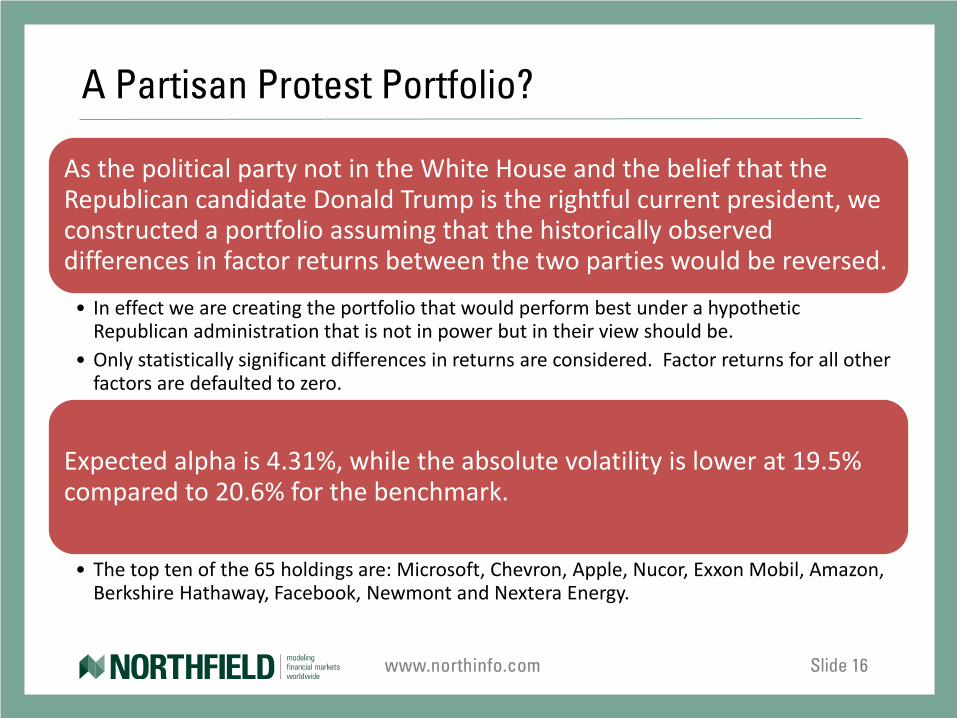
A Partisan Protest Portfolio?
As the political party not in the White House and the belief that the Republican candidate Donald Trump is the rightful current president, we constructed a portfolio assuming that the historically observed differences in factor returns between the two parties would be reversed.
• In effect we are creating the portfolio that would perform best under a hypothetic Republican administration that is not in power but in their view should be.
• Only statistically significant differences in returns are considered. Factor returns for all other factors are defaulted to zero.
Expected alpha is 4.31%, while the absolute volatility is lower at 19.5% compared to 20.6% for the benchmark.
• The top ten of the 65 holdings are: Microsoft, Chevron, Apple, Nucor, Exxon Mobil, Amazon, Berkshire Hathaway, Facebook, Newmont and Nextera Energy.
www.northinfo.com Slide 17
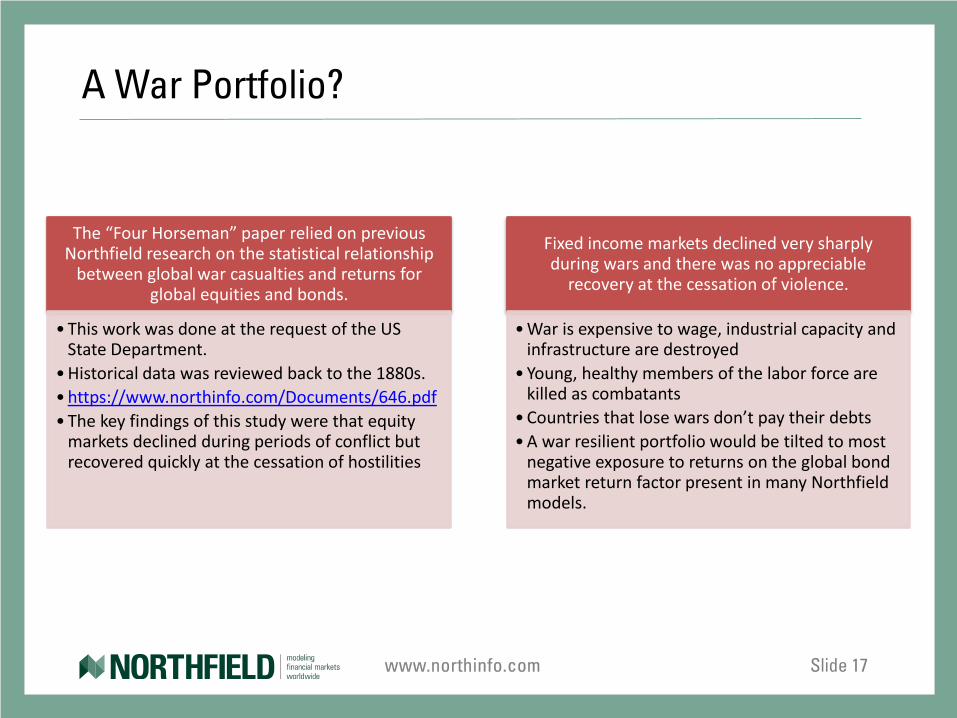
A War Portfolio?
The “Four Horseman” paper relied on previous Northfield research on the statistical relationship
between global war casualties and returns for global equities and bonds.
• This work was done at the request of the US State Department.
• Historical data was reviewed back to the 1880s. • https://www.northinfo.com/Documents/646.pdf• The key findings of this study were that equity
markets declined during periods of conflict but recovered quickly at the cessation of hostilities
Fixed income markets declined very sharply during wars and there was no appreciable
recovery at the cessation of violence.
• War is expensive to wage, industrial capacity and infrastructure are destroyed
• Young, healthy members of the labor force are killed as combatants
• Countries that lose wars don’t pay their debts• A war resilient portfolio would be tilted to most
negative exposure to returns on the global bond market return factor present in many Northfield models.
www.northinfo.com Slide 18
Early Hints on a Pandemic Portfolio
Our early published work on the pandemic was accurate in forecasting that financial markets would recover quickly from the lows in March 2020.
• diBartolomeo, Investments and Wealth Monitor, May 2020.
Since then our sustainability model has presented one very interesting indication in terms of corporate sustainability in the pandemic period.
• Perversely, the expected half life of firms increased markedly. • This effect was concentrated in banks that moved to a seventy-year average half-life
suggesting a default rate of only 1% per annum. • This result arises from the enormous liquidity injected by the US Fed and other central
banks. It’s hard to go broke if you are highly levered with borrowing costs below zero.• See Belev, Emilian and Dan diBartolomeo “Finance Meets Macroeconomics: A Structural
Model of Sovereign Credit Risk”, M. Crouhy, D. Galai ande Z. Weiner Editors, “Contingent Claims Analysis in Corporate Finance”, World Scientific, 2019.
www.northinfo.com Slide 19
Many investors are keen to formulate US equity portfolios that they perceive as “resilient” to multiple sources of large and pervasive risks.
We have presented several different themes of how the concept of resilience to risk can be manifested in typical institutional US equity portfolios.
Such exemplar portfolios are easily formulated using routine optimization techniques depending on the investor’s choice of which stresses to guard against.
• Probability weighted combinations of such resilient equity portfolios can be constructed using the method of Centralized Portfolio Management as described in A Radical Proposal for the Operation of Multi-Manager Investment Funds (northinfo.com) and Northfield News June 2018 (northinfo.com)
Final Comments