building a future for women and children the 2012 report … · building a future for women and...
TRANSCRIPT

Building a Future for Women and Children
The 2012 Reportwww.countdown2015mnch.org
FAMILY CARE I N T E R N A T I O N A L
pantone
322 C
321 U
pantone
382 C
381 U
CMYK (process)
DS 302-3 C
C 25, Y 95
DS 302-5 U
C 20, Y 65
CMYK (process)
DS 249-3 C
C 95, Y 25, K 35
DS 248-2 U
C 100, Y 30, K 30
CounTdo
Wn To
2015 The 2012 Repo
RT Building a Future for W
omen and Children

ISBN: 978-92-806-4644-3
© World Health Organization and UNICEF 2012
All rights reserved. Publications of the World Health Organization are available on the WHO web site (www.who.int) or can be purchased from WHO Press, World Health Organization, 20 Avenue Appia, 1211 Geneva 27, Switzerland (tel.: +41 22 791 3264; fax: +41 22 791 4857; e-mail: [email protected]).
Requests for permission to reproduce or translate WHO publications – whether for sale or for noncommercial distribution – should be addressed to WHO Press through the WHO web site (http://www.who.int/about/licensing/copyright_form/en/index.html).The designations employed and the presentation of the material in this publication do not imply the expression of any opinion whatsoever on the part of the World Health Organization concerning the legal status of any country, territory, city or area or of its authorities, or concerning the delimitation of its frontiers or boundaries. Dot-ted lines on maps represent approximate border lines for which there may not yet be full agreement.
The mention of specific companies or of certain manufacturers’ products does not imply that they are endorsed or recommended by the World Health Organization in preference to others of a similar nature that are not mentioned. Errors and omissions excepted, the names of proprietary products are distinguished by initial capital letters.
All reasonable precautions have been taken by the World Health Organization to verify the information contained in this publication. However, the published material is being distributed without warranty of any kind, either expressed or implied. The responsibility for the interpretation and use of the material lies with the reader. In no event shall the World Health Organization be liable for damages arising from its use.
This publication has been prepared to facilitate the exchange of knowledge and to stimulate discussion. The logos that appear on the back cover represent the institution-al affiliations of individual participants in report preparation and do not imply institutional endorsement of the contents or recommendations or approval of any specific intervention for which data are included. Implementation of specific intervention is dependent on the legal context in each country. While all reasonable precautions have been taken to verify the information contained in this publication, Countdown partners accept no responsibility for errors.
Printed in Washington, DC.
Photo credits: cover, © 2002, Leela Khanal, Courtesy of Photoshare; page 3, © 2012 Cassandra Mickish/CCP, Courtesy of Photoshare; page 4, Joshua Roberts/Save the Children; page 12, © 2009 Joydeep Mukherjee, Courtesy of Photoshare; page 21, © 2007 WHO/Christopher Black; page 22, © 2006 Salma Siddique, Courtesy of Photoshare; page 30, © UNICEF/NYHQ2002-0516/Vitale; page 41, © UNICEF/NYHQ2009-0600/Noorani; page 50, Colin Crowley/Save the Children; page 200, © 2007 Bonnie Gillespie, Courtesy of Photoshare.
Editing and layout by Communications Development Incorporated, Washington, DC.
ContributorsLead writers: Jennifer Requejo (PMNCH/Johns Hopkins University), Jennifer Bryce (Johns Hopkins University), Cesar Victora (University of Pelotas)
Subeditors/writers: Aluisio Barros (University of Pelotas), Peter Berman (Harvard School of Public Health), Zulfiqar Bhutta (Aga Khan University), Ties Boerma (WHO), Bernadette Daelmans (WHO), Adam Deixel (Family Care International), Joy Lawn (Saving Newborn Lives), Elizabeth Mason (WHO), Holly Newby (UNICEF), Ann Starrs (Family Care International)
Profile team: Tessa Wardlaw (UNICEF), Archana Dwivedi (UNICEF), Holly Newby (UNICEF)
Additional writing team: Andres de Francisco (PMNCH), Carole Presern (PMNCH), Mickey Chopra (UNICEF), Blerta Maliqi (WHO), Giorgio Cometto (Global Health Workforce Alliance), Justine Hsu (LSHTM), Matthews Matthai (WHO), Priyanka Saksena (WHO), Sennen Hounton (UNFPA)
Production team: Christopher Trott and Elaine Wilson (Communications Development Incorporated), Jennifer Requejo (PMNCH/Johns Hopkins University), Adam Deixel (Family Care International), Dina El Husseiny (PMNCH)
Countdown Coordinating Committee: Mickey Chopra (co-chair), Zulfiqar Bhutta (co-chair), Jennifer Bryce, Joy Lawn, Carole Presern, Elizabeth
Mason, Ann Starrs, Peter Berman, Bernadette Daelmans, Tessa Wardlaw, Ties Boerma, Cesar Victora, Flavia Bustreo, Andres de Francisco, Jennifer Requejo, Laura Laski, Nancy Terreri, Holly Newby, Archana Dwivedi, Zoe Matthews, Jacqueline Mahon, Lori McDougall
Technical Working Groups
Coverage: Jennifer Bryce (co-chair), Tessa Wardlaw (co-chair), Holly Newby, Archana Dwivedi, Jennifer Requejo, Alison Moran, Shams El Arifeen, Sennen Hounton, Steve Hodgins, Angella Mtimumi, Blerta Maliqi, Lale Say, James Tibenderana, Nancy Terreri
Equity: Cesar Victora (co-chair), Ties Boerma (co-chair), Henrik Axelson, Aluisio Barros, Carine Ronsmans, Wendy Graham, Betty Kirkwood, Edilberto Loaiza, Zulfiqar Bhutta, Kate Kerber,
Financing: Peter Berman (chair), Henrik Axelson, Jacqueline Mahon, Lara Brearley, Justine Hsu, Daniel Kraushaar, Ravi Rannan-Eliya, Anne Mills, Karin Stenberg
Health systems and policies: Bernadette Daelmans (co-chair), Zoe Matthews (co-chair), Blerta Maliqi, Nancy Terreri, Giorgio Cometto, Priyanka Saksena, Sennen Hounton, Amani Siyam, Daniel Kraushaar, Eleonora Cavagnero, Mark Young, Lara Brearley, Amani Siyam

Building a Future for Women and Children
The 2012 Report

Building a Future for Women and Children The 2012 Reportii
AcknowledgementsCountdown would like to thank the following:
UNICEF/Statistics and Monitoring Section for use of global databases, preparation of country profiles and inputs to, and review of, report text. Particular recognition goes to David Brown, Danielle Burke, Xiaodong Cai, Liliana Carvajal, Elizabeth Horn-Phathanothai, Priscilla Idele, Rouslan Karimov, Mengjia Liang, Rolf Luyendijk, Colleen Murray, Khin Wityee Oo, Chiho Suzuki and Danzhen You.
University of Pelotas colleagues Andrea Damaso and Giovanny França for their inputs to the equity analyses.
The PMNCH secretariat for convening meetings and teleconferences for the Countdown and PMNCH colleagues Dina El Husseiny for providing administrative support and Henrik Axelson, Lori McDougall and Shyama Kuruvilla for their contributions to the report.
Amani Siyam from WHO (HQ), Thomas H. H. Walter from the University of Technology Berlin, Fekri Dureab from the WHO Yemen country office
and Carmen Dolea for their inputs to the health systems and health policies analyses.
Steve Hodgins, Cindy Berg, Andre Lalonde, Cherrie Evans, Wendy Graham and Claudia Hanson for their inputs on the quality of care panel. The PMNCH for convening a meeting on quality of care.
Robert E. Black at Johns Hopkins University for his inputs into the nutrition and cause of child death analyses.
Lale Saye and Iqbal Shah from WHO for their inputs to the maternal mortality and causes of maternal death analyses.
Nancy Terreri for her contributions to the report.
Nuriye Ortayli from UNFPA for inputs to the family planning analyses.
The Bill and Melinda Gates Foundation, the World Bank and the Governments of Australia, Canada, Norway, Sweden and the United Kingdom for their support for Countdown to 2015.
Building a Future for Women and Children The 2012 Report iii
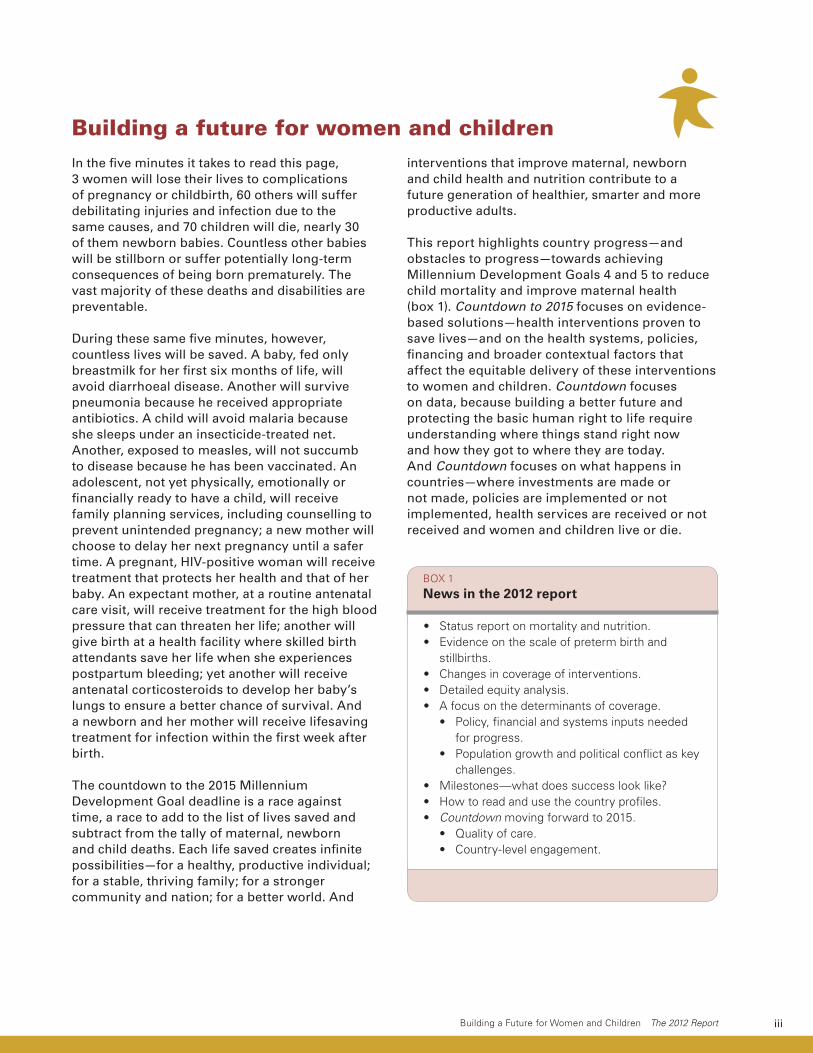
Building a future for women and childrenIn the five minutes it takes to read this page, 3 women will lose their lives to complications of pregnancy or childbirth, 60 others will suffer debilitating injuries and infection due to the same causes, and 70 children will die, nearly 30 of them newborn babies. Countless other babies will be stillborn or suffer potentially long-term consequences of being born prematurely. The vast majority of these deaths and disabilities are preventable.
During these same five minutes, however, countless lives will be saved. A baby, fed only breastmilk for her first six months of life, will avoid diarrhoeal disease. Another will survive pneumonia because he received appropriate antibiotics. A child will avoid malaria because she sleeps under an insecticide-treated net. Another, exposed to measles, will not succumb to disease because he has been vaccinated. An adolescent, not yet physically, emotionally or financially ready to have a child, will receive family planning services, including counselling to prevent unintended pregnancy; a new mother will choose to delay her next pregnancy until a safer time. A pregnant, HIV-positive woman will receive treatment that protects her health and that of her baby. An expectant mother, at a routine antenatal care visit, will receive treatment for the high blood pressure that can threaten her life; another will give birth at a health facility where skilled birth attendants save her life when she experiences postpartum bleeding; yet another will receive antenatal corticosteroids to develop her baby’s lungs to ensure a better chance of survival. And a newborn and her mother will receive lifesaving treatment for infection within the first week after birth.
The countdown to the 2015 Millennium Development Goal deadline is a race against time, a race to add to the list of lives saved and subtract from the tally of maternal, newborn and child deaths. Each life saved creates infinite possibilities—for a healthy, productive individual; for a stable, thriving family; for a stronger community and nation; for a better world. And
interventions that improve maternal, newborn and child health and nutrition contribute to a future generation of healthier, smarter and more productive adults.
This report highlights country progress—and obstacles to progress—towards achieving Millennium Development Goals 4 and 5 to reduce child mortality and improve maternal health (box 1). Countdown to 2015 focuses on evidence-based solutions—health interventions proven to save lives—and on the health systems, policies, financing and broader contextual factors that affect the equitable delivery of these interventions to women and children. Countdown focuses on data, because building a better future and protecting the basic human right to life require understanding where things stand right now and how they got to where they are today. And Countdown focuses on what happens in countries—where investments are made or not made, policies are implemented or not implemented, health services are received or not received and women and children live or die.
Box 1 News in the 2012 report
• Status report on mortality and nutrition.• Evidence on the scale of preterm birth and
stillbirths.• Changes in coverage of interventions.• Detailed equity analysis.• A focus on the determinants of coverage.
• Policy, financial and systems inputs needed for progress.
• Population growth and political conflict as key challenges.
• Milestones—what does success look like?• How to read and use the country profiles.• Countdown moving forward to 2015.
• Quality of care.• Country-level engagement.

ContentsCountdown headlines for 2012: saving the lives of the world’s women, newborns and children 1
Countdown to 2015: tracking progress, fostering accountability 5
The Countdown country profile: a tool for action 10
Progress towards Millennium Development Goals 4 and 5 13
Coverage along the continuum of care 23
Determinants of coverage 32
Milestones of progress on the path to success 42
Accountability now for Millennium Development Goals 4 and 5 48
Country profiles 51
Annex A Country profile indicators and data sources 203
Annex B Definitions of Countdown indicators 206
Annex C Definitions of policy and health systems indicators 208
Annex D Essential interventions for reproductive, maternal, newborn and child health 210
Annex E Countdown priority countries considered to be malaria endemic 211
Annex F Details on estimates from the Inter-agency Group for Child Mortality Estimation used in the Countdown report 212
Notes 213
References 214

Building a Future for Women and Children The 2012 Report 1
Countdown headlines for 2012: saving the lives of the world’s women, newborns and children
Maternal and child survival: progress, but not enough . . .
• Maternalmortalityhasdeclineddramatically,butfasterprogressisneeded.
• Maternaldeathshavedroppedfrom543,000ayearin1990to287,000in2010.
• Only9Countdown countriesareontracktoachieveMillenniumDevelopmentGoal5;25havemadeinsufficientornoprogress.
• MaternalmortalityisconcentratedinSub-SaharanAfricanandSouthAsiancountries:anAfricanwoman’slifetimeriskofdyingfrompregnancy-relatedcausesis100timeshigherthanthatofawomaninadevelopedcountry.
• Childmortalityisdownsharply,butmoreneedstobedone.
• Deathsamongchildrenunderage5worldwidehavedeclinedfrom12millionayearin1990to7.6millionin2010.
• Only23CountdowncountriesareontracktoachieveMillenniumDevelopmentGoal4;13havemadelittleornoprogress.
• Despiterecentimprovements,pneumoniaanddiarrhoeastillcausemorethantwomilliondeathsayearthatcouldbeavoidedbyavailablepreventivemeasuresandprompttreatment.
• Newbornsurvivalisimprovingtooslowly,andstillbirths,especiallyintrapartumstillbirths,andpretermbirthsneedurgentattention.
• 40%ofchilddeathsoccurduringthefirstmonthoflife.
• Morethan10%ofbabiesarebornpreterm,afigurethatisrising,andcomplicationsduetopretermbirtharetheleadingcauseofnewborndeathsandthesecondleadingcauseofchilddeaths.
• Countdowncountriesthathavesuccessfullyreducedneonatalmortality—suchasBangladesh,NepalandRwanda—offermodelsforimprovingnewbornsurvival.
• MostCountdowncountriesfaceaseverenutritioncrisis.
• Undernutritioncontributestomorethanathirdofchilddeathsandtoatleastafifthofmaternaldeaths.
• InthemajorityofCountdowncountries,morethanathirdofchildrenarestunted;stuntingismostcommonamongpoorchildren.
Coverage: gains, gaps, inequities, challenges
• Bangladesh,Cambodia,EthiopiaandRwanda,countriesthathaverapidlyincreasedcoverageformultipleinterventionsacrossthecontinuumofcare,offerlessonsforcountrieswithslowerormoreunevenprogress.
• Highcoveragelevelsforvaccines(over80%onaverageacrossallCountdowncountries)andrapidprogressindistributionofinsecticide-treatednetsshowwhatispossiblewithhighlevelsofpoliticalcommitmentandfinancialresources.
• Progressismuchslower,andinequitiesincoveragemuchwider,forskilledattendantatbirthandotherinterventionsthatrequireastronghealthsystem.Newapproachesareneededthatimprovethequalityofservices,bringservicesclosertohomeandexpandaccesstoessentialcare.

Building a Future for Women and Children The 2012 Report2
• There are wide ranges in coverage across the Countdown countries for many interventions. Coverage of demand for family planning satisfied, for example, ranges from 17% in fragile states such as Sierra Leone to 93% in Vietnam and Brazil and 97% in China. Countries with high coverage of specific interventions show what can be achieved with the right policies, adequate investments, appropriate implementation strategies and strong demand.
• To increase coverage, the volume of services provided must grow at a faster pace than the population. Nigeria, for example, has seen the number of births grow from 4.3 million in 1990 to 6.1 million in 2008, with 7 million projected in 2015. Although the country has doubled the number of births attended by a skilled health care provider since 1990, coverage has increased only 8%.
• The Millennium Development Goal 7 target for access to an improved drinking water source has been achieved globally and in 23 Countdown countries; progress in access to an improved sanitation facility is lagging. For both interventions the need is most pronounced in rural areas.
• Poor people have less access to health services than richer people, and geographic and urban-rural inequities also exist in many countries, highlighting the importance of digging deeper into subnational data to support effective planning and resource allocation according to need.
Context matters: supportive policies, adequate financing, sufficient human resources and peace
• Countries such as Ghana, Malawi, Lao People’s Democratic Republic and Tanzania have achieved results through innovative human resources policies such as task shifting. Other countries need to follow this lead.
• Official development assistance for maternal, newborn and child health in Countdown countries has increased steadily over the past decade, accounting for around 40% of official development assistance for health that Countdown countries received in 2009, but the rate of increase appears to be slowing.
• Though domestic health funding is essential, 40 Countdown countries devote less than 10% of government spending to health.
• In most countries a severe disease episode or a major pregnancy or childbirth complication can push families into financial catastrophe: in all but 5 Countdown countries out-of-pocket payments for health services account for 15% or more of health expenditure.
• 53 Countdown countries continue to experience a severe shortage of health workers.
• Countries with high-intensity conflicts have lower coverage and higher inequity and mortality.
• Providing broader access to education, expanding opportunities for girls and women, reducing poverty and improving living conditions, and respecting human rights, including eliminating violence against women, can improve health and reduce mortality.
Making good on commitments
Countries and their partners have pledged to work together to meet Millennium Development Goals 4 and 5. There is still time. Countdown data show that by transforming commitment into action, rapid progress is possible. To build a better future for women and children, we all must keep our promises. Millions of women’s and children’s lives depend on it.
Countries must continue to:
• Implement costed national health plans that emphasize service integration and include programmes for reproductive, maternal, newborn and child health.
• Strengthen health information systems, including vital registration systems and national health accounts, so that timely, accurate data can inform policies and programmes.
• Increase domestic funding allocations for and expenditures on health.
• Build the numbers, motivation and skill mix of the health workforce.
• Analyse subnational data to identify gaps and inequities and to monitor and evaluate programmes and policies.
• Develop strategies to rapidly address nutrition shortfalls and increase coverage of essential

Building a Future for Women and Children The 2012 Report 3
health interventions across the full continuum of care, especially for the poor.
All stakeholders must continue to:
• Advocate for sufficient funding for reproductive, maternal, newborn and child health.
• Undertake research to develop the evidence on effective interventions and innovative strategies for service delivery.
• Support country efforts to implement innovative strategies that increase access to timely, equitable and high-quality care.
Together we can:
• Demand accountability and act accountably.
• Build a better future for millions of women and children.

Building a Future for Women and Children The 2012 Report 5
Countdown to 2015: tracking progress, fostering accountability
Countdown to 2015 is a global movement to track, stimulate and support country progress towards achieving the health-related Millennium Development Goals, particularly goals 4 (reduce child mortality) and 5 (improve maternal health; box 2). Since 2005 Countdown has produced periodic reports and country profiles on key aspects of reproductive, maternal, newborn and child health, achieving global impact with its focus on accountability and use of available data to hold stakeholders to account for global and national action.
Countdown to 2015:
• Focuses on coverage levels and trends of interventions proven to improve reproductive, maternal, newborn and child health as well as critical determinants of coverage: health systems functionality, health policies and financing.
• Examines equity in coverage across different population groups within and across Countdown countries.
• Uses these data to hold countries and their international partners accountable for progress in reproductive, maternal, newborn and child health (box 3).
• Supports country-level countdowns to promote evidence-based accountability (see concluding section for a description of country-level Countdown activities).
Countdown includes academics, governments, international agencies, professional associations, donors and nongovernmental organizations, with The Lancet as a key partner.
Countdown focuses on countries
Countdown tracks progress in the 75 countries where more than 95% of all maternal and
child deaths occur (map 1) and produces country profiles and reports to be used by all stakeholders—internationally and at the country level—to advocate for action on reproductive, maternal, newborn, and child health.
The number of Countdown countries has increased, reflecting an evolution from a child survival initiative to a movement supportive of the continuum of care and responsive to the global accountability agenda. Countdown countries are selected primarily based on burden of maternal, newborn and child mortality, taking into consideration both numbers and rates of death. Details on the country selection process for this and previous Countdown cycles are available at www.countdown2015mnch.org.
Countdown is more than tracking coverage of interventions!
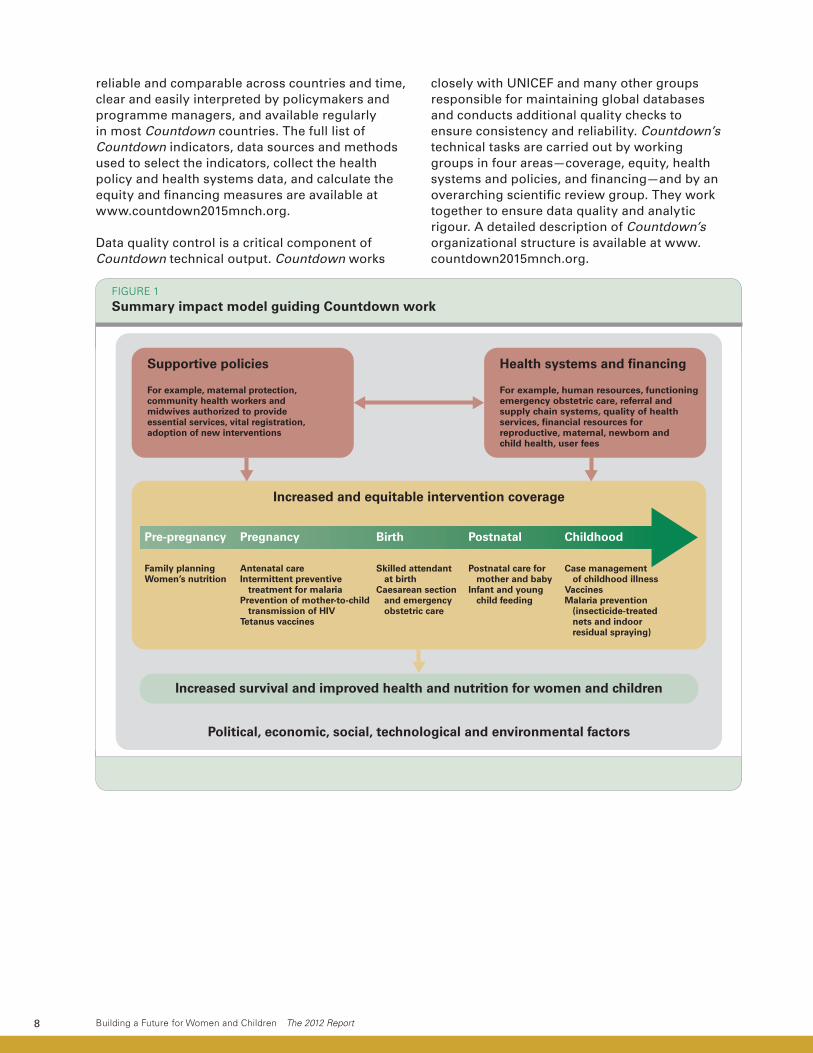
Countdown gathers and synthesizes data on coverage of lifesaving interventions across the continuum of care from pre-pregnancy and childbirth through childhood up to age 5, highlighting progress and missed opportunities. Coverage is defined as the proportion of individuals needing a health service or intervention who actually receive it. Countdown also tracks key determinants of coverage in countries—equity patterns across population groups, health system functionality and capacity, supportive health policies and financial resources for maternal, newborn and child health.
Figure 1 shows the overarching conceptual framework of Countdown, illustrating the links between coverage and its determinants as well as the broader contextual factors that affect maternal, newborn and child survival. Countdown is engaging in cross-cutting research to answer questions from countries and their partners in response to previous Countdown reports and profiles about the ingredients needed for success in achieving high, sustained and equitable

Building a Future for Women and Children The 2012 Report6
Equity in coverage, a central component of the Countdown conceptual framework, is highlighted throughout this report. The Commission on Accountability for Women’s and Children’s Health’s Keeping Promises, Measuring Results,1 emphasizes disaggregating all coverage data by key equity considerations to assess progress. National-level aggregate statistics often hide important within-country inequities that countries must address to achieve the health
intervention coverage. This research aims to expand the evidence base on effective delivery strategies for increasing coverage that take into consideration critical health policy and systems, political, economic, financial, environmental and social factors. Recognizing that effective coverage depends on service quality, Countdown is expanding efforts to examine barriers and facilitating factors to improving the quality of care.
Box 2 Countdown and the accountability agenda
At a September 2010 UN General Assembly summit to assess progress on the Millennium Development Goals, Secretary-General Ban Ki-moon launched the Global Strategy for Women’s and Children’s Health, an unprecedented plan to save the lives of 16 million women and children by 2015.1 This was followed by the establishment of the Commission on Information and Accountability for Women’s and Children’s Health, which was charged with developing an accountability framework to monitor and track commitments made to the Global Strategy. In May 2011 the Commission released Keeping Promises, Measuring Results,2 which drew on advice from Countdown members and other technical experts to identify a set of core indicators3 that enable stakeholders to track progress in improving coverage of interventions across the continuum of care and resources for women’s and children’s health. The report urged that all coverage data be disaggregated by key equity considerations. In September 2011 the UN Secretary-General appointed the independent Expert Review Group to report annually on progress in implementing the Commission’s recommendations on reporting, oversight and accountability in the 75 priority countries.
Countdown to 2015 has contributed significantly to this accountability framework. In November 2011 Countdown collaborated with the Health Metrics Network in developing Monitoring Maternal, Newborn and Child Health: Understanding Key Progress Indicators,4 which summarizes the key opportunities for and challenges to effective monitoring of the core indicators identified by the Commission. In March 2012 Countdown published Accountability for Maternal, Newborn and Child Survival: An Update of Progress in Priority Countries,5 which featured country profiles customized to showcase the commission indicators. That publication was launched at the 126th Assembly of the Inter-Parliamentary Union,
in Kampala, Uganda, where a historic resolution on the role of parliaments in addressing key challenges to securing the health of women and children was unanimously adopted.6 Countdown partners have also collaborated with a wide range of other global health initiatives—including the International Health Partnership,7 the GAVI Alliance8 and the Global Fund to Fight AIDS, Tuberculosis and Malaria, among others—on developing a common, harmonized conceptual framework9 for monitoring and evaluating results.
Countdown is committed to deepening its engagement in the accountability agenda through:• Countdown profiles focused on the Commission
indicators, updated annually with new data and results.
• Special analyses to address accountability questions and inform the independent Expert Review Group.
• Country-level Countdown processes that include national consultations, workshops or publications and use Countdown data and methodological approaches (see concluding section).
Notes1. See www.everywomaneverychild.org for up-to-date information
on commitments to the Global Strategy.
2. Commission on Information and Accountability for Women’s and
Children’s Health 2011.
3. The core Commission indicators for results are a subset of the
Countdown indicators and are included in the country profiles; see
annexes A and B for definitions.
4. Countdown to 2015, Health Metrics Network, UNICEF and WHo
2011.
5. Countdown to 2015 2012.
6. IPU 2012.
7. Boerma and others 2010.
8. GAVI Alliance 2010.
9. Bryce and others 2011.

Building a Future for Women and Children The 2012 Report 7
Millennium Development Goals and universal coverage.
Countdown reviews, analyses and compiles statistics on reproductive, maternal, newborn and child health by child gender, household wealth quintile, maternal education, urban-rural residence and region of the country and produces scientific publications with these results.2 Detailed equity profiles for each country are available at www.countdown2015mnch.org.
Countdown data sources and methods
Building on others’ work, Countdown aims to make data on coverage levels and trends, equity, health policies and systems, and financial resources for maternal, newborn and child health readily accessible. The data for the coverage indicators, publicly available at www.childinfo.org, come mostly from household surveys (box 4). The two main surveys used to collect nationally representative data for reproductive, maternal, newborn and child health in the Countdown countries are U.S. Agency for International Development–supported Demographic and Health Surveys and United Nations Children’s Fund (UNICEF)–supported Multiple Indicator Cluster Surveys. These surveys also provide estimates of coverage by household wealth, urban-rural residence, gender, educational attainment and geographic location.
The Countdown profiles reflect the estimates available for each country. Missing values and data that are more than five years old indicate an urgent need for concerted action to increase data collection efforts so that timely evidence is available for policy and programme development.
The most important criterion for including an intervention or approach in Countdown is internationally accepted (peer-reviewed) evidence demonstrating that it can reduce mortality among mothers, newborns or children under age 5. Countdown coverage indicators must also produce results that are nationally representative,
Box 3 Countdown addresses multiple Millennium Development Goals
• Millennium Development Goal 4 to reduce child mortality.
• Millennium Development Goal 5 to improve maternal health.
• Millennium Development Goal 1 to eradicate extreme poverty and hunger, specifically by addressing nutrition with a focus on infant and young child feeding.
• Millennium Development Goal 6 to combat HIV/AIDS, malaria and other diseases.
• Millennium Development Goal 7 to ensure environmental sustainability, through tracking access to an improved water source and an improved sanitation facility.
• See www.un.org/millenniumgoals/ for more information on the Millennium Development Goals.
MAP 1 The 75 Countdown Priority countries
Building a Future for Women and Children The 2012 Report8
reliable and comparable across countries and time, clear and easily interpreted by policymakers and programme managers, and available regularly in most Countdown countries. The full list of Countdown indicators, data sources and methods used to select the indicators, collect the health policy and health systems data, and calculate the equity and financing measures are available at www.countdown2015mnch.org.
Data quality control is a critical component of Countdown technical output. Countdown works
closely with UNICEF and many other groups responsible for maintaining global databases and conducts additional quality checks to ensure consistency and reliability. Countdown’s technical tasks are carried out by working groups in four areas—coverage, equity, health systems and policies, and financing—and by an overarching scientific review group. They work together to ensure data quality and analytic rigour. A detailed description of Countdown’s organizational structure is available at www.countdown2015mnch.org.
Supportive policies
For example, maternal protection,community health workers andmidwives authorized to provideessential services, vital registration,adoption of new interventions
Health systems and financing
For example, human resources, functioning emergency obstetric care, referral and supply chain systems, quality of health services, financial resources forreproductive, maternal, newborn andchild health, user fees
Increased survival and improved health and nutrition for women and children
Political, economic, social, technological and environmental factors
Increased and equitable intervention coverage
Pre-pregnancy Pregnancy Birth Postnatal Childhood
Family planningWomen’s nutrition
Antenatal careIntermittent preventive
treatment for malariaPrevention of mother-to-child
transmission of HIVTetanus vaccines
Skilled attendantat birth
Caesarean sectionand emergencyobstetric care
Postnatal care formother and baby
Infant and youngchild feeding
Case managementof childhood illness
VaccinesMalaria prevention
(insecticide-treatednets and indoorresidual spraying)
FIGURE 1 Summary impact model guiding Countdown work

Building a Future for Women and Children The 2012 Report 9
Box 4 Sources of country-level Countdown data
National health information systems encompass a broad range of data sources essential for planning and for routine monitoring and evaluation, including censuses, household surveys, health facility reporting systems, health facility assessments, vital registration systems, other administrative data systems and surveillance. Concerted efforts are needed to strengthen health information systems across the 75 Countdown countries to increase the availability of reliable and timely data (see table).1
The preferred source for mortality data is high-quality vital registration with complete reporting of deaths and accurate attribution of cause of death. However, only around a third of Countdown countries have birth registration coverage over 75%, and around 14% have death registration coverage over 50%. Since 2000 only 16% of countries have been able to generate cause of death information from a civil registration system for more than 50% of deaths, well below the level required for producing reliable cause of death information. Mortality data in Countdown countries are also collected through surveys or censuses. More than half of Countdown countries conducted such surveys for child mortality during 2000–06 and 2007–11, but less than a fifth did so for maternal mortality (see table), hampering country ability to assess mortality levels and trends.
Given weak vital registration systems and the lack of other nationally representative sources of mortality data, mortality levels in most Countdown countries are derived from model-based estimates that use data from several sources, including vital registration, household surveys, censuses, and other studies. Country-specific estimates of neonatal and under-five mortality are produced by the United Nations Inter-agency Group for Child Mortality Estimation.2 Country-specific causes of neonatal and child death profiles are from national estimates calculated by the Child Health Epidemiology Reference Group with the World Health organization (WHo). Maternal mortality ratios are from the Maternal Mortality Estimation Inter-agency Group.3 Global and regional cause of maternal death profiles are produced through a WHo systematic review process.
Intervention coverage responds more quickly to programmatic changes than does mortality and should be measured more frequently to promote evidence-based decisionmaking. only 29 Countdown countries
(39%) conducted a household survey during 2009–11, and 21 of them (28%) had also conducted a previous survey during 2006–08. Facility reports can provide estimates for some coverage indicators, but data quality is often a problem in Countdown countries, and these estimates are not nationally representative.
Data availability in Countdown countries
Topic PeriodNumber of countries
Share of Countdown
countries (%)Coverage of civil registrationBirths (more than 75%) 2005–10 23 31
Deaths (more than 50%) 2005–10 10 14
Cause-of-death (more than 50%) 2000–10 12 16
Data collection (at least one in period)
Child mortality2007–11 43 58
And during 2000–06 41 55
Maternal mortality2007–11 12 16
And during 2000–06 8 11
Reproductive, maternal, newborn and child health intervention coverage
2009–11 29 39
And during 2006–08 21 28
Accurate, timely and consistent data are crucial for countries to effectively manage their health systems, allocate resources according to need and ensure accountability for delivering on commitments to women, newborns and children. Enhancing country capacity to monitor and evaluate results is a core Countdown principle and central to the accountability agenda. Achieving this goal requires a long-term approach with short-term milestones. Recommended actions include4:• Developing a harmonized programme of household
health surveys.• Investing in vital registration systems and routine
information systems.• Evaluating information and communication
technologies to improve data collection.• Building country capacity to monitor, review and act
on available data.
Country-level countdown processes can contribute to building this capacity (see concluding section).
Notes1. Health Metrics Network and WHo 2011.
2. UNICEF, WHo, World Bank, UNDESA 2011.
3. UNICEF, WHo, World Bank, UNDESA 2012.
4. Countdown to 2015, Health Metrics Network, UNICEF, WHo 2011.

Building a Future for Women and Children The 2012 Report10
The Countdown country profile: a tool for action
Countdown country profiles present in one place the best and latest evidence to assess country progress in improving reproductive, maternal, newborn and child health (figure 2). The two-page profiles in this report are updated every two years with new data and analyses. Countdown has also committed to annually updating the core indicators selected by the Commission on Information and Accountability for Women’s and Children’s Health.
Reviewing the information
The first step in using the country profiles is to explore the range of data presented: demographics, mortality, coverage of evidence-based interventions, nutritional status and socioeconomic equity in coverage. Key questions in reviewing the data include:
• Are trends in mortality and nutritional status moving in the right direction? Is the country on track to achieve the health Millennium Development Goals?
• How high is coverage for each intervention? Are trends moving in the right direction towards universal coverage? Are there gaps in coverage for specific interventions?
• How equitable is coverage? Are certain interventions particularly inaccessible for the poorest segment of the population?
Identifying areas to accelerate progress
The second step in using the country profiles is to identify opportunities to address coverage gaps and accelerate progress in improving coverage and health outcomes across the continuum of care. Questions to ask include:
• Are the coverage data consistent with the epidemiological situation? For example:
• If pneumonia deaths are high, are policies in place to support community case management of pneumonia? Are coverage levels low for careseeking and antibiotic treatment for pneumonia, and what can be done to reach universal coverage? Are the rates of deaths due to diarrhoea consistent with the coverage levels and trends of improved water sources and sanitation facilities?
• In priority countries for eliminating mother-to-child transmission of HIV, are sufficient resources being targeted to preventing mother-to-child transmission?
• Does lagging progress on reducing maternal mortality or high newborn mortality reflect low coverage of family planning, antenatal care, skilled attendance at birth and postnatal care?
• Do any patterns in the coverage data suggest clear action steps? For example, coverage for interventions involving treatment of an acute need (such as treatment of childhood diseases and childbirth services) is often lower than coverage for interventions delivered routinely through outreach or scheduled in advance (such as vaccinations). This gap suggests that health systems need to be strengthened, for example by training and deploying skilled health workers to increase access to care.
• Do the gaps and inequities in coverage along the continuum of care suggest prioritizing specific interventions and increasing funding for reproductive, maternal, newborn and child health? For example, is universal access to labour, delivery and immediate postnatal care being prioritized in countries with gaps in interventions delivered around the time of birth?

Building a Future for Women and Children The 2012 Report 11
FIGURE 2 Sample country profile
Impact: under-five mortality rateand maternal mortality ratioThese charts display trends overtime, reflecting progress towardsreaching the MillenniumDevelopment Goal 4 and 5 targets.
Key population characteristicsThese indicators provide information for understandingcountry contexts and challengesto scaling up essentialinterventions.
WATER AND SANITATION
CHILD HEALTH
POLICIESDEMOGRAPHICS
MATERNAL AND NEWBORN HEALTH
SYSTEMS AND FINANCING
*Intrapartum-related events **Sepsis/meningi s/tetanus
Percent of children receiving first line treatment among those receiving any an malarial
Percent of children <5 years sleeping under ITNs
4 22 28
0
20
40
60
80
100
2003DHS
2006MICS
2008DHS
Perc
ent
Interna onal Code of Marke ng of Breastmilk Subs tutes
Midwifery personnel authorized to administer core set of life saving interven ons
Specific no fica on of maternal deaths
Postnatal home visits in first week of life
Low osmolarity ORS and zinc for management of diarrhoea
Community treatment of pneumonia with an bio cs
Rotavirus vaccine
Pneumococcal vaccine
Yes
Yes
Yes
Yes
Yes
Yes
Par al
Par al 88 92 92 96
90
0
20
40
60
80
100
1998DHS
2003DHS
2006MICS
2007Other NS
2008DHS
Perc
ent
Antenatal care Percent of women aged 15-49 years a ended at least once by a skilled health provider during pregnancy
Embolism 1%
Haemorrhage 34%
Hypertension 19%
Indirect 17%
Other direct 11%
Unsafe abor on 9%
Sepsis 9%
Causes of maternal deaths, 1997-2007
40 29 45 29 29 39 29 45
0
20
40
60
80
100
1993DHS
1998DHS
2003DHS
2006MICS
2008DHS
Perc
ent
Diarrhoeal disease treatment
Improved drinking water coverage Improved sanit on coverage
Source: WHO/UNICEF JMP 2012
Percent of popula on by type of drinking water source, 1990-2010
Total Urban Rural Source: WHO/UNICEF JMP 2012
Percent of popula on by type of sanita on facility, 1990-2010
Total Urban Rural
10% 3% Preterm 14%
Asphyxia* 11%
Sepsis** 6% Other 2%
Congenital 3%
0% 7%
Measles 1% Meningi s 2%
Injuries 4%
Malaria 18%
HIV/AIDS 3%
Other 18%
Percent of children <5 years with diarrhoea receiving oral rehydra on therapy/increased fluids with con nued feeding
Children <5 years with diarrhoea treated with ORS
32 (2008)
44 (2008)
5 (2008)
- -
68 (2008)
8 (2008)
86 (2010)
Malaria preven on and treatment
Maternity protec on in accordance with Conven on 183
Par al
Per capita total expenditure on health (Int$)
General government expenditure on health as % of total government expenditure (%)
Out-of-pocket expenditure as % of total expenditure on health (%)
Density of doctors, nurses and midwives (per 10,000 popula on)
Official development assistance to child health per child (US$)
Official development assistance to maternal and neonatal health per live birth (US$)
325 (2010)
Na onal availability of emergency obstetric care services (% of recommended minimum)
12 (2010)
27 (2010)
11.4 (2009)
21 (2009)
43 (2009)
(2011) 37
Costed na onal implementa on plan(s) for maternal, newborn and child health available
Yes
Source: WHO/CHERG 2012
Women with low body mass index (<18.5 kg/m2, %)
Postnatal visit for mother (within 2 days for all births, %)
Postnatal visit for baby (within 2 days for all births, %)
Neonatal tetanus vaccine (%)
C-sec on rate (total, urban, rural; %) (Minimum target is 5% and maximum target is 15%)
Malaria during pregnancy - intermi ent preven ve treatment (%)
Demand for family planning sa sfied (%)
16 18
37
68
10
9 37
5
0
20
40
60
80
100
1990 2010
41 33
43 58
7 9 9 0
1990 20102 3
34
77
11
9 53
11
1990 2010
4 8
20
43
47 16
29 33
1990 2010
12 19
44
73
33
2 11 6
1990 2010
7 14
29
58
42
9
22 19
0
20
40
60
80
100
1990 2010
78 (2008) Antenatal care (4 or more visits, %)
Neonatal death: 38%
Globally more than one third of child deaths are
ributable to undernutr on
Source: WHO 2010
Pneumonia
Diarrhoea
Causes of under-five deaths, 2010 Regional es mates for sub-Saharan Africa
11, 7,
50 (2008)
Shared facili es Improved facili es Open defeca on Unimproved
Other improved Piped on premises Unimproved facili es Surface water
Perc
ent
Perc
ent
EQUITY
76
93
* See Annex/website for indicator defini on
Note: Based on 2006 WHO reference popula on
13
CHILD HEALTH
(2008)
(2008)
52
DEMOGRAPHICS
MATERNAL AND NEWBORN HEALTH
NUTRITION(2008)
(2008)
(2010)
9
Socioeconomic ine es in coverage
Total popul on (000)
Total under-five popul on (000)
Births (000)
Birth registra on (%)
Neonatal mortality rate (per 1000 live births)
Lif me risk of maternal death (1 in N)
Total fer lity rate (per woman)
Adolescent birth rate (per 1000 women)
S llbirth rate (per 1000 total births)
4.2
70
22
(2010) 28
(2010) 68
(2010) 24,392 (2010) 3,533 (2010) 770 (2008) 71
(2010) 2,700 Total maternal deaths
122
74
41
0
20
40
60
80
100
120
140
1990 1995 2000 2005 2010 2015
Under-five mortality rate
MDG Target
Source: IGME 2011
580
350
150
0
100
200
300
400
500
600
700
1990 1995 2000 2005 2010 2015
MDG Target
Maternal mortality ra
Source: MMEIG 2012
93
63
68
57
78
32
0 20 40 60 80 100Percent
Coverage along the con nuum of care
Source: DHS, MICS, Other NS
Skilled ndant
*Postnatal care
bre eeding
Measles
40 44 44 47 50
55 57
0.0
20.0
40.0
60.0
80.0
100.0
1988DHS
1993DHS
1998DHS
2003DHS
2006MICS
2007Other NS
2008DHS
Perc
ent
Skilled a endant at delivery Percent live births a ended by skilled health personnel
7
37 28
48
0
20
40
60
2005 2008 2009 2010
Perc
ent
26
44 34 51
16
33 24
0
20
40
60
80
100
1998DHS
2003DHS
2006MICS
2008DHS
Perc
ent
Pneumonia treatment
93
94 94
0
20
40
60
80
100
1990 1995 2000 2005 2010
Perc
ent
Immuniza Percent of children immunized against measles Percent of children immunized with 3 doses DTP Percent of children immunized with 3 doses Hib
23 24 20 19
14 14
39 37 31 36
28 29
0
20
40
60
80
100
1988DHS
1993DHS
1998DHS
2003DHS
2006MICS
2008DHS
Perc
ent
Underweight and stun ng prevalence Percent children <5 years who are underweight Percent children <5 years who are stunted
7
31
53 54 63
0
20
40
60
80
100
1993DHS
1998DHS
2003DHS
2006MICS
2008DHS
Perc
ent
Exclusive breas eeding Percent infants <6 months exclusively bre ed
Source: UNICEF/UNAIDS/WHO
Percent children <5 years with suspected pneumonia taken to appropriate health provider Percent children <5 years with suspected pneumonia receiving an bio cs
Coverage levels are shown for the poorest 20% (red circles) and the richest 20% (orange circles). The longer the line between the two groups, the greater the inequality. These es mates may differ from other charts due to differences in data sources.
Household wealth quin le: Poorest 20% Richest 20%
DHS 2008
Measles
DTP3
Careseeking for pneumonia
feeding ORT & con nued
Demand for family planning sfied
Antenatal care 4+ visits
Skilled birth ndant
bre eeding Early ini on of
ITN use among children <5 yrs
Vitamin A (past 6 months)
Demand for family planning sfied
Antenatal care (4+ visits)
at delivery
Exclusive
Introdu on of solid, semi-solid/so foods (%)
Early ini on of bre eeding (within 1 hr of birth, %)
Vitamin A supplemen on (two dose coverage, %)
ng prevalence (moderate and severe, %)
Low birthweight incidence (moderate and severe, %)
Source: WHO/UNICEF
Neonatal deaths: % of all under-5 deaths (2010) 38
Infant mortality rate (per 1000 live births) (2010) 50
Deaths per 1,000 live births Deaths per 100,000 live births
Note: MDG target calculated by Countdown to 2015
Percent HIV+ pregnant women receiving ARVs for PMTCT
Uncertainty range around the e mate
Antenatal care 1+ visit
Total under-five deaths (000) (2010) 57
www.countdown2015mnch.org
(2009)
(2010)
(2006)
Pre-pregnancy
Pregnancy
Birth
Neonatal period
Infancy
Eligible HIV+ pregnant women receiving ART for their own health (%, of total ARVs)
0 (2010)
Preven on of mother-to-child
transmission of HIV
0 10 20 30 40 50 60 70 80 90 100Percent
Building a Future for Women and Children The 2012 Report Building a Future for Women and Children The 2012 Report
Ghana Ghana
Cause of deathProvides information usefulfor interpreting the coveragemeasures and identifyingprogrammatic priorities.
Intervention coverageThese charts show most recent coveragelevels and trends for selected reproductive,maternal, newborn and child health interventions.
Continuum of careGaps in coverage along the continuum of care frompre-pregnancy and childbirth through childhood upto age 5 should serve as a call to action for a countryto prioritize these interventions.
PoliciesThese indicators show progressin country adoption of supportivepolicies for the introduction andimplementation of essentialinterventions.
Health systems and financingThese indicators provideinformation about health systemcapacity and available financingneeded for scaling upinterventions.
Water and sanitationWater and sanitation fromimproved sources are essentialfor reducing transmission ofinfectious disease.
NutritionUndernutrition contributes to at least athird of all deaths among children underage 5 globally.
Equity in coverageSocioeconomic inequitiesin coverage highlight theneed for concerted effortsto improve coverageamong the poorest.

Building a Future for Women and Children The 2012 Report12

Building a Future for Women and Children The 2012 Report 13
Progress towards Millennium Development Goals 4 and 5
Improving maternal, newborn and child survival across Countdown countries depends on each country’s ability to reach women, newborns and children with effective interventions along the continuum of care. Reproductive, maternal, newborn and child health is inextricably interconnected: improving maternal health and nutrition will reduce newborn and young child deaths. In turn, reducing stunting, improving child health and lowering adolescent and total fertility rates will reduce the risk of a maternal death among the next generation of women.
Under-five mortality is declining! A huge reduction in global deaths among children under age 5 has been achieved, from more than 12 million in 1990 to 7.6 million in 2010, the latest year for which estimates are available.3 Countdown countries account for over 95% of these deaths. The decline has accelerated in the past decade—from 1.9% a year in the 1990s to 2.5% a year over 2000–10—showing that focused goals and attention make a difference. Despite the remarkable progress, much work remains. The majority of the 7.6 million unacceptable child deaths that occur each year could be prevented using effective and affordable interventions. Mortality is not being reduced uniformly, and reductions in neonatal mortality lag behind survival gains among older children. As a result, the share of neonatal deaths in all deaths among children under age 5 has increased from 36% to 40% over the past decade.4 Faster reductions in neonatal mortality are critical for achieving Millennium Development Goal 4. Lessons can be taken from Bangladesh, Nepal and Rwanda, Countdown countries that have reduced their neonatal mortality rate by more than 30% in the last decade.
Modelled estimates of maternal mortality for 2010 based on socioeconomic determinants5 show a substantial decline in maternal deaths over the last two decades. The number of women who die during pregnancy or childbirth has decreased
nearly 50% globally since 1990—from 543,000 deaths to around 287,000 in 2010.6 The majority of maternal deaths are concentrated in Countdown countries in Sub-Saharan Africa and South Asia, an indication of global disparities in women’s access to needed obstetrical care and other services, including family planning and quality antenatal and postnatal care. Data on a woman’s lifetime risk of a maternal death accentuate these disparities—for example, a woman in Chad has a 1 in 15 chance of dying from a maternal cause during her life time and a woman from Afghanistan has a 1 in 32 chance, compared with 1 in 3,800 for a woman in a developed country.
The maternal mortality ratio and lifetime risk of a maternal death are important measures of health system functionality. For every woman who dies due to a pregnancy or childbirth complication, approximately 20 others suffer injuries, infection and disabilities. The millions of women experiencing adverse pregnancy outcomes are a critical marker of the world’s commitment to improving maternal health and achieving Millennium Development Goal 5.
Table 1 shows country specific progress towards Millennium Development Goals 4 and 5, including estimated under-five mortality rates and maternal mortality ratios for 1990, 2000 and 2010; the average annual rate of reduction for 1990–2010 for the two measures; and a summary assessment of progress. Criteria for judging which countries are on track to achieve Millennium Development Goal 4 were developed by the Inter-agency Reference Group on Child Mortality Estimation and include three categories (on track, insufficient progress and no progress); criteria for judging which countries are on track to achieve Millennium Development Goal 5 were developed by the Maternal Mortality Estimation Inter-agency Group and include four categories (on track, making progress, insufficient progress and no progress). See the footnote to table 1 for more details on these criteria.

Building a Future for Women and Children The 2012 Report14
(continued)
Countries and territories
Under-five mortality rate Maternal mortality ratio, modelled
Deaths per 1,000 live births
Average annual rate of reduction (%) Assessment
of progressa
Deaths per 100,000 live births
Average annual rate of reduction (%) Assessment
of progressb1990 2000 2010 1990–2010 1990 2000 2010 1990–2010
Afghanistan 209 151 149 1.7 Insufficient progress 1,300 1,000 460 5.1 Making progress
Angola 243 200 161 2.1 Insufficient progress 1,200 890 450 4.7 Making progress
Azerbaijan 93 67 46 3.5 Insufficient progress 56 65 43 1.3 Insufficient progress
Bangladesh 143 86 48 5.5 On track 800 400 240 5.9 On track
Benin 178 143 115 2.2 Insufficient progress 770 530 350 3.9 Making progress
Bolivia (Plurinational State of) 121 82 54 4.0 On track 450 280 190 4.1 Making progress
Botswana 59 96 48 1.0 Insufficient progress 140 350 160 –0.7 No progress
Brazil 59 36 19 5.7 On track 120 81 56 3.5 Making progress
Burkina Faso 205 191 176 0.8 No progress 700 450 300 4.1 Making progress
Burundi 183 164 142 1.3 Insufficient progress 1,100 1,000 800 1.5 Insufficient progress
Cambodia 121 103 51 4.3 On track 830 510 250 5.8 On track
Cameroon 137 148 136 0.0 No progress 670 730 690 –0.2 No progress
Central African Republic 165 176 159 0.2 No progress 930 1,000 890 0.2 Insufficient progress
Chad 207 190 173 0.9 No progress 920 1,100 1,100 –0.7 No progress
China 48 33 18 4.9 On track 120 61 37 5.9 On track
Comoros 125 104 86 1.9 Insufficient progress 440 340 280 2.2 Making progress
Congo 116 104 93 1.1 Insufficient progress 420 540 560 –1.5 No progress
Congo, Democratic Republic 181 181 170 0.3 No progress 930 770 540 2.7 Making progress
Côte d’Ivoire 151 148 123 1.0 Insufficient progress 710 590 400 2.8 Making progress
Djibouti 123 106 91 1.5 Insufficient progress 290 290 200 1.9 Insufficient progress
Egypt 94 47 22 7.3 On track 230 100 66 6.0 On track
Equatorial Guinea 190 152 121 2.3 Insufficient progress 1,200 450 240 7.9 On track
Eritrea 141 93 61 4.2 On track 880 390 240 6.3 On track
Ethiopia 184 141 106 2.8 Insufficient progress 950 700 350 4.9 Making progress
Gabon 93 88 74 1.1 Insufficient progress 270 270 230 0.8 Insufficient progress
Gambia 165 128 98 2.6 Insufficient progress 700 520 360 3.4 Making progress
Ghana 122 99 74 2.5 Insufficient progress 580 550 350 2.6 Making progress
Guatemala 78 49 32 4.5 On track 160 130 120 1.5 Insufficient progress
Guinea 229 175 130 2.8 Insufficient progress 1,200 970 610 3.4 Making progress
Guinea-Bissau 210 177 150 1.7 Insufficient progress 1,100 970 790 1.7 Insufficient progress
Haiti 151 109 165 –0.4 No progress 620 460 350 2.7 Making progress
India 115 86 63 3.0 Insufficient progress 600 390 200 5.2 Making progress
Indonesia 85 54 35 4.4 On track 600 340 220 4.9 Making progress
Iraq 46 43 39 0.8 On track 89 78 63 1.7 Insufficient progress
Kenya 99 111 85 0.8 No progress 400 490 360 0.5 Insufficient progress
Korea, Democratic People’s Republic 45 58 33 1.6 On track 97 120 81 0.9 Insufficient progress
Kyrgyzstan 72 52 38 3.2 On track 73 82 71 0.2 Insufficient progress
Lao People’s Democratic Republic 145 88 54 4.9 On track 1,600 870 470 5.9 On track
Lesotho 89 127 85 0.2 No progress 520 690 620 –0.9 No progress
Liberia 227 169 103 4.0 On track 1,200 1,300 770 2.4 Making progress
Madagascar 159 102 62 4.7 On track 640 400 240 4.7 Making progress
Malawi 222 167 92 4.4 On track 1,100 840 460 4.4 Making progress
Mali 255 213 178 1.8 Insufficient progress 1,100 740 540 3.5 Making progress
Mauritania 124 116 111 0.6 No progress 760 630 510 2.0 Making progress
Mexico 49 29 17 5.3 On track 92 82 50 3.0 Making progress
Morocco 86 55 36 4.4 On track 300 170 100 5.1 Making progress
Mozambique 219 177 135 2.4 Insufficient progress 910 710 490 3.1 Making progress
Myanmar 112 87 66 2.6 Insufficient progress 520 300 200 4.8 Making progress
Nepal 141 84 50 5.2 On track 770 360 170 7.3 On track
Table 1 Country progress towards Millennium Development Goals 4 and 5

Building a Future for Women and Children The 2012 Report 15
Of74Countdowncountrieswithavailabledata,23areontracktoachieveMillenniumDevelopmentGoal4(figure3).Bangladesh,Brazil,EgyptandPerureducedtheunder-fivemortalityrate66%ormore,andChina,LaoPeople’sDemocraticRepublic,Madagascar,MexicoandNepalreducedit60%–65%.Butmuchremainstobedone:13countriesmadenoprogress,and38madeinsufficientprogress.Countriesandtheirdevelopmentpartnersmust
continueprioritizingchildsurvivaleffortstomaintainforwardmomentumbeyond2015andtopreventreversals.
Only9of74CountdowncountrieswithavailabledataareontracktoachieveMillenniumDevelopmentGoal5(figure4).Eightofthem(Bangladesh,Cambodia,China,Egypt,Eritrea,LaoPeople’sDemocraticRepublic,NepalandVietnam)arealsoontracktoachieveMillennium
Source: Under-five mortality, UNICEF, WHO, World Bank and UNDESA 2011; maternal mortality, WHO, UNICEF, UNFPA and World Bank 2012.
Countries and territories
Under-five mortality rate Maternal mortality ratio, modelled
Deaths per 1,000 live births
Average annual rate of reduction (%) Assessment
of progressa
Deaths per 100,000 live births
Average annual rate of reduction (%) Assessment
of progressb1990 2000 2010 1990–2010 1990 2000 2010 1990–2010
Niger 311 218 143 3.9 Insufficient progress 1,200 870 590 3.6 Making progress
Nigeria 213 186 143 2.0 Insufficient progress 1,100 970 630 2.6 Making progress
Pakistan 124 101 87 1.8 Insufficient progress 490 380 260 3.0 Making progress
Papua New Guinea 90 74 61 1.9 Insufficient progress 390 310 230 2.6 Making progress
Peru 78 41 19 7.1 On track 200 120 67 5.2 Making progress
Philippines 59 40 29 3.6 On track 170 120 99 2.8 Making progress
Rwanda 163 177 91 2.9 Insufficient progress 910 840 340 4.9 Making progress
São Tomé and Príncipe 94 87 80 0.8 No progress 150 110 70 3.8 Making progress
Senegal 139 119 75 3.1 Insufficient progress 670 500 370 3.0 Making progress
Sierra Leone 276 233 174 2.3 Insufficient progress 1,300 1,300 890 1.8 Insufficient progress
Solomon Islands 45 35 27 2.6 On track 150 120 93 2.2 Making progress
Somalia 180 180 180 0.0 No progress 890 1,000 1,000 –0.7 No progress
South Africa 60 78 57 0.3 No progress 250 330 300 –0.9 No progress
Sudanc 125 114 103 1.0 Insufficient progress 1,000 870 730 1.6 Insufficient progress
Swaziland 96 114 78 1.0 Insufficient progress 300 360 320 –0.3 No progress
Tajikistan 116 93 63 3.1 Insufficient progress 94 120 65 1.8 Insufficient progress
Tanzania, United Republic of 155 130 76 3.6 Insufficient progress 870 730 460 3.2 Making progress
Togo 147 124 103 1.8 Insufficient progress 620 440 300 3.5 Making progress
Turkmenistan 98 74 56 2.8 Insufficient progress 82 91 67 1.0 Insufficient progress
Uganda 175 144 99 2.8 Insufficient progress 600 530 310 3.2 Making progress
Uzbekistan 77 63 52 2.0 Insufficient progress 59 33 28 3.7 Making progress
Viet Nam 51 35 23 4.0 On track 240 100 59 6.9 On track
Yemen 128 100 77 2.5 Insufficient progress 610 380 200 5.3 Making progress
Zambia 183 157 111 2.5 Insufficient progress 470 540 440 0.4 Insufficient progress
Zimbabwe 78 115 80 –0.1 No progress 450 640 570 –1.2 No progress
a. “On track” indicates that the under-five mortality rate for 2010 is less than 40 deaths per 1,000 live births or that it is 40 or more with an average annual rate
of reduction of 4% or higher for 1990–2010; “insufficient progress” indicates that the under-five mortality rate for 2010 is 40 deaths per 1,000 live births or
more with an average annual rate of reduction of 1%–3.9% for 1990–2010; “no progress” indicates that the under-five mortality rate for 2010 is 40 deaths per
1,000 live births or more with an average annual rate of reduction of less than 1% for 1990–2010.
b. “On track” indicates that the average annual rate of reduction of the maternal mortality ratio for 1990–2010 is 5.5% or more; “making progress” indicates
that the average annual rate of reduction of the maternal mortality ratio for 1990–2010 is between 2% and 5.5%; “insufficient progress” indicates that the
average annual rate of reduction of the maternal mortality ratio for 1990–2010 is less than 2%; “no progress” indicates that the average annual rate of reduction
of the maternal mortality ratio for 1990–2010 is negative—that is, that the maternal mortality ratio has increased. Countries with a maternal mortality ratio
below 100 deaths per 100,000 live births in 1990 are not categorized by the Maternal Mortality Estimation Inter-agency Group. Countdown to 2015 calculated
the assessment of progress for Countdown countries that fall into this group.
c. Data refer to Sudan as it was constituted in 2010, before South Sudan seceded. Data for South Sudan and Sudan as separate states are not available.
TABlE 1 (CONTINUED) Country progress towards Millennium Development Goals 4 and 5

Building a Future for Women and Children The 2012 Report16
DevelopmentGoal4.Onlythreecountries(EquatorialGuinea,NepalandVietnam)reducedthemodelledmaternalmortalityratio75%ormorefrom1990to2010,thoughCambodia,Bangladesh,Egypt,EritreaandLaoPeople’sDemocraticRepubliccameclose,reducingit70%–74%.
Causes of child deaths
Newanalysesfor2010showthat64%ofchilddeathsareattributabletoinfectiousdiseasesinnewbornsandchildren,and40%occurduringtheneonatalperiod(figure5).Undernutritioncontributestooverathirdofchilddeaths.7Theleadingcausesofneonataldeathsarecomplicationsofpretermbirth(box 5),intrapartum-relatedevents,andsepsisandmeningitis;theleadingcausesofdeathamongolderchildrenremainpneumonia,diarrhoea(box6)andmalaria(31%).
Causes of maternal deaths
Haemorrhageandhypertensiontogetheraccountformorethanhalfofmaternaldeaths—deathsofwomenwhilepregnantorwithin42daysofterminationofpregnancy,regardlessofthesiteordurationofpregnancy,fromanycauserelatedtooraggravatedbythepregnancyoritsmanagement—andsepsisandunsafeabortion(box7)combinedaccountfor17%(figure6).Indirectcauses,includingdeathsduetoconditionssuchasmalaria,HIV/AIDSandcardiacdiseases,accountforabout20%.IndirectmaternaldeathsattributabletoAIDSin15CountdowncountrieswithHIVprevalenceabove5%rangesfrom8%to67%,withamedianof27%.8ThecategoriesofmaternaldeathsarebasedonaWHOclassificationsystemthatconsidersobstructedlabourandanaemiatobecontributingconditionsratherthandirectcauses.Deathsrelatedtothesetwoconditionsareclassifiedunderhaemorrhageorsepsis.Clearprogrammaticactionslinkedtoobstructedlabour
FIGUrE 3 Progress towards Millennium Development Goal 4 in Countdown countries
Source: Countdown to 2015 analysis based on UNICEF, WHO, World
Bank and UNDESA 2011.
0
10
20
30
40
Overall progress as of 2010
Number of Countdown countries
On track Insufficientprogress
No progress
FIGUrE 4 Progress towards Millennium Development Goal 5 in Countdown countries
Source: Countdown to 2015 analysis based on WHO, UNICEF, UNFPA
and World Bank 2012.
0
10
20
30
40
Overall progress as of 2010
Number of Countdown countries
On track Makingprogress
Insufficientprogress
No progress
9
40
16
9
FIGUrE 5 Roughly 40% of child deaths occur during the neonatal period
Source: liu and others forthcoming.
Global causes of death among children ages 0–59 months, 2010
Diarrhoea10%
Measles 1%
Diarrhoea, neonatal 1%
Tetanus 1%
Pneumonia 14%Preterm birthcomplications 14%
Intrapartum-related events9%
Othernon-neonatal
18%
Malaria 7%
Sepsis andmeningitis 5%
Congenitalabnormalities 4%
Injury 5%
AIDS 2%Meningitis 2%
Other neonatal 2%
Pneumonia, neonatal 4%
Neonatal40%
Neonatal40%

Building a Future for Women and Children The 2012 Report 17
(continued)
Preterm births and stillbirths have been overlooked on the global health agenda. Countdown is reporting preterm birth estimates and stillbirth rates for the first time to raise their visibility and promote their prioritization for action. Many of the interventions for preventing preterm births and stillbirths are effective in improving other maternal and newborn health outcomes.
15 million preterm births a year
Preterm birth complications are the leading cause of newborn deaths and the second-leading cause of deaths in children under age 5. More than 1.1 million children a year die due to complications of being born too soon,1 and many others experience a lifetime of disability.2 Approximately 80% of preterm births occur between 32 and 37 weeks of gestations, and most of these babies survive when they receive essential newborn care; 75% of deaths of preterm babies can be prevented without intensive care.
According to the first national estimates of preterm birth (before 37 completed weeks of pregnancy), approximately 14.9 million babies a year—more than 1 in 10—are born too soon. of the 65 countries in the world with reliable trend data, only 3 have shown substantial reductions over 1990–2010. About 84% of all preterm births occur in Countdown countries. The preterm birth rate in Countdown countries ranges from 7% in Papua New Guinea and Iraq to 18% in Malawi, with a median of 12%.
There is a stark survival and care gap for premature babies between low- and high-income countries. Yet many preterm babies can be saved through feasible, low-cost interventions such as breastfeeding support, thermal care and basic care for infections and breathing difficulties. An analysis using the lives Saved Tool found that universal coverage of kangaroo mother care could prevent 450,000 deaths a year alone.3 Nurses, midwives and community-based workers providing postnatal care need training in kangaroo mother care, breastfeeding support and other preterm baby care skills as well as access to reliable supplies of key commodities and equipment. Effective care before, during and between pregnancies and childbirth is also important for preventing preterm births and improving the survival chances of preterm babies. Antenatal corticosteroid injections, a priority
medicine of the United Nations Commission on life-Saving Commodities for Women and Children, delivered to women in preterm labour, reduce the risk of death and respiratory distress in preterm babies. Coverage of antenatal corticosteroids is low in the few Countdown countries with estimates. Scaling up to universal coverage across Countdown countries could save an estimated 400,000 preterm babies a year.
Investment in research is essential for better understanding the causes of preterm birth in order to develop preventive interventions for universal application. Research to improve implementation of proven interventions in low-resource settings and on low-cost technological solutions to address complications of prematurity is needed.
The May 2012 Born Too Soon: The Global Action Report on Preterm Births3—supported by Countdown and around 50 organizations—sets a new goal of halving deaths due to preterm birth by 2025.
Almost 3 million stillbirths a year
An estimated 2.7 million third-trimester stillbirths occur every year, a drop of 1.1% a year over 1995-2009. Countdown countries accounted for 93% of stillbirths in the 193 countries with data for 2009, with rates ranging from 5 per 1,000 total births in Mexico to 47 in Pakistan and a median of 23.
Worldwide, approximately 1.2 million stillbirths occur during labour; these are known as intrapartum stillbirths. The risk of intrapartum stillbirth is 24 times higher for an African woman than for a woman in a high-income country. Yet these deaths are largely preventable. The most important strategy to reduce stillbirths is improved care at birth, which also saves maternal and newborn lives, giving a triple return on investments in training skilled birth attendants and increasing the number of functional basic and comprehensive emergency obstetric care facilities.4
other interventions proven to reduce stillbirths are family planning, supportive policies protecting women from harmful working conditions and exposure to environmental toxins (such as indoor air pollution from cookstoves and tobacco smoke) and quality antenatal care services (such as early recognition and treatment of intrauterine growth restriction; protection from malaria
Box 5 Preterm births and stillbirths: making them count

Building a Future for Women and Children The 2012 Report18
through insecticide-treated net use and delivery of intermittent preventive treatment for pregnant women; and identification and treatment of hypertension, diabetes and sexually transmitted diseases, particularly syphilis). Stillbirths can also be reduced by inducing post-term pregnancies (at 41 weeks and later) and by conducting newborn resuscitation. Scaling up of effective care, especially quality childbirth services, could halve stillbirth rates by 2020.5
Notes1. liu and others forthcoming.
2. Blencowe and others forthcoming.
3. March of Dimes, PMNCH, Save the Children and WHo 2012.
4. lawn and others 2011; Bhutta and others 2011.
5. Pattinson and others 2011.
Box 5 (CoNTINUED) Preterm births and stillbirths: making them count
Source: UNICEF forthcoming.
According to UNICEF’s (forthcoming) Pneumonia and Diarrhoea: Tackling the Deadliest Diseases for the World’s Poorest Children, fewer children under age 5 are dying due to pneumonia and diarrhoea than a decade ago. However, these two diseases combined still account for close to 2 million deaths a year. of the 7.6 million deaths among children under age 5 in 2010 (including neonatal deaths), 18% were due to pneumonia and 11% to diarrhoea (see figure 5 in the main text). Approximately 90% of these deaths were in Sub-Saharan Africa and South Asia, and the five countries with the most deaths are all Countdown countries: India, Pakistan, Nigeria, Democratic Republic of the Congo and Ethiopia.
Preventive interventions, some of which reduce the incidence of both diseases, include optimal breastfeeding practices and adequate nutrition, immunizations, hand washing with soap and access to improved water and sanitation facilities. lifesaving treatment options after a child gets sick include antibiotics for bacterial pneumonia and oral rehydration salts and zinc for diarrhoea. However, coverage of these interventions remains low, particularly among the most vulnerable.
In Countdown countries the median coverage of exclusive breastfeeding (for the first six months of life), antibiotic use for pneumonia and oral
rehydration therapy with continued feeding are all less than 50% (see figure 9 in the main text). only 39 Countdown countries have policies for community case management of pneumonia that could expand treatment access to the underserved (see figure 15 in the main report). Although the number of countries adopting policies on low-osmolarity oral rehydration salts and zinc for managing diarrhoea is increasing, zinc treatment remains unavailable in nearly a third of Countdown countries. Median coverage of access to an improved water source is 76% in Countdown countries, but access to an improved sanitation facility hovers at an unacceptable 40%. Most Countdown countries report high coverage of measles and Haemophilus influenzae type b vaccines, but only 9 are implementing policies for rotavirus vaccine and 16 for pneumococcal conjugate vaccines. Expanding vaccine uptake is essential to realize the full potential of these interventions in reducing deaths due to pneumonia and diarrhoea, particularly as vaccines against rotavirus and pneumococcus are being introduced in more countries.
A global action plan for pneumonia has been in place since 2009. A consortium of partners including academic universities, UN agencies and the Clinton Health Access Initiative is developing an integrated global action plan for diarrhoea and pneumonia to scale up proven interventions and increase commitment to addressing these two leading killers of children.
Box 6 Pneumonia and diarrhoea: neglected killers

Building a Future for Women and Children The 2012 Report 19
(continued)
Worldwide approximately 22 million unsafe abortions, half of all induced abortions, occur each year, resulting in the deaths of 47,000 women and temporary or permanent disability among an additional 5 million women. Almost all these deaths and disabilities occur in developing countries.1 An abortion is defined as unsafe when performed by an individual who lacks the necessary skills or in an environment that does not meet minimal medical standards. Deaths due to unsafe abortion result mainly from severe infections, bleeding and organ damage caused by the procedure. Preventing unsafe abortions would contribute substantially towards achieving Millennium Development Goal 5.
Countdown countries represent a wide spectrum of public health consequences of unsafe abortion, ranging from little or none in some countries (Central and Southeast Asian countries and those in Far East Asia) to about 1 in 5 maternal deaths due to unsafe abortion in Countdown countries in East Africa (see map). In general, maternal deaths due to unsafe abortions are high in Countdown countries with high overall maternal mortality.
Globally the abortion rate fell between 1995 and 2003 from 35 per 1,000 women of reproductive age (ages 15–44) to 29 but has since stagnated at 28 in 2008. over 2003-2008 the total number of abortions rose, reflecting increased global population. The proportion of abortions that were unsafe increased from 44% in 1995 to 49% in 2008.2
More than 80% of unintended pregnancies in developing countries occur to women who have an unmet need for modern contraception. Given the extent of unintended pregnancy and the high levels of unsafe abortion around the world, continuing efforts to provide family planning services (see box 9), education and information to prevent unsafe abortions are essential public health interventions.3 Effective, high-quality family planning services are characterized by a variety of affordable commodities, complete information for women about potential benefits and side effects and attention to social and cultural factors to expand women’s access to contraception.4 WHo estimates that 75% of unsafe abortions could be avoided if the need for family planning were fully met.5
Unsafe abortions are concentrated in Latin America and the Caribbean and Central Africa
Unsafe abortionsper 1,000 womenages 15–44
30 or more
20–29
10–19
1–9
None or negligible
Source: WHo 2008.
Box 7 Unsafe abortion: a preventable cause of maternal deaths

Building a Future for Women and Children The 2012 Report20
and anaemia include increasing women’s access to comprehensive emergency obstetric care and nutrition interventions, respectively.
Undernutrition: grave crisis—a call for action
Undernutrition contributes to over a third of child deaths globally.9 The result of inadequate energy or micronutrient intake and often rooted in poverty, undernutrition increases the risk of death and ill-health for both mother and baby during
pregnancy, childbirth and the postnatal period through early childhood. Stunting prevalence is a critical indicator of progress in child survival, reflecting long-term exposure to poor health and nutrition, especially in the first two years of life.10 Children under age 5 around the world have the same growth potential, and stunting prevalence above 3% indicates the need for remedial actions.
a. Includes deaths due to obstructed labour or anaemia.
b. Nearly all (99%) of abortion deaths are due to unsafe abortion.
Source: Preliminary data from the World Health organization.
Global estimates of the causes of maternal deaths, 1997–2007
Haemorrhagea
35%
Hypertension18%
Sepsisa
8%Unsafe
abortionb
9%
Embolism 1%
Other direct11%
Indirect18%
FIGURE 6 Haemorrhage and hypertension account for more than half of maternal deaths
As stated by the Inter-Agency Group for Safe Motherhood, “Unsafe abortion is the most neglected—and most preventable—cause of maternal death. These deaths can be significantly reduced by ensuring that [maternal health] programmes include client-centered family planning services to prevent unwanted pregnancy, contraceptive counseling for women who have had an induced abortion, the use of appropriate technologies for women who experience abortion complications, and, where not against the law, safe services for pregnancy termination.”6
Where unsafe abortions occur, comprehensive post-abortion care for women is important to address complications and ensure access to contraception.
Skilled health workers, appropriate pain control management, follow-up care including identification and treatment of bleeding or infection, removing health worker stigma for caring for women after an abortion, and increasing and improving family planning counselling and services are all necessary components.7
Notes1. World Health organization 2011.
2. Sedgh and others 2012.
3. WHo 2005.
4. WHo 2009.
5. WHo 2011.
6. Inter-Agency Group for Safe Motherhood 1998.
7. Singh and others 2009.
Box 7 (CoNTINUED) Unsafe abortion: a preventable cause of maternal deaths
FIGURE 7 Two-thirds of Countdown countries have stunting prevalence of 30% or more
Source: UNICEF global databases, April 2012, based on Demographic
and Health Surveys, Multiple Indicator Cluster Surveys and other
household surveys
0
5
10
15
20
25
50%or more
40%–49%
30%–39%
20%–29%
5%–19%
Lessthan 5%
Number of Countdown countries (n = 63)
Prevalence of stunting, 2006–2010

Building a Future for Women and Children The 2012 Report 21
All 63 Countdown countries with available data since 2006 have stunting prevalence above this threshold (figure 7). In the majority of these countries more than a third of children are stunted, a situation requiring urgent attention, and prevalence is particularly high among the poorest populations (figure 8). In a fifth of these countries more than half of children in the poorest 20% of households are stunted. Multisectoral programmes
that emphasize reaching the poor must continue to be a major priority in Countdown countries.
Wasting, or low weight for height, in children under age 5, is the most reliable indicator of acute food insecurity and signals an urgent need for action. The short-term mortality risk is much higher for a wasted child than for a stunted child. In 62 Countdown countries with available data since 2006 the prevalence of wasting ranges from 0.8% in Swaziland to 21% in the last survey in pre-secession Sudan, with a median of 7%. Niger (16%), Chad (16%), Bangladesh (18%) and India (20%) also have high prevalence of wasting. The median prevalence is 10% in the nine Countdown countries in the Sahel region prone to severe drought and famine.
Maternal undernutrition is a risk factor for poor maternal, newborn and child health outcomes, and interventions to improve women’s nutritional status before, during, after and between pregnancies are essential (box 8). The Scale Up Nutrition road map, the Global Alliance for Improved Nutrition, the Renewed Efforts Against Child Hunger, the U.S. and Irish–led 1,000 days: Change a Life, Change the Future campaign and similar initiatives are under way to address maternal and child undernutrition;11 the challenge is to ensure that these are fully integrated with country-level reproductive, maternal, newborn and child health programmes.12
FIGURE 8 Poorer children are more likely to be stunted
Source: Demographic and Health Surveys and Multiple Indicator
Cluster Surveys
0
10
20
30
40
50
Median prevlance of stunting by wealth quintile,Countdown countries with data (%)
Poorest Second Middle Fourth Richest
42 42
36
32
25

Building a Future for Women and Children The 2012 Report22
Key indicators of maternal nutrition are maternal stature, body mass index and micronutrient deficiency. Poor maternal nutrition contributes to at least 20% of maternal deaths, and increases the probability of other poor pregnancy outcomes, including newborn deaths.1 Maternal undernutrition is particularly severe in South Asian Countdown countries. In Pakistan, for example, more than 25% of women ages 15–19 have a low body mass index (below 18.5 kilograms per square metre) and 10% had short stature (less than 145 centimetres).2
In this report Countdown tracks for the first time the prevalence of low body mass index among women of reproductive age, an important risk factor for intrauterine growth restriction, low birthweight and neonatal mortality. less data are available on the nutritional status of women than on the nutritional status of children. In 24 Countdown countries with a recent Demographic and Health Survey the median prevalence of low body mass index among women of reproductive age is 11%, with a low of 0.7% in Egypt. Four countries report extremely high prevalence: Nepal (26%), Madagascar (28%), Bangladesh (33%) and India (40%).
Short maternal stature, often a result of childhood stunting, is also a risk factor for obstructed labour and caesarean delivery due to a disproportion between the baby’s head and the maternal pelvis. Prolonged obstructed labour combined with no or delayed access to caesarean delivery can result in maternal
mortality, debilitating long-term health consequences such as obstetric fistula and neonatal mortality due to birth asphyxia. Many Countdown countries with high maternal undernutrition also lack readily available emergency caesarean sections.
limited information is available on maternal micronutrient deficiencies. A WHo review of nationally representative surveys from 1993 to 2005 found that 42% of pregnant women worldwide are anaemic, more than half of them due to iron deficiency.2 Prenatal folic acid deficiency, also widespread, is associated with increased risk of neural tube defects.
Further research is needed to understand the relationships between maternal undernutrition and short- and long-term maternal and child health outcomes. More and better data are also needed on measures of maternal nutritional status and on coverage of evidence-based interventions, including folic acid supplementation in the periconceptional period, iron and folic acid uptake among women at risk of iron deficiency anaemia and nutrition programmes to address food insecurity and low maternal body mass index.
Notes1. Black and others 2008; Stoltzfus, Mullany and Black 2004.
2. Zulfigar A. Bhutta and others, Aga Khan University, National
Nutrition Survey, Pakistan, 2011.
3. WHo and CDC 2008.
Box 8 A new focus on maternal undernutrition

Building a Future for Women and Children The 2012 Report 23
Coverage along the continuum of care
This section presents levels and trends in the Countdown coverage indicators, including measures of equity in coverage. It reviews the number of countries with coverage data available for Countdown indicators, discusses new indicators included for the first time in 2012 and summarizes coverage trends since 2000.
Figure 9 shows median coverage values based on the latest available estimates since 2006 for 21 Countdown indicators. Table 2 shows the number of countries with available data for each Countdown indicator, the median coverage values and the range in coverage across reporting countries. Figure 9 and table 2 do not include the
caesarean section rate, prevention of mother-to-child transmission of HIV and eligible HIV-positive pregnant women receiving antiretroviral treatment for their own health, which are reported on separately.
New coverage indicators for 2012 reflect advancements in family planning and infant feeding: demand for family planning satisfied (an indicator of met need for family planning; box 9) and introduction of solid or semisolid foods. Coverage is reported both for the compound measure of oral rehydration therapy with continued feeding and for oral rehydration salts alone. Information on oral rehydration salts use
Figure 9 Coverage of interventions varies across the continuum of care
a. Data are for 2010.
b. Analysis is based on countries with 75% or more of the population at risk of p. falciparum transmission.
Source: immunization rates, WHO and uNiCeF; postnatal visit for mother, Saving Newborn Lives analysis of Demographic and Health Surveys;
improved water and sanitation, WHO and uNiCeF Joint Monitoring Programme 2012; all other indicators, uNiCeF global databases, April 2012, based on
Demographic and Health Surveys, Multiple indicator Cluster Surveys and other national surveys.
0
25
50
75
100
Median national coverage of selected Countdown interventions, most recent year since 2006 (%)
Pregnancy Birth Postnatal Infancy Childhood Water andsanitation
Pre-pregnancy
Impr
oved
san
itatio
n fa
cilit
ies
Impr
oved
drin
king
wat
er s
ourc
es
Ora
l reh
ydra
tion
salts
Mal
aria
tre
atm
ent
(firs
t-lin
e an
timal
aria
l)b
Ant
ibio
tics
for
pneu
mon
ia
Car
esee
king
for
pneu
mon
ia
Chi
ldre
n sl
eepi
ng u
nder
inse
ctic
ide-
trea
ted
nets
b
Vita
min
A s
uppl
emen
tatio
n(t
wo
dose
s)
Hae
mop
hilu
s in
fluen
zae
type
bim
mun
izat
ion
(thr
ee d
oses
)a
Mea
sles
imm
uniz
atio
na
DTP
3 im
mun
izat
iona
Intr
oduc
tion
of s
olid
,se
mis
olid
or
soft
food
s
Exc
lusi
ve b
reas
teed
ing
(for
first
six
mon
ths)
Post
nata
l vis
it fo
r m
othe
r
Ear
ly in
itiat
ion
of b
reas
tfee
ding
Ski
lled
atte
ndan
t at
birt
h
Neo
nata
l tet
anus
pro
tect
ion
Inte
rmitt
ent
prev
entiv
etr
eatm
ent
of m
alar
iafo
r pr
egna
nt w
omen
Ant
enat
al c
are
(at
leas
t fo
ur v
isits
)
Ant
enat
al c
are
(at
leas
t on
e vi
sit)
Dem
and
for
fam
ilypl
anni
ng s
atis
fied
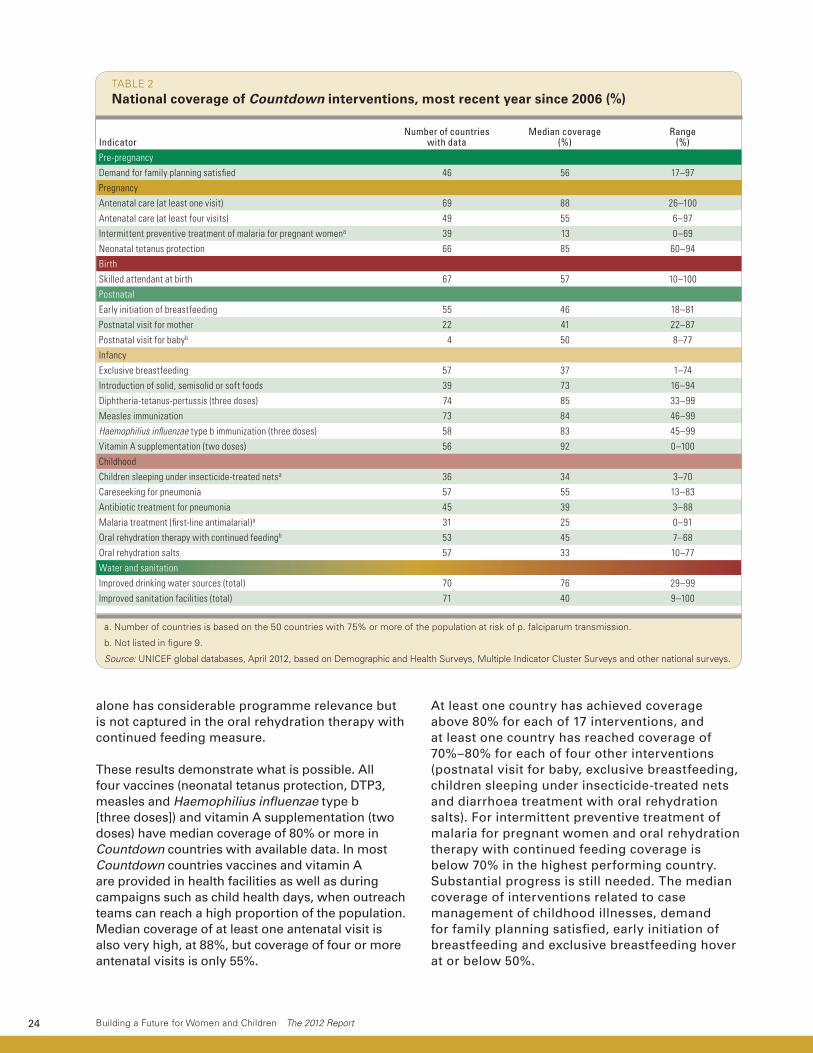
Building a Future for Women and Children The 2012 Report24
alone has considerable programme relevance but is not captured in the oral rehydration therapy with continued feeding measure.
These results demonstrate what is possible. All four vaccines (neonatal tetanus protection, DTP3, measles and Haemophilius influenzae type b [three doses]) and vitamin A supplementation (two doses) have median coverage of 80% or more in Countdown countries with available data. In most Countdown countries vaccines and vitamin A are provided in health facilities as well as during campaigns such as child health days, when outreach teams can reach a high proportion of the population. Median coverage of at least one antenatal visit is also very high, at 88%, but coverage of four or more antenatal visits is only 55%.
At least one country has achieved coverage above 80% for each of 17 interventions, and at least one country has reached coverage of 70%–80% for each of four other interventions (postnatal visit for baby, exclusive breastfeeding, children sleeping under insecticide-treated nets and diarrhoea treatment with oral rehydration salts). For intermittent preventive treatment of malaria for pregnant women and oral rehydration therapy with continued feeding coverage is below 70% in the highest performing country. Substantial progress is still needed. The median coverage of interventions related to case management of childhood illnesses, demand for family planning satisfied, early initiation of breastfeeding and exclusive breastfeeding hover at or below 50%.
a. Number of countries is based on the 50 countries with 75% or more of the population at risk of p. falciparum transmission.
b. Not listed in figure 9.
Source: UNICEF global databases, April 2012, based on Demographic and Health Surveys, Multiple Indicator Cluster Surveys and other national surveys.
IndicatorNumber of countries
with dataMedian coverage
(%)Range
(%)Pre-pregnancy
Demand for family planning satisfied 46 56 17–97
Pregnancy
Antenatal care (at least one visit) 69 88 26–100
Antenatal care (at least four visits) 49 55 6–97
Intermittent preventive treatment of malaria for pregnant womena 39 13 0–69
Neonatal tetanus protection 66 85 60–94
Birth
Skilled attendant at birth 67 57 10–100
Postnatal
Early initiation of breastfeeding 55 46 18–81
Postnatal visit for mother 22 41 22–87
Postnatal visit for babyb 4 50 8–77
Infancy
Exclusive breastfeeding 57 37 1–74
Introduction of solid, semisolid or soft foods 39 73 16–94
Diphtheria-tetanus-pertussis (three doses) 74 85 33–99
Measles immunization 73 84 46–99
Haemophilius influenzae type b immunization (three doses) 58 83 45–99
Vitamin A supplementation (two doses) 56 92 0–100
Childhood
Children sleeping under insecticide-treated netsa 36 34 3–70
Careseeking for pneumonia 57 55 13–83
Antibiotic treatment for pneumonia 45 39 3–88
Malaria treatment (first-line antimalarial)a 31 25 0–91
Oral rehydration therapy with continued feedingb 53 45 7–68
Oral rehydration salts 57 33 10–77
Water and sanitation
Improved drinking water sources (total) 70 76 29–99
Improved sanitation facilities (total) 71 40 9–100
TAblE 2 National coverage of Countdown interventions, most recent year since 2006 (%)

Building a Future for Women and Children The 2012 Report 25
Delivering for women and babies: caesarean section rates and coverage of needed HIV services
Data on caesarean section rates are presented separately because the target coverage value is not 100%. Rates below 5% signal a lack of access to emergency obstetric care, and rates above 15% suggest overuse, which may increase poor maternal and neonatal health outcomes.13 Of the 47 Countdown countries with available data for
2006−2011, 18 report caesarean section rates below 5%, and 8 report rates above 15%. Rates range from 1% (Niger, Ethiopia and South Sudan) to 50% (Brazil), with a median of 5%. Of 42 Countdown countries with available disaggregated data, 23 have caesarean section rates below 5% in rural areas, while only 5 have such low rates in urban areas; this reflects the concentration of emergency obstetric care services in cities. Caesarean sections are one component of comprehensive emergency
Source: WHo and others 2009; Singh and others 2009; Singh and Ashford 2009.
Expanding access to family planning is an effective strategy for saving women’s and children’s lives and improving their health. Family planning empowers women and households to make decisions about whether and when to have children as well as desired family size. This is critical because more than 40% of all pregnancies worldwide are unintended.
Family planning reduces maternal deaths due to unsafe abortions (see box 7). Spacing pregnancies at least two years apart and limiting the total number of pregnancies improves the survival chances and health outcomes of women, newborns and children.
Family planning offers an opportunity to strengthen human capital and enhance progress in poverty reduction and sustainable economic development. Effective family planning programmes require strong government leadership, commitment and investment and must be part of a comprehensive approach that includes activities at the policy, service delivery and community levels.
The experience of Niger illustrates a successful approach to increasing delivery and uptake of family planning services. Contraceptive prevalence increased from 8.2% in 1998 to 16.5% in 2009 (see figure). The percentage of service delivery points offering at least three modern methods of contraceptives grew from 58% in 2008 to 80% in 2010−12, with more than 85% reporting no stockout of commodities in the latter period.
Niger’s progress can be attributed in part to its 2007 adoption of a comprehensive approach to increasing access to family planning. This approach is linked to the national poverty reduction strategy and to the national health sector policy and development plan. Strong leadership led to the development and implementation of supportive policies and plans, a
focus on improving access to high-quality services and community mobilization. A dedicated national budget line for procuring contraceptives was established and has increased over the last four years.
The country is also working to improve the supply chain management system and the competency and supervision of health workers. on the demand side several initiatives have been introduced to involve male partners in women’s reproductive health, engage religious and other community leaders and mobilize communities to advocate for higher quality services.
Although more progress is needed in Niger, its comprehensive approach, which addresses supply- and demand-side constraints to the scale-up of family planning services, offers a promising model for others to adopt.
The contraceptive prevalence rate in Niger has nearly doubled since 1998
0
5
10
15
20
200920061998
Contraceptive prevalence rate (%)
Source: 1998 and 2006 Demographic and Health Surveys;
Niger Ministry of Health 2010; United Nations Population Fund
Reproductive Health Commodity Security surveys.
Box 9 Family planning: what does it take to succeed?

Building a Future for Women and Children The 2012 Report26
obstetric care, which also includes blood transfusions and other interventions to manage life-threatening complications of pregnancy and childbirth (such as those requiring a health facility adequately equipped and staffed to administer parental antibiotics, oxytocin for the prevention of postpartum haemorrhage, magnesium sulfate for convulsions, basic neonatal resuscitation, active management of the third stage of labour and assisted vaginal delivery).
The Commission on Information and Accountability for Women’s and Children’s Health selected one HIV indicator with two components to encourage countries to increase provision of antiretroviral medicines to HIV-positive pregnant women in order to reduce the risk of transmission of HIV to their baby and improve their health. These indicators are important measures of progress towards achieving Millennium Development Goal 6. New reporting on coverage for the most effective antiretroviral drug regimens will now enable monitoring of country progress in scaling up these regimens.
Coverage of the most effective regimens for preventing mother-to-child transmission of HIV in the 21 Countdown countries considered priority countries for eliminating mother-to-child transmission shows a wide range (table 3), with three countries reporting coverage of 10% or less and five countries reaching 75% or more of the eligible population in need.14
Coverage of antiretroviral therapy for HIV-positive pregnant women who are treatment eligible also varies substantially. Of the 17 priority countries with data for 2010, coverage ranges from 0% in Ghana to 39% in Botswana and Chad.
Coverage trends since 2000
Examining coverage trends is essential for assessing country progress. Information on trends requires at least two separate and comparable measures at two points in time. For nine Countdown indicators at least 20 countries had two measurements at least three years apart, one between 2000 and 2005 (median 2002) and the other between 2006 and 2011 (median 2008).
In absolute terms the largest increase in coverage of indicators along the continuum of care was for children sleeping under insecticide-treated nets (35 percentage points) followed by exclusive breastfeeding (14 percentage points), at least one antenatal care visit and DTP3 vaccination (both with 12 percentage points; table 4). The smallest
absolute gains were for diarrhoea treatment with oral rehydration salts and early initiation of breastfeeding, both with 4 percentage points. Absolute gains should be interpreted with caution because increases are harder to achieve when baseline levels are already high. For example, median coverage of measles and DTP3 vaccination was 71% during 2000−05, limiting the maximum possible absolute increase in coverage to 29 percentage points.
An alternative measure of progress is the coverage gap, or how much coverage would need to increase from the 2000−05 level to reach universal coverage. The change from 2000−05 to 2006−11 can then be expressed as a percentage of this gap. At least one antenatal care visit, DTP3 and measles immunization and children sleeping under insecticide-treated nets progressed the fastest in closing the gap (see table 4). Early initiation of breastfeeding and diarrhoea treatment with oral rehydration salts showed the least progress, consistent with their slow progress in absolute coverage gains.
Source: WHo, UNAIDS and UNICEF 2011.
Country Point estimate Range
Congo, Dem. Rep. 1 <1–1
Chad 7 5–9
Nigeria 9 7–10
Angola 20 15–28
Burundi 36 32–49
Uganda 42 36–51
Kenya 43 37–49
Zimbabwe 46 40–52
Ghana 48 40–57
Mozambique 52 44–62
Cameroon 53 43–65
Tanzania 59 52–68
Côte d’Ivoire 66 54–79
Zambia 75 67–85
Lesotho 89 77–>95
Botswana >95 >95–>95
South Africa >95 85–>95
Swaziland >95 88–>95
Note: The ranges around the levels of coverage are based on the
uncertainty ranges around the estimates of need. Point estimates
and ranges are given for countries with a generalized epidemic.
Ethiopia, India and Malawi are also priority countries for eliminating
mother-to-child transmission of HIV but do not have disaggregated
data on type of treatment regimen for 2010.
TABlE 3 Estimated antiretroviral coverage for the prevention of mother-to-child transmission using the most effective regiment, 2010 (%)

Building a Future for Women and Children The 2012 Report 27
Figure 10 shows progress in coverage for selected interventions to illustrate the “cap” affecting interventions that had already achieved coverage of 70% or higher by 2005 (at least one antenatal care visit and DTP3 and measles immunization) and the potential for rapid growth among new interventions backed by high levels of resources and political commitment (children sleeping under insecticide-treated nets). Interventions requiring strong health systems (skilled attendant at birth) or requiring behaviour change (early initiation of breastfeeding, careseeking for pneumonia) appear stalled at coverage levels of 30%–50%, suggesting that more effective ways are needed to reach women and children with these and similar interventions.
Progress in improving coverage must also be assessed in relation to demographic factors such as population growth. Many Countdown countries are experiencing escalating population growth, increasing the absolute number of women and children in need of services (box 10).
Rapid progress is possible!
The 2012 Countdown results show that rapid progress in increasing coverage of single interventions is possible. To reach sustainable and equitable gains in reproductive, maternal, newborn and child health, however, coverage must increase simultaneously across multiple interventions. To compare country progress in increasing coverage of multiple interventions, Countdown uses the composite coverage index, a weighted average of coverage levels for eight widely available
indicators along the continuum of care covering four groups of interventions (preconception, pregnancy and delivery, immunizations and case management of childhood illnesses). The difference between universal coverage and the index value is the coverage gap; the higher the index value, the closer a population is to universal coverage and closing the coverage gap.15
Countries with at least two household surveys, one from 2000−05 and one from 2006−11, were examined. The mean interval between the two surveys was 5.8 years but varied by country. Coverage change is expressed as an increase or reduction in percentage points of the composite coverage index, standardized for a five-year period.
For countries with two surveys the mean composite coverage index was 59% in the earlier period and 64% in the later period, an increase of 5 percentage points over five years or 0.8 percentage point a year, though there was wide variability in progress across this subset of Countdown countries (figure 11). Bangladesh, Cambodia, Rwanda and Ethiopia had substantial increases of about 15 percentage points over five years or 3 percentage points a year. Mozambique, Uzbekistan, Côte d’Ivoire and Cameroon, however, showed declines of 5 percentage points or more, indicating that some countries are experiencing reversals in coverage of key interventions. Efforts are under way to increase the frequency and availability of household survey data in Countdown countries, so that future analyses will include more countries.
Source: UNICEF global databases, April 2012, based on Demographic and Health Surveys, Multiple Indicator Cluster Surveys and other national surveys.
IndicatorNumber of
countries with data
Median coverage (%) Change
(percentage points)
Proportion of gap closed
(%)2000−05 2006−11
Antenatal care (at least one visit) 61 76 88 12 50
Skilled attendant at birth 61 49 57 8 16
Early initiation of breastfeeding 21 49 53 4 8
Exclusive breastfeeding (for first six months) 48 26 40 14 19
DTP3 immunizationa 73 71 83 12 41
Measles immunizationa 73 71 79 8 28
Children sleeping under insecticide-treated netsb 26 2 37 35 36
Careseeking for pneumonia 45 44 51 7 13
Oral rehydration salts treatment 46 29 33 4 6
a. Based on the interagency estimates from 2002 and 2008, the average reference years for calculating trends for the nonvaccine indicators in table 3.
b. Analysis is based on countries with 75% or more of the population at risk of p. falciparum transmission with trend data available.
TABlE 4 Trends in Countdown indicators, countries with data from at least two surveys, 2000−05 and 2006−11

Building a Future for Women and Children The 2012 Report28
Figure 10 Most interventions have seen progress in coverage since 2000
a. Data are for 26 countries with data available for both time periods and with at least 75% of the population at risk of p. falciparum transmission.
Source: uNiCeF global databases, April 2012, based on Demographic and Health Surveys, Multiple indicator Cluster Surveys and other national surveys.
0
25
50
75
100
Ora
l reh
ydra
tion
salts
trea
tmen
t
Chi
ldre
n sl
eepi
ng u
nder
inse
ctic
de-t
reat
ed n
etsa
Exc
lusi
ve b
reas
tfee
ding
Car
esee
king
for
pneu
mon
ia
Ear
ly in
itiat
ion
of b
reas
tfee
ding
Ski
lled
atte
ndan
t at
birt
h
Mea
sles
imm
uniz
atio
n
DTP
3 im
mun
izat
ion
Ant
enat
al c
are
(at
leas
t on
e vi
sit)
Median national coverage of selected Countdown interventions, 2000–05 and most recent year since 2006 (%)
2000–05
2006 or later
global fertility rates are declining, but the population continues growing rapidly in many Countdown countries, particularly Sub-Saharan African and Middle east and North African countries. Larger populations translate into more people in need of health services, increasing the challenge for reaching universal coverage in Countdown countries with resource constraints and weak health systems.
The impact of population growth on the demand for reproductive, maternal, newborn and child health services can be illustrated by comparing coverage trends in skilled attendant at birth with birth rates in Nigeria, where the annual number of births is projected to explode from 4.3 million in 1990 to 7 million in 2015, an increase of 63% (see figure). The proportion of births attended by skilled health personnel in Nigeria increased modestly from 31% in 1990 to 39% in 2008, while the absolute number of births attended by a skilled health provider doubled, from approximately 1.3 million in 1990 to 2.7 million in 2008. Had the number of births remained stable each year between 1990 and 2008, coverage would have reached around 63% in 2008, 24 percentage points higher than the actual figure of 39%.
The example shows that focusing on coverage alone
can mask important progress in delivering services to women, newborns and children. Nigeria’s slow progress in increasing coverage of skilled attendant at birth despite doubling the number of births attended by a skilled health provider is also a clear indication of the considerable challenges posed by population pressure on country efforts to deliver interventions at scale.
Explosion in births in Nigeria: a challenge for delivering services
0
1
2
3
4
5
6
7
8
201520102005200019951990
Annual number of births, Nigeria (millions)
Source: uNDeSA 2011.
Box 10 Scaling up and reaching more people: swimming against the population growth tide

Building a Future for Women and Children The 2012 Report 29
Equity in coverage—new findings from Countdown analyses
National estimates of intervention coverage often mask important subnational inequities. The country profiles include a summary graph showing socioeconomic inequities in coverage for a set of key interventions across the continuum of care. Intervention coverage is substantially
FIGURE 11 Most countries have increased coverage of eight interventions across the continuum of care
Source: Demographic and Health Surveys and Multiple Indicator
Cluster Surveys.
–10 –5 0 5 10 15 20
Mozambique
Uzbekistan
Côte d’Ivoire
Cameroon
Guinea-Bissau
Mali
Bolivia
Philippines
Benin
Iraq
Zambia
Sierra Leone
Togo
Egypt
Senegal
São Tomé and Príncipe
Lesotho
Uganda
Mauritania
Indonesia
Ghana
Nepal
Nigeria
Central African Republic
Zimbabwe
Lao PDR
Kenya
Madagascar
Niger
Malawi
Vietnam
Burkina Faso
Peru
Ethiopia
Rwanda
Cambodia
Bangladesh
Change in composite coverage index over about five years
higher among women and children from richer households, but inequities in coverage vary by intervention (figure 12). Interventions that require a functional health system, such as skilled attendant at birth, are particularly inequitable, while interventions that do not, such as vaccines, are more equitable.16 The composite coverage index also reveals important inequities. The overall median value across 54 countries with data is 60%, but the median value ranges from 48% in the poorest quintile to 74% in the richest.
Figure 13 shows the subnational composite coverage index for one country in Latin America, Africa and Asia. Bolivia shows little variability across regions, while Ethiopia and India show far greater variability. Subnational data are essential for deciding whether geographic targeting of interventions is necessary.
Another important geographic dimension of coverage inequity is urban-rural location. Ethiopia
FIGURE 12 Coverage inequity varies by intervention
Source: Demographic and Health Surveys and Multiple Indicator
Cluster Surveys.
0
20
40
60
80
100
Car
esee
king
for p
neum
onia
Ora
l reh
ydra
tion
ther
apy
and
cont
inue
d fe
edin
g
Vita
min
A s
uppl
emen
tatio
n (t
wo
dose
s)
Mea
sles
imm
uniz
atio
n
DTP
3 um
mun
izat
ion
Chi
ldre
n sl
eepi
ng u
nder
inse
ctic
ide-
trea
ted
nets
Early
initi
atio
n of
bre
aste
edin
g
Skill
ed a
ttend
ant a
t birt
h
Ant
enat
al c
are
(at l
east
one
vis
it)
Dem
and
for f
amily
pla
nnin
g sa
tisfie
d
Coverage along the continuum of care, Countdown countries with data, median and by wealth quintile (%)
MedianRichest 20%
Poorest 20%

Building a Future for Women and Children The 2012 Report30
has the widest urban-rural gap in the composite coverage index, with an urban value 37 percentage points higher than the rural value, followed by Niger (28 percentage points), Chad (27 percentage points), Nigeria and Yemen (24 percentage points for both; figure 14). Only two countries, São Tomé and Príncipe and Uzbekistan, have a higher value for rural areas than for urban areas, though the differences were small. The average urban-rural gap across all Countdown countries is 13.8 percentage points.
These results highlight the importance of disaggregating national results by multiple dimensions of inequities, including wealth, region of the country and urban-rural location. Subnational data can be used to target interventions where they are most needed by identifying population groups at higher risk. Countries that made the most rapid progress in improving coverage did so by reaching out to the poorest households and to households in remote areas.
FIGURE 13 Subnational variations in the composite coverage index in three countries
Source: Demographic and Health Surveys and Multiple Indicator
Cluster Surveys.
0
20
40
60
80
100
Kera
laTa
mil
Nad
uG
oaH
imac
hal P
rade
shM
ahar
asht
raD
elhi
Punj
abW
est
Ben
gal
Kar
nata
kaA
ndhr
a pr
ades
hS
ikki
mJa
mm
u an
d K
ashm
irH
arya
naM
izor
amG
ujar
atO
rissa
Triip
ura
Chh
attis
garh
Utt
aran
chal
Man
ipur
Mad
hya
Prad
esh
Raj
asth
anA
ssam
Jhar
khan
dU
ttar
Pra
desh
Aru
nach
al P
rade
shM
egha
laya
Bih
arN
agal
and
Add
is A
beba
Dire
Daw
aH
arar
iTi
gray
Gam
bela
Am
hara
Ben
-Gum
zS
nnp
Oro
miy
aA
far
Som
ali
Tarij
aS
anta
Cru
zPa
ndo
Chu
quis
aca
Ben
iO
ruro
Coc
haba
mba
Poto
síLa
Paz
Composite coverage index, by subregion, Bolivia, Ethiopia and India(%)
Bolivia Ethiopia India

Building a Future for Women and Children The 2012 Report 31
FIGURE 14 Coverage inequities between urban and rural households
Source: Demographic and Heatlh Surveys and Multiple Indicator Cluster Surveys.
0 20 40 60 80 100
UrbanRural
Peru
Cambodia
Tanzania
Uzbekistan
Egypt
Lesotho
Indonesia
Morocco
Brazil
Malawi
Madagascar
Zambia
Swaziland
Iraq
Philippines
Bangladesh
Congo
Kyrgyzstan
Kenya
Zimbabwe
India
Bolivia
Mozambique
South Africa
São Tomé and Príncipe
Uganda
Tajikistan
Nepal
Ghana
Côte d’Ivoire
Burkina Faso
Pakistan
Gabon
Guatemala
Yemen
Senegal
Liberia
Djibouti
Guinea–Bissau
Congo, Dem. Rep.
Niger
Central Africa Republic
Benin
Rwanda
Sierra Leone
Guinea
Azerbaijan
Comoros
Ethiopia
Mauritania
Nigeria
Togo
Mali
Haiti
Chad
Composite coverage index, urban and rural (%)

Building a Future for Women and Children The 2012 Report32
Determinants of coverage
Countdown recognizes the importance of health systems, the legislative framework, financial resources and contextual factors (such as education, water and sanitation, governance, conflict and other humanitarian emergencies, environment and socioeconomic factors, including the status of women) in determining country ability to achieve high and equitable coverage. This section provides an update on country progress in strengthening health systems and the policy environment for women and children; trends in official development assistance for maternal, newborn and child health; and examples of how context matters in maternal, newborn and child survival.
Strengthening policies and health systems: the building blocks for progress
Countdown monitors key health policy and health system indicators critical to the scale-up of essential reproductive, maternal, newborn and child health interventions. Selected indicators cover the continuum of care and the six health system building blocks (leadership and governance, health systems financing, access to essential medicines, health information systems, health workforce and health service delivery).17 The good news is that there has been progress in policy adoption and health system strengthening. But gaps remain and must be addressed for Countdown countries to achieve Millennium Development Goals 4 and 5.
Supportive legislation is a key first step in improving access to and quality of care; it must be followed by sustained political commitment and strong support from stakeholders so that policies are translated into action on the ground. In 2012, 30 of 68 Countdown countries with available data reported adopting a policy recommending postnatal home visits within the first week of life, critical for ensuring that newborn babies receive essential care when the risk of mortality is highest (figure 15). A recent WHO survey found that community health workers in Sub-Saharan
African and Asian countries with this policy provide home visits for both mothers and newborns (box 11).18 The number of Countdown countries with a policy allowing community health workers to treat pneumonia, enabling access to timely lifesaving care at the community level, has more than doubled in four years, from 18 to 38.19 Sixteen countries have adopted a policy on pneumococcal vaccine,20 and nine a policy on rotavirus vaccine, demonstrating a strong commitment from governments to introduce these new and effective interventions for child survival. However, progress has been limited on protective policies for maternity leave for new and expecting mothers21 and on the International Code of Marketing on Breast-milk Substitutes,22 which are needed to create an environment that promotes maternal and newborn health.
Critical health systems input: human resources
Implementing supportive policies and programmes for reproductive, maternal, newborn and child health depends on adequate human resources. Health care workers can deliver quality services effectively only if sufficient funds are allocated to support the health care infrastructure, including supply chain management and health information systems. Increasing access to care also depends on reducing financial barriers to receiving care, particularly out-of-pocket costs.
A total of 53 Countdown countries (including South Sudan) have a severe shortage of health workers, defined as an aggregate density of physicians, nurses and midwives below 2.3 per 1,000 people.23 In many cases available health personnel have an inappropriate mix of skills relative to service needs on the ground.24 The human resources crisis is most pronounced in Countdown countries in West and Central Africa and in East and Southern Africa (figure 16).
Inequities in the distribution of health care workers within Countdown countries are also vast. Reasons include shortfalls in the number of trained workers

Building a Future for Women and Children The 2012 Report 33
available and reluctance on the part of health workers to serve in remote and rural areas because of unsatisfactory living and working conditions, lower status and levels of recognition, and a lack of opportunities for professional advancement.25 Seventeen Countdown countries encourage health care providers to work in underserved areas by adopting WHO global policy recommendations for health worker education, regulation, financial incentives, and professional and personal support.26
Addressing the human resources crisis for reproductive, maternal, newborn and child health is a major call to action in the Global Strategy for Women’s and Children’s Health.27 The Second Global Forum on Human Resources for Health in
2011 called on all stakeholders to combat the human resources crisis through widespread adoption of supportive policies (for example, on innovative skills mix approaches, deployment and retention schemes, and training), improvements in health workforce information systems and predictable long-term investments in health workforce development.28
There are positive examples of innovative approaches to tackle health workforce challenges: evidence continues to accumulate on the effectiveness of nonphysician clinicians in delivering emergency obstetric care services in remote and rural areas (such as in Tanzania);29 countries such as Kenya are establishing bilateral agreements with other countries in the region to collaborate on health workforce training and promote circular migration of health workers;30 research is being conducted in a variety of settings from Ghana31 to Lao People’s Democratic Republic (discrete choice experiments)32 on the incentives most likely to improve health workforce deployment and retention.
Malawi has implemented an innovative emergency human resources programme that includes task-shifting approaches to enhance training, deployment and retention of health workers (box 16 later in the report). The initiative is credited with saving more than 13,000 lives, estimated using the Lives Saved Tool and based on increases in coverage between 2004 and 2009 in antenatal care, skilled attendant at birth, prevention of mother-to-child transmission of HIV and vaccinations.33 Continuing investment will be critical to sustain these gains.
By contrast, recent evidence shows that external assistance for human resources for health from leading global health initiatives is only partly aligned with national health workforce development priorities.34
Financial resources for reproductive, maternal, newborn and child health in Countdown countries
Policymakers need financial information to make informed decisions on setting priorities, efficiently allocating resources among competing health care needs and ensuring sustainable funding for programmes. There are three main sources of funding for reproductive, maternal, newborn and child health in Countdown countries: government expenditures, external expenditures (resources provided by development partners as official development assistance) and private spending (of which out-of-pocket expenditure is typically the largest component).
Figure 15 Changes in adoption of supportive policies along the continuum of care
Note: Covers the 68 Countdown countries with data since 2008.
excludes Comoros, Kyrgyzstan, São Tomé and Príncipe, Solomon
islands, uzbekistan, South Sudan and Vietnam.
Source: See annexes A and C.
0 10 20 30 40 50 60 70
Maternity protectionin accordance with
Convention 183
Specific notificationof maternal deaths
Midwives authorizedto administer core set
of life-saving interventions
International codeof marketing
for breastmilk substitutes
Postnatal home visitsin the first week of life
Community treatment ofpneumonia with antibiotics
Low-osmolarityoral rehydration salts
Rotavirus vaccine
Pneumococcal vaccine
Number of 68 Countdown countries with data that haveadopted each supportive policy along the continuum of care,2008 and 2012
2008
2012
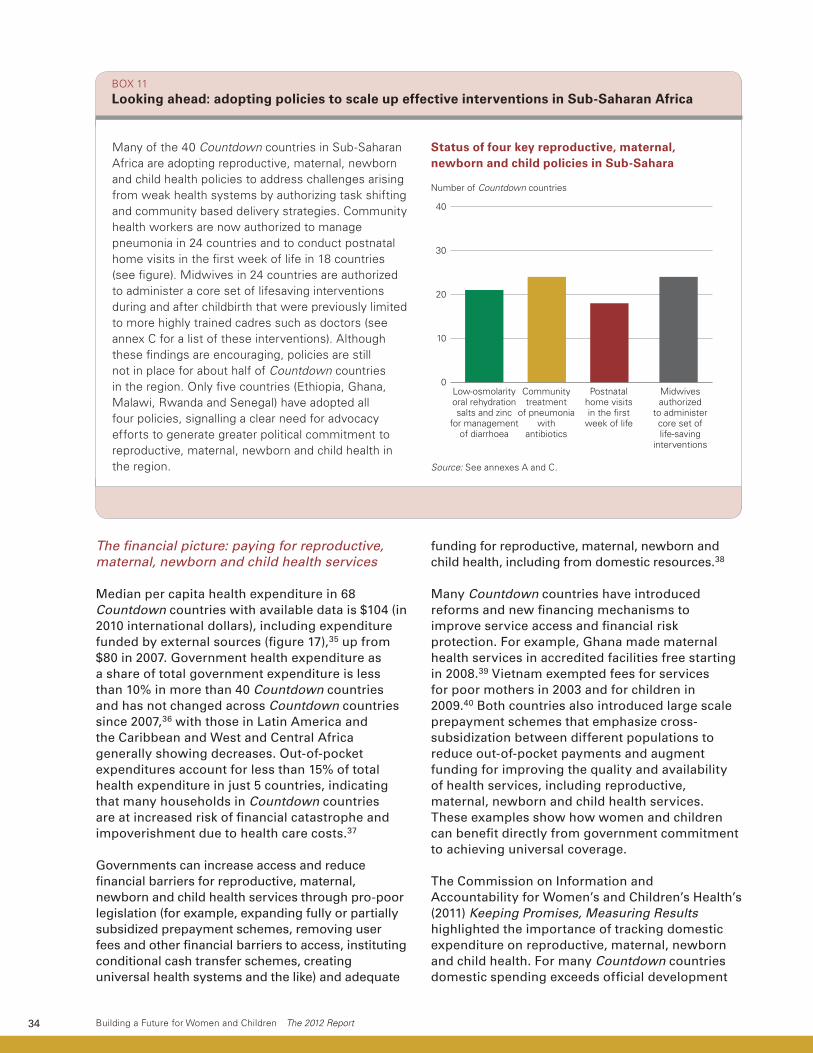
Building a Future for Women and Children The 2012 Report34
The financial picture: paying for reproductive, maternal, newborn and child health services
Median per capita health expenditure in 68 Countdown countries with available data is $104 (in 2010 international dollars), including expenditure funded by external sources (figure 17),35 up from $80 in 2007. Government health expenditure as a share of total government expenditure is less than 10% in more than 40 Countdown countries and has not changed across Countdown countries since 2007,36 with those in Latin America and the Caribbean and West and Central Africa generally showing decreases. Out-of-pocket expenditures account for less than 15% of total health expenditure in just 5 countries, indicating that many households in Countdown countries are at increased risk of financial catastrophe and impoverishment due to health care costs.37
Governments can increase access and reduce financial barriers for reproductive, maternal, newborn and child health services through pro-poor legislation (for example, expanding fully or partially subsidized prepayment schemes, removing user fees and other financial barriers to access, instituting conditional cash transfer schemes, creating universal health systems and the like) and adequate
funding for reproductive, maternal, newborn and child health, including from domestic resources.38
Many Countdown countries have introduced reforms and new financing mechanisms to improve service access and financial risk protection. For example, Ghana made maternal health services in accredited facilities free starting in 2008.39 Vietnam exempted fees for services for poor mothers in 2003 and for children in 2009.40 Both countries also introduced large scale prepayment schemes that emphasize cross-subsidization between different populations to reduce out-of-pocket payments and augment funding for improving the quality and availability of health services, including reproductive, maternal, newborn and child health services. These examples show how women and children can benefit directly from government commitment to achieving universal coverage.
The Commission on Information and Accountability for Women’s and Children’s Health’s (2011) Keeping Promises, Measuring Results highlighted the importance of tracking domestic expenditure on reproductive, maternal, newborn and child health. For many Countdown countries domestic spending exceeds official development
Many of the 40 Countdown countries in Sub-Saharan Africa are adopting reproductive, maternal, newborn and child health policies to address challenges arising from weak health systems by authorizing task shifting and community based delivery strategies. Community health workers are now authorized to manage pneumonia in 24 countries and to conduct postnatal home visits in the first week of life in 18 countries (see figure). Midwives in 24 countries are authorized to administer a core set of lifesaving interventions during and after childbirth that were previously limited to more highly trained cadres such as doctors (see annex C for a list of these interventions). Although these findings are encouraging, policies are still not in place for about half of Countdown countries in the region. only five countries (Ethiopia, Ghana, Malawi, Rwanda and Senegal) have adopted all four policies, signalling a clear need for advocacy efforts to generate greater political commitment to reproductive, maternal, newborn and child health in the region.
Status of four key reproductive, maternal, newborn and child policies in Sub-Sahara
0
10
20
30
40
Number of Countdown countries
Low-osmolarityoral rehydrationsalts and zinc
for managementof diarrhoea
Communitytreatment
of pneumoniawith
antibiotics
Postnatalhome visitsin the first
week of life
Midwivesauthorized
to administercore set oflife-saving
interventions
Source: See annexes A and C.
Box 11 Looking ahead: adopting policies to scale up effective interventions in Sub-Saharan Africa

35
assistance flows, especially when out-of-pocket expenditures are considered. Recent evidence on domestic spending on reproductive, maternal, newborn and child health in many Countdown countries is not readily available, however, and comparisons across large numbers of countries are still not possible. Several international agencies, including WHO and UNFPA, are working with countries to develop such evidence in different regions. Countdown is working with its partners to support countries and the international community in improving the tracking of both external and domestic resources for maternal, newborn and child health as part of the Accountability Agenda follow-up process. Countdown is committed to helping building the capacity of countries to estimate and use indicators of per
capita expenditure on total health and maternal, newborn and child health expenditures by source of financing to accelerate progress towards Millennium Development Goals 4 and 5.
Countdown data on official development assistance to maternal, newborn and child health goes back to 2003,41 and this report presents updated data for 2009. Countdown expects to release data for 2010 and a new analysis of official development assistance for reproductive health later in 2012. Monitoring official development assistance supports evidence-based decisionmaking and strengthens accountability for commitments by development partners to maternal, newborn and child health. Data on actual spending provide a benchmark of the financial resources available and can be used to estimate the additional investments required to achieve Millennium Development Goals 4 and 5. Breakdowns of official development assistance by source and recipient that highlight whether funds are being allocated to the countries most in need of external support can improve allocation and efficient use (box 12). More detailed analyses, such as by programme (for example, malaria) or recipient group (for example, newborns), have been undertaken and are needed for accountability. These analyses rely on the quality
FIGURE 17 National resources invested in reproductive, maternal, newborn and child health
Source: See annexes A and C.
International $
2007 2010 2007 2010 2007 2010
Financing indicators, median Countdown countries with data
Percent
0
20
40
60
80
100
120
0
10
20
30
40
50
60
Out-of-pocketexpenditure
on health(% of totalexpenditureon health,right axis)
Governmentexpenditureon health
(% of generalgovernmentexpenditure,
right axis)
Per capitaexpenditure
on health(left axis)
FIGURE 16 African countries are experiencing a severe health workforce shortage
Note: A severe health workforce shortage is defined as an aggregate
density of physicians, nurses and midwives below 2.3 per 1,000
people.
Source: World Health organization Global Health Workforce Statistics,
2011 Update (http://apps.who.int/globalatlas/).
0 5 10 15 20 25
West and Central Africa
South Asia
Middle East and North Africa
Latin America and the Caribbean
Eastern and Southern Africa
East Asia and Pacific
CEE/CIS
Number of 74 Countdown countries with data that have a severe health workforceshortage, various years (1998–2009), by United Nations Children’s Fund region
No severe shortage
Severe shortage

Building a Future for Women and Children The 2012 Report36
of donor reporting, suggesting that greater specificity in official development assistance tracking depends on improving and adhering to donor reporting mechanisms. For example, a recent analysis found that only 0.1% of total official development assistance for maternal, newborn and child health was used for projects whose description explicitly mentioned interventions to reduce neonatal deaths. The lack of specificity in official development assistance reporting makes it unclear whether this finding indicates a need for improvement in project descriptions, for increases in official development assistance for neonatal interventions or for a combination of both.
Official development assistance for maternal, newborn and child health in Countdown countries has increased steadily over the past decade and accounted for about 40% of official development assistance to health in 2009. The 2009 data suggest that the rate of increase is levelling off. Total official development assistance to maternal, newborn and child health for Countdown countries was $4.51 billion in 2009, of which $3.15 billion (69.8%) went to child health and $1.36 billion (30.2%) went to maternal, neonatal and newborn health, up 14.1% in real terms from 2008. Compare this with increases of 17.1% from 2006 to 2007 and 21.2% from 2007 to 2008.
From whom?
In 2009 the United States was the largest source of official development assistance for maternal, newborn and child health, followed by the Global Fund to Fight AIDS, Tuberculosis and Malaria and the International Development Association of the World Bank (see figure 1).
Figure 1. Official development assistance for maternal, newborn and child health was $4.5 billion in 2009
Bilateral aidagencies
54.0%
Global healthinitiatives
22.9%
Multilateralagencies
23.1%
Source: Creditor Reporting System Aid Activities Database of
the organisation for Economic Co-operation and Development
Development Assistance Committee.
To whom?
In 2009 approximately three-quarters of official development assistance for maternal, newborn and child health went to the 75 Countdown countries, with Nigeria and India receiving the most (see figure 2). The amount varies widely across countries and is not always in proportion to need. Total official development assistance has been concentrated in Sub-Saharan Africa and South Asia, especially in countries with large numbers of mothers and children.
Figure 2. Ten countries received more than 50% of official development assistance for maternal, newborn and child health in 2009
Other48.7%
Ethiopia6.3%
Afghanistan5.3%
Congo, Dem. Rep.4.5%
India7.5%
Nigeria9.1%
Kenya3.3%
Sudan2.7%
Pakistan5.0%
Tanzania3.7%
Bangladesh4.0%
Source: Creditor Reporting System Aid Activities Database of
the organisation for Economic Co-operation and Development
Development Assistance Committee.
Box 12 Official development assistance flows for maternal, newborn and child health

Building a Future for Women and Children The 2012 Report 37
Official development assistance for child and maternal and newborn health varies widely across Countdown countries, even after adjusting for the size of the vulnerable population. For example, in 2009 official development assistance per child ages 0–5 averaged $1.60 for the 10 countries receiving the least official development assistance and $38 for the 10 countries receiving the most (figure 18). Similarly, for maternal and newborn health the average was $4.18 per live birth for the 10 countries receiving the least official development assistance and $90 per live birth for the 10 countries receiving the most. Of the 10 countries that receive the most official development assistance for child health, 7 are also among the 10 countries that receive the most official development assistance for maternal and newborn health; 6 countries are among the 10 countries that receive the least official development assistance for both child health and maternal and newborn health.
Assessing the targeting of official development assistance relative to need reveals that factors other than need influence allocations to countries (see figure 18). More-populated Countdown countries often received more official development assistance for maternal, newborn and child health in absolute terms. When adjusted for the size of the vulnerable populations, however, received funds show a different picture. For example, in 2009 India received the third most official development assistance for child health in absolute terms, but the amount received per child ages 0–5 was $1.58, compared with $12.28 in Nigeria and $17.88 in Ethiopia, the two recipients of the most official development assistance for child health in absolute terms. For maternal and newborn health India received the most official development assistance in absolute terms but only $4.89 per live birth, compared with $14.24 in Nigeria, which received the second most official development assistance
FIGURE 18 Resource profiling: Countdown countries receiving the most and least official development assistance
0 10 20 30 40 50 60 70 80
Korea, Dem. Rep.
Yemen
Indonesia
Philippines
India
Egypt
Turkmenistan
China
Brazil
Mexico
Papua New Guinea
Zambia
Zimbabwe
Afghanistan
Rwanda
Equatorial Guinea
São Tomé and Príncipe
Djibouti
Liberia
Solomon Islands
Official development assistanceto child health per child, 2009 ($)
Official development assistanceto maternal and newborn health per child, 2009 ($)
Bottom 10 median: $1.60
0 30 60 90 120 150
Cameroon
Congo, Rep.
Uzbekistan
Egypt
South Africa
India
Turkmenistan
China
Brazil
Mexico
Rwanda
Afghanistan
Sierra Leone
Cambodia
Malawi
Equatorial Guinea
Djibouti
Liberia
São Tomé and Príncipe
Solomon Islands
Top 10 median: $90Top 10 median: $38
Bottom 10 median: $4.20

Building a Future for Women and Children The 2012 Report38
for maternal and newborn health, and $27.24 per live birth in Ethiopia, which received the fourth most. Afghanistan received the third most official development assistance, or nearly $63.40 per live birth. These examples show that absolute values alone do not accurately portray how official development assistance flows benefit individual mothers, newborns and children in Countdown countries, a situation complicated by important subnational inequities by urban-rural location, region of the country and socioeconomic groups.
Context matters: coverage and mortality change in the real world
Changes in the coverage of essential interventions happen within specific political, social, economic, epidemiological and environmental contexts (see figure 1). Many contextual factors are modifiable and reflect current unfair and avoidable health and other inequities within and between countries. Poverty and poor environmental conditions, for example, place families at higher risk of mortality
Conflict is a major threat to reproductive, maternal, newborn and child health. War affects not only the people in the countries directly involved, but also the people in neighbouring countries due to displacement and movement across borders. Armed and violent conflict can severely impair country ability to deliver basic health and other services.
The Uppsala Conflict Data Program1 uses a definition of conflict as the use of armed force between two parties, at least one of which is the government of a state, resulting in at least 25 battle-related deaths to determine conflict status. The results for 1991−2000 and 2001−2010 indicate that of 58 Countdown countries:• 21 had no conflict in either decade.• 12 had one or more conflicts in one of the two
decades.• 25 had at least one conflict in both decades.
Countdown has used these data to investigate the relationship between conflict and country progress in achieving high and equitable coverage of proven interventions (as measured by the composite coverage index; see section on coverage). The figure shows both the median composite coverage score for groups of countries with no conflict, conflict in one decade and conflict in both decades as well as median scores for countries in each group on the concentration index, a widely used measure of inequity. Higher concentration index scores indicate greater inequity. Conflict is associated not only with lower coverage, but also with greater socioeconomic inequities in coverage. longer conflicts (for example, those longer than two decades) may have compound negative effects on coverage and equity. In addition, average child mortality in 2010 was higher in countries with conflict during the two previous
decades (99 deaths per 1,000 live births) than in countries with conflict during one
Conflict prevents progress in achieving high and equitable coverage
0
20
40
60
80
Composite coverage index, by wealth quintile, concentration indexand armed conflict status, 55 countries with available data (%)
Richest 20% Second 20%Fourth 20% Poorest 20%Middle 20%
Concentrationindex = 6.4 Concentration
index = 8.8
Concentrationindex = 10.9
Median = 67%
Median = 62%
Median = 56%
Arm
ed c
onfli
ctin
bot
h de
cade
s
Arm
ed c
onfli
ctin
one
dec
ade
No
arm
ed c
onfli
ctin
eith
er d
ecad
e
Source: Uppsala University, Uppsala Conflict Data Program, www.pcr.
uu.se/research/ucdp/datasets/ucdp_prio_armed_conflict_dataset/.
of the two decades (93 deaths per 1,000 live births). Countries without conflict had the lowest under-five mortality rate (70 deaths per 1,000 live births).
Note1. www.pcr.uu.se/research/ucdp/datasets/ucdp_prio_armed_
conflict_dataset/.
Box 13 Conflict threatens the health of women and children

Building a Future for Women and Children The 2012 Report 39
through reduced ability to pay for health care services and increased exposure to inadequate housing, water and sanitation, food supplies, education and employment opportunities. Conditions of poverty can be compounded by natural disasters, conflict and other emergencies that destroy or increase pressure on already weak health care infrastructure and displace people (box 13). Gender discrimination and other societal factors such as early age at marriage and childbearing can also contribute to poor maternal, newborn and child health outcomes.
A range of cross-sectoral measures are available to remedy broader contextual challenges to progress. Expanding access to education, introducing gender-based affirmative action policies, adopting a human rights framework and adopting efforts to improve living and working conditions such as water and sanitation supplies (box 14) can all make a difference. Political commitment to reproductive, maternal, newborn
and child health and strong leadership are also critical to ensuring access to care.
Other contextual factors that play a role in maternal and child health and nutrition include education, environmental factors, such as water and sanitation, pollution and climate. Countdown maintains data on coverage of water and sanitation (see box 14) but does not have direct indicators of the potential effects of education, pollution or climate change at present. Countdown recognizes their importance for the futures of women and children.42
It is notable that some countries—such as Pakistan (box 15)—have been able to maintain and even strengthen reproductive, maternal, newborn and child health programmes despite important contextual disruptions and challenges. In some situations the breakdown of existing systems can even provide an opportunity to create new and more supportive policies and programmes for women and children.
Good news! Median coverage of improved sources of drinking water in Countdown countries increased from 60% in 1990 to 76% in 2010 (see figure). of 69 Countdown countries with available trend data, 23 have met the Millennium Development Goal target on proportion of the population using an improved drinking water source, and 16 are on track. However, 24 countries are not on track, and 6 are making insufficient progress. Coverage continues to be much higher in urban areas than in rural areas: in the 72 Countdown countries with available disaggregated data for 2010, median coverage was 91% in urban areas compared with 64% in rural areas.
Median coverage of improved sanitation facilities remains low across Countdown countries but has increased markedly, from 27% in 1990 to 40% in 2010 (see figure). Ten countries have achieved the Millennium Development Goal target on the proportion of the population using an improved sanitation facility, and ten are on track. But the majority are not on track (47 countries) or are making insufficient progress (3 countries). Urban-rural inequities in coverage of improved sanitation facilities are also pronounced. In 72 Countdown countries with available disaggregated data for 2010, median coverage was 55% in urban areas compared with 31% in rural areas.
These data show that it is possible for Countdown countries to achieve rapid gains in coverage of improved water sources and sanitation facilities. Countries need to continue efforts to reach households in rural and other underserved areas and to concentrate on scaling up access to improved sanitation facilities.
Coverage of improved drinking water sources and sanitation facilities has improved since 1990
0
20
40
60
80
100
201020001990201020001990
Median coverage in Countdown countries with available data (%)
Drinking water Sanitation
Source: WHo and UNICEF Joint Monitoring Programme on Water
Supply and Sanitation 2012.
Box 14 Water and sanitation: countries reach targets!

Building a Future for Women and Children The 2012 Report40
(continued)
Pakistan lies at the centre of one of the most volatile geopolitical regions of the world. In its 65 year history the country has experienced three military coups and three full-scale wars with India, the most recent of which occurred in 1971 and ended in the breakup of the country into the current Pakistan and Bangladesh. The debilitating Afghan wars following the Russian invasion of 1979 and the U.S.-led invasion of 2001 have resulted in smouldering conflict and insurgency in the northwest and the federally administered tribal areas. Pakistan’s population has grown from 27 million at the time of independence in 1947 to an estimated 187 million people in 2011, a third (36.7%) of whom are under age 14. Pakistan has hosted millions of Afghan refugees over the last three decades and endured major humanitarian emergencies in recent years, including an earthquake (2005) and massive floods (2010 and 2011).
Progress in maternal, newborn and child health indicators in Pakistan has been insufficient to reach the Millennium Development Goals (see table 1 in the main text). There is considerable variation across provinces and the federally administered tribal areas in resources, access to services and development. The most recent Demographic and Health Survey (2006−07) did not have province-level specificity, but information from a series of provincial level surveys suggests huge differentials in infant mortality between districts (see map). Despite the country’s agrarian economy, a 2011 national nutrition survey suggests that a quarter to a third of households are moderate to severely food insecure and that rates of anaemia among women of reproductive age and of child stunting and wasting have remained static over the last three decades. Findings from the 2006−07 Demographic and Health Survey also indicate that despite some reduction in post-neonatal infant and child mortality since 1991, the number of newborn deaths has remained largely unchanged, and they now account for half of child deaths. Some 57% of neonatal deaths occurred within the first 72 hours after birth; the vast majority were within the first 24 hours. Coverage of many reproductive, maternal, newborn and child health interventions remain unacceptably low, as shown in the country profile. The composite coverage index, an average of eight essential reproductive, maternal, newborn and child health interventions, is only 56% for the country as a whole, with huge differentials between the poorest
and richest subgroups (see figure). Insufficient vaccination coverage makes Pakistan one of the last three countries to have reported endemic polio, with 198 cases in 2011.
Subnational variations in infant mortality illustrate diversity
Source: Pakistan Multiple Indicator Cluster Surveys.
High socioeconomic inequity in coverage of interventions for maternal, newborn and child health in Pakistan
0
10
20
30
40
50
60
70
80
Composite coverage indicator by wealth quintile, Pakistan, 2005–06
Poorest Second Middle Fourth Richest
Source: Pakistan Demographic and Health Surveys 2005–06.
The recent disbandment of the federal health ministry following the 18th constitutional amendment has placed a huge responsibility on provinces for planning and action on public health, especially reproductive,
Box 15 Pakistan: delivering services under pressure
Infant mortality rateper 1,000 live births
90 or more80–8970–7960–69Fewer than 60

Building a Future for Women and Children The 2012 Report 41
The bottom line: coverage gains but no room for complacency
In summary, the 2012 Countdown results on coverage are encouraging—and show that progress is possible! Some countries are setting an example of what can be achieved – for one or two interventions, or better yet for multiple interventions across the continuum of care and requiring functioning health systems. But much remains to be done, not only before 2015 but in
the years that follow. Coverage is still much too low for interventions that require 24 hour access to trained health personnel; efforts to deliver these interventions at the community level are expected to increase rapidly in the next few years. Equity in coverage remains a challenge for many countries, and quality is only now beginning to receive the attention it deserves. The next section of the report builds on these findings to examine the kinds of progress needed to prevent unnecessary deaths among women and children.
maternal, newborn and child health. Despite opportunities for concerted action, challenges of governance, oversight and implementation of evidence-based policies remain. There may also be opportunities to integrate services at all levels—for example, in family planning and health, under separate ministries. A recent assessment of provincial strategies for reproductive, maternal, newborn and child health underscored the unique opportunities for implementing evidence-based intervention packages across the continuum of care. Recent estimates suggest, for example, that
implementing targeted packages at scale through the lady Health Workers programme linked to first- and second-level facilities could reduce under-five mortality 57% over the next few years, especially among the poorest quintiles and rural populations.1 other estimates indicate that full coverage of interventions could reduce newborn deaths by 84% and stillbirths by 59%.
Note1. Khan and others forthcoming.
Box 15 (CoNTINUED) Pakistan: delivering services under pressure

Building a Future for Women and Children The 2012 Report42
Milestones of progress on the path to success
Many interrelated factors contribute to or detract from country ability to expand coverage of essential services to women, newborns and children and achieve Millennium Development Goals 4 and 5. Assessing country progress requires looking at and beyond the numbers to identify the actions needed for success.
Results matter. Countries and their development partners need to regularly take stock of how well they are increasing equitable coverage, improving nutrition and decreasing mortality and morbidity. These changes do not occur in a vacuum, and understanding how and why they occur is essential for sustaining and bringing improvements to scale. The country profiles in this report can be a starting point for critical questions about what a country is doing well and where more effort is needed.
This section examines four types of success: ensuring that all determinants of coverage are in place to make possible high coverage with lifesaving interventions, assessing whether inequities in coverage are being reduced, identifying and promoting effective interventions and ensuring that these interventions are delivered with high quality.
An essential step is to carry out in-depth country case studies so that lessons learned can be shared and adapted to other settings (box 16).
Equity matters!
A second avenue for assessing country progress, and one highlighted in the Commission on Information and Accountability for Women’s and Children’s Health (2011) report Keeping Promises, Measuring Results is determining how well countries are decreasing inequities and reaching the most vulnerable population groups (box 17).
Better evidence of what works
Accountability depends on good data. Countries need regularly available, high-quality data for
routine programme management as well as for monitoring and evaluation. Many Countdown countries are establishing the foundations of a sound health information system—a supportive policy and legal framework, a comprehensive national health plan, well designed coordination and oversight mechanisms, and sufficient human and financial inputs. Investment is needed to improve national capacity to measure and report on core coverage, equity, policy, health systems and financing indicators through an optimal combination of household surveys, facility reports, censuses, vital registration systems, national health accounts and other essential sources of data. Equal attention is needed to develop the capacity of decisionmakers to act on available evidence by allocating resources according to need and by strengthening policy and programme implementation.
Better measurement of core indicators is critical both to improve data quality and to support countries in using evidence effectively to make decisions. Many technical groups are working to improve the measurement of coverage and mortality, including the Child Health Epidemiology Reference Group and interagency reference groups such as the Maternal Mortality Estimation Interagency Group and the Malaria Monitoring and Evaluation Reference Group.
The scientific community has a responsibility to continue advancing the knowledge base on what works and on how to deliver what works in different contexts. A joint PMNCH, WHO and Aga Khan University (2011) report, Essential Interventions, Commodities and Guidelines for Reproductive, Maternal, Newborn, and Child Health, compiled and reviewed the evidence needed to reach consensus on the basic packages of reproductive, maternal, newborn and child health services for delivery at each level of the health system (community, first level/outreach and referral) across the continuum of care.43 The report recommends 56 essential interventions to be scaled up as basic service packages at national level (annex D), identifies research gaps in the

Building a Future for Women and Children The 2012 Report 43
(continued)
Countdown focuses not only on coverage, but also on the policy, health systems and financial determinants of coverage (see figure 1 in the main text). The evolution of integrated community case management of childhood pneumonia, diarrhoea and malaria in Malawi illustrates the importance of all these factors
and the role that monitoring and evaluation can play in shaping country programmes. Figure 1 shows the timeline of community case management introduction in Malawi; key milestones and the sources of evidence used by the Ministry of Health and its partners to strengthen the programme are highlighted below.
Figure 1. Timeline for implementation and monitoring and evaluation of community case management in Malawi
2007 2008 2009 2010 2011 2012 2013 2014
Policy supportestablished in
maternal, newbornand child health
strategic planfor 2008–12
Financing from theGlobal Fund to Fight
AIDS, Tuberculosisand Malaria to double
health surveillanceassistants workforce
and from otherdonors to support
rapid scale up
Ministry of Healthdatabase on trainingfor community case
management
Training of health surveillanceassistants in community case
management begins withorientation of district staff.Training continues through
mid-2010, with 20–30 peopletrained at a time in each district
Health system support for community casemanagement recognized, with continuing effortsto strengthen supervision and ensure constant stocksof commodities at the community level
Documentation ofprogramimplementation byindependentevaluation team
Assessment ofquality of careunder communitycase management
Assessment of healthsystem supports under
community casemanagement
Retraining and mentoring ofhealth surveillance assistantsconducted in some districts
Demographic and HealthSurvey to assess coverageand mortality
Demographic andHealth Survey orMultiple Indicator
Cluster Surveyto assess coverage
and mortality
Routine monitoring ofimplementation of communitycase management byMinistry of Health and other partners
Policy
The Malawi Health Sector Reform Program of Work for 2004−10 identified community health workers (health surveillance assistants) as a cornerstone of the health system. Salaried members of the health workforce in place for 20 years, health surveillance assistants were given a broader role in delivering primary care services, including treatment of common childhood illness at community level, in the 2008−12 plan.1 In 2009 the Ministry of Health adopted national guidelines and training materials for integrated community management of childhood illness.2 This served as the
basis for a rapid scale-up of functional village health clinics in hard-to-reach areas, with trained health surveillance assistants able to assess sick children, refer those with signs of serious illness and treat diarrhoea, malaria and pneumonia.
Financing
A 2008 grant from the Global Fund to Fight AIDS, Tuberculosis and Malaria enabled the government to double (to 10,000) the size of the health surveillance assistant workforce. Development partners agreed to support implementation of community case
Box 16 The Countdown model at the country level: community case management of childhood illness in Malawi

Building a Future for Women and Children The 2012 Report44
(continued)
management, under Ministry of Health direction, in all 28 districts.
Quality of care provided by community case management−trained workers
In 2009, shortly after the initial rollout of community case management training in selected districts, the Ministry of Health requested an assessment of the quality of care being provided by the health surveillance assistants.3 The results showed that 63% of children with confirmed fever, cough with fast breathing or diarrhoea were treated correctly (figure 2), close to levels of correct treatment in previous studies in similar settings. Inadequate drug stocks contributed to inappropriate treatment of children presenting with fever and diarrhoea (figure 3). The study identified the most common errors in assessment and treatment, and the Ministry of Health used these findings as a basis for strengthening supervision systems and reinforcing areas of performance weakness in retraining and mentoring programmes.
Figure 2. Treatment of sick children by community case management–trained health surveillance assistants in six districts in Malawi
0
20
40
60
80
100
Childrenwith danger
signsneedingreferralwho arereferred
Childrenwith diarrhoea
who areprescribed
oral rehydrationsalts
correctly
Childrenwith feverwho are
prescribedan
antimalarialcorrectly
Childrenwith cough
and fastbreathingwho are
prescribedan
antibioticcorrectly
Children for whom specific case management tasks were performedby health surveillance assistants, six districts in Malawi, 2009 (%)
Source: Nsona and others 2011.
Figure 3. Drug availability varies by type
0
20
40
60
80
100
Oral rehydrationsalts
Antimlarials(any dose)
AntibioticsAll criticaldrugs
Health surveillance assistants with drugs available on the day of the survey, six districts in Malawi, 2009 (%)
Source: Nsona and others 2011.
Health system supports
A companion assessment of health systems support4 and a qualitative study of perceptions about community case management by health surveillance assistants and district health managers5 provided further inputs to ongoing planning. The findings were positive, but the assessments revealed problems with supervision and drug supply. In response to these findings, district managers developed innovative solutions, including training new cadres of supervisors and introducing innovative methods to complement supervision with refresher training and mentoring. For drugs, a new system of tracking community case management commodities was established.
Context matters!
Reproductive, maternal, newborn and child health programmes are affected by the broader environment, including the political, economic, social, technological and environmental factors that affect the strength of implementation and effectiveness of interventions. In Malawi a severe fuel shortage since 2008 has had important negative consequences for the community case management programme—limiting travel for health surveillance assistants and supervisors, slowing the delivery of drugs and contributing to power outages and an economic downturn.6
Box 16 (CoNTINUED) The Countdown model at the country level: community case management of childhood illness in Malawi

Building a Future for Women and Children The 2012 Report 45
Monitoring and evaluation as tools in effective programme management
The Malawi community case management programme has effectively used monitoring and evaluation, including routine tracking of programme activities and periodic assessments and surveys, to establish a process of continuous programme improvement. The policy foundation for community case management, coupled with adequate financing and attention to health systems supports, has supported a strong initial rollout. The results of these efforts (and the potential negative effects of the fuel
crisis) will be measured in a national household survey planned for mid-2013 to measure the proportions of children under age 5 with fever or malaria, presumed pneumonia and diarrhoea who receive lifesaving treatment.
Notes1. Malawi Ministry of Health 2007.
2. Government of Malawi, WHo and UNICEF 2008.
3. Nsona 2011.
4. Callaghan 2011.
5. Callaghan-Koru and others forthcoming.
6. Malawi Energy Regulatory Authority n.d.
Box 16 (CoNTINUED) The Countdown model at the country level: community case management of childhood illness in Malawi
An examination of changes in equity of coverage over time in 28 Countdown countries with at least two surveys since 2000 (with a median of five years between surveys) that had data by wealth quintile found that the 11 countries with rapid change (an increase of 7 percentage points or more between surveys) in the composite coverage index were particularly successful at improving coverage among the poorest (see figure). This was not the case for countries with moderate (an increase of 2–6.9 percentage points between surveys) or no change (an increase of less than 2 percentage points). It could be argued that women and children in the wealthiest quintile in the rapid change group had already reached such high coverage that no further increases were possible, but this was not true because average coverage in the first survey was 72%, leaving substantial room for increase.
These findings yield an important policy message: increasing coverage at the national level depends on
how well the poorest groups in the population are being reached.
Increasing coverage at the national level requires targeting the poorest groups
0
3
6
9
12
15
Change in composite coverage index, by wealth quintile,11 Countdown countries with the fastest coverage gainssince 2000 (percentage points)
Poorest Second Middle Fourth Richest
Source: Demographic and Health Surveys and Multiple Indicator
Cluster Surveys.
Box 17 Success means reaching the poor

Building a Future for Women and Children The 2012 Report46
(continued)
Increasing intervention coverage is important, but will result in mortality reduction only if interventions are delivered at adequate levels of quality. At the country level monitoring service quality is an essential part of program management. Standard indicators of quality and feasible measurement methods are needed to support these efforts.
WHo and partners have been working on indicators of the quality of care in maternal, newborn and child health services at the facility level. These indicators are intended for routine measurement, with the results used to improve services. The indicators cover health service readiness, audits, interventions actually received (for example, during family planning consultations, antenatal care visits, labour and childbirth and postnatal care visits) and other measures of service quality, including:• Availability of trained personnel.• Availability of essential drugs and commodities
(such as vaccines, antibiotics, oxytocin, syphilis and HIV tests, rapid malaria tests, oral rehydration solutions and the like).
• Interventions received by women and children (such as oxytocin for women in the third stage of labour to prevent haemorrhage and oral rehydration solutions and zinc for children with diarrhoea and dehydration).
• Maternal (and where feasible, perinatal) death reviews.• other indicators of quality of care (such as the fresh
stillbirth1 rate).• Maternal or parent satisfaction with services received.
Standard methods for assessing the quality of Integrated Management of Childhood Illness in health facilities have been available for many years and are used by countries
to monitor progress and improve programmes.2 Figure 1 compares results on the performance of first-level health workers in conducting an integrated assessment of the sick child, using a summary index based on 10 assessment tasks that health workers should complete for every child under age 5 who presents for care.3 These and similar results are used by ministries of health and their partners to improve the effectiveness of their Integrated Management of Childhood Illness training and supervision. Methods have also been developed to assess the quality of child health care delivered at the community level as a part of the Catalytic Initiative to Save a Million lives, an international partnership aimed at strengthening health systems to accelerate progress towards Millennium Development Goals 4 and 5. The tools have been used in Ethiopia and Malawi (see box 16) and are available for adaptation and use in other settings.4
More recently, methods have been developed to assess the quality of care during pregnancy and around the time of childbirth. Facility surveys conducted in representative samples of health facilities in Ethiopia, Kenya, Madagascar, Rwanda and Tanzania (mainland and Zanzibar) with support from the USAID-supported Maternal and Child Health Integrated Program assessed various indicators (figure 2).5 The results are being used by the ministries of health in these countries and their partners to improve the supply chains for essential drugs and commodities.
Countdown will continue to participate in efforts to improve measurement of quality of care indicators and to develop feasible, routine measurement methods that produce results representative of services received by the population.
Box 18 Quality counts!
content of the basic service packages and serves as an important starting point for helping countries prioritize specific interventions and service delivery strategies (based on their current disease burden and health system functionality). A companion report on the essential supportive policies required for scaling up these essential interventions is under preparation.
Progress in perspective: increasing the quality of services delivered
Countdown recognizes that coverage gains will translate into improved maternal, newborn and child health only if services are delivered at a
level of quality that will lead to impact (box 18). Countdown is expanding its efforts to examine the health system and other factors related to quality of care and will include more reporting on service quality in future publications.
There are different components of success, all of which are equally important: ensuring that policies and programmes are in place and being implemented, promoting equity in coverage, identifying and disseminating cost-effective interventions and ensuring that they are delivered with high quality.

Building a Future for Women and Children The 2012 Report 47
Figure 1. Assessing the quality of child health care using Integrated Management of Childhood Illness health facility surveys
0
20
40
60
80
100
Mongoliaa
(2006)Malawi(2009)
Ethiopia(2008)
Ecuadora
(2011)Cambodia
(2010)
Index of integrated assessment of sick children under age 5presenting for care at public health facilities (%)
a. Not a Countdown country; data shown to reflect variability in IMCI
assessments.
Notes1. A fresh stillbirth is a death that occurs immediately before or during
labour or childbirth.
2. www.who.int/imci-mce/Methods/HF_survey.htm
3. Health facility surveys to assess the quality of care delivered
to children first-level facilities conducted by ministries of health in
collaboration with UNICEF, WHO and selected partners, 2006–11.
Figure 2. Quality of care indicators for services during pregnancy and childbirth
Indicators of care quality measured through service quality assessments in samples of health facilities
Medicines for emergencyobstetric care present in delivery room
0
20
40
60
80
100
Magnesium sulphateOxytocinSyphilis testconducted during
antenatal visit
Madagascar ZanzibarKenya TanzaniaEthiopia Rwanda
Note: The indicators shown here are those for which data were
available for at least three countries. They do not represent the full
spectrum of quality measures.
4. See www.jhsph.edu/dept/ih/IIP/projects/catalyticinitiative.html for
a report on the application in Malawi and the survey protocols and
tools.
5. www.mchip.net/resources and www.mchip.net/
QoCMCHIPsurveys.
BOx 18 (CONTINUEd) Quality counts!

Building a Future for Women and Children The 2012 Report48
Accountability now for Millennium Development Goals 4 and 5
Many lives are being saved in Countdown countries through increased access to effective, high-quality health services, nutrient-rich foods and improved water and sanitation facilities. However, the data show that more progress is needed. Progress depends on everyone—governments, development partners, public health researchers, professional societies, nongovernmental organizations, communities, the media and the private sector—working together to fulfil our commitments to women and children.
Accountability requires action. Together success can be achieved by making the following actions a reality:
Invest in saving women’s and children’s lives.
• Advocate for increased funding for reproductive, maternal, newborn and child health at the global and national levels and support efforts to track and monitor funding.
• Make sure that global and national financing mechanisms support increased access to essential interventions and elimination of coverage gaps and inequities.
• Encourage alignment and harmonization by strengthening links across health financing mechanisms as called for by the Global Strategy for Women’s and Children’s Health, the Paris Declaration on Aid Effectiveness and the Accra Agenda for Action.
• Develop national and local strategies to reduce out-of-pocket spending for health.
• Support research to fill knowledge gaps on what works to improve maternal, newborn, and child survival and reduce stillbirths and preterm births.
Implement strategies to increase evidence-based decisionmaking.
• Strengthen global and national processes for using available data for setting priorities, targeting and planning as well as monitoring and evaluation of policies and programmes.
• Strengthen civil registration, vital statistics and routine health information systems, including periodic household surveys.
• Monitor inequities in coverage and quality of essential reproductive, maternal, newborn and child health interventions within and between countries and develop locally appropriate strategies to address them.
Implement laws and policies to promote universal coverage.
• Identify and implement solutions for gaps in the laws and policies needed to support the equitable delivery of essential reproductive, maternal, newborn and child health interventions.
Innovate to improve service delivery.
• Promote technological and other innovations in service delivery strategies to increase coverage, reduce inequities and improve the quality of essential reproductive, maternal, newborn and child health interventions.
• Address supply chain problems, human resources shortages and other bottlenecks to the availability of essential services.
• Integrate the delivery of effective reproductive, maternal, newborn and child health interventions to maximize the number of women and children reached.

Building a Future for Women and Children The 2012 Report 49
Inform and communicate to build effective partnerships.
• Communicate what needs to be done, targeting decisionmakers, implementing agencies, advocates and others.
• Strengthen intersectoral links for implementation of essential reproductive, maternal, newborn and child health interventions (such as water and sanitation to reduce the risk of disease transmission, transportation systems to increase access to emergency care, agricultural programmes to ensure food security and education systems to increase health literacy).
• Build stronger links across key national planning and development agencies (planning commission, ministries of finances and the like).
• Use data on reproductive, maternal, newborn and child health to engage in global policy dialogue on sustainable development (for example, Rio +20, G8 and G20 processes, development of the post-2015 framework and the like).
Countdown to success: taking action at the global and country levelsIn keeping with the global Accountability Agenda set out by the Commission on Information and Accountability for Women’s and Chidlren’s Health, Countdown is committed to annual reporting and analysis of country-specific information on the core Commission indicators and regular reporting on the full range of Countdown coverage, equity, health systems, health policies, and financing indicators.
Countdown recognizes that success in catalysing progress, ensuring accountability and helping the millions of women and children whose lives depend on access to effective health interventions will ultimately be measured by results in countries. Countdown is increasing its efforts to encourage and support countries to conduct their own country-level Countdowns, based on subnational profiles (by region, province or district) that are used to strengthen and stimulate political commitment and strategic planning. By engaging in a Countdown process, governments, parliamentarians, academics, civil society, media and other stakeholders can learn from successes and understand and develop solutions for remaining challenges in reaching high, equitable coverage of
effective reproductive, maternal, newborn and child health interventions in their countries.
Experience in several countries demonstrates that adopting a Countdown process can be a force for change. In 2006 Senegal became the first country to hold a national Countdown conference, bringing together government leaders, private and public partners and the academic community to develop a new child survival plan. Zambia held a national Countdown conference in 2008, resulting in important actions including a significant expansion of national capacity for midwife training. Nigeria has embarked on a national strategy, modelled on Countdown, that includes production of maternal and child health profiles for its 36 states, highlighting geographic inequities and opportunities to make concrete progress on coverage.
Because every country starts with its own unique set of baseline conditions, policy and planning approaches, health objectives and contextual factors, there is no single model for implementing a country Countdown. All Countdown processes, however, will:
• Be aligned with and linked to the existing national planning processes for reproductive, maternal, newborn and child health.
• Be organized and led by a broad range of in-country partners from multiple sectors, including academics, nongovernmental organizations, professional associations, parliamentarians and the private sector as well as the ministry of health, donors and UN agencies.
• Be focused on tracking coverage across subnational units for key, proven health interventions and on measuring equity of coverage across socioeconomic and demographic factors, including ethnicity, wealth, gender and geography.
• Engage national scientists and other academics in identifying critical indicators, compiling and assessing national and subnational data and objectively analysing the results
• Contribute to building country capacity to evaluate ongoing programmes and initiatives at the national and subnational levels.
• Produce profiles and reports to provide an ongoing report card on progress and remaining gaps.

Building a Future for Women and Children The 2012 Report50
• Culminate in a conference or other event to exchange ideas, develop consensus on objectives and action plans, attract media and public attention to women’s and children’s health issues and foster accountability
Technical support and guidance is available from Countdown to 2015 and its members for countries wishing to initiate a country Countdown process.
A tool kit is being prepared for countries to use in planning and implementing national Countdown processes.
More information on activities, achievements, directions forward and how to get involved in Countdown is available at www.countdown2015 mnch.org.