building a demand driven supply chain - apics-fraservalley.org · all material and material ©...
TRANSCRIPT
All material and material © copyright Demand Driven Institute, LLC 2014, all rights reserved
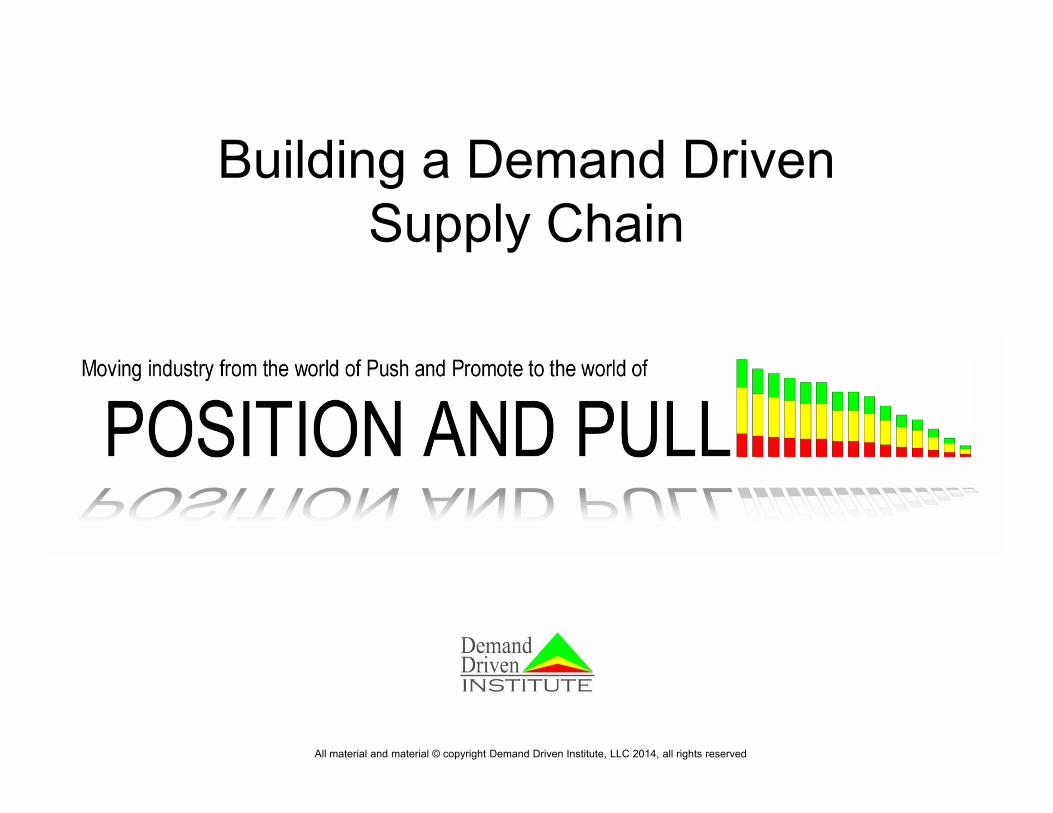
Building a Demand Driven Supply Chain
All material and material © copyright Demand Driven Institute, LLC 2014, all rights reserved
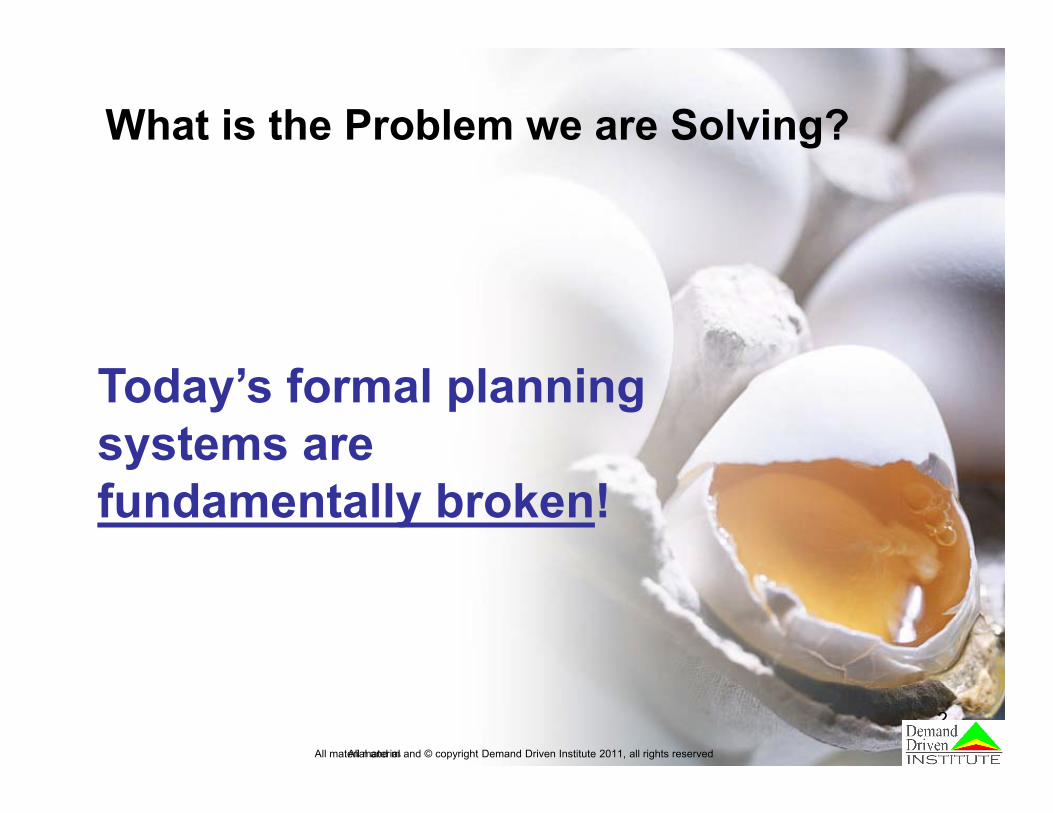
Today’s formal planning systems arefundamentally broken!
What is the Problem we are Solving?
All material and © copyright Demand Driven Institute 2011, all rights reserved
2
All material and material © copyright Demand Driven Institute, LLC 2014, all rights reserved
3
Old Rules, Old Tools, New Pressures
• Forecast error is on the rise• Supply Chain Complexity and Volatility is increasing• Legacy planning tactics and tools are breaking down
► Inside most modern ERP systems is MRP► 79% of ERP Buyers implement MRP► Conceived in the 1950’s► Codified in the 1960’s► Commercialized in the 1970’s and… ► …it hasn’t changed
All material and material © copyright Demand Driven Institute, LLC 2014, all rights reservedDDMRP Intro4
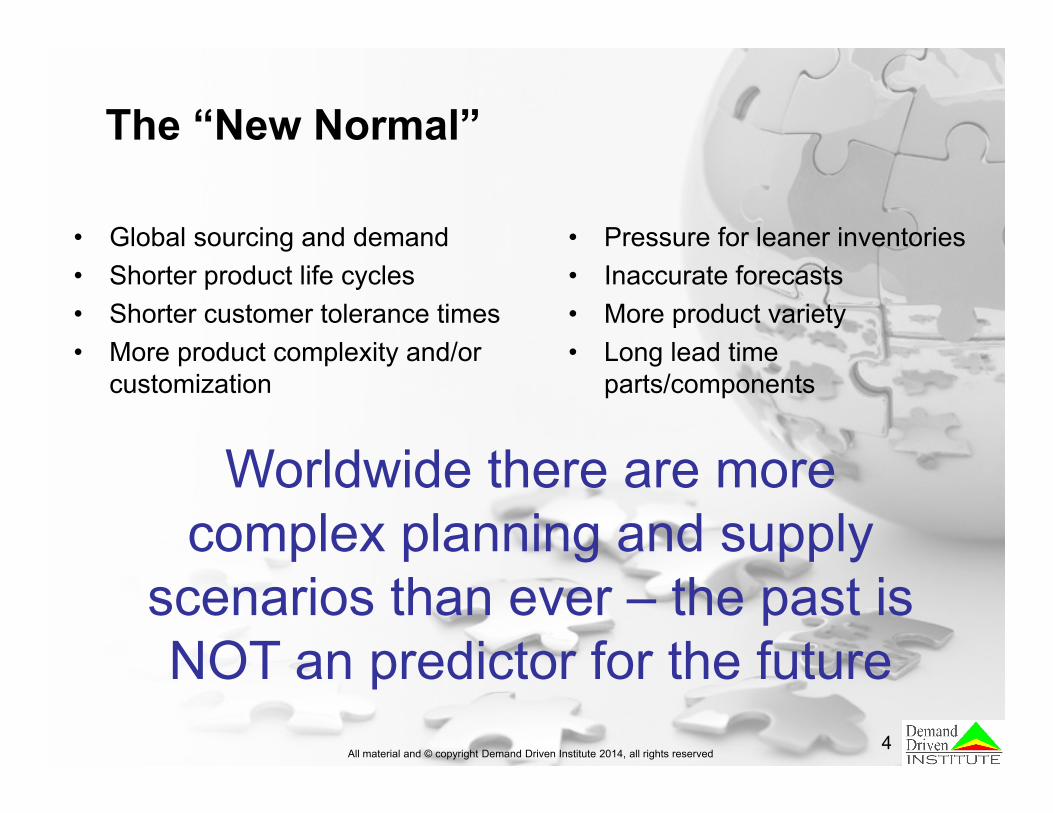
The “New Normal”
• Pressure for leaner inventories• Inaccurate forecasts• More product variety• Long lead time
parts/components
4All material and © copyright Demand Driven Institute 2014, all rights reserved
• Global sourcing and demand• Shorter product life cycles• Shorter customer tolerance times• More product complexity and/or
customization
Worldwide there are more complex planning and supply
scenarios than ever – the past is NOT an predictor for the future
All material and material © copyright Demand Driven Institute, LLC 2014, all rights reserved
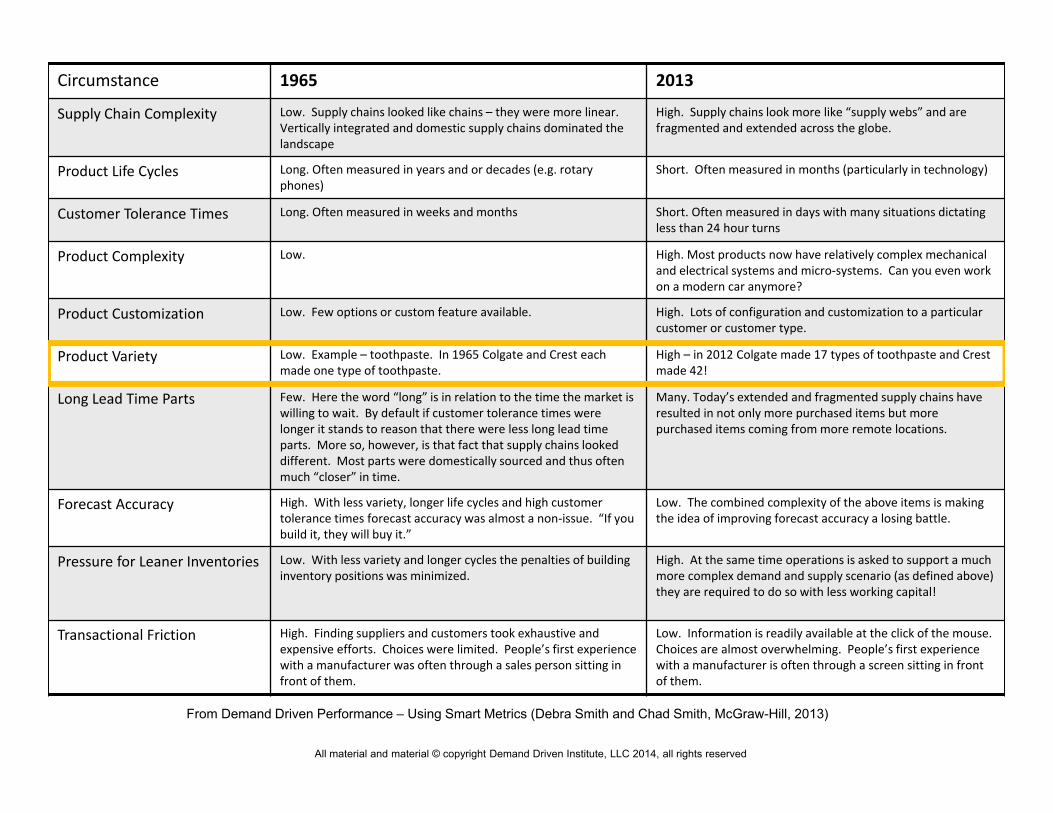
Circumstance 1965 2013
Supply Chain Complexity Low. Supply chains looked like chains – they were more linear. Vertically integrated and domestic supply chains dominated the landscape
High. Supply chains look more like “supply webs” and are fragmented and extended across the globe.
Product Life Cycles Long. Often measured in years and or decades (e.g. rotary phones)
Short. Often measured in months (particularly in technology)
Customer Tolerance Times Long. Often measured in weeks and months Short. Often measured in days with many situations dictating less than 24 hour turns
Product Complexity Low. High. Most products now have relatively complex mechanical and electrical systems and micro‐systems. Can you even work on a modern car anymore?
Product Customization Low. Few options or custom feature available. High. Lots of configuration and customization to a particular customer or customer type.
Product Variety Low. Example – toothpaste. In 1965 Colgate and Crest each made one type of toothpaste.
High – in 2012 Colgate made 17 types of toothpaste and Crest made 42!
Long Lead Time Parts Few. Here the word “long” is in relation to the time the market is willing to wait. By default if customer tolerance times were longer it stands to reason that there were less long lead time parts. More so, however, is that fact that supply chains looked different. Most parts were domestically sourced and thus often much “closer” in time.
Many. Today’s extended and fragmented supply chains have resulted in not only more purchased items but more purchased items coming from more remote locations.
Forecast Accuracy High. With less variety, longer life cycles and high customer tolerance times forecast accuracy was almost a non‐issue. “If you build it, they will buy it.”
Low. The combined complexity of the above items is making the idea of improving forecast accuracy a losing battle.
Pressure for Leaner Inventories Low. With less variety and longer cycles the penalties of building inventory positions was minimized.
High. At the same time operations is asked to support a much more complex demand and supply scenario (as defined above) they are required to do so with less working capital!
Transactional Friction High. Finding suppliers and customers took exhaustive and expensive efforts. Choices were limited. People’s first experience with a manufacturer was often through a sales person sitting in front of them.
Low. Information is readily available at the click of the mouse. Choices are almost overwhelming. People’s first experience with a manufacturer is often through a screen sitting in front of them.
From Demand Driven Performance – Using Smart Metrics (Debra Smith and Chad Smith, McGraw-Hill, 2013)
All material and material © copyright Demand Driven Institute, LLC 2014, all rights reservedDDMRP Intro6
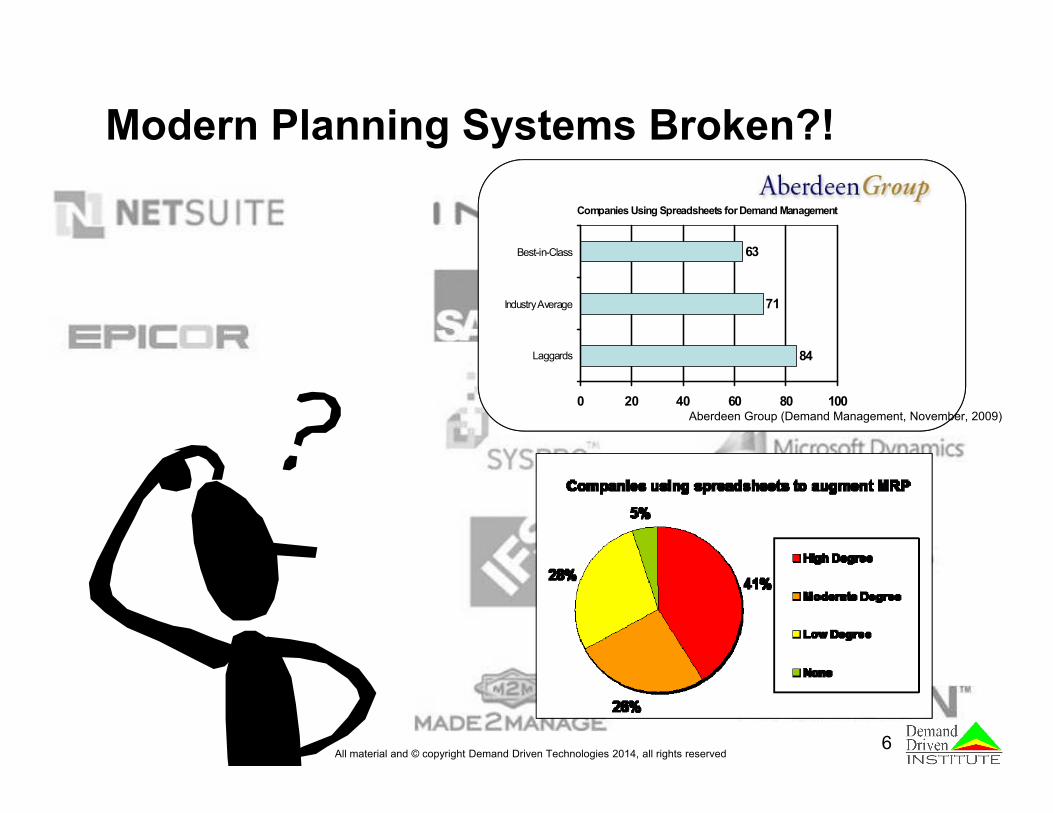
Companies Using Spreadsheets for Demand Management
84
71
63
0 20 40 60 80 100
Laggards
Industry Average
Best-in-Class
Aberdeen Group (Demand Management, November, 2009)
6
Modern Planning Systems Broken?!
All material and © copyright Demand Driven Technologies 2014, all rights reserved
All material and material © copyright Demand Driven Institute, LLC 2014, all rights reserved
Poll Question #1What would happen to your planning and
scheduling capability if you lost your Microsoft Office License?
All material and material © copyright Demand Driven Institute, LLC 2014, all rights reserved
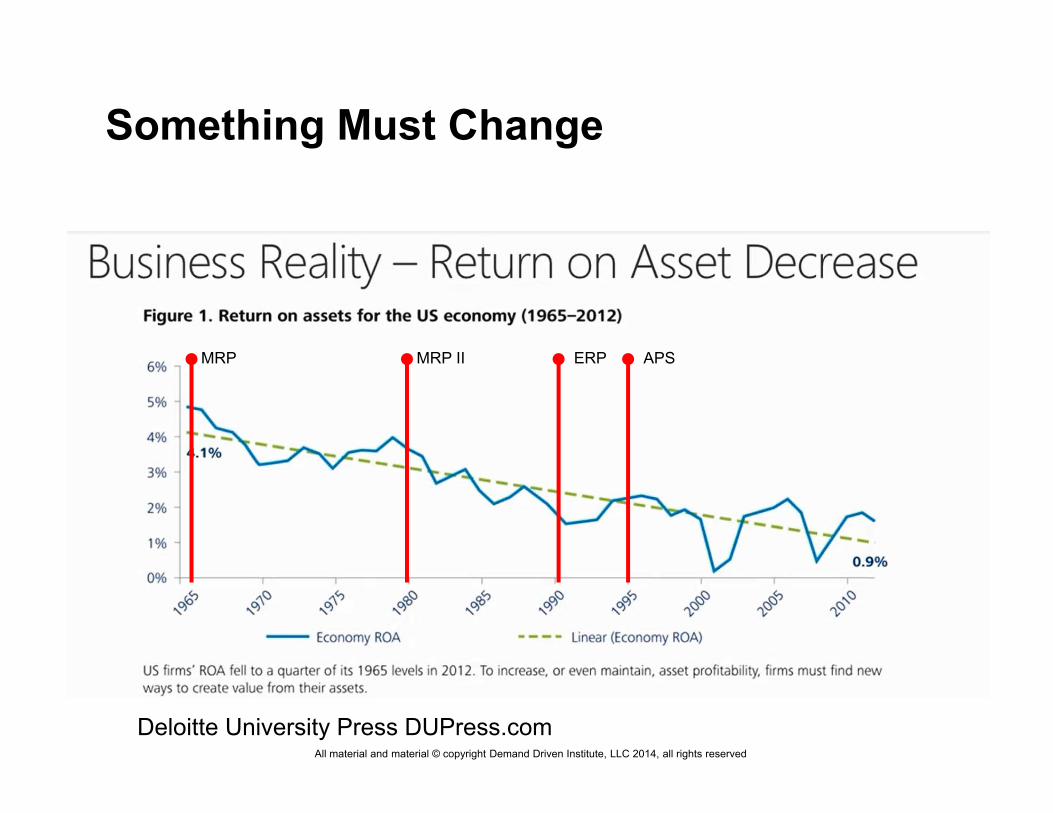
Something Must Change
Deloitte University Press DUPress.com
MRP MRP II ERP APS

All material and material © copyright Demand Driven Institute, LLC 2014, all rights reserved
Where to Start?
All material and material © copyright Demand Driven Institute, LLC 2014, all rights reserved
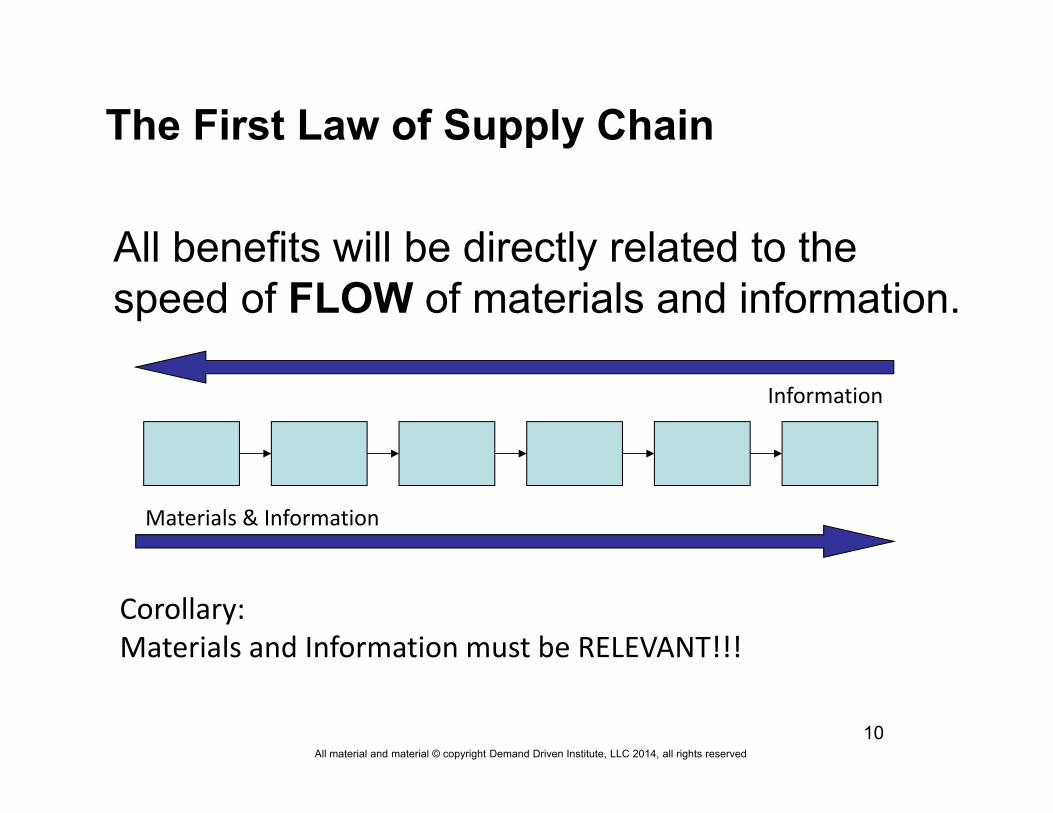
10
The First Law of Supply Chain
All benefits will be directly related to the speed of FLOW of materials and information.
Materials & Information
Information
Corollary:Materials and Information must be RELEVANT!!!
All material and material © copyright Demand Driven Institute, LLC 2014, all rights reserved
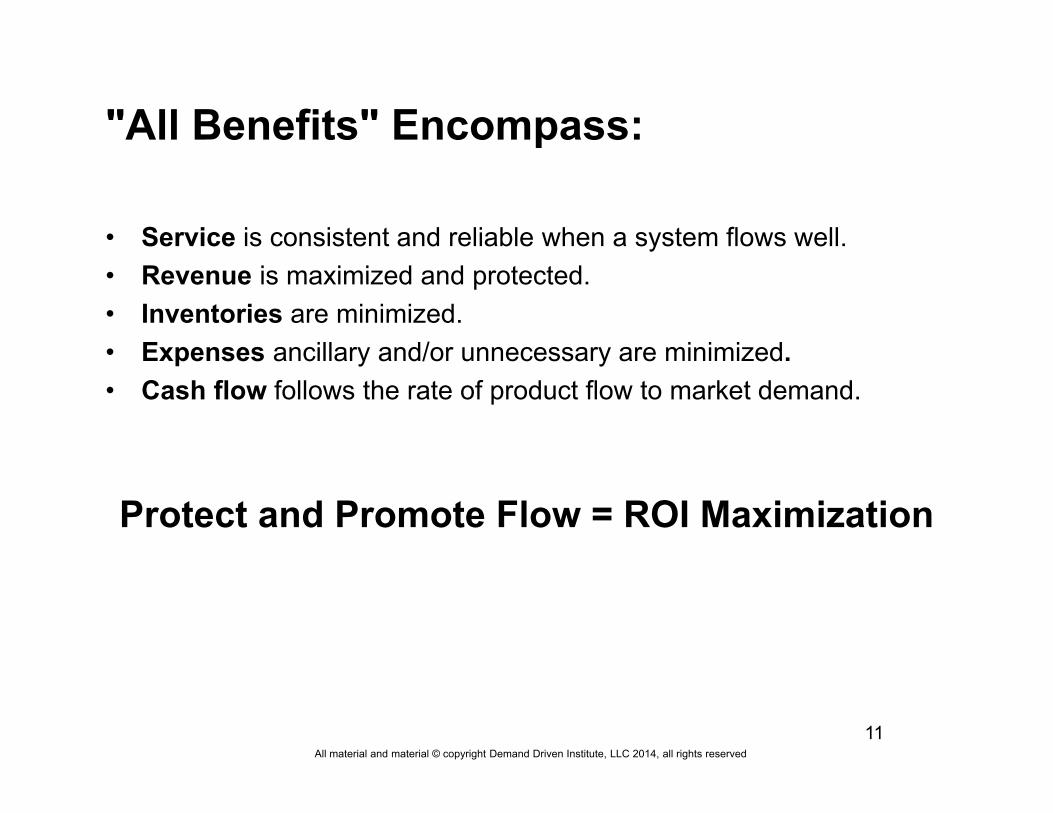
"All Benefits" Encompass:
• Service is consistent and reliable when a system flows well.• Revenue is maximized and protected.• Inventories are minimized. • Expenses ancillary and/or unnecessary are minimized.• Cash flow follows the rate of product flow to market demand.
Protect and Promote Flow = ROI Maximization
11
All material and material © copyright Demand Driven Institute, LLC 2014, all rights reserved
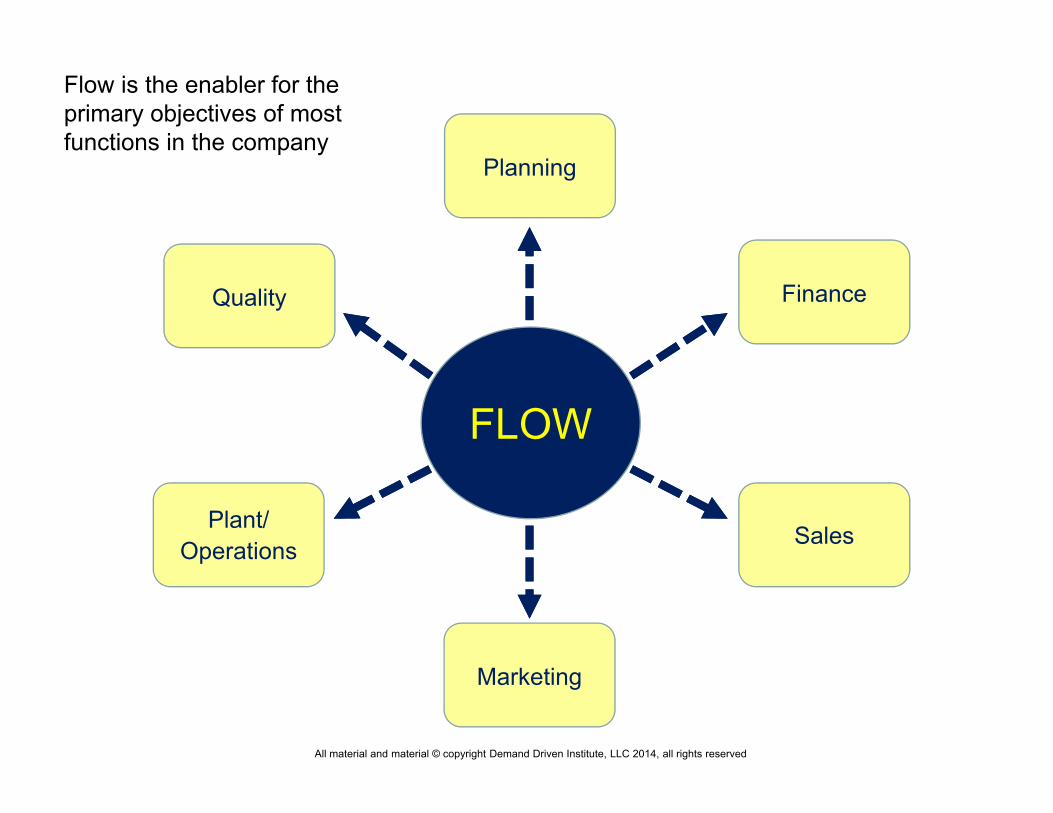
FLOW
Flow is the enabler for the primary objectives of most functions in the company
Planning
Finance
Sales
Marketing
Quality
Plant/ Operations
All material and material © copyright Demand Driven Institute, LLC 2014, all rights reserved
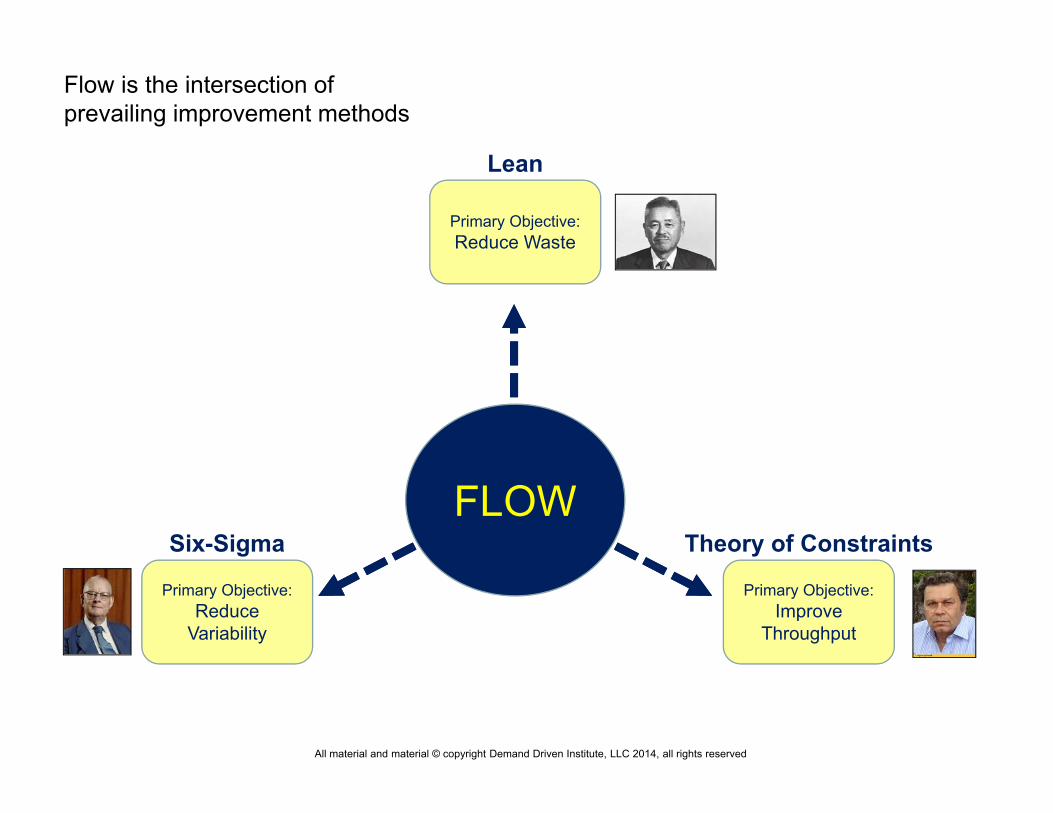
FLOW
Flow is the intersection of prevailing improvement methods
Primary Objective:Reduce Waste
Lean
Primary Objective:Reduce
Variability
Six-Sigma
Primary Objective:Improve
Throughput
Theory of Constraints
All material and material © copyright Demand Driven Institute, LLC 2014, all rights reserved
14
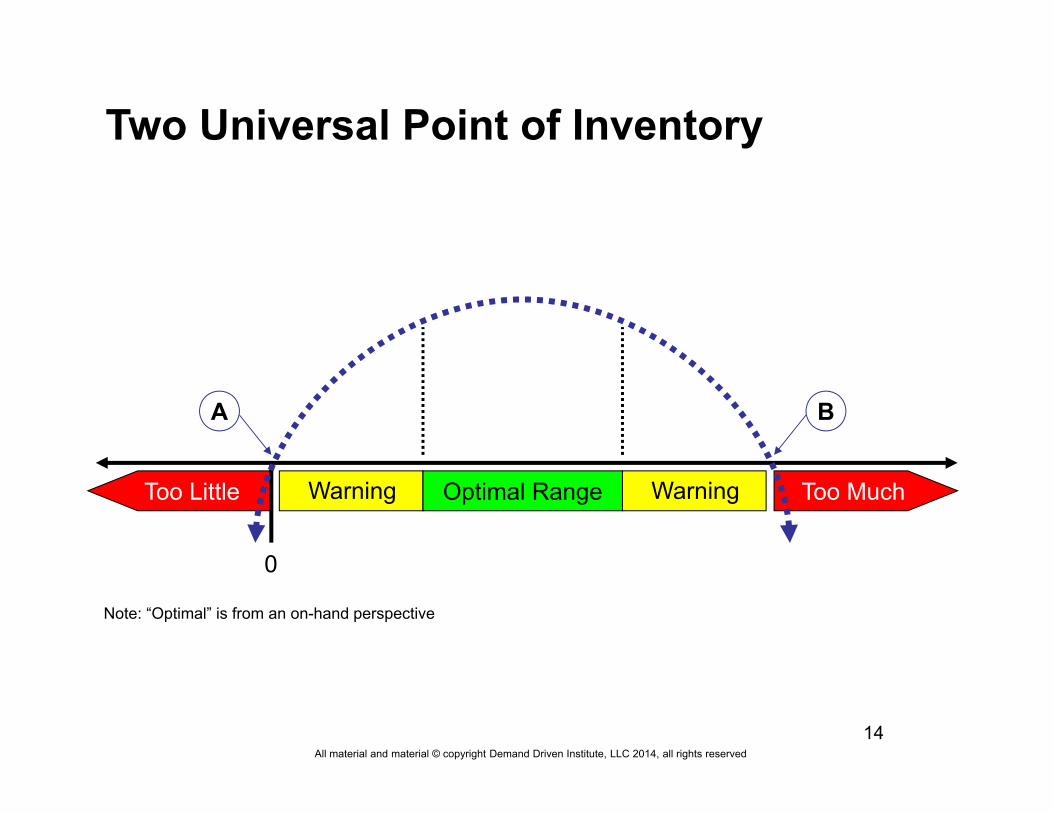
Two Universal Point of Inventory
Too MuchToo Little
A B
0
Optimal RangeWarning Warning
Note: “Optimal” is from an on-hand perspective
All material and material © copyright Demand Driven Institute, LLC 2014, all rights reserved
15
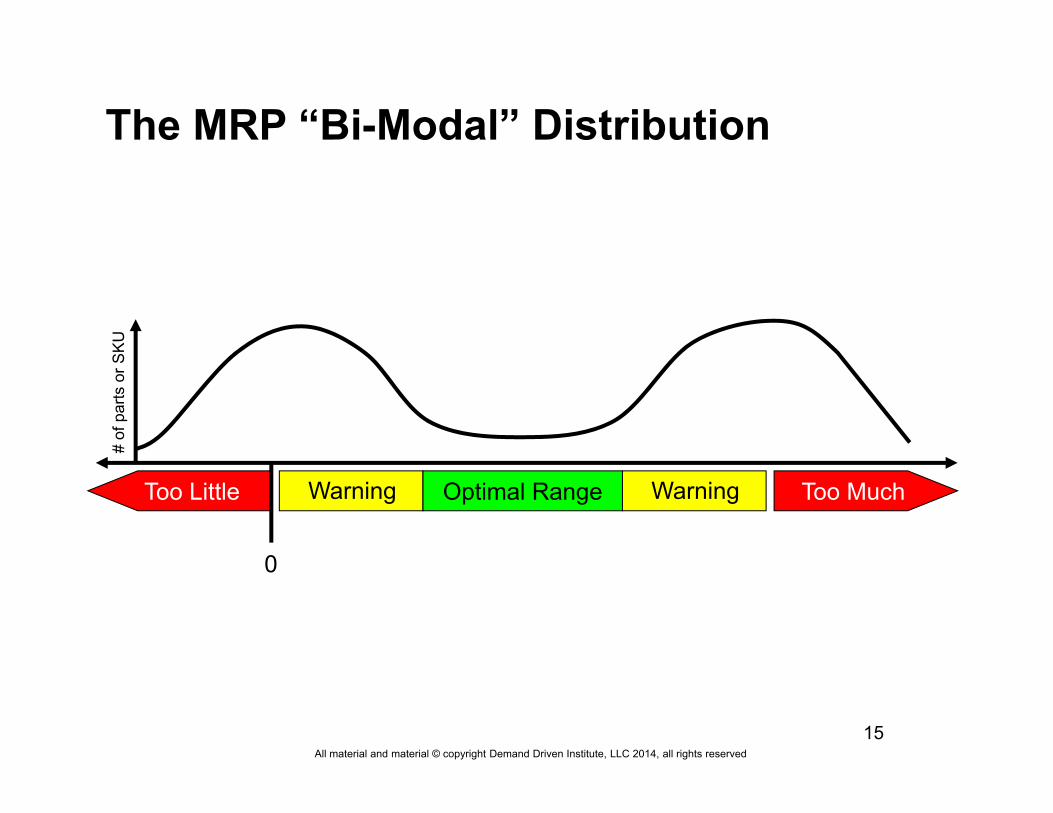
The MRP “Bi-Modal” Distribution
Too MuchToo Little Optimal Range
# of
par
ts o
r SKU
Warning Warning
0
All material and material © copyright Demand Driven Institute, LLC 2014, all rights reserved
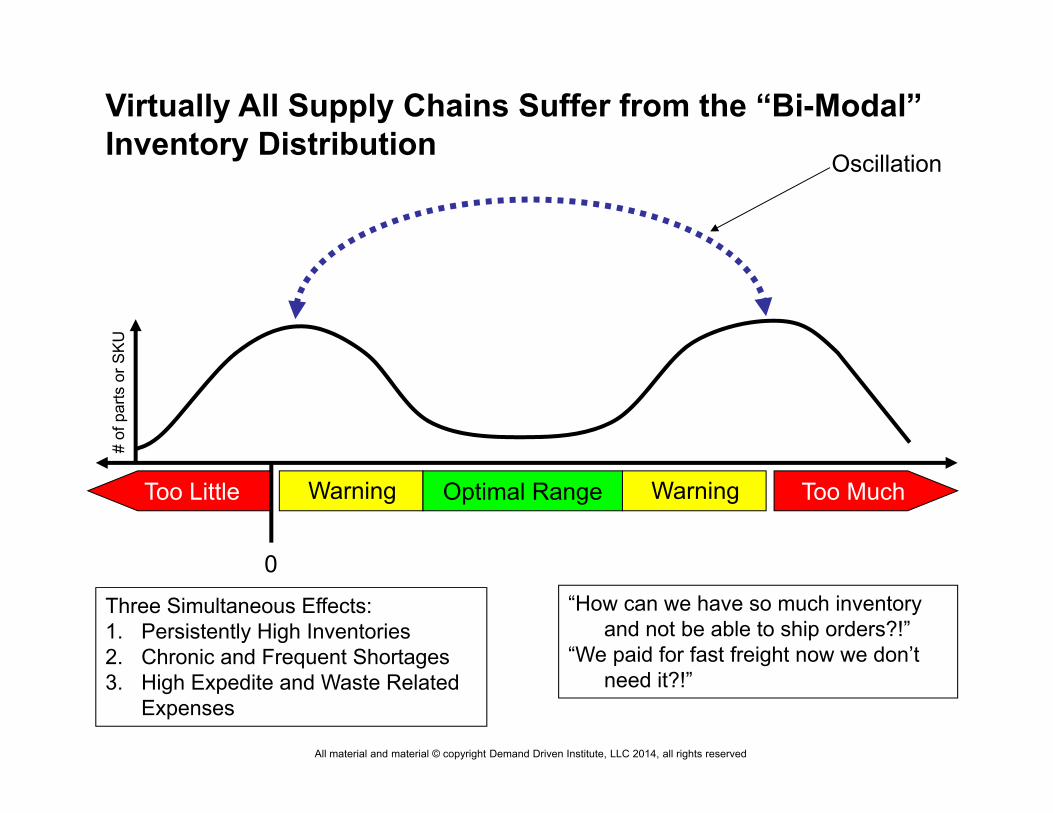
Virtually All Supply Chains Suffer from the “Bi-Modal” Inventory Distribution
Too MuchToo Little Optimal Range
# of
par
ts o
r SKU
Warning Warning
Oscillation
0Three Simultaneous Effects:1. Persistently High Inventories2. Chronic and Frequent Shortages3. High Expedite and Waste Related
Expenses
“How can we have so much inventory and not be able to ship orders?!”
“We paid for fast freight now we don’t need it?!”
All material and material © copyright Demand Driven Institute, LLC 2014, all rights reserved
Poll Question #2Do you have the bi-modal distribution in your
business?
All material and material © copyright Demand Driven Institute, LLC 2014, all rights reserved
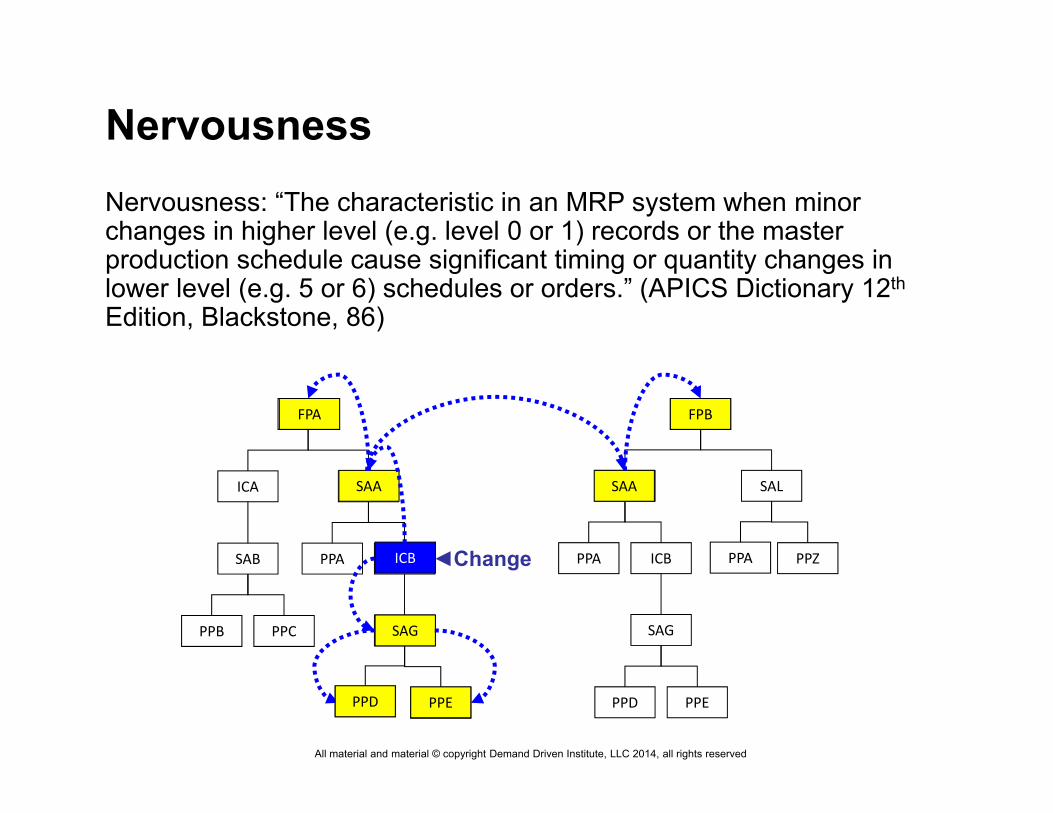
FPA
ICA SAA
SAB ICB
PPB PPC
PPA
SAG
PPEPPD
FPB
SAL
PPZPPA
SAA
ICBPPA
SAG
PPEPPD
◄ChangeICB
SAA
FPA
SAG
PPEPPD
SAA
FPB
NervousnessNervousness: “The characteristic in an MRP system when minor changes in higher level (e.g. level 0 or 1) records or the master production schedule cause significant timing or quantity changes in lower level (e.g. 5 or 6) schedules or orders.” (APICS Dictionary 12th
Edition, Blackstone, 86)

All material and material © copyright Demand Driven Institute, LLC 2014, all rights reserved
See How Nervousness Happens in MRP
19
All material and material © copyright Demand Driven Institute, LLC 2014, all rights reserved
20
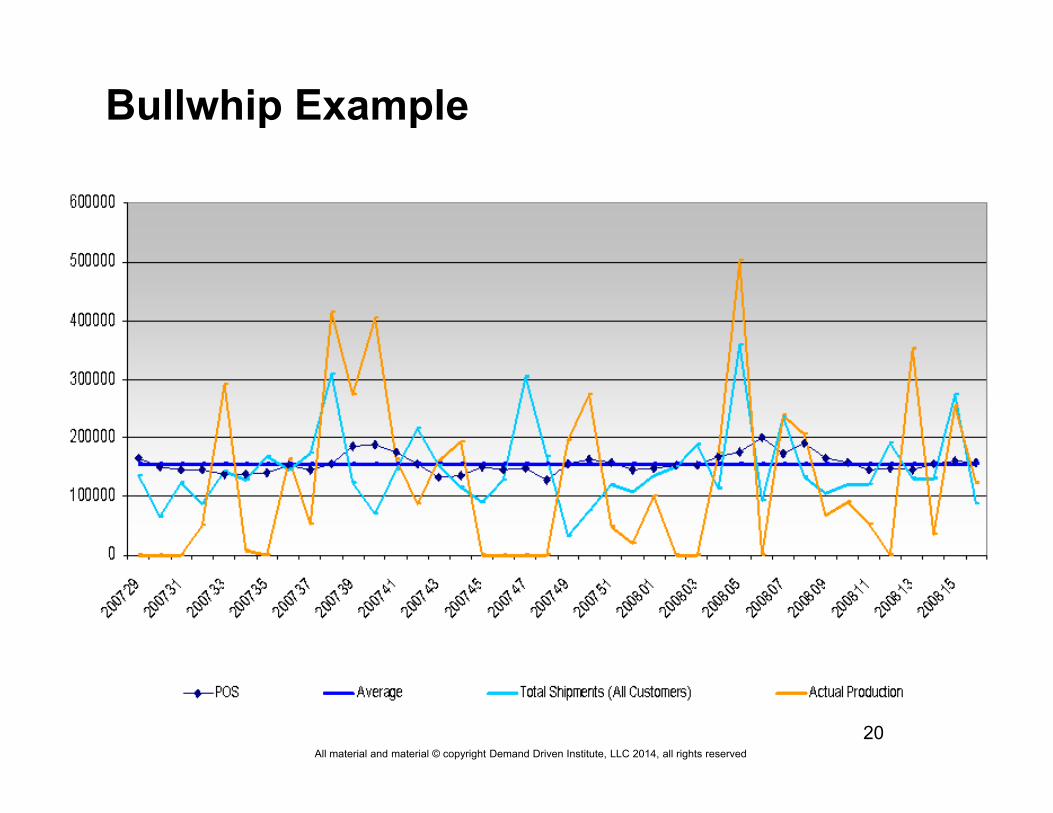
Bullwhip Example
All material and material © copyright Demand Driven Institute, LLC 2014, all rights reserved
21
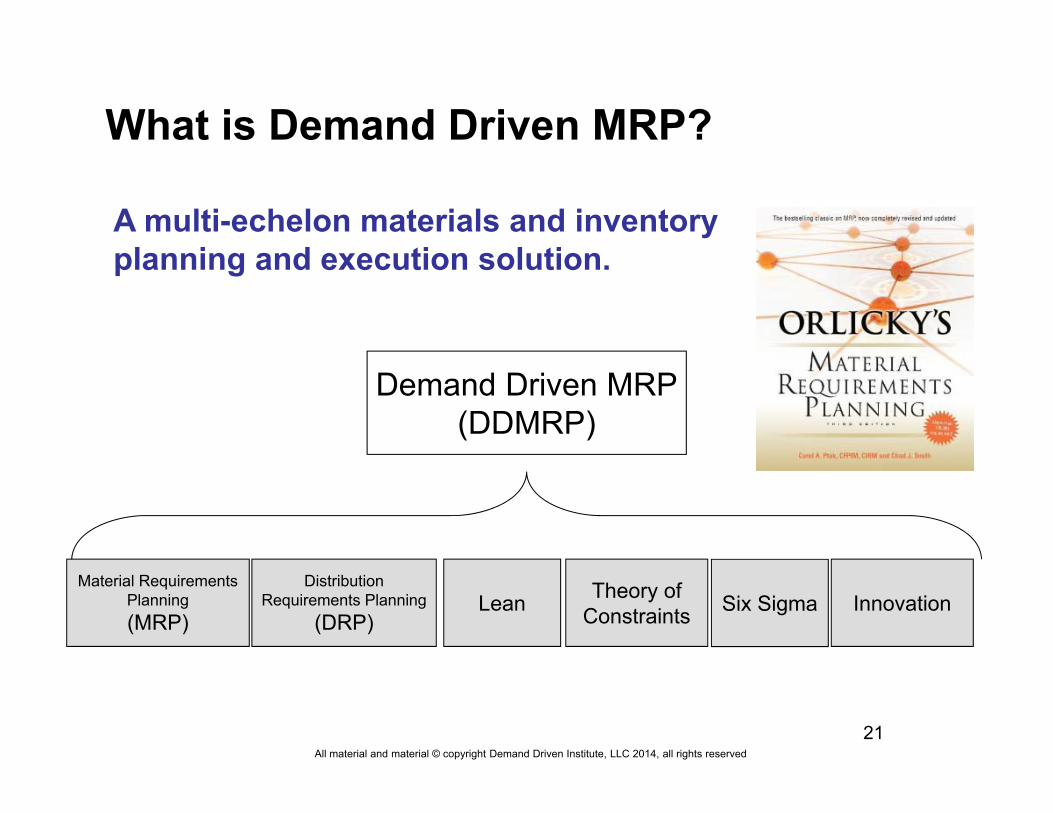
What is Demand Driven MRP?
Material Requirements Planning(MRP)
Distribution Requirements Planning
(DRP)Lean Theory of
Constraints Innovation
Demand Driven MRP(DDMRP)
A multi-echelon materials and inventory planning and execution solution.
Six Sigma
All material and material © copyright Demand Driven Institute, LLC 2014, all rights reserved
22
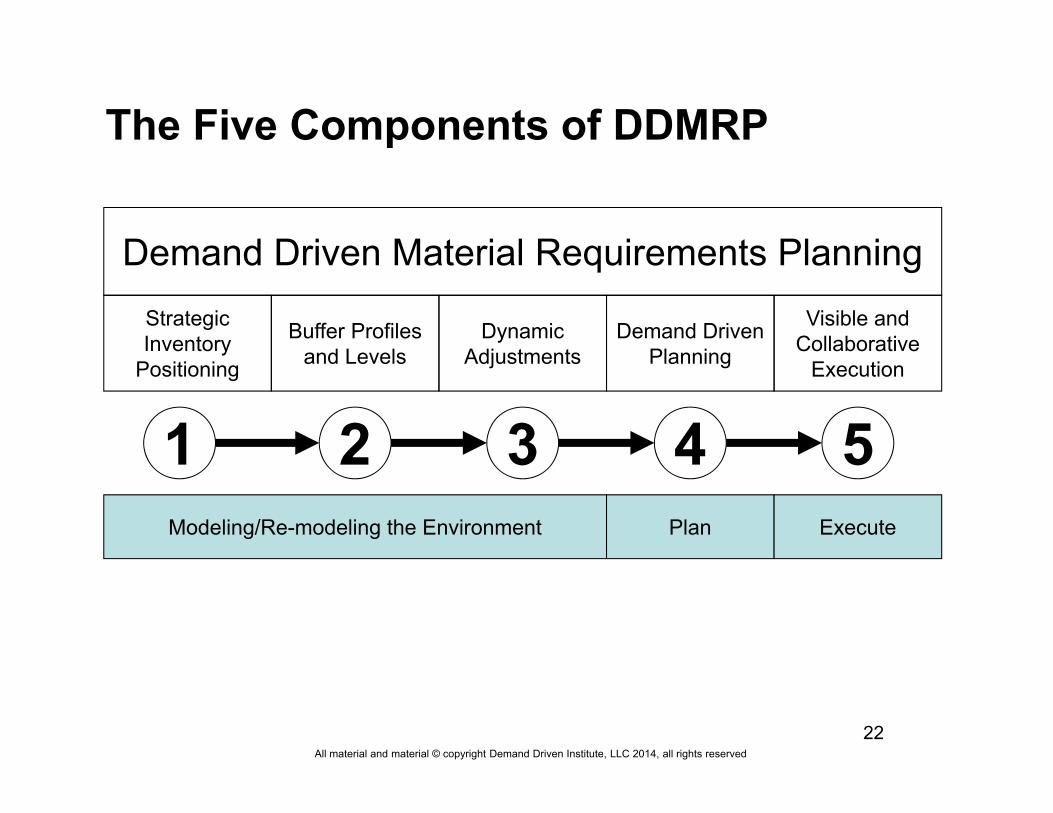
Demand Driven Material Requirements PlanningStrategic Inventory
Positioning
1
Buffer Profiles and Levels
2
Dynamic Adjustments
3
Demand Driven Planning
4
Visible and Collaborative
Execution
5Modeling/Re-modeling the Environment Plan Execute
The Five Components of DDMRP
All material and material © copyright Demand Driven Institute, LLC 2014, all rights reserved
23
Demand Driven Material Requirements PlanningStrategic Inventory
Positioning
Buffer Profiles and Levels
Dynamic Adjustments
Demand Driven Planning
Visible and Collaborative
Execution
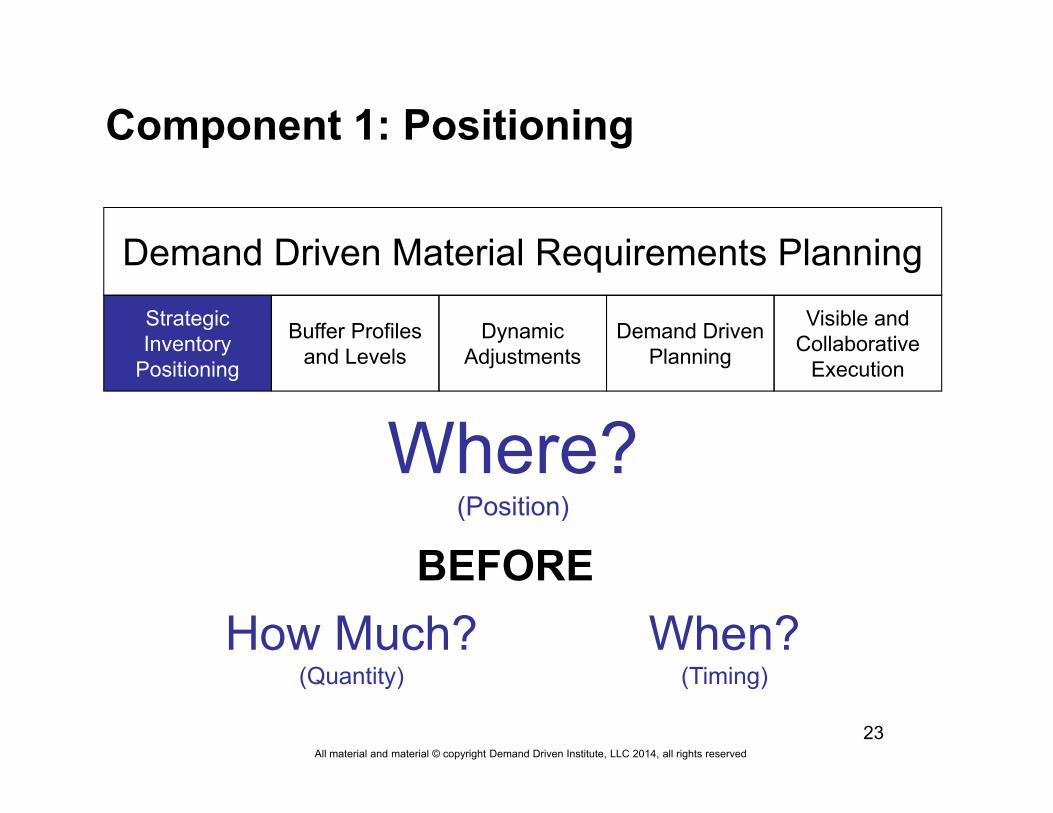
Component 1: Positioning
Where?(Position)
BEFOREHow Much?
(Quantity)When?
(Timing)
All material and material © copyright Demand Driven Institute, LLC 2014, all rights reserved
24
Demand Driven Material Requirements PlanningStrategic Inventory
Positioning
Buffer Profiles and Levels
Dynamic Adjustments
Demand Driven Planning
Visible and Collaborative
Execution
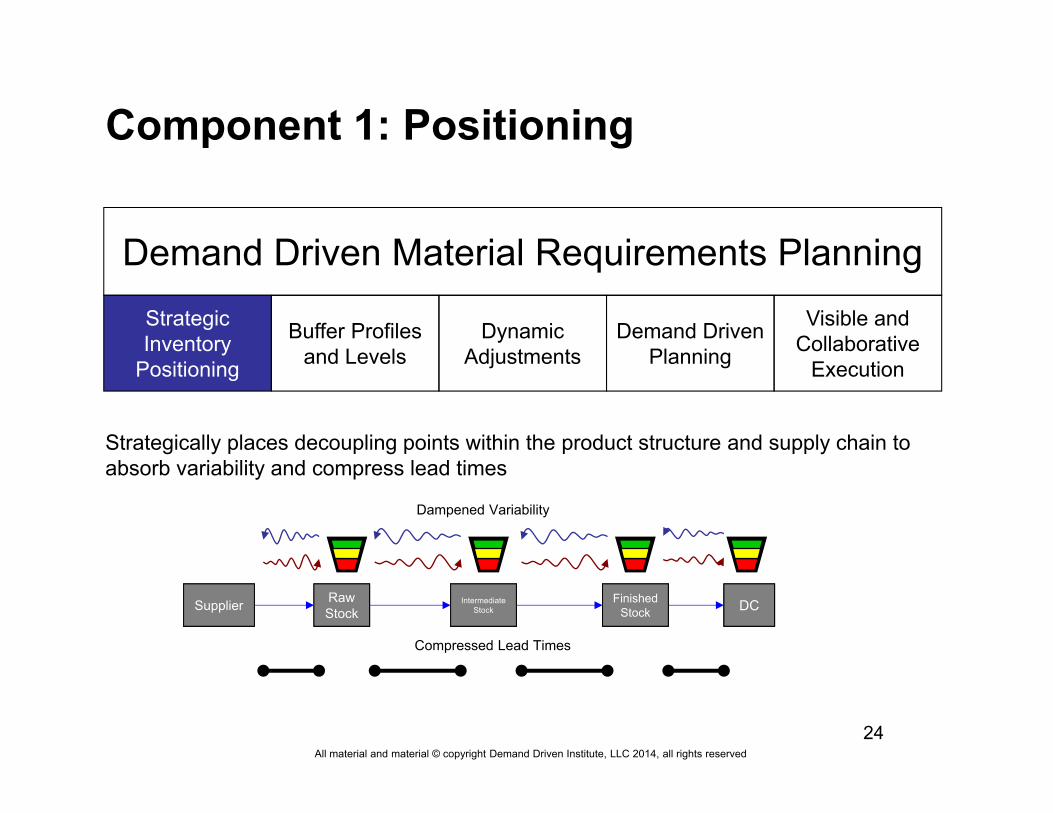
Component 1: Positioning
Strategically places decoupling points within the product structure and supply chain to absorb variability and compress lead times
DCFinished Stock
Raw Stock
IntermediateStock
Compressed Lead Times
Supplier
Dampened Variability
All material and material © copyright Demand Driven Institute, LLC 2014, all rights reserved
25
Demand Driven Material Requirements PlanningStrategic Inventory
Positioning
Buffer Profiles and Levels
Dynamic Adjustments
Demand Driven Planning
Visible and Collaborative
Execution
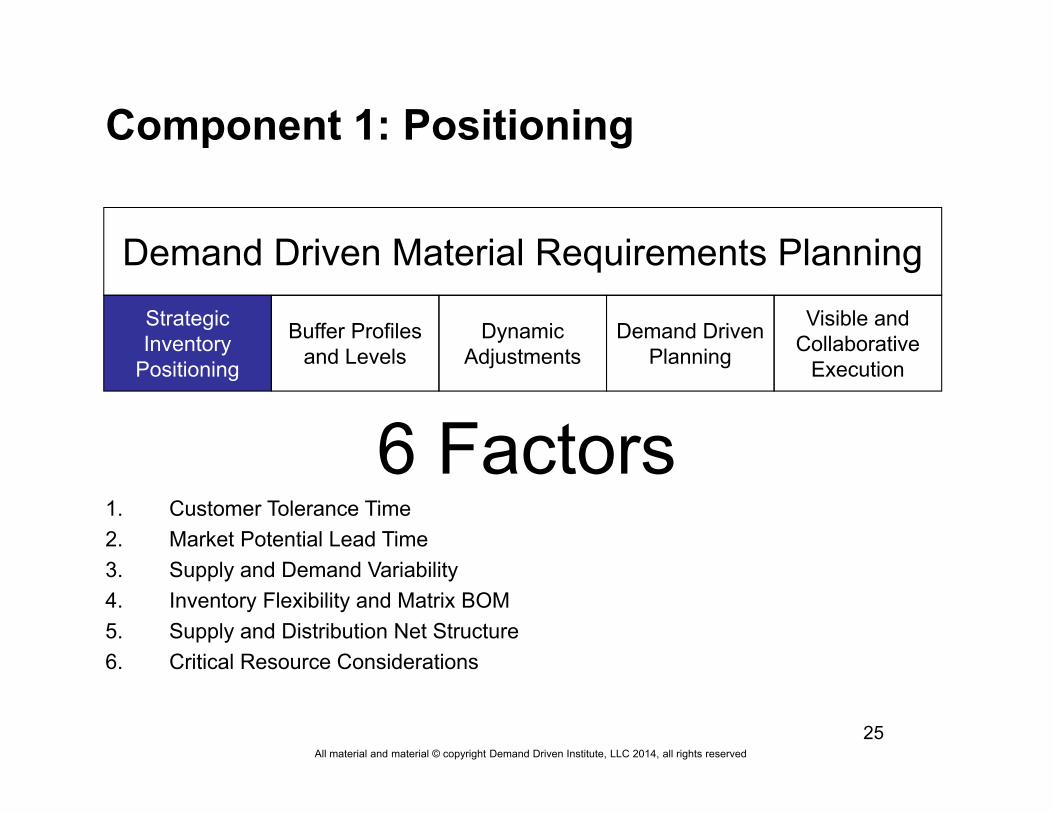
Component 1: Positioning
6 Factors1. Customer Tolerance Time2. Market Potential Lead Time3. Supply and Demand Variability4. Inventory Flexibility and Matrix BOM5. Supply and Distribution Net Structure6. Critical Resource Considerations
All material and material © copyright Demand Driven Institute, LLC 2014, all rights reserved
26
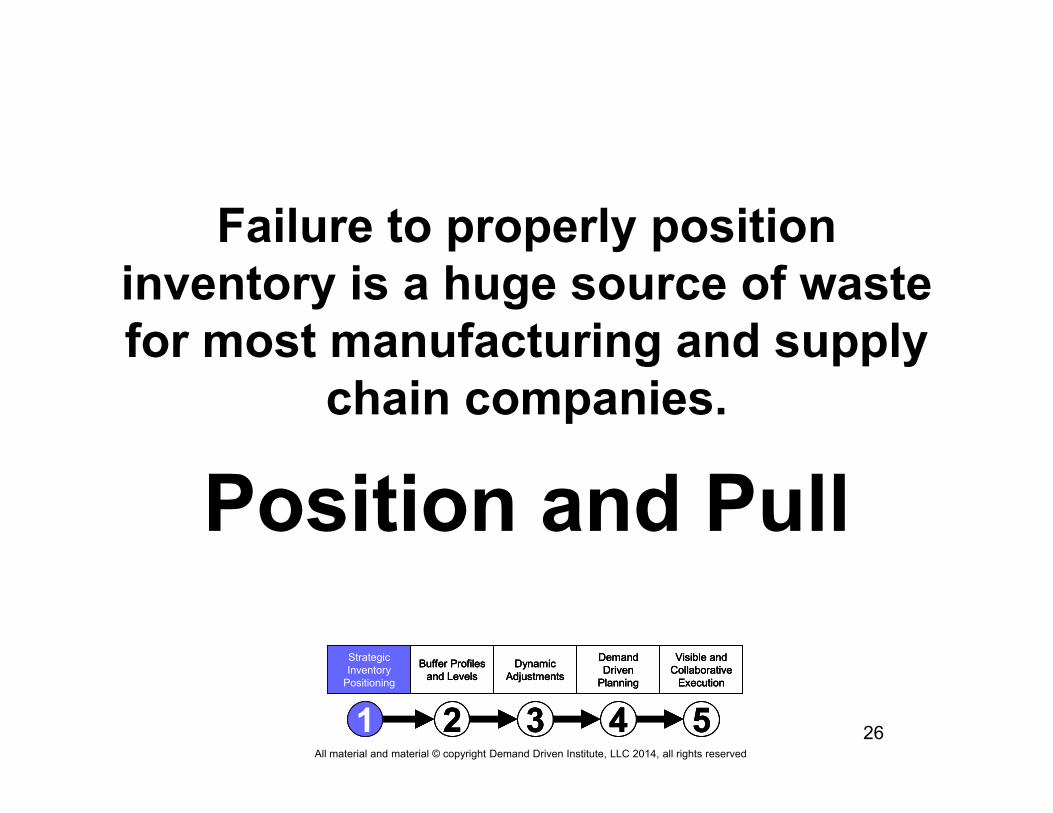
Failure to properly position inventory is a huge source of waste for most manufacturing and supply
chain companies.
Position and PullStrategic Inventory
Positioning
1
Buffer Profiles and Levels
2
Dynamic Adjustments
3
Demand Driven
Planning
4
Visible and Collaborative
Execution
5
Strategic Inventory
Positioning
1
Strategic Inventory
Positioning
1
Buffer Profiles and Levels
2
Buffer Profiles and Levels
2
Dynamic Adjustments
3
Dynamic Adjustments
3
Demand Driven
Planning
4
Demand Driven
Planning
4
Visible and Collaborative
Execution
5
Visible and Collaborative
Execution
5
All material and material © copyright Demand Driven Institute, LLC 2014, all rights reserved
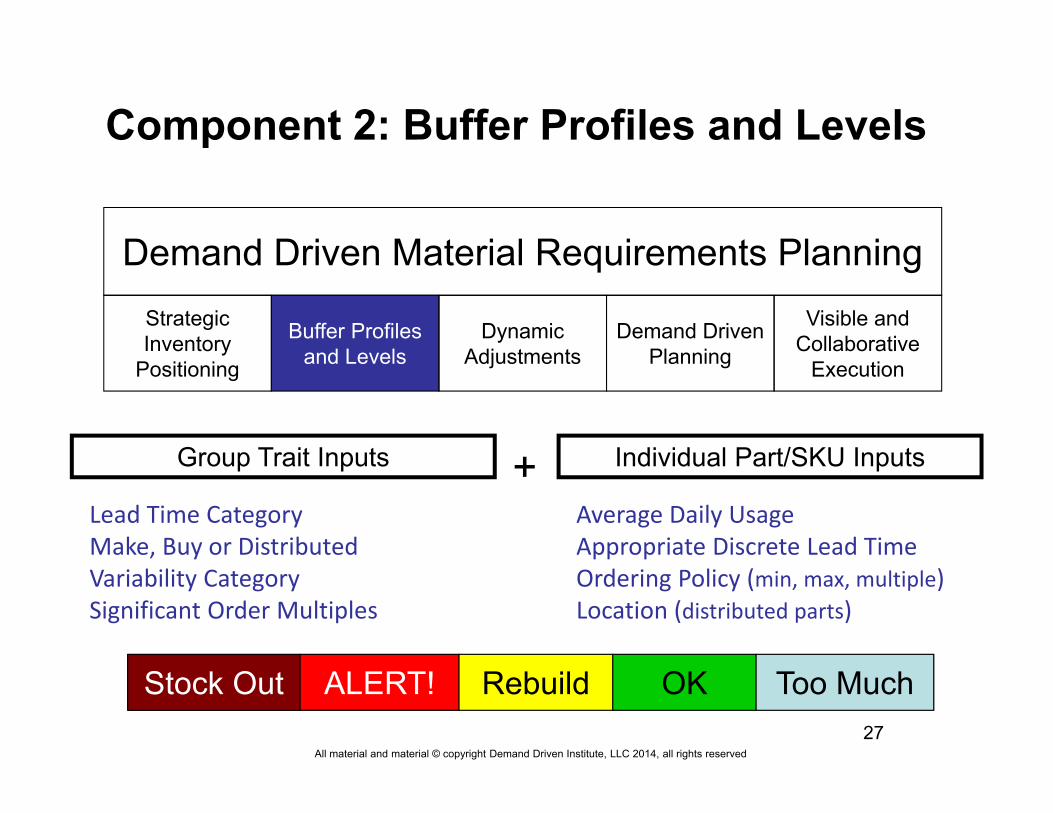
27
ALERT! Rebuild OK Too MuchStock OutStock Out
Component 2: Buffer Profiles and Levels
Group Trait Inputs
Lead Time CategoryMake, Buy or DistributedVariability CategorySignificant Order Multiples
Individual Part/SKU Inputs
Average Daily UsageAppropriate Discrete Lead TimeOrdering Policy (min, max, multiple)Location (distributed parts)
+
ALERT! Rebuild OK Too Much
Demand Driven Material Requirements PlanningStrategic Inventory
Positioning
Buffer Profiles and Levels
Dynamic Adjustments
Demand Driven Planning
Visible and Collaborative
Execution
All material and material © copyright Demand Driven Institute, LLC 2014, all rights reserved
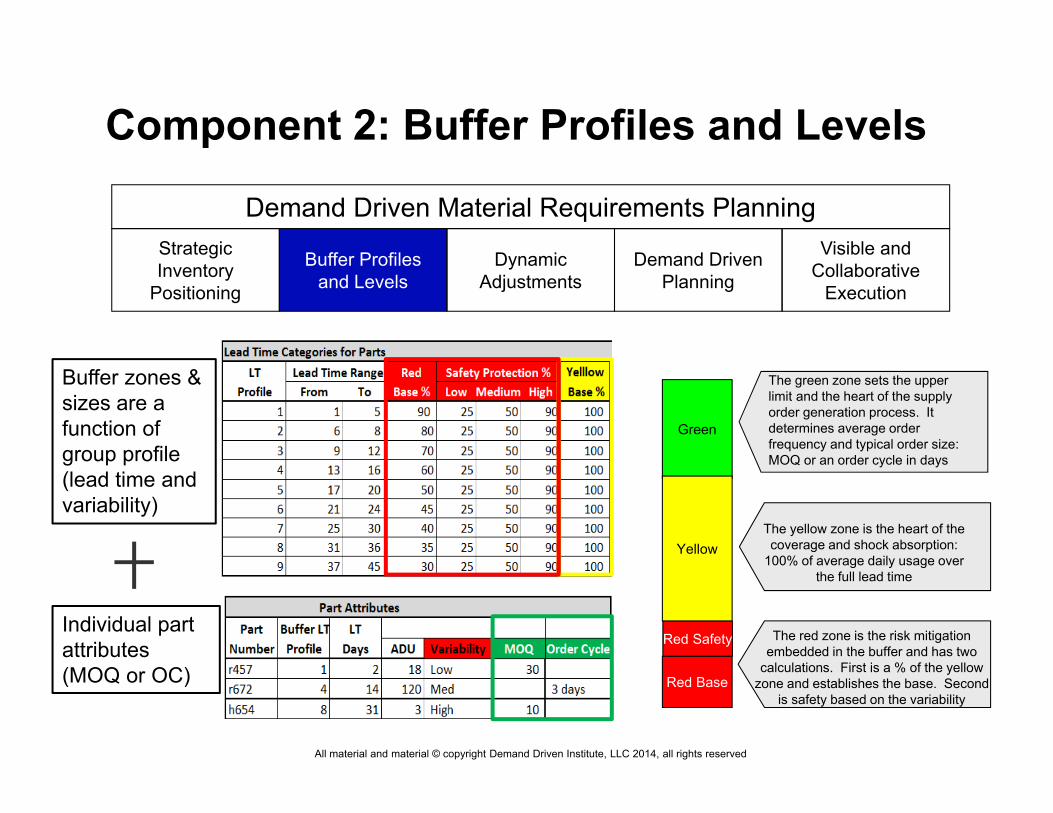
Demand Driven Material Requirements PlanningStrategic Inventory
Positioning
Buffer Profiles and Levels
Dynamic Adjustments
Demand Driven Planning
Visible and Collaborative
Execution
Green
Yellow
Red Base
Red Safety
The yellow zone is the heart of the coverage and shock absorption:
100% of average daily usage over the full lead time
The red zone is the risk mitigation embedded in the buffer and has two
calculations. First is a % of the yellow zone and establishes the base. Second
is safety based on the variability
The green zone sets the upper limit and the heart of the supply order generation process. It determines average order frequency and typical order size: MOQ or an order cycle in days
Buffer zones & sizes are a function of group profile (lead time and variability)
Individual part attributes (MOQ or OC)
Component 2: Buffer Profiles and Levels
All material and material © copyright Demand Driven Institute, LLC 2014, all rights reserved
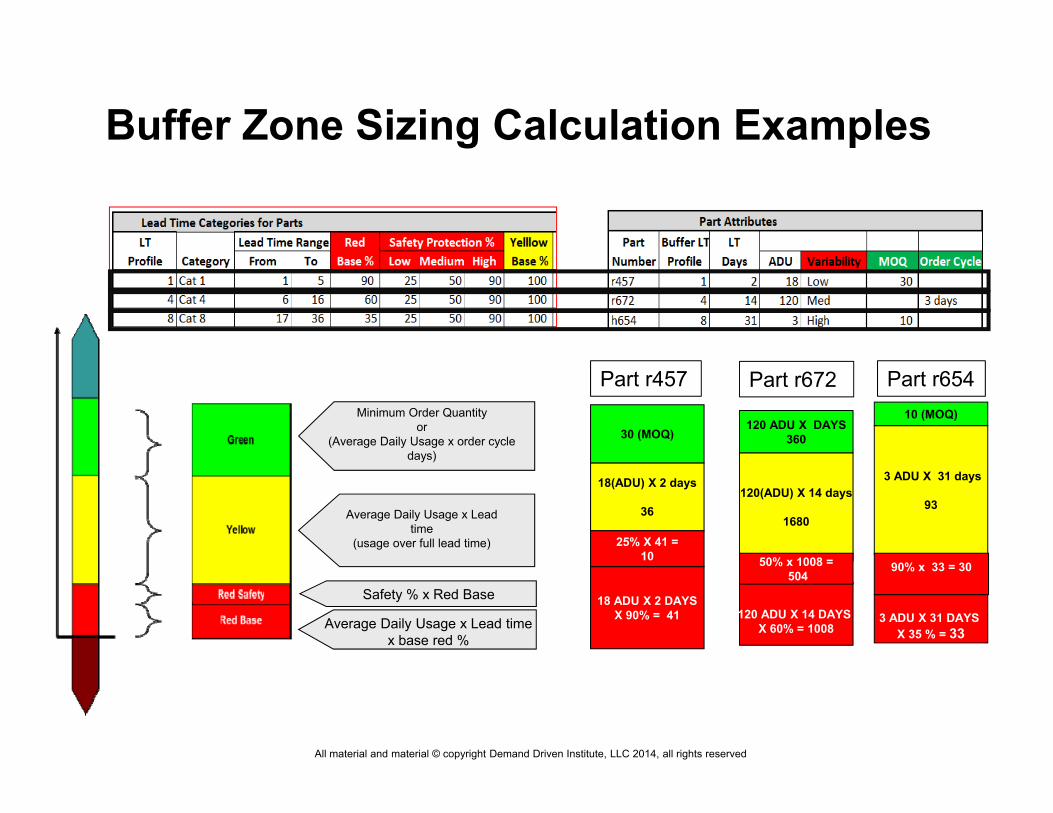
Buffer Zone Sizing Calculation Examples
18(ADU) X 2 days
36
18 ADU X 2 DAYSX 90% = 41
120 ADU X DAYS360
120(ADU) X 14 days
1680
120 ADU X 14 DAYS X 60% = 1008
Part r457 Part r672
50% x 1008 =504
25% X 41 =10
30 (MOQ)10 (MOQ)
3 ADU X 31 days
93
Part r654
3 ADU X 31 DAYS X 35 % = 33
90% x 33 = 30
Minimum Order Quantity or
(Average Daily Usage x order cycle days)
Average Daily Usage x Lead time
(usage over full lead time)
Average Daily Usage x Lead time x base red %
Safety % x Red Base
All material and material © copyright Demand Driven Institute, LLC 2014, all rights reserved
30
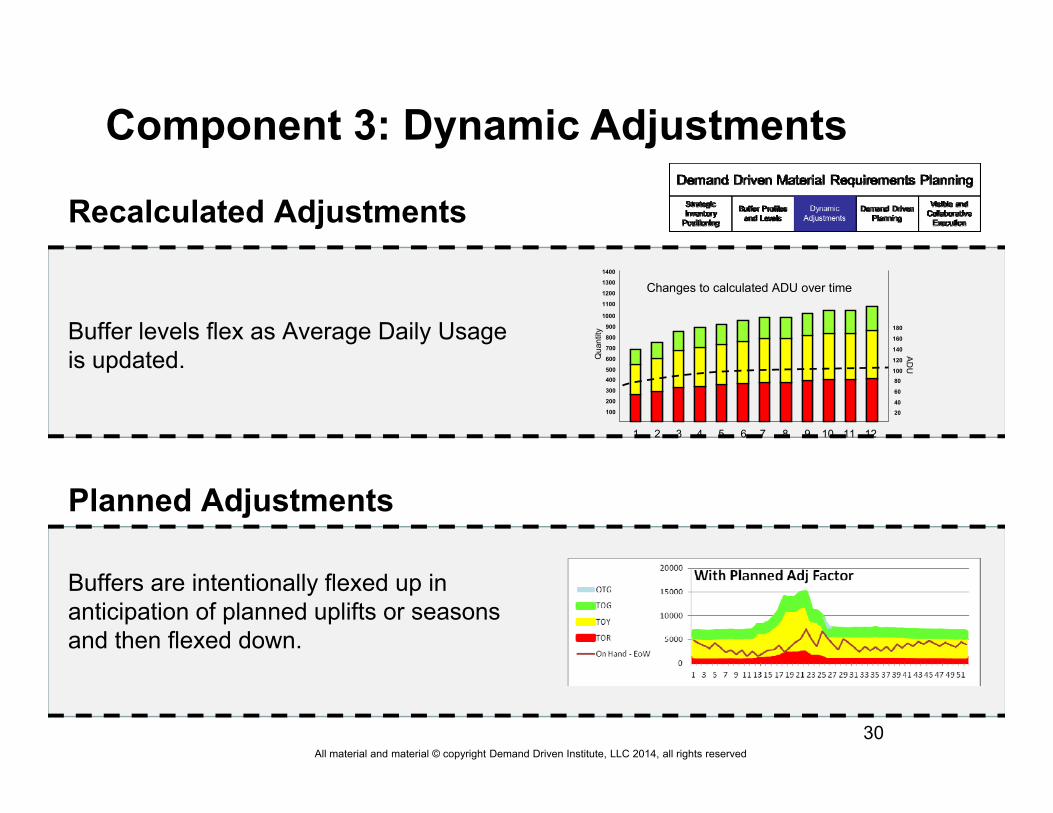
Component 3: Dynamic Adjustments
Buffers are intentionally flexed up in anticipation of planned uplifts or seasons and then flexed down.
Planned Adjustments
Recalculated Adjustments
Qua
ntity
1 2 3 4 5 6 7 8 9 10 11
100
200
300
400500
600
700
800
900
1000
1100
1200
1300
1400
12
ADU
2040
60
80100
120
140
160
180
Changes to calculated ADU over time
Buffer levels flex as Average Daily Usage is updated.
All material and material © copyright Demand Driven Institute, LLC 2014, all rights reserved
31
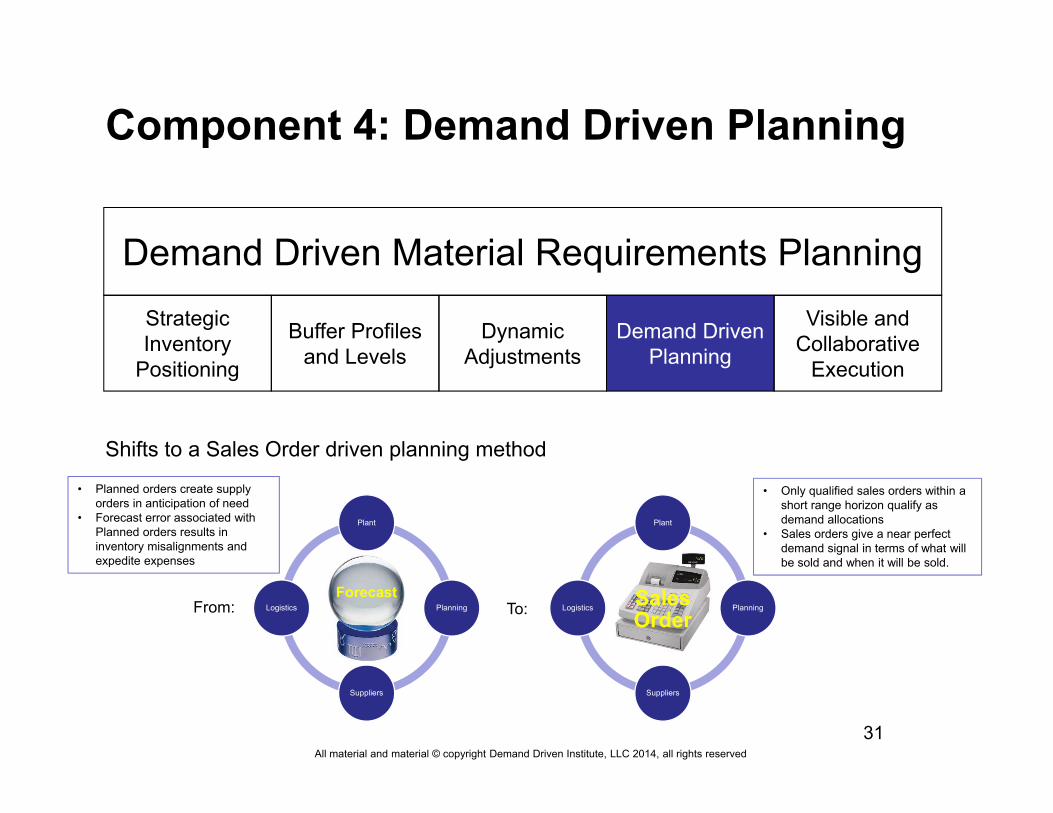
Component 4: Demand Driven Planning
Demand Driven Material Requirements PlanningStrategic Inventory
Positioning
Buffer Profiles and Levels
Dynamic Adjustments
Demand Driven Planning
Visible and Collaborative
Execution
Shifts to a Sales Order driven planning method
From:Forecast
Plant
Planning
Suppliers
Logistics To: Sales Order
Plant
Planning
Suppliers
Logistics
• Planned orders create supply orders in anticipation of need
• Forecast error associated with Planned orders results in inventory misalignments and expedite expenses
• Only qualified sales orders within a short range horizon qualify as demand allocations
• Sales orders give a near perfect demand signal in terms of what will be sold and when it will be sold.
All material and material © copyright Demand Driven Institute, LLC 2014, all rights reserved
Poll Question #3How many of you directly tie the forecast to the
creation of planned orders?
All material and material © copyright Demand Driven Institute, LLC 2014, all rights reserved
33
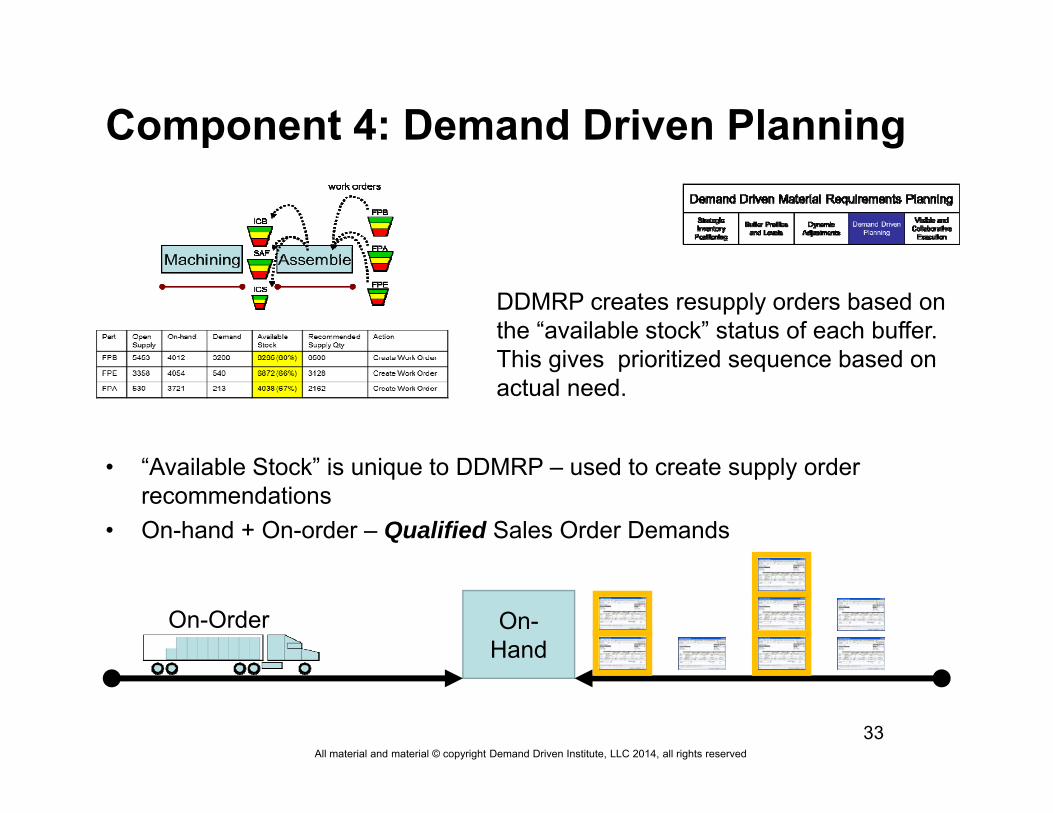
Component 4: Demand Driven Planning
DDMRP creates resupply orders based on the “available stock” status of each buffer. This gives prioritized sequence based on actual need.
• “Available Stock” is unique to DDMRP – used to create supply order recommendations
• On-hand + On-order – Qualified Sales Order Demands
On-Hand
On-Order
All material and material © copyright Demand Driven Institute, LLC 2014, all rights reserved
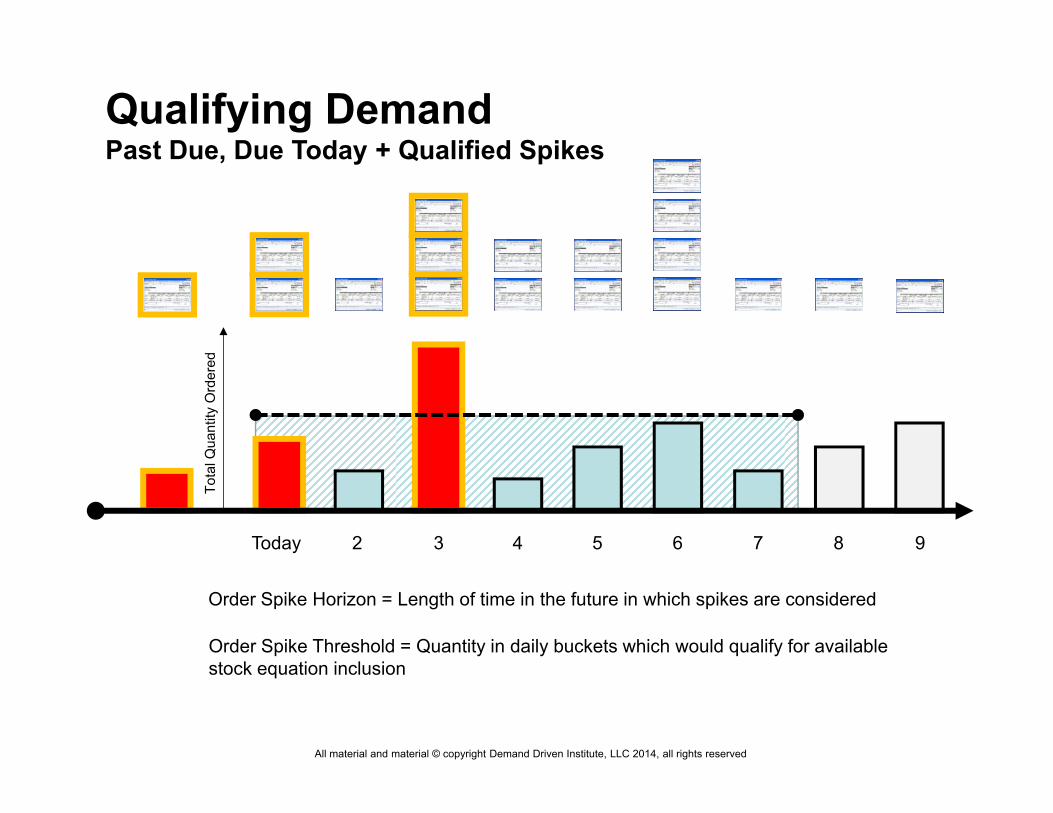
Qualifying DemandPast Due, Due Today + Qualified Spikes
Today 2 3 4 5 6 7 8 9
Tota
l Qua
ntity
Ord
ered
Order Spike Horizon = Length of time in the future in which spikes are considered
Order Spike Threshold = Quantity in daily buckets which would qualify for available stock equation inclusion
All material and material © copyright Demand Driven Institute, LLC 2014, all rights reserved
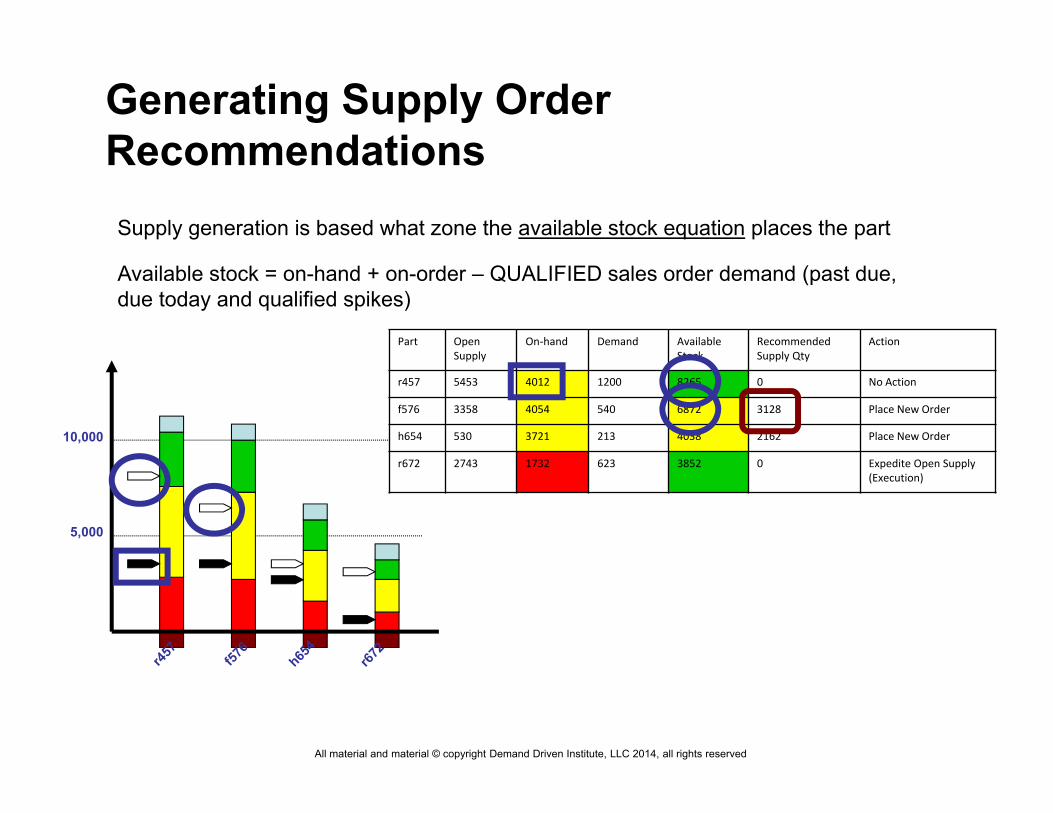
Generating Supply Order Recommendations
10,000
5,000
Part Open Supply
On‐hand Demand Available Stock
Recommended Supply Qty
Action
r457 5453 4012 1200 8265 0 No Action
f576 3358 4054 540 6872 3128 Place New Order
h654 530 3721 213 4038 2162 Place New Order
r672 2743 1732 623 3852 0 Expedite Open Supply (Execution)
Supply generation is based what zone the available stock equation places the part
Available stock = on-hand + on-order – QUALIFIED sales order demand (past due, due today and qualified spikes)
All material and material © copyright Demand Driven Institute, LLC 2014, all rights reserved
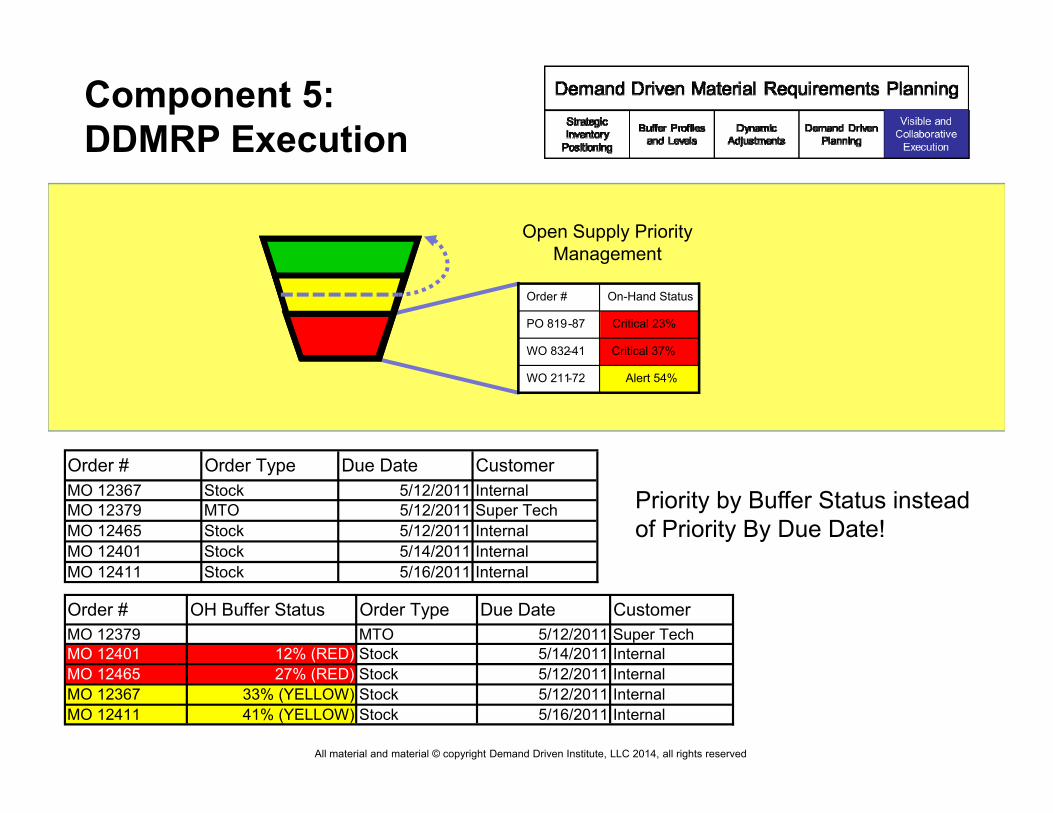
Component 5: DDMRP Execution
Open Supply Priority Management
Alert 54%WO 211-72
Critical 37%WO 832-41
Critical 23%WO 819-87
Order #
WO 211-72
WO 832-41
PO 819-87
On-Hand StatusOrder #
Priority by Buffer Status instead of Priority By Due Date!
Order # OH Buffer Status Order Type Due Date CustomerMO 12379 MTO 5/12/2011 Super TechMO 12401 12% (RED) Stock 5/14/2011 InternalMO 12465 27% (RED) Stock 5/12/2011 InternalMO 12367 33% (YELLOW) Stock 5/12/2011 InternalMO 12411 41% (YELLOW) Stock 5/16/2011 Internal
Order # Order Type Due Date CustomerMO 12367 Stock 5/12/2011 InternalMO 12379 MTO 5/12/2011 Super TechMO 12465 Stock 5/12/2011 InternalMO 12401 Stock 5/14/2011 InternalMO 12411 Stock 5/16/2011 Internal
All material and material © copyright Demand Driven Institute, LLC 2014, all rights reserved
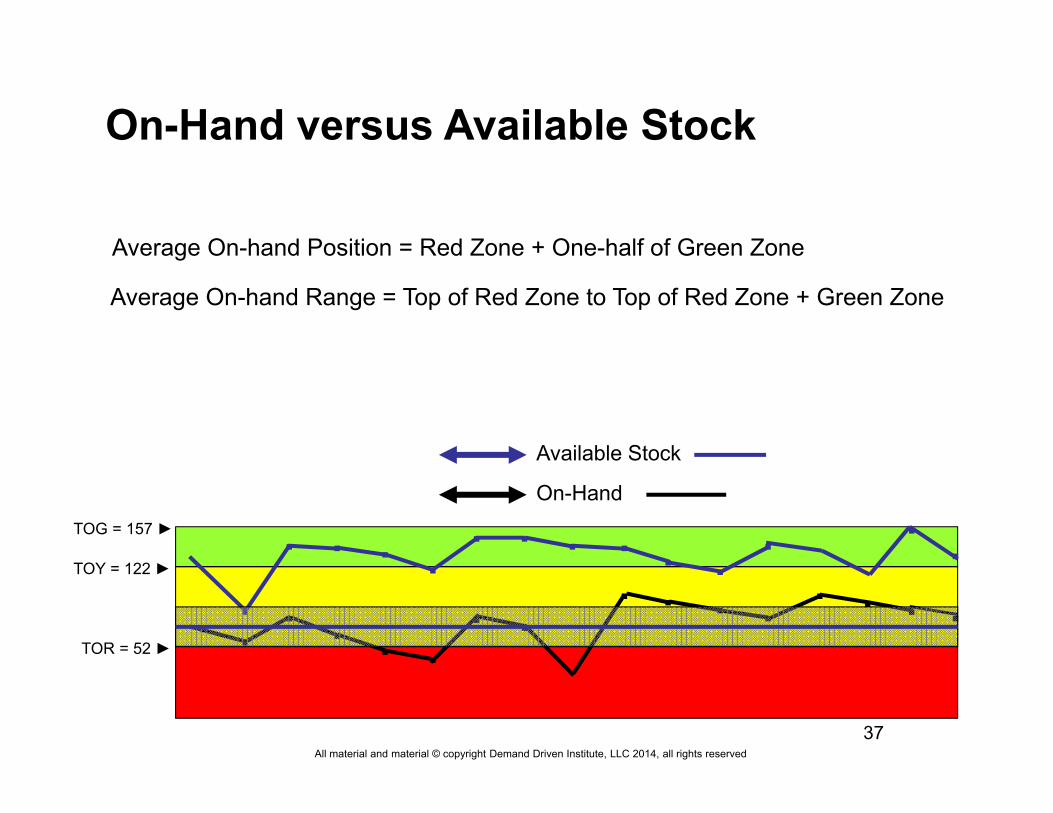
On-Hand versus Available Stock
37
▪
▪▪
▪
▪▪
▪▪
▪
▪
▪▪
▪
▪
▪
▪
▪
▪
▪
▪
▪▪▪
▪
▪
TOG = 157 ►
TOY = 122 ►
TOR = 52 ►
On-Hand
Available Stock
▪▪▪
▪
Average On-hand Position = Red Zone + One-half of Green Zone
Average On-hand Range = Top of Red Zone to Top of Red Zone + Green Zone
All material and material © copyright Demand Driven Institute, LLC 2014, all rights reservedDDMRP Intro38
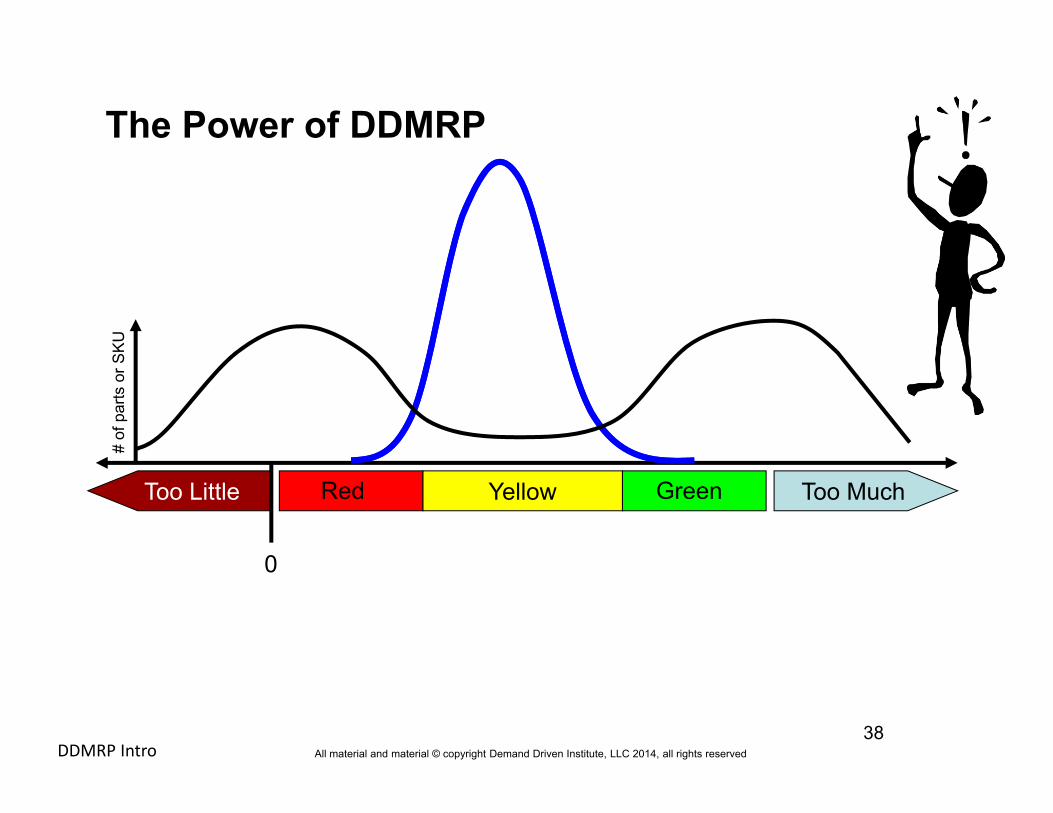
The Power of DDMRP
Too MuchToo Little Yellow
# of
par
ts o
r SKU
Red Green
0
All material and material © copyright Demand Driven Institute, LLC 2014, all rights reserved
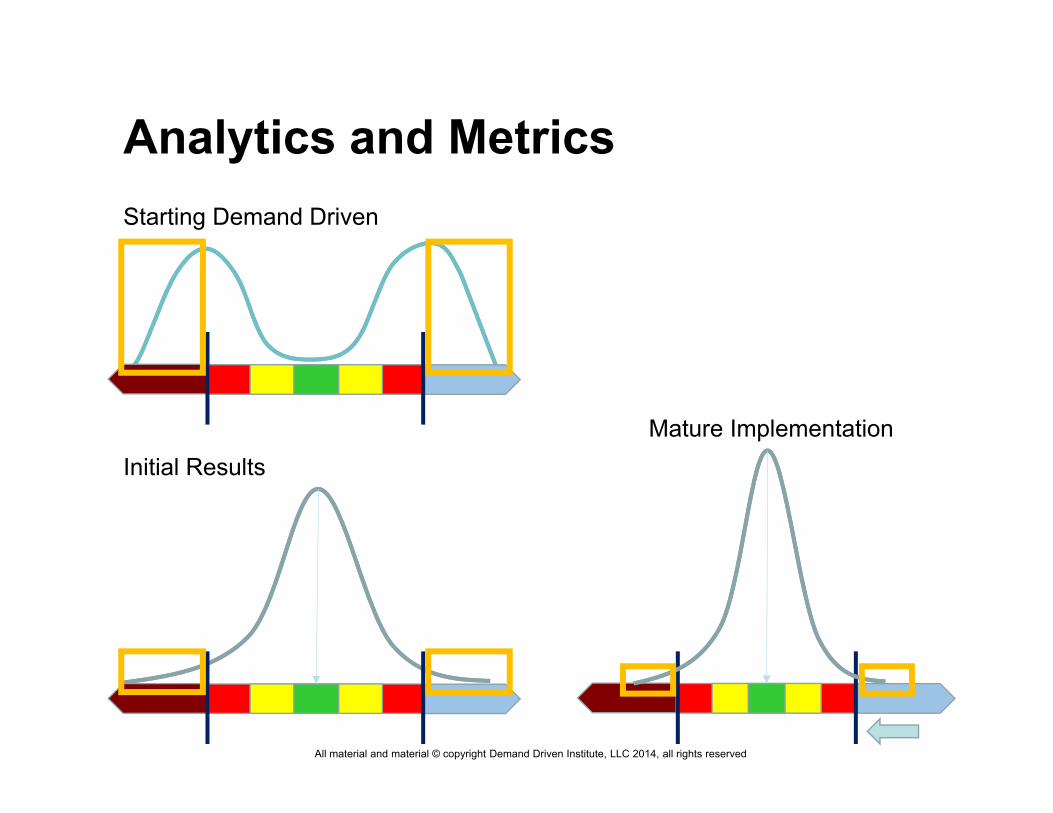
Analytics and MetricsStarting Demand Driven
Initial ResultsMature Implementation
All material and material © copyright Demand Driven Institute, LLC 2014, all rights reserved
The DDMRP Pyramid
FLOW
Sales Orders
Decoupling Points
Lead Time
Order Minimums
Lower Inventory
High Service
Fundamental Principal
Fundamental planning equation based on sales order demand against dynamically managed decoupling points.
New emphasis on relevant operational components for FLOW.
Better Alignment of resources to actual demand retains flexibility, promotes velocity with fewer course corrections.
Fewer Expedites
Buffer Status
▲ROI
All material and material © copyright Demand Driven Institute, LLC 2014, all rights reservedDDMRP Intro41
Certified Demand Driven Planner Program
Upcoming sessions in Europe, Australia, Africa, Asia and North America
CDDP Information and Registration: http://demanddriveninstitute.com/cddp_program.html

All material and material © copyright Demand Driven Institute, LLC 2014, all rights reserved
All material and material © copyright Demand Driven Institute, LLC 2014, all rights reserved
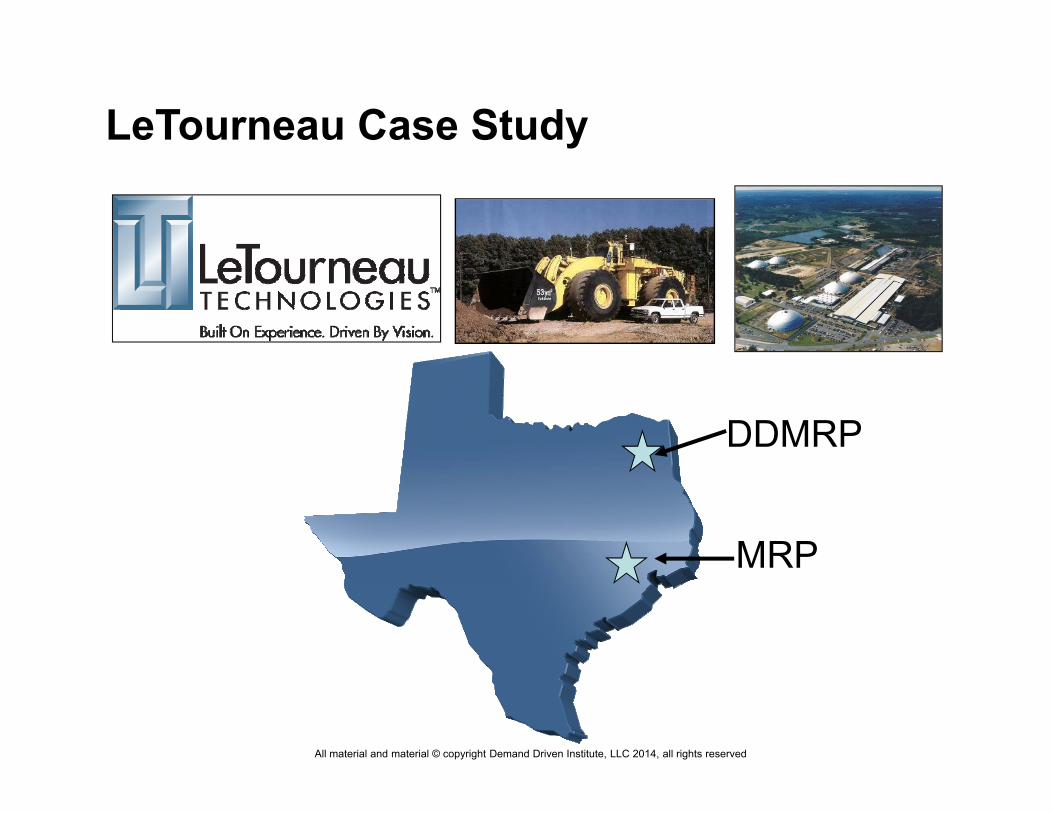
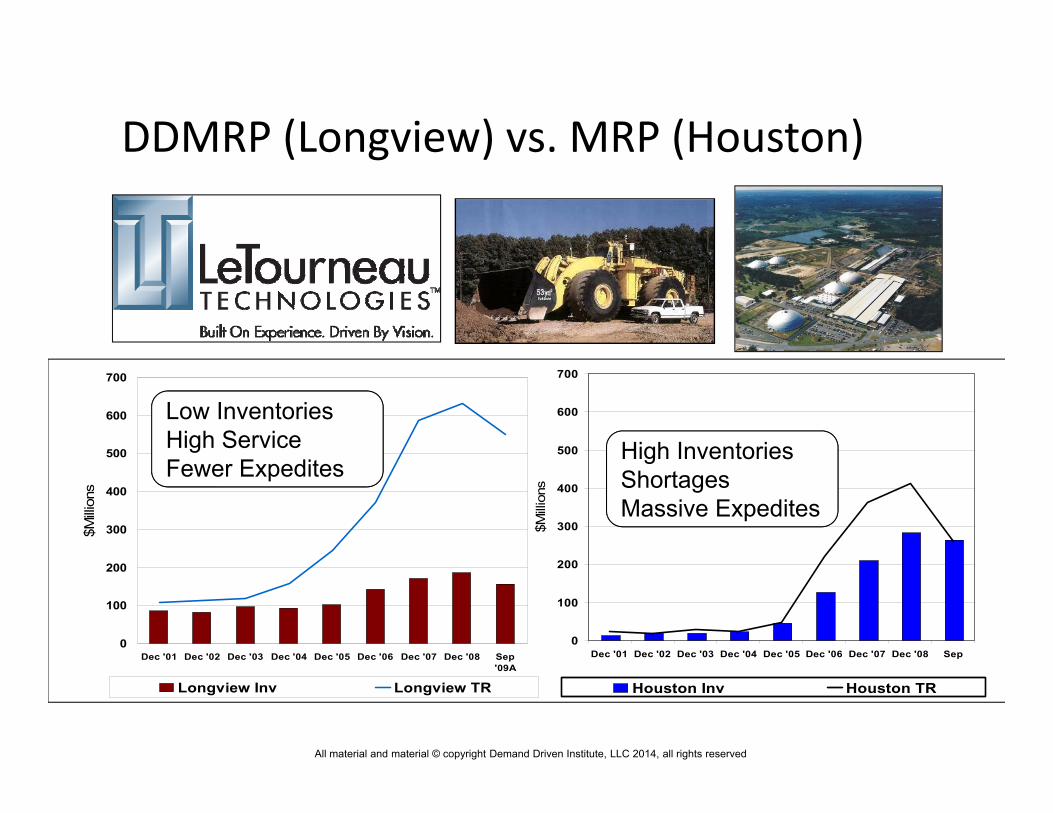
LeTourneau Case Study
MRP
DDMRP

All material and material © copyright Demand Driven Institute, LLC 2014, all rights reserved
C
SteelProducts
ComponentSupply (H/L)
OffshoreProducts
MiningProducts
C
C
Suppliers
DrillingSystems
ForestryProducts
C
C
Synchronization and Flow Challenge
C = Customer
= Remote Location
Supply Variability
Distortions & amplification in
demand requirements reverberate backward
Demand / Information Variability
End Item Assembly inherits the amplifying upstream variability.
Lead Time before DDMRP
All material and material © copyright Demand Driven Institute, LLC 2014, all rights reserved
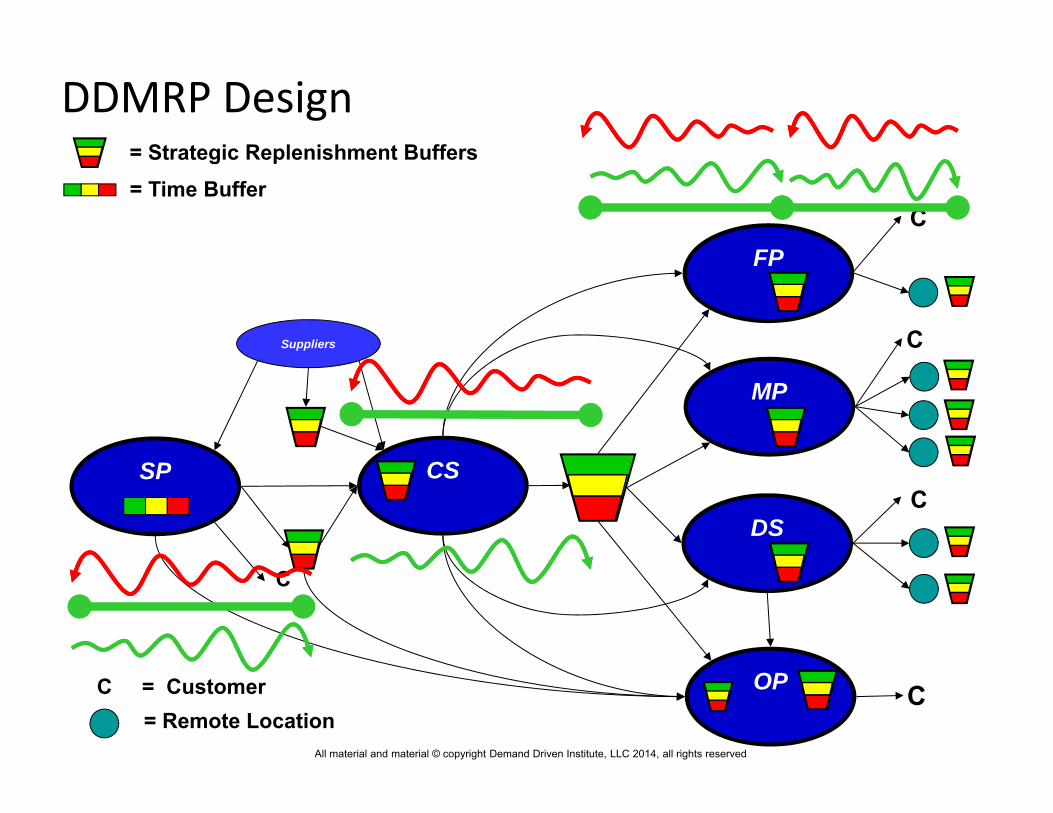
SP CS
OP
MP
C
C
Suppliers
C = Customer
DS
FP
C
C
= Remote Location
= Time Buffer= Strategic Replenishment Buffers
C
DDMRP Design
All material and material © copyright Demand Driven Institute, LLC 2014, all rights reserved
Stock-outs reduced by over 66%!
0
100
200
300
400
500
600
700
Dec '01 Dec '02 Dec '03 Dec '04 Dec '05 Dec '06 Dec '07 Dec '08 Sep'09A
$Milli
ons
Longview Inv Longview TR
0
100
200
300
400
500
600
700
Dec '01 Dec '02 Dec '03 Dec '04 Dec '05 Dec '06 Dec '07 Dec '08 Sep
$Milli
ons
Houston Inv Houston TR
High InventoriesShortagesMassive Expedites
Low InventoriesHigh ServiceFewer Expedites
DDMRP (Longview) vs. MRP (Houston)
All material and material © copyright Demand Driven Institute, LLC 2014, all rights reserved
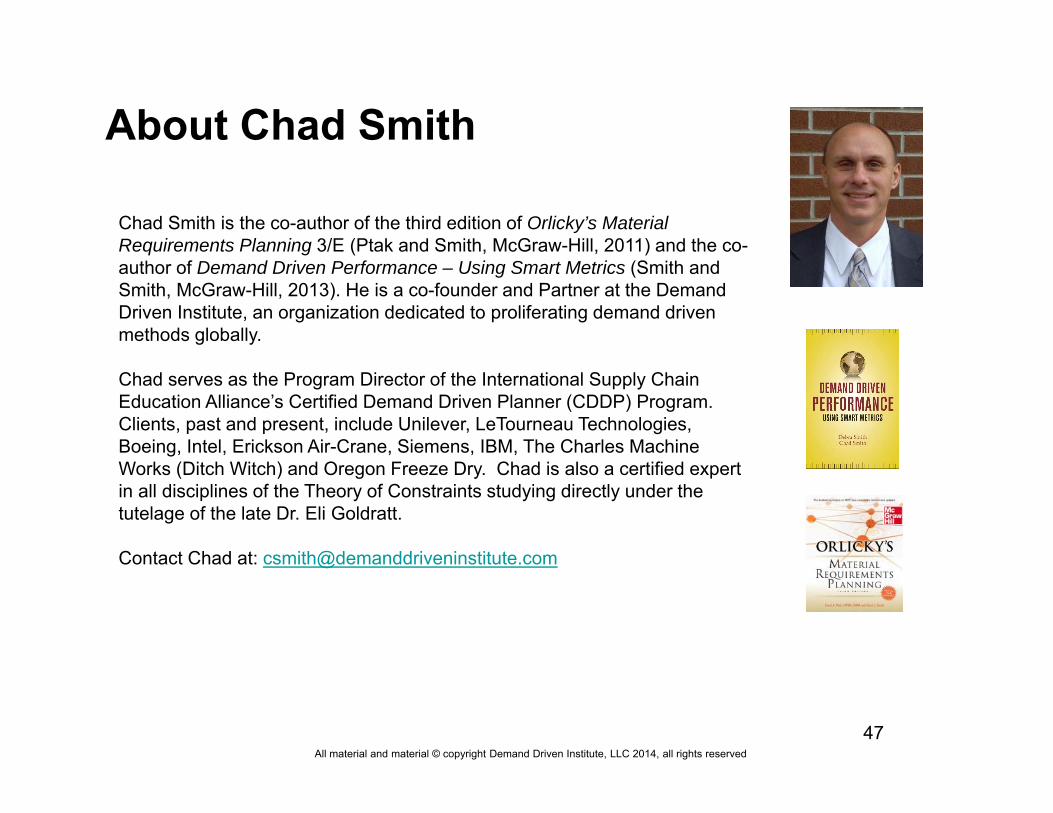
About Chad Smith
47
Chad Smith is the co-author of the third edition of Orlicky’s Material Requirements Planning 3/E (Ptak and Smith, McGraw-Hill, 2011) and the co-author of Demand Driven Performance – Using Smart Metrics (Smith and Smith, McGraw-Hill, 2013). He is a co-founder and Partner at the Demand Driven Institute, an organization dedicated to proliferating demand driven methods globally.
Chad serves as the Program Director of the International Supply Chain Education Alliance’s Certified Demand Driven Planner (CDDP) Program. Clients, past and present, include Unilever, LeTourneau Technologies, Boeing, Intel, Erickson Air-Crane, Siemens, IBM, The Charles Machine Works (Ditch Witch) and Oregon Freeze Dry. Chad is also a certified expert in all disciplines of the Theory of Constraints studying directly under the tutelage of the late Dr. Eli Goldratt.
Contact Chad at: [email protected]