building a classroom learning system - montgomery ... · web viewcenters ( when completed word work...
TRANSCRIPT

Building a Classroom Learning System
A Toolbox for Teachers
Draft ‘06

Board Of Education
Dr. Charles HaugheyPresident
Ms. Sharon W. CoxVice President
Mr. Steve AbramsMs. Valerie Ervin
Mrs. Nancy Navarro Mrs. Patricia B. O’Neill
Mr. Gabe RomeroMs. Sarah Horvitz
Student Member
School Administration
Dr. Jerry D. WeastSecretary-Treasurer, Board of Education
Superintendent of SchoolsMr. Larry Bowers
Chief Operating OfficerDr. Frieda K. Lacey
Deputy Superintendent of SchoolsMr. John Q. Porter
Deputy Superintendent for Strategic Technologies and Accountability
Building a Classroom Learning System A Toolbox for TeachersResource Book for TeachersCopyright © 2006 Montgomery County Public Schools
All rights reserved. No part of this publication may be reproduced, stored in a retrieval system, distributed, or transmitted in any form or by any means, whether electronic, mechanical, photocopy, recording, or any other, without the prior permission of the Montgomery County Public Schools, except for brief quotations consistent with a fair use under United States copyright law.
Requests for information should be sent toDr. Michael Perich, Systemwide Coordinator Continuous ImprovementOffice of the Chief Operating OfficerMontgomery County Public Schools850 Hungerford Drive, Rockville, MD [email protected]
2

Building a Classroom Learning SystemA Toolbox for Teachers
Sharon HawkinsSherwood ES Baldrige Quality Academy Teacher
Fran MorrisWaters Landing ES Baldrige Quality Academy Teacher
Ed RaganTilden MS Baldrige Quality Academy Teacher
This resource was created as a supplement to My Job, Your Job, Our Job: Building a Classroom Learning System. This resource has been designed to support all MCPS educators who visit the Baldrige Quality Academies. Our intention is to have each participant walk away with samples/examples of practical, user friendly quality tools that can be easily deployed in their classrooms.
This resource was created under the direction and leadership of Dr. Michael Perich, Coordinator of Systemwide Continuous Improvement.
3

4

Building a Classroom Learning SystemA Toolbox for Teachers
I. Why Baldrige?
A. Introduction……………………………………………………………………...…………………………….7B. Testimonials…………………………………………………………………………………………..………8C. Supportive Data……………………………………………………………………………………..………..9
II. Baldrige Background
A. Baldrige Basics…………………………………………………………………………….……………….11B. Baldrige Core Values………………………………………………………………………………………12C. Baldrige Categories………………………………………………………………………………………..14
III. Classroom Culture
A. Building the Classroom Culture…………………………………………………………………………...15B. Displaying Our Classroom Culture…………………………………………………….………………….15C. Ground Rules………………………………………………………………………………………………..16D. Core Values………………………………………………………………………………………………….17E. Mission Statement……………………………………………………………………..……………………18F. My Job, Your Job, Parents’ Job, Our Job…………………………………………………………….….20G. Quality Tools Used Quickly to Collect Stakeholder Input…………………………...………………….23
1. Affinity Diagram……………………………………………………………………………….….242. Consensogram………………………………………………………………………………...…253. Issue Bin…………………………………………………………………………………………..294. Light Voting………………………………………………………………….……………………305. Looks Like, Sounds Like, Feels Like………………………………………………….……….316. Plus/Delta………………………………………………….…………………………..………….337. Survey………………………………………………….……………………………………….…35
H. Personal Reflections: Self-Monitoring Tool……………………………………………………..………..37
IV. Shared Accountability
A. Building a System of Classroom/Shared Accountability………………………..………………………39B. Setting Goals……………………………………………………………………………………….…….…39C. Sample Goals……………………………………………………………………………………………….40D. Planning for Action………………………………………………………………………………………….43E. Displaying Data……………………………………………………………………………………………..50F. Using Graphs to Display Data……………………………………………………………………………..51
1. Bar Graph……………………………………………………………………………...…………..522. Control Chart………………………………………………………………………………………533. Histogram…………………………………………………………………………………………..544. Line graph……………………………………………………………….…………………………555. Pareto Chart……………………………………………………………………………………….566. Pie Graph……………………………………………………………………………………….….577. Radar Chart………………………………………………………………………..………………588. Run Chart…………………………………………………………………………….…………….59
5

9. Scattergram………………………………………………………………………………………..6010. Tally Chart………………………………………………………………………………………….6111. Target Graph………………………………………………………...…………………………….62
V. Student Accountability
A. Developing Data Notebooks or Folders…………………………………………………………………..63B. Elementary SampleC. Secondary Sample
VI. Quality Tools
A. Plan, Do, Study, Act…………………………………………………………………………………………65B. Linkages Chart for the Essentials of Baldrige-Guided School Improvement Planning…..………….67C. Action Plan………………………………………....………………………………………………………. 68D. Bone Diagram ………………………………………………………………………………………...…….70E. Checklist…………………………………………….……………………………………………………….72F. Fishbone Diagram…………………………………………………………………………………………..73G. Five Whys……………………………………………………………………………………………………75H. Flow Chart………………………………………………………………………………………..………….77I. Force Field Analysis………………………………………………………….…………………………….79J. Four Quadrant Diagram……………………………………………………………………………………81K. If…Then…………………………………………………………………..………………………………….83L. Interrelationship Diagram………………………………………………….……………………………….85M. Ladder………………………………………………………………..………………………………………87N. Lotus Diagram………………………………………………………….……………………………………89O. Morphing……………………………… ……………………………..……………………………………..91P. ORID………………………………………………… ………………………………………….…………..93Q. Parking Lot…………………………………………………………………………………………………..95R. Problem Statement…………………………………………………………………………………………97
VII. Resources
A. Baldrige Processes to Meet PGS Standards and Framework Expectations…………………………99B. Personal Reflections: Self-Monitoring Tool………………………………………………………….…
102C. Additional Resources……………………………………………………………………………………..103
6
INTRODUCTION
Welcome to the Baldrige Quality Academy!
Three MCPS Baldrige Quality Academies have been established to provide teachers and staff with a hands-on approach for understanding how to develop a Baldrige-based Classroom Learning System. Baldrige is a way of focusing our efforts to help all students become independent learners, make good decisions, solve problems, and take responsibility for their learning.
What is Baldrige?
The Baldrige Education Criteria for Performance Excellence is a management system for continuously making improvement in all that we do. The criteria are made up of eleven Core Values and seven Categories that enable us to self-assess, make informed decisions, get results, and focus on continuous improvement. The criteria also help students become independent learners and assume more responsibility for their learning.
Why Baldrige?
Baldrige enables all of us to continuously improve. MCPS has adopted the Malcolm Baldrige Criteria for Performance Excellence as the continuous improvement model for all schools and offices because:
It is the best current research in organizational development that describes what it takes to make school districts, schools, and classrooms get better.
It helps us develop systems which are well-defined, well-designed, and well-deployed processes that help the organization/classroom achieve its’ mission and goals.
It has a reputation for rigor and results among numerous school systems across the nation. It uses a systems approach for performance excellence and continuous improvement focused on
academic success for all students. It is not an add-on and is closely aligned with the Framework for Improving Teaching and Learning,
The Skillful Teacher, and the Professional Growth Systems. It helps to build Classroom Learning Systems by engaging students in the process. IT WORKS and is working in many of Montgomery County public schools.
Testimonials
7

Wow! I am so excited about how the Baldrige Tools have helped my students become more accountable for their education. I will never teach without using the Baldrige Processes. I could be the Baldrige poster child.
Janet – Middle School
Baldrige has made me a stronger teacher. It gave a name to processes I was already using, and it increased my “bag of tricks”. The difference is, now I reach for those tricks first!
Melissa – Elementary School
I used a Plus/Delta today for my weekly reflection paper. I usually focus on content with a short mention about process. So today I worked solely on this Baldrige process. It really opened my eyes for improvement for next week.
Diane – High School
I love how the Baldrige Quality Tools have helped my students realize how important their education is. If and when I ever leave MCPS and go to another school system that does not use Baldrige, I will continue Baldrige on my own.
Jan – Middle School
Baldrige Quality Tools give my students a sense of ownership in the classroom. By using the Quality Tools consistently, my students have taken responsibility for their own learning and, in turn, have suggested using the tools when they see the need.
Megan – Elementary School
I returned to my school and used several of the Baldrige Quality Tools with my students. What a difference they made in the attitude of my students. They now feel that they have input of what happens in their class.
Emmanuel – High School
The consistent use of Baldrige Quality Tools has shown me how to become a more effective instructor and communicator. My students feel a part of the classroom climate and have a say in how to improve both academically and socially.
Somer – Elementary School
The PDSA is my favorite Quality Tool. We use is consistently to assess classroom behaviors. Since using the PDSA, the classroom behavioral infractions have drastically decreased.
Claudia – Middle School
Supportive Data
MCPS began its Baldrige journey in 2000. Since then, progress has been made in student achievement. Here is a sampling of the data that shows some of our progress.
8
9

10

Baldrige BasicsFacts about Baldrige
Designed to help American business and industry gain a competitive edge in the global market
Built around eleven Core Values/Best Practices and Seven Categories Created in 1987 for business and adapted for educational use in 1998 Named posthumously for former Secretary of Commerce, Malcolm Baldrige
What the Criteria Do Reflect current best thinking on organizational practice Provide a means for self-assessment to help organizations evaluate how well they are
doing Provide a dynamic framework for continuous improvement and planning
Baldrige in EducationThe education version of the Criteria, the Baldrige Education Criteria for Performance Excellence, was created in 1998 to create schools and classrooms that lead to quality learning for all students.
Baldrige Helps Schools Assess ThemselvesThe school assesses itself by asking:
How well are all students doing? How can we improve the learning of all students? How do we know what’s working and not working? Are there systems in place?
The school also looks at other factors that impact student achievement such as:
What are the levels of satisfaction and dissatisfaction of students, parents, and teachers? How well does the leadership of the school communicate with stakeholders and monitor the progress of all
students? Does the school have goals in place and action plans to achieve those goals? How well and how often does the school collect and analyze data? How is that communicated to the
community?
What resources, including opportunities for training, does the school have in place to support student achievement?
11

Baldrige Core Values
The Baldrige Core Values or Best Practices are the foundation for the Baldrige Criteria and are essential for a results-oriented organization focused on performance excellence. These Core Values/Best Practices must be applied and integrated at all levels of the organization. In a school setting, the evidence for Core Values/Best Practices should be demonstrated in daily actions at the school, classroom, and student level.
Visionary LeadershipVisionary Leadership occurs when there is a shared vision and visible commitment of all stakeholders to the principles and practices of continuous improvement and performance excellence.
Learning-Centered EducationLearning-Centered Education occurs when the school’s goals/objectives and actions support student learning and the current and future needs of students.
Organizational and Personal LearningOrganizational and Personal Learning occurs when there is a well-executed approach enabling staff and students to participate in personal learning and continuous improvement processes.
Valuing Faculty, Staff and PartnersValuing Faculty, Staff and Partners occurs when staff and stakeholders' input, shared decision-making, on-going development, and collaboration are valued and enhanced.
AgilityAgility occurs when there is the desire and the ability for faster and more flexible response to student and stakeholder needs.
Focus on the FutureFocus on the Future occurs when there is an understanding of the expectations of next level teachers, of the community, and of employers so that students can prepare for a future point in time.
Managing for InnovationManaging for Innovation occurs when stakeholders are supported in creating meaningful change in programs or processes that create new value for student achievement.
Management by FactManagement by Fact occurs when data is used to drive decisions, inform instruction, or to evaluate key processes and results.
Public/Social Responsibility and CitizenshipPublic Responsibility and Citizenship is the belief in group norms and values and the practice of good citizenship, understanding that it is the school’s role to model these values as members of the community.
12

Focus on Results and Creating ValueFocus on Results and Creating Value occurs when there is a focus on results and those actions that create value in attaining results.
Systems PerspectiveSystems Perspective occurs when processes are planned, aligned and implemented systematically and systemically to increase the likelihood of reaching targeted goals.
See My Job, Your Job, Our Job Appendix B pp. 55-58
13

Baldrige CategoriesThe Baldrige Categories are linked to create an integrated management system that enables organizations to focus systematically and systemically on performance excellence and continuous improvement. This integrated management system works at the district, school, and classroom levels.
LeadershipThe Leadership Category examines how the school's leadership [system] addresses the school's values, directions, and performance expectations as well as the focus on students and stakeholders, monitoring student learning, Communicating schools’ values and goals, staff empowerment, innovation, agility, and organizational learning.
Strategic Planning
The Strategic Planning Category examines how the school develops strategic goals/objectives and action plans. The category also focuses on how the chosen strategic objectives and action plans are deployed and how progress is measured.
Student and Stakeholder FocusThe Student and Stakeholder Focus Category examines how the school determines the academic needs of students. The category also focuses on how the school builds relationships with students and stakeholders, and determines the key factors that lead to student and stakeholder satisfaction, preferences, and expectations.
Measurement, Analysis and Knowledge ManagementThe Measurement, Analysis, and Knowledge Management Category examines how the school selects, gathers, analyzes, manages, and improves its data, information and knowledge assets.
Faculty and Staff Focus
The Faculty and Staff focus Category examines how the school's work system and staff learning, satisfaction, and motivation enable staff to develop and utilize their full potential in alignment with the school's overall goals/objectives and action plans. This category also focuses on the school's efforts to build and maintain a work environment and staff support climate conducive to performance excellence and to personal and organizational growth.
Process ManagementThe Process Management Category examines the key aspects of the school’s process management, including key learning-centered processes for the schools instructional programs and key support processes that create value for all stakeholders.
Organizational Performance ResultsThe Organizational Performance Results Category examines the school’s performance and improvement in key areas—student learning results; student- and stakeholder-focused results; and staff and leadership results. The category also focuses on performance levels relative to those of comparable schools.
14

Building the Classroom Culture
Purpose: The culture in a Baldrige-based Classroom builds a system of shared responsibility, accountability, shared decision-making, and problem solving.
Benefits of building a Baldrige-based Culture: Expectations are identified and communicated Trust is established Students focus on learning All stakeholders are engaged in the learning process Students are increasingly willing to take risks Students share in making decisions about their classroom systems Students have increased ownership/buy-in Students and parents are aware of progress
Displaying Evidence of Our Classroom CulturePurpose: The culture display is the foundation of the data center. The data center provides a central location where the mission statement, ground rules, core values, and responsibilities are posted. These classroom expectations and beliefs serve as both a visual reminder and a springboard for class discussions.
Bulletin Board Display
15
Your Job
My Job Parents’
Job
Our Job
Classroom Ground Rules
Our Core ValuesOur Classroom Mission Statement

Ground Rules
Purpose: Ground rules are the foundation from which an organization operates. Ground rules are the “bottom line” expectations that all stakeholders agree upon and are committed to abiding by.
Ground rules should be:
1. Written as a team: The brainstorming technique or affinity diagram may be used to elicit all stakeholder input. “Less is sometimes more”. The team can prioritize each response by doing a light or weighted vote. Developing criteria or indicators for each ground rule helps everyone to understand which behaviors support as well as conflict with the group’s determined ground rules.
2. Posted: Posting the ground rules reinforces the groups’ expectations.
3. Reviewed: By consistently reviewing the ground rules, teachers and students set the stage for learning. Many disruptions and/or behavioral problems are avoided when the group revisits the ground rules daily, weekly, and/or prior to a lesson/class period.
4. Revised: Ideally, one would expect that the ground rules become so engrained and internalized that a visual reminder is no longer necessary. Some groups find that many initial “rules” may be deleted while certain situations call for additional ground rules. The important part is that the ground rules be a living, breathing document that is consistently reviewed, analyzed, and revised, and used to monitor and re-direct inappropriate behaviors.
5. Monitored and discussed when violated: What happens when a group member or several group members are violating the determined ground rules? There are several strategies that may be used:
Simple reminders Create awareness by collecting data and sharing results with group Completing a Force Field Analysis to determine possible reasons Develop a PDSA Develop a list of consequences and celebrations
Sample Ground Rules
16
Be RespectfulSpeak kindlyTreat others as you would like to be treated
Be ResponsibleHave materials readyComplete assignmentsFollow school rules
Actively ParticipateShare ideasBe an active group memberDo our share of the workPay attention
Follow Group NormsRaise our handsBe on timeClap when appropriate
See My Job, Your Job, Our Job pp. 7-9

Core Values
Purpose: Core values maximize the opportunities for continuous improvement and performance excellence in a Classroom Learning System. They are the foundation for building a positive classroom culture. As
students integrate Core Values into the everyday life of the classroom, their ability to become coproducers of and accountable for their learning is greatly enhanced.
Core Values should be:
1. Written as a team: The brainstorming technique or affinity diagram may be used to elicit all stakeholder input. “Less is sometimes more”. The team can prioritize each response by doing a light or weighted vote.
2. Posted: Posting the core values reinforces and reminds the class of what they value.
3. Reviewed: By routinely referring to the core values, teachers and students set the stage for learning. Classroom decisions in regards to instruction, behaviors, and procedures should reflect the class’s core values.
4. Revised: The important part is that the core values be a living, breathing document that is consistently reviewed, analyzed, revised as necessary, and used as tools to reinforce best practices.
Sample Acrostic Display of Core ValuesWe as the class of 2009:
Celebrate success
Offer support to others
Respect others
Evaluate and analyze our data
Value everyone’s input for decision-making
Appreciate and value others’ opinions
Learn from our mistakes
Use data to plan for instruction
Establish class ground rules together
Solve problems using PDSA and other Baldrige quality tools
See My Job, Your Job, Our Job pp. 14-17
17

Mission Statement
Purpose: Mission statements enable the group to focus on results, help to create common goals and aligned actions, and create a sense of teamwork and shared responsibility.
A mission statement: Helps to align actions Provides a purpose statement Motivates students Defines clear expectations Reinforces purpose, goals and measures Acts as a foundation from which goals and data collection/analysis evolve
Possible Lesson Sequence1. Read a short story or excerpt from a book that illustrates how the character set goals,
worked toward reaching his goal, and ultimately persevered. Examples: Corduroy, The Little Engine that Could, The Giving Tree, Chicken Soup for the Teenage Soul, Mia Hamm: Winners Never Quit2. Discuss (use a strategy) or define key qualities/characteristics that impacted the
character’s ability to reach his goal (list ideas).3. Ask students to identify qualities/characteristics that successful students have (list ideas).4. Pose the following questions: Who are we (qualities, values, beliefs)? Why are we here
(generally)? What do we want to accomplish (specifically)? How will we make it happen (systems, processes, plans)?
5. Use the affinity tool for questions “Who are we?” and “Why are we here?”6. Use the brainstorming technique and weighted voting for “What do we want to
accomplish?” and “How will we make it happen?”7. Create a class rough draft using ideas from post-it notes and/or brainstorming/prioritizing
list.8. Wordsmith document and present to class.9. Ask for additions, edits, and/or revisions.10. Have each student and teacher sign the mission.11. Review the mission routinely to remind everyone that all have a common mission.
Additional ideaAsk parents to respond to the same questions either at Back to School Night or as a homework assignment. Include these ideas in the mission statement
See My Job, Your Job, Our Job pp. 18-21
18

Mission Statement
Who are we? Why are we here?
What do we want to accomplish?
How will we make it happen?
19

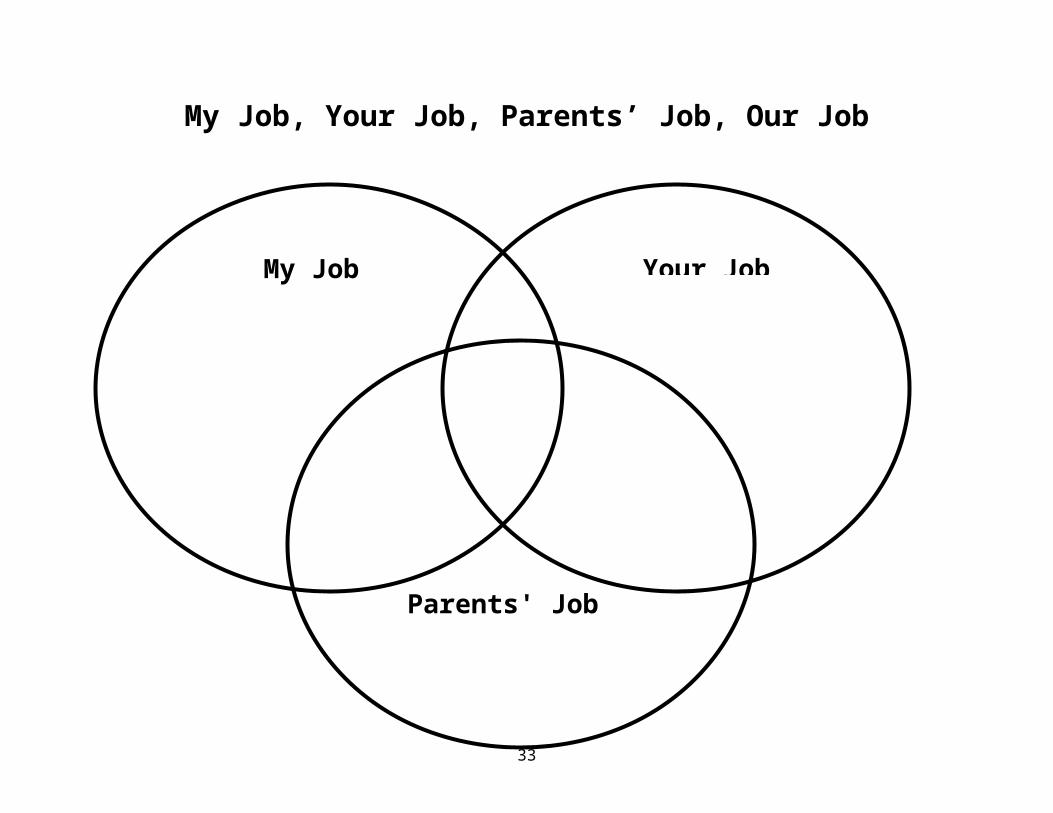
My Job, Your Job, Parents’ Job, Our JobPurpose: This activity allows all stakeholders to determine and clarify their roles and responsibilities involved in student learning. Once the jobs are defined, the chart is posted and used as a constant reminder that all members are held accountable for the agreed upon jobs.
Determining the Jobs: Ask students to brainstorm jobs for which they think they should be responsible (an affinity diagram may be used). Have students suggest jobs for which they believe the teacher is responsible. Encourage students to determine jobs for which they think their parents should be responsible. Create a group chart. Add and/or delete ideas. Use the chart as a reminder and springboard for discussion.
My Job (Student) Your Job (Teacher) Parents’ Job Our Job (Together) Come to school prepared Pay attention Actively participate Have materials ready Stay on task Complete homework Complete classwork
Teach us so that we understand
Have materials and resources available
Guide us when we need help
Give us feedback Show us what we need to
do in order to improve Come to school prepared Communicate with our
parents
Make sure that we have school supplies
Help us with assignments Read with us Get us to school on time Make sure we are well fed Take us to the doctors Communicate with our
teachers Listen to us Spend time with us
Do our personal best Listen to each other Respect each other Help each other Be honest Know our jobs and be
responsible for doing them
Hint: Some teachers use this strategy at “Back to School Night” and have the parents fill out the My Job, Your Job, Our Job chart. Often the teacher, parents, and students sign the charts.
See My Job, Your Job, Our Job pp. 11-12
20

My Job, Your Job, Parents’ Job, Our Job
My Job Your Job Parents’ Job
Our Job
21

Parents' Job
My Job, Your Job, Parents’ Job, Our Job
My Job Your Job
22

Quality ToolsUsed To Quickly Collect Stakeholder Input
Quality Tools develop our process thinking skills which enable us to better problem-solve, build risk-free environments, offer input, analyze, synthesize, and make decisions.
Affinity Diagram: When we need to get information from everyone in a quick and organized way, an affinity diagram just might be the tool. Asking for input and then having participants write their idea/ideas on post-it notes is an ideal way of gathering information. Once ideas are posted, leaders may then sort and group responses based on their affinity or similarities.
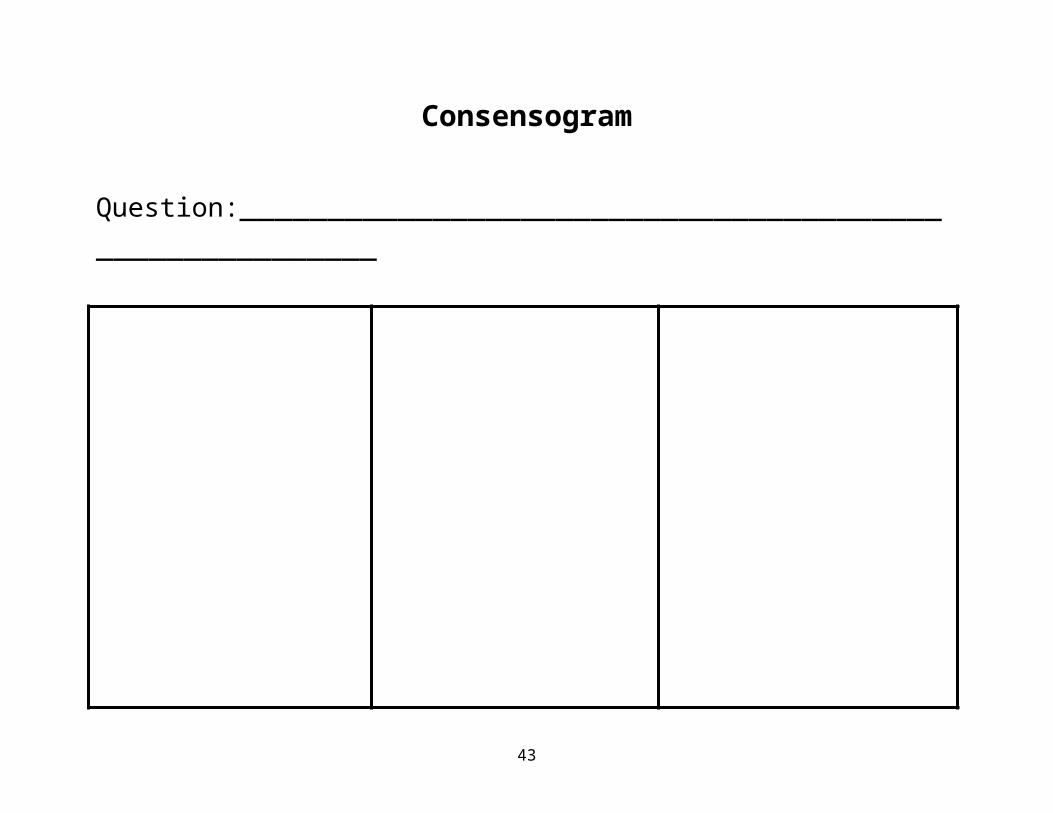
Consensogram: Consensograms help us determine how people feel and/or what they know. It also enables teachers to base their plans on the needs/perceptions of their students. Consensograms may act as a springboard for instruction and/or a culminating activity after a unit of study and prior to the test.
Issue Bin: Have we ever had situations where a student’s needs/wants or concerns have not been addressed because this would interfere with the scope and sequence of our planning and teaching? If so, an issue bin is an ideal way of validating and identifying individual needs. The issue bin allows for an instructional “flow”, yet offers a vehicle for students’ personal attention.
Light Voting: This strategy allows everyone in the group to have an equal voice and moves the decision-making process along quickly. The number of votes each student has is equal to the number of items divided by three.
Looks Like, Sounds Like, Feels Like: This strategy helps the group to imagine and communicate expectations for their learning environment. Posting and reviewing the chart reinforces beliefs and values .
Plus/Delta: Using the plus/delta is a quick and easy way teachers may evaluate the lesson, the activity, and/or the day. Simply posing two questions, “What worked?” and “What opportunities do we have for improvement?”, allows the teacher and students to work together in building a quality educational learning environment.
Survey: (“Short and Sweet”) the best surveys are focused. Surveys pose questions that will lead to specific information based on specified items. Often, organizations determine their survey questions once generic/soft data is gathered. For example, several students might communicate that the weekly vocabulary quizzes are “too confusing”. Using this information, one might develop a survey to:
a. Determine if this is the general perceptionb. Target possible reasonsc. Develop improvement plans
23

Affinity Diagram
The Affinity Diagram strategy is a way of gathering lots of information and ideas, then categorizing so that groups may discover common levels of understanding, similar beliefs and/or expectations
Question: What do we need to review for our Spanish 1A Mid-term Exam?
Question: What do we need to review for our Spanish 1A Midterm Exam?
School
Food
Spelling
Getting Acquainted
Pastimes
Classroomobjects
Places inschool
Tellingtime
Cultural differences
Ordinal numbers
Schoolsubjects
Describingvocabulary
Conjucating‘ser’ and ‘pener’ verbsAdjective
agreement
Conjugating‘er’ verbs
Conjugating‘ir’ verbs
Conjugating ‘preferir’ verbs
Cultural differences atmealtime
Accent Practice spellingwith peers
Conjugating‘ar’ verbs
Subjectpronouns
Pastimevocabulary
‘Jugar’ stemchanging verbs
Weatherexpressions
24

Consensograms
Purpose: Consensograms may be used to collect information about individuals’ perceptions. The leader poses a question and asks each group member to record his or her thoughts or feelings. Once everyone has placed their marker on the consensogram, the group analyzes the results and determines the next steps.
Consensograms can:
Help to determine levels of understanding i.e., “How much do you know about…”
Allow students an opportunity to express their feelings about a certain subject i.e., “How did you feel about the unit test?”
Provide the teacher with “quick information/data” so instruction can be modified/differentiated.
Help to send the message to students that their ideas, beliefs, and feelings are important and valued.
ExamplesI am proficient at writing a BCR. Time spent studying for this assessment:
Not yet Getting there I can teach it
How prepared for Thursday’s test?
0 1-10 11-20 21-30 31+(Minutes)
After seeing my report card, I felt…
25

Help!!! Somewhat Totally
26

Consensogram
Question:_________________________________________________________
1 2 3 4 5 6 7 8 9 10
27

Consensogram
Question:________________________________________________________
Always Sometimes Never
28

Consensogram
Question:________________________________________________________
29

Issue Bin
Purpose: This quality tool is a vehicle that opens and channels communication in a constructive way.
Using the Issue Bin: Acknowledges team members’ ideas and questions
Sends the message that all ideas/concerns/questions/needs are valued
Maintains a history of team ideas/questions
Allows meetings to continue without getting “bogged down” over issues/concerns
Examples:
Affinity Diagram
Issue Bin
Where are the permission slips?
Can I talk to you at recess?
I am going on vacation and need my homework for next week.
I don’t understand the math.
30

Light Voting
Light voting is a tool used to allow everyone in the group to have a voice in the decision-making process.
Step 1: State the question.
Step 2: Brainstorm a list of ideas.
Step 3: Determine the number of votes per student by dividing the total number of choices by 3 and rounding to the nearest whole number.
Question: How shall we celebrate our success when we reach our goals?
Activity Number of VotesFifteen minutes of extra recess xxxxxxxxxxxxxxxxxxxxxxxxxxIce cream party xxxxxSilent speedball xxxxxxxxFoozeball xxExtra silent reading time x“Who Wants to be a Millionaire” game xxxxxxxxxxxxxxFree time xxxxxxxxxxNo homework one day xxxxxxxxxxxxxxxxxExtra computer lab time xxxKaroke xxxxx
31

Looks Like, Sounds Like, Feels LikePurpose: This quality tool is used to concretely define expectations. “Looks Like, Sounds Like, Feels Like” should be:
1. Written as a team: A brainstorming technique such as an affinity diagram may be used to elicit all stakeholders’ input.
2. Posted: Posting this chart helps reinforce the group’s expectations.
3. Reviewed: By consistently reviewing the ground rules, teachers and students set the stage for learning. Many disruptions and/or behavioral problems are avoided when the group revisits the “Looks Like, Sounds Like, Feels Like” chart daily, weekly, and/or prior to a lesson/class period.
4. Revised: This strategy may be used several times for different situations. For example, a teacher may decide to pose these questions regarding their classroom atmosphere and again use it when discussing expectations for non-classroom behavior or independent work time.
5. Monitored and discussed when violated: What happens when a group member or several group members are violating the determined expectations? There are several strategies that may be used:
~Brainstorming ~Affinity Diagram ~Light/weighted vote ~Imagineering/Visioning
Looks Like, Sounds Like, Feels Like
Looks Like Directions posted Quality work posted Neat and organized Bright and cheerful Special areas to work Kids involved in
projects The teacher sitting and
meeting with small groups
Feels Like Mutual respect A safe environment Groups getting along Happy A lot of people are
involved in learning Feels comfortable Feels like we can be
open and honest
Sounds Like Students working
quietly Teacher whispering to
students The sound of the
computer turning on and off
Pages flipping Pencils writing
32
When I envision the “perfect”__________________________, it:
Looks Like
Sounds Like
Feels Like
33

Process Tips for Plus/Delta+/∆
Purpose: This evaluation tool provides a method for continuous improvement for a team. Even in well operating and efficient teams, the +/∆ evaluation can help the team stretch itself to even higher levels of performance.
Pluses (What worked well?)
Pluses should identify the things that are working.
Pluses are the items that you want to maintain.
Pluses are the items that you want to strengthen/build upon.
Deltas (What are some opportunities for improvement?)
Identify the things (deltas) that are not working and need to be changed or included.
Deltas should be action oriented and begin with a verb.
Deltas should be specific.
Deltas should be within the realm of possibility.
Deltas should be posted, reviewed, and acted upon as soon as possible.
Hint: Limit the ∆’s to a manageable number to prevent being overwhelmed.
+Good pacingInteresting topicHands-on materialsEveryone was participatingGood discussionsLots of people shared ideasDifferent activities to choose from
∆Monitor noise levelLimit sidebars Slow pace of lessonModel examplesCheck for understanding with new vocabulary words
34

Plus/Delta
Plus+
(What is working that we want to continue?)
Delta∆
(Opportunities for improvement)
35

Survey
Purpose: A survey is used to collect data from stakeholders in order to compare perceptions. Surveys may be used when a new project is planned, to prove the needs and wants of a group, to determine improvement strategies, or to evaluate a program.
Surveys:
Can be used with a large or small group Can provide an overall view Provide a springboard for change Help to identify levels of satisfaction
While surveys are the most commonly known method for gathering stakeholder input, other data collection and analysis tools may be appropriate to use. Many people use the term survey as a generic term for any attempt to ask for in-put, however there are other methods that may be used to capture stakeholders’ perceptions:
Informal Discussion Open-ended Inquires Needs Assessments Focus Groups Time-of-Service Feedback
Check List for Planning a Survey:
Determine what data already exists Determine what information is needed Describe the purpose and scope of the survey Determine which tool is the best approach for gathering and analyzing information Determine who will be surveyed Determine when the survey will be conducted Develop core questions Test the core questions to make sure they are valid and reliable Determine how the survey results will be analyzed Develop an action plan
Picture of BallotScantron Card
36

Survey
Survey Questions Strongly Agree
Somewhat Agree
Disagree Strongly Disagree
Additional Comments:
37

Personal Reflections: Self-Monitoring ToolDirections: This self-monitoring tool may be used for planning and implementation as you work towards building a Classroom Learning System using the Baldrige Education Criteria for Performance Excellence.
CLS “Look Fors” Yes No Comments/Future Plans
Ground rules
Consensograms
Issue Bin
Plus/Delta
Affinity Diagram
Surveys
“My Job, Your Job, Our Job”
“Looks Like, Sounds Like, Feels Like
Classroom mission statement
38

39

Building a Classroom System of Shared Accountability
Purpose of building a Baldrige based classroom of shared accountability: Shared accountability allows students to take an active role in their education. By analyzing progress, setting goals, and creating action plans, students are able to evaluate their learning based on the identified standard.
Benefits of building a Baldrige based classroom of shared accountability:
Builds trust and respect. Goals give direction and purpose. Enables students to see the connection between their actions and their progress. Helps students to plan for success. Helps students to recognize opportunities for improvement. Provides a concrete and visual reminder. Allows each student to be part of the solution through process thinking and problem solving. Provides incentives. Promotes classroom collaboration. Provides alignment.
Setting GoalsIn the beginning of the school year, students need to know the long-term goals. In the process of mapping out their plan of action, students develop short-term goals which together lead to attainment. In addition to short and long term goals, students should be encouraged to consider challenging themselves by identifying stretch goals.
When working with students to set goals, remember that the goals must be important, within reach, reasonable, clearly defined, and measurable. They are followed by a clearly defined plan of action. Some classrooms use “SMART” goals:
Specific goalsMeasurable goalsAchievable goalsRelevant goalsTrackable goals
40

Sample Goals
Secondary Writing Example
Long Term Goal Short Term Goal Stretch Goal
Write a cohesive ECR that includes a well-developed introductory paragraph, which includes an introduction, supporting details and conclusion as measured by the MCPS writing rubric.
Write a well-developed introductory paragraph that establishes the purpose, speaks to the audience, and addresses the topic as measured by the MCPS writing rubric.
Write a well developed, multi-paragraph extended constructive response that addresses all parts of the rubric as measured by the MCPS writing rubric.
Primary Writing Example
Long Term Goal Short Term Goal Stretch Goal
Write a well-developed paragraph that includes a hook, a topic sentence, supporting details, and a concluding sentence as measured by the MCPS writing rubric.
Write a concluding sentence that summarizes the paragraph as measured by the MCPS writing rubric.
Write a well developed, multi paragraph piece that includes an introduction, three or more supporting details, and conclusion as measured by the MCPS writing rubric.
Class Reading Example
Long Term Goal Short Term Goal Stretch Goal
Read five hundred (20 students x 25 books) books by June 12th.
Read forty (20 students x 2 books) books by the end of September.
Read six hundred (20 students x 30 books) books by June 12th.
Remember: A goal without a measure is a wish!
See My Job, Your Job, Our Job, pp. 26-28Finger
With tie
41

My Goal
Name:__________________________ Period______________________
1. My goal is:________________________________________________________________________________________________________________________________
2. I will accomplish my goal by:________________________________________________________________________________________________________________________________
Assignment/ Mastery Objective Total Points Points Earned Percentage
Quiz Grades
42
Goal Setting
My goal is to: ____________________________________________
I will accomplish this goal by:
The date that I will have accomplished this goal is: ______________
I know that I will have accomplished my goal when: ___________________________________________________________________________________________________________________________________________________________________________________
Student Signature: __________________________________Parent Signature: ___________________________________Teacher Signature: __________________________________
43

Math Action Plan
My math goal is:_________________________________________________________________________________________________________________________________________________________
My improvement plan is:_________________________________________________________________________________________________________________________________________________________
I will monitor my progress by:_________________________________________________________________________________________________________________________________________________________
Student Signature: ___________________________________
Parent Signature: ____________________________________
Teacher Signature: ___________________________________
44

Writing Action Plan
Name: __________________________ Current Stage: _______
What are some areas in writing that I need to improve?___________________________________________________________________________________________________________________________________________________________________________
What are my goals?___________________________________________________________________________________________________________________________________________________________________________
These are the steps I will take to reach my goals: _____________________________________ _____________________________________ _____________________________________
How can my parent and teacher help me to reach my goals?___________________________________________________________________________________________________________________________________________________________________________
45

My Academic Goal for 7th Grade World Studies
I, ________________________________, plan to earn a
grade of _____ in my world studies class for the second marking period, November 3, 2004 - January 24, 2005.
Students who want to improve their grade, maintain a high grade, or improve their understanding and ability in world studies may consider one or more of the following:
Improving attendance Completing all homework Taking steps to make sure that they understand the material. These steps may include studying
with classmates and using MAP to ask the teacher for clarification. Reviewing class work on a regular basis (daily) Using “Before, During and After” reading strategies when reading/studying text material. Using mnemonic devices to help remember ideas Rewarding themselves for achieving good grades Finding strategies to stay focused during class Socializing less in class Having all materials for class Improving the organization of their notebook Getting more sleep on school nights
Think about the items on this list. Which of these pertain to you? Is there some other strategy that can help you achieve your goal?
The actions I plan to take in order to obtain my goal are:
_____________________________________________ _____________________________________________ _____________________________________________ ______________________________________________
Remember, only you can make a difference in your grades. With hard work, determination, and commitment, you can meet your goal and be highly successful.
Student Signature _______________________________
Name: ____________________________
Date: _____________________________
46

Interim Grade Evaluation – 2nd Marking Period
My goal for my 2nd quarter grade in world studies is: ______My 2nd quarter interim grade in world studies is: ______
Circle the correct choice:I did meet my academic goal for the second quarter.I did not meet my academic goal for the second quarter.
I earned my grade because:
____ I completed all assignments.____ I came to class prepared to learn.____ I participated actively and cooperatively during all class activities.____ I paid attention and followed directions.____ I used study strategies to prepare for quizzes and tests.____ I kept my notebook organized.____ I was rarely absent or late for class.____ I used my assignment notebook every night.____ I looked up my assignment on the homework board. _____ I did not complete all assignments.____ I was not prepared with some or all of my assignments. ____ I did not write my homework in my assignment notebook every day.____ I was often late or absent from class.____ I was frequently unprepared for class…paper, atlas, pen or sharpened pencils.____ I did not contribute in a positive way to class discussions.____ I did not use active study strategies to prepare for quizzes or tests.____ I did not take responsibility for my own learning.
What I can do to reach my goal in world studies:___________________________________________________________________________________________________________________________________________________________________________________________________________________________________________________________________________________________________________________________________________________________________________________________________________________________________
47

Review of My Academic Goal for 7th Grade WSI, ________________, planned to earn a grade of _____ in my world studies class for the second marking period, Nov. 3 – Jan. 24, 2005. My grade was ________.Circle the correct statement:I met my academic goal for the 2nd marking period.I did not meet my academic goal for the 2nd marking period.
I earned my grade because:(Circle those that apply) I complete all assignments. I met all due dates and deadlines. I came to class prepared to learn. I was prepared for class with all my materials: paper, pen, and atlas. I participated actively and cooperatively during class activities. I used active study strategies to prepare for tests/quizzes. I kept my notebook organized. I was absent no more than 2 days for the marking period. I used my assignment notebook every night. I looked up my assignments online on the homework board. I did not complete all assignments. I handed in work late or past the due date or deadline date. I was absent more than 5 times this marking period. I was frequently unprepared with my assignments. I did not contribute in a positive way to class activities. I did not write my homework in my assignment notebook every day. I did not use active strategies to prepare for tests and quizzes. I did not come with pens, pencils, or paper every day. I did not take responsibility for my own learning. Other: ______________________________________.
I, ____________________, plan to earn a grade of _____ in my world studies class for the third marking period, January 25 – April 7, 2005.
The actions I plan to take in order to obtain my goal are:
_____________________________________________ _____________________________________________ _____________________________________________
______________________________________________
______________________________________________
Name:____________________________________________ Date: ____________ PD: _______ Marking Period: _______
Remember, only I can make a difference in my grade. With hard work, determination, and commitment, I can meet my goal and be highly successful.
48

Report Card Reflection and Goal
Directions: On the opposite page, mark an “X” on the section of the circle graph that reflects your final grade. Mark an “X” on the appropriate rating you earned for your Learning Skills areas (Participation and Assignment Completion). **Reflect on your progress for this Term. Select and complete one item below in each section that best represents your progress, thoughts, and goals.
Learning Skills Codes: C = Consistently; O = Often; S = Sometimes; R = Rarely
I. Final Grade (Select one and complete)
_____ I am pleased with my overall grade for this Term because: ______________________________________________________________________________________________________________________________________________________________________
_____ I am not pleased with my overall grade for this Term. I intend to improve my overall grade by taking the following actions:
_____________________________________________________________________________ _____________________________________________________________________________ _____________________________________________________________________________
II. Learning Skills: Participation – “P” (Select one and complete)
_____ I am pleased with my rating in “P” because: ______________________________ _________________________________________________________________________________________________________________________________________________________________________
_____ I am not pleased with my rating in “P”. I intend to improve my rating by taking the following actions: _____________________________________________________________________________ _____________________________________________________________________________ _____________________________________________________________________________
III. Learning Skills: Assignment Completion – “AC” (Select one and complete)
49

_____ I am pleased with my rating in “AC” because: ___________________________________________
_____ I am not pleased with my rating in “AC”. I intend to improve my rating by taking the following actions:
_____________________________________________________________________________ _____________________________________________________________________________ _____________________________________________________________________________
“Actions” Ideas: Attend MAP frequently and before assessments Complete all HW everyday Have all materials ready to begin class on time Complete all CW on time Pay attention and actively listen Ask questions in class to seek clarification Actively engage in the lesson Follow written and oral directions Copy all information and show all work as directed Seek accuracy on all assignments Seek help from peers, parents, friends Maintain an organized binder with all materials, assignments, resources, notes, etc. Accurately copy all assignments and check assignment book each night Make-up all work on time Use all resources such as the TMS “HW BOARD”, MAP offered, etc. Prepare for and participate in “Retake Quiz”.
Parent Signature: __________________________________
Comments:
50

Displaying Data
Purpose: The data center provides a central location where the mission statement, goals, core values and classroom data are posted. Posted data is classroom/group data, not individual student data. This focal area communicates grade level expectations and performance results. In addition, ground rules, the My Job, Your Job, Our Job chart, and classroom mission statement are displayed as both a visual reminder and a springboard for class meeting discussions. These tools communicate the shared commitment to learning and continuous improvement. Once the mission is posted, it is time to begin setting goals and collecting data. The data wall becomes a tool where the teacher and students discuss results, analyze performance, solve problems, and make decisions using quality tools.
Our Classroom Data Center
Your Job
My Job Parents’
Job
Our Job
Classroom Ground Rules
Our Core ValuesOur Classroom Mission Statement
Goal Goal Goal Goal
Data
Data
Data
Data
Data
Data
Data
Data
51

Using Graphs to Display Data
Bar Graphs can be used to compare one data point to another. The bars show changes in magnitude.
Control Charts are used to focus on acceptable limits of the process. They help define which variations are common and which ones are special (and in need of attention). In a control chart, the control limits are set according to the data collected. The Upper Control limit (UCL) is approximately three standard deviations above the mean, and the Lower Control Limit (LCL) is approximately three standard deviations below the mean.
Histograms are bar graphs that reflect a moment in time. They provide specific details that are hidden by class averages.
Line Graphs, also known as run graphs, are used to show information that change continuously over time. A continuous line is drawn between the data points and shows change in direction. Several variables, each with its own line, can be shown on a single graph.
Line Plots are created by marking values above a number line. The number of marks indicates how many times each score occurred. Line plots show outliers, clusters, and gaps.
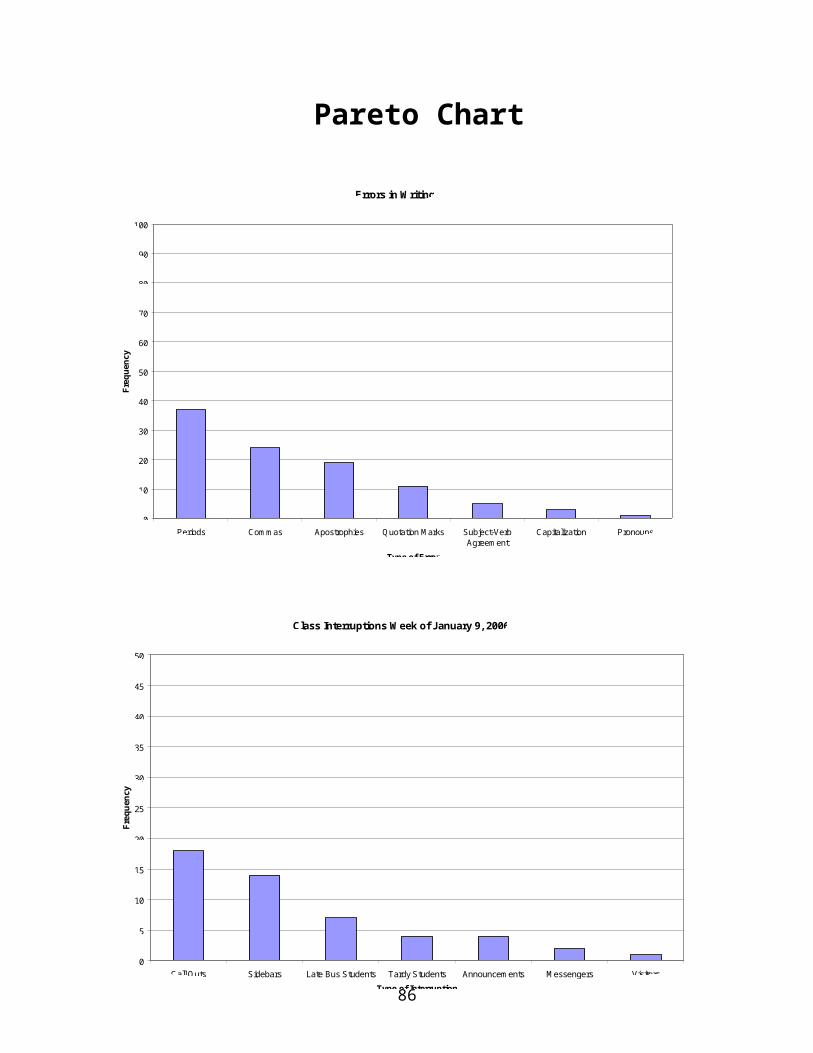
Pareto Charts are used to discriminate between the vital few and trivial many. Data on a Pareto chart is graphed from largest to smallest.
Pie Graphs show a comparison of component data elements against the whole.
Radar Charts are used to identify trends and patterns. They show the gaps between the categories. Radar charts are also known as spider charts.
Run Graphs, also known as line graphs, are used to show information that change continuously over time. A continuous line connecting the data points shows changes in direction. Several variables, each with its own line, can be shown on a single graph.
Scattergrams, or scatter plots, show trends through the distribution of the points comparing two variables. They can be used to explore relationships.
Tally Charts are marks collected in labeled columns on a grid as the information is collected. They are one of the easiest ways to record data.
Target Graphs provide a concrete visual of the targeted goal. Data can be placed in the bands around the center.
52

Bar Graph
0
5
10
15
20
25
30
Number of Students
1 2 3 4 5Class Periods
Homework Completion: Research Project
Completed HomeworkDid not Complete Homework
53

Control Charts
Transition Time Between Math Class
0
2
4
6
8
10
12
14
16
18
20
Monday Tuesday Wednesday Thursday Friday
Days of the Week
Num
ber o
f Sec
onds
Bar Graph
Num
ber o
f Sig
ht W
ords
54

Basic Addition and Subtraction Facts
0
3
6
9
12
15
18
21
24
27
Twos Threes Fours Fives Twos-Fives Sixes Sevens Eights Nines Sixes-Nines Twos-Nines
Addition and Subtraction Fact Quiz
Num
ber o
f Stu
dent
s M
eetin
g Ex
pect
atio
n
Jim's Mile Run Times
0
1
2
3
4
5
6
7
8
9
10
11
12
13
14
15
16
17
18
Week1
Week2
Week3
Week4
Week5
Week6
Week7
Week8
Week9
Week10
Week11
Week12
Week13
Week14
week15
Week16
Week17
Week18
Weeks
Tim
e in
Min
utes
Histogram
55

Line GraphNu
mbe
r of F
acts
56

Class Interruptions Week of January 9, 2006
0
5
10
15
20
25
30
35
40
45
50
Call Outs Sidebars Late Bus Students Tardy Students Announcements Messengers Visitors
Type of Interruption
Freq
uenc
y
Errors in Writing
0
10
20
30
40
50
60
70
80
90
100
Periods Commas Apostrophies Quotation Marks Subject-VerbAgreement
Capitalization Pronouns
Type of Error
Freq
uenc
yPareto Chart
57

Pie Graph
58

How Well Are We Following Our Ground Rules?
0102030405060708090
100Show Respect
Work Quietly
Keep Your Body to YourselfListen to the Speaker
Follow Directions
MondayTuesdayWednesday
Ou
Number of Mrs. Fry's Students Who Recognize the Upper Case Letters
(as of November 1)
0
2
4
6
8
10
12
14
16
18A
BC
D
E
F
G
H
I
J
K
LM
NO
P
Q
R
S
T
U
V
W
X
YZ
Individual Sit-ups Per Minute
4240
3735
39
31
26
28
23
0
5
10
15
20
25
30
35
40
45
Week 1 Week 2 Week 3 Week 4 Week 5 Week 6 Week 7 Week 8 Week 9
Week
Num
ber o
f Sit-
ups
Radar Chart
Run Chart
59

Reading Progress
318
302
284269
251
232
203
171
136
102
81
0
50
100
150
200
250
300
350
August September October November December January February March April May June
Months
Cla
ss T
otal
Rea
ding
Rec
over
y Le
vels
60

Scattergram
Third Grade: Unit One Quiz 1 Data
0-50% 60% 70% 80% 90% 100%
Gather and organize data from a variety of sources
Organize and display data using tables, pictographs, and bar graphs using the appropriate scale.
Interpret and compare data from tables pictographs and bar graphs.
= two students
Conjugating Verbs: Spanish 1 A
ar verb er verb ir verb jugar verb
0-50%
60%
70%
80%
90%
100%
61

Tally ChartNumber of Students Who Brought Their Books to Class
Week of 2/6/06 Week of 2/13/06
Monday
Tuesday
Wednesday
Thursday
Friday
Decimal FractionsQuiz Retest
A
B
C
D
E
62

Target Graph
MSA Reading - BCR Rubric
Score 3 The response demonstrated an understanding of the complexities of the text.
Addresses the demands of the question Effectively uses text-relevant information to clarify or extend understanding
Score 2The response demonstrates a general understanding of the text.
Partially addresses the demands of the question Uses text-relevant information to show understanding
Score 1The response demonstrates a minimal understanding of the text.
Minimally addresses the demands of the question Uses minimal information to show some understanding of the text in relation to the question
Score 0The response is completely incorrect, irrelevant to the question, or missing.
01
322
63

Building a System of Individual Student Accountability
Developing Data Notebooks or Folders
A data notebook folder could contain the following components:
Mission Statements (School/Classroom/Individual) Class Ground Rules Classroom Core Values Contracts My Job Chart Classroom Goals and Action Plans Individual Goals and Action plans Graphs and Charts showing individual student achievement Instructional Objectives Quality Tool Templates Parent Communication Forms Student/Parent Reflection Sheets
Other:“Quick Check” Resource SheetTable of ContentsStudent QuizzesReport CardsParent Conference Summary SheetInterimsReading Logs
See My Job, Your Job, Our Job pp. 39-47
64

65

Plan, Do, Study, Act
Plan:State the problem to be solved or
identify the project.Clarify objectives and goals. Identify Key players or team
members.Plan activities/strategies.
Do: Design appropriate tools.Do appropriate activities.
Study: Study the progress against the
goals and objectives.See if your plan is working. Identify and remove road blocks.
Act: Complete action.Document findings.Communicate results.Determine if the plan worked. If the plan worked, why? If the plan did not work, why not?
The PDSA process/cycle was developed for scientists at Bell Laboratory. This model is researched based and has been proven to be one of the best strategies used by organizations to ensure continuous improvement.
See Future Force, pp. 98
66

Plan, Do, Study, Act
Plan: Do:
Study: Act.
67

Leadership“What” questions:1. What are the vision, mission, values, and performance expectations of the school?2. What will be done to communicate the school’s vision, mission, values, goals/objectives, and performance expectations?3. What is the monitoring plan for determining what is working and what is not working?
“How” questions:1. How are the school’s vision, mission, values, and performance expectations developed, including the participation of all stakeholders?2. How will the school’s vision, mission, values, goals/objectives, and performance expectations be communicated to all stakeholders?3. How is the school’s performance monitored and how is the information used for continuous improvement?
Stakeholder Focus“What” questions:Based on the data:1. What are the educational needs of all students and subgroups of students?2. What are the expectations of students and stakeholders?3. What are the levels of satisfaction/dissatisfaction of students and stakeholders?
“How” questions:1. How does the school determine student (including subgroups of students) and stakeholder needs and expectations? What processes will be used to disaggregate data?2. How does the school determine and build student and stakeholder levels of satisfactions or dissatisfaction?
Faculty and Staff Focus
“What” questions:1. What are the professional development and resource needs of the staff to implement the school improvement plan?2. What is the staff’s level of satisfaction and dissatisfaction with the current work systems and school environment?
“How” questions:1. How does the school determine the needs for professional development to utilize their full potential in meeting the school’s goals/objectives?2. How does the school maintain a work environment and staff support climate that contribute to the well-being, satisfaction, and motivation of all staff members?
Process Management“What” questions:1. What are key processes that have been put in place to support and sustain the SIP goals/objectives and actions within each category?
“How” questions:1. How are key processes defined, designed, and deployed to support and sustain the SIP goals/objectives and actions within each category?2. How have key processes been aligned and integrated to maximize efficiency?3. How is the PDSA model used for continuous improvement?4. How are quality tools used to enhance participation and facilitation of processes?
Information and Analysis
“What” questions:1. What formative measures have been identified to use along the way to make sure that we are on the right path with the actions in each category?2. What tools are in place to take corrective and rapid action, if needed? (e.g., PDSA)
“How” questions:1. How were formative measures identified or developed to monitor progress?2. How often is data collected, analyzed, and shared with stakeholders?3. How do schools ensure the quality and availability of needed data and information?4. How are the data used for continuous improvement?
Strategic Planning“What” questions:1. Based on student and stakeholder needs, expectations, and requirements, what are the measurable, priority school improvement goals/objectives?2. What are the action plans for the goals/objectives? (who, what, when)3. What monitoring plan will be used to ensure that the action plans are implemented effectively?
“How” questions:1. How does the school engage all stakeholders in the school in the school improvement planning process?2. How are action plans developed and monitored?3 How are Professional Development Plans (PDPs) and actions developed to support the plan?
Performance Results
“What” questions:1. What summative measures will be used to establish baseline data and to determine progress with SIP goals? (e.g., student achievement, student and stakeholder satisfaction, staff training and well-being, leadership systems, benchmarking, key processes and systems)
“How” questions:1. How well are we doing in achieving our goals/objectives and action plans?2. How will our results be used to improve our school and guide our school improvement planning process?
Linkages Chart for the Essentials of Baldrige-Guided School Improvement Planning up front with the quality toolsThe Linkages chart shows the interrelationship and interdependency of all of the Baldrige Categories and Core Values.
68

Action PlanAn Action Plan is a tool that individuals and groups use to record tasks that need to be completed in order to reach targeted goals.
Goal: To complete homeworkWho What Resources When
Student Bring assignment notebook to class PencilAssignment notebookGlasses
Every day
StudentCopy homework assignment into notebook
PencilAssignment notebook Glasses
As soon as seated in the classroom
Teacher Assignment written on board Chalkboard/chart paper Before class
Homework Buddy and Student
Check assignment book for completeness and accuracy
Assignment notebook Immediately after assignment is recorded
Student Get signature from teacher Assignment notebookPencil
As leaving class
StudentTake assignment notebook and materials home
Assignment notebookBinderHomework materials
End of day
Parent Provide space and time for homework completion
Table/deskLightMaterialsQuiet
Each evening
Student Actively complete homework Materials needed Each evening during time established
Student If confused, get help from parent or homework buddy
MaterialsPhone
As needed
Student &Parent
Have parent check off that homework has been completed
Completed assignmentAssignment notebook
Each evening
Student Put completed assignment in binder Completed assignmentBinder
When completed
Student Take homework/binder/completed homework assignment to class
HomeworkBinder
Next day
69

Action Plan
Who What Resources When
70

Bone DiagramA Bone Diagram is a planning tool that helps organizations define their currentand desired states. This tool includes the driving and restraining forces of theForce Field Analysis.
Transition Period
Present State
-Chaotic afternoons-Time off task-Listening issues-Poor quality of work-Disruptive dismissal
Desired State
-Productive afternoons-Maximum time on task-Active Listening-Excellent work quality-Organized dismissal
Restrainers Adverse attitudes Negative attitudes Apathy Poor communication No pride in work Do not want to get involved Expect quick results Do not want responsibility Past practice and habits
Drivers Clear
expectations Flow charts Behavior
monitoring charts Personal
responsibility Clearly defined
consequences Commitment Shared
responsibility Group meetings
to discuss progress
71

Bone Diagram
Transition Period
Drivers
Restrainers
72

Checklist
Purpose: The purpose of a checklist is to enable one to keep track of progress in completing tasks.
Centers When CompletedWord WorkPoemWritingListeningGameWord WallDramaFree Choice
Work Completed With the Substitute Teacher
Subject None Some All
Warm -up
Reading work
Math work
Writing
Science
Social Studies
73

Fishbone DiagramThe Fishbone Diagram helps groups to determine root cause. (It does not establish actions to solve the problem.)
Horse playing in the locker roomModels skills
Misusing the equipment
Sidebar conversations during instructions
Comfortable temperature
Well-litHave use of entire gym
Not enough equipmentUnorganized equipment
Faulty equipment
Effect
Teacher
Cause Cause
Materials/ResourcesEnvironment
Students
PE is sometimes unsafe
Sets expectations
Cause Cause
74

Fishbone Diagram
CauseCause
Cause Cause
Effect
75

Five Whys
The Five Whys helps to drill down and identify the root cause of a problem. The question “Why” is asked five (or more) times.
Why are our team meetings unproductive?
Answer: We spend too much time talking and sharing stories about things that happen in our classrooms.
Why do we spend too much time talking about personal things and sharing stories about things that happen in our classrooms?
Answer: We don’t have a focus for our meetings.
Why don’t we have a focus for our meetings?
Answer: We aren’t organized with an agenda.
Why aren’t we organized with an agenda?
Answer: We don’t have a process for developing an agenda.
Why don’t we have a process for developing an agenda?
Answer: We haven’t taken time to look at our data to assess our needs.
Flow Chart Symbols76

Task Box
Meeting
Decision Diamond
More information on another flow chart
Report
End
77

Flow Chart
Writing a Persuasive Paper
Flow Charts enable groups to clearly define, communicate, and monitor multi-step processes.
Write your first draft. Be sure to use the rubric/criteria as you write your paper. Edit/Revise your paper.
Determine a topic or argument.
Begin researching your topic to find important informationthat will support your position and weaken the opposing side.
Record research information on index cards and be sure to create a bibliography along the way.
Begin your outline. Remember to save your strongest argument as the clincher.
Continue researching.
Write your final draft and proofread.
Do you have “expert”witnesses and/or data (numbers) toSupport your argument?
NO
YES
78

Force Field Analysis
Goal: Score 80% or above on our unit test.
Drivers: What are we currently doing that is helping us to reach our goal?
Preventers: What is keeping us from reaching our goal?
Studying before the test
Paying attention in class
Taking notes
Asking for help
Completing our homework
Completing our study packet
Knowing how to study
Commitment
Off task behavior
Incomplete work
Irresponsibility
Choosing not to study
Leaving materials in school
Avoiding help
Poor attitude
Lack of Effort
How do we maintain and strengthen the Drivers? How do we reduce the Preventers?
Next steps: Action PlanWhat needs to be accomplished?
Who will be responsible for the task?
When will task be completed?
Complete all homework assignments
StudentsParents
Every night
Finishing my study guide questions
Students By next Thursday
Force Field Analysis is a tool used to analyze current behaviors/beliefs that may be “driving” the group to reach the target goals, and those practices/beliefs that are preventing groups from reaching the goal. Once the preventers have been identified, action plans may be written to address the issues.
79

Force Field Analysis
Goal: ________________________________________________ ________________________________________________
Drivers Preventers
How do we maintain and strengthen the Drivers?
How do we reduce the Preventers?
Who What When
80

+3
+1
+2
+1 +2 +3-2-3 -1
-2
-1
-3
Four Quadrant DiagramThe Four Quadrant Diagram may be used with small groups to determine individual or group perception. Once areas have been identified, other tools such as the Force Field Analysis, PDSA, and/or Action Plan may be used to address high resistance/high impact areas. (Please note that other quadrant descriptors can be used, such as high/low expectations, high/low support, high/low achievement, etc.)
Goal: To implement Baldrige-based Classroom Learning Systems throughout our school.
Where would you place the following? Setting classroom Ground Rules Defining “My Job, Your Job,
Parents’ Job, Our Job”? Using Affinity Diagrams Using Consensograms Using Plus/Deltas
Writing a class Mission Statement
Defining Core Values Holding Class Meetings
Taking Surveys Using the PDSA process Using a Force Field Analysis Setting class Goals Creating class Action Plans Keeping class Data Posting class Data (no personal
identification) Setting individual Goals
Using student Data Notebooks Sharing “Quality Tools I’ve Used”
at staff meetings Holding Baldrige training
sessions during staff meetings Attending a Baldrige Quality
Academy Continuously referring to
classroom Ground Rules, Jobs, Mission Statement
Low Resistance High Resistance
Low Impact
High Impact
81

Four Quadrant Diagram
Low Resistance
High Impact
High Resistance
Low Impact
+1
+2
+3
+4
+1 +3+2 +4
-1
-1-3 -2-4
-2
-3
-4
82

If…ThenIf…Then is a projection tool used to predict possible consequences that might occur when organizations are planning for change. It shows predicted “domino” effects of decision making.
If we
hav
e le
ss h
elp
in c
lass
room
s,
then our neediest students won’t get the academic help they need.
If we
incr
ease
sta
ff co
vera
ge, then we have
less help in classrooms.
Question: How can we reduce office referrals during recess?
If…
Then…
If…Then…
If we provide more playground equipm
ent,
then students will have more to do during recess.
If students have more to do during recess,
then there will be less teasing and fewer arguments.
If we provide structured activities,
then students will have limited choices during recess.
then they will have fewer opportunities to make poor choices.
If students have limited choices
during recess,
83

If…Then
.
Question:
If…Then…
If…
Then…
84

Interrelationship Diagram
What Factors Contribute to Student Success?
(arrows out, arrows in)
Home environment
(5,0)
Student motivation(1,4)
An Interrelationship Diagram helps to identify the cause and effect relationship between two factors.
Attitude(2,3)
Opportunities to feel successful
(2,3)
Student/TeacherRelationship
(4,1)
Effort(1,4)
Interrelationship DiagramQuestion:___________________________________________________________________________________________
Factor 1
Factor 2
Factor 3
Factor 6
Factor 5
Factor 4

Ladder
Step 1 Read the question before reading the text.
Step 2 Make sure that you understand what the question is asking.
Step 3 Read the text. Remember to think about the question being asked as you read.
Step 4 Answer the question!
Step 5 a. Give an example from the text.Make a connection.Describe the clues you found as
you were reading (inferences).
The Ladder provides a graphic organizer that allows groups to list the steps that will lead them to the desired state.

Ladder

Lotus Diagram
Outline BibliographyNote Taking
Strategy
Mini Lessons Research Report
Multiple Resources
6 Traits of Writing
FormatMini Lessons
OralReport
BibliographyOutline
Multiple Resources
Format
Note Taking Strategy
6 Traits of Writing
Oral Report
The Lotus Diagram is a brainstorming and organizational technique that enables the group to define key concepts as well as all the parts of the whole.

Lotus Diagram

Morphing
Current State65% of the class is unable to choose an appropriate problem solving strategy, apply it, and correctly solve the problem.
The class will work on reading comprehension strategies.
Students will determineimportant information in the text, and will circle and underline it.
Students will determine which operation or strategy to use, choosing from a list of options.
Students will correctly solve the problem and explain why they chose the problem solving strategy.
Morphing is similar to the Bone Strategy. This technique is particularly helpful for those visual processors. Morphing helps the group to understand the processes and time involved in systematic and systemic change.

Morphing

ORIDFocused Conversation
Data AnalysisLevel of
QuestionsPurpose Questions to Answer
OObjective Level
To examine the data
To identify factual information
What do you see? What factual statements
can you make based on the data?
RReflective Level
To encourage participants to make connections
To encourage free flow of ideas and imagination
What surprised you? What encouraged you? What discouraged you? How does this make you
feel?
IInterpretive Level
To identify patterns and determine the significance or meaning
To articulate underlying insights
What does the data tell us – what new insights do you have?
What good news is there for us to celebrate?
What doesn’t it tell us and what else might we need to know?
What areas of need seem to arise?
DDecisional Level
To propose next steps
To develop an action plan
To make decisions
To experience “coming together”
What are our proposed next steps?
What decisions can we make?
What is our action plan for moving forward?

ORID
Data Conversation Step Your Comments O
R
I
D


Parking LotThe Parking Lot technique is commonly used as a summative evaluation after a lesson or meeting. It incorporates the plus/delta sstragegy with a questions and future ideas component.
Example: Feedback from Baldrige Workshop
What’s working? The information was valuable. We were able to spend time planning. The strategies can be used immediately. The pacing was excellent. We don’t feel overwhelmed!
What questions do you have? Will this take away from instructional time? What are the expectations?
What are the next steps? Leadership team will determine scope and sequence for
implementation. Teams will reach consensus. Volunteers will make poster templates. Staff development time will be used for more training.
Ideas (Additions, deletions, and/or modifications)?
Model the mission statement lesson. Choose three quality tools to focus on.

Parking Lot
What’s working? What questions do you have?
What are the next steps? Ideas (Additions, deletions, and/or modifications)?

Problem Statement
Who What When
TeacherTeachers will stand outside doorway.Teachers will document tardy students and give data to SDT.
Before and after each class
Staff Development Teacher SDT will collect and post data.Weekly
AdministratorsAdministrators will clearly communicate hallway expectations.Administrators will sweep hallways and stairwells.Administrators will implement discipline policy.
Before and after each class
StudentsStudents will be responsible for following hallway procedures.
Before and after each class
Problem StatementThe greatest amount of office referrals occur during the transition time between classes. Students who are sent to the office lose instructional time.Possible Causes:
Bullying Horse play in the hallway Too much time between classes
Impact on the OrganizationStudents who are sent to the office end up missing too much class. Once students are sent back to class, they’re behavior is usually disruptive and disrespectful. This impacts the culture in the classroom and affects the quality of instruction.
Desired StateStudents use appropriate behavior in the hallways. All students arrive to class on time and are ready for learning when the bell rings. There are no office referrals during transitional time between classes.
Action Plan
The Problem Statement tool enables a group to clearly define a problem. This strategy enables teams to communicate in a logical, risk-free, and open environment. Once the statement has been developed, teams may work towards solving the problem using a variety of problem solving/process thinking tools.
Not enough adult supervision Expectations have not been clearly
defined and monitored
Step Two: Using the ideas from the brainstormed list, the group determines which behavior(s) they believe to be the root cause of the problem. Weight voting or a consensogram may be used to help the group reach consensus. Action plans are written to address problem.
Step One: The facilitator introduces the problem to the group. Next, the group brainstorms possible causes. The group also describes how this problem impacts the organization.

Problem Statement
Who What When
Problem Statement
Impact on the Organization
Desired State

Baldrige Processes to Meet PGS Standards and Framework ExpectationsPGS Standards
Standard IFramework for Improving Teaching and
Learning “Look Fors”Baldrige “Look Fors” in a Classroom
Learning SystemTeaches students strategies for exerting effective effort, e.g. time management, study skills, and use of resources including teacher, family and peers
Staff teaches students how to work smart. Teachers and students use monitoring charts and graphs to determine time on task, transitional time, time spent studying, number of students that completed homework.
Motivates and inspires in all students the willingness to learn, self confidence, and or/perseverance
Feedback on student work is frequent, specific, respectful and instructional.
Teachers set achievement standards, show students how to collect and analyze data, and help students write action plans.
Encourages students to challenge themselves for personal growth
Teachers communicate that, with effort, students can achieve rigorous goals.
Teachers engage students in goal setting and allow for personal study and development.
Promotes students’ social and emotional development
There is a language of giving help.There is a language of response to errors or below standard work.
Teachers model the use of and use quality tools such as the PDSA cycle and Force Field Analysis to promote continuous improvement.
Encourages students to set their own academic, social, and extracurricular goals
Students self-monitor their own learning and set personal goals. Students articulate goals, evaluate progress and have access to personal progress.
Teachers have a process and system in place for developing class and personal goals.
Teaches students to reflect on and to apply standards and criteria to their work
Student progress is based on incremental rigorous goal setting.
Teachers have a process in place that allows time for students to analyze their performance results, set goals, and write action plans.
Provides prompt and specific feedback to students on their work and progress toward goals
Teachers provide feedback that is regular and ongoing.
Teachers, parents and students understand the process for evaluation and know exactly how grades will be determined.
Takes responsibility for academic growth and achievement of all students
There are provisions for re-teaching and extra help.
Teachers/students write mission statements and routinely evaluate their progress.
Demonstrates/models sensitivity to all students; treats all students respectfully and equitably
The three key messages are evident:This is important.
You can do it.I won’t give up on you.
Teachers use quality tools that are engaging, encourage process thinking, and allow for respectful problem solving.
PGS StandardsStandard III
Framework for Improving Teaching and Learning
Baldrige “Look Fors” in a Classroom Learning System

Creates a classroom atmosphere that fosters students using each other as sources of knowledge, listening to, and showing respect for others’ contributionsCommunicates the following messages:
You can do it Effective effort leads to achievement Promotes positive interpersonal
relationships among students Builds positive interpersonal
relationships with students Encourages all students to participate
in class discussions and to take risks in the learning process
Effort based Intelligence appears in practices, behaviors and structure in the learning environment
Teachers/students establish ground rules.Teachers model/teach core values.Teachers/students define My Job, Your Job, Our Job.Teachers use plus/delta.Teachers give student surveys.Teachers/students use the PDSA strategy.Teachers use the fishbone strategy.Teacher/students write action plans.Teachers/students use monitoring tools such as graphs and charts.Teachers/students use force field analysis.
Uses a repertoire of strategies matched to student needs to avoid and/or address behavior problems
Evidence of student learning is used in planning, including intervention or acceleration.
Teachers/students write class mission statements that are aligned with the school mission statement.Teachers/students use plus/delta.Teachers/students write action plans.Teachers/students use the PDSA cycle.Teachers/students use charts and collect data.
Establishes routines to meet group/individual needs to maximize engaged student learning time
Instruction drives the schedule. Maximum time is spent on academic engagement
Teachers/students develop flow charts.Teachers/students use lotus diagrams.Teachers/students use the fishbone diagram.Teachers/students use charts and graphs.Teachers/students plan for instruction using the linkage chart.
Creates a classroom atmosphere for students and families in which all are welcomed and valued
Communicates academic and/or behavioral concerns
Communicates positive and/or negative feedback to families in a timely manner
Communication to parents and community about individual student progress exists in relation to goals.
Teachers use consensograms.Teachers survey parents/students.Teachers facilitate discussion about group and personal values and beliefs activities.Teachers facilitate My Job, Your Job, Our Job discussions with parents at Back to School Night.Teachers post data on data centers.Teachers communicate student progress using data notebooks.
PGS StandardsStandard IV
Framework for Improving Teaching and Learning
Baldrige “Look Fors” in a Classroom Learning System
Gathers data about student performance and other relevant information from a variety of sources
Teachers provide feedback to students about their learning and their work.Students articulate goals and evaluate progress.
Students use data note books that include:Class/personal mission.Class/personal goals.Lists of indicators being assessed.Lists of assignments, quizzes, and tests that will be used to assess mastery.Data on performance results.Action plans.
Develops and communicates clear criteria for success for student work
Student work is aligned with curriculum indicators.
Teachers and students plan instruction using the linkage chart.
Develops and uses a clearly defined grading system that is consistent with the MCPS Grading and Reporting Policy and Regulations
Assessment measures are matched to curriculum indicators.
Teachers meet collaboratively to determine baselines, formative and summative assessments.
Uses assessment data to ensure that every student is progressing toward state, local, and school system standards
There is a variety of data sources and records used to show progress towards proficiency.
Teachers meet collaboratively to analyze data and determine improvement plans.

Personal Reflections: Self-Monitoring ToolBuilding a Classroom Learning System
Directions: This self-monitoring tool may be used for planningand implementation as you work towards building a ClassroomLearning System using the Baldrige Criteria for Performance Excellence.
CLS “Look Fors” Yes No Comments/Future PlansGround rules
Consensograms
Issue Bin
Plus/Delta
Affinity Diagram
Surveys
“My Job, Your Job, Our Job”
“Looks Like, Sounds Like, Feels Like”
Classroom mission statement
Classroom goal setting
Classroom data collection
Classroom action planning
Individual goal setting
Individual data collection
Individual action planning
Quality Tools
1.2.3.4.5.6.7.8.

Additional ResourcesAcademies
Baldrige Quality Academies: Sherwood ES, Waters Landing ES, Tilden MS
MCPS Staff Staff Development Teachers Staff Development Specialists Baldrige Support
Dr. Michael Perich-Coordinator of Systemwide Continuous ImprovementMs. Sharon Hawkins-Sherwood Quality Academy TeacherMs. Fran Morris-Waters Landing Quality Academy Teacher
Mr. Ed Ragan-Tilden Quality Academy TeacherMs. Caren Lederer-Office of Organizational DevelopmentMr. Jerry Perlet-Principal/Sherwood ESMr. Bill Poole-Principal/Waters Landing ESMs. Karen Rabin-Principal/Tilden Middle SchoolMs. Eva Wetten-Retired MCPS PrincipalMs. Joan Carroll-Retired MCPS Director of School Performance
Books Future Force: Kids That Want to, Can, and Do! McClanahan, Elaine and Wicks, Carolyn. 1993
Pact Publishing Tool Time for Education: Choosing and Implementing Quality Improvement Tools. Langford
International, Inc. 2001. www.langfordlearning.com
Web Sites MCPS (www.mcps.k12.md.us) key Search: Baldrige www.baldrigeineducation.org “Ordinary Resources, Extraordinary results: Using Baldrige to Achieve Performance Excellence”
www.grand-blanc.k12.mi.us American Society for Quality: www.asq.org Koality Kids: www.asq.org/edu/kkid Georgia O’Keefe Elementary: http://www.okeeffe.aps.edu/Okeeffe_Web/default.html Jim Shipley & Associates: www.jimshipley.net Baldrige National Quality Program: www.quality.nist.gov Create a Graph: http://nces.ed.gov/necskids/graphing/
MCPS Publications Our Call to Action: Pursuit of Excellence: The Strategic Plan for the MCPS, 2003-2008. MCPS
(2610-04) Building a Classroom Learning System-My Job, Your Job, Our Job Building an Organizational Learning System: The Baldrige Principal’s Handbook for Guiding the
School Improvement Process The Bulletin
2003-2004: Issues 7, 11, 16, 24, 292004-2005: Issues 23, 26, 282005-2006: Issue 25