building a better future growing long-term value
TRANSCRIPT

Q2 2021 ResultsConference Call
August 6, 2021
BUILDING A BETTER FUTURE
GROWING LONG-TERM VALUE
NON-GAAP MEASURES“EBITDA”, “Adjusted EBITDA”, “net operating income” (NOI), “funds from operations” (FFO), and “adjusted funds from operations” (AFFO) are non-GAAP measures and do not have standardized meanings prescribed by GAAP. See “Non-GAAP Measures” in Extendicare’s most recent MD&A.

FORWARD-LOOKING STATEMENTS
2
This presentation contains forward-looking statements within the meaning of applicable Canadian securities laws (“forward-looking statements” or “forward-looking information”). Statements other than statements of historical fact contained in this presentation may be forward-looking statements, including, withoutlimitation, management’s expectations, intentions and beliefs concerning anticipated future events, results, circumstances, economic performance orexpectations with respect to Extendicare Inc. (the “Company” or “Extendicare”), including, without limitation: statements regarding its business operations,business strategy, growth strategy, results of operations and financial condition, including anticipated timelines, costs and financial returns in respect ofdevelopment projects, and in particular statements in respect of the impact of measures taken to mitigate the impact of COVID-19, the availability of variousgovernment programs and financial assistance announced in respect of COVID-19, the impact of COVID-19 on the Company’s operating costs, staffing,procurement, occupancy levels and volumes in its home health care business, the impact on the capital and credit markets and the Company’s ability to accessthe credit markets as a result of COVID-19, increased litigation and regulatory exposure and the outcome of any litigation and regulatory proceedings. Forward-looking statements can often be identified by the expressions “anticipate”, “believe”, “estimate”, “expect”, “intend”, “objective”, “plan”, “project”, “will” or othersimilar expressions or the negative thereof. These forward-looking statements reflect the Company’s current expectations regarding future results, performanceor achievements and are based upon information currently available to the Company and on assumptions that the Company believes are reasonable. Actualresults and developments may differ materially from results and developments discussed in the forward-looking statements, as they are subject to a number ofrisks and uncertainties.
Although forward-looking statements are based upon estimates and assumptions that the Company believes are reasonable based upon information currentlyavailable, these statements are not representations or guarantees of future results, performance or achievements of the Company and are inherently subject tosignificant business, economic and competitive uncertainties and contingencies and involve known and unknown risks, uncertainties and other factors that maycause actual results, performance or achievements of Extendicare to differ materially from those expressed or implied in the statements.
In particular, risks and uncertainties related to the effects of COVID-19 on Extendicare include: the length, spread and severity of the pandemic; the nature andextent of the measures taken by all levels of governments and public health officials, both short and long term, in response to COVID-19; domestic and globalcredit and capital markets; the Company’s ability to access capital on favourable terms or at all due to the potential for reduced revenue and increasedoperating expenses as a result of COVID-19; the availability of insurance on favourable terms; litigation and/or regulatory proceedings against or involving theCompany, regardless of merit; the health and safety of the Company’s employees and its residents and clients; and domestic and global supply chains,particularly in respect of personal protective equipment. Given the evolving circumstances surrounding COVID-19, it is difficult to predict how significant theadverse impact will be on the global and domestic economy and the business operations and financial position of Extendicare. For further information on therisks, uncertainties and assumptions that could cause Extendicare’s actual results to differ from current expectations, refer to “Risk Factors” in Extendicare’sAnnual Information Form and “Forward Looking-Statements” in Extendicare’s Q2 2021 Management’s Discussion and Analysis filed by Extendicare with thesecurities regulatory authorities, available at www.sedar.com and on Extendicare’s website at www.extendicare.com.
Readers should not place undue reliance on such forward-looking statements and assumptions as management cannot provide assurance that actual resultsor developments will be realized or, even if substantially realized, that they will have the expected consequences to, or effects on, the Company. The forward-looking statements speak only as of the date of this presentation. Except as required by applicable securities laws, the Company assumes no obligation toupdate or revise any forward-looking statements, whether as a result of new information, future events or otherwise.

3
Vaccines and testing are critical to protect
residents, clients and staff
COVID-19 UPDATE
• Successful vaccination campaign has made it possible to welcome back families and visitors in our homes and communities
• Residents 92% in LTC and 90% in retirement fully vaccinated
• Staff 86% in LTC, 80% in retirement and 86% in ParaMed have received first dose
• No outbreaks as of August 5, 2021
• Routine surveillance testing continuing with focus on those not yet fully vaccinated
• Maintaining enhanced staffing levels and prevention protocols
• Continuing recovery in ParaMed volumes and occupancy in our homes and communities

4
2021 SECOND QUARTER HIGHLIGHTS
Pandemic impact diminishing
• Pandemic costs decreased to $42.8M in Q2, down 26% from Q1 2021; costs exceeded funding by $9.5M(1)
• Volatility in results expected to continue due to timing of COVID-19 costs and related recoveries
• Anticipate further funding to cover some of the 1H 2021 net COVID costs in LTC
• Easing of public health restrictions enabled average occupancy improvements in LTC and retirement in Q2• LTC +250 bps
• Retirement +30 bps
• Home health care volumes returned to pre-pandemic levels and NOI margins increased 60 bps over the previous quarter
• SGP customer base +11.1% vs. Q2 2020
(1) For breakdown of COVID-19 costs and related pandemic funding by line of business, see Slide 18

5
LONG-TERM CARE –REDEVELOPMENT ADVANCING
Investing in a better future for seniors
• Commenced construction on Kingston 192-bed home with targeted completion of Q1 2023; Sudbury 256-bed home construction ongoing
• Two projects represent a total investment of $120.3M(1)
• Closed $95.9M in construction financing to support Sudbury and Kingston projects
• Additional seven projects in advanced stages of approvals with Ontario government, totalling a further estimated investment of ~$400M
• Continue work with industry partners and governments to make more redevelopment projects financially feasible
(1) Represents estimated total investment before capital grant provided by the Ontario government under the Long-Term Care Home Capital Development Funding Program (New Funding Program) announced in 2020.
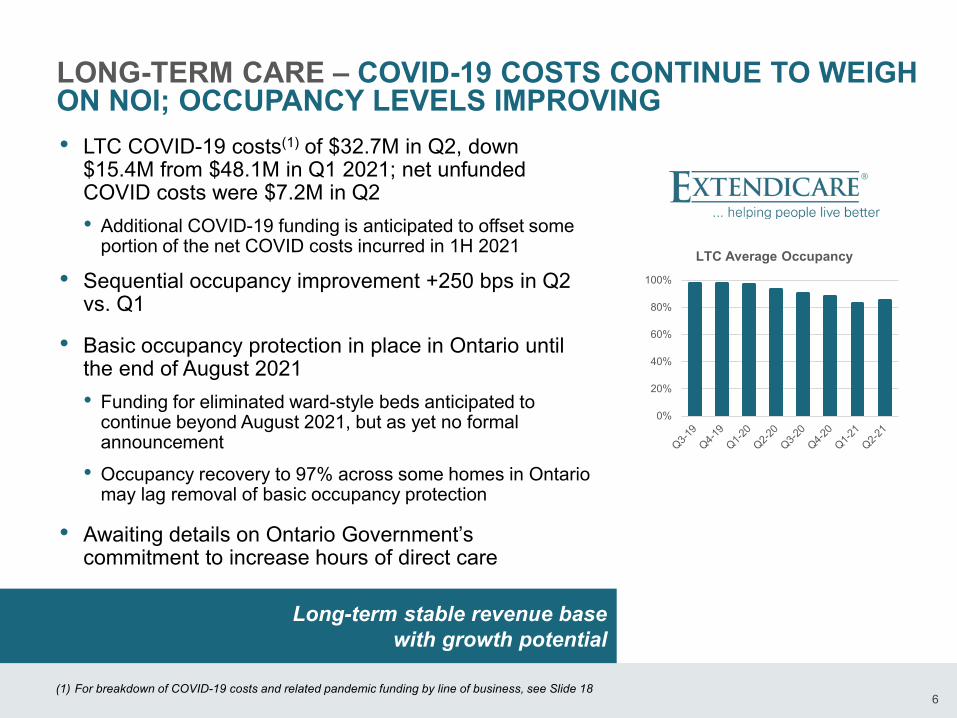
LONG-TERM CARE – COVID-19 COSTS CONTINUE TO WEIGH ON NOI; OCCUPANCY LEVELS IMPROVING• LTC COVID-19 costs(1) of $32.7M in Q2, down
$15.4M from $48.1M in Q1 2021; net unfunded COVID costs were $7.2M in Q2• Additional COVID-19 funding is anticipated to offset some
portion of the net COVID costs incurred in 1H 2021
• Sequential occupancy improvement +250 bps in Q2 vs. Q1
• Basic occupancy protection in place in Ontario until the end of August 2021• Funding for eliminated ward-style beds anticipated to
continue beyond August 2021, but as yet no formal announcement
• Occupancy recovery to 97% across some homes in Ontario may lag removal of basic occupancy protection
• Awaiting details on Ontario Government’s commitment to increase hours of direct care
6
Long-term stable revenue base with growth potential
0%
20%
40%
60%
80%
100%
LTC Average Occupancy
(1) For breakdown of COVID-19 costs and related pandemic funding by line of business, see Slide 18

PARAMED – VOLUMES RETURN TO PRE-PANDEMIC LEVELS; STAFFING CAPACITY CONTINUES TO WEIGH ON GROWTH• ADV recovered to pre-pandemic levels, Q2 ADV up
3.7% from Q1 2021
• Improved back-office efficiencies contributing to NOI margin growth, +60 bps to 7.9%(2) in Q2 vs. Q1
• Pace of volume growth impacted by constraints on workforce capacity
• In-house training programs on track to add 600 front-line team members in 2021
• Volumes anticipated to continue to increase as pandemic subsides and staffing capacity grows
• Strong fundamental long-term market growth opportunity
7
Driving increased care hours through investments in people, process, and technology
(1) Excluding ParaMed B.C. contracts expired in January 2020(2) Excluding impact of net COVID costs and CEWS
6,000
10,000
14,000
18,000
22,000
26,000
Home Health Care Average Daily Volume (ADV) (1)

FINANCIAL REVIEWQ2 2021
8

RevenueQ2 Q2
ChangeYTD YTD
Change2021 2020 2021 2020
$307.4 $281.9 9.0% $629.8 $553.8 13.7%
Adjusted EBITDA and MarginQ2 Q2
ChangeYTD YTD
Change2021 2020 2021 2020$17.8 $8.2 118.2% $45.5 $28.3 60.9%5.8% 2.9% 290 bps 7.2% 5.1% 210 bps
AFFO and AFFO per Share (1)
Q2 Q2Change
YTD YTDChange2021 2020 2021 2020
$8.1 $2.9 174.0% $27.6 $14.6 89.5%$0.09 $0.03 $0.31 $0.16
NOI and MarginQ2 Q2
ChangeYTD YTD
Change2021 2020 2021 2020
$31.3 $19.9 56.8% $71.5 $50.3 42.1%10.2% 7.1% 310 bps 11.4% 9.1% 230 bps
CONSOLIDATED RESULTSThree and six months ended June 30, 2021($ millions, except per share amounts)
(1) Basic AFFO/share9
Payout ratio of 78% YTD 2021 compared to 147% YTD 2020 and 81% FY2020
EBITDA and AFFO/Share (1) impact of Select ItemsImpact on: Q2 Q2
ChangeYTD YTD
Change2021 2020 2021 2020EBITDANet COVID Costs $(9.5) $(10.7) $1.2 $(11.8) $(11.0) $(0.8)ParaMed CEWS $7.7 $0.0 $7.7 $17.4 $0.0 $17.4
AFFO/ShareNet COVID Costs $(0.08) $(0.09) $0.01 $(0.10) $(0.09) $(0.01)ParaMed CEWS $0.06 − $0.06 $0.14 − $0.14

RevenueQ2 2021 $187.2M 4.9%YTD 2021 $392.3M 15.8%NOI
Q2 2021 $9.8M -12.0%margin 5.2% -100 bps
YTD 2021 $26.1M -11.8%margin 6.6% -210 bpsAverage Occupancy
Q2 2021 85.4% -810 bpsYTD 2021 84.2% -1,100 bps
LONG-TERM CARE
10
• Q2 revenue up $8.7M or 4.9%• YoY increased COVID-19 funding of $7.9M
• Q2 NOI down $1.3M or 12.0%• Higher costs of resident care and lower preferred
accommodation revenue, partially offset by $1.4M lower unfunded net COVID costs
• Q2 NOI(1) margin of 10.5% compared to 11.0% at Q1• Q2 occupancy +250 bps to 85.4% in Q2 from Q1• Basic occupancy funding protection in Ontario in
place until August 31, 2021• Governments continue to support LTC sector with
additional COVID-19 funding; ongoing volatility in matching with expenditures
Three and six months ended June 30, 2021
0%
5%
10%
15%
NOI Margin
NOI margin (as reported)
NOI margin (excluding net COVID-19 costs) (1)
(1) NOI margins excluding net COVID costs as outlined on Slide 18

HOME HEALTH CARE
11
• Q2 revenue up $15.6M or 18.3%• 24% increase in ADV, partially offset by lower COVID-19
pandemic pay funding of $1.8M
• Q2 NOI up $12.6M to $14.0M and margin at 13.9%• Growth in ADV, CEWS of $7.7M and back-office
efficiencies, partially offset by higher net COVID-19 costs
• Sequential ADV and margin improvements• Q2 ADV up 3.7% from Q1
• Q2 NOI(1) margin of 7.9% up from 7.3% in Q1 2021 and 5.8% in Q4 2020
Three and six months ended June 30, 2021
(1) NOI margins excluding net COVID costs as outlined on Slide 18, CEWS (Q1 2021 $9.7M and Q2 2021 $7.7M; Q3 2020 $50.8M and Q4 2020$40.4M), and Q4 2020 one-time charges of $6.1M
7.7%
5.5%4.6%
2.3%
5.6% 5.8%7.3% 7.9%
Q3-19 Q4-19 Q1-20 Q2-20 Q3-20 Q4-20 Q1-21 Q2-21
NOI Margin (ex-COVID & CEWS) (1)
Revenue Q2 2021 $101.1M 18.3%YTD 2021 $198.8M 11.3%NOI Q2 2021 $14.0M 889.5%margin 13.9% 1,220 bps
YTD 2021 $30.0M 423.1%margin 15.1% 1,190 bpsAverage Daily Volume (1)
Q2 2021 25,264 24.0%YTD 2021 24,811 10.1%

Revenue
Q2 2021 $12.3M 4.8%YTD 2021 $24.5M 2.9%NOI
Q2 2021 $3.7M 5.2%margin 30.1% 10 bps
YTD 2021 $7.1M -1.1%margin 29.2% -120 bpsAverage Stabilized Occupancy
Q2 2021 90.2% -130 bpsYTD 2021 90.4% -210 bpsAs at Lease-up Occupancy
Q2 2021 73.0% 570 bps
RETIREMENT LIVING
12
• Q2 revenue up $0.6M or 4.8%
• Q2 NOI up $0.2M or 5.2% and margin +10 bps• Contributions from lease-up occupancy and lower YoY COVID-19
costs, partially offset by increased labour and promotional costs
• Average stabilized occupancy holding above 90%
• As at lease-up occupancy +350 bps from Q1
• In-person tours and easing of move-in restrictions expected to drive occupancy growth in 2H 2021
Three and six months ended June 30, 2021
50%60%70%80%90%
100%
Stabilized Portfolio Average Occupancy
50%55%60%65%70%75%
Lease-up Portfolio Occupancy at Period End

Revenue
Q2 2021 $6.9M 9.8%YTD 2021 $14.3M 12.4%NOI
Q2 2021 $3.7M -4.0%margin 54.2% -780 bps
YTD 2021 $8.3M +6.3%margin 58.1% -330 bpsContract Services
Beds 6,359 -2.8%
SGP
Residents 83,511 11.1%
OTHER CANADIAN OPERATIONS
13
• Q2 revenue up $0.6M or 9.8%
• Q2 NOI down $0.2M or 4.0% and margin at 54.2% (YTD 58.1%); reflecting increased staff and higher business development costs to support growth
• +11.1% growth in SGP clients from Q2 2020 (+3.0% from Q1 2021)
Three and six months ended June 30, 2021
0
15,000
30,000
45,000
60,000
75,000
90,000
Q3-19 Q4-19 Q1-20 Q2-20 Q3-20 Q4-20 Q1-21 Q2-21
SGP (3rd party residents)

STRONG FINANCIAL POSITION
14
(1) Includes current portion, reflects 2025 convertible debt at face of $126.5M and excludes deferred financing costs(2) Retirement demand constructions loans are reflected as current (3) As at June 30, 2021, no amounts drawn on LTC construction credit facilities
Strong liquidity position and no scheduled debt maturities until Q1 2022
Debt Maturities ($ millions)
Long-term Debt (1) Cash
$565M $133M
EBITDA interest coverage
Debt to GBV
Weighted average rate
Q2 2021 5.4x 46.3% 4.3%Q1 2021 5.0x 46.2% 4.3%
Q4 2020 4.7x 45.9% 4.3%
43.1
126.5
5.2 10.7 10.7 11.1 11.6 11.8 12.0 9.7 14.1 10.7 9.5 8.2 8.0
129.8
48.8 47.7 36.2
2021 remaining 2022 2023 2024 2025 2026 Thereafter
Construction Lease Liabilities Mortgage Amortization Mortgage Principal at Maturity(2) 2025 Convertible Debt (1)
As at June 30, 2021
+$95.9M in construction financing closed in Q2 2021 to support LTC redevelopment(3)
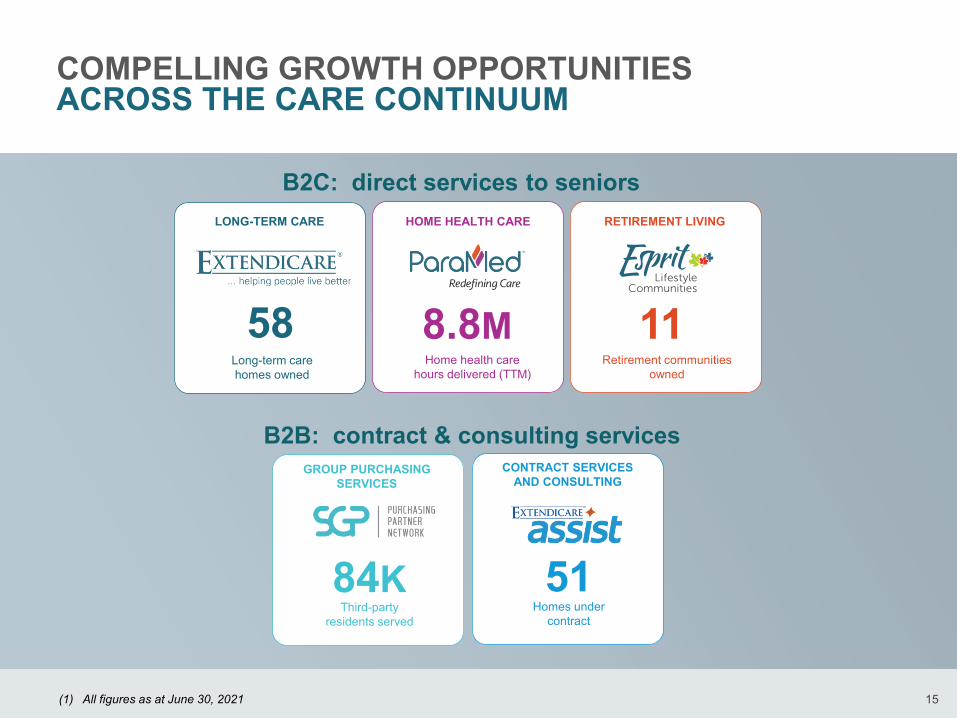
COMPELLING GROWTH OPPORTUNITIESACROSS THE CARE CONTINUUM
15
51Homes under
contract
58Long-term care homes owned
11Retirement communities
ownedHome health care
hours delivered (TTM)
84KThird-party
residents served
GROUP PURCHASING SERVICES
CONTRACT SERVICES AND CONSULTING
B2C: direct services to seniors
B2B: contract & consulting services
HOME HEALTH CARE
8.8M
RETIREMENT LIVINGLONG-TERM CARE
(1) All figures as at June 30, 2021

THANK YOU

17
APPENDIX

Q2 2021 ESTIMATED COVID-19 REVENUE, OPERATING EXPENSES AND ADMINISTRATIVE COSTS
18
Three and six months ended June 30, 2021
2021 2020(millions of dollars) Q2 Q1 YTD Q2 Q4 Q3 Q2 Q1 YTD Q2 Year
RevenueLong-term care 25.5 47.0 72.5 25.6 21.1 17.6 0.4 18.0 64.7 Retirement living - - - - - - - - -Home health care 7.8 8.8 16.6 6.4 7.6 9.6 - 9.6 23.6 Revenue impact 33.3 55.8 89.1 32.0 28.7 27.2 0.4 27.6 88.3 Operating ExpensesLong-term care 32.7 48.1 80.8 34.3 27.7 26.2 0.7 26.9 88.9 Retirement living 0.2 0.1 0.3 0.1 0.5 0.5 - 0.5 1.1 Home health care 8.8 9.0 17.8 7.2 7.7 10.0 - 10.0 24.9 Operating expenses impact 41.7 57.2 98.9 41.6 35.9 36.7 0.7 37.4 114.9 NOILong-term care (7.2) (1.1) (8.3) (8.7) (6.6) (8.6) (0.3) (8.9) (24.2)Retirement living (0.2) (0.1) (0.3) (0.1) (0.5) (0.5) - (0.5) (1.1)Home health care (1.0) (0.2) (1.2) (0.8) (0.1) (0.4) - (0.4) (1.3)NOI impact (8.4) (1.4) (9.8) (9.6) (7.2) (9.5) (0.3) (9.8) (26.6)Administrative costs 1.1 0.9 2.0 0.7 1.6 1.2 - 1.2 3.5 Adjusted EBITDA impact (9.5) (2.3) (11.8) (10.3) (8.8) (10.7) (0.3) (11.0) (30.1)

Long-term Care NOI and Margin (1)
Q2 Q2Change
YTD YTDChange2021 2020 2021 2020
$17.0 $19.7 -13.9% $34.4 $38.5 -10.6%10.5% 12.3% -180 bps 10.8% 12.0% -120 bps
Average Occupancy
85.4% 93.5% -810 bps 84.2% 95.2% -1,100 bps
Retirement Living NOI and Margin (1)
Q2 Q2Change
YTD YTDChange2021 2020 2021 2020
$3.9 $4.0 -2.5% $7.4 $7.7 -4.1%31.7% 34.0% -230 bps 30.3% 32.5% -220 bps
Average Stabilized Occupancy90.2% 91.5% -130 bps 90.4% 92.5% -210 bps
RESULTS – NOI BY DIVISION (1)
19
(1) Excludes the impact of COVID-19 related costs in excess of funding as outlined on Slide 18 and impact on the home health care segment of CEWS received in 2021 (Q1 2021 $9.7M and Q2 2021 $7.7M; $nil in Q1 2020 and Q2 2020)
(2) ADV excludes B.C. contracts expired at the end of January 2020
($ millions)
Three and six months ended June 30, 2021
Home Health Care NOI and Margin (1)
Q2 Q2Change
YTD YTDChange2021 2020 2021 2020
$7.3 $1.8 312.3% $13.8 $6.1 126.9%7.9% 2.3% 560 bps 7.6% 3.6% 400 bps
Average Daily Volume (ADV) (2)
25,264 20,380 24.0% 24,811 22,532 10.1%
Assist/SGP NOI and MarginQ2 Q2
ChangeYTD YTD
Change2021 2020 2021 2020
$3.7 $3.9 -4.0% $8.3 $7.8 6.3%54.2% 62.0% -780 bps 58.1% 61.4% -330 bps
SGP 3rd Party Residents at period end83,511 75,165 11.1% 83,511 75,165 11.1%