building a 600-ship navy: march 1982 costs, timing, … m. rivlin director march 1982 iii contents...
TRANSCRIPT

A CBO STUDY Building a 600-Ship Navy:Costs, Timing, andAlternative Approaches
March 1982
Congress of the United StatesCongressional Budget Off ice


BUILDING A 600-SHIP NAVY:COSTS, TIMING, AND ALTERNATIVE APPROACHES
The Congress of the United StatesCongressional Budget Office
NOTE
Unless o the rwise n o t e d , a l lcost f i g u r e s in this repor tare in fiscal year 1983 dollars.
ii

PREFACE
As the Congress considers the defense budget for fiscal year1983, one of the more important issues will be the Navy's ship-building program. The Administration has announced plans toincrease U.S. naval forces in the interest of assuring maritimesuperiority over any likely enemy. A key aspect of this is ashipbuilding program that will modernize and increase the size ofthe U.S. fleet. This shipbuilding program will add substantiallyto costs, both in fiscal year 1983 and in the future.
This report, prepared at the request of the House Committeeon Armed Services, examines the budget and schedule implicationsof shipbuilding programs that would achieve the Navy's forceobjectives. The report also examines possible alternativesto the Navy's program. (Two forthcoming companion reports con-sider implications of the buildup for aircraft procurement andmanpower.) In accordance with CBO's mandate to provide objectiveand nonpartisan analysis, the report offers no recommendations.
This report was prepared by Peter T. Tarpgaard of theNational Security and International Affairs Division of theCongressional Budget Office, under the general supervision ofRobert F. Hale and John Hamre. Patrick Haar of CBO's BudgetAnalysis Division provided essential support to the projectin preparing budget estimates. John Enns, Alan Shaw, Al Peden andothers on the CBO staff contributed to the estimates of costs.John Wells of the Institute for Defense Analyses provided invalu-able assistance in the assessment of U.S. shipbuilding capacity.The author gratefully acknowledges the helpful comments andassistance of Alfred Fitt and Greg Schulte of the CBO staff and ofDorothy Yufer and Ronald Feldman of the Center for Naval Analyses.(The assistance of external reviewers and contributors implies noresponsibility for the final product, which rests solely withCBO.) Patricia H. Johnston edited the manuscript, and Nancy H.Brooks provided extensive editorial assistance. Jean Haggis andJanet Stafford prepared the report for publication.
Alice M. RivlinDirector
March 1982
iii


CONTENTS
Page
Preface iii
SUMMARY xi
CHAPTER I. INTRODUCTION . . . . . . . . . . . . . . 1
CHAPTER II. RATIONALE FOR THE 600-SHIP NAVY .... 3
U.S. vs. the Soviet Union at Sea .... 3The U.S. Navy Today: HigherCommitments—Smaller Fleet 4The Future Navy—the Navy's Plan .... 6The Future Navy—What is Needed? .... 17
CHAPTER III. BUILDING THE FUTURE NAVY-ALTERNATIVE APPROACHES 19
Overview of Options forNaval Shipbuilding Programs 20Option I: Rapid Buildup toNavy Force Objectives 21Option II: Moderately PacedBuildup to Navy Force Objectives ... 26Option III: Budget ConstrainedProgram 28Option IV: Expanded Navyof Modified Force Mix 30
CHAPTER IV. INDUSTRY AND NAVAL FORCEEXPANSION 37
The U.S. Shipbuilding Industry 38The Options—Industry Implications ... 41
CHAPTER V. OVERALL COST IMPLICATIONSOF NAVAL FORCE EXPANSION 45
Other Cost Categories 45Costs of the Future Navy—Estimates for the Four Options 49

CONTENTS (continued)
Page
CHAPTER VI. CURRENT ISSUES FOR THE CONGRESS 61
Basic Directions 61The Five-Year ShipbuildingProgram 62Summary Assessment of theFive-Year Shipbuilding Plan 71
APPENDIX A. OPTION I: NAVY FORCE OBJECTIVES-SHIPS IN FLEET BY 1992 ANDAUTHORIZED BY 1988 75
APPENDIX B. OPTION II: NAVY FORCE OBJECTIVES-SHIPS IN FLEET BY 1996 AND AUTHOR-IZED BY 1992 81
APPENDIX C. OPTION III: REDUCED FORCEOBJECTIVES—SHIPS IN FLEETBY 1996 AND AUTHORIZED BY 1992 89
APPENDIX D. OPTION IV: MODIFIED FORCE MIX,EXPANDED FORCE LEVELS—SHIPSIN FLEET BY 1996 AND AUTHOR-IZED BY 1992 97
APPENDIX E. OPEN-OCEAN DESTROYER (DDGY) 105
APPENDIX F. BASIS FOR BUDGET AUTHORITYESTIMATES FOR OPTIONS I THROUGH IV ... Ill
GLOSSARY . 115
vi

TABLES
Page
TABLE 1. SHIPS INCLUDED IN NAVY FORCELEVEL GOALS, BY TYPES 8
TABLE 2. NAVY OBJECTIVE FOR SURFACECOMBATANT FORCE LEVEL 11
TABLE 3. AMPHIBIOUS LIFT REQUIREMENTS ........ 14
TABLE 4. REPLENISHMENT SHIPS: OBJECTIVESAND CURRENT FORCE 14
TABLE 5. NAVAL FORCE OBJECTIVES 16
TABLE 6. OPTION I: RAPID BUILDUP TO NAVYFORCE OBJECTIVES—SHIPS IN FLEETBY 1992 AND AUTHORIZED BY 1988 24
TABLE 7. OPTION I: RAPID BUILDUP TO NAVYFORCE OBJECTIVES—ILLUSTRATIVESHIPBUILDING PROGRAM 24
TABLE 8. OPTION II: MODERATELY PACED BUILDUPTO NAVY FORCE OBJECTIVES—SHIPS INFLEET BY 1996 AND AUTHORIZED BY 1992 ... 27
TABLE 9. OPTION II: MODERATELY PACED BUILDUPTO NAVY FORCE OBJECTIVES—ILLUSTRATIVESHIPBUILDING PROGRAM 27
TABLE 10. OPTION III: BUDGET CONSTRAINEDPROGRAM—SHIPS IN FLEET BY 1996AND AUTHORIZED BY 1992 29
TABLE 11. OPTION III: BUDGET CONSTRAINEDPROGRAM—ILLUSTRATIVESHIPBUILDING PROGRAM 29
TABLE 12. OPTION IV: EXPANDED NAVY OFMODIFIED FORCE MIX—SHIPS IN FLEETBY 1996 AND AUTHORIZED BY 1992 33
vii

TABLES (Continued)
TABLE 13.
TABLE 14.
TABLE 15.
TABLE 16.
TABLE 17.
TABLE 18.
TABLE 19.
TABLE 20.
TABLE 21.
OPTION IV: EXPANDED NAVY OFMODIFIED FORCE MIX—ILLUSTRATIVESHIPBUILDING PROGRAM
REAL VALUE OF SHIPMENTS PEREMPLOYEE, 1972-1976
MAJOR U.S. SHIPBUILDING YARDS,BY REGION, DECEMBER 1980
SUMMARY OF RESULTS OF IDASASCALCULATION OF MINIMUM INDUSTRIALREQUIREMENTS FOR FOUR OPTIONS
OPTION I: ESTIMATED BUDGET AUTHORITYFOR DEPARTMENT OF THE NAVY
OPTION II: ESTIMATED BUDGET AUTHORITYFOR DEPARTMENT OF THE NAVY
OPTION III: ESTIMATED BUDGET AUTHORITYFOR DEPARTMENT OF THE NAVY
OPTION IV: ESTIMATED BUDGET AUTHORITYFOR DEPARTMENT OF THE NAVY
ADMINISTRATION'S PROPOSED SHIPBUILDINGPROGRAM FOR FISCAL YEARS 1983-1987 . .
33
39
40
43
52
54
56
58
63
viii

APPENDIX TABLES
TABLE A-l.
TABLE A-2.
TABLE B-l.
TABLE B-2.
TABLE C-l.
TABLE C-2.
TABLE D-l.
TABLE D-2.
ILLUSTRATIVE SHIPBUILDING PROGRAMFOR OPTION I: NAVY FORCEOBJECTIVES—SHIPS IN FLEET BY1992 AND AUTHORIZED BY 1988 . . .
ILLUSTRATIVE FORCE STRUCTUREFOR OPTION I: NAVY FORCEOBJECTIVES—SHIPS IN FLEET BY1992 AND AUTHORIZED BY 1988 .
ILLUSTRATIVE SHIPBUILDING PROGRAMFOR OPTION II: NAVY FORCEOBJECTIVES—SHIPS IN FLEET BY1996 AND AUTHORIZED BY 1992 . . .
ILLUSTRATIVE FORCE STRUCTUREFOR OPTION II: NAVAL FORCEOBJECTIVES—SHIPS IN FLEET BY1996 AND AUTHORIZED BY 1992 .
ILLUSTRATIVE SHIPBUILDING PROGRAMFOR OPTION III: REDUCED FORCELEVEL OBJECTIVES—SHIPS IN FLEETBY 1996 AND AUTHORIZED BY 1992 .
ILLUSTRATIVE FORCE STRUCTUREFOR OPTION III: REDUCED FORCELEVEL OBJECTIVES—SHIPS IN FLEETBY 1996 AND AUTHORIZED BY 1992 ,
ILLUSTRATIVE SHIPBUILDING PROGRAMFOR OPTION IV: MODIFIED FORCEMIX, EXPANDED FORCE LEVELS-SHIPS IN FLEET BY 1996 ANDAUTHORIZED BY 1992
ILLUSTRATIVE FORCE STRUCTURE FOROPTION IV: MODIFIED FORCE MIX,EXPANDED FORCE LEVELS—SHIPS IN FLEETBY 1996 AND AUTHORIZED BY 1992 . . .
76
78
82
84
90
92
98
100
ix

APPENDIX TABLES (Continued)
TABLE E-l.
TABLE E-2.
CHARACTERISTICS OF ALTERNATIVESHIP TYPES
DERIVATION OF DDGY DISPLACEMENTAND COST USING FFG-7 AS BASELINE
Page
108
110
FIGURES
FIGURE 1.
FIGURE 2.
FIGURE E-l.
SHIPBUILDING AND CONVERSION,NAVY BUDGET LEVELS SINCE 1975AND PROJECTED TO 1995 UNDERFOUR SHIPBUILDING PROGRAM OPTIONS
NAVY BUDGET AUTHORITY SINCE1975 AND PROJECTED TO 1995UNDER FOUR PROGRAM OPTIONS . . .
FOUR ALTERNATIVE SHIP TYPES
22
50
109

SUMMARY
Once the indisputably dominant power at sea, the UnitedStates has seen this dominance erode over the past two decades asa result of steady growth in Soviet naval capabilities and declin-ing force levels in the U.S. Navy. Between 1970 and 1980 thetotal number of ships in the U.S. Navy fell from 847 to 538and uniformed personnel strength declined from 675,000 to about525,000. Although the remaining ships are newer and more capablethan those retired, the Navy now has substantially fewer shipswith which to sustain its peacetime commitments or to conductwartime operations. One result has been an operational pace inrecent years nearly unprecedented in peacetime. The Chief ofNaval Operations recently testified that "the Navy has been atvirtually a wartime operating tempo since the beginning of theVietnam conflict and has never stood down."
BUILDING THE FUTURE NAVY—STRATEGY CONSIDERATIONS
The Administration has announced plans to increase substanti-ally U.S. naval forces, which are deemed to be inadequate. Thespecifics of these plans are based upon a maritime offensivestrategy that emphasizes strikes against enemy forces and theirsupporting base structure, including strikes in enemy watersagainst its home territory. Carrier battle groups would be theprimary instrument of such offensive action. The Navy believesthat the most efficient way to maintain control of the seasis to destroy hostile forces capable of challenging that control.The Navy further holds that the very existence of such offen-sive forces would force the Soviet Union into a defensive,reactive position, allowing the United States to capitalizeon Soviet geographic disadvantages and compelling the SovietUnion to concentrate its naval forces close to its homelandwhere they would pose less of a threat to U.S. sea lines ofcommunication.
It is very likely that this strategy would evoke a strongSoviet response against the attacking battle groups, since itwould involve direct assaults against Soviet territory. In theNavy's view, this dictates a requirement for highly capable—andtherefore very expensive--weapons systems to defend against
xi

intense Soviet attacks. Critics of this position, however, viewthe strategy as fundamentally unworkable and likely to provokeSoviet use of nuclear weapons against the battle groups. In thisview, even the most sophisticated and expensive weapons wouldprobably not be effective in protecting the battle groups againstthe intensive resistance that would be encountered in Sovietwaters. A more realistic approach, in this view, might be tobuild a Navy capable of controlling and defending large areas ofthe ocean, including vital sea lanes and Third World areas,against a widely distributed Soviet threat. This approachwould require a large fleet, but one with less need for the highlysophisticated weapons required for an offensive strategy.
BUILDING THE FUTURE NAVY—FORCE OBJECTIVES
The Navy's Force Objectives
Based on its strategy and its view of priorities, the Navyhas developed specific objectives for future naval force expan-sion. The Navy believes that the fleet outlined in SummaryTables 1 and 2 is the minimum force needed to protect U.S.interests at sea, given currently foreseen conditions. This fleetwould number over 600 ships (including the strategic force ofballistic missile submarines) of the types that support the Navy'srequirements for accomplishing its wartime missions as the Navycurrently perceives them.
The fleet envisioned by current Navy planners features 15deployable aircraft carriers, with their associated air wings andbattle group escorts, which would form the primary offensivestrike forces. The carrier battle groups would be supplementedby four surface action groups (SAGs), which are naval combatgroups not containing aircraft carriers. SAGs would probably becentered upon the four battleships that the Administration plansto reactivate.
Lift capability for amphibious forces—that is, forcescapable of making a forcible invasion from the sea—would beincreased about 50 percent to provide a capability to land aMarine Amphibious Brigade, or MAB (15,500 troops), in addition tothe current ability to land a Marine Amphibious Force, or MAF(32,500 troops). The Navy has increased its force level goal forattack submarines from 90 to 100, and intends to replace its 25old minesweepers with 31 new ships.
xii

SUMMARY TABLE 1. NAVY FORCE OBJECTIVES
Forces Number
Carrier Battle GroupsSurface Action GroupsAmphibious LiftUnderway Replenishment GroupsNuclear Attack Submarines
154
1 MAF aI + 1 MAB b/10100
aj Marine Amphibious Force - 32,500 troops.
_b/ Marine Amphibious Brigade - 15,500 troops.
SUMMARY TABLE 2. SHIP LEVELS FOR GENERAL PURPOSE FORCES
Ship Type
CombatantsAircraft CarriersBattleshipsBattle Group EscortsFrigatesAttack SubmarinesSmall CombatantsTotal Combatants
Other ShipsAmphibious ShipsMine Warfare ShipsReplenishment ShipsMaterial Support ShipsFleet Support ShipsTotal, Other Types
Number ofCurrent Force
120
11281915
301
6525532630199
ShipsObjective
154
137101100
—357
7531692733235
Ballistic Missile Submarines(SSBNs)
Total, All Ships
35
535
Unstated
592 + SSBNs
xiii

Finally, the underway replenishment force, which is vital forsustained operations at sea, would be built up to support thelarger combat fleet. The number of support ships, includingdestroyer tenders and submarine tenders, which back up the fleetalso would be appreciable.
inOptions I and II, among the program alternatives examined
this report, meet these Navy force objectives.
Alternative Force Objectives
There are many alternatives to the force objectives presentedabove. Very generally, these can be categorized as two types:
o Those that procure a different number of the same kinds ofships as proposed by the Navy; and
o Those that procure a different mix of ships.
This report examines an alternative of each type.
Alternatives of the first kind might logically derive from anassessment that the Navy's strategy and the specific ship typesplanned to implement that strategy are correct, but that thenumbers of ships recommended are either unattainable withinfeasible budgets or are unnecessary for the levels of conflictanticipated in the future. This kind of alternative is examinedas Option III.
Alternatives of the second kind—those that procure a differ-ent mix of ships—might derive from a different view of navalstrategy or from a different view of how best to implement theNavy's strategy. This kind of alternative is examined in OptionIV. This option would introduce three different ship types notcurrently included in Navy shipbuilding plans. It suggestsdirections in which ship design might proceed if it was decided toplace more emphasis on distributed-force, open-ocean operations asopposed to concentrated offensive strikes.
BUILDING THE FUTURE NAVY—ALTERNATIVE APPROACHES
This report presents four alternative shipbuilding pro-grams. These programs illustrate the budget and force structureimplications of various approaches to future Navy shipbuilding.
xiv

Of the four options examined, two, Options I and II, would achievethe number and types of ships recommended by the Navy. Option Iwould reach these goals by 1992, which means the ships would haveto be authorized no later than 1988. This is probably the short-est period of time in which the Navy's goals could be reached.Congress could decide to accomplish the same goals, but over alonger time. Hence, Option II would extend the authorizationperiod from six to ten years, with authorizations extendingthrough fiscal year 1992 and force goals substantially achievedby 1996.
Option III would be a lower cost alternative producing fewerships, but one in which the kinds of ships procured would allbe of the same types contained in current Navy plans. It wouldresult in a substantially smaller fleet than Options I and II.Option IV would introduce some ship types not contained in currentNavy plans. It would attain numerical force levels comparable tothe Navy goals at a lower cost than Options I or II.
Appendixes A through D present details of the annual ship-building programs for each of these options and the resultingyear-by-year force structure. Summary Table 3 provides a summaryof the results.
Option I; Rapid Buildup to Navy Force Objectives
Option I would achieve the Navy's force goals in ten years,necessitating that authorizations be accomplished in six yearssince ships are generally not delivered until at least four yearsafter authorization. This option would require authorizationof 176 ships over the next six years at a total cost of $119billion. (All costs in this report are in fiscal year 1983dollars). This option is clearly the most desirable in terms ofachieving the Navy's long-run objectives. It would result ina fleet structured to support the Navy's offensive strategy andwould do so in a shorter time than any of the other options.Under Option I, the fleet would grow to 657 ships by the 1990s,including 15 deployable carrier battle groups.
This growth would, however, require an immediate and drasticincrease in the Shipbuilding and Conversion, Navy (SCN) budget.SCN budget requirements for Option I are estimated to averageabout $25 billion annually over the next six years, or about 2 1/2times the fiscal year 1982 authorization and 34 percent above theAdministration's budget request for 1983. This $25 billion would
xv

SUMMARY TABLE 3. SUMMARY OF SHIPBUILDING PROGRAM OPTIONS (Costsin billions of fiscal year 1983 dollars)
Option Option Option OptionI II III IV
TimingYear goals met 1992 1996 1996 1996Authorization period
(in years) 6 aj 10 10 10
ShipsCurrent force (End of 1981) 535 535 535 535Retirements 152 a./ 240 240 240Now building or authorized 98 98 98 98New authority 176 a./ 230 146 231Fleet total 657 a/ 623 539 624
Program RequirementsTotal authorizations,
ships 176 a./ 230 146 231Average annual number
of ships 29.3 23.0 14.6 23.1Total new construction
cost 119 a./ 170 97.0 121Average annual new
construction cost 19.8 17.0 9.7 12.1Average annual total,
Shipbuilding andConstruction, Navy 24.8 21.3 12.1 15.1
_a/ Option I is a six-year authorization program through fiscalyear 1988, with ships assumed to be substantially all deliv-ered by 1992. For Option I, therefore, the figures forretirements and fleet totals are through 1992 and authoriza-tions are through fiscal year 1988. In all other options, theprogram period is four years longer, with authorizationsextending through 1992 and the figures for retirements andfleet totals through 1996.
xvi

be higher than the amount required for new ships alone because theSON budget contains funds for purposes other than construction ofnew ships, including conversions of existing ships, outfitting,post delivery costs, cost growth, and funds to cover unforeseenescalation. Over the past ten years, these items have averagedabout 20 percent of the total SON budget. In this report, there-fore, it is assumed that funds required for new ships representabout 80 percent of the total SCN budget in any given year.
Option II; Slower Buildup to Navy Force Objectives
Option II would achieve the same force goals as Option Ibut would take four more years to attain them. Authorizationsfor Option II would be distributed over a ten-year period endingin 1992, with deliveries assumed to be substantially complete by1996. A total of 230 ships would be authorized over the ten-yearperiod in this option at a total cost of $170 billion. More shipswould have to be constructed than in Option I because more olderships would be retired during the longer duration of Option II.This would translate into an average annual expenditure of $17.0billion for new ship construction or (assuming an 80 percent shareof SCN for new construction) a total average SCN budget of $21.3billion per year for ten years. This would be a lower annualaverage expenditure than Option I but still over two times the SCNbudget for fiscal year 1982 and about 16 percent more than theAdministration's request for 1983.
It should be recognized that, when viewed over a longer timeframe, Options I and II are in fact the same since both eventuallyattain the same force goals. They are treated here as two optionsand viewed over different time periods in order to investigate theeffects of timing and scheduling on the budgetary requirements fora naval force expansion program. Although the long-term budgetaryrequirements for these two options should be about the same, thenearer-term budget implications would be substantially different.
Option III; Budget Constrained Program
Option III illustrates the force levels that might result ifthe Navy continued to procure the same types of ships as currentlyplanned, but with the shipbuilding budget constrained to moremodest growth. In Option III, it was assumed that the budget fornew construction was limited to a level of about $10 billion peryear (or $12.5 billion for the total SCN budget).
xvii
92-181 0 - 8 2 - 2

The Navy resulting from Option III, that is a Navy con-strained to modestly increased budget levels and currentlyprogrammed ship types, would contain about 540 ships in the mid-1990s, about the same number as the current force. The mix ofship types in Option III would correspond to those in the Navy'splans but at the lower numbers dictated by constrained budgets.The resulting fleet would include 12 carrier battle groupsinstead of 15 and lower force levels in most other categories—levels that would closely resemble the force goals of the previousAdministration.
Option IV; Expanded Navy of Modified Force Mix
Option IV would provide the higher numerical force levelsof Options I and II but at lower cost. It would include asomewhat different mix of combatant ships than those in cur-rent Navy plans—a mix motivated by an emphasis on open-ocean,distributed-force operations as opposed to emphasis on concen-trated offensive strikes.
Distributed-force, open-oc^an operations require shipsthat can surveil large areas and can engage enemy units—surface,subsurface, or airborne—at long range. Ships for these opera-tions, therefore, should have helicopters or vertical/shorttake-off and landing (V/STOL) aitcraft for long-range surveil-lance and targeting, towed-array sonar systems for long-rangesubmarine detection, cruise missiles, and long-range anti-airwarfare (AAW) capability. Option IV would include a total of 73new surface combatants of types well-suited to distributed-forceoperations but not currently included in Navy construction plans.These include 12 guided missile aviation cruisers (CGV) and 61guided missile destroyers (DDGY).
The CGVs would be equipped With a balanced suite of ship-mounted anti-air, antisubmarine, and antisurface weapons, includ-ing vertically launched missiles. Their principal feature,however, would be a flight deck and support facilities for eightto 12 V/STOL aircraft or helicopters—an air group large enough toprovide a sustained airborne surveillance capability for a navalforce not containing an aircraft carrier.
The DDGY is a general purpose surface combatant also equippedwith a balanced suite of anti-air, antisubmarine, and antisurfaceweapons. It would have a modern (but non-AEGIS) AAW system, atowed-array sonar, and vertically launched missiles. Its flight
xviii

deck and aviation support facilities would be adequate for twohelicopters (or future V/STOL aircraft) for extended surveillance,targeting, and attack. These ships, with their ability to providea naval presence and force over a large ocean area, could be usedin a wide variety of missions from offensive strikes to patrol andpresence operations.
Option IV would also call for resuming construction ofnonnuclear attack submarines of an upgraded and modernized type tosupplement the nuclear submarine force. These are suggested notbecause they are more capable on a ship-to-ship basis than nuclearsubmarines but because of their cost advantage. Some importantsubmarine missions, such as barrier patrols, could be performedadequately by nonnuclear submarines, and some argue that diesel-electric submarines, because they are very quiet and difficult todetect when operating on battery power, would actually be moreeffective than nuclear submarines for some missions. The approxi-mately three-to-one life-cycle cost advantage of diesel-electricsubmarines over current nuclear attack submarines would provide alarger submarine force, and, therefore, the flexibility inherentto more units, for a given investment. Thus, as a supplement tothe nuclear force, diesel-electric submarines could be assigned tomissions for which they are suited and free nuclear submarines formore demanding tasks.
Option IV would procure 231 ships over ten authorizingyears at a total cost of $121 billion. This would correspond toan average annual program of $12.1 billion for new construction orabout a $15.1 billion average annual total SCN budget requirement.This budgetary requirement would fall between the force sustaininginvestment level of Option III and the sharply increased budgetlevels of Options I and II.
INDUSTRY AND NAVAL FORCE EXPANSION
The four options considered above were analyzed for theireffect on the U.S. shipbuilding industrial base, with the aidof a computer model called the Institute for Defense AnalysesShip Allocation System (IDASAS). The results indicated that allof the options were well within the capacity of the currentshipbuilding industry, assuming, of course, some growth in ship-yard employment levels.
The major problem in the shipbuilding industry at presentis not the physical capacity to respond to any anticipated Navy
xix

buildup, but rather one of staying in business in the face of adisappearing demand from commercial ship operators. Compared to1972 and 1973, when U.S. shipbuilders received new orders for 48and 43 merchant ships, respectively, of 1,000 gross tons andover, only seven vessels were ordered in 1980 and six in 1981.The government, therefore, has become almost the sole remainingcustomer for this industry and government actions are likely to bekey determinants of the size and capabilities of the industry inthe future.
TOTAL NAVY BUDGET UNDER FOUR OPTIONS
The costs outlined for each of the above options and ex-plained in more detail in the appendixes are only those in theShipbuilding and Conversion, Navy (SCN) budget. Additionalcosts—including funds for such things as operations, maintenance,manpower, weapons, and aircraft procurement—are interrelated andspread across a wide spectrum of activities. Calculating them isa complex and laborious process. The Congressional Budget Office(CBO), however, has developed a computer model, called the DefenseResources Model (DRM), that automates this process and enables CBOto compute relatively rapid estimates of the overall budgetaryeffects of changes in procurement plans.
Projections of the Navy's overall budget requirements undereach of the four options, as estimated with the help of the DRM,are shown in the Summary Figure. The required budget authorityrises sharply to a peak in order to effect a rapid force buildupand then settles back to a somewhat lower sustaining budget level.This effect is most pronounced for Options I and II, with OptionI—the accelerated buildup—peaking several years before OptionII. Option IV—the 600-ship option with a different force mix—shows a similar trend but at a somewhat lower level. OptionIII—which basically maintains current force levels—also requiressome growth in real budget authority but at a much more modestlevel. Tables showing these estimates in detail are providedin Chapter V.
THE ADMINISTRATION'S FIVE-YEAR SHIPBUILDING PLAN
The five-year shipbuilding program proposed by the Admin-istration in the fiscal year 1983 budget is shown in SummaryTable 4. It proposes authorization of 133 new ships and 16conversions, service life extension program (SLEP) overhauls, and
xx

Summary Figure.
Navy Budget Authority Since 1975 and Projected to 1995Under Four Program OptionsBillions of Fiscal Year 1983 Dollars
110
60 —
50 —
1975 1980 1985 1990Fiscal Years
1995

SUMMARY TABLE 4. ADMINISTRATION'S PROPOSAL SHIPBUILDING PROGRAMFOR FISCAL YEARS 1983-1987
Type of Ship
Trident (BallisticMissile Submarine)
SSN-688 (Attack Submarine)CVN (Aircraft Carrier-Nuclear)CV (Aircraft Carrier) SLEP b/CG-47 (Guided Missile Cruiser)CG-42 (Nuclear Guided MissileCruiser)
DDG-51 (Guided MissileDestroyer)
DD (Destroyer)BB (Battleship) ReactivationFFG-7 (Guided Missile Frigate)MCM (Mine Countermeasure Ship)MSH (Mine Countermeasure Ship)LSD-41 (Landing Ship Dock)LHD-1 (Amphibious Ship)AOE (Multipurpose Stores
Ship)AE (Ammunition Ship)ARS (Salvage Ship)AD (Destroyer Tender)T-AO (Oiler)T-AGS (Ballistic Missile Submarine
Support Ship) ConversionT-AK (Cargo Ship) ConversionT-ARC (Cable Ship)T-AGM (Range InstrumentationShip) Conversion
T-AGOS/AGOS (Surveillance TowedArray Sensor System)
T-AKRX (SL-7) Conversion c/T-AFS (Stores Ship) ConversionT-AH (Hospital Ship) Conversion
New Construction ShipsConversions/SLEPs/Reactivations
1982 a/
—2
——3
—
——131
—1—
——2—1
——
—
—4
42—
17
7
1983
22213
—
——124
—1
—
——1
—1
———
——
4
—1
18
7
1984
13
——3
—
——124111
——1—3
———
—1
——1
21
2
1985
14
—13
—
1
—125
—2
—
11
——4
21
—
——
——1
24
2
1986
14
——4
—
—2
—3—52
—
12
—14
——1
12
———
32
1
1987
14—14
1
31
—3—521
21
—16
———
—3
———
38
1
1983-1987Total
6172317
1
43312131182
442218
211
16
4
—2
133
16
SOURCE: Department of Defense
NOTE: All ships, conversions, and service life extensions are proposed to be authorizedin the year listed. They will not enter the fleet until later years.
a/ Included to provide comparison with the Administration's program.
b/ SLEP = Service Life Extension Program.
£/ Acquisition of eight T-AKRXs will be completed in fiscal year 1982.

reactivations in fiscal years 1983 through 1987. Although thisfive-year program, estimated to cost over $80 billion in fiscalyear 1983 dollars, is more ambitious than previous programssubmitted to the Congress over the past few years, it would notaccomplish all of the Navy's goals. It is, perhaps, closest toOption II of this report, but does not contain sufficient ships,particularly surface combatants, to reach many of the Navy goalsfor specific ship types. In addition, this plan—as has been thecase with so many previous shipbuilding plans—places procurementof most of its ships in the later out-years. Over half of the 133ships of this five-year plan appear in the last two years.Achievement of the Navy's force level goals, therefore, wouldrequire adhering to at least the authorization levels contained inthe out-year building plans and continued high levels of construc-tion in the years beyond fiscal year 1987.
BUILDING THE FUTURE NAVY—DIFFICULT CHOICES
Consideration of the four program options discussed abovesuggests some important conclusions regarding the Navy's currentforce expansion plans. Options I and II indicate that buildingup to the force levels proposed by the Navy with the kinds ofships currently programmed, could not be accomplished withoutincreasing shipbuilding and total Navy budgets to levels wellabove recent peacetime practice. Option III indicates that, ifthe Navy continued to procure the kinds of ships currently pro-grammed, some real budget growth would be required even tomaintain current force levels. Attainment of the currently statedforce goals within the bounds of even fairly vigorous real growthin budget authority might not be achieved unless successfulefforts could be mounted to develop less costly warships, such asthose suggested in Option IV.
Not only is the Navy's shipbuilding program very expensive,but it is predicated upon an offensive strategy that is, inthe opinion of some observers, dangerously provocative in anuclear-armed world and very hazardous to U.S. carrier forces evenif a nuclear exchange is avoided. Critics of the Navy's strategyargue that the U.S. should turn away from the current emphasison offensive strikes into Soviet waters—strikes which, theyfeel, would be likely to result in more damage to irreplaceablecarrier battle groups than to Soviet forces—and emphasize insteadthe development of a Navy with distributed offensive capability,able to control large areas of the ocean, including vital sealanes and strategically important areas in the Third World. Such
xxiii

a Navy, it is argued, would be better able to protect U.S. inter-ests across a wider spectrum of future contingencies.
The Congress, therefore, must not only consider the budgetaryimplications of future shipbuilding programs but also the wisdomof the naval strategy assumptions upon which those programsare based.
xxiv
CHAPTER I. INTRODUCTION
One of the most widely known and discussed defense goalsestablished by the Administration is naval force expansion, or the"600-ship Navy." Convinced that currently operational navalforces are inadequate to support fully existing U.S. worldwidecommitments and possible future contingencies, the Administrationhas proposed a substantial buildup of naval forces. Althoughthe proposed expansion would be a many-faceted program involvingmore than just increasing the number of ships in the Navy, theterm "600-ship Navy" has become the commonly used catchword fordescribing this goal.
A gross ship total, such as 600 ships, can be justifiablycriticized as an inadequate indicator of naval strength. It saysnothing about ship capabilities or such other key factors asaircraft, manpower, training, logistics, maintenance, moderniza-tion, and a host of other items vital to the effectiveness ofa modern Navy. Despite this, the term 600-ship Navy does serveas useful rhetorical shorthand in discussing the proposed buildupand it is a convenient index with which to measure a balancednaval force expansion.
This proposed naval program is a very large undertaking. Itwill require a substantial increase in budgetary authority for theNavy which will have to be sustained over a period of many years.Decisions made now in shaping such a program will influence thestructure and capabilities of U.S. naval forces well into the nextcentury. This raises many important issues for the Congress,including the following:
o What is the rationale for a naval force buildup?
o What forms can such a buildup take?
o How long will it take?
o What are the budgetary implications of the proposedbuildup?

This report examines these issues. In particular, itanalyzes the ship-related aspects of the proposed naval expansionwith regard to procurement costs and schedules, effects on theshipbuilding industry, naval manpower, and operation and main-tenance (0 & M) requirements.
The importance of these issues is highlighted not only bythe long-term national security implications cited above, but bythe sheer magnitude of the expenditures involved. The Congres-sional Budget Office (CBO) estimates that a program to build thefleet of ships recommended by the Navy would cost at least $170billion in ship procurement alone over a period of ten years.Assuming an 80 percent share for new construction in the Navy'sshipbuilding and conversion (SON) budget, this would imply anaverage annual budget requirement of $21.3 billion for SCN, morethan twice the amount authorized in fiscal year 1982. Moreover, aNavy buildup would involve additional procurement in other cate-gories, such as aircraft and weapons, and additional costs formanpower and operations in sustaining a larger fleet. Indeed, thetotal Navy budget would have to grow to a level nearly 40 percentabove that for fiscal year 1982 (in fiscal year 1983 dollars) toaccomplish the buildup, and would then settle to a level about 25percent higher than fiscal year 1982 to sustain the larger fleet.
Chapter II of this report describes the Navy's plan forexpanding naval force levels and presents the rationale underlyingthis expansion. Chapter III presents four options for future Navyshipbuilding, using various numbers and mixes of ships. Theseoptions are defined in more detail in the appendixes. Chapter IVdiscusses the industrial base necessary to support building shipsfor an expanded Navy. Chapter V analyzes the aggregate costs ofnaval force expansion and projects total Department of the Navybudgetary requirements under each of the four options. Chapter VIdiscusses the Administration's proposed five-year shipbuildingprogram for fiscal years 1983-1987.
All cost figures in this report, unless otherwise noted, arein terms of fiscal year 1983 dollars.

CHAPTER II. RATIONALE FOR THE 600-SHIP NAVY
Once the unequivocally dominant power at sea, the U.S.Navy has seen this dominance erode over the past two decadesas the result of a vigorous expansion by the Soviet navy inboth the numbers and sophistication of its forces. During thepast decade, Navy witnesses before the Congress have deliveredincreasingly hedged assessments about the degree of naval superi-ority enjoyed by the United States. Finally, in his testimonylast year, the Chief of Naval Operations refused to claim anymargin of superiority for U.S. naval forces. In his testimony, hestated:
. . . it would be misleading to continuespeaking of a 'narrow margin1 when, in fact,we have entered a period in which any reason-able estimate of the balance falls within therange of uncertainty. In other words, thesituation today is so murky one cannot, withconfidence, state that the U.S. possesses amargin of superiority. I/
U.S. VERSUS SOVIET NAVAL FORCES
The Soviet navy has improved substantially in the past 25years. In the categories of major surface warships and amphibiousships alone, Soviet force levels grew from about 260 in themid-1960s to 362 in 1980. Concern about the relative navalbalance, however, is not so much the result of simple numericalcomparisons. It is, rather, the result of qualitative trends andof the rapid evolution of the Soviet navy from a force of modestcapabilities oriented toward coastal defense to a modern, blue-water force capable of posing a serious threat to the U.S. Navyanywhere in the world.
I/ Testimony of Admiral Thomas B. Hayward, USN, Chief of NavalOperations, in Department of Defense Appropriations for 1982,Hearings before the Subcommittee on Defense, House Committeeon Appropriations, 97:1 (March 1981), Part 1, p. 540.

A recent publication of the Department of Defense (DoD)estimated the size of the Soviet fleet at over 2,400 ships. _2/A cursory examination of such fleet comparisons could lead tounwarranted alarm if the numbers were not put in the propercontext. The large number of ships in the Soviet fleet is mostlyaccounted for by relatively small ships of modest capability.This impressive Soviet ship total does show, however, that,despite its recent emphasis on capable and expensive warships, theSoviet Union has also retained the large number of "low-mix" shipsbuilt to defend its extensive coastal areas and to support thefour-fleet posture that geography imposes upon it. 3/
During the decade of the 1970s, the Soviet navy introduced12 new classes of ocean-going warships, all equipped with modern,sophisticated weapons and electronics systems. At the same time,the Soviet Union adopted a distinctly more assertive stance indeploying its naval forces at sea, with Soviet naval groupsappearing on a regular basis in areas such as the MediterraneanSea where the U.S. had long been accustomed to unchallengednaval domination. The U.S.S.R. also demonstrated its new navalcapabilities and tactics in large-scale exercises called "Okean,"in which Soviet forces launched closely coordinated attacksagainst "enemy" forces clearly intended to represent U.S. carrierbattle groups. A key element of the Soviet tactical approachwas use of cruise missiles, launched by airplanes, submarines,and surface ships, for long-range attack. This aggressive newSoviet posture and the steady growth in the numbers of modernships and weapons has created a challenge that is troubling toU.S. naval planners.
THE U.S. NAVY TODAY; LARGER COMMITMENTS—SMALLER FLEET
While the Soviet Union was expanding its naval capabilities,the U.S. Navy suffered substantial declines in some widely watchedindicators of naval strength. Between 1970 and 1980, the numberof ships operated by the U.S. Navy fell from 847 to 538 and uni-formed personnel strength declined from 675,000 to about 525,000.
2j Department of Defense, Soviet Military Power (U.S. GovernmentPrinting Office, 1981), p. 40.
3/ The Soviet Union maintains fleets in the North Atlantic, NorthPacific, Black Sea, and Baltic Sea.
The ships remaining in the fleet are newer and more capable thanthose that have been retired but, nevertheless, the Navy has sub-stantially fewer ships with which to sustain its peacetime commit-ments or to undertake wartime operations than in the past, kj
In the meantime, demand for naval patrol and presence opera-tions in response to world tensions has increased. This hasbeen true most notably in the Middle East where the United Statesnow maintains a substantial naval force in waters on the otherside of the world from the continental United States. The strainscreated in responding to these demands were recently described bythe Chief of Naval Operations in these terms:
The records for continuous underway timeestablished by our recent Indian Ocean de-ployers have exceeded those experienced dur-ing any conflict involving U.S. naval forcesin this century. The fact is that the Navyhas been at virtually a wartime operatingtempo since the beginning of the Vietnamconflict, and has never stood down. Today theaverage ship's operating tempo actuallyexceeds Vietnam levels by about fifteenpercent. 5/
4Y Not only are the ships remaining in the fleet generallymore capable than those retired but the Navy has found otherways of accomplishing functions performed by some formerships. For example, the fleet of 1970 contained four anti-submarine warfare (ASW) carriers (CVS) and their associatedescort and support forces. Today's ASW capability, usingfixed surveillance systems, land-based patrol aircraft, andmore advanced sea-based ASW aircraft on attack carriers isalmost certainly superior to any capabilities possessed by theold CVSs. Similarly, the decline in mine warfare ships is atleast partially offset by the development of minesweepinghelicopters (although such helicopters have no minehuntingcapability), and a decline in the numbers of fleet tugs hasbeen offset by increased use of civilian charters.
5J Testimony of Admiral Thomas B. Hayward, USN, in Department ofDefense Appropriations for 1982, Hearings, Part I, pp. 537-38.

THE FUTURE NAVY—THE NAVY'S PLAN
The Administration has provided the Congress with specificrecommendations for the number and kinds of ships required toperform the Navy's missions. These recommendations derive fromthe Navy's current strategy for naval warfare in the event ofconflict with the Soviet Union. This section briefly describesthe Administration's force recommendations and their underlyingrationale. 6/
The Navy's View; Carrier Battle Groups Are Key to Victory at Sea
The Navy believes that the most efficient way to gain andmaintain control of the seas during wartime would be to destroyhostile forces capable of challenging that control. TJ This wouldinclude frontal assaults against Soviet naval forces and theirsupporting bases in Soviet home waters. Aircraft carrier battlegroups would be used as the instrument of such offensive action.The Navy believes that the very existence of such offensive forceswould force the Soviet Union into a defensive, reactive mode,allowing the United States to capitalize on Soviet geographic dis-advantages and compelling the Soviets to concentrate their navalforces in areas close to the Soviet Union where they would poseless of a threat to U.S. sea lines of communication. 8^/
The usefulness of carrier battle groups would by no meansbe limited to direct confrontations with the Soviet Union. Inthe Korean War ^and again in Vietnam, aircraft carriers were
6V Navy force objectives (ship numbers and types) presented inthis section are based on Hearings on Military Posture andH.R. 2970, Hearings before the Subcommittee on Seapower andStrategic and Critical Materials, House Committee on ArmedServices, 97:1 (February, March, and April 1981), Part 3, pp.441-75.
2J Testimony of Admiral Thomas B. Hayward, USN, Chief of NavalOperations, in Military Posture and H.R. 6459, Hearings beforethe Subcommittee on Seapower and Strategic and CriticalMaterials, House Committee on Armed Services, 96:2 (Februaryand March 1980), Part 3, p. 361.
8/ Ibid.

heavily involved in conducting tactical air strikes and providingair support for ground forces. A recent Brookings Institutionstudy examined the actual use of military forces in promotingU.S. political objectives in the period 1946-1975 and found thatnaval forces were involved in 177 of the 215 incidents studied,more than half of which involved aircraft carriers. 9/ Carriersremain the only means of very quickly aggregating a"~substantialamount of tactical air power on short notice in most areas of theworld. Carrier battle groups are, therefore, an important instru-ment of national power in a wide range of conflict scenarios,including Third World crises, and can be expected to remainso for the foreseeable future.
In addition to carrier battle groups, the Navy's offensiveforces include surface action groups (SAGs), which are navalcombat units that do not contain an aircraft carrier. They havebeen used in the Middle East and the Caribbean, and might be aform of response appropriate to other crises in the Third World.Their offensive capability will be considerably enhanced by theavailability of cruise missiles and might be further improved inthe future by deployment of vertical/short-takeoff and landing(V/STOL) aircraft aboard small carriers or "air-capable" ships.The concept of surface action groups gives surface combatantsan independent offensive mission once again and provides theNavy with additional flexibility in the employment of its forces.
The Navy intends to maintain and, in fact, substantiallyimprove its capabilities for supporting amphibious operations.Amphibious operations, that is the forcible landing of troops(Marines) from sea against enemy resistance, are complex anddifficult. The U.S. Navy and Marine Corps developed this militaryart to a high degree during World War II and have attempted tocontinue improving their amphibious capabilities since that time.The Administration has proposed a 50 percent increase in the liftcapacity (numbers of troops and amount of equipment that can betransported) of U.S. amphibious forces.
In addition to these offensive roles, the Navy would con-tinue to shoulder important defensive responsibilities in theevent of war. It would be vital to keep open the sea lines of
9/ Barry M. Blechman and Stephen S. Kaplan, Force Without War~~ (Washington, D.C.: The Brookings Institution, 1978), pp.
38, 41.

communications (SLOCs) connecting the United States with itsallies and its economic trading partners. The Navy would accom-plish this with barriers (across geographic choke points used bythe Soviet fleet), with maritime air patrols, and with convoyescorts. Similarly, the logistics chains supporting military andnaval operations around the world would have to be protectedand/or provided by the Navy. All of this would require a largeand capable fleet of ships.
The rest of this chapter discusses more specifically and inmore detail the types and numbers of ships the Navy believes arenecessary for performing its missions.
Ship Counting Methodology
When speaking of force levels, it is important to be clearas to which things are counted and which are not. DoD has recent-ly adopted a specific policy in this regard for naval ships. Indiscussing the 600-ship Navy or other issues relating to fleetsize, the ships counted are only those that contribute to theNavy's wartime missions through combat or direct support of combatoperations. These kinds of ships are shown in Table 1.
TABLE 1. SHIPS INCLUDED IN NAVY FORCE LEVEL GOALS, BY TYPES
Strategic ForcesBallistic Missile Submarines(SSBN)
Battle ForcesAircraft Carriers (CV/CVN)Battleships (BB)Cruisers/Destroyers (CG/CGN/DD/DDG)
Frigates (FF/FFG)Attack Submarines (SS/SSN)Amphibious Ships (LHA/LHD/LPD/LSD/LST)
Replenishment Ships (AOE/AOR/AO/AE/AFS)
Small Combatants (PG/PHM)Mine Warfare Ships (MSO/MCM/MSH)
Support ForcesMaterial Support Ships(AD/AS/AR)
Fleet Support Ships(ATS/ATF/ASR/ARS/AGOS/TAGOS/TATF)
Major Mobilization ForcesReserve ships that wouldparticipate in combat ordirect combat support

Not included are indirect support auxiliaries, prepositioningand sealift ships, and mobilization forces not likely to engagein combat or direct combat support. About 36 ships now operatedby the Navy fall into these excluded categories.
Carrier Battle Groups
During the past 25 years, the Navy has traditionally de-ployed aircraft carriers, with their associated escorts andsupport ships, in the Mediterranean Sea and in the WesternPacific. Until recently these standing deployments consisted oftwo carrier groups in the Mediterranean and two in the WesternPacific. Deteriorating conditions in the Middle East have nowgiven rise to a requirement for forces in the Indian Ocean aswell. As a result, the Navy now maintains five deployed carriers—usually a task force containing a carrier in the Indian Ocean,plus two carriers each in the Mediterranean and the WesternPacific. These five deployments are currently sustained by aforce of twelve deployable carriers. 10/ This situation is partof the strained operating tempo cited by the Chief of NavalOperations. A more comfortable and sustainable posture wouldbe to have three carriers in the force for each one deployed.This would provide for a more orderly rotation of ships todeployment stations, provide time for periodic maintenance, timeashore for the crew, and more ships to respond to unforeseencontingencies. These considerations, as well as an underlyingconcern that twelve carriers might be inadequate in wartime, havemotivated the Navy's request to expand its force from 12 to 15deployable carriers.
Expansion to a force of 15 carriers would require growthin other forces as well. The Navy would need enough additionalescort and logistics ships to support the three new carriers.This would generate a requirement for about 26 additional surface
i2/ There are actually 13 carriers in commission but one isundergoing an extensive refit under the Service Life Exten-sion Program (SLEP). The planned continuation of SLEP willhave one carrier in a nondeployable status at all timesuntil the end of the century. In addition, the Navy main-tains one older carrier, Lexington, as an aviation trainingship. Lexington currently has no air group or aircraftsupport capability and could not be deployed.
92-181 0 - 8 2 - 3

combatants and 8 underway replenishment ships, ll/ In the Navy'splan, these would include a large proportion of highly capable andvery costly surface combatants, such as the CG-47-class cruiserand the planned DDG-51-class destroyer.
Clearly, additional air groups would also be required for thenew carriers, necessitating procurement of additional aircraft andexpansion of the naval aircraft support structure. This issue isaddressed in a companion CBO study, The Budgetary Implications ofModernizing and Expanding Carrier-Based Air Forces (forthcoming).
Surface Action Groups
The Navy also proposes, in their future force planning, toform four surface action groups (SAGs), which are smaller battlegroups not containing aircraft carriers. An obvious role for thefour Iowa-class battleships that the Navy plans to reactivatewould be to serve as the centerpiece of these surface actiongroups. The Navy envisions future SAGs as consisting of a battle-ship, a CG-47-class cruiser, and three DDG-51-class destroyers.Equipped with cruise missiles, SAGs would be essentially equiva-lent to current Soviet battle groups and could operate as offen-sive strike groups in areas of moderate enemy threat. Using theirguns as well as cruise missiles, they could be particularlyeffective in operations against coastal target areas and insupport of amphibious operations.
Modification plans for the late 1980s could include fittingthe battleships with a flight deck and support facilities for adetachment of vertical/short-takeoff and landing (V/STOL) aircraftor helicopters to provide air cover and extended surveillance forthe surface action groups. But even without such facilities, the
ll/ The Navy, for planning purposes, assumes that the 15 carrierswould be deployed in wartime in seven two-carrier battlegroups, each containing 12 surface escorts plus one single-carrier battle group containing six surface escorts. Eachbattle group, either with one or two carriers, would besupported by an underway replenishment group. In addition,the logistics chain would require naval auxiliary or merchantships to resupply the replenishment ships. It is assumedhere that three additional carriers would be supported by twoadditional replenishment groups.
10

modified battleships could operate with the support of land-basedaircraft, helicopters from accompanying destroyers and cruisersand, in the future, aircraft from large amphibious ships (LHA/LHD)that could support V/STOL or helicopter operations. The four pro-posed SAGs would require about 20 ships and, as in the case ofcarrier battle groups, their operations would require the supportof underway replenishment ships.
Total surface combatant requirements, as seen by the Navy,are shown in Table 2. This represents the number of surfacewarships required to support 15 aircraft carriers, four surfaceaction groups, the amphibious force, 10 underway replenishmentgroups, and seven convoys.
TABLE 2. NAVY OBJECTIVE FOR SURFACE COMBATANT FORCE LEVEL a/
FF/Force Types BB CGN CG-47 DDG-51 DD-993 DD-963 FFG
15 Carrier BattleGroups — 6 23 31 — 30
4 Surface ActionGroups 4 — 4 12
Amphibious Force(1.5 MAF) b/ — -- — 10 4 — 8
10 UnderwayReplenishment Groups — — —
7 Convoys — — —
Total 4 6 27
10
63
7
4 37
30
63
101
a/ See glossary in Table 1 for identification of ship type foreach designation; for example, CG is a cruiser.
J>/ A MAF is a Marine Amphibious Force consisting of about 32,500troops.
11

Attack Submarines
Many observers believe that submarines would be the warshipsmost likely to prove decisive in future naval combat. The Navynow has a force of 91 attack submarines of which all but fiveare nuclear powered. 12/ They would be used in wartime to conductoffensive operations against enemy submarines and shipping inforward areas, to form barriers at geographic choke points againstthe passage of enemy ships and submarines, and to operate indirect support of battle groups. Submarines might be used aswell in various secondary missions such as minelaying in forwardareas. The Navy believes that together all of these missionswould require a force of more than 100 submarines in wartime.Until recently the Navy had a force level goal of 90 nuclearattack submarines. This has been increased recently to 100 sub-marines, but, pointing to the Soviet force of about 110 nuclearand 180 diesel attack submarines, the Navy regards even a 100-ship force goal as set more by budgetary than operational con-siderations. 13/
Amphibious Forces
Amphibious forces--that is, those forces capable of theforcible landing of troops from the sea—are regarded by the Navyas a key element of its power-projection capability. Given thecurrent emphasis on the Rapid Deployment Force (RDF) and associat-ed force projection capabilities in the national strategy, amphib-ious force capabilities assume particular importance.
12/ Attack submarines (designated SS—conventionally powered, orSSN—nuclear powered) are general purpose warships with aprimary mission of defeating enemy submarines and surfacewarships. Ballistic missile submarines (SSBNs) are strategicforce ships with a primary mission of launching nuclearballistic missiles.
137 Vice Admiral J. G. Williams, USN, Deputy Chief of NavalOperations (Submarine Warfare), stated that he believes aforce of 131 nuclear-powered attack submarines would be moreappropriate to the real military need. In Hearings onMilitary Posture and H.R. 2970, Part 3, p. 216.
12

The amphibious force contains several types of ships, allspecifically designed to support the landing of troops onto ahostile shore. The Navy's current capability, considering bothtroop and equipment lift requirements, can lift about one notionalMarine Amphibious Force (MAP). 14/
Current peacetime deployment requirements call for maintain-ing three Marine Amphibious Units (MAUs) continuously deployed,one in the Mediterranean and two in the Western Pacific, with afourth intermittently deployed in the Caribbean or North Atlantic.With current amphibious ship force levels, however, only theAtlantic fleet can meet its requirement and both the Atlantic andPacific fleets experience higher than desirable deployment ratios(ratio of time deployed to time in home port).
The Administration believes that the current amphibious liftcapability should be substantially expanded to a level that wouldsimultaneously support a MAB in addition to the current MAF. Thiswould require a 50 percent increase in troop capacity over thatrequired for a MAF alone and even larger increases in capacityfor vehicles and cargo (see Table 3). Lift capacity would beincreased both by adding to the number of ships in the amphibiousforce and by replacing retiring amphibious ships with new ships oflarger capacity. Such an expansion would permit a simultaneouslanding in force in two different areas or, of course, a landingwith a substantially larger force in a single area.
Replenishment Ships
Navy planning currently considers a force of 69 replenishmentships to be the minimum needed to support a 15-carrier Navy.Table 4 shows the types of replenishment ships planned.
In underway replenishment, it is important to minimize thetime a warship must spend alongside the replenishment ship. Inthe Navy's underway replenishment concept, warships in the battle
14 / Three acronymns—MAF, MAB, and MAU—are commonly used todenote variously sized aggregates of amphibious troops andtheir equipment. A Marine Amphibious Force (MAF) consists ofabout 32,500 troops, a Marine Amphibious Brigade (MAB) hasabout 15,500 troops, and a Marine Amphibious Unit (MAU) hasabout 1,600 troops.
13

TABLE 3. AMPHIBIOUS LIFT REQUIREMENTS
Vehicles Cargo(Sq. Ft. (Cu. Ft.
Lift Requirement Personnel X 1,000) X 1,000) Helicopters
MAF (Current)
MAB(Proposed Addition)
Total Requirement
35,880
17,826
53,706
778
495
1,273
2,045
1,771
3,816
512
167
679
Percent of oneMAF Lift 150 164 187 133
SOURCE: Department of the Navy,
TABLE 4. REPLENISHMENT SHIPS: OBJECTIVES AND CURRENT FORCE
Ship Type Objective Current Force
Multiproduct StationShips (AOE/AOR)
Oilers (AO/TAO)
Ammunition Ships (AE/TAE)
Refrigeration/StoresShips (AFS/TAF)
Total
15
29
16
9
69
11
19
13
10
53
14

group would be resupplied by multiproduct "station ships," whichwould provide fuel, ammunition, and stores in a "one-stop" replen-ishment. 15/ The station ships would be resupplied by "shuttleships"—oilers (AOs), ammunition ships (AEs), and stores ships(AFSs)—in the underway replenishment group. The shuttle ships,in turn, would be resupplied at advance bases with materialsbrought in by merchant ships.
Thus the Navy seeks to establish a logistics chain culminat-ing in a rapid transfer of fuel, stores, and munitions to operat-ing warships at sea. Since replenishment ships are absolutelyessential for sustained operation at sea, loss of any link in thechain can result in loss of the logistics flow and, therefore,loss of the battle group's ability to sustain operations at sea.Any decision to expand the size of the battle fleet, therefore,requires a commensurate expansion of the mobile logistics supportforce.
Mine Warfare Forces
Although mine warfare is among the least glamorous of navalactivities, it is also one of the most potent threats in theentire arsenal of naval weapons. Not only can mines destroy enemymerchant and naval ships at low cost to the nation deployingthem, but the very threat of mines can paralyze large numbersof enemy ships. Mines used by an inferior naval power cangreatly inhibit the use of the seas by a dominant naval power,and the dominant power can use mines to solidify its controlefficiently over ocean areas against potential challengers. Minewarfare, therefore, deserves careful consideration in developingnaval plans and programs.
The Soviet Union is not unaware of the effectiveness of minesand is known to have the world's largest stockpile of mine warfareweapons. The U.S. mine warfare fleet has dwindled from about 100ships in the mid-1960s to the present level of 25 ships, almostall of which are over 25 years old, and all but three of which areassigned to the Naval Reserve. The Navy plans to improve capabil-
15/ Station ships are designated as AOEs and AORs. AOEs arelarger (53,000 tons vs. 37,000 tons) and faster (29 knots vs.21 knots) than AORs.
15

ities in this long-neglected area by building at least 31 new minecountermeasure ships, designated MCM and MSH. The lead MCM wasauthorized in fiscal year 1982.
Summary of Navy Force Goals
The Navy believes that the fleet described above and out-lined in Table 5 is the minimum force necessary to protect U.S.interests at sea, given currently foreseen conditions. It fea-tures 15 deployable aircraft carriers, with their associated airwings and battle group escorts, forming the primary offensivestrike forces. These 15 battle groups, together with the foursurface action groups (SAGs), 100 nuclear attack submarines, and
TABLE 5. NAVAL FORCE OBJECTIVES
Number of ShipsShip Type Objective Current Force
Aircraft CarriersBattleshipsBattle Group EscortsFrigatesAttack SubmarinesSmall Combatants
154
137101100
—
120
11281915
Total, Combatants 357 301
Amphibious Ships 75 (1.5 MAF) 65 (1.0 MAF)Mine Warfare Ships 31 25Replenishment Ships 69 53Material Support Ships 27 26Fleet Support Ships 33 30
Total, Other Types 235 199
Strategic Force (SSBNs) Unstated 35
Total Ships 600+ 535
16

1.5 MAF amphibious force, would provide both a larger Navy, betterable to sustain the extensive deployment commitments now taxingthe current forces, and a Navy with enhanced combat capabilities,better able to conduct wartime tasks.
The previous Administration had many of the same basicgoals for the Navy, that is: improving fleet readiness, airdefense capabilities, and antisubmarine warfare capabilities;maintaining forces for worldwide presence and crisis management;strengthening offensive striking power; and upgrading mine warfareposture. Force level goals were more modest, however: 12 deploy-able aircraft carriers, 90 nuclear attack submarines, amphibiouslift for one MAF, and lower force goals in most other categories.The types of ships proposed by the current Administration areessentially the same as those of the previous Administration;the major difference is the size of the fleet.
THE FUTURE NAVY—WHAT IS NEEDED?
Current Navy strategy places primary emphasis on the carrierbattle group as the basis of naval power. In the event of afull-scale war between the United States and the Soviet Union,battle groups would be the primary offensive striking arm forconducting a frontal assault against Soviet naval forces andbases. This mission, however, is by no means the only one thatthe Navy might be called upon to execute in the future. Dependingupon the circumstances, the United States might find it advisable(because of the nature of the crisis, the disposition of Sovietforces, agreements made with allied nations, and so forth) topursue some strategy other than a frontal assault on Soviet homebases. The Navy might face a distributed threat by Soviet and/orother naval forces that would require a different mix of ships,including a sufficient number of surface combatants to protectU.S. interests over a relatively long period in distant waters.Indeed, recent events in the Middle East have been of this nature,straining the Navy's resources with demands for additional contin-uous deployments.
In addition, some have questioned whether an approaching car-rier battle group, with its enormous concentration of power, mightinduce the Soviet Union to use nuclear weapons against it. Cer-tainly the temptation would be great, given the difficulty of de-feating a battle group with conventional weapons. In addition,use of nuclear weapons at sea would involve minimal collateraldamage; it would, therefore, be a clear-cut tactical use exclu-sively against military forces.
17

Even if one takes the most pessimistic view of the pros-pects for using carrier battle groups to attack Soviet bases, theneed for aircraft carriers and their associated escort and supportforces does not necessarily collapse, although the strategyfor their employment might change. If the Navy was preventedfrom making a frontal assault on enemy naval forces in theirbasing areas because of concern about nuclear escalation—or forany other reason—then the strategy of winning through quickdestruction of the enemy's naval forces and supporting basestructure might have to be revised. In such a situation, a moregradual attrition of enemy forces and a wider distribution ofnaval forces might be necessary. In this kind of war, or in a warfocused in some area of the Third World, a massive, coordinatedattack such as the Soviet Union could organize near its homewaters might not materialize, but the U.S. Navy could be facedwith the task of opposing Soviet naval forces worldwide. In suchcircumstances, having ships with sufficient capability to with-stand the maximum Soviet home-water threat might be less importantthan having enough ships to oppose a distributed threat in distantwaters. 16/
16/ For a discussion of alternatives for naval mission priori-ties, see Congressional Budget Office, Shaping the GeneralPurpose Navy of the Eighties; Issues for Fiscal Years1981-1985 (January 1980), Chapter II.
18

CHAPTER III. BUILDING THE FUTURE NAVY—ALTERNATIVE APPROACHES
The Navy has described in fairly precise terms the kind offleet it believes is needed, but, even within the context of thatgoal, there can be many different programs, depending upon howquickly and in what sequence the required ships are built. Futureshipbuilding programs, however, may be constrained by budgetarylimits. This has, in fact, been the prevailing reality in thepast. Out-year shipbuilding plans have almost always beenscaled down to fit within budgetary limitations.
If the fleet recommended by the Navy is accepted as the goal,it is clearly desirable to get the required ships at sea assoon as possible. Building up the fleet rapidly would be expen-sive, however. Budgetary and industrial limitations might neces-sitate a slower expansion. If even an extended buildup provedinfeasible because of cost, then the force objectives might haveto be modified. This could be done by reducing the number ofships in the shipbuilding program or by modifying the mix of shipscontained within that program.
If the Navy determined to increase the fleet size butfell considerably short of its goal because of the high cost ofthe ships procured, this could affect significantly the strategyoptions available in a future conflict. An offensive strategymight still be possible with a smaller fleet of highly capableships, if the force was properly massed, skillfully used, and notdestroyed by nuclear counterattacks. If, however, the nature ofthe conflict called for extended operations in distant areasagainst a distributed threat, then a numerically smaller fleetmight be hard pressed to prevail.
The Congress should consider carefully the longer-termbudgetary implications of the Navy's shipbuilding program andassess whether the Navy's strategy—and the shipbuilding programderived from that strategy—is the best basis on which to proceedwith naval modernization. In order to begin such an assessment,there must be some estimate of the longer-term budgetary costs ofthe Navy's program and of some possible alternative programs.That is the objective of this chapter. Later, in Chapter V, theimplications for the total Navy budget, including manpower andsupport costs as well as procurement, will be examined.
19

This chapter presents four options illustrating the bud-getary and force structure effects of using different approachesto future shipbuilding programs. The options are designedto illuminate major program and budgetary implications of rep-resentative future naval shipbuilding alternatives. None ofthe options were designed to match the specific details of theAdministration's current five-year program. The Administrationprogram is discussed in Chapter VI.
OVERVIEW OF OPTIONS FOR NAVAL SHIPBUILDING PROGRAMS
Of the four options examined, two—Options I and II—wouldachieve the number and types of ships recommended by the Navy,with Option I reaching the goal more quickly than Option II.Option III would limit costs by procuring fewer ships of thekinds contained in current Navy plans. It would result in asubstantially smaller fleet than Options I and II. Option IIIillustrates what would probably happen if the United Statesembarked upon the Navy's plan, but the funding in future yearsfell short of the amount needed to complete the program. OptionIV introduces some ship types not contained in current Navyplans. It would reach the Navy's numerical force level goals,but do so at a substantially lower cost than Options I or II.Option IV illustrates the kind of program that might be pursued ifit was decided to emphasize a distributed-force, open-oceancapability as opposed to a concentrated carrier battle groupoffensive strategy.
Option I would achieve the Navy's force goals for typesand numbers of ships and have these ships at sea by 1992. Thistime frame generally agrees with the goal stated by the Secretaryof the Navy and is probably about the shortest industriallyfeasible time for accomplishing that goal. (For ships to becommissioned by 1992, CBO assumed that they would have to beauthorized no later than 1988.)
Option I would require an annual budget for Shipbuild-ing and Conversion, Navy (SCN) averaging $24.8 billion through1988. I/ That is a very high level—about 2 1/2 times the
Funds for building Navy ships are appropriated in the bud-get category "Shipbuilding and Conversion, Navy" (SCN). Theamount of this appropriation intended for new construction
20

shipbuilding budget in fiscal year 1982 (in fiscal year 1983dollars).
Option II also would reach the Navy's force goals, butextend the period of time for building the required ships. Inthis option, rather than having the ships in the fleet in tenyears, CBO assumed that the required ships would be authorizedover a ten-year period ending in 1992. This means that allthe ships would not enter the fleet until about 1996. OptionII would require construction of more ships than Option I tocompensate for the additional ships retired by the Navy duringthe longer duration of this option. Funding for Option II wouldaverage $21.3 billion (in fiscal year 1983 dollars) annuallythrough 1992, providing only slight budgetary relief from thehigh levels of Option I.
Since Options I and II both would result in shipbuildingand conversion budgets considerably higher than previous authori-zations, Option III is presented to illustrate the force levelsthat might be achieved by 1996 if annual budgets were limitedto levels about 25 percent above the level authorized in 1982 infiscal year 1983 dollars. In Option III, it is assumed that themix of ship types procured would be similar to those in currentNavy plans, but the force levels would be lower, generallycomparable to those planned during the Carter Administration.
Option IV would reach the higher force level goals ad-vocated by the Navy but with a somewhat different mix of shipsamong the combatant types than in Options I and II. The annualcost of about $15.1 billion, though higher than Option III,would be considerably lower than Options I and II.
Figure 1 shows the budget trends for shipbuilding andconversion, for each of the four options.
OPTION I: RAPID BUILDUP TO NAVY FORCE OBJECTIVES
Option I illustrates the program and budgetary implicationsof building naval forces conforming in numbers and types of shipsto the goals presented to the Congress by the Navy in testimony
varies from year to year but has averaged about 80 percentover the past 10 years. The other 20 percent is spent onother items, including ship conversions.
21

Figure 1.
Shipbuilding and Conversion, Navy Budget Levels Since 1975 andProjected to 1995 Under Four Shipbuilding Program OptionsBillions of Budget Year 1983 Dollars
35
30
25
20
15
10
Actual
AdministrationProposed Budget ^
for Fiscal Year 1983
01975
Projected
A./Option II
\ .-
1980 1985 1990Fiscal Years
1995
22

during the spring of 1981. 2/ It would achieve these forcegoals with nearly all of the required ships in the fleet withinten years. This period is about the shortest time in whichthe required ships could be built and is in general agreement withthe Secretary of the Navy's often stated goal of achieving a600-ship Navy by the end of this decade. Indeed, Option I resultsin over 600 ships at sea by 1989. A force with the specific typesof ships that conform to current Navy force structure goals is notachieved, however, until 1992.
In developing the force structure projections for OptionI and for all subsequent options, CBO assumed that the shipscurrently in the fleet would be retained for at least a servicelife of 30 years. A service life of 50 years is assumed foraircraft carriers and 40 years for certain classes of auxiliaryships that are now frequently retained beyond 30 years. CBOassumed that ships would be delivered to the Navy four years afterauthorization, except for aircraft carriers which require eightyears to build; Trident submarines, six years; nuclear-poweredcruisers, five years; and nuclear-powered attack submarines, fiveyears. Given these assumptions, new ships would have to beauthorized no later than 1988 to be in the fleet by 1992.
Using these assumptions and the Navy's force objectivesas shown in Table 5 in Chapter II, CBO developed a shipbuildingprogram through 1988 that would achieve the required force struc-ture by about 1992. Details of this building program and ayear-by-year breakdown of the resulting force structure arecontained in Appendix A. The results are summarized in Tables6 and 7.
This option would require authorization of a total of 176ships over a period of six years at a total cost of $119 billion.Major items include three aircraft carriers at $3.5 billion each,six Trident submarines at $1.4 billion each, nine SSN-688-classsubmarines at $700 million per ship, and 61 cruisers and de-stroyers for a total surface combatant cost of about $64 billion.This amount, however, is only for construction of new ships (andreactivation of the four battleships). The Navy shipbuildingbudget contains other items, such as conversions, outfitting,
2J See Hearings on Military Posture and H.R. 2970, Part 3, pp.441-75.
23

TABLE 6. OPTION I: RAPID BUILDUP TO NAVY FORCE OBJECTIVES—SHIPSIN FLEET BY 1992 AND AUTHORIZED BY 1988 (Dollar amountsin fiscal year 1983 dollars)
Current Force (End of 1981)Retirements Through 1992Now Building or AuthorizedNew Authority Through 1988Fleet Total, 1992
53515298176657
Six-Year Program: 176 ships costing $119 billion
Average Annual Program: 29.3 ships costing $19.8 billion
Average Annual SCN a./ Requirement: $24.8 billion
SCN = Shipbuilding and Conversion, Navy. It is assumed thatnew construction accounts for 80 percent of the total SCNappropriation.
TABLE 7. OPTION I: RAPID BUILDUP TO NAVY FORCE OBJECTIVES-ILLUSTRATIVE SHIPBUILDING PROGRAM
Ship TypeNumberof Ships
Percent ofTotal Cost
Trident SubmarinesAircraft CarriersSurface CombatantsAttack SubmarinesAmphibious ShipsMine Warfare ShipsReplenishment ShipsMaterial Support ShipsFleet Support ShipsTotal
63649173029135
176
795558295
less than 1
24
post delivery costs, cost growth, and unforeseen escalation.These items have averaged about 20 percent of the budget overthe past 10 years. _3/ Assuming a 20 percent allowance for theseother items, the resulting average annual cost would be $24.8billion, considerably higher than any previous peacetime ship-building budget. The fiscal year 1982 shipbuilding authorizationwas $8.8 billion, or about $9.6 billion in fiscal year 1983dollars. The Administration's 1983 request is for $18.6 billionfor shipbuilding.
A summary breakdown of the six-year shipbuilding programis displayed in Table 7. It contains three new carriers necessaryto build to 15 battle groups and other ships required to reachNavy force level goals. Clearly the dominant budget item issurface combatants, which claim over half of the total new con-struction budget. This is because of the large number of battlegroup surface combatants needed to replace those now approachingretirement and to build up to the higher force level goals, andthe high cost of the current AEGIS and AEGIS-derivative shipsproposed to replace them, 47
This option is the most desirable in terms of the Navy'scurrently stated objectives. It would attain the Navy's forcegoals and do so in a shorter period of time—by 1992—than any ofthe other options. It would produce a fleet structured to supportthe Navy's current offensive strategy (discussed in Chapter III),including 15 deployable aircraft carriers and their associatedhighly capable escort ships.
The cost of Option I would be very high, however. It wouldrequire a drastic and immediate increase in the shipbuildingbudget. These high budgetary costs might be relieved somewhat byextending the time taken to achieve the Navy's force goals. Thisalternative is investigated in Option II.
3/ Funds for constructing Navy ships are contained in the Ship-building and Conversion, Navy appropriation. See footnote 1of this chapter.
4_/ AEGIS is the name of a large shipboard anti-air warfare systemabout to be deployed by the Navy. It has been in developmentsince the late 1960s and will enter service for the first timeon U.S.S. Ticonderoga (CG-47), scheduled for commissioning in1983.
25
92-181 0 - 82 -

OPTION II; MODERATELY PACED BUILDUP TO NAVY FORCE OBJECTIVES
Option II would attain the same Navy force goals as OptionI, but extend the time to accomplish them. In Option II, CBOassumed that new ship authorizations required to achieve the forcegoals would be spread over a ten-year period ending in 1992, withship deliveries substantially completed by 1996.
Since this option would extend over a longer period duringwhich more older ships would be retired, more new ships would haveto be authorized than in Option I. Using the same retirementcriteria and building time assumptions as in Option I, an illus-trative shipbuilding program was developed for this option.Details of the shipbuilding program and the year-by-year breakdownof the resulting force structure are contained in Appendix B. Theresults are summarized in Tables 8 and 9.
A total of 230 ships would have to be authorized over aperiod of ten years in this option at a total cost of $170 bil-lion. This would require an average annual expenditure for newconstruction of $17.0 billion, somewhat less than in Option I, butspread over ten years rather than six. Moreover, the annualbudget requirements would still be substantially higher thanprevious norms. Assuming again an allowance of 20 percent of thetotal SCN budget for items other than new construction, the totalbudget requirement would average about $21.3 billion per year overthe ten-year period.
In the summary breakdown given in Table 9, surface com-batants still dominate in terms of their share of costs. Asin Option I, this occurs because of the large number of shipsrequired and the high cost of the AEGIS/AEGIS-derivative ships nowbeing procured or developed. Surface combatants procured underthis option include 20 CG-47-class cruisers at $1.14 billion pership, 42 DDGX destroyers at $800 million per ship, and 16 nuclearcruisers (CGN) at $1.75 billion per ship.
Option II would reach the same force goals as Option I,that is, a force consistent with the Navy's offensive strategy andwith the Navy's currently stated requirements. These goals areachieved, however, four years later than in Option I. The averageannual budget requirement for Option II would be reduced by about16 percent from Option I, but would remain high—still over twice
26

TABLE 8. OPTION II: MODERATELY PACED BUILDUP TO NAVY FORCEOBJECTIVES—SHIPS IN FLEET BY 1996 AND AUTHORIZED BY1992 (Dollar amounts in fiscal year 1983 dollars)
Current Force (End of 1981)Retirements Through 1996Now Building or AuthorizedNew Authority Through 1992Fleet Total, 1996
53524098230623
Ten-Year Program: 230 ships costing $170 billion
Average Annual Program: 23 ships costing $17.0 billion
Average Annual SCN a./ Requirement: $21.3 billion
a/ Shipbuilding and Conversion, Navy. It is assumed that newconstruction accounts for 80 percent of the SCN appropriation.
TABLE 9. OPTION II: MODERATELY PACED BUILDUP TO NAVY FORCEOBJECTIVES—ILLUSTRATIVE SHIPBUILDING PROGRAM
Ship Type
Trident SubmarinesAircraft CarriersSurface CombatantsAttack SubmarinesAmphibious ShipsMine Warfare ShipsReplenishment ShipsMaterial Support ShipsFleet Support ShipsTotal
Numberof Ships
1058716263038135
230
PercentTotal Cost
8105379283
less than 1
27

the amount appropriated in fiscal year 1982. 5J Alternativeswith more modest budget requirements might, therefore, be ofinterest. One approach to lower budget costs—reducing the numberof ships procured—is discussed in Option III.
OPTION III; BUDGET CONSTRAINED PROGRAM
Option III illustrates the force levels that would probablybe achieved if the Navy procured the same types of ships ascurrently planned, but with a shipbuilding budget constrained tomodest growth. In Option III, CBO assumed that the shipbuildingbudget was constrained to a level averaging about $9.7 billion peryear for new construction—which would correspond to an overall$12.1 billion SCN budget (in fiscal year 1983 dollars), againassuming new construction accounts for 80 percent of the SCNbudget.
Under the assumptions discussed above, nearly all of theincreased force level goals would have to be abandoned. The shipsthat could be procured within these limits would be sufficientonly to replace ships being retired and maintain current forcelevels. Details of the illustrative shipbuilding program for thisoption and the resulting year-by-year force structure breakdownare contained in Appendix C. The results are summarized in Tables10 and 11.
A Navy constrained to modestly increased budget levelsand currently programmed ship types would closely resemble thatplanned by the Carter Administration: 12 deployable aircraftcarrier battle groups, 90 nuclear attack submarines, amphibiouslift for 1 Marine Amphibious Force (MAF), and current levels formost other ship types. The budget assumed for this option is notoverly austere; indeed, it is higher than any SCN budget in the
_5/ The careful reader will observe that if Options I and II areconsidered over the same time period, fiscal years 1983through 1996, the average budget requirement would be aboutthe same. Both options would result in the same force struc-ture but Option I would reach it in 1992 rather than 1996.Unless force goals were revised, subsequent construction wouldbe only that required to maintain the status quo. Thus, in1996 force levels under Options I and II would be identical,but Option I had funding accelerated in the early years.
28

TABLE 10. OPTION III: BUDGET CONSTRAINED PROGRAM—SHIPS IN FLEETBY 1996 AND AUTHORIZED BY 1992 (Dollar Amounts inFiscal Year 1983 Dollars)
Current Force (End of 1981) 535Retirements Through 1996 240Now Building or Authorized 98New Authority Through 1992 146
Fleet Total, 1996 539
Ten-Year Program: 146 Ships Costing $98 billion
Average Annual Program: 14.6 ships costing $9.7 billion
Average Annual SCN a./ Requirement: $12.1 billion
a./ Shipbuilding and Conversion, Navy. It is assumed that newconstruction accounts for 80% of the SCN appropriation.
TABLE 11. OPTION III: BUDGET CONSTRAINED PROGRAM—ILLUSTRATIVESHIPBUILDING PROGRAM
Number Percent ofShip Type of Ships Total Cost
Trident Submarines 10 14Aircraft Carriers 0 0Surface Combatants 62 57Attack Submarines 6 4Amphibious Ships 16 11Minewarfare Ships 24 2Replenishment Ships 20 7Material Support Ships 8 4Fleet Support Ships 0 0Total 146
29

past decade. The relatively low force levels would primarilyoccur because of the very high cost of the types of ships, nowbeing procured by the Navy, particularly the combatants. Althoughthis option would result in force levels considerably below theNavy's current plans, it would require that recent SCN budgetlevels be not only maintained but be increased to a level about 25percent higher on average, in the future.
This option would retain the Administration's recent initia-tive for reactivating the four Iowa-class battleships. Foursurface action groups formed around these impressive ships couldbe used to supplement the present 12 carrier battle groups inmaintaining deployment commitments around the world. Instead ofdeploying two aircraft carrier battle groups in the Indian Ocean,for example, one carrier group and one surface action group mightbe deployed there. When upgraded with cruise missiles and im-proved helicopter-V/STOL aviation capability, a U.S. battleshipsurface action group would probably be superior to any currentSoviet battle group. Use of the battleships in this way couldrelieve some of the operating pressures on U.S. carrier forces.
Clearly an option that provides higher force levels, butwithout the very high budget requirements of Options I and II,would be desirable. This alternative is discussed in Option IV.
OPTION IV; EXPANDED NAVY OF MODIFIED FORCE MIX
Option IV investigates the feasibility of achieving highership force levels at a lower cost by altering the mix of shipsprocured. The shipbuilding program of Option IV resembles thatof Option II, except that several alternative warship types wouldbe substituted for those currently planned by the Navy. Thiswould result in force levels very close to the goals establishedby the Navy, but at an average annual SCN budget estimated atabout $15.1 billion (in fiscal year 1983 dollars), compared to$24.8 billion for Option I and $21.3 billion for Option II.Shipbuilding budgets of this magnitude, though significantlyhigher than in the past, might be achievable—if the Administra-tion's plans for substantial real growth in defense spending arerealized.
Alternative Ship Types
In seeking ways to reduce shipbuilding program costs, atten-tion is immediately drawn to the surface combatants, since that
30

category accounts for more than half of the total program costsin each of the three previous options. One of the most signifi-cant items in the surface combatant category is the guided missiledestroyer (DDG). A large number of this type of ship is neededto provide modern air defense protection to the fleet and toreplace the many existing DDGs that will be retired by 1996.The Navy is currently designing a ship, designated DDG-51 (previ-ously DDGX), to fill this role. The DDG-51 would be a capableanti-air warfare (AAW) ship, but its cost has risen steadilyduring design development and is now estimated at about $800million per ship. The previous three options all assumed procure-ment of DDG-51 for the guided missile destroyer role.
In Option IV, it is assumed that the DDGY, a substantiallyless expensive guided missile destroyer, costing about $400million per ship, would be procured, _6/ The cost estimate forthis ship is based upon the cost for the FFG-7-class guidedmissile frigate now being built, with additions for upgradedcombat system and ship performance features. The DDGY would nothave a powerful AEGIS or AEGIS-derivative phased-array radar asdoes the DDG-51, but it would have a modern AAW missile firecontrol system incorporating an advanced technology terminalengagement radar (TER). This and other features described in theCBO report cited in footnote 6 would make the DDGY a very capablewarship. There is no current program to develop a ship of thiskind, however. Such a program would, of course, involve sometechnical risks and as much as $300 million in research anddevelopment (R&D) expenditures. Availability of a ship like DDGYcould substantially reduce long-term shipbuilding program costsfor surface combatants.
In Option IV aircraft carriers would be procured at the rateof one every three years, as opposed to one every other year inOptions I and II. This would place 14 deployable carriers inthe fleet in 1996 rather than 15. Fleet aviation capability issupplemented in this option, however, by building twelve cruisers(CGV) with extensive facilities for supporting V/STOL aircraft.These cruisers would operate with surface action groups andunderway replenishment groups, as well as in other areas in whichcarrier-based aircraft are not available.
6/ This ship is discussed in Congressional Budget Office, NavalSurface Combatants in the 1990s; Prospects and Possibilities(April 1981).
31

Option IV would retain the Navy's new goal of 100 attack^submarines but procure updated diesel-electric submarines toprovide for the growth from the previous goal of 90 submarines.Though not as e f fec t ive as nuclear submarines over the fullspectrum of missions, diesel-electric submarines can per formquite well in some very important missions, such as barrierpatrols. _7Y The most at tractive feature of diesel-electricsubmarines is their low cost in comparison to nuclear-poweredships. Thus, more diesel-electric submarines could be procuredfor any given investment level. A German shipbuilding f i rm,Howaldtswerke-Deutsche Werf t , has formally offered to design andbuild a fully equipped diesel-electric submarine of 2,600 tonssubmerged displacement for the U.S. Navy for $218 million (infiscal year 1981 dollars). This price includes a capable moderncombat system of U.S. manufactured components. The firm estimatesthat follow-on ships would be about half that price. Nuclearattack submarines funded in fiscal year 1981 cost $457 millioneach and are estimated to cost $700 million in fiscal year 1983.A mixed force of nuclear and diesel submarines, with nuclearsubmarines undertaking the more demanding missions, would permitthe United States to maintain a force of 100 submarines at lowercost or, alternatively, to maintain a still larger number ofsubmarines at the same cost as an all nuclear force.
Shipbuilding Program
An illustrative shipbuilding program incorporating theforce mix changes described above is presented in detail inAppendix D, along with the resulting year-by-year force struc-ture breakdown. The results are summarized in Tables 12 and 13.
Option IV would produce an expanded Navy with force levelscomparable to Navy objectives but at a cost substantially lowerthan Options I and II. It would result in a fleet of 624 ships in1996, but with the different mix of ships discussed above. Theaverage annual budget requirement of $15.1 billion (in fiscalyear 1983 dollars), though less than the $24.8 billion and
TJ For a further discussion of diesel-electric submarines inmodern naval warfare, see Congressional Budget Office, Shapingthe General Purpose Navy of the Eighties; Issues for FiscalYears 1981-1985 (January 1980), pp. 93-96 and Appendix B, pp.127-40.
32

TABLE 12. OPTION IV: EXPANDED NAVY OF MODIFIED FORCE MIX--SHIPS IN FLEET BY 1996 AND AUTHORIZED BY 1992 (Dollaramounts in fiscal year 1983 dollars)
Current Force (End of 1981)Retirements Through 1996Now Building or AuthorizedNew Authority Through 1992Fleet Total, 1996
53524098231624
Ten-Year Program: 231 ships costing $121 billion
Average Annual Program: 23.1 ships costing $12.1 billion
Average Annual SCN a/ Requirement: $15.1 billion
a/ Shipbuilding and Conversion, Navy. It is assumed that newconstruction accounts for 80 percent of the SCN appropriation.
TABLE 13. OPTION IV: EXPANDED NAVY OF MODIFIED FORCE MIX-ILLUSTRATIVE SHIPBUILDING PROGRAM
Ship TypeNumberof Ships
Percent ofTotal Cost
Trident Submarines 10Aircraft Carriers 3Surface Combatants 90Attack Submarines 16Amphibious Ships 26Mine Warfare Ships 30Replenishment Ships 38Material Support Ships 13Fleet Support Ships 5Total 231
129425143115
less than 1
33

$21.3 billion of Options I and II, respectively, is still substan-tially higher than previous norms. (The fiscal year 1982 SCNauthorization was $8.8 billion, or about $9.6 billion in fiscalyear 1983 dollars.) Funding the program of Option IV would re-quire substantial real growth in SCN budget authority of about 8percent per year over the ten-year period. This is clearly morethan the 7 percent annual real growth over five years projected bythe Administration for overall defense spending, but is lessdrastic than the budget acceleration required for Options I or II.CBO's analysis, therefore, suggests that budget growth in SCN be-yond that projected for defense as a whole will almost certainlybe required if any significant naval force expansion is to berealized.
The fleet resulting from Option IV would not be simply a lessexpensive program than Options I and II. It would also be struc-tured in accordance with a somewhat different view of naval war-fare. Although it would possess much better offensive strikecapability than today's fleet, the fleet of Option IV would beoriented more toward broad-ocean, distributed-force operations asopposed to concentrated battle group strikes. Although this forcewould contain 14 large aircraft carriers and the ships to supportthem, it would be less optimized for offensive strike operationsthan the forces of the previous options in the interest of obtain-ing more ships, such as the CGV and the DDGY, that are well-suitedto worldwide operations against a distributed threat. This fleetstructure would be consistent with the view, described in thepreceding chapters, that the ability to control and defend largeareas of the ocean is likely to be at least as important a capa-bility for U.S. naval forces in the future as the ability to mounta frontal assault by battle groups in enemy waters.
Four Program Options—Recapitulation and Conclusions
Consideration of the four program options discussed abovesuggests some important conclusions regarding the Navy's currentforce expansion plans. Options I and II indicate that expandingto the force levels proposed by the Navy with the kinds of shipscurrently programmed could not be accomplished without increasingshipbuilding budgets to levels well above previous peacetimebudgets and well above levels that would be reached with 7 percentannual real growth. Option III indicates that, if the Navycontinued to procure the kinds of ships currently programmed andif shipbuilding budgets did not grow substantially above currentlevels, the Navy of the 1990s would be essentially that projectedby the previous Administration. Attainment of the currently
34

stated force goals within the bounds of the current Administra-tion's planned real growth in budget authority would be achievedonly if successful efforts could be mounted to develop less costlywarships, such as those suggested in Option IV.
35


CHAPTER IV. INDUSTRY AND NAVAL FORCE EXPANSION
Any discussion of a sustained increase in a major defenseprogram, like the naval force expansion, should include considera-tion of the industrial base necessary to support such a program.This chapter provides a summary description of the industrialconditions relating to warship construction in the United Statesand an assessment of the feasibility, from an industrial stand-point, of the options presented in Chapter III. !_/
CBO concludes that there is adequate shipbuilding capacityin the United States to support any of the four options consideredin this report. In fact, given the present severely depressedcommercial ship market and the bleak prospects for near-termimprovement, an expanded naval ship construction program might bethe best means of preventing a serious deterioration of theindustrial base supporting the Navy.
Modern warships, however, are not built by shipyards alone.The shipyards are supported by a host of other contractors whosupply everything from raw materials to complex electronic sys-tems. Indeed, in the case of the more complex modern warships,only about 40 percent of the total cost goes to shipyards, withthe balance spent to procure the combat system components (missilesystems, radars, sonars, and so forth) and for other equipmentand program support functions. Problems that could govern shipdelivery schedules could also arise in these supporting indus-tries. No such problems are now evident, however, largely becauseof excess capacity in the economy as a whole. Potential futureproblems in these supporting industries, while not the focus ofthis chapter, might be averted by a sustained commitment to higherproduction rates.
I/ This assessment draws heavily upon the results of a study of~~ the U.S. and Soviet shipbuilding industries prepared by the
Department of Defense at the request of the Senate ArmedServices Committee. See R.E. Kuenne, et al., The Shipbuild-ing Industries of the U.S. and U.S.S.R. as Bases for NationalMaritime Policies: Current Capabilities and Surge DemandPotential, IDA Report R-260 (Arlington, Virginia: Institutefor Defense Analyses, February 1981).
37

THE U.S. SHIPBUILDING INDUSTRY
The U.S. shipbuilding industry enjoys a long and proud tra-dition dating from early colonial days. It provided the merchanthulls, from clippers to containerships, that carried the water-borne commerce of a maritime nation through two centuries ofunparalleled economic growth. American shipyards also producedthe warships that protected this commerce and U.S. interestsaround the world. Now this industry is in trouble. It is widelyagreed that the shipbuilding industry (or more precisely that seg-ment producing ocean-going ships) is uneconomic and would almostdisappear if it were not for the protection and subsidies itreceives as a result of national maritime policy. This is pri-marily a result of fundamental economic realities, and is a plightshared by the shipbuilding industries in many other industriallymature nations.
The Shipbuilding Process
The shipbuilding process resists the industrial innovationsthat have been so successful in other industries. Ships cannot bemass-produced because of low unit demand. While automobiles of agiven type are produced by the hundreds of thousands and airplanesby the hundreds, it is unusual for production of a given shipdesign to extend beyond ten units. Ships, therefore, are atailor-made product, produced by skilled craftsmen without the aidof the labor-saving production-line techniques that higher volumeproduction might justify. This does not mean that the industryhas been devoid of technical improvements. Impressive advanceshave been made, including greatly improved welding methods,numerically controlled cutting and machining techniques, modularconstruction methods, semiautomatic assembly of piping and struc-tural members, and computer-based control methods, to name only afew. Nevertheless the nature of the product and the inherent lowunit volume make shipbuilding a labor-intensive process. This isdemonstrated by the low value of shipments per employee relativeto other industries shown in Table 14.
Current Status of U.S. Shipyards
Although there are over 400 firms engaged in some aspectof shipbuilding and repair in the United States, most of these arequite small and the private shipyards relevant to naval industrialplanning number only about 26. These can be further narrowed toonly nine that are currently capable of warship construction. Ofthe rest, the Navy considers six capable of building amphibious
38

TABLE 14. REAL VALUE OF SHIPMENTS PER EMPLOYEE, 1972-1976 (In1976 dollars)
Industry 1972 1973 1974 1975 1976
ShipbuildingAutomobilesAircraft
17,30294,52928,872
20,06099,23734,408
24,88698,60040,754
33,270126,00154,681
31,030173,33360,664
SOURCE: R.E. Kuenne, et al. , The Shipbuilding Industries ofthe U.S. and U.S.S.R. as Bases for National MaritimePolicies; Current Capabilities and Surge Demand Poten-tial, IDA Report R-260 (Arlington, Virginia: Institutefor Defense Analyses, February 1981), p. S-18.
and auxiliary ships and eleven others capable of building sea-going merchant ships. These are listed in Table 15.
In addition, the Navy itself maintains eight shipyards, fouron the east coast, three on the west coast, and one in Hawaii.These are very important to maintaining the fleet as they are allmajor industrial activities fully capable of dealing with thecomplexities of modern warships. Although the naval shipyardshave built ships throughout most of their long history, since thelate 1960s all new ships have been constructed in private ship-yards, with the naval shipyards devoting their efforts to overhauland repair.
Another important distinction among shipyards with regardto Navy support is the capability to work with nuclear reactors.Currently two private shipyards (General Dynamics, Groton, Connec-ticut, and Newport News Shipbuilding & Drydock Co., Newport News,Virginia) and six naval shipyards (Portsmouth, Norfolk, Charles-ton, Puget Sound, Mare Island, and Pearl Harbor) are qualified towork on nuclear-powered ships.
This shipbuilding base should be adequate to support anybut the most extraordinary industrial support needs of the Navy.The key industrial problem is to keep the U.S. shipbuildingindustry from collapsing owing to a lapse in demand for itsproduct. Compared to 1972 and 1973, when new contracts for 48 and
39

TABLE 15. MAJOR U.S. SHIPBUILDING YARDS, BY REGION, DECEMBER 1980
TotalPlant
Employees
Total Active Shipbuilding Base 119,109
Atlantic CoastBath Iron WorksGeneral Dynamics, QuincyGeneral Dynamics, GrotonBethlehem Steel, Sparrows Pt.Maryland Shipbuilding and DrydockNewport News Shipbuildingand Drydock
Norfolk Shipbuildingand Drydock
Gulf CoastTampa Ship Repair & DrydockAlabama Drydock & ShipbuildingLitton/Ingalls, PascagoulaAvondale ShipyardsHalter Marine ServicesEquitable ShipyardsLevingston Shipbuilding, OrangeTodd Shipyards, HoustonTodd Shipyards, Galveston
Pacific CoastNational Steel & ShipbuildingTodd Shipyards, San PedroBethlehem Steel, San FranciscoTacoma Boatbuilding CompanyTodd Shipyards, SeattleLockheed Shipbuilding, Seattle
Great LakesAmerican Ship Building, LorainPeterson Builders, Inc.Bay Shipbuilding, SturgeonMarinette Marine Corp.
66,5015,5843,74024,7382,7201,806
24,208
3,705
28,635700
1,24911,9267,7232,5071,1102,237489694
19,6817,5283,789580
2,0574,1671,560
4,2921,096974
1,358864
TotalProductionWorkers
98,000
55,6874,9692,29421,3651,5231,168
18,713
2,513
22,819406945
9,6386,1242,074800
1,812441579
15,8645,8373,228328
1,5333,6071,331
3,630896884
1,111739
BuildingCategory a/
IIIIIII
I
III
IllIIIIIIIIIIIIIIIIIII
III
IIIIIII
IllIIIIIIII
SOURCE: Department of the Navy, U.S. Maritime Administration, Insti-tute for Defense Analyses.
a/ I = Combat capable (plus amphibious/auxiliary and merchant);II = Amphibious/auxiliary capable (plus merchant); andIII = Merchant capable (only)*
40

43 merchant ships of 1,000 gross tons and over, respectively, wereplaced with U.S. shipbuilders, only seven vessels were ordered in1980 and six in 1981. As of December 31, 1981, the orders formerchant shipbuilding for all U.S. shipyards totaled only 33 shipswith a total displacement of 705,000 gross tons. As of the end of1981, the backlog of 98 Navy vessels and nine Coast Guard vessels,ordered (or to be ordered) by the U.S. government, are now theeconomic mainstay of the industry.
At the start of the decade of the 1970s, fewer than 40,000workers in private shipyards were engaged in naval ship con-struction. As a result of an expanding workload, this forcegrew to 80,000 by mid-1979. This expansion was attended bymany difficulties, including schedule slippages, cost overruns,and a resulting adversary relationship between some shipyardsand the Navy. At the end of 1981, the number of workers en-gaged in naval construction had fallen to about 58,000 and isexpected to fall still further to about 45,000 given currentlyfunded work. If given the task of building a larger Navy inthe future, the shipbuilding industry would have to expand againand the costs of recruitment and training and other turbulencecaused by expansion might be reflected in higher prices for shipconstruction.
THE OPTIONS—INDUSTRY IMPLICATIONS
The Institute for Defense Analyses (IDA) study cited earlierinvestigated the capacity of the industry to support a series of14-year shipbuilding programs resulting in fleet sizes rangingfrom 500 to 800 ships. Some conclusions of that study can besummarized as follows:
o 500-Ship Force. Easily supported by existing shipyards,less than half would be provided a viable workload.Attrition of many small and some large yards would belikely.
o 600-Ship Force. Also easily within the capacity of theexisting shipyards. Some shrinkage of the industry wouldbe likely.
o 700-Ship Force. Begins to tax the capacity of thepresent industrial base, as limited by labor and com-ponents supply factors under peacetime conditions. Somedelays would occur because of the limited number ofnuclear-qualified yards.
41
92-181 0 - 8 2 - 5

o 800-Ship Force. Would press the capacity of all exist-ing private and naval shipyards, particularly withregard to labor and components. Would probably needto expand the number of nuclear-qualified buildingyards.
The four options in this report were specifically anal-yzed using the computer model developed by IDA for its study.This model, called IDASAS for Institute for Defense AnalysesShip Allocation System, sequentially allocates the ships ofan inputted shipbuilding program to the various shipyards (asgoverned by the various constraints programmed into the model.)It then calculates, among other things, the number of ship-yards required to produce the ships and the total employmentlevels necessary to carry out the program. The IDASAS results,it should be emphasized, express the full effect of only selectedcritical factors affecting shipbuilding output, chiefly build-ing positions within the shipyards and labor supply. All IDASASresults, therefore, are really minimum estimates of the num-ber of yards that might be required under normal conditions.
The results of the IDASAS runs for Options I through IVare summarized in Table 16. IDASAS calculates that as fewas five to nine shipyards could support the new constructionrequirements of the four program options considered and thataverage man-year requirements would not exceed 59,000. A com-parison of these results with the resources available (as ofDecember 1980) suggests that adequate shipbuilding capacityis available for any of the four options.
The IDASAS model tries to maximize the utilization of ship-yard facilities so as to calculate the minimum number of shipyardsrequired. The number of required yards shown in Table 16,therefore, understates the number that could be supported aseconomically viable enterprises under the four options. Inreality more shipyards, perhaps twice as many, would probablybe used to support the building program in any of these options.This would allow for capacity to accommodate the unforeseendelays and interferences that are inevitable in real-life shipconstruction and would maintain a larger industrial base forsurge requirements.
The results of the IDASAS assessment indicate that, giventhe currently available facilities, the capacity of the indus-trial base is unlikely to be a constraint for any of the fouroptions considered. The key shipbuilding industry problem at the
42

TABLE 16. SUMMARY OF RESULTS OF IDASAS CALCULATION OF MINIMUMINDUSTRIAL REQUIREMENTS FOR FOUR OPTIONS
Option
IIIIIIIV
Number ofShips Built
176230146231
Number ofShipyardsRequired
9759
TotalMan-yearsRequired
(In thousands)
355530279380
Average AnnualMan-yearsRequired
(In thousands)
59532838
present time is acquiring adequate work to sustain itself. Ifsuch work does not materialize, then there may be a substantialcontraction of the shipbuilding industry in the next few years.If that should occur then sufficient industrial capacity tosupport a naval expansion program could become a problem in thefuture.
43


CHAPTER V. OVERALL COST IMPLICATIONS OF NAVAL FORCE EXPANSION
The costs outlined for the four options in Chapter IIIand explained in more detail in the appendixes are just thosefunded in the Shipbuilding and Conversion, Navy (SCN) authoriza-tion. A buildup of naval force will, of course, lead to addi-tional costs in other budget categories as well. These additionalcosts are interrelated and spread across a wide spectrum ofactivities. Calculating them is a complex and laborious process.CBO, however, has developed a computer model called the DefenseResources Model (DRM) that automates much of this process, makingpossible relatively rapid estimates of the overall budgetaryeffects of changes in procurement plans. For a more detaileddiscussion of the methods used to derive the overall budgetauthority estimates, see Appendix F. For each of the shipbuildingprogram options considered in this report, the DRM was used toestimate the overall budgetary implications for the Department ofthe Navy.
In addition, CBO is preparing two companion reports to thispaper that specifically examine two other important aspects ofthe proposed expansion of the Navy. One of these, The BudgetaryImplications of Modernizing and Expanding Carrier-Based Air Forces(forthcoming), examines procurement of aircraft for the additionalair wings needed to support a larger aircraft carrier force, andthe other, Manning the 600-Ship Navy; Requirements Versus Supply(forthcoming), examines the manpower requirements of the Navyunder the same four options considered here.
OTHER COST CATEGORIES
Many types of costs would be affected by a Navy buildup.Some major categories are discussed below. In estimating futurecosts, the Defense Resources Model used cost and other relation-ships based on the budget approved by the Congress for fiscal year1982. Cost factors were updated to fiscal year 1983 dollars byadding the amount of overall price growth that CBO expects tooccur. Cost increases from factors other than inflation arenot included in these estimates.
45

Aircraft Procurement, Navy (APN)
Growth in the number of aircraft carriers in the Navy wouldrequire procurement of aircraft to form additional air wings.Because of the high cost of today's high-performance naval air-craft, this would be a substantial budget item. The aircraftneeded to form a new air wing for a new $3.6 billion aircraftcarrier would probably cost about $5.6 billion. The $5.6 billionincludes the cost of aircraft assigned to carrier squadrons, plusthose for training squadrons, the repair pipeline, and advanceattrition aircraft for 15 years. The Navy not only plans toexpand the number of air wings; it is also modernizing existingwings. Costs of this modernization program are included in theestimates.
All estimates assume the Navy's plan for modernizationand expansion of its air forces. Thus costs assume that allcarriers, except the Coral Sea and Midway, would be equipped withthe F-14 as the fighter/interceptor aircraft; fighter/interceptorsprotect carriers from enemy bombers and escort attack aircraft.The F/A-18 and the A-6E are the aircraft designated for light andmedium attack roles, respectively. Attack aircraft are used todeliver ordnance against land and sea targets. The S-3A isincluded as the antisubmarine aircraft. I/ Other, more minor,aviation missions are to be carried out using aircraft typesplanned by the Navy.
The exact year when these many types of aircraft would beprocured does not necessarily reflect the Navy's detailed plans,but rather a reasonable profile coordinated with the time whenships would enter the fleet under the various options in thisreport. The annual rates of aircraft procurement are consistentwith those in recent Department of Defense procurement plansprovided to the Congress.
Weapons Procurement, Navy (WPN)
The weapons employed by the Navy's ships and aircraft areprocured in the WPN account. This includes the many differenttypes of sophisticated missiles and torpedoes that have become
I/ The S-3A aircraft is not currently being procured. Costs inthis report assume that the production line would be reopened.
46

the costly cutting edge of modern naval combat systems. It isanticipated that this account will grow in the future, because ofa continuation of the trend toward use of sophisticated weapons innaval combat systems and deployment of these weapons as part ofthe Navy's modernization program. Also, an increase in the numberof ships and aircraft, as currently proposed by the Navy, wouldrequire increased procurement of weapons to support the largerforce. Estimates in this report assume that total purchases ofmost Navy weapons—including the costly, sophisticated weapons—would expand in rough proportion to the increases in numbers ofships and aircraft.
Operation and Maintenance, Navy (OMN)
The OMN account contains funds to support the many activitiesnecessary to operate and maintain the fleet, including fuel, spareparts, pay for the Navy's civilian employees, and depot repair ofships and aircraft. Clearly, growth in this account can beexpected as the number of ships and aircraft in the Navy grows.
Estimates in this report assume that those funds that aredirectly related to the number of ships or aircraft in service,such as the fuel, spare parts, and maintenance for a particularweapon, are increased in proportion to the increased numbers ofships or aircraft in the fleet requiring these items. The rest ofthe operation and maintenance account, which cannot be directlyrelated to the number of ships and aircraft, remains at itspresent level.
The factors used to estimate operation and maintenancefunds are based on the 1982 budget, adjusted only for estimatedprice growth between 1982 and 1983. Thus any policy changesrelated to operation and maintenance funds, such as those proposedin the 1983 budget to improve readiness, are not reflected inthese estimates. Costs for civilian personnel, which are includedin the operation and maintenance account, reflect actual andplanned pay raises through October 1, 1982.
Military Personnel, Navy (MPN)
The MPN account contains funds to pay the Navy's uniformedpersonnel. An increase in the Navy's force levels would re-quire an increase in military personnel strength and, therefore,an increase in the military personnel budget. Estimates of
47

personnel costs reflect numbers of personnel needed to man shipsand aircraft, assuming manning levels consistent with the bud-get for fiscal year 1982. Sufficient personnel are added tothe shore establishment to ensure that the percentage of timepeople spend deployed on ships or aircraft remains at currentlevels. The costs of these added personnel, both those deployedand those ashore, are estimated based on pay raises throughOctober 1, 1982.
Military personnel costs for Options I, II, and IV couldbe understated because of potential recruiting and retentionproblems. Between 1982 and 1987, the projected supply of re-cruits volunteering for naval service seems adequate to main-tain the current quality of new recruits while also meetingnumerical requirements. This assumes that pay raises beyond1982 keep pace with those in the private sector. Beyond 1987,however, recruiting and retention might not be sufficient tomeet requirements. The Navy could eliminate recruiting problemsby lowering quality standards for entering recruits. Alterna-tively, the Navy could limit demand for male recruits, whoare in short supply, by increasing numbers of female recruits,who are generally not in short supply. Without these or otherchanges in personnel policies, additional money might be neededfor bonuses to keep up needed recruiting and retention levels. 3_/Since the need for these added sums would depend on detailedpersonnel policies, they were not included in the cost estimatesin this report.
The estimates for all the options understate long-run man-power costs because they exclude one major category of person-nel costs—funds for military retirement. Under current budgetprocedures, funds for military retirement appear in the budgetonly after persons complete their career, which usually takes atleast 20 years, and retire. Thus this naval buildup would notincrease retirement costs significantly for at least 20 years. Onthe other hand, the Administration has recommended paying formilitary retirement on an "accrual" basis. This would requirebudgeting now for future retirement costs. If this system were ineffect, costs for military personnel would increase by about 30percent over those in this report.
3/ See Congressional Budget Office, Manning the 600-Ship Navy;Requirements Versus Supply (forthcoming).
48

Other Costs
There are other types of costs that generally do not varyas distinctly with increases in numbers of ships and aircraft.Among these are costs for research and development, militaryconstruction, and family housing. These costs are included inthe estimates, generally increasing according to recent plansthrough 1987 but remaining constant thereafter. Budget authorityfor the Marine Corps, which is included in the budget of theDepartment of the Navy, is also shown. Marine Corps budgetauthority remains essentially constant at its current level,although a small portion does vary with the number of ships andaircraft in the fleet.
COSTS OF THE FUTURE NAVY—ESTIMATES FOR THE FOUR OPTIONS
Estimates for the Department of the Navy budget requiredfor each option, in fiscal year 1983 dollars, are shown inTables 17 through 20, at the end of this chapter. As is the casewith most projections, these numbers become increasingly specula-tive as one moves further into the future. Figure 2 plots thesebudget projections for the four options, together with recentactual levels of Navy budget authority.
The steepest increases in budget authority would be requiredfor Option I, with Options II, IV, and III having successivelylower budget requirements in that order. These projections (dataare faired in the later years to illustrate trends more clearly)show budget authority peaking at about $102 billion for Option Iand then settling back to a sustaining level of just over $90billion. Similarly Option II peaks at about $99 billion beforesettling to a sustaining level of about $90 billion per year. Thepeak occurs later for Option II than for Option I, because of theaccelerated procurement for the force buildup in Option I, butboth resolve to about the same sustaining level since both optionseventually arrive at the same force goal. Similarly, Option IVexperiences a peak at about $94 billion and then resolves to asustaining budget level of $87 billion.
Budget levels for Option III rise at a slower rate thanfor the other options and steady at a sustaining rate of about$76 billion. Option III, which resulted in a smaller fleetsize than the other options, would have the lowest budget author-ity requirement.
49

Figure 2.
Navy Budget Authority Since 1975 and Projected to 1995Under Four Program OptionsBillions of Fiscal Year 1983 Dollars110
60 -
50 —
1975 1980 1985 1990Fiscal Years
1995
50
The estimates in this report do not include the effectsof growth in weapons costs because of factors such as priceunderestimates or changes in the weapons systems. There couldalso be price growth in the operation and maintenance account, ifreadiness improvements were achieved, and in the personnelaccounts to reflect real pay growth in the economy. No money isset aside for such increases. While these factors could drive upfuture Navy budgets, the economy itself would, it is hoped, alsogrow over this lengthy period. Thus, these added costs might notincrease the burden on the economy imposed by Navy spending.
Finally, all these budget projections are stated in terms offiscal year 1983 dollars. The effects of general economic infla-tion are not included in the estimates presented. Actual futurebudgets, stated in terms of future-year dollars, would, of course,be higher than the numbers shown here, as would costs of mostother federal and private endeavors.
51

TABLE 17. OPTION I: ESTIMATED BUDGET AUTHORITY FOR DEPARTMENT OFTHE NAVY (By Fiscal Year, in Billions of Fiscal Year1983 Dollars)
SON a/
APN b/
WPN
MPN £/
O&MN
Other BA d/
Subtotal, Navy el
Subtotal, Marines f/
Total, Departmentof the Navy
1982
9.6
8.1
3.4
11.5
20.1
13.0
65.7
8.9
74.6
1983
19.8
7.8
3.7
11.6
20.3
13.1
76.3
8.7
85.0
1984
20.8
7.7
3.5
11.7
20.4
13.0
77.1
9.4
86.5
1985
22.0
8.3
3.5
11.8
20.6
14.1
80.3
9.2
89.5
1986
26.1
9.6
3.5
12.0
20.9
14.7
86.8
9.1
95.9
1987
32.5
9.8
3.8
12.2
21.7
13.2
93.2
9.0
102.2
(continued)
a/ Assumes new construction accounts for 80 percent of total SCNbudget requirement.
b/ APN for the AV-8B, as well as certain APN which varies withaircraft force levels, are included in Marine related budgetauthority.
cj MPN includes military pay raises through October 1, 1982.
52

TABLE 17. (Continued)
SCN a/
APN b/
WPN
MPN £/
O&MN
Other BA d/
Subtotal, Navy d/
Subtotal, Marines
Total, Departmentof the Navy
1988
29.8
10.0
5.3
12.6
21.7
13.6
93.0
8.8
101.8
1989
13.8
10.9
6.8
13.1
22.4
13.9
80.9
8.2
89.1
1990
13.8
11.7
7.3
13.5
23.0
14.0
83.3
7.8
91.1
1991
13.8
11.5
7.4
14.0
23.5
14.1
84.3
7.8
92.1
1992
13.8
11.2
7.4
14.4
23.9
14.2
84.9
7.8
92.7
d/ Includes all remaining fleet budget authority, such as Marine~~ Corps costs generated by Navy force activities, all research,
development, test, and evaluation (RDT&E), family housing, andmilitary construction.
ej Excludes Navy costs generated by Marine Corps activity, suchas aircraft personnel, as well as small elements of APN, WPN,and Other BA.
fl Includes all Marine budget authority except that generated byNavy forces.
53

TABLE 18. OPTION II: ESTIMATED BUDGET AUTHORITY FOR DEPARTMENT OF THENAVY (By Fiscal Year, in Billions of Fiscal Year 1983Dollars)
1982 1983 1984 1985 1986 1987 1988 1989
SCN a./ 9.6 17.1 20.5 22.4 23.1 23,4 21.8 23.1
APN b/ 8.1 7.8 7.7 8.3 9.6 9.8 10.0 10.1
WPN 3.4 3.7 3.5 3.7 3.4 3.7 5.2 6.6
MPN c/ 11.5 11.6 11.7 11.8 12.0 12.2 12.4 12.7
O&MN 20.1 20.3 20.4 20.6 20.9 21.3 21.6 22.1
Other BAd./ 13.0 13.1 12.9 14.0 13.3 13.2 13.5 13.8
Subtotal, Navy e/ 65.7 73.6 76.7 80.8 82.3 83.6 84.5 88.4
Subtotal, Marines fj 8.9 8.7 9.4 9.2 9.1 9.0 8.8 8.2
Total, Departmentof the Navy 74.6 82.3 86.1 90.0 91.4 92.6 93.3 96.6
(continued)
a/ Assumes new construction accounts for 80 percent of total SCN budgetrequirement.
]>/ APN for the AV-8B, as well as certain APN which varies with aircraftforce levels, are included in Marine related budget authority.
c/ MPN includes military pay raises through October 1, 1982.
54

TABLE 18. (Continued)
1990
SCN aj
APN b/
WPN
MPN £/
O&MN
Other BA d/
Subtotal, Navy e/
Subtotal, Marines f/
Total, DepartmentOf the Navy
22
11
7
13
22
13
90
7
98
.3
.6
.3
.0
.6
.9
.7
.8
.5
1991
22
11
7
13
23
13
91
7
99
.1
.5
.3
.4
.0
.9
.2
.8
.0
1992
21
11
7
13
23
14
90
7
98
.5
.2
.3
.7
.0
.0
.7
.8
.5
1993
13.8
10.4
7.4
13.8
23.1
14.1
82.6
8.0
90.6
1994
13
10
7
13
23
14
82
8
90
.8
.2
.4
.8
.1
.1
.4
.0
.4
1995
13.8
10.1
7.3
13.8
23.0
14.2
82.2
8.0
90.2
1996
13.8
10.1
7.3
13.8
23.0
14.1
82.1
8.0
90.1
d/ Includes all remaining fleet budget authority, such as Marine Corps~~ costs generated by Navy force activities, all research, develop-
ment, test, and evaluation (RDT&E), family housing, and militaryconstruction.
e/ Excludes Navy costs generated by Marine Corps activity, such as~~ aircraft personnel, as well as small elements of APN, WPN, and
Other BA.
f/ Includes all Marine budget authority except that generated byNavy forces.
55

TABLE 19. OPTION III: ESTIMATED BUDGET AUTHORITY FOR DEPARTMENT OFTHE NAVY (By Fiscal Year, in Billions of Fiscal Year 1983Dollars)
1982 1983 1984 1985 1986 1987 1988 1989
SCN a./
APN b/
WPN
MPN c/
O&M, Navy
Other BA d./
Subtotal, Navy e/
Subtotal, Marines f/
Total, Departmentof the Navy
9.6 11.6 13.5 12.5 12.5 12.9 13.9 11.0
8.1 7.8 7.7 8.3 9.2 9.0 9.0 9.3
3.4 3.7 3.5 3.2 2.9 3.1 5.1 5.7
11.5 11.6 11.7 11.8 12.0 12.0 11.9 12.0
20.1 20.3 23.0 20.6 20.9 21.1 21.2 21.6
13.0 13.1 13.0 14.0 13.3 13.1 13.4 13.5
65.7 68.1 72.4 70.4 70.8 71.2 74.5 73.1
8.9 8.7 9.4 9.2 9.1 9.0 8.8 8.2
74.6 76.8 81.8 79.6 79.9 80.2 83.3 81.3
(continued)
a/ Assumes new construction accounts for 80 percent of total SCN budgetrequirement.
b/ APN for the AV-8B, as well as certain APN which varies with aircraftforce levels, are included in Marine related budget authority.
c/ MPN includes military pay raises through October 1, 1982.
56

TABLE 19. (Continued)
1990
SCN a/
APN b/
WPN
MPN c/
O&MN
Other BA d/
Subtotal, Navy e/
Subtotal, Marines f/
Total, Departmentof the Navy
12
9
6
12
21
13
76
7
83
.6
.4
.7
.0
.8
.6
.1
.8
.9
1991
11
9
6
12
22
13
75
7
82
.3
.7
.7
.1
.0
.5
.1
.8
.9
1992
11
9
6
12
22
13
74
7
82
.3
.3
.7
.1
.0
.5
.9
.8
.7
1993
11
8
6
11
21
13
74
8
82
.5
.9
.7
.9
.6
.5
.1
.0
.1
1994
11.5
8.9
6.7
11.8
21.3
13.6
73.8
8.0
81.8
1995
11.5
8.9
6.7
11.7
21.0
13.5
73.3
8.0
81.3
1996
11.5
8.9
6.7
11.5
20.8
13.3
72.7
8.0
80.7
d/ Includes all remaining fleet budget authority, such as Marine Corps~~ costs generated by Navy force activities, all research, develop-
ment, test, and evaluation (RDT&E), family housing, and militaryconstruction.
e/ Excludes Navy costs generated by Marine Corps activity, such as~~ aircraft personnel, as well as small elements of APN, WPN, and
Other BA.
fj Includes all Marine budget authority except that generated byNavy forces.
57
92-181 0 - 8 2 - 6

TABLE 20. OPTION IV: ESTIMATED BUDGET AUTHORITY FOR DEPARTMENT OF THENAVY ((By Fiscal Year, in Billions of Fiscal Year 1983Dollars)
1982 1983 1984 1985 1986 1987 1988 1989
SCN a/ 9.6 12.0 13.1 14.0 13.5 15.0 14.9 16.0
APN V 8.1 7.8 7.7 8.3 9.6 9.8 10.0 11.6
WPN 3.4 3.7 3.5 3.5 3.3 3.6 5.2 6.7
MPN c/ 11.5 11.6 11.7 11.8 12.0 12.0 12.1 12.2
O&MN 20.1 20.3 20.4 20.6 20.9 21.2 21.3 21.6
Other BA d./ 13.0 13.1 13.0 14.0 13.3 13.1 13.4 13.5
Subtotal, Navy e/ 65.7 68.5 69.4 72.2 72.6 74.7 76.9 81.6
Subtotal, Marines f_/ 8.9 8.7 9.4 9.2 9.1 9.0 8.8 8.2
Total Department ofthe Navy BA 74.6 77.2 78.8 81.4 81.7 83.7 85.7 89.8
(continued)
a/ Assumes new construction accounts for 80 percent of total SCN budgetrequirement.
Jb/ APN for the AV-8B, as well as certain APN which varies with aircraftforce levels, are included in Marine related budget authority.
cj MPN includes military pay raises through October 1, 1982.
58

TABLE 20. (Continued)
1990
SCN a/
APN b_/
WPN
MPN £/
O&MN
Other BA d/
Subtotal, Navy e/
Subtotal, Marines f/
Total Department ofthe Navy BA
18
13
7
12
22
13
86
7
94
.5
.2
.2
.4
.0
.6
.9
.8
.7
1991
16
13
7
12
22
13
85
7
93
.9
.1
.2
.3
.3
.6
.4
.8
.2
1992
17
12
7
12
22
13
86
7
94
.3
.7
.3
.9
.4
.6
.2
.8
.0
1993
11.9
12.1
7.3
13.4
22.3
13.8
80.8
8.0
88.8
1994
11
11
7
13
22
13
80
8
88
.9
.6
.3
.4
.2
.8
.2
.0
.2
1995
11.9
10.1
7.3
13.6
22.2
14.0
79.1
8.0
87.1
1996
11.9
10.2
7.2
13.7
22.4
13.9
79.3
8.0
87.3
d/ Includes all remaining fleet budget authority, such as Marine Corps~~ costs generated by Navy force activities, all research, develop-
ment, test, and evaluation (RDT&E), family housing, and militaryconstruction.
e/ Excludes Navy costs generated by Marine Corps activity, such as~~ aircraft personnel, as well as small elements of APN, WPN, and
Other BA.
f/ Includes all Marine budget authority except that generated byNavy forces.
59


CHAPTER VI. CURRENT ISSUES FOR THE CONGRESS
The preceding chapters have outlined the goals of the Navy'sproposed expansion program, its rationale, and its projectedcosts. Some alternative programs have been similarly outlined.
The Congress must now make decisions that will, eitherexplicitly or by default, help to define the future Navy. Under-lying these decisions should be a judgment about the wisdomof the Navy's offensive strategy, correlated with a judgmentabout what budget levels are feasible to support naval moderniza-tion or expansion.
BASIC DIRECTIONS
If the Congress agrees with the Navy's strategy and withthe shipbuilding program derived from it, and if the Congressbelieves that the Navy's plans should be realized as soon aspossible, then a program similar to Option I might be pursued. Asshown in the preceding chapter, this would require substantial andimmediate increases in the Navy's budget.
If the Congress agrees with the Navy's strategy and itsresulting force expansion program, but believes that the forceexpansion can be achieved at a more measured pace, then a programsuch as that outlined in Option II might be appropriate. Thiswould also require substantial increases in the Navy budget butthe costs would be spread over a longer time than in Option I.
If the Congress agrees with the Navy's strategy and concurswith buying the types of ships derived from it, but does notprovide the substantially increased funding required to supportthe Navy program, then the result might be the fleet of OptionIII. Option III also would require growth in the Navy's budgetbut at a much more modest rate than either Options I or II.
A judgment by the Congress that the Navy program is notadvisable, either because Congress disagrees with the strategyupon which it is predicated or because the budgets implied aredeemed to be infeasible, would mean that some alternative programmust be developed. Option IV is one such program. It is a
61

relatively modest departure from the Navy program, intended toupgrade the Navy's capabilites for open-ocean, distributed-forceoperations as opposed to emphasizing concentrated carrier battlegroup operations.
Still more radical departures from the Navy's proposedprogram might be pursued. For example, a program emphasizingsubmarines at the expense of aircraft carriers and surfacecombatants is an option that some might find promising. Suchan option might also emphasize high technology, including satel-lite surveillance and long-range precision guided munitionsfor tactical strikes. Other alternatives might emphasize land-based aircraft in lieu of sea-based tactical air power. All ofthese are possible and, perhaps, advisable, but they are notcurrently recommended by the Navy. The alternatives avail-able to the Congress within the context of the Navy shipbuild-ing program would involve either sharply increased budgetsor lower budgets that, given the high costs of the Navy's ships,would maintain the Navy at force levels now deemed inadequateby the Administration's naval planners.
THE FIVE-YEAR SHIPBUILDING PROGRAM
The five-year shipbuilding program proposed by the Admin-istration in the fiscal year 1983 budget is shown in Table 21.It proposes authorization of 133 new ships and 16 conversions,service life extensions (SLEPs), and reactivations in fiscalyears 1983 through 1987. The proposed budget for fiscal year1983 contains authorizations for 18 new construction ships and 7conversions/SLEPs/reactivations with a budget authority require-ment of over $18.6 billion, about twice the budget authorityrequested in 1982. Although the Administration's program isclearly tending in the direction of Options I and II, it concen-trates a majority of the new construction ships in the last twoyears and would, therefore, result in a force buildup more akin toOption II than Option I.
The Administration's five-year program is estimated to costan average of about $19.3 billion annually over the five-yearperiod, somewhat less than the $21.3 billion estimated for OptionII. One reason for this lower cost is that the Administration'sprogram contains relatively few of the expensive surface com-batants that would be needed to reach the Navy's objectives fornew-generation cruisers and destroyers.
62

TABLE 21. ADMINISTRATION'S PROPOSED SHIPBUILDING PROGRAM FOR FISCAL YEARS 1983-1987
Type of Ship
Trident (BallisticMissile Submarine)
SSN-688 (Attack Submarine)CVN (Aircraft Carrier-Nuclear)CV (Aircraft Carrier) SLEP b/CG-47 (Guided Missile Cruiser)CG-42 (Nuclear Guided MissileCruiser)
DDG-51 (Guided MissileDestroyer)
DD (Destroyer)BB (Battleship) ReactivationFFG-7 (Guided Missile Frigate)MCM (Mine Counte measure Ship)MSH (Mine Countermeasure Ship)LSD-41 (Landing Ship Dock)LHD-1 (Amphibious Ship)AOE (Multipurpose Stores
Ship)AE (Ammunition Ship)ARS (Salvage Ship)AD (Destroyer Tender)T-AO (Oiler)T-AGS (Ballistic Missile Submarine
Support Ship) ConversionT-AK (Cargo Ship) ConversionT-ARC (Cable Ship)T-AGM (Range InstrumentationShip) Conversion
T-AGOS/AGOS (Surveillance TowedArray Sensor System)
T-AKRX (SL-7) Conversion c/T-AFS (Stores Ship) ConversionT-AH (Hospital Ship) Conversion
New Construction ShipsConversions/SLEPs/Reactivations
1982 a./
—2
——3
—
——131
—1
—
——2
—1
———
—4
42—
17
7
1983
22213
—
——124
—1
—
——1
—1
———
——
4—1
18
7
1984
13
——3
—
——124111
——1
—3
———
—1
——1
21
2
1985
14
—13
—
1
—125—2—
11
——4
21—
——
——1
24
2
1986
14
——4
—
—2
—3
—52—
12
—14
—
—1
12
—
——
32
1
1987
14
—14
1
31
—3
—521
21—16
———
—3
———
38
1
1983-1987Total
6172317
1
43312131182
442218
211
16
4
—2
133
16
SOURCE: Department of Defense
NOTE: All ships, conversions, and service life extensions are proposed to be authorizedin the year listed. They will not enter the fleet until later years.
a./ Included to provide comparison with the Administration's program.
W SLEP = Service Life Extension Program.
c/ Acquisition of eight T-AKRXs will be completed in fiscal year 1982.

Aircraft Carriers
The most striking feature of the proposed fiscal year 1983Navy budget is the recommendation for two large-deck, nuclear-powered aircraft carriers (CVNs) of the Nimitz class. The Admin-istration believes that this procurement strategy would permitsimultaneous purchase of heavy equipment for the ships and serialfabrication of major subassemblies. This, they believe, wouldstrengthen the vendor/contractor base and accelerate the deliveryof each ship by as much as 21 months•
Authorization of the two aircraft carriers would be a keystep in realizing the program goals of the Navy and would beseen as a strong endorsement of that program. Although theobligational authority for these ships would be nearly $7 billion,outlays in the first year would probably total less than 5 percentof that amount. Authorization, however, would commit the publicto a large and continuing stream of outlays not only for con-tinuing carrier construction in the years beyond 1983 but alsofor procuring aircraft for the carriers and for support of theships and aircraft over their life cycles. These expenditureswould probably total at least $19 billion over 30 years for eachcarrier. The carrier decision, therefore, carries a substantialcommitment forward to future budgets.
As an alternative to expanding the large-deck carrier force,the Congress could direct the Navy to build smaller carriers.The Navy has argued that the 60,000-ton carriers considered in thelate 1970s are not sufficiently less expensive than the 90,000-ton Nimitz-class carriers to be cost effective. Another alterna-tive would be to develop a design for a much smaller aviationsupport ship such as a 12-15,000-ton aviation cruiser (CVG)—asproposed for Option IV in this report. The CVG would not operatein the same way as a 60,000-ton or 90,000-ton aircraft carrier—that is, to launch high-performance combat aircraft—but wouldprovide long-range surveillance, targeting, and ASW capabilitiesto a dispersed group of U.S. and allied surface warships andsubmarines, enabling them to use their long-range weapons moreeffectively. Thus, the CVG would serve as a catalyst, enablingthe Navy to distribute its strike capabilities more effectivelyamong many ships rather than having them concentrated in a fewvery powerful warships.
To be effective, however, the CVG would require an efficientV/STOL aircraft, suitably equipped with sensors appropriate fordetecting and identifying enemy units and communications for
64

relaying this information to U.S. and allied forces in the area.The key initiative for implementing a distributed force concept,such as that suggested here, might well be development of thisV/STOL aircraft.
If the Congress elected not to authorize more large-deckcarriers or to initiate an alternative approach, such as the CVG,then some of the current tempo-of-operations pressure on existingcarriers might be relieved by forming additional battle groupsaround the newly reactivated battleships and using these for someof the deployment commitments now covered by aircraft carriers.This is discussed further below.
Battleship Reactivations
Last year the Congress authorized reactivation of the battle-ship New Jersey and appropriated $325 million for that purpose.In its five-year program, the Administration proposes to reacti-vate the three remaining Iowa-class battleships, with Iowascheduled in the fiscal year 1983 budget at a cost of $445 mil-lion. These ships would be fitted with Tomahawk and Harpooncruise missiles to augment their 16-inch guns and, the Administra-tion argues, would be a formidable addition to the Navy's activeforces. This addition could be made available relatively quicklyand at a relatively lower cost than new ships.
Battleships could operate in a variety of roles in peacetimeand wartime operations. The formidable-looking battleships couldbe useful in relieving the current at-sea operating pressure onaircraft carriers for peacetime-presence and crisis-responseoperations. As was discussed in Chapter II, in wartime battle-ships could operate as the centerpiece of surface action groups instrikes against coastal targets and in supporting amphibiousoperations.
Work required for reactivation of the three remainingbattleships will be somewhat more extensive than for New Jersey.New Jersey was previously reactivated in the 1960s for service inthe Vietnam war. The three other ships have been out of servicesince the 1950s and will require more work. Although reactivationcosts are comparable to that of a new-construction frigate ordestroyer, operating costs for the battleships, with their crew ofmore than 1,500 and World War II vintage machinery systems, may berather high—but would certainly be much less than for aircraftcarriers.
65

Trident Submarines
The Administration has proposed authorization of two Tri-dent submarines in the fiscal year 1983 budget, for a total costof about $2.8 billion. Trident submarines are normally procuredat a rate of one per year. Last year, however, the Congress,citing continued delays in Trident submarine deliveries, didnot authorize a Trident in the fiscal year 1982 budget. Noforce level goal has been established for Trident submarines,but authorization of two ships in 1983 would return the pro-gram to the schedule recommended by the Administration.
Trident submarines, fitted with 24 missile launchers,are intended eventually to replace the 31 "Poseidon" ballis-tic missile submarines (which have 16 missile launchers each)that are currently in the fleet. _!/ The Poseidon submarineswere all commissioned during the 1960s and will reach their20th year of service during the 1980s. These ships have beencarefully maintained by the Navy, however, and could operatefor many more years. Furthermore, after a relatively modestmodification that can be accomplished outside a shipyard, thePoseidon submarines could be capable of launching the same TridentI missile now used by the new SSBNs. The new Trident II missile,when deployed, probably in the late 1980s, will be compatibleonly with the larger missile launchers fitted on the Tridentsubmarines.
Surface Combatants
The Administration's five-year shipbuilding program con-tains 37 other surface combatants of various types in addi-tion to the battleships. For fiscal year 1983, these includesthree CG-47-class cruisers and two FFG-7-class frigates. Ofthe 37 ships, 25 are "battle group" surface combatants—cruisersand destroyers—and the remainder are FFG-7-class guided missilefrigates, intended as escorts for convoys and groups of shipsother than carrier battle groups.
_!/ The term "Poseidon" submarine is often used to denote collec-~~ tively the ships of the SSBN 616-, SSBN 627-, and SSBN 640-
class submarines that were converted to launch the Poseidonrather than the Polaris missile.
66

Considerably more than 25 cruisers and destroyers wouldbe needed to meet the Navy's force level goals, given the largenumber of ships of these types approaching 30 years of servicein the late 1980s and 1990s. In Chapter III, it was estimatedthat delivery of 61 new cruisers and destroyers would be requiredto meet the Navy's force goals by 1992, and 84 by 1996. The 25ships currently programmed are clearly only a fraction of thatrequirement.
Of the 25 cruisers and destroyers in the Administration'sprogram, 22 will be equipped with AEGIS or AEGIS-derivativeAAW systems. These will be expensive ships. The CG-47-classships cost over $1 billion per ship and the CGN-42 class, proposedfor construction starting in fiscal year 1987, will probably costat least 50 percent more. CBO estimates that the DDG-51-classdestroyer, scheduled for construction starting in fiscal year1985, will have a follow-ship price of about $800 million (infiscal year 1983 dollars.)
As was shown in the discussion of the options in ChapterIII, procurement of surface combatants is not only an important,but the dominant, factor in proposed future Navy shipbuildingbudgets. If Option II is used as a model, for example, 59 addi-tional cruisers and destroyers, beyond those in the Administra-tion's current five-year program, would have to be authorized infiscal years 1988 through 1992 in order to meet the Navy's forcelevel goals for surface combatants by 1996 (assuming four yearsfrom authorization to delivery). Given the prices of the shiptypes now proposed, the procurement cost of these 59 ships wouldexceed $60 billion in fiscal year 1983 dollars.
Clearly, development of a lower-cost surface combatantwith adequate combat capability could have substantial long-term benefits. A ship such as DDGY, proposed in Option IVand discussed in more detail in Appendix E, is suggested as asurface combatant that would be both affordable and effective infuture naval combat. The dominance of surface combatants infuture shipbuilding budget projections marks the development ofsuch a warship as a key initiative in planning future navalforces.
The Administration proposes to continue production of FFG-7-class guided missile frigates, although those previously author-ized will build the frigate force level above the Navy's objec-tive. The Administration says it plans to continue procurement ofthis "useful and relatively inexpensive ship" to meet escort needs
67

other than those for carrier battle groups. It also plansto assign earlier ships of this class to the Naval Reserveforce.
Attack Submarines
The Administration's five-year program proposes constructionof 17 SSN-688-class attack submarines, including two in thefiscal year 1983 budget. This is about the construction raterequired to sustain a force of 100 submarines—the Navy's currentforce goal—in the long term, assuming an operating life of30 years. Given the age profile of the current force, however,procuring that many submarines over the next five years wouldincrease the force above the 100-ship goal, assuming a 30-yearlife, or conversly, allow retirement of older nuclear submarinesbefore 30 years.
A key issue in this area—in addition to that of how manysubmarines should be procured—is what kind of attack submarinesshould be built. The Administration proposes to continue produc-tion of the SSN-688-class submarine (first authorized in fiscalyear 1970) through fiscal year 1987 and for the foreseeablefuture. Efforts to design an alternative class of nuclear-poweredsubmarines, undertaken during the previous Administration, havebeen dropped.
There has also been recent interest in the Congress andamong some defense analysts in the possibility of resuming produc-tion of non-nuclear submarines. This interest has been stimulatedfurther by a recent proposal by the German firm of Howaldswerke-Deutsche Werft (mentioned in Chapter III) to design and build a2,600-ton diesel-electric submarine, fully equipped with a U.S.-built combat suite, for a lead-ship price of about $200 million.If diesel-electric submarines could be acquired at about thatprice, then they could be procured at a ratio of about three shipsto one (on a discounted life-cycle cost basis), compared with theSSN-688. It has been suggested that a mixed force of nuclear anddiesel-electric submarines could provide a larger, and, therefore,potentially more effective force for a given level of investmentthan an all nuclear submarine force. The Navy concedes thatmodern diesel-electric submarines could be very effective in someimportant missions, such as barrier patrols, but argues that thesemissions should allocated to allied submarines, while the UnitedStates continues to build only high-performance, nuclear-poweredattack submarines.
68

Mine Warfare Ships
Two new types of mine warfare ships are proposed in theAdministration's five-year program. These ships would replacethe 25 aging ocean minesweepers (MSOs) now in the fleet, allbut three of which are assigned to the Naval Reserve force.
The Administration proposes authorization of 13 mine coun-termeasure ships (MCMs) during the five-year period as fellow-ships to the lead MCM that was authorized in fiscal year 1982.In addition, the five-year program includes 11 ships of a newclass of smaller mine hunters, designated MSH. Of these twotypes, the MCM is the larger and more capable. The MSH wouldaugment the MCM ships during initial mine clearance and har-bor breakout operations. These ships would have improved sys-tems for minesweeping (causing mines to explode harmlessly), minehunting (locating mines in the water or on the ocean floor) andmine neutralization (rendering the mine harmless after it has beenlocated). Mine hunting and mine neutralization are importantfunctions in dealing with sophisticated modern mines. The MCM isintended to provide a capability to counter Soviet deep-watermines.
As was discussed in Chapter II, mines are a potent navalweapon. These ships should improve U.S. capabilities in anarea in which the United States now may be quite vulnerable.
Amphibious Ships
The Administration's five-year plan proposes procurementof 10 amphibious ships during the 1983-1987 period. This in-cludes eight ships of the LSD-4l-class and two ships of a newtype designated LHD. Although this program represents a muchmore active procurement of amphibious ships than has been thepractice in recent years, these 10 ships would not be sufficientto realize the Navy's announced goal of increasing amphibious liftcapability from 1 to 1.5 Marine Amphibious Force (MAF). _2/Therefore, further construction of amphibious ships in the yearsbeyond fiscal year 1987 will be required if the 1.5 MAF goal is to
2J In the 11-year period starting in fiscal year 1972, only twoamphibious ships, LSD-41 and 42, were authorized.
69

be achieved. 3/ Indeed, the proposed program is actually nomore than a start in the direction of building up amphibiouslift capability. The eight LSDs would be sufficient only toreplace eight existing ships of the LSD-28 class that will beretired between 1984 and 1987, assuming retirement after 30yearg.
The LHD, or general purpose amphibious assault ship, is anew initiative in amphibious ship design intended by the Adminis-tration to provide a net increase in amphibious lift capability.It will be based on the design of the Amphibious Assault Ship(LHA) and would replace the seven Helicopter Landing Ships (LPHs)scheduled for retirement in the mid-1990s. It will be a largeship, of about 40,000-tons displacement, and will be specificallydesigned to support high-speed landing craft air cushion (LCAC)vehicles and V/STOL aircraft. The Administration is also examin-ing potential uses of the LHDs as V/STOL support platforms fordiversifying and broadening the offensive aviation capabilities ofthe fleet. The LHD will be expensive, however, with the lead-shipprocurement cost estimated at over $1 billion.
The Administration is also planning a third type of newamphibious ship, in the landing platform dock (LPD). This shiptype is similar in size to the LSD-41 class and would carry amixed load of troops, vehicles, cargo, LCACs, and helicopters.These ships, now designated LPDX, would replace LPDs now in thefleet. The Administration's current planning envisions authoriza-tion of the lead ship in fiscal year 1988.
Amphibious ships are different from the ships that havebeen procured in recent years to support mobility enhancement,particularly for support of the Rapid Deployment Force (RDF). Themobility-enhancement ships developed for the RDF are conver-sions or adaptations of merchant ship designs and require somedeveloped port facilities for off-loading. They are appropriatefor unopposed landings or for support of forces after a successfullanding. Amphibious ships, on the other hand, are designed tosupport opposed landings and to discharge troops and equipmentwithout the use of port facilities.
_3/ Ongoing reappraisals by the Navy and Marine Corps of the liftcapacity required for amphibious forces may result in stilllarger capacity requirements for achieving the 1.5 MAF liftgoal.
70

Replenishment Ships
The Administration's five-year shipbuilding program containsa total of 26 replenishment ships, only one of which is includedin the fiscal year 1983 budget. Replenishment ships, whichprovide fuel, ammunition, and stores to naval ships at sea, areessential to the Navy's ability to conduct sustained operations atsea. Growth in naval combat forces should be accompanied by acomparable growth in underway replenishment ships.
The Administration program includes four fast combat supportships (AOEs), four ammunition ships (AEs) and 18 fleet oilers(AOs). In addition, two combat stores ships (AFS) were recentlypurchased from the Royal Navy. The 26 ships in the Administra-tion's proposal come close to the 29-ship program for replenish-ment ships contained in Option I. This program, if sustained infuture budget requests and authorized by the Congress, wouldrepresent significant progress in improving the Navy's replenish-ment capabilities.
Support Ships
The Administration's five-year shipbuilding program alsocontains recommendations for procuring various types of supportships. These recommendations include no submarine tenders (ASs),however, and only two destroyer tenders (ADs) programmed in thelast two years of the plan. The present material support shipforce contains 26 ships— 13 ASs, 9 ADs, and 4 repair ships (ARs).Assuming retirement of these ships at 40 years, this force wouldshrink to 15 ships—6 ADs and 9ASs—by 1986, the year in which thefirst new tender is programmed for authorization. The currentlyproposed program, therefore, would result in a substantial reduc-tion in the number of tenders while the fleet they serve isgrowing, unless many of the current tenders were retained intotheir fifth decade of service.
SUMMARY ASSESSMENT OF THE FIVE-YEAR SHIPBUILDING PLAN
The Administration's five-year shipbuilding plan, containing133 new construction ships and estimated to cost over $80 billionin fiscal year 1983 dollars, is more ambitious than previousprograms submitted to the Congress in the past few years. It doesnot, however, contain enough ships to realize the Navy's announcedforce level goals for an expanded Navy. In addition, this plan—as has been the case with so many previous plans—has most of its
71

ships programmed in the later out-years. Over half of the 133new construction ships are programmed for the last two years ofthe five-year plan. Achievement of the Navy's expanded forcelevel goals would require adhering to the out-year building plansand continued high levels of construction in the years beyondfiscal year 1987.
72

APPENDIXES


APPENDIX A. OPTION I: NAVY FORCE OBJECTIVES—SHIPS IN FLEET BY1992 AND AUTHORIZED BY 1988
This appendix contains tables presenting, in detail, anillustrative shipbuilding program for Option I (see Table A-l) anda year-by-year breakdown of the force structure that would resultfrom that building program (see Table A-2) taking into account thestructure of the current fleet and assumed retirements through1992. In this option, the objective is to achieve the Navy'sforce level goals by the end of 1992. In developing the forcestructure projections, assumptions about years of service untilship retirement (from commissioning date) and building time (fromauthorization to delivery) are as follows:
Retirement Assumptions Building Time Assumptions
50 Years Aircraft Carriers (CVN)—8 yearsAircraft Carriers (CV/CVN) Ballistic Missile Submarine
(SSBN)--6 Years40 Years Nuclear Powered Guided MissileDestroyer Tenders (AD) Cruiser (CGN)—5 yearsSubmarine Tenders (AS) Nuclear Powered AttackRepair Ships (AR) Submarine (SSN)—5 yearsFleet Oilers (AO/TAO) All others—4 yearsSalvage Ship (ARS)Submarine Rescue Ship (ASR)Fleet Tug (ATF/TATF)
30 YearsAll others
Under these assumptions, ships actually in the fleet by 1992must be authorized no later than 1988.
Certain types of reserve and support ships, which arenot included in the Navy's current ship counting methodology,are not included in these listings.
75

TABLE A-l. ILLUSTRATIVE SHIPBUILDING PROGRAM FOR OPTION I: NAVY FORCE OBJEC-TIVES—SHIPS IN FLEET BY 1992 AND AUTHORIZED BY 1988 (By fiscalyear, costs in billions of fiscal year 1983 dollars)
1983 1984Ship Type Ships Cost Ships Cost
Strategic
SSBN (Trident) 1 1.4 1 1.4
General Purpose
CombatantsAircraft carrier (CVN) 1 3.5Battleship (BB) 1 0.45 1 0.45Cruiser (CGN) 1 2.15Cruiser (CG) 3 3.4 4 4.55Destroyer (DDG) 1 1.25Destroyer (DD)Submarine (SSN) 2 1.4 1 0.7
Amphibious ShipsAmphib. assault
ship (LHD)Amphib. transportdock (LPD)
Landing ship dock (LSD) 4 1.6 5 2.0
Mine Warfare ShipsMine countermeasure
ship (MCM) 6 0.6 6 0.65Mine warfare ship (MSH) 1 0.1
Replenishment ShipsFast combat support
ship (AOE)Oiler (AO/TAO) 4 1.2 4 1.2Ammo, ship (AE/TAE) 1 0.45 2 0.80
Material Support ShipsDestroyer tender (AD) 2 0.9 2 0.9Submarine tender (AS) 1 0.45 1 0.45
Fleet Support ShipsSurveillance ship(TAGOS)
Salvage ship (ARS) 1 0.10 1 0.1
Total, All Ships 27 15.45 31 16.70
1985Ships Cost
1 1.4
1 3.51 0.45
3 3.4
6 3.01 0.7
4 1.6
5 0.53 0.2
4 1.21 0.40
1 0.451 0.45
1 0.1
33 17.35
1986Ships
1
344
2
1
3
121
21
2
27
Cost
1.4
5.254.553.2
1.4
1.3
0.2
0.70.60.40
0.90.45
0.2
20.55
(continued)
76

TABLE A-l. (Continued)
1987Ship Type Ships Cost
Strategic
SSBN (Trident) 1 1.4
General Purpose
CombatantsAircraft carrier (CVN) 1 3.5Battleship (BB)Cruiser (CGN) 3 5.25Cruiser (CG) 3 3.4Destroyer (DDG) 10 8.0Destroyer (DD)Submarine (SSN) 2 1.4
Amphibious ShipsAmphib. assault
ship (LHD)Aiaphib. transport
dock (LPD) 1 0.7Landing ship dock (LSD)
Mine Warfare ShipsMine countermeasure
ship (MCM)Mine warfare ship (MSH) 3 0.2
Replenishment ShipsFast combat supportship 1 0.5
Oiler (AO/TAO) 3 0.9Ammo, ship (AE/TAE)
Material Support ShipsDestroyer tender (AD) 1 0.45Submarine tender (AS)
Fleet Support ShipsSurveillance ship(TAGOS)
Salvage ship (ARS)
1988 TotalShips Cost Type
1 1.4 6
33
3 5.25 103 3.4 2010 8.0 25
61 0.7 9
2 2.0 3113
173 0.2 13
2 1.0 417
3 1.20 8
1 0.45 94
23
Total Percent ofType Total CostCost All Ships
8.4 7
10.5 91.3517.9 5522.720.453.06.3 5
3.30.7 85.2
1.75 2
0.9
2.25.1 93.25
4.05 51.8
0.2 a
0.3
Total, All Ships 29 25.70 29 23.60 176 119.35
77
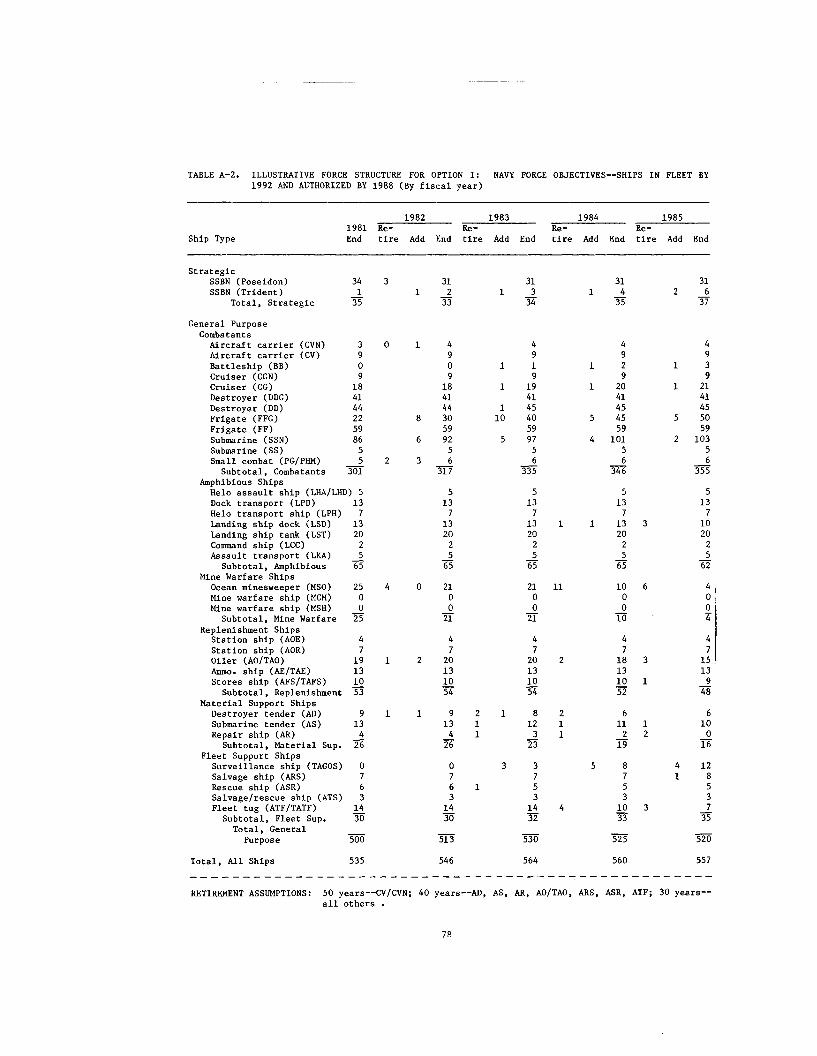
TABLE A-2. ILLUSTRATIVE FORCE STRUCTURE FOR OPTION I: NAVY FORCE OBJECTIVES—SHIPS IN FLEET BY1992 AND AUTHORIZED BY 1988 (By fiscal year)
1981Ship Type End
StrategicSSBN (Poseidon) 34SSBN (Trident) J
Total, Strategic 35
General PurposeCombatantsAircraft carrier (CVN) 3Aircraft carrier (CV) 9Battleship (BB) 0Cruiser (CGN) 9Cruiser (CG) 18Destroyer (DDG) 41Destroyer (DD) 44Frigate (FFG) 22Frigate (FF) 59Submarine (SSN) 86Submarine (SS) 5Small combat (PG/PHM) 5Subtotal, Combatants 301
Amphibious ShipsHelo assault ship (LHA/LHD) 5Dock transport (LPD) 13Helo transport ship (LPH) 7Landing ship dock (LSD) 13Landing ship tank (LST) 20Command ship (LCC) 2Assault transport (LKA) 5
Subtotal, Amphibious 65Mine Warfare Ships
Ocean minesweeper (MSO) 25Mine warfare ship (MCM) 0Mine warfare ship (MSH) 0
Subtotal, Mine Warfare 25Replenishment Ships
Station ship (AOE) 4Station ship (AOR) 7Oiler (AO/TAO) 19Ammo, ship (AE/TAE) 13Stores ship (AFS/TAFS) _10Subtotal, Replenishment 53
Material Support ShipsDestroyer tender (AD) 9Submarine tender (AS) 13Repair ship (AR) _4
Subtotal, Material Sup. 26Fleet Support ShipsSurveillance ship (TAGOS) 0Salvage ship (ARS) 7Rescue ship (ASR) 6Salvage/rescue ship (ATS) 3Fleet tug (ATF/TATF) 14Subtotal, Fleet Sup. 30Total, GeneralPurpose 500
Total, All Ships 535
1982 1983Re- Re-tire Add End tire Add
3 311 2 1
33
0 1 490 1918 14144 1
8 30 1059
6 92 55
2 3 6317
513713202565
4 0 210021
47
1 2 20131054
1 1 9 2 113 14 126
0 376 131430
3IT
546
End
31334
491919414540599756
335
5137
13202565
210021
4720131054
812323
37531432
530
564
1984 1985Re- Re-tire Add End tire Add
311 4 2
35
49
1 2 19
1 20 14145
5 45 559
4 101 256
346
5137
1 1 13 3202565
11 10 600
To
47
2 18 31310 152
2 61 11 11 2 2
19
5 8 47 153
4 10 333
52T
560
End
31637
4939214145505910356
355
513710202562
4004
471513948
610016
12853735
120
557
RETIREMENT ASSUMPTIONS: 50 years—CV/CVN; 40 years—AD, AS, AR, AO/TAO, ARS, ASR, ATF; 30 years-all others .
78

TABLE A-2. (Continued)
Ship Type
StrategicSSBN (Poseidon)SSBN (Trident)
Total, Strategic
General PurposeCombatantsAircraft carrier (CVN)Aircraft carrier (CV)Battleship (BB)Cruiser (CGN)Cruiser (CG)Destroyer (DDG)Destroyer (DD)Frigate (FFG)Frigate (FF)Submarine (SSN)Submarine (SS)Small combat (PG/PHM)Subtotal, Combatants
Amphibious ShipsHelo assault ship (LHA/LHD)Dock transport (LPD)Helo transport ship (LPH)Landing ship dock (LSD)Landing ship tank (LST)Command ship (LCC)Assault transport (LKA)
Subtotal, AmphibiousMine Warfare Ships
Ocean minesweeper (MSO)Mine warfare ship (MCM)Mine warfare ship (MSH)
Subtotal, Mine WarfareReplenishment Ships
Station ship (AOE)Station ship (AOR)Oiler (AO/TAO)Ammo, ship (AE/TAE)Stores ship (AFS/TAFS)Subtotal, Replenishment
Material Support ShipsDestroyer tender (AD)Submarine tender (AS)Repair ship (AR)
Subtotal, Material Sup.Fleet Support ShipsSurveillance ship (TAGOS)Salvage ship (ARS)Rescue ship (ASR)Salvage/rescue ship (ATS)Fleet tug (ATF/TATF)Subtotal, Fleet Sup.Total, GeneralPurpose
Total, All Ships
1986Re-tire Add End
311 7
38
49
1 49
4 251 402 43
4 5459
4 10756
365
5137
2 1 9202561
2 21 1
03
47
4 1 12139
J5
61 9
015
123 2 72 3
3732
321
559
1987Re-tire Add End
312 9
40
4949
3 281 394 39
5459
1 3 1091 4
6364
5137
2 4 112025
"63
1 16 7
0"8
47
4 162 1 12
948
2 81 10
018
123 1 51 2
37
"29
530
570
1988Re-tire Add End
31940
1 5949
4 321 40
4 355459
2 2 1091 3
6365
5137
5 16202568
16 131 1
15
47
4 202 14
934
2 101 11
021
121 6
23730
553
593
1989Re-tire Add
1
13
14 6
2 12
4
153
42 1
11
1
End
311041
59410353937545910816
367
513720202572
018422
472413957
1112023
127237
31
572
613
BUILDING TIME ASSUMPTIONS: CVN— 8 years; SSBN— 6 years; CGN— 5 years;— 4 years.
SSN—5 years; all others
79

TABLE A-2. (Continued)
1990 1991 1992Re- Re- Re-
Ship Type tire Add End tire Add End tire Add End
StrategicSSBN (Poseidon) 31 31 31SSBN (Trident) 1 11 1 H 1 1
Total, Strategic 42 43 44
General PurposeCombatantsAircraft carrier (CVN) 5 1 6 6Aircraft carrier (CV) 9 9 9Battleship (BB) 4 4 4Cruiser (CGN) 10 1 3 12 1 3 14Cruiser (CG) 4 39 3 42 1 3 44Destroyer (DDG) 6 4 37 9 10 38 9 10 39Destroyer (DD) 37 37 37Frigate (FFG) 54 54 54Frigate (FF) 59 59 59Submarine (SSN) 4 1 105 6 2 101 3 2 100Submarine (SS) 1 0 0 0Small combat (PG/PHM) 6 6 6Subtotal, Combatants 365 368 372
Amphibious ShipsHelo. assault ship (LHA/LHD) 1 6 6 2 8Dock transport (LPD) 13 1 14 1 13Helo. transport ship (LPH) 7 1 6 1 5Landing ship dock (LSD) 20 20 20Landing ship tank (LST) 20 20 20Command ship (LCC) 2 2 2Assault transport (LKA) _5 _5_ _5
Subtotal, Amphibious 73 73 73Mine Warfare Ships
Ocean minesweeper (MSO) 0 0 0Mine warfare ship (MCM) 18 18 18Mine warfare ship (MSH) 3 _7 3 K) 3 13
Subtotal, Mine Warfare 25 28 31Replenishment Ships
Station ship (AOE) 1 5 1 6 2 8Station ship (AOR) 7 7 7Oiler (AO/TAO) 2 26 3 29 29Ammo, ship (AE/TAE) 1 1 13 13 3 16Stores ship (AFS/TAFS) 9 9 9Subtotal, Replenishment 60 64 69
Material Support ShipsDestroyer tender (AD) 1 2 12 1 13 1 14Submarine tender (AS) 1 13 13 13Repair ship (AR) _0 _0 _0
Subtotal, Material Sup. 25 26 27Fleet Support ShipsSurveillance ship (TAGOS) 2 14 14 14Salvage ship (ARS) 7 7 7Rescue ship (ASR) 2 2 2Salvage/rescue ship (ATS) 3 3 3Fleet tug (ATF/TATF) _1_ _7_ J_
Subtotal, Fleet Sup. 33 33 33Total, GeneralPurpose 581 592 605
Total, All Ships 623 635 649
80

APPENDIX B. OPTION II: NAVY FORCE OBJECTIVES—SHIPS IN FLEET BY1996 AND AUTHORIZED BY 1992
This appendix contains tables showing details of an illus-trative shipbuilding program for Option II (see Table B-l) and ayear-by-year breakdown of the force structure that would resultfrom that building program (see Table B-2) taking into accountthe structure of the current fleet and assumed retirementsthrough 1992, In this option, the objective is to achieve theNavy's force level goals by the end of 1996. In developing theforce structure projections, assumptions about years of serviceuntil ship retirement (from commissioning date) and building time(from authorization to delivery) are as follows:
Retirement Assumptions
50 YearsAircraft Carriers (CV/CVN)
40 YearsDestroyer Tenders (AD)Submarine Tenders (AS)Repair Ships (AR)Fleet Oilers (AO/TAO)Salvage Ship (ARS)Submarine Rescue Ship (ASR)Fleet Tug (ATF/TATF)
30 YearsAll others
Building Time Assumptions
Aircraft Carriers (CVN)—8 yearsBallistic Missile Submarine(SSBN)—6 Years
Nuclear Powered Guided MissileCruiser (CGN)—5 years
Nuclear Powered AttackSubmarine (SSN)—5 years
All others—4 years
Under these assumptions, ships actually in the fleet by 1996must be authorized no later than 1992.
Certain types of reserve and support ships, which arenot included in the Navy's current ship counting methodology,are not included in these listings.
81

TABLE B-l. ILLUSTRATIVE SHIPBUILDING PROGRAM FOR OPTION II: NAVY FORCE OBJECTIVES—SHIPS INFLEET BY 1996 AND AUTHORIZED BY 1992 (By fiscal year, costs in billions of fiscalyear 1983 dollars)
1983 1984 1985 1986 1987Ship Type Ships Cost Ships Cost Ships Cost Ships Cost Ships Cost
StrategicSSBN (Poseidon)SSBN (Trident)
General PurposeCombatantsAircraft carrier (CVN)Aircraft carrier (CV)Battleship (BB)Cruiser (CGN)Cruiser (CG)Destroyer (DDG)Destroyer (DD)Frigate (FFG)Frigate (FF)Submarine (SSN)Submarine (SS)Small combatant (PG/PHM)
Amphibious ShipsHelo assault ship (LHA/LHD)Dock transport (LPD)Helo transport ship (LPH)Landing ship dock (LSD)Landing ship tank (LST)Command ship (LCC)Assault transport (LKA)
Mine Warefare ShipsOcean minesweeper (MSO)Mine warfare ship (MCM)Mine warfare ship (MSH)
Replenishment ShipsStation ship (AOE)Station ship (AOR)Oiler (AO/TAO)Ammo, ship (AE/TAE)Stores ship (AFS/TAFS)
Material Support ShipsDestroyer tender (AD)Submarine tender (AS)Repair ship (AR)
/Fleet Support ShipsSurveillance ship (AGOS)Salvage ship (ARS)Rescue ship (ASR)Salvage/rescue ship (ATS)Fleet tug (ATF/TATF)
Total, All Ships
1.4
0.45
4.55
1.0
1.4
1.2
0.6
0.90.4
0.90.45
0.1
1.4 1.4 1.4
3 C. J
0.45
4.551.251.0
0.7
0.452.154.55
1.0
1.6
1.4
1.3
1.2
0.7
6 0.61 0.1
5 0.53 0.18 3 0.18
0.60.4
0.450.45
0.90.4
0.450.45
0.60.4
0.450.45
1 0.10.1
1 1.4
3.5
9.13 5.25
7 5.6
2 1.4
1 1.01 0.7
1.6
0.18
0.90.4
0.45
0.2
27 13.35 28 17.15 29 16.33 24 18.48 25 17.48
(continued)
82

TABLE B-l. (Continued)
1988Ships Cost
1 1.4
1 3.5
— —2 3.5
— —6 4.8__ __
1 0.7
1 1.0
——
__
3 0.18
1 0.7
2 0.61 0.4
—
1 0.45
—
__
1989Ships
1
—
—3
—8
__
2
11
—
—
—
—
1
31
—
1
—
—
Cost
1.4
—
—5.25
—6.4—
1.4
1.00.5
—
—
—
—
0.5
0.90.4
—
0.45
—
—
1990 1991 1992Ships
1
1
—2
—6__
1
11
—
--
—
—
1
211
1—
—
—
Cost Ships Cost Ships Cost
1.4 1 1.4 1 1.4
3.5 — — 1 3.5
— — — — —3.5 3 5.25 2 3.5
— — — — —4.8 8 6.4 6 4.8___
0.7 2 1.4 2 1.4
1.0 1 1.0 1 1.00.5 1 0.5 1 0.5
—__
__
— — — — —
0.5 1 0.5 1 0.5
0.6 3 0.90.40.25 — — 1 0.5
0.45
— — — — —
— — — — —
__
TotalType
10
5
31620426
16
75
—14
1713
5
2382
94
32
TotalTypeCost
14.0
17.5
1.3528.422.7534.053.0
11.2
7.32.7
—5.6
1.70.75
2.7
6.93.20.75
4.051.8
0.30.2
Percentof
TotalCost,AllShips
8
10
53
7
9
2
8
3
< 1
20 17.23 22 18.20 19 17.60 20 17.35 16 17.10 230 170.27
83

TABLE B-2. ILLUSTRATIVE FORCE STRUCTURE FOR OPTION II: NAVY FORCE OBJECTIVES—SHIPS IN FLEET BY1996 AND AUTHORIZED BY 1992 (By fiscal year)
1981Ship Type End
StrategicSSBN (Poseidon) 34SSBN (Trident) _1
Total, Strategic 35
General PurposeCombatantsAircraft carrier (CVN) 3Aircraft carrier (CV) 9Battleship (BB) 0Cruiser (CGN) 9Cruiser (CG) 18Destroyer (DDG) 41Destroyer (DD) 44Frigate (FFG) 22Frigate (FF) 59Submarine (SSN) 86Submarine (SS) 5Small combat (PG/PHM) 5Subtotal, Combatants 301
Amphibious ShipsHelo assault ship (LHA/LHD) 5Dock transport (LPD) 13Helo transport ship (LPH) 7Landing ship dock (LSD) 13Landing ship tank (LST) 20Command ship (LCC) 2Assault transport (LKA) 5
Subtotal, Amphibious "65Mine Warfare Ships
Ocean minesweeper (MSO) 25Mine warfare ship (MCM) 0Mine warfare ship (MSH) _0
Subtotal, Mine Warfare 25Replenishment Ships
Station ship (AOE) 4Station ship (AOR) 7Oiler (AO/TAO) 19Ammo, ship (AE/TAE) 13Stores ship (AFS/TAFS) 10Subtotal, Replenishment 53
Material Support ShipsDestroyer tender (AD) 9Submarine tender (AS) 13Repair ship (AR) _4
Subtotal, Material Sup. 26
Fleet Support ShipsSurveillance ship (TAGOS) 0Salvage ship (ARS) 7Rescue ship (ASR) 6Salvage/rescue ship (ATS) 3Fleet tug (ATF/TATF) 14
Subtotal, Fleet Sup. 30Total,General Purpose 500
Total, All Ships 535
1982 1983Re- Re-tire Add End tire Add
3 311 2 1
33
0 1 490 1918 14144 1
8 30 1059
6 92 55
2 3 6317
5137
13202565
4 0 210021
47
1 2 20131054
1 1 9 2 113 14 126
0 376 131430
313
546
End
31334
4919
19414540599756
335
5137
13202565
210021
4720131054
812323
37531432
530
564
1984Re-tire Add End
311 4
35
49
1 29
1 204145
5 4559
4 10156
346
5137
1 1 13202565
11 100010
47
2 18131052
2 61 111 2
19
5 8753
4 10
33
525
560
1985Re-tire Add End
312 6
37
49
1 39
1 214145
5 5059
2 10356
355
5137
3 10202562
6 4004
47
3 1513
1 948
61 102 0
16
4 121 8
53
3 _735
520
557
(continued)
RETIREMENT ASSUMPTIONS: 50 years—CV/CVN; 40 years—AD, AS, AR, AO/TAO, ARS, ASR, ATF; 30 years-all others .
84
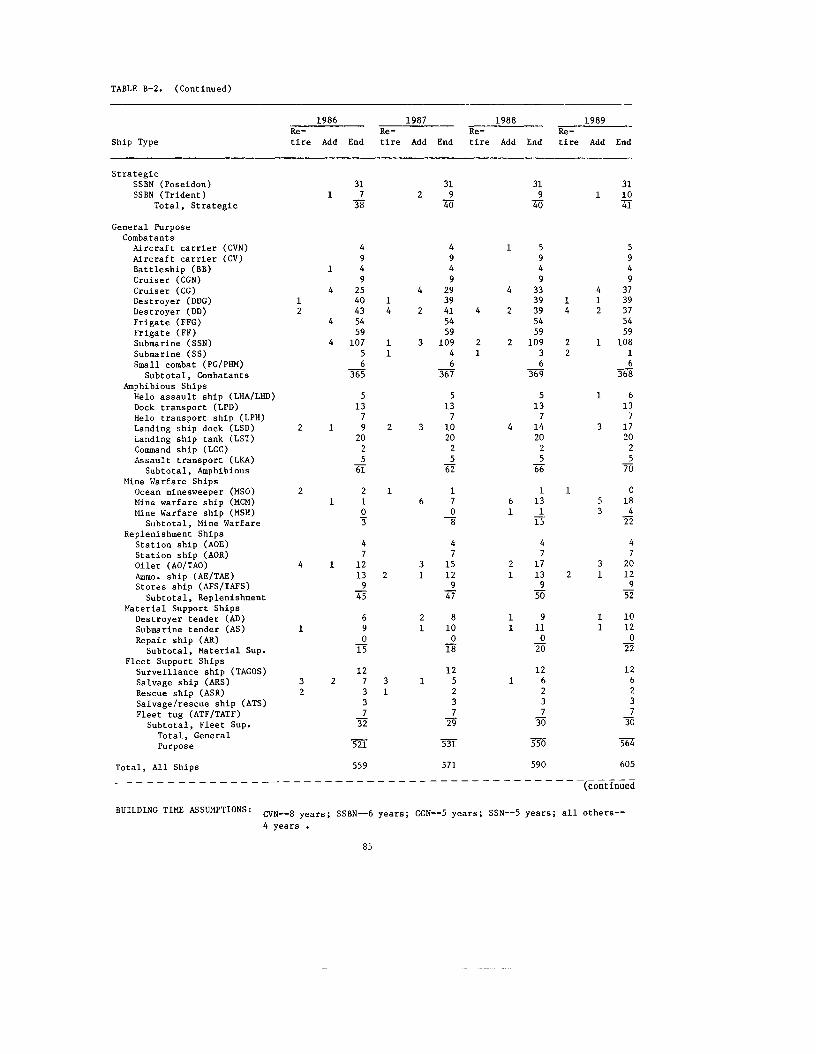
TABLE B-2. (Continued)
1986 1987 1988 1989Re-
Ship Type tire
StrategicSSBN (Poseidon)SSBN (Trident)
Total, Strategic
General PurposeCombatantsAircraft carrier (CVN)Aircraft carrier (CV)Battleship (BB)Cruiser (CGN)Cruiser (CG)Destroyer (DDG) 1Destroyer (DD) 2Frigate (FFG)Frigate (FF)Submarine (SSN)Submarine (SS)Small combat (PG/PHM)
Subtotal, CombatantsAmphibious ShipsHelo assault ship (LHA/LHD)Dock transport (LPD)Helo transport ship (LPH)Landing ship dock (LSD) 2Landing ship tank (LST)Command ship (LCC)Assault transport (LKA)
Subtotal, AmphibiousMine Warfare Ships
Ocean minesweeper (MSO) 2Mine warfare ship (MCM)Mine Warfare ship (MSH)
Subtotal, Mine WarfareReplenishment Ships
Station ship (AOE)Station ship (AOR)Oiler (AO/TAO) 4Ammo, ship (AE/TAE)Stores ship (AFS/TAFS)Subtotal, Replenishment
Material Support ShipsDestroyer tender (AD)Submarine tender (AS) 1Repair ship (AR)
Subtotal, Material Sup.Fleet Support ShipsSurveillance ship (TAGOS)Salvage ship (ARS) 3Rescue ship (ASR) 2Salvage/rescue ship (ATS)Fleet tug (ATF/TATF)
Subtotal, Fleet Sup.Total, GeneralPurpose
Total, All Ships
BUILDING TIME ASSUMPTIONS: CVN__g year
Add End
311 7
38
49
1 49
4 254043
4 5459
4 10756
365
5137
1 9202561
21 1
03
47
1 1213945
69015
122 7
33732
"521
559
s; SSBN— 6
Re-tire Add
2
414 2
1 31
2 3
16
32 1
21
3 11
End
31940
4949293941545910946
367
513710202562
1708
47
1512947
810018
12523729
531
571
Re-tire Add
1
4
4 2
2 21
4
61
21
11
1
years; CGN — 5 years; SSN — 5
Re-End tire
31940
5949
3339 139 45459109 23 26
369
513714202566
1 113115
47
1713 2950
911020
12623730
350
590
years; all
Add End
311 10
41
5949
4 371 392 37
5459
1 10816
368
1 6137
3 17202570
05 183 4
22
47
3 201 12
952
1 101 12
022
12623730
564
605
(continued
others —
85

TABLE B-2. (Continued)
Ship Type
StrategicSSBN (Poseidon)SSBN (Trident)
Total, Strategic
General PurposeCombatantsAircraft carrier (CVN)Aircraft carrier (CV)Battleship (BB)Cruiser (CGN)Cruiser (CG)Destroyer (DDG)Destroyer (DD)Frigate (FFG)Frigate (FF)Submarine (SSN)Submarine (SS)Small combat (PG/PHM)Subtotal, Combatants
Amphibious ShipsHelo assault ship (LHA/LHD)Dock transport (LPD)Helo transport Ship (LPH)Landing ship dock (LSD)Landing ship tank (LST)Command ship (LCC)Assault transport (LKA)
Subtotal, Amphibious
Mine Warfare ShipsOcean minesweeper (MSO)Mine warfare ship (MCM)Mine warfare ship (MSH)
Subtotal, Mine WarfareReplenishment Ships
Station ship (AOE)Station ship (AOR)Oiler (AO/TAO)Ammo, ship (AE/TAE)Stores ship (AFS/TAFS)Subtotal, Replenishment
Material Support ShipsDestroyer tender (AD)Submarine tender (AS)Repair ship (AR)
Subtotal, Material Sup.Fleet Support ShipsSurveillance ship (TAGOS)Salvage ship (ARS)Sub, rescue ship (ASR)Salvage/rescue ship (ATS)Fleet tug (ATF/TATF)
Subtotal, Fleet Sup.Total, GeneralPurpose
Total, All Ships
1990Re-tire Add
1
18
6
4 21
4
3
21 1
1 11
1
End
311142
59410453337545910606
368
613721202574
018725
472212954
1013023
13623731
575
617
1991Re-tire Add End
311 12
43
594
1 945
9 7 31375459
6 1 10106
360
1 71 14
1 621202575
018
3 1028
47
3 251 13
958
1 1113024
2 15623733
378
621
1992Re-tire Add End
311 13
44
1 694
1 3 111 449 6 28
375459
3 2 10006
358
1 81 131 5
21202574
018
3 1331
1 57
2 271 14
962
1 1213025
15623733
583
627
1993Re-tire Add End
6 251 14
39
694
2 134 405 8 31
3754
1 583 1 98
06
356
1 91 1 131 4
21202574
0181331
1 67
3 301 15
967
1 1313026
15623733
587
626
(continued
86

TABLE B-2. (Continued)
1994 1995 1996Re- Re- Re-
Ship Type tire Add End tire Add End tire Add End
StrategicSSBN (Poseidon) 1 3 1 2 4 8 7 1SSBN (Trident) 1 _15 1 _16 1 17_
Total, Strategic 27 24 18
General PurposeCombatantsAircraft carrier (CVN) 1 7 7 1 8Aircraft carrier (CV) 9 1 8 1 7Battleship (BB) 4 4 4Cruiser (CGN) 3 16 2 18 3 21Cruiser (CG) 4 36 2 34 3 31Destroyer (DDG) 5 6 32 8 40 6 46Destroyer (DD) 37 37 37Frigate (FFG) 54 54 1 53Frigate (FF) 1 57 4 53 2 51Submarine (SSN) 2 2 98 2 1 97 1 2 98Submarine (SS) 0 0 0Small combat (PG/PHM) 6 6 6Subtotal, Combatants 356 358 362
Amphibious ShipsHelo assault ship (LHA/LHD) 1 10 1 11 1 12Dock transport (LPD) 1 14 2 1 13 1 1 13Helo transport ship (LPH) 4 1 3 1 2Landing ship dock (LSD) 21 21 21Landing ship tank (LST) 20 20 20Command ship (LCC) 2 2 2Assault transport (LKA) 5 5 5
Subtotal, Amphibious 76 75 75Mine Warfare ShipsOcean minesweeper (MSO) 0 0 0Mine warfare ship (MCM) 18 18 18Mine warfare ship (MSH) 13 L3 _13
Subtotal, Mine Warfare 31 31 31Replenishment Ships
Station ship (AOE) 1 1 6 1 7 1 8Station ship (AOR) 7 7 7Oiler (AO/TAO) 1 2 31 3 3 31 2 29Ammo, ship (AE/TAE) 1 16 16 16Stores ship (AFS/TAFS) 2 1 _8 _8 1 _9Subtotal, Replenishment 68 69 69
Material Support ShipsDestroyer tender (AD) 1 14 14 14Submarine tender (AS) 13 13 13Repair ship (AR) _0 _0 _0
Subtotal, Material Sup. 27 27 27Fleet Support ShipsSurveillance ship (TAGOS) 15 15 15Salvage ship (ARS) 6 6 6Rescue ship (ASR) 2 2 2Salvage/rescue ship (ATS) 3 3 3Fleet tug (ATF/TATF) _7 _7 _7
Subtotal, Fleet Sup. 33 33 33Total, GeneralPurpose 591 593 597
Total, All Ships 618 617 615
87


APPENDIX C. OPTION III: REDUCED FORCE OBJECTIVES—SHIPS IN FLEETBY 1996 AND AUTHORIZED BY 1992
This appendix contains tables giving details of an illustra-tive shipbuilding program for Option III (see Table C-l) and ayear-by-year breakdown of the force structure that would resultfrom that building program (see Table C-2), taking into accountthe structure of the current fleet and assumed retirements through1996. In this option, shipbuilding budgets are constrainedto about the current level and a mix of ship types consistent withcurrent planning is procured. This results in force levelssignificantly lower than Navy objectives. In developing theforce structure projections, assumptions about years of serviceuntil ship retirement (from commissioning date) and building time(from authorization to delivery) are as follows:
Retirement Assumptions
50 YearsAircraft Carriers (CV/CVN)
40 YearsDestroyer Tenders (AD)Submarine Tenders (AS)Repair Ships (AR)Fleet Oilers (AO/TAO)Salvage Ship (ARS)Submarine Rescue Ship (ASR)Fleet Tug (ATF/TATF)
30 YearsAll others
Building Time Assumptions
Aircraft Carriers (CVN)—8 yearsBallistic Missile Submarine(SSBN)—6 Years
Nuclear Powered Guided MissileCruiser (CGN)—5 years
Nuclear Powered AttackSubmarine (SSN)—5 years
All others—4 years
Under these assumptions, ships actually in the fleet by 1996must be authorized no later than 1992.
Certain types of reserve and support ships, which are notincluded in the Navy's current ship counting methodology, arenot included in these tables.
89

TABLE C-l. ILLUSTRATIVE SHIPBUILDING PROGRAM FOR OPTION III: REDUCED FORCE LEVEL OBJECTIVES-SHIPS IN FLEET BY 1996 AND AUTHORIZED BY 1992 (By fiscal year, costs in billions offiscal year 1983 dollars)
1983 1984 1985 1986 1987Ship Type Ships Cost Ships Cost Ships Cost Ships Cost Ships Cost
StrategicSSBN (Poseidon)SSBN (Trident)
General PurposeCombatantsAircraft carrier (CVN)Aircraft carrier (CV)Battleship (BB)Cruiser (CGN)Cruiser (CG)Destroyer (DDGX)Destroyer (DD)Frigate (FFG)Frigate (FF)Submarine (SSN)Submarine (SS)Small combatant (PG/PHM)
Amphibious ShipsHelo assault ship (LHA/LHD)Dock transport (LPD)Helo transport ship (LPH)Landing ship dock (LSD)Landing ship tank (LST)Command ship (LCC)Assault transport (LKA)
Mine Warefare ShipsOcean minesweeper (MSO)Mine warfare ship (MCM)Mine warfare ship (MSH)
Replenishment ShipsStation ship (AOE)Station ship (AOR)Oiler (AO/TAO)Ammo, ship (AE/TAE)Stores ship (AFS/TAFS)
Material Support ShipsDestroyer tender (AD)Submarine tender (AS)Repair ship (AR)
Fleet Support ShipsSurveillance ship (AGOS)Salvage ship (ARS)Sub, rescue ship (ASR)Salvage/rescue ship (ATS)Fleet tug (ATF/TATF)
Total, All Ships
1.4
0.45
0.7
0.8
1.4
0.45
1.4
0.45 —
1.4
0.7
1.3
0.4 0.8 0.4
1.40
4 4.56 4 4.56 4 4.56 4 4.56 2 2.281 1.25 — — 5 4.00
0.7
1.01 1.00
0.4
—™"~
11
1—
—
o__ __
0.3 20.4 1
0.45 —— — i
„
0.3~"~
0.60.4
0.45
—
31
11
1—
—
0.30.1
0.30.4
0.45—
—
3"~~
21
1
—
0.3~"""
0.60.4
0.45
—
33
1
—
1
—
—
0.30.18
0.3
—
0.45
—
—
12 9.06 16 10.56 16 10.01 15 9.81 18 10.31
(continued)
90

TABLE C-l (Continued)
1988 1989 1990 1991 1992Ships Cost Ships Cost Ships Cost Ships Cost Ships Cost
TotalType
Percentof
TotalTotal Cost,Type AllCost Ships
1 1.4 1 1.4 1 1.4 1 1.4 1 1.4 10 14.0 14
2 2.286 4.80 6 4.80 7 5.6 7 5.6 7 5.6
2039
1.35
22.8 5731.6
1 0.7 1 0.7 1 0.7 — 4.2
1 1.0 — 1 1.0 — — — — 41 0.75 — — 1 0.75 1 0.75 4
1 0.4 — — — — — — — — 8 3.2
4.33.25 11
2 0.12 3 0.18 3 0.18
o.7
2 0.6 1 0.3 2 0.6 1 0.3 2 0.6
1212
154
1.200.76
0.7
4.51.6
1 0.451 0.45 — — 1 0.45
1.81.8
16 11.05 14 8.58 16 9.93 11 8.75 12 9.05 146 97.11
91

TABLE C-2. ILLUSTRATIVE FORCE STRUCTURE FOR OPTION III: REDUCED FORCE LEVEL OBJECTIVES—SHIPSIN FLEET BY 1996 AND AUTHORIZED BY 1992 (By fiscal year)
1981Ship Type End
StrategicSSBN (Poseidon) 34SSBN (Trident) _1
Total, Strategic 35
General PurposeCombatantsAircraft carrier (CVN) 3Aircraft carrier (CV) 9Battleship (BB) 0Cruiser (CGN) 9Cruiser (CG) 18Destroyer (DDG) 41Destroyer (DD) 44Frigate (FFG) 22Frigate (FF) 59Submarine (SSN) 86Submarine (SS) 5Small combat (PG/PHM) 5Subtotal, combatants 301
Amphibious ShipsHelo assault ship (LHA/LHD) 5Dock transport (LPD) 13Helo transport ship (LPH) 7Landing ship dock (LSD) 13Landing ship tank (LST) 20Command ship (LCC) 2Assault transport (LKA) 5
Subtotal, Amphibious 65Mine Warfare Ships
Ocean minesweeper (MSO) 25Mine warfare ship (MCM) 0Mine warfare ship (MSH) _0
Subtotal, Mine Warfare 25Replenishment Ships
Station ship (AOE) 4Station ship (AOR) 7Oiler (AO/TAO) 19Ammo, ship (AE/TAE) 13Stores ship (AFS/TAFS) 10Subtotal, Replenishment 53
Material Support ShipsDestroyer tender (AD) 9Submarine tender (AS) 13Repair ship (AR) 4
Subtotal, Material Sup. 26Fleet Support ShipsSurveillance ship (TAGOS) 0Salvage ship (ARS) 7Rescue ship (ASR) 6Salvage/rescue ship (ATS) 3Fleet tug (ATF/TATF) _14Subtotal, Fleet Sup. 30Total, GeneralPurpose 500
Total, All Ships 535
1982 1983Re- Re-tire Add End tire Add
3 311 2 1
33
1 490 1918 14144 1
8 30 1059
6 92 55
2 3 6317
5137
13202565
4 210021
47
1 2 20131054
1 1 9 2 113 14 126
0 376 131430
313
546
End
31334
491919414540599756
335
5137
13202565
210021
4720131054
812323
37531432
532
564
1984Re-tire Add End
311 4
35
49
1 29
1 204145
5 4559
4 10156
346
5137
1 1 13202565
11 100010
47
2 18131052
2 61 111 2
19
5 8753
4 1033
525"
560
1985Re-tire Add End
312 6
37
49
1 39
1 214145
5 5059
2 10356
355
5137
3 102025
"62
6 4004
47
3 1513
1 948
61 102 0
16
4 121 8
53
3 735
520
557
(Continued)
RETIREMENT ASSUMPTIONS: 50 years—CV/CVN; 40 years—AD, AS, AR, AO/TAO, ARS, ASR, ATF; 30 years—all others.
92

TABLE C-2. (Continued)
Re-Ship Type tire
StrategicSSBN (Poseidon)SSBN (Trident)
Total, Strategic
General PurposeCombatantsAircraft carrier (CVN)Aircraft carrier (CV)Battleship (BB)Cruiser (CGN)Cruiser (CG)Destroyer (DDG) 1Destroyer (DD) 2Frigate (FFG)Frigate (FF)Submarine (SSN)Submarine (SS)Small combat (PG/PHM)Subtotal, Combatants
Amphibious ShipsHelo assault ship (LHA/LHD)Dock transport (LPD)Helo transport ship (LPH)Landing ship dock (LSD) 2Landing ship tank (LST)Command ship (LCC)Assault transport (LKA)
Subtotal, AmphibiousMine Warfare Ships
Ocean minesweeper (MSO) 2Mine warfare ship (MCM)Mine warfare ship (MSH)
Subtotal, Mine WarfareReplenishment Ships
Station ship (AOE)Station ship (AOR)Oiler (AO/TAO) 4Ammo, ship (AE/TAE)Stores ship (AFS/TAFS)Subtotal, Replenishment
Material Support ShipsDestroyer tender (AD)Submarine tender (AS) 1Repair ship (AR)
Subtotal, Material Sup.Fleet Support Ships
Surveillance ship (TAGOS)Salvage ship (ARS) 3Rescue ship (ASR) 2Salvage/rescue ship (ATS)Fleet tug (ATF/TATF)
Subtotal, Fleet Sup.Total, GeneralPurpose
Total, All Ships
BUILDING TIME ASSUMPTIONS: CVN— 8 yes
1986
Add End
311 7
38
49
1 49
4 254043
4 5459
4 10756
365
5137
1 9202561
21 1
03
47
1 1213945
69015
122 7
33732
~52l
559
irs, SSBN— -6
1987Re-tire Add End
312 9
40
4949
4 291 394 39
5459
1 3 1091 4
6365
5137
2 2 9202561
1 1102
47
1 132 1 12
945
1 79016
123 41 2
3728
517
557
years, CGN — 5 ye
1988Re-tire Add End
31940
1 5949
4 3339
4 355459
2 1 1081 3
6364
1 6137
1 10202563
13 4
05
47
2 151 13
948
71 10
017
12423728
525
565
;ars, SSN — 5 years
1989Re-tire Add End
311 10
41
5949
4 371 384 31
5459
2 1 1072 1
6360
6137
2 12202565
1 03 71 1
8
47
1 162 1 12
948
1 810018
12423728
527
568
(continued)
>, all others —
93

TABLE C-2. (Continued)
Ship Type
StrategicSSBN (Poseidon)SSBN (Trident)
Total, Strategic
General PurposeCombatantsAircraft carrier (CVN)Aircraft carrier (CV)Battleship (BB)Cruiser (CGN)Cruiser (CG)Destroyer (DDG)Destroyer (DD)Frigate (FFG)Frigate (FF)Submarine (SSN)Submarine (SS)Small combat (PG/PHM)Subtotal, Combatants
Amphibious ShipsHelo assault ship (LHA/LHD)Dock transport (LPD)Helo transport Ship (LPH)Landing ship dock (LSD)Landing ship tank (LST)Command ship (LCC)Assault transport (LKA)
Subtotal, AmphibiousMine Warfare Ships
Ocean minesweeper (MSO)Mine warfare ship (MCM)Mine warfare ship (MSH)
Subtotal, Mine WarfareReplenishment Ships
Station ship (AOE)Station ship (AOR)Oiler (AO/TAO)Ammo, ship (AE/TAE)Stores ship (AFS/TAFS)Subtotal, Replenishment
Material Support ShipsDestroyer tender (AD)Submarine tender (AS)Repair ship (AR)
Subtotal, Material Sup.Fleet Support ShipsSurveillance ship (TAGOS)Salvage ship (ARS)Rescue ship (ASR)Salvage/rescue ship (ATS)Fleet tug (ATF/TATF)
Subtotal, Fleet Sup.Total, GeneralPurpose
Total, All Ships
1990Re-tire Add End
311 11
42
5949
4 416 32
315459
4 1031 0
6353
1 7137
1 13202567
03 10
111
47
2 181 1 12
950
1 71 11
018
12423728
"527
569
1991Re-tire Add End
311 12
43
594
1 82 43
9 5 28315459
6 1 9806
345
71 14
1 61 14
202568
03 133 4
17
47
1 1912951
1 811019
12423728
"528
571
1992Re-tire Add End
311 13
44
594
1 71 2 449 6 25
315459
3 9506
339
1 81 131 5
1 15202568
013
2 619
47
2 2112953
81 12
020
12423728
127
571
1993Re-tire Add End
6 251 14
39
6947
4 405 6 26
3154
1 583 92
06
332
81 1 131 4
15202567
013
3 922
47
1 2212954
1 912021
12423728
524
563
(continued)
94

TABLE C-2. (Continued)
1994
Ship TypeRe-tire Add End
1995Re-tire Add End
1996Re-tire Add End
StrategicSSBN (Poseidon)SSBN (Trident)
Total, Strategic
General PurposeCombatantsAircraft carrier (CVN)Aircraft carrier (CV)Battleship (BB)Cruiser (CGN)Cruiser (CG)Destroyer (DDG)Destroyer (DD)Frigate (FFG)Frigate (FF)Submarine (SSN)Submarine (SS)Small combat (PG/PHM)Subtotal, Combatants
Amphibious ShipsHelo assault ship (LHA/LHD)Dock transport (LPD)Helo transport ship (LPH)Landing ship dock (LSD)Landing ship tank (LST)Command ship (LCC)Assault transport (LKA)
Subtotal, AmphibiousMine Warfare Ships
Ocean minesweeper (MSO)Mine warfare ship (MCM)Mine warfare ship (MSH)
Subtotal, Mine WarfareReplenishment Ships
Station ship (AGE)Station ship (AOR)Oiler (AO/TAO)Ammo, ship (AE/TAE)Stores ship (AFS/TAFS)
Subtotal, Replenishment
Material Support ShipsDestroyer tender (AD)Submarine tender (AS)Repair ship (AR)
Subtotal, Material Sup.
Fleet Support ShipsSurveillance ship (TAGOS)Salvage ship (ARS)Rescue ship (ASR)Salvage/rescue ship (ATS)Fleet tug (ATF/TATF)Subtotal, Fleet Sup.Total, GeneralPurpose
Total, All Ships
13 121527
594736283154579106
328
913415202568
0131225
372312752
1
2
42
21
13022
12423728
"523
550
_24
4734353154539006
327
912315202
_566
0131225
372112_750
913_022
12423728
518
542
11718
574731423153519006
327
912215202
_565
0131225
472112_751
913_022
12423728
5l8
536
95


APPENDIX D. OPTION IV: MODIFIED FORCE MIX, EXPANDED FORCELEVELS—SHIPS IN FLEET BY 1996—AUTHORIZED BY 1992
This appendix contains tables presenting in detail an illus-trative shipbuilding program for Option IV (see Table D-l) and ayear-by-year breakdown of the force structure that would resultfrom that building program (see Table D-2), taking into accountthe structure of the current fleet and assumed retirements through1996. In this option, the objective is to achieve force levelgoals consistent with Navy objectives by the end of 1996, but toreduce costs by changing the mix of ship types procured. Indeveloping the force structure projections, assumptions aboutyears of service until ship retirement (from commissioning date)and building time (from authorization to delivery) are as follows:
Retirement Assumptions Building Time Assumptions
50 Years Aircraft Carriers (CVN)—8 yearsAircraft Carriers (CV/CVN) Ballistic Missile Submarine
(SSBN)—6 Years40 Years Nuclear Powered Guided MissileDestroyer Tenders (AD) Cruiser (CGN)—5 yearsSubmarine Tenders (AS) Nuclear Powered AttackRepair Ships (AR) Submarine (SSN)—5 yearsFleet Oilers (AO/TAO) All others—4 yearsSalvage Ship (ARS)Submarine Rescue Ship (ASR)Fleet Tug (ATF/TATF)
30 YearsAll others
Under these assumptions, ships actually in the fleet by 1996must be authorized no later than 1992.
Certain types of reserve and support ships, which are notincluded in the Navy's current ship counting methodology, arenot included in these tables.
97

TABLE D-l. ILLUSTRATIVE SHIPBUILDING PROGRAM FOR OPTION IV: MODIFIED FORCE MIX, EXPANDED FORCELEVELS—SHIPS IN FLEET BY 1996 AND AUTHORIZED BY 1992 (By fiscal year, costs inbillions of fiscal year 1983 dollars)
1983 1984 1985 1986 1987Ship Type Ships Cost Ships Cost Ships Cost Ships Cost Ships Cost
StrategicSSBN (Poseidon)SSBN (Trident)
General PurposeCombatantsAircraft carrier (CVN)Aircraft carrier (CV)Battleship (BB)V/STOL cruiser (CGV)Cruiser (CG)Destroyer (DDG)Destroyer (DD)Frigate (FFG)Frigate (FF)Submarine (SSN)Submarine (SS)Small combatant (PG/PHM)
Amphibious ShipsHelo assault ship (LHA/LHD)Dock transport (LPD)Helo transport ship (LPH)Landing ship dock (LSD)Landing ship tank (LST)Command ship (LCC)Assault transport (LKA)
Mine Warefare ShipsOcean minesweeper (MSO)Mine warfare ship (MCM)Mine warfare ship (MSH)
Replenishment ShipsStation ship (AOE)Station ship (AOR)Oiler (AO/TAO)Ammo, ship (AE/TAE)Stores ship (AFS/TAFS)
Material Support ShipsDestroyer tender (AD)Submarine tender (AS)Repair ship (AR)
Fleet Support ShipsSurveillance ship (AGOS)Salvage ship (ARS)Rescue ship (ASR)Salvage/rescue ship (ATS)Fleet tug (ATF/TATF)
Total, All Ships 18
1.4
1 0.7
0.4
1.4 1.4
1 0.25
1.4
1
3
—
0.45
3.42
1
1
2
3.5
0.45
2.28
—
1
3
—
0.45
3.42
—
—
31
—
—
3.420.65
1.4
3.5
1 1.03 3.42
r\ 7 _U. / ~" ^"^
2 0.3 2 0.3
__ _ l 1 O-L -L. J
4 1.9 3 1.4 3 1.4 4 1.8
— 1 1.00.7 —~
4 0.4 4 0.4 5 0.51 0.20
21
1-
0.60.4
0.45
—
21
—
0.60.4
—
21
11
0.60.4
0.450.45
31
11
0.90.4
0.450.45
0.33
0.6
0.45
9.72 16 10.68 20 11.17 23 10.97 15 12.00
(Continued)
98

TABLE D-l. (Continued)
1988Ships
1
—
———12
12
11
—
~
3
1
31
—
1
—__
2
Cost
1.4
—
———4.8
0.70.3
1.00.5
—
—
0.33
0.7
0.90.4
—
0.45
—
0.20
1989Ships
1
—
—2
—12
13
11
E—
3
1
21
—
1
—
—
Cost
1.4
—
—1.5
—4.8
0.70.45
1.00.5
E—
0.33
0.5
0.60.4
—
0.45
—
—
1990 1991Ships Cost Ships
1 1.4 1
1 3.5
—3 2.25 3
— — —12 4.8 12
1___ __
1 1.0 11
E i i—
3 0.33
1 0.5 1
2 0.6 211
1 0.45 1i
3
—
Cost
1.4
—
—2.25
—4.8
0.7
—
1.00.5
E—
—
0.5
0.60.40.25
0.450.45
0.30
—
1992Ships
1
—
—3
—12
1
11
—
—
—
1
311
11
—
—
Cost
1.4
—
—2.25
—4.8
0.7
1.00.5
—
—
—
0.5
0.90.40.25
0.450.45
—
—
TotalType
10
3
3121461
610
75
14
1713
5
2382
94
32
TotalTypeCost
14.0
10.5
1.359.2515.9624.65
4.21.6
7.32.7
6.5
1.71.52
2.7
6.93.20.5
4.051.8
0.300.20
Percentof
TotalCost,AllShips
12
9
42
5
14
3
11
5
0
"29" 11.68 29 12.63 25 14.83 29 13.60 27 13.60 231 120.88
99

TABLE D-2. ILLUSTRATIVE FORCE STRUCTURE FOR OPTION IV: MODIFIED FORCE MIX, EXPANDED FORCE LEVELS-SHIPS IN FLEET BY 1996 AND AUTHORIZED BY 1992 (By fiscal year)
Ship Type
StrategicSSBN (Poseidon)SSBN (Trident)
Total, Strategic
General PurposeCombatantsAircraft carrier (CVN)Aircraft carrier (CV)Battleship (BB)Cruiser (CGN)Cruiser (CG)V/STOL cruiser (CGV)Destroyer (DDG)Destroyer (DD)Frigate (FFG)Frigate (FF)Submarine (SSN)Submarine (SS)Small combat (PG/PHM)Subtotal, Combatants
Amphibious ShipsHelo assault hip (LHA/LHD)Deck transport (LPD)Helo transport ship (LPH)Landing ship dock (LSD)Landing ship tank (LST)Command ship (LCC)Assault transport (LKA)
Subtotal, AmphibiousMine Warfare Ships
Ocean minesweeper (MSO)Mine warfare ship (MCM)Mine warfare ship (MSH)
Subtotal, Mine WarfareReplenishment Ships
Station ship (AOE)Station ship (AOR)Oiler (AO/TAO)Ammo, ship (AE/TAE)Stores ship (AFS/TAFS)Subtotal, Replenishment
Material Support ShipsDestroyer tender (AD)Submarine tender (AS)Repair ship (AR)
Subtotal, Material Sup.Fleet Support Ships
Surveillance ship (TAGOS)Salvage ship (ARS)Rescue ship (ASR)Salvage/rescue ship (ATS)Fleet tug (ATF/TATF)Subtotal, Fleet Sup.Total, GeneralPurpose
Total, All Ships
1981End
34135
3909180414422598655
301
5137
13202565
250025
4719131053
913426
07631430
3oo
535
1982 1983Re- Re-tire Add End tire Add
3 311 2 1
33
1 490 1918 104144 1
8 30 1059
6 92 55
2 3 63l7
5137
13202565
4 210021
47
1 2 20131054
1 1 9 2 113 14 126
0 376 131430
513
546
End
31334
4919190414540599756
335
5137
13202565
210021
4720131054
812323
37531432
330
564
1984Re-tire Add End
311 4
35
49
1 29
1 2004145
5 4559
4 10156
346
/ 5
137
1 1 13202565
11 100010
47
2 18131052
2 61 111 2
19
5 8753
4 1033
325
560
1985Re-tire Add End
312 6
37
49
1 39
1 2104145
5 5059
2 10356
355
5137
3 10202562
6 4004
47
3 1513
1 948
61 102 0
16
4 121 8
53
3 735
320
557
(Continued
RETIREMENT ASSUMPTIONS: 50 years—CV/CVN; 40 years—AD, AS, AR, AO/TAO, ARS, ASR, ATF; 30 years-all others.
100

TABLE D-2. (Continued)
Ship Type
StrategicSSBN (Poseidon)SSBN (Trident)
Total, Strategic
General PurposeCombatantsAircraft carrier (CVN)Aircraft carrier (CV)Battleship (BB)Cruiser (CGN)Cruiser (CG)V/STOL cruiser (CGV)Destroyer (DDG)Destroyer (DD)Frigate (FFG)Frigate (FF)Submarine (SSN)Submarine (SS)Small combat (PG/PHM)Subtotal, Combatants
Amphibious ShipsHelo assault ship (LHA/LHD)Dock transport (LPD)Helo transport ship (LPH)Landing ship dock (LSD)Landing ship tank (LST)Command ship (LCC)Assault transport (LKA)
Subtotal, AmphibiousMine warfare ships
Ocean minesweeper (MSO)Mine warfare ship (MCM)Mine warfare ship (MSH)
Subtotal, Mine WarfareReplenishment Ships
Station ship (AOE)Station ship (AOR)Oiler (AO/TAO)Ammo, ship (AE/TAE)Stores ship (AFS/TAFS)Subtotal, Replenishment
Material Support ShipsDestroyer tender (AD)Submarine tender (AS)Repair ship (AR)
Subtotal, Material Sup.
Fleet Support ShipsSurveillance ship (TAGOS)Salvage ship (ARS)Rescue ship (ASR)Salvage/rescue ship (ATS)Fleet tug (ATF/TATF)
Subtotal, Fleet Sup.Total, GeneralPurpose
Total, All Ships
1986Re-tire Add End
311 7
38
49
1 49
4 250
1 402 43
4 5459
4 10756
365
5137
2 1 9202561
2 21 1
03
47
4 1 1213945
61 9
015
123 2 72 3
3732
321
559
1987Re-tire Add End
312 9
40
4949
3 280
1 394 39
5459
1 3 1091 4
6364
5137
2 4 11202563
1 14 5
06
47
2 142 1 12
946
1 79016
123 41 2
3728
523
563
1988Re-tire Add End
31940
1 5949
2 30039
4 355459
2 1 1081 1 4
6362
5137
3 14202566
14 9
010
47
2 161 13
949
79016
12423728
53l
571
1989Re-tire Add End
311 10
41
5949
3 330
1 384 31
5459
2 1062 2
6356
1 6137
3 17202570
1 04 131 1
14
47
2 182 1 12
950
1 81 10
018
12423728
536
577
(Continued)
101

TABLE D-2. (Continued)
Ship Type
StrategicSSBN (Poseidon)SSBN (Trident)
Total, Strategic
General PurposeCombatantsAircraft carrier (CVN)Aircraft carrier (CV)Battleship (BB)Cruiser (CGN)Cruiser (CG)V/STOL cruiser (CGV)Destroyer (DDG)Destroyer (DD)Frigate (FFG)Frigate (FF)Submarine (SSN)Submarine (SS)Small combat (PG/PHM)Subtotal, Combatants
Amphibious ShipsHelo assault ship (LHA/LHD)Dock transport (LPD)Helo transport ship (LPH)Landing ship dock (LSD)Landing ship tank (LST)Command ship (LCC)Assault transport (LKA)
Subtotal, AmphibiousMine Warfare Ships
Ocean minesweeper (MSO)Mine warfare ship (MCM)Mine warfare ship (MSH)
Subtotal, Mine WarfareReplenishment Ships
Station ship (AOE)Station ship (AOR)Oiler (AO/TAO)Ammo, ship (AE/TAE)Stores ship (AFS/TAFS)
Subtotal, ReplenishmentMaterial Support Ships
Destroyer tender (AD)Submarine tender (AS)Repair ship (AR)
Subtotal, Material Sup.Fleet Support Ships
Surveillance ship (TAGOS)Salvage ship (ARS)Rescue ship (ASR)Salvage/rescue ship (ATS)Fleet tug (ATF/TATF)
Subtotal, Fleet Sup.Total, GeneralPurpose
Total, All ships
1990Re-tire Add
1
3
6 1
4 11 2
1
4
5
31 1
1 11
End
311142
59493603331545910336
352
614721202575
018119
472112953
811019
12423728
546
588
1991Re-tire Add End
311 12
43
594
1 83 391 1
9 24315459
6 972 5
6342
1 714
1 621202575
018
3 422
47
2 2312955
1 911020
12423728
542
585
1992Re-tire Add
1
1
11
9 12
32
11 11
3
1
31
1
2
End
311344
6947381273154599476
343
814521202575
018725
572613960
1011021
12623730
354
598
1993Re-tire Add End
6 251 14
39
6947
4 342 3
5 12 343154
1 583 1 92
3 106
348
1 91 1 141 4
21202575
018
3 1028
1 67
2 281 14
964
1 1111022
12623730
567
606
(Continued)
102

TABLE D-2 (Continued)
1994 1995 1996Re- Re- Re-
Ship Type tire Add End tire Add End tire Add End
StrategicSSBN (Poseidon) 1 3 1 2 4 8 7 1SSBN (Trident) 1 lj> 1 .16 1 17
Total, Strategic 27 24 18
General PurposeCombatantsAircraft carrier (CVN) 6 1 7 7Aircraft carrier (CV) 9 1 8 1 7Battleship (BB) 4 4 4Cruiser (CGN) 7 7 7Cruiser (CG) 4 30 2 28 3 25V/STOL cruiser (CGV) 3 6 3 9 3 1 2Destroyer (DDG) 5 12 41 12 53 12 65Destroyer (DD) 31 31 31Frigate (FFG) 54 54 1 53Frigate (FF) 1 57 4 53 2 51Submarine (SSN) 2 1 91 2 89 1 1 89Submarine (SS) 10 10 10Small combat (PG/PHM) 6 6 6Subtotal, Combatants 352 359 367
Amphibious ShipsHelo assault ship (LHA/LHD) 1 10 1 11 1 12Dock transport (LPD) 14 2 1 13 1 1 13Helo transport ship (LPH) 4 1 3 1 2Landing ship dock (LSD) 21 21 21Landing ship tank (LST) 20 20 20Command ship (LCC) 2 2 2Assault transport (LKA) __5 __5 _5
Subtotal, Amphibious 76 75 75Mine Warfare Ships
Ocean minesweeper (MSO) 0 0 0Mine warfare ship (MCM) 18 18 18Mine warfare ship (MSH) 3 L3 .13 L3
Subtotal, Mine Warfare 31 31 31Replenishment ships
Station ship (AOE) 1 1 6 1 7 1 8Station ship (AOR) 7 7 7Oiler (AO/TAO) 1 2 29 3 2 28 2 3 29Ammo, ship (AE/TAE) 14 1 15 1 16Stores ship (AFS/TAFS) 2 _7 1 _8 1 _9Subtotal, Replenishment 63 65 69
Material Support ShipsDestroyer tender (AD) 1 12 1 13 1 14Submarine tender (AS) 11 1 12 1 13Repair Ship (AR) JO _0 _0Subtotal, Material Sup. 23 25 27
Fleet Support ShipsSurveillance ship (TAGOS) 12 3 15 15Salvage ship (ARS) 6 6 6Sub, rescue ship (ASR) 2 2 2Salvage/rescue ship (ATS) 3 3 3Fleet tug (ATF/TATF) _7 _7 __7
Subtotal, Fleet Sup. 30 33 33Total,General Purpose 575 588 602
Total, All ships 602 612 620
103


APPENDIX E. OPEN-OCEAN DESTROYER (DDGY)
This appendix contains excerpts from the CBO study NavalSurface Combatants in the 1990s; Prospects and Possibilities,April 1981. These excerpts describe the DDGY and some othersurface combatants referred to in this report.
The open-ocean destroyer, which for convenience isdesignated DDGY, is illustrative of a warship that wouldresult from different choices on the design trade-offissues from those taken by the Navy for the DDGX. _!/ Itwould be an offensively oriented surface combatantcapable of battle group operations, but optimized morefor broad-ocean operations in the context of a worldwidenaval war rather than for the intensive, frontal assaultscenario used to derive the DDGX requirements.
The DDGY would carry the same vertical launching systemand the same missiles, including cruise missiles, as theDDGX. It would be significantly smaller than the DDGX,however, because of the effect of the design trade-offsdiscussed below and because, unlike the DDGX, it wouldnot have space and weight capacity for unspecifiedfuture growth.
In anti-air warfare (AAW), the DDGY would emphasize"back-end" technology and would use an advanced missilefire control system to achieve high firepower at shorterranges. _2/ It would use the advanced SM-2 AAW missile,and would have the long-range area AAW capability ofthat missile. Although this system would probably beless capable, particularly in a jamming environment,than the one proposed for the DDGX or AEGIS, it shouldbe considerably less expensive than AEGIS and much more
JL/ DDGX is now referred to by the Navy as the DDG-51.
2/ The term "back-end" refers to the missile fire-control func-tion of an AAW system as opposed to the search and detection
functions.
105
92-181 0 -

capable than any of the pre-AEGIS AAW systems on exist-ing cruisers and destroyers.
In antisubmarine warfare (ASW), the DDGY emphasizeslong-range passive detection with a towed-array sonarwhereas the DDGX emphasizes active detection using theSQS-53 sonar. The DDGY would also be fitted with anactive sonar, but would utilize the smaller SQS-56rather than the larger, more expensive SQS-53 used bythe DDGX. The DDGY would carry two LAMPS III helicop-ters, which are essential to its long-range ASW orienta-tion and would also provide it with an independentover-the-horizon surveillance and targeting capability.
The DDGY is assumed to have the same propulsion systemas the DDGX; but being a smaller ship, it would be a bitfaster. Its range, however, would be about 10 percentless than that of the DDGX.
Finally, the DDGY would be fitted with a gun and arelatively simple gun fire control system suitable forsurface engagements and shore bombardment. Although agun is unlikely to be useful in a modern battle groupengagement, it could still be vital for independentpatrol and presence operations and for support ofamphibious landings.
Emphasizing long-range towed-array ASW rather thanshorter-range active sonar, carrying its own helicoptersrather than relying upon those from other ships, andmounting a large-caliber gun for antisurface and shorebombardment missions, the DDGY would be better equippedfor independent operations outside of the battle groupthan would the DDGX.
In addition to carrier battle group operations, theDDGY could operate with surface action groups. In thisrole, its aircraft would provide over-the-horizonsurveillance and its towed-array sonar would providelong-range detection of submarines. The DDGY could alsooperate in support of amphibious landings, providing AAWand ASW protection en route and gunfire support duringthe assault. It could also operate with frigates inescorting replenishment ships and convoys, substantiallyincreasing the protection provided. Finally, the DDGYcould operate independently in patrol and presence orocean area control missions.
106

The characteristics of the DDGX and DDGY destroyers andCGN-42 (nuclear) and CG-47 (AEGIS) cruisers are shown in TableE-l, which reproduces Table 3 from the CBO study Naval SurfaceCombatants in the 1990s; Prospects and Possibilities. Thecharacteristics shown for DDGX in the table represent those forthe design baseline of the ship now designated DDG-51 as they weredefined in April 1981. Figure E-l presents simple drawings ofthese four types of ships. Table E-2 illustrates the deriviationof DDGY displacement and cost, using the FFG7 as the baseline.This figure and table reproduce Figure 5 and Table D-2 in theApril 1981 study.
107

TABLE E-l. CHARACTERISTICS OF ALTERNATIVE SHIP TYPES
Displacement (tons)Maximum Speed (knots)Endurance Speed (knots)
NuclearCruiser(CGN-42)
12,00030+
AEGISCruiser(CG-47)
9,1003020
Battle GroupDestroyer(DDGX) a./
6,0002918
Open OceanDestroyer(DDGY) b/
5,0003020
AAW SystemsSearch radar SPY-1Fire control radar 4 MK99Launcher system VLSMissile capacity 122Missile type SM-2
SPY-1 MFAR4 MK99 2 MK99 or 2 Agile BeamVLS VLS122 90SM-2 SM-2
3-D c/2 Agile Beam d/
VLS90SM-2
ASW SystemsTowed-array sonarLAMPS-compatibleNumber of aircraftHull-mounted sonarASW weapons
SQR-19YesTwoSQS-53
SQR-19YesTwoSQS-53
NoneYesNoneSQS-53
SQR-19YesTwoSQS-56
ASROC/MK32 Tubes ASROC/MK32 Tubes ASROC/MK32 Tubes ASROC/MK32 Tubes
ASuW SystemsMissilesGuns
Tomahawk (TASM) Tomahawk (TASM)Two 5"/54 Two 5"/54
Tomahawk (TASM)None
Tomahawk (TASM)One 155mm (6")
Land Attack SystemsMissilesGuns
Tomahawk (TLAM)Two 5"/54
Tomahawk (TLAM)Two 5"/54
Tomahawk (TLAM)None
Tomahawk (TLAM)One 155mm (6")
Estimated Cost(millions of fiscalyear 1982 dollars) $1,340 $1,018 $550 $375
a/ A final decision on the configuration of the DDGX has not yet been made. The charac-teristics listed above may be changed by the Navy as the design process progresses.
b/ For DDGY weight and cost rationale, see Table E-2.
c/ SPS-48E 3-D and SPS-49 2-D air radars as used on the latest U.S. ships supplemented byhorizon and high-elevation search by agile beam fire control radars. Later units mighthave a new-generation air search radar.
d/Agile beam is used here as a generic term that includes such specific concepts as theTerminal Engagement Radar (TER) or Flexible Adaptive Radar (FLEXAR). This system wouldbe capable of simultaneously tracking and engaging multiple targets while supplementingthe air search function in the horizon and zenith areas.

Figure E-1.Four Alternative Ship Types
CGN-42
CG-47
DDGX
DDGY
109

TABLE E-2. DERIVATION OF DDGY DISPLACEMENT AND COST USING FFG-7 AS BASELINE
Feature
AAW System
MissileLauncher
Speed
Gun
Range
Overpressure
FragmentProtection
Differences DisplacementDDGY vs. FFG-7 . Effect (Tons)
New AgileBeam System MK92/STIR +75
SPS-48E No 3-D Radar +75
MK1390-cell VLS Launcher +350
30 knots 28 knots +400
155mm 76mm +20
10 percenthigher — +130
7 psi 3 psi +100
Level I Inherent +160
Total Difference +1,310
Resulting Displacement and Cost Estimate
Cost Effect(Millions of1982 dollars)
+10.0
+10.0
+16.0
+6.6
+5.0
+0.7
+3.3
+5.5
+57.1
Displacement (Tons)FFG-7Difference
DDGY Displacement
Cost (Millions
3,600+1,3104,910
of 1982 Dollars)FFG-7Difference
DDGY Cost
280+57337
110

APPENDIX F. BASIS FOR BUDGET AUTHORITY ESTIMATES FOR OPTIONS ITHROUGH IV
DEFENSE RESOURCES MODEL
With the exception of certain procurement and manpower esti-mates, annual budget authority requirements cited for OptionsI through IV of this paper were generated by the CBO DefenseResources Model (DRM). Designed to provide an unclassifiedestimate of defense costs in the current fiscal year, plus theDefense Department's most recent Five-Year Defense Plan (FYDP),the DRM spans a six-year period. Initial input to the DRM isprogram element data for the first year of the FYDP, reaggregatedinto declassified form. This input is then updated to reflectfinal budget decisions as reflected in Congressional appropria-tions bills. DRM estimates are generally made in constant dollarsbased on the first year of the six-year period covered by themodel. The base year for Options I through IV was fiscal year1982; all figures were converted to fiscal year 1983 budgetdollars, using CBO inflation estimates of January 1982.
OUT-YEAR FORCES
The DRM is structured so that the addition or deletion ofany one force element will not only produce changes in directaccounts of that force element, such as manpower and operationsand maintenance, but also the appropriate support tail. Theseautomatic adjustments are derived from the relationships whichexist in the base year, various factors manuals, and, in the caseof such new weapons systems as the F/A-18 aircraft, specificservice-generated information. As a result of this process, onlycertain procurement data needs to be manually produced.
Assumptions
The most significant assumption made for Options I through IVwas that the relationships that existed among elements in thefiscal year 1982 program would continue into the out-years. SinceDepartment of Defense (DoD) policy with regard to manning levels,
111

operations and maintenance requirements, and support functionscould change, out-year estimates could easily vary over time. Itwas assumed that Navy Research and Development (R&D) would con-tinue at a constant level after 1987. Procurement schedules foraircraft and weapons were based on those used in the March 1981Congressional Data Sheets and September 1981 Selected AcquisitionReports (SAR), if they were different from the former.
Navy/Marine Corps Overlap
Navy and Marine Corps dollars were aggregated to reflectforce interactions; that is, certain Marine Corps expenditureswere included in Navy budget authority for fleet activity andsupport forces. About $0.5 billion fell into this category in1982. Likewise, certain Navy expenditures vary with Marine Corpsforce levels. These variable elements, such as aircraft opera-tions and maintenance and medical personnel, were over $2 billionin 1982. Total Department of the Navy budget authority includesboth Navy and Marine Corps related budget authority.
Procurement
Certain procurement costs were generated by the DRM. Amongthese are cost growth, inflation, and other miscellaneous elementsof the Weapons Procurement, Navy, and Aircraft Procurement, Navy(WPN and APN) accounts, which occur routinely and often vary withforce size. The ratios of these elements to investment costs thatexisted in fiscal year 1982 were assumed to hold for every year ofevery option.
The remaining procurement data was manually derived:
o Figures for Shipbuilding and Conversion, Navy (SCN) werethose presented in detail for each option in Appendixes Athrough D. New construction was assumed to account for 80percent of total SCN. No DRM estimates were used.
o APN requirements varied with the maximum number of car-riers for each option. Existing procurement rates in theMarch 1981 Congressional Data Sheets were assumed adequateto sustain existing force levels, with additional aircraftadded to the end of present total programs in most cases.Fifteen-year service life was used for all aircraft.
112

WPN requirements were assumed to be a function of forcechanges. For example, a one-quarter increase in carrierair wings or combatant ships, would generate a one-quarterincrease in all appropriate WPN systems beyond the totalprograms to be procured in the September 1981 SARs orMarch 1981 Congressional Data Sheets. Ballistic missilesrequirements were determined separately.
113


GLOSSARY


GLOSSARY
AAW; Anti-air warfare.
AE; Ammunition ship.
AEGIS; New anti-air warfare system developed by the Navy.
AFS; Stores ship.
AGOS; Surveillance ship.
AO: Fleet oiler.
APE; Fast combat support ship.
APR: Replenishment oiler.
ARS; Salvage ship.
ASuW; Antisurface warfare.
ASW; Antisubmarine warfare.
BB: Battleship.
CG; Guided missile cruiser.
CGN; Nuclear-powered guided missile cruiser.
CGV; Aviation guided missile cruiser.
CIWS; Close-in Weapon System; also known as "Phalanx".
CV; Conventionally-powered aircraft carrier.
CVN; Nuclear-powered aircraft carrier.
DP; Destroyer.
DDG: Guided missile destroyer.
117

GLOSSARY (Continued)
ECM; Electronic countermeasures.
ECCM; Electronic counter-countermeasures.
FF; Frigate designation.
FFG; Guided missile frigate.
FLEXAR; Flexible adaptive radar.
HARPOON; Intermediate-range antiship cruise missile.
ICW; Interrupted continuous-wave illumination.
LAMPS; Light airborne multipurpose system; specially outfittedhelicopters deployed on surface combatants.
LHA: Amphibious assault ship.
LHP; New-design amphibious assault ship.
LPD; Amphibious transport, dock.
LSD: Landing ship, dock.
LSI; Landing ship, tank
MCM; Mine countermeasure ship.
MFAR; Multi-function array radar.
MK32 Tubes; Torpedo tubes for launching antisubmarine torpedoes.
MK99 Fire Control System; Missile fire control system used withthe AEGIS anti-air warfare system.
MSH; Small minehunting ship.
OTH; Over-the-horizon.
118

GLOSSARY (Continued)
PCW; Pulsed continuous-wave illumination.
SAG; Surface action group.
SM-1; Basic version of the Navy's Standard anti-air missile.
SM-2; Advanced version of the Navy's Standard anti-air missile.
SPY-1; Phased-array air search radar used in the AEGIS anti-airwarfare system.
SQR-19; Designation for a tactical towed-array sonar systemdeployed on surface combatants.
SQS-53; Large, hull-mounted active sonar.
SQS-56; Small, hull-mounted active sonar.
SS; Conventionally-powered attack submarine.
SSN; Nuclear-powered attack submarine.
SSBN; Nuclear-powered ballistic missile submarine.
TACTAS; Tactical towed-array sonar.
TAE; Civilian manned ammunition ship.
TAGOS; Civilian manned surveillance ship.
TASM: Tactical antiship missile.
TER; Terminal engagement radar.
TERCOM; Terrain comparison guidance.
TLAM: Tactical land attack missile.
TOMAHAWK; Long-range cruise missile used against ships (TASM) andland targets (TLAM).
119

GLOSSARY (Continued)
TWS; Track while scan.
VLS; Vertical launching system.
V/STOL; Vertical/short takeoff and landing aircraft,
120
o