build a light intensity logger - emant daq and labview...
TRANSCRIPT

Build a Light Intensity Logger
October 2008 © 2008 Emant Pte Ltd www.emant.com 1

Table of ContentsImportant Note......................................................................................................................................2Learning Objectives..............................................................................................................................3Introduction.......................................................................................................................................... 4Exercise 1 – Using a Computer based Light Intensity Data logger...................................................... 7Exercise 2 – Build a VI and Data Acquisition....................................................................................10Exercise 3 – Loop example and chart.................................................................................................13Create a sub VI................................................................................................................................... 15Exercise 4 – Multiplot Chart and Alarm............................................................................................ 17Exercise 5 – Statistics and Log to file................................................................................................ 20Exercise 6 – Build your Light Intensity Logger (optional exercise)...................................................23Exercise 7 – SARs outbreak............................................................................................................... 25Exercise 8 – Pedestrian Crossing........................................................................................................29Exercise 9 – Improved Airconditioning Control (challenge exercise)............................................... 33
Important Note
The PC must be correctly setup in order for you to complete the exercises in this instructional guide. If you have not setup the Training Kit, please do so using the installation guide and run the diagnostic before proceeding.
This instructional guide had been revised for LabVIEW ver 8 and later.
October 2008 © 2008 Emant Pte Ltd www.emant.com 2

Learning Objectives
Following our step by step Instruction Guide, the user will create a Light Intensity Logger, a SARS detector and Pedestrian Crossing (Traffic Lights). After completion of these exercises, the user would have learnt the following
Sensor / Actuator
• Photodiode• Switch• LED• Thermistor
Data Acquisition (DAQ)
• Analog Input• Analog Output (Current)• Digital Input• Digital Output
LabVIEW • Build VI, sub VI• While Loop• Charts• Clusters• Boolean operations• Arrays• Statistical VIs• Save data to File• Shift Registers• Formula Node
The exercises will take about a day to complete. The additional optional exercises are intended for the faster learners.
October 2008 © 2008 Emant Pte Ltd www.emant.com 3

Introduction
“In problem-based learning, the starting point for learning should be a problem, a query or a puzzle that the learner wishes to solve”
Boud. D, 1995, p.13. Enhancing Learning through Self Assessment
Types of problems that are solved by measuring light intensity
• In photography or film production, creative manipulation of light can create stunning images from a low cost consumer camcorder, while poor lighting will cripple the most expensive, state-of-the-art broadcast camera.
• Light intensity is an important management factor for breeder type poultry. There is evidence suggesting a minimum threshold intensity is needed to obtain optimal reproduction performance.
• The amount of light received by a plant is an important factor, because plants' growth may suffer if they do not receive sufficient light. They may lose their characteristic shape and grow thin, leggy stems. New leaves may also be smaller and turn yellow. Some plants may lose their color or turn dark green. Plants exposed to excessive light, on the other hand, may not flower properly or may turn pale green. Different species of plants require different amounts of light.
Light intensity decreases dramatically with distance from the light source. An object located 15 cm from two 40-watt fluorescent lamps receive about 9300 lux, but only 5400 lux if they are 30 cm from the lamps.
The human eye is a very poor "instrument" for measuring light intensity, because the pupil adjusts constantly in response to the amount of light it receives. To accurately measure the light intensity in a given spot, it is best to use a light meter.
Light intensity may be measured in lux (metric system) or foot-candles (Imperial system). Note that 1 foot-candle = 10.76 lux
To provide some points of reference:
• Full sunlight 11000 lux • Morning sunlight 6000 lux• A bright office has about 400 lux• Moonlight represents about 1 lux
October 2008 © 2008 Emant Pte Ltd www.emant.com 4

A computer based light intensity logger is made up of the following components
• Sensor - a photodiode (BPW34)• Data acquisition module• Computer with programming software (LabVIEW)
The light sensor used is the BPW34. This is a high speed and high sensitive silicon PIN photodiode in a miniature flat plastic package. A photodiode is designed to be responsive to optical input. Due to its waterclear epoxy the device is sensitive to visible and infrared radiation. The large active area combined with a flat case gives a high sensitivity at a wide viewing angle.
Photodiodes can be used in either zero bias or reverse bias. Diodes have extremely high resistance when reverse biased. This resistance is reduced when light of an appropriate frequency shines on the junction. Hence, a reverse biased diode can be used as a light detector by monitoring the current running through it. Coupled to a 10Kohm resistor, and given the specification of the BPW34 a simple relationship between lux (light intensity) and voltage is given by
lux = 1333 * Vo
With the Data Acquisition Module (DAQ module), a regular computer can now be used to measure this voltage. The DAQ module contains an 24-bit ADC (analog to digital converter). During analog to digital conversion, a digital value can correspond to a range of analog values. Any analog signal within the zone of one least significant bit (LSB) will have the same digital value. This error is known as quantization error. The relationship between this error and the bit resolution is given by
error = 1 / 2^n where n is the resolution in bits of the ADC
October 2008 © 2008 Emant Pte Ltd www.emant.com 5

For an 24-bit ADC operating over a 2.5V range, the accuracy you obtain cannot be better than 2.5/16777216 V or 0.15 uV. However due to noise, this is only achievable through careful wiring. In a typical application, a noise floor of about 18 bits or 9 uV is usually achievable.
The DAQ module used (the EMANT300 or EMANT380) has up to 6 differential ADC channels, one 8 bit current DAC channel, 8 digital I/Os and either a 16 bit PWM or a Counter. It is connected to the PC through the USB or bluetooth port of the computer respectively.
The Light Application Adaptor for the EMANT300 has the photodiode BPW34 connected to AIN0 (input analog) of the DAQ module and the resistor connected to AINCOM
LabVIEW is a programming language from National Instruments. It is a graphical language in which the program is drawn rather than written. There is no text-based code like in Basic or C. The program is presented as a diagram with data flow determining the sequence of the program. Scientists and engineers use LabVIEW, as they are already familiar with the schematic way of describing a system function.
In the next few exercises, you will how to combine the Data Acquisition Module, Light Application Adaptor and LabVIEW to create a Light Intensity Data Logger.
Web Resource
www.emant.com Emant Pte Ltd www.ni.com National Instruments
October 2008 © 2008 Emant Pte Ltd www.emant.com 6

Exercise 1 – Using a Computer based Light Intensity Data logger
Objective
To learn how to use a computer based measurement system
Over the next few exercises, you will learn how to use LabVIEW, the Data Acquisition Training kit with a Photodiode to build a Light Intensity Logging System. In this exercise, we will run the final resulting logger called the Light System Demo VI so that you have an idea what we intend to achieve.
1. The DAQ Training Kit comprises either● EMANT300 USB DAQ module or
EMANT380 Bluetooth DAQ module, ● Light Application Adaptor
LabVIEW and NI-VISA library should also been installed and diagnostic program run. If not, STOP and read the installation guide before proceeding with the rest of the exercises.
Convention Note:
All files names are in courier new font Light System Demo.vi
You should have 4 folders.
• Learn DAQ and LabVIEW folder – contains the solution VI to all the exercises• Driver & Example VI folder – contains the EMANT300 driver• Video – contains the instructional videos• Working VI folder – storing the programs that you will create over the next few
exercises.
2. Click on the LabVIEW icon on your desktop to launch LabVIEW.
3. Click the Open… button. The dialog box that appears lists all available LabVIEW VIs. Go to the Learn DAQ and LabVIEW folder and choose Light System Demo.vi. This will open the Light System Demo VI Front Panel.
October 2008 © 2008 Emant Pte Ltd www.emant.com 7
BluetoothDAQ module

Using the Light Intensity Logger
In LabVIEW, the programs are called VI (short for Virtual Instruments). This VI uses the Photodiode on the Light Application Adaptor to measure the light intensity. The result is shown as the value in LUX and a light meter. It also charts the light intensity over time. The update rate is settable from 0 to 2 sec. There is also an alarming function if the light intensity exceeds the set value. The VI also shows basic statistics like Max, Mean and Min light intensity value. The values are calculated only when the VI stops.
4. If you are using the Bluetooth DAQ, do unchecked the Find CheckBox and select the Comm Port as per the outgoing port assigned when you paired the Bluetooth Module.
5. Click to run the VI. 6. Change the ambient light intensity by covering the photodiode with your
hands. Observe how the meter and its associated digital display are able to monitor the changes and report the results in Lux. Alternatively shine a torchlight or other light source onto the photodiode to change the light intensity.
7. A chart is very useful to observe the trend of the light intensity changes. It is very easy to create charts in LabVIEW. There are two plots for this chart – one displaying the measured light intensity (yellow) and the other the Alarm Limit (red).
October 2008 © 2008 Emant Pte Ltd www.emant.com 8

8. For data loggers, it is very common to include alarms whenever limits allowed are exceeded. Use the Operating tool to change the High Limit. You can use the increment or decrement arrows on the control, or drag the pointer to the desired values.
9. If you are using a torchlight to increase the light intensity, set the High Limit above the ambient value. If you are blocking the ambient light, set the High Limit lower. Observe the Limit LED. It changes color when the High Limit is exceeded.
10.You may be logging data from periods as short as minutes to as long as days. Changing the update period (how often the light intensity is measured) is a very common feature. Use the Operating tool to change the Update Period and observe the change. The DAQ card you are using has a maximum acquisition rate of 100 samples/sec so this will limit the lower end of the Update Period.
11.Press to stop the VI. If you are using the USB DAQ, take note of the Comm Port assigned. It is given here.
12.If this data logger were used in a greenhouse, it may be useful to know the maximum and minimum light intensities measured during the measurement period. Statistic functions in LabVIEW allow the user to read off these values. In this example, the results are displayed only when the program ends.
13.Close the VI and do not save changes.
End of Exercise 1
October 2008 © 2008 Emant Pte Ltd www.emant.com 9
Exercise 2 – Build a VI and Data Acquisition
Objective
• Familiarize with the LabVIEW development environment• Build a VI• Learn Analog Input and conversion
Complete the following steps to create a VI that read the voltage across the photodiode and convert it to a light intensity value in Lux.
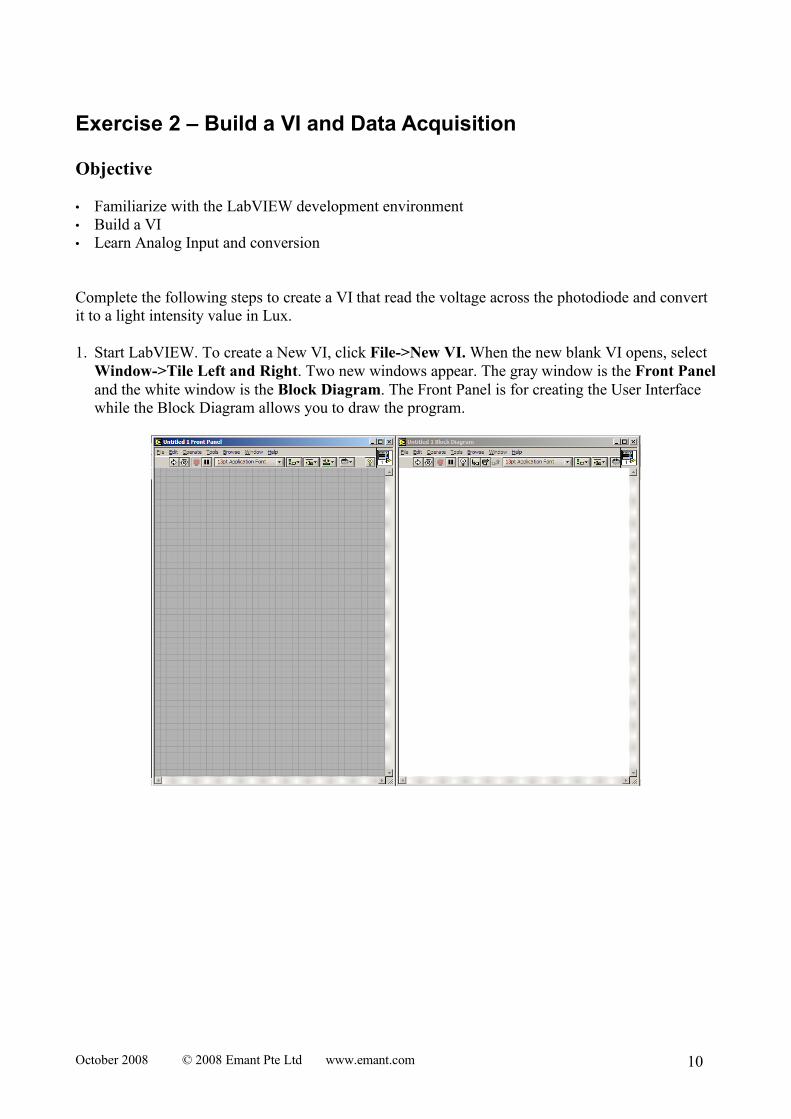
1. Start LabVIEW. To create a New VI, click File->New VI. When the new blank VI opens, select Window->Tile Left and Right. Two new windows appear. The gray window is the Front Panel and the white window is the Block Diagram. The Front Panel is for creating the User Interface while the Block Diagram allows you to draw the program.
October 2008 © 2008 Emant Pte Ltd www.emant.com 10

Before continuing, let’s acquaint ourselves with the tools palette, controls palette and the functions palette. You will have to use these palettes often.
Front Panel
The front panel is the user interface. It should look like the following
October 2008 © 2008 Emant Pte Ltd www.emant.com 11

Block Diagram
Now we will create the following block diagram that reads in the voltage using the DAQ card and converts the voltage to light intensity in Lux (see page 5 for equation).
To learn how to create the Front Panel and Block Diagram, view Ex 2 video. Goto the video folder, open index.html and click on the Ex 2 video link.
The following VI are used.
1. EMANT300 Read Analog.VI from the VI library EMANT300.llb found in the
Driver & Example VI folder. This VI reads the voltage across the 10Kohm resistor.(see page 5 for schematic)
2. EMANT300 Initialisation.VI makes the connection to the DAQ module
3. EMANT300 Close.VI closes the connection to the DAQ module
4. numeric constant from Functions->Programming->Numeric palette
5. Multiply from Functions->Programming->Numeric palette6. Click the Run button to run the VI. Just like in exercise 1, make sure that the com port
setting is correct and click OK. Run the VI several times and shine a torch light to the photodiode to create different light intensity and observe the result
7. Select File->Save Save the VI in the Working VI folder because you will use this VI in subsequent exercises. Name the file Data Acquisition Ex 2.vi Close the VI.
Did you see this instead? It is a Broken Run button. It indicates that the VI cannot run due to errors. When you click on the button, a pop up window will list the errors. Make the corrections until you get the normal Run button.
Important - remember where you save the file as you will need to use it later.
End of Exercise 2
October 2008 © 2008 Emant Pte Ltd www.emant.com 12

Exercise 3 – Loop example and chart
Objective
• Learn how to make repetitive measurements• Learn about charts• Learn how to program timed measurements• Create a sub VI
In the last exercise, you have to repetitively run the program to make different measurements. In this exercise, you will make use of the While Loop to do it. Charts are a great way to display such data as we are able to observe trends.
Front Panel
1. Open your previously saved Data Acquisition Ex 2.vi. You will add controls to arrive at the following front panel.
October 2008 © 2008 Emant Pte Ltd www.emant.com 13

Block Diagram
Complete the diagram as shown
To learn how to create the Front Panel and Block Diagram, view Ex 3 video.
The following VI are used.
1. While Loop from Functions->Programming->Structures palette.From LabVIEW Help
While Loop repeats the subdiagram inside it until the conditional terminal receives a particular Boolean value. The Boolean value depends on the continuation behavior of the While Loop.
To enclose the VIs in a While Loop, click and drag a selection rectangle around the Vis you
want to enclose. Use the Positioning tool to resize the loop, if necessary.
2. Time Delay from Functions->Programming->Timing palette.
When you place this Express VI, a dialog box appears. As we are not using a fixed delay, just click OK. To make the delay time (s) connection appear, move the cursor over the down arrows at the bottom of the Time Delay Express VI. When the double headed arrow appears, click and drag until the Delay Time (s) input appears.
3. Divide from Functions->Programming->Numeric palette
October 2008 © 2008 Emant Pte Ltd www.emant.com 14

4. Numeric Constant from Functions->Programming->Numeric palette. We need to divide the delay by 1000 as the Time Delay Express VI accepts the delay in seconds
5. Click the Run button to run the VI. Run the VI and and observe the result
6. Use the Operating tool to change the Update Period. You can drag the pointer to the desired value.
7. Press to stop the VI.
8. Save the VI. Select File->Save. go to the Working VI folder. Name the file Loop Example Ex 3.vi Close the VI.
Create a sub VI
If you know programming, you should be familiar with the concept of functions or subroutines. In schematic drawings whether electrical, mechanical or civil, if you need to convey a complex drawing the only way to do it is to have a top schematic showing the connections with the major blocks, and leave the details in the schematics of the sub blocks. In LabVIEW the equivalent is called the sub VI.
To learn how to create a sub VI, view Ex 3a video.
October 2008 © 2008 Emant Pte Ltd www.emant.com 15

1. The VIs that reads the analog voltage and converts the voltage to Lux has shrunk into a subVI. The benefit is that in the future if you need to read the light intensity, you just need to insert this subVI into your diagram.
2. Save the VI. Select File->Save. The following dialog box will pop up reminding you that you did not save your subVI.
3. Click OK. Go to the Working VI folder. Name the subVI Lux.vi4. Close the VI.
Note: In this exercise, you have created two VIs.
• Top level VI called Loop Example Ex 3.vi • SubVI called Lux.vi
End of Exercise 3
October 2008 © 2008 Emant Pte Ltd www.emant.com 16

Exercise 4 – Multiplot Chart and Alarm
Objective
• Learn how to plot multiple values• Learn about Boolean Comparison• Learn about Clusters
In the last exercise, you learnt how to create a trend chart with user defined delays. Many times, you would like the program to warn the user if certain threshold are reached. In our example, plants exposed to excessive light may not flower properly or may turn pale green.
You may also want to compare the measured intensity with the threshold value over time. In such instances, a multi plot chart is useful. In this exercise, you will build on the previous exercise to add the alarm and multiple plots to the chart.
Front Panel
1. Open an existing VI. Look for Loop Example Ex 3.vi you saved previously. Modify it to the following front panel.
2. Insert Square LED from Control->Modern->Boolean palette. Name it Alarm
3. Insert Numeric Knob from Control->Modern->Numeric palette. Name it Limit. Change the range to 1000. Click on 10 and enter 1000
October 2008 © 2008 Emant Pte Ltd www.emant.com 17

4. Extend the Plot Legend to show two plots and change the second plot label to Limit.
Move the cursor over middle and bottom of the Plot Legend. When the double headed arrow appears, click and drag until the second plot legend appears. Click on the label to change it to Limit
Block Diagram
1. Select Window->Show Diagram to display the block diagram. Complete the diagram as shown
2. Align the subVI you created in the previous exercise Lux.vi with the Initialise.vi and Close.vi
3. Insert Greater? from Functions->Programming->Comparison palette. When the measured value is greater than the set limit, the Alarm LED changes state
4. Insert Bundle from Functions->Programming->Cluster palette.
From LabVIEW Help
Clusters group data elements of mixed types, such as a bundle of wires, as in a telephone cable, where each wire in the cable represents a different element of the cluster.
5. In this VI, it helps to group both the measured value and the limit onto the same chart
6. Finally, use the Wiring tool from the Tools Palette to wire the icons as shown in the above block diagram.
7. Go back to the Front Panel
October 2008 © 2008 Emant Pte Ltd www.emant.com 18

8. Click the Run button to run the VI. Use the Operating tool to change the Limit. You can drag the knob to the desired value. Shine a torch light to the LDR to create different light intensity and observe the result
9. Press to stop the VI.10.Save the VI. Select File->Save. Call the file Multiplot Chart and Alarm Ex 4.vi
Close the VI.
End of Exercise 4
October 2008 © 2008 Emant Pte Ltd www.emant.com 19

Exercise 5 – Statistics and Log to file
Objective
• Learn about arrays• Learn how to use the statistical VIs• Learn how to save the data to a file
It is often useful to know the maximum, minimum and average light intensity that has been logged. You will also have noticed that once you stop the VI, the data is lost when you run the VI again. Wouldn’t it be useful if the information can be saved into a file so that you can analyze the data in the future?
From LabVIEW Help
An Array group data elements of the same type. An array consists of elements and dimensions. Elements are the data that make up the array. A dimension is the length of an array. An array can have one or more dimensions..
Front Panel
1. Open an existing VI. Look for Multiplot Chart and Alarm Ex 3.vi you saved previously. Modify it to the following front panel.
2. Insert Numeric Indicator from Control->Modern->Numeric palette. Insert 4 of these indicators. Name them Current Data Point, Max value, Mean and Min value.
October 2008 © 2008 Emant Pte Ltd www.emant.com 20

Block Diagram
1. Select Window->Show Diagram to display the block diagram. Complete the diagram as shown
When the loop is exits, the mean, max and min light intensity values are calculated. At the same time, the data is saved to a file.
2. Insert Mean from Functions->Mathematics->Mathematics-> Probability & Statistics palette. This VI returns the average of the light intensity measurements from an array of light intensity values.
3. Insert Array Max & Min from Functions->Programming->Array palette. This VI returns the maximum and minimum light intensity from an array of light intensity values.
4. Insert the Write LabVIEW Measurements File Express VI from Function->Programming->File I/O palette.
When you connect a wire to the Signals input, the Convert to Dynamic Data function will be added into the wire automatically.
5. Use the Wiring tool from the Tools Palette to wire the icons as shown in the above block diagram.
6. When you try to wire the output of Data Acquisition VI to the input of the Mean VI, you will get a wiring error. This is because the output is a single value whereas the input requires an array. To
October 2008 © 2008 Emant Pte Ltd www.emant.com 21

resolve this, click on the terminal shown below and select Enable Indexing. This will cause the single values to accumulate to form an array when the loop exits.
7. When you have completed all the wiring, save the VI as Statistics and Log to File Ex 5.vi.
8. Go back to the Front Panel. Click the Run button to run the VI. Cover the photodiode to change the light intensity and observe the result
9. Press to stop the VI. A dialog box will appear. Enter the name of the file to save the spreadsheet.
10.You may now use Notepad to open the spreadsheet file saved. This is in the CSV format that can be read by text editors and spreadsheet programs like Excel.
11.Go to the Learn DAQ and LabVIEW folder and open the VI called Read LVM File Ex 5a.vi Run the program first and then look at the diagram to see what is required to read back and display logged data.
12.Close the VI. Do not save.
End of Exercise 5
October 2008 © 2008 Emant Pte Ltd www.emant.com 22

Exercise 6 – Build your Light Intensity Logger (optional exercise)
Objective
• Learn Decoration controls
You will now use your knowledge of LabVIEW and Data Acquisition learnt from the previous exercises to build the data logger that you ran in Exercise 1.
Front Panel
1. Open a new VI. Build the following front panel.
Hint: To beautify the front panel use the Control->Modern->Decorations palette and the coloring Tool from the Tool Palette
Block Diagram
2. Build the diagram on your own. If you run into difficulties, refer to the previous exercises or the LabVIEW Help. As a last resort, you can refer to the Light System Demo.vi
3. When you have completed the diagram, save the VI as My Light System Demo.vi
October 2008 © 2008 Emant Pte Ltd www.emant.com 23
4. Click the Run button to run the VI and observe the results.
5. Press to stop the VI.6. Close the VI.
End of Exercise 6
October 2008 © 2008 Emant Pte Ltd www.emant.com 24

Exercise 7 – SARs outbreakObjective
• Learn Formula Node• Learn Analog Output (Current)• Learn how the Thermistor measures temperature
Problem
Severe acute respiratory syndrome (SARS) is a respiratory or airways infection that broke out in Asia in early 2003. It is highly infectious and death from the disease is not uncommon. Fever is one of the first signs of SARS. On June 1, 2003, in Taiwan, a National Temperature Monitoring Campaign was launched. In the campaign, fever was defined as forehead or axillary temperature >37°C. You have been tasked to create a fever detector.
SolutionWarning: This is intended as proof of concept exercise and not intended for real life use.
A thermistor will be used to measure the forehead temperature. Thermistors are widely used in industrial applications because of their sensitivity, small size, ruggedness and low cost. Thermistors have an electrical resistance that varies non-linearly with temperature. The R-T characteristics of most thermistors can be described by the Steinhart-Hart equation:
1/T = A + B*(Ln R) + C*(Ln R)3
T is the absolute temperature (in Kelvin) and A, B, and C are constants which can be determined by measuring three sets of resistance and temperature values during calibration.
Most thermistors have a negative temperature coefficient (NTC), their resistance decreases with increasing temperature. Thermistors are specified according to its nominal resistance at 25 oC and commonly available thermistors range from 250 ohms to 100 kohms
The thermistor that we are using has the following characteristics
• Nominal resistance @ 25 oC: 10 kohms• negative temperature coefficient (NTC)• Steinhart-Hart equation parameters:
• A= 0.001129148 • B= 0.000234125 • C= 8.76741E-8
As the DAQ module Analog Input measures only voltage, we will need to provide a current source to convert the resistance to voltage. The EMANT300 has an 8 bit current DAC (digital to analog converter). As the DAC has 8 bits resolution, we can drive the resistance from 0 to 1mA in 255 steps with increments of about 39uA.
October 2008 © 2008 Emant Pte Ltd www.emant.com 25

• Connect the thermistor to the Light Application Adaptor screw terminals labeled IDAC and AGND
• Connect a wire from IDAC to AIN3• Connect a wire from AGND to AIN2
Front Panel
Open a new VI. Build the following front panel.
1. Insert Stop Button from Control->Modern->Boolean palette
2. Insert Numeric Indicator from Control->Modern->Numeric palette. Name it Thermistor Resistance
3. Insert Thermometer Control from Control->Modern->Numeric palette. Right mouse click on the thermometer and select Visible Items->Digital Display to enable the numeric indicator associated with the thermometer.
October 2008 © 2008 Emant Pte Ltd www.emant.com 26

Block Diagram
Select Window->Show Diagram to display the block diagram. Complete the diagram as shown
4. From the VI library EMANT300.llb found in the Driver & Example VI folder., insert the EMANT300 Write IDAC.VI This VI sets the current of the 8 bit current
DAC
5. Insert Formula Node from Functions->Programming->Structures palette.
A Formula Node evaluates mathematical formulae and expressions similar to C on the block diagram. This is useful if the mathematics is quite involved and is clearer when implemented in text form rather than in a graphical manner.
To create an input, use the position tool, right click on the left border of the Formula node. Select Add input from the popup menu. Name it Vo. Next right click on the right border of the Formula node. Select Add output from the popup menu. Name it T. Add all the other nodes shown in the diagram. Finally select the Text tool and click on the Formula Node to enter the following formula
Rt = Vo/(i*0.001);T = 1/ (a + ln(Rt)*(b + c*(ln(Rt)**2)));C = T – 273.15;
The first line calculates the Thermistor resistance. The next line converts from resistance to temperature in Kelvin and finally converts the temperature from Kelvin to Centigrade.
8. Insert Numeric Constant from Functions->Programming->Numeric palette. Do the same for the remaining Numeric Constants
October 2008 © 2008 Emant Pte Ltd www.emant.com 27

9. Go back to the Front Panel
10.Click the Run button to run the VI. Use the Operating tool to change the High and Low Threshold.
• Observe the ambient temperature• Use your finger to touch the thermistor. The temperature should change to reflect the
higher temperature of your body.
14.Press to stop the VI.
15.Save the VI. Select File->Save. Call the file SARs and Thermistor.vi Close the VI.
End of Exercise 7
Additional Exercises
1. In the US, Fahrenheit is a more common unit of temperature measurement. Modify the VI to allow the user to select the reading in oF or oC.
2. Modify the VI to reflect a temperature limit has been exceeded.3. It has been found that some people have a normally higher body temperature and therefore a rise
in body temperature is a more appropriate indication of fever. Implement this in your program.
October 2008 © 2008 Emant Pte Ltd www.emant.com 28

Exercise 8 – Pedestrian Crossing
Objective• Learn digital input• Learn digital output• Learn shift registers
Problem
The principal decided to prototype a pedestrian crossing outside the school that is controlled by a computer. He envision a system where eventually the lights can be activated from the office, via internet or SMS. As a first part of the project, you have been tasked to develop a basic crossing solution.
The lights will stay green until the button is pressed. When the button is pressed, the lights changed to yellow and then red and then back to green.
Solution
Front Panel
Open a new VI. Build the following front panel. It comprises just the STOP switch
Block Diagram
Select Window->Show Diagram to display the block diagram. Complete the diagram as shown
October 2008 © 2008 Emant Pte Ltd www.emant.com 29

The Light Application Adaptor has a Red, Yellow, Green LED and switch connected as shown
6. From the EMANT300.llb VI library found in the Driver & Example VI folder, insert the EMANT300 Config DIO.VI This VI sets the configuration of the DIO. 8
bits (1 byte) determines the direction of the digital IO. Specifying the corresponding bit as 1 configures that bit as input and 0 as output. Since D0 – D2 (see above schematic) are outputs and D3 is an input we set the configuration byte to binary 0000 1000
7. From the same VI library, insert the EMANT300 Write Digital Bit.VI Set the bit
address and the bit state to drive the output accordling. Therefore, if we are interested to light up the Red LED then we set bit address=2 and bit state=F. When D2 output is low, current flows through the diode limited by the 220 ohm resistor to turn on the LED. Conversely, when output is high, the LED if off.
8. Insert the EMANT300 Read Digital Bit.VI to read the state of the switch. As the
switch is connected to D3, we set the bit address=3. When the switch is open, an internal pull up resistor at the input pulls the voltage to 5V and therefore the VI will return T. If the switch is closed, the VI returns F.
9. Insert Shift Register
Right-click the left or right border of the While loop and select Add Shift Register from the shortcut menu. To add the second element, right click on the left shift register and select Add Element
October 2008 © 2008 Emant Pte Ltd www.emant.com 30

From LabVIEW Help
Use shift registers on For Loops and While Loops to transfer values from one loop iteration to the next. You can create multiple shift register terminals on the left side of a loop to remember more than one previous value.
The Shift register is unique to LabVIEW because it is a graphical programming language and dataflow determines the sequence of the program. Without the shift register, it would be impossible for previous values in a loop to be stored and used in subsequent iterations.
In our solution, the shift register is used to store the state of the lighted LED. In normal operation, the switch is not closed and the Green LED is turned on. This means that D0 = T, D3 = T and the right shift register is T.
iteration n-2 n-1 n n+1 n+2 n+3 n+4right shift register T T F T T T T
D1 T T T F T T TD2 T T T T F T TD0 F F F T T F FD3 T T F X X T T
Suppose at iteration n, the switch is closed. The 2 subsequent iterations see the F state cascaded to the left shift registers and D1, D2. D0, the Green light will be lighted up only when both the Red and Yellow LEDs are off as the result of the NAND operation.
13.Insert Nand from Functions->Programming->Boolean palette
14.Insert Or from Functions->Programming->Boolean palette
15.Insert Time Delay from Functions->Programming->Timing palette. Set the delay to 0.5s
16.Insert numeric constants from Functions -> Programming->Numeric palette.
After inserting the constant, right mouse click on it. When the pop up menu appears, select Properties. To make the representation as binary rather than the default decimal, first in the Appearance Tab, select show Radix.
October 2008 © 2008 Emant Pte Ltd www.emant.com 31
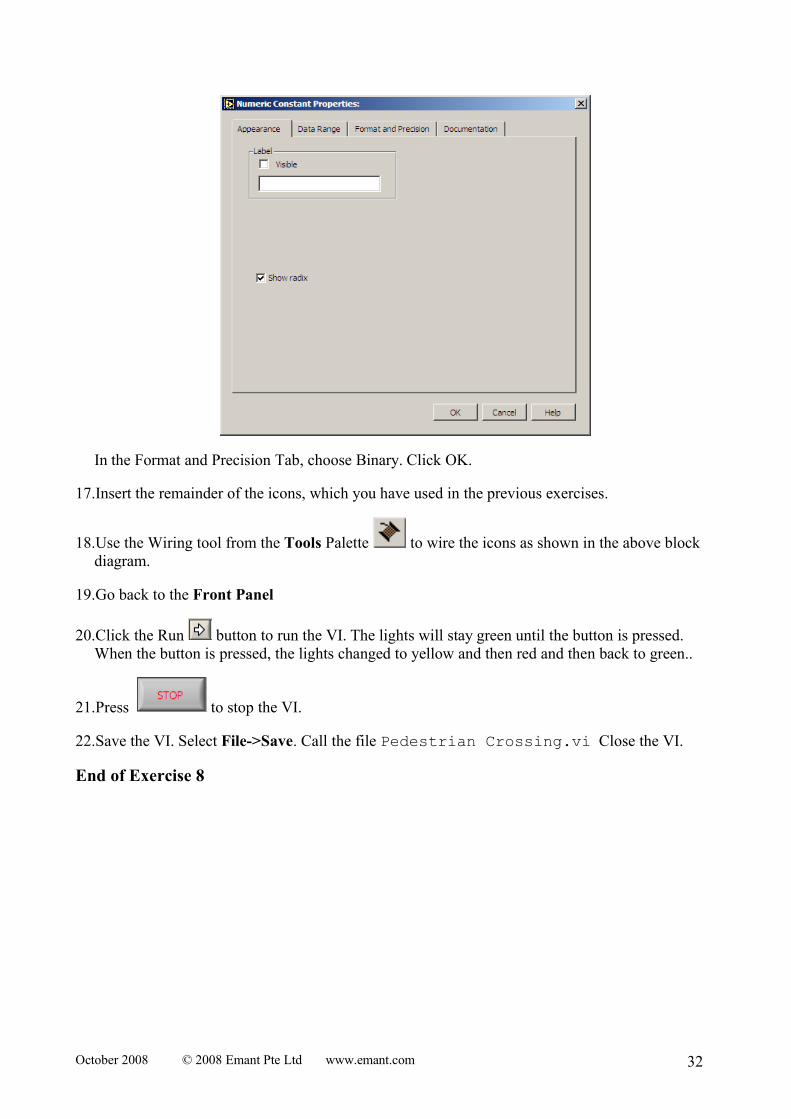
In the Format and Precision Tab, choose Binary. Click OK.
17.Insert the remainder of the icons, which you have used in the previous exercises.
18.Use the Wiring tool from the Tools Palette to wire the icons as shown in the above block diagram.
19.Go back to the Front Panel
20.Click the Run button to run the VI. The lights will stay green until the button is pressed. When the button is pressed, the lights changed to yellow and then red and then back to green..
21.Press to stop the VI.
22.Save the VI. Select File->Save. Call the file Pedestrian Crossing.vi Close the VI.
End of Exercise 8
October 2008 © 2008 Emant Pte Ltd www.emant.com 32
Exercise 9 – Improved Airconditioning Control (challenge exercise)
ObjectiveReinforce understanding of• analog input• analog output• sub VI• digital output
Problem
With the rising oil prices, price for electricity has risen too. To reduce electricity consumption, Jeffrey wants his room air conditioning to operate only when he is sleeping at night and when the temperature exceeds a preset temperature.
Write a LabVIEW VI that meets Jeffrey’s requirement. Use the Green LED to represent the air conditioning turning on and off.
Tips:
• Use the Lux subvi you have created• Create a Temperature sub VI from the Thermistor Exercise.• Use the digital VI from the Pedestrian Exercise to turn on and off the LED.
End of Exercise 9
October 2008 © 2008 Emant Pte Ltd www.emant.com 33