buenaventura announces fourth quarter and full year … · gold production at orcopampa decreased...
TRANSCRIPT

Buenaventura Announces Fourth Quarter and Full Year 2015 Results
Lima, Peru, February 25, 2016 – Compañia de Minas Buenaventura S.A.A. (“Buenaventura” or “the Company”) (NYSE: BVN; Lima Stock Exchange: BUE.LM), Peru’s largest publicly-traded precious metals mining company, announced today results for the fourth quarter (4Q15) and twelve month (“2015”) periods ended December 31,2015. All figures have been prepared in accordance with IFRS (International Financial Reporting Standards) on a non GAAP basis and are stated in U.S. dollars (US$). Fourth Quarter 2015 Highlights:
• In 4Q15, EBITDA from direct operations was US$16.0 million and adjusted EBITDA (including associated companies) was US$72.6 million.
• Total attributable production in 4Q15 was 182k gold ounces and 6.5 million silver ounces (compared to 245k gold ounces and 5.5 million silver ounces in 4Q14).
• Full year 2015 attributable production was 759k gold ounces and 22.3 million silver ounces (compared to 846k gold ounces and 19.7 million silver ounces in 2014).
• Gold production from direct operations will increase in 2017, once Tambomayo starts operating at full capacity (Tambomayo will add 150-170k gold ounces).
• The Tambomayo project is in line with budget. Civil works are at 30% progress, exploration and development at 80%. Production ramping up is expected by 4Q16.
• Silver production in 2015 was in line with the guidance provided, despite one month strike at Uchucchacua mine.
• During 4Q15, El Brocal reached full production capacity level of 18K TPD. • Cerro Verde’s plant expansion project (from 120k TPD to 360K TPD) was
completed in 4Q15. Expected production for 2016 is 550k – 600k TM. • Yanacocha will distribute dividends of US$300 million in March 2016 (BVN will
receive its equity share of US$130 million).
Financial Highlights (in millions of US$, except EPS figures):
4Q15 4Q14 Var% FY15 FY14 Var%
Total Revenues 234.7 276.5 -15% 951.9 1,175.8 -19%
Operating Profit -55.1 -18.3 201% -149.8 61.6 N.A.
EBITDA Direct Operations
16.0 35.3 -55% 105.2 274.1 -62%
Adjusted EBITDA (Inc Associates)
72.6 181.5 -60% 378.1 672.0 -44%
Net Income -292.6 -161.4 81% -317.2 -76.1 317%
EPS** -1.15 -0.63 81% -1.25 -0.30 317%
(*) Includes deferred income tax write-off from Yanacocha of US$-223 million. (**) as of December 31, 2015 Buenaventura had 254,186,867 outstanding shares.
Visit our website:
http://www.buenaventura.com
Contacts in Lima:
Carlos Galvez, Chief Financial Officer
Tel: (511) 419-2540
Daniel Dominguez, Director of Treasury
and Investor Relations
Tel: (511) 419-2591
Email:
Contacts in New York:
Maria Barona / Rafael Borja
i-advize Corporate Communications
Tel: (212) 406-3691/3693
Email: [email protected]

Compañía de Minas Buenaventura S.A.A. Third Quarter and Nine-Month 2015 Results
Page 2 of 24
During 4Q15, net sales were US$227.5 million, a 14% decrease compared to the US$264.6 million reported in 4Q14. This was mainly explained by the decrease in metal prices as well as lower gold and copper volume sold. Royalty income decreased 39%, to US$7.2 million in 4Q15 compared to the US$11.9 reported in 4Q14. This was due to lower revenues at Yanacocha (32% lower QoQ).
Operating Highlights 4Q15 4Q14 Var% FY15 FY14 Var%
Net Sales (in millions of US$)
227.5 264.6 -14% 919.5 1,138.9 -19%
Average Realized Gold Price (US$/oz) 1 2
1,093 1,192 -8% 1,151 1,263 -9%
Average Realized Gold Price (US$/oz) inc. Affiliates 3
1,096 1,194 -8% 1,154 1,258 -8%
Average Realized Silver Price (US$/oz) 1 2
14.46 15.76 -8% 15.06 18.65 -19%
Average Realized Lead Price (US$/MT) 1 2
1,665 1,994 -16% 1,712 2,107 -19%
Average Realized Zinc Price (US$/MT) 1 2
1,447 2,240 -35% 1,839 2,244 -18%
Average Realized Copper Price (US$/MT) 1 2
4,332 6,591 -34% 4,515 6,738 -33%
Volume Sold 4Q15 4Q14 Var% FY15 FY14 Var%
Gold Oz Direct Operations 1
93,352 102,043 -9% 380,899 436,257 -13%
Gold Oz inc Associated Companies 3
207,701 260,810 -20% 841,818 914,627 -8%
Silver Oz 1 6,575,608 5,075,656 30% 21,023,873 19,045,010 10%
Lead MT 1 10,302 5,470 88% 32,389 18,599 74%
Zinc MT 1 16,087 9,961 62% 55,529 20,904 166%
Copper MT 1 9,176 10,451 -12% 29,094 40,263 -28%
(1) Buenaventura’s Direct Operations includes 100% of Buenaventura’s operating units, 100% of La Zanja and
100% of El Brocal (2) The realized price considers the adjustments of quotational periods (3) Considers 100% of Buenaventura’s operating units, 100% of La Zanja, 100% of El Brocal, 40.95% of
Coimolache and 43.65% of Yanacocha
For 2015, net sales decreased 19%, from US$1,138.9 million in 2014 to US$919.5 million in 2015. Royalty income for 2015 was US$32.4 million (US$36.9 million in 2014).
Operating Revenues

Compañía de Minas Buenaventura S.A.A. Third Quarter and Nine-Month 2015 Results
Page 3 of 24
In 4Q15, Buenaventura’s gold equity production from direct operations decreased 14%, from 104,166 ounces in 4Q14 to 90,034 ounces in 4Q15 due to the decline in production at Breapampa mine (no production in 4Q15 vs 13,178 gold ounces in 4Q14). Gold production including associated companies in 4Q15 was 182,247 ounces, 26% lower than the reported in the same period 2014, explained by a decrease in production from Yanacocha. Silver equity production from direct operations increased 14%, mainly due to higher production at Uchucchacua mine (13.9 million silver ounces in 2015 vs 12.1 million silver ounces in 2014).
Orcopampa’s (100% owned by Buenaventura)
Production
4Q15 4Q14 Var % FY 2015 FY 2014 Var %
Gold Oz 48,606 54,878 -11% 204,629 203,226 1%
Silver Oz 170,254 143,925 18% 562,795 423,148 33%
Cost Applicable to Sales
4Q15 4Q14 Var % FY 2015 FY 2014 Var %
Gold US$/Oz 693 697 -1% 680 777 -12% Gold production at Orcopampa decreased 11% in 4Q15 (compared to 4Q14) due to lower ore grade (Appendix 2). Cost Applicable to Sales (CAS) in 4Q15 was US$ 693/oz of gold, in line with the Cost Applicable to Sales (CAS) reported in 4Q14. Gold production guidance for 2016 is 200k – 210k ounces.
1 Direct Operation production includes 100% of Buenaventura’s operating units, 53.06% of La Zanja, 54.07% of El Brocal and 40.10% of Coimolache.
Equity Production 4Q15 4Q14 Var% FY15 FY14 Var%
Gold Oz Direct Operations1 90,034 104,166 -14% 358,003 422,135 -15%
Gold Oz including Associated Companies
182,247 244,854 -26% 758,575 845,515 -10%
Silver Oz Direct Operations1 6,314,489 5,350,072 18% 21,740,350 19,074,255 14%
Silver Oz including Associated Companies
6,506,921 5,491,990 18% 22,325,087 19,659,822 14%
Lead MT 8,779 6,012 46% 28,476 20,227 41%
Zinc MT 12,642 8,509 49% 43,750 22,038 99%
Copper MT Direct Operations1 5,034 5,886 -14% 17,674 23,678 -25%
Copper MT including Associated Companies
23,757 16,851 41% 66,032 68,106 -3%
Production and Operating Costs

Compañía de Minas Buenaventura S.A.A. Third Quarter and Nine-Month 2015 Results
Page 4 of 24
Uchucchacua (100% owned by Buenaventura)
Production
4Q15 4Q14 Var % FY 2015 FY 2014 Var %
Silver Oz 4,118,509 3,395,628 21% 13,919,922 12,055,570 15%
Zinc MT 1,602 1,504 6% 5,692 6,349 -10%
Lead MT 2,565 2,086 23% 8,433 7,605 11%
Cost Applicable to Sales
4Q15 4Q14 Var % FY 2015 FY 2014 Var %
Silver US$/Oz 12.97 14.99 -13% 13.97 16.34 -15% Silver production in 4Q15 increased 21% compared to 4Q14, due to higher ore treated and higher ore grade (Appendix 2). Cost Applicable to Sales (CAS) in 4Q15 decreased 13% compared to 4Q14, mainly explained by lower labor cost due to higher exchange rate, lower consumable costs (explosive materials), reagents costs and more silver ounces sold (4.1 million silver ounces in 4Q15 compared to 3.2 million silver ounces in 4Q14). Silver production guidance for 2016 is 15.5 million – 16.5 million ounces. Mallay (100% owned by Buenaventura)
Production
4Q15 4Q14 Var % FY 2015 FY 2014 Var %
Silver Oz 357,236 309,213 16% 1,285,361 1,216,034 6%
Zinc MT 2,407 2,333 3% 9,173 9,893 -7%
Lead MT 1,841 1,876 -2% 7,193 7,513 -4%
Cost Applicable to Sales
4Q15 4Q14 Var % FY 2015 FY 2014 Var %
Silver US$/Oz 13.77 12.80 8% 13.90 13.76 1% Silver production in 4Q15 increased 16% compared to 4Q14, due to higher ore treated (Appendix 2). Cost Applicable to Sales (CAS) in 4Q15 was 8% higher compared to 4Q14 due to lower by-product contribution. Silver production guidance for 2016 is 1.5 million – 1.9 million ounces. Julcani (100% owned by Buenaventura)
Production
4Q15 4Q14 Var % FY 2015 FY 2014 Var %
Silver Oz 868,662 782,652 11% 3,266,453 3,084,347 6%
Cost Applicable to Sales
4Q15 4Q14 Var % FY 2015 FY 2014 Var %
Silver US$/Oz 11.32 13.97 -19% 12.30 14.14 -13% Silver production in 4Q15 increased 11% compared to 4Q14 production, due to higher ore treated and higher ore grade (Appendix 2). Cost Applicable to Sales (CAS) in 4Q15 was 19% lower than 4Q14, mainly explained by lower labor cost expenses due to higher exchange rate and lower contractors costs due to fewer meters drifted (11% lower).

Compañía de Minas Buenaventura S.A.A. Third Quarter and Nine-Month 2015 Results
Page 5 of 24
Silver production guidance for 2016 is 3.0 million – 3.4 million ounces. La Zanja (53.06% owned by Buenaventura)
Production
4Q15 4Q14 Var % FY 2015 FY 2014 Var %
Gold Oz 37,709 34,808 8% 141,071 143,573 -2%
Silver Oz 89,111 82,594 8% 331,080 422,395 -22%
Cost Applicable to Sales
4Q15 4Q14 Var % FY 2015 FY 2014 Var %
Gold US$/Oz 832 703 18% 789 569 39% Gold production in 4Q15 increased 8% compared to 4Q14. CAS in 4Q15 increased 18% compared to 4Q14, mainly explained by higher ore treated and lower ore grade (0.88 Au g/MT in 4Q14 compared to 0.63 Au g/MT in 4Q15). Gold production guidance for 2016 is 130k – 140k ounces. Tantahuatay (40.10% owned by Buenaventura)
Production
4Q15 4Q14 Var % FY 2015 FY 2014 Var %
Gold Oz 47,697 38,558 24% 144,782 143,643 1%
Silver Oz 281,440 227,131 24% 879,832 754,357 17%
Cost Applicable to Sales
4Q15 4Q15 Var % FY 2015 FY 2014 Var %
Gold US$/Oz 388 475 -18% 489 455 7% Gold production in 4Q15 increased 24% compared to the figure reported in 4Q14. CAS in 4Q15 decreased 18% compared to 4Q14 mainly due to higher ore grade (0.54 Au g/MT in 4Q14 compared to 0.66 Au g/MT in 4Q15) from Cienaga Norte mine. Gold production guidance for 2016 is 140k – 150k ounces El Brocal (54.07%* owned by Buenaventura)
Production
4Q15 4Q15 Var % FY 2015 FY 2014 Var %
Copper MT 9,165 10,749 -15% 32,061 43,282 -26%
Zinc MT 15,966 8,640 85% 53,319 10,162 425%
Silver Oz 1,183,101 921,625 28% 3,669,500 2,501,839 47%
Cost Applicable to Sales
4Q15 4Q15 Var % FY 2015 FY 2014 Var %
Copper US$/MT 5,456 5,499 -1% 5,322 5,096 4%
Zinc US$/MT 1,444 1,321 9% 1,601 1,369 17% During 4Q15, Copper production decreased 15% compared to 4Q14, due to a lower recovery rate. Moreover, in 4Q15 zinc production increased 85% due to higher ore treated, despite the lower grade. (*) Since January 2016, the new ownership of El Brocal is 56.29%.

Compañía de Minas Buenaventura S.A.A. Third Quarter and Nine-Month 2015 Results
Page 6 of 24
In 4Q15, Zinc CAS increased 9% compared to 4Q14 mainly due to higher selling expenses. Copper CAS in 4Q15 was in line with the CAS reported in 4Q14. Zinc production guidance for 2016 is 60k – 70k MT, while copper production guidance for 2016 is 35k – 45k MT.
General and administrative expenses in 4Q15 were US$25.8million, 9% lower compared to the US$28.4 million in 4Q14 figure. This is mainly due to lower third-party services. For 2015, the expense was US$86.5 million (US$101.1 million in 2014).
Exploration in non-operating areas during 4Q15 was US$5.0 million compared with the US$17.6 million in 4Q14. During the period, Buenaventura’s main exploration efforts were focused on the Tambomayo project (US$3.5 million) and Marcapunta (US$0.6 million). For 2015, the expense was US$30.6 million (US$50.0 million in 2014).
During 4Q15, Buenaventura’s share in associated companies was negative US$235.0 million, compared to negative US$113.8 million reported in 4Q14, composed by:
YANACOCHA At Yanacocha (43.65% owned by Buenaventura), during 4Q15, gold production was 211,256 ounces, 34% lower than 4Q14 production (322,309 ounces). For 2015, gold production was 917,690 ounces, 5% lower than 969,944 ounces in 2014. Gold production guidance at Yanacocha for 2016 is 600k – 650k ounces. In 4Q15, Yanacocha reported net loss of US$547.4 million compared to a net loss of US$380.3 million reported in 4Q14 (Includes deferred income tax of US$510 million). CAS in 4Q15 was US$747/oz, 75% higher than the US$426/oz reported in 4Q14 mainly due to: i) a higher inventory write-down (US$34.7 million in 4Q15 compared to US$11.1 million in 4Q14), and ii) lower volume sold (216,733 gold ounces in 4Q15 vs 327,278 gold ounces in 4Q14). Capital expenditures at Yanacocha were US$37.3 million in 4Q15, while for 2015 was US$96.2 million. Yanacocha still has a strong pipeline of growth projects: Quecher Main (prefeasibility), Chaquicocha Sulphides and Yanacocha Verde (scoping) and Maqui Maqui (exploration).
Share in the Result of Associates (in millions of US$) 4Q15 4Q14 Var % FY 2015 FY 2014 Var %
Cerro Verde -2.6 20.8 N.A. 6.5 77.9 -92%
Coimolache 6.5 5.0 30% 16.6 22.3 -25%
Yanacocha -238.9 -139.7 71% -196.5 -174.7 12%
Total -235.0 -113.8 106% -173.4 -74.6 132%
General and Administrative Expenses
Share in Associated Companies
Exploration in Non-Operating Areas

Compañía de Minas Buenaventura S.A.A. Third Quarter and Nine-Month 2015 Results
Page 7 of 24
CERRO VERDE At Cerro Verde (19.58% owned by Buenaventura), during 4Q15 copper production was 95,619 MT (18,722 MT attributable to Buenaventura), a 71% increase compared to 4Q14 (56,001 MT and 10,965 MT attributable to Buenaventura). For 2015, copper production was 246,973 MT (48,357 MT attributable to Buenaventura). During 4Q15, Cerro Verde reported a net loss of US$13.2 million compared to net profit of US$55.9 million in 4Q14. This was mainly due to a higher depreciation (related to the new concentrate plant) and a higher net loss from currency exchange difference, despite of the 71% increase in volume sold. For 2015, net income was US$33.3 million (compared to US$377.6 million in 2014). Capital expenditures at Cerro Verde were US$274.1 million in 4Q15, and US$1,595.6 million in 2015. Cerro Verde’s plant expansion was completed, in-line with schedule and budget (US$4.6 billion). It became the largest concentration facility (360K TPD) in the world and full plant capacity is expected to be reached in 1Q16. Copper production guidance at Cerro Verde for 2016 is 550k MT – 600k MT. COIMOLACHE (Tantahuatay operation) At Coimolache (40.10% owned by Buenaventura), attributable contribution to the net income in 4Q15 was US$6.5 million (US$5.0 million in 4Q14). For 2015, the contribution was US$16.6 million, compared to US$22.3 million reported in 2015.
The Tambomayo Project (100% ownership) • Detail engineering currently at 100% of development • Civil works are at 30% of progress (expected to be completed in 3Q16) • 100% of mayor equipment has been purchased (80% arrived to site) • CAPEX: US$ 340 M (Total disbursement as of 4Q15 US$158.3 M)
o Exploration and mine development US$122 M (Disbursement as of 4Q15 S$93.9 M) o Civil works and Equipment US$218 M (Disbursement as of 4Q15 S$64.4 M)
The San Gabriel Project (100% ownership) • The project has been rescheduled in order to preserve cash flow • Feasibility studies were completed in 4Q15 • Environmental Impact Assessment (EIA) of the project´s construction is expected to be
approved in 4Q16 • Objective for 1S16:
o Continue the construction of a 450 meters exploration ramp o Drilling program: 7,000 meters in order to confirm resources and certainty
Project Development and Exploration

Compañía de Minas Buenaventura S.A.A. Third Quarter and Nine-Month 2015 Results
Page 8 of 24
•••• Currently BVN is in the process of raising US$ 270 million long-term syndicate
loan. Proceeds from this new debt will be used for the following: a. Reprofiling of BVN´s current short term debt (US$ 232 million). b. Partially finance the construction of the Tambomayo Project.
•••• Yanacocha will distribute a cash dividend of US$ 300 million
BVN will receive US$ 131 million in 1Q16.
•••• Cerro Verde - loan of US$ 125 million in 4Q15
In 4Q15, Cerro Verde received a loan of US$ 600 million from its shareholder in order to comply with the covenants of its syndicate loan ($1.8 billion).
•••• El Brocal - capital increase of US$ 19 million in 1Q16
This capital increase was needed in order to comply with the covenants of its loan.
At the Board of Directors´ meeting held February 25, 2016, the following resolutions were passed: To call for the Annual Shareholders Meeting´ to be held on March 29, 2016, the following items will be proposed for approval: a. Approve the Annual Report as of December, 31, 2015. b. Approve the Financial Statements as of December, 31, 2015. c. Appoint Ernst and Young (Paredes, Zalvidar, Burga y Asociados) as External Auditors for fiscal year 2016.
Recent events
Buenaventura´s Cash and Debt Situation

Compañía de Minas Buenaventura S.A.A. Third Quarter and Nine-Month 2015 Results
Page 9 of 24
* * *
Company Description Compañía de Minas Buenaventura S.A.A. is Peru’s largest, publicly traded, precious metals company and a major holder of mining rights in Peru. The Company is engaged in the mining, processing, development and exploration of gold and silver and other metals via wholly owned mines as well as through its participation in joint exploration projects.
Buenaventura currently operates several mines in Peru (Orcopampa*, Uchucchacua*, Mallay*, Julcani*, El Brocal, La Zanja and Coimolache and is developing the Tambomayo and San Gabriel projects. The Company owns 43.65% of Minera Yanacocha S.R.L (a partnership with Newmont Mining Corporation), an important precious metal producer; 19.58% of Sociedad Minera Cerro Verde, an important Peruvian copper producer. For a printed version of the Company’s 2014 Form 20-F, please contact the investor relations contacts on page 1 of this report, or download the PDF format file from the Company’s web site at www.buenaventura.com. (*) Operations wholly owned by Buenaventura Note on Forward-Looking Statements
This press release may contain forward-looking information (as defined in the U.S. Private Securities Litigation Reform Act of 1995) that involve risks and uncertainties, including those concerning the Company’s, Yanacocha’s and Cerro Verde’s costs and expenses, results of exploration, the continued improving efficiency of operations, prevailing market prices of gold, silver, copper and other metals mined, the success of joint ventures, estimates of future explorations, development and production, subsidiaries’ plans for capital expenditures, estimates of reserves and Peruvian political, economic, social and legal developments. These forward-looking statements reflect the Company’s view with respect to the Company’s, Yanacocha’s and Cerro Verde’s future financial performance. Actual results could differ materially from those projected in the forward-looking statements as a result of a variety of factors discussed elsewhere in this Press Release.
**Tables to follow**
APPENDIX 1
Equity Participation in Subsidiaries and Associates (as of September 30, 2015)
BVN Operating
Equity % Mines / Business
El Molle Verde S.A.C* 100.00 Trapiche project
Minera La Zanja S.A* 53.06 La Zanja
Sociedad Minera El Brocal S.A.A* 56.29 Colquijirca and Marcapunta
Compañía Minera Coimolache S.A ** 40.10 Tantahuatay
Minera Yanacocha S.R.L ** 43.65 Yanacocha
Sociedad Minera Cerro Verde S.A.A ** 19.58 Cerro Verde
Processadora Industrial Rio Seco S.A* 100.00 Rio Seco chemical plant
Consorcio Energético de Huancavelica S.A* 100.00 Energy – Huanza Hydroelectrical plant
Buenaventura Ingenieros S.A* 100.00 Engineering Consultant
(*)Consolidates (**) Equity Accounting

Compañía de Minas Buenaventura S.A.A. Third Quarter and Nine-Month 2015 Results
Page 10 of 24
APPENDIX 2
4Q15 4Q14 % FY15 FY14 %
Mining Unit Operating Results
Orcopampa Ore Milled DMT 120,878 115,862 4% 458,222 454,694 1%
Ore Grade OZ/MT 0.42 0.48 -13% 0.46 0.46 1%
Recovery Rate % 93.9% 96.9% -3% 95.3% 97.1% -2%
Ounces Produced* 48,606 54,878 -11% 204,629 202,227 1%
Mining Unit Operating Results
La Zanja Ounces Produced 37,709 34,959 8% 141,071 143,724 -2%
Tantahuatay Ounces Produced 47,697 38,558 24% 144,782 143,643 1%
* Includes ounces from retreatment of taling dams
4Q15 4Q14 % FY15 FY14 %
Mining Unit Operating Results
Uchucchacua Ore Milled DMT 318,219 287,970 11% 1,121,474 1,013,633 11%
Ore Grade OZ/MT 15.38 13.83 11% 14.80 14.56 2%
Recovery Rate % 84.2% 85.2% -1% 83.9% 81.7% 3%
Ounces Produced 4,118,509 3,395,628 21% 13,919,922 12,055,570 15%
Julcani Ore Milled DMT 45,024 43,292 4% 177,948 167,760 6%
Ore Grade OZ/MT 20.06 19.02 5% 19.22 19.32 -1%
Recovery Rate % 96.2% 95.0% 1% 95.5% 95.2% 0%
Ounces Produced 868,662 782,652 11% 3,266,453 3,084,347 6%
Mallay Ore Milled DMT 42,812 38,290 12% 158,124 148,058 7%
Ore Grade OZ/MT 8.93 8.64 3% 8.66 8.77 -1%
Recovery Rate % 93.4% 93.5% 0% 93.8% 93.7% 0%
Ounces Produced 357,236 309,213 16% 1,285,361 1,216,034 6%
Mining Unit Operating Results
Colquijirca Ounces Produced 1,030,199 490,896 110% 2,811,391 603,342 366%
4Q15 4Q14 % FY15 FY14 %
Mining Unit Operating Results
Uchucchacua Ore Milled DMT 318,219 287,970 11% 1,121,474 1,013,633 11%
Ore Grade % 1.04% 0.90% 16% 1.05% 1.04% 1%
Recovery Rate % 48.02% 57.9% -17% 48.2% 60.2% -20%
MT Produced 1,602 1,504 6% 5,693 6,349 -10%
Mallay Ore Milled DMT 42,812 38,290 12% 158,124 148,058 7%
Ore Grade % 6.5% 7.1% -8% 6.60% 7.79% -15%
Recovery Rate % 86.3% 86.3% 0% 87.9% 85.8% 2%
MT Produced 2,407 2,333 3% 9,172 9,893 -7%
Mining Unit Operating Results
Colquijirca MT Produced 15,966 8,640 85% 53,319 10,162 425%
Open Pit
GOLD PRODUCTION
Underground
Open Pit
SILVER PRODUCTION
Underground
Open Pit
ZINC PRODUCTION
Underground

Compañía de Minas Buenaventura S.A.A. Third Quarter and Nine-Month 2015 Results
Page 11 of 24
APPENDIX 3: EBITDA Reconciliation (in thousand US$)
Note: EBITDA (Buenaventura Direct Operations) consists of earnings before net interest, taxes, depreciation and amortization, share in associated companies, net, loss on currency exchange difference, other, net, provision for workers’ profit sharing and provision for long-term officers’ compensation. EBITDA (including associated companies) consists of EBITDA (Buenaventura Direct Operations), plus (1) Buenaventura’s equity share of EBITDA (Yanacocha) (2) Buenaventura’s equity share of EBITDA (Cerro Verde), plus (3) Buenaventura’s equity share of EBITDA (Coimolache). All EBITDA mentioned were similarly calculated using financial information provided to Buenaventura by the associated companies. Buenaventura presents EBITDA (Buenaventura Direct Operations) and EBITDA (including affiliates) to provide further information with respect to its operating performance and the operating performance of its equity investees, the affiliates. EBITDA (Buenaventura Direct Operations) and EBITDA (including affiliates) are not a measure of financial performance under IFRS, and may not be comparable to similarly titled measures of other companies. You should not consider EBITDA (Buenaventura Direct Operations) and EBITDA (including affiliates) as alternatives to operating income or net income determined in accordance with IFRS, as an indicator of Buenaventura’s, affiliates operating performance, or as an alternative to cash flows from operating activities, determined in accordance with IFRS, as an indicator of cash flows or as a measure of liquidity.
4Q15 4Q14 FY 2015 FY 2014
Net Income -315,297 -164,441 -375,545 -61,640
Add / Substract: 331,262 199,706 480,734 335,692
Provis ion for income tax, net 16,544 23,928 12,613 66,012
Share in associated companies by the
equity method, net 234,996 113,842 173,375 74,600
Interest income -8,585 -4,209 -11,026 -8,408
Interest expense 6,519 4,313 27,622 11,318
Loss on currency exchange difference 6,158 3,381 13,683 8,452
Long Term Compensation provision 330 -1,842 330 89
Depreciation and Amortization 63,279 57,684 242,464 208,698
Workers´ participation provis ion 266 -20 895 3,669
Adquiscion gain generated by subsidiary 0 27 0 -59,852
Loss from discontinued operations 4,583 4,830 9,523 31,114
Impairment of Long-Lived Assets 7,172 -2,228 11,255 0
EBITDA Buenaventura Direct Operations 15,965 35,265 105,189 274,052
EBITDA Yanacocha (43.65%) 18,392 105,971 164,265 205,695
EBITDA Cerro Verde (19.58%) 23,497 27,931 68,261 143,299
EBITDA Coimolache (40.01%) 14,755 12,335 40,360 48,941
Adjusted EBITDA (including Associated
companies) 72,609 181,503 378,075 671,987

Compañía de Minas Buenaventura S.A.A. Third Quarter and Nine-Month 2015 Results
Page 12 of 24
APPENDIX 4: PROVEN AND PROBABLE RESERVES
GOLD
% Ownership MT (000) Grade Oz/TMS Oz (000) Attributable (000)
Orcopampa 100.00 648 0.475 308 308
Julcani 100.00 289 0.016 5 5
Mallay 100.00 86 0.016 1 1
Tambomayo 100.00 1,081 0.303 328 328
Antapite 100.00 38 0.335 13 13
Breapampa 100.00 520 0.014 8 8
La Zanja 53.06 11,905 0.020 236 125
La Zanja (on Pads and Plant) 53.06 8 4
Tantahuatay (Oxides) 40.10 66,197 0.014 920 369
Tantahuatay PAD 40.10 11 4
El Brocal Marcapunta (Sulphides) 56.29 21,750 0.013 273 154
Yanacocha 43.65 5,057 2,207
Total 102,514 0.070 7,167 3,526
SILVER
% Ownership MT (000) Grade Oz/TMS Oz (000) Attributable (000)
Uchucchacua (Silver - Sulphides) 100.00 3,947 15.000 59,208 59,208
Uchucchacua (Zinc - Sulphides) 100.00 324 5.850 1,896 1,896
Julcani 100.00 289 20.840 6,018 6,018
Breapampa 100.00 520 0.550 287 287
Mallay 100.00 86 10.970 948 948
Orcopampa 100.00 648 1.650 1,072 1,072
Tambomayo 100.00 1,081 9.260 10,007 10,007
La Zanja 53.06 11,905 0.130 1,574 835
La Zanja (on Pads and Plant) 53.06 825 438
Tantahuatay Oxidos 40.10 66,197 0.230 15,087 6,049
Tantahuatay PAD 40.10 67 27
El Brocal (Tajo Norte - La Llave) 54.07 39,698 0.880 34,934 18,889
El Brocal Marcapunta (Sulphides) 54.07 21,750 0.610 13,267 7,174
Yanacocha 43.65 60,000 26,190
Cerro Verde (Sulphides) 19.58 3,953,233 0.048 187,822 36,776
Cerro Verde (Oxides) 19.58 610,019 0.010 6,047 1,184
Total 4,709,697 0.085 399,060 176,997
ZINC
% Ownership MT (000) % Zn MT (000) Attributable (000)
Uchucchacua (Plata - Sulphides) 100.00 3,947 1.43 57 57
Uchucchacua (Zinc - Sulphides) 100.00 324 6.24 20 20
Mallay 100.00 86 8.93 8 8
Tambomayo 100.00 1,081 3.01 33 33
El Brocal (Tajo Norte - La Llave) 54.07 39,698 2.52 1,000 541
Total 45,136 2.48 1,117 658
LEAD
% Ownership MT (000) % Pb MT (000) Attributable (000)
Uchucchacua (Silver - Sulphides) 100.00 3,647 1.08 43 43
Uchucchacua (Zinc - Sulphides) 100.00 324 3.78 12 12
Julcani 100.00 289 2.52 7 7
Mallay 100.00 86 6.35 5 5
Tambomayo 100.00 1,081 2.00 22 22
El Brocal (Tajo Norte - La Llave) 54.07 39,698 0.86 341 185
Total 45,125 0.95 431 274
Compañía de Minas Buenaventura S.A.A. Third Quarter and Nine-Month 2015 Results
Page 13 of 24
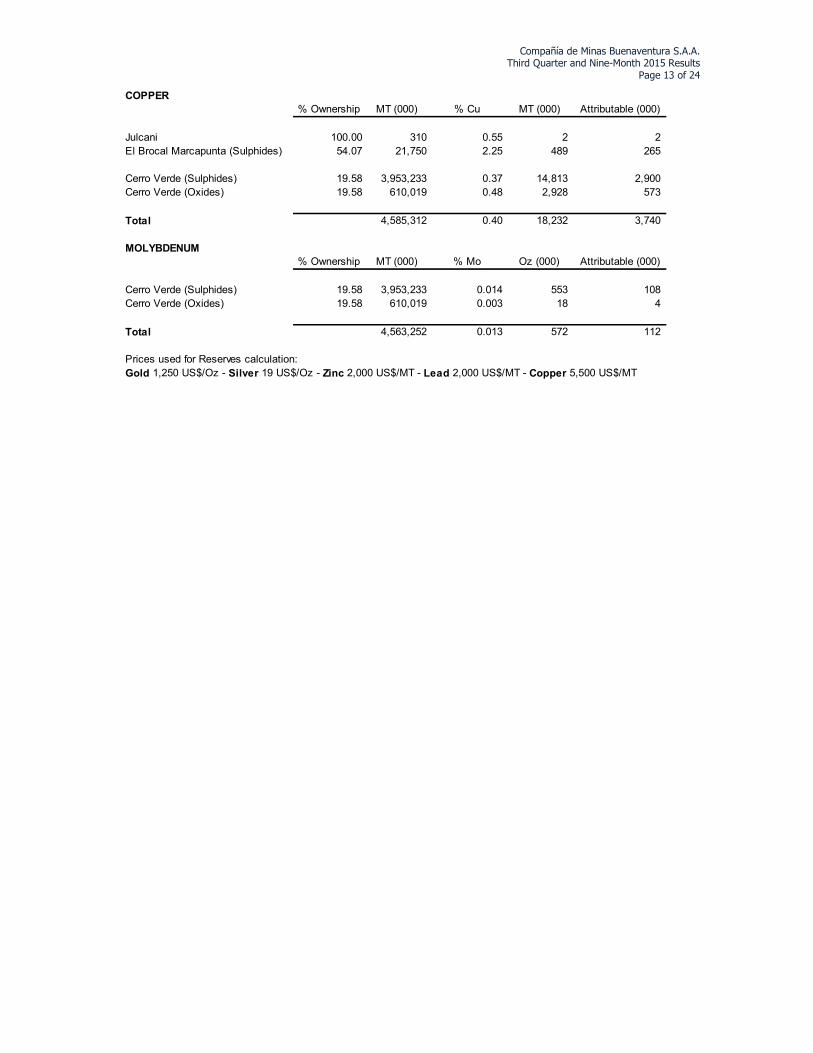
COPPER
% Ownership MT (000) % Cu MT (000) Attributable (000)
Julcani 100.00 310 0.55 2 2
El Brocal Marcapunta (Sulphides) 54.07 21,750 2.25 489 265
Cerro Verde (Sulphides) 19.58 3,953,233 0.37 14,813 2,900
Cerro Verde (Oxides) 19.58 610,019 0.48 2,928 573
Total 4,585,312 0.40 18,232 3,740
MOLYBDENUM
% Ownership MT (000) % Mo Oz (000) Attributable (000)
Cerro Verde (Sulphides) 19.58 3,953,233 0.014 553 108
Cerro Verde (Oxides) 19.58 610,019 0.003 18 4
Total 4,563,252 0.013 572 112
Prices used for Reserves calculation:
Gold 1,250 US$/Oz - Silver 19 US$/Oz - Zinc 2,000 US$/MT - Lead 2,000 US$/MT - Copper 5,500 US$/MT

Compañía de Minas Buenaventura S.A.A. Third Quarter and Nine-Month 2015 Results
Page 14 of 24
APPENDIX 5: COST APPLICABLE TO SALES RECONCILIATION Reconciliation of Costs Applicable to Sales and Cost Applicable to Sales per Unit Sold
Cost applicable to sales consists of cost of sales, excluding depreciation and amortization, plus Selling expenses. Cost applicable to sales per unit sold for each mine consists of cost applicable to sales for a particular metal produced at a given mine divided by the volume of such metal produced at such mine in the specified period. We note that cost applicable to sales is not directly comparable to the cash operating cost figures disclosed in previously furnished earnings releases.
Cost applicable to sales and Cost applicable to sales per unit of mineral sold are not measures of financial performance under IFRS, and may not be comparable to similarly titled measures of other companies. We consider Cost applicable to sales and Cost applicable to sales per unit of mineral sold to be key measures in managing and evaluating our operating performance. These measures are widely reported in the precious metals industry as a benchmark for performance, but do not have standardized meanings. You should not consider Cost applicable to sales or Cost applicable to sales per unit of mineral sold as alternatives to cost of sales determined in accordance with IFRS, as indicators of our operating performance. Cost applicable to sales and Cost applicable to sales per unit of mineral sold are calculated without adjusting for by-product revenue amounts.
The tables below set forth (i) a reconciliation of consolidated Cost of sales, excluding depreciation and amortization to consolidated Cost applicable to sales, (ii) reconciliations of the components of Cost applicable to sales (by mine and mineral) to the corresponding consolidated line items set forth on our consolidated statements of profit or loss for the three and six months ended June 30, 2014 and 2015, and (iii) reconciliations of Cost of sales, excluding depreciation and amortization to Cost applicable to sales for each of our mining units. The amounts set forth in Cost applicable to sales and Cost applicable to sales per unit sold for each mine and mineral indicated in the tables below can be reconciled to the amounts set forth on our consolidated statements of profit or loss for the three and six months ended June 30, 2014 and 2015 by reference to the reconciliations of Cost of sales, excluding depreciation and amortization (by mine and mineral), Selling Expenses (by mine and metal) expenses and Exploration in units in operations (by mine and mineral) to consolidated Cost of sales, excluding depreciation and amortization, consolidated Selling Expenses and consolidated Exploration in units in operations expenses, respectively, set forth below.

Compañía de Minas Buenaventura S.A.A. Third Quarter and Nine-Month 2015 Results
Page 15 of 24
Set forth below is a reconciliation of consolidated Cost of sales, excluding depreciation and amortization, to consolidated Cost applicable to sales:
Add:
Consolidated Exploration in units in operation
Consolidated Commercial deductions
Consolidated Selling expenses
Consolidated Cost applicable to sales
Set forth below is a reconciliation of Cost of sales, excluding depreciation and amortization (by mine and mineral) to consolidated Cost of sales:
Cost of sales by mine and mineral
Julcani, Gold
Julcani, Silver
Julcani, Lead
Julcani, Copper
Mallay, Gold
Mallay, Silver
Mallay, Lead
Mallay, Zinc
Breapampa, Gold
Breapampa, Silver
Orcopampa, Gold
Orcopampa, Silver
Uchucchacua, Gold
Uchucchacua, Silver
Uchucchacua, Lead
Uchucchacua, Zinc
La Zanja, Gold
La Zanja, Silver
El Brocal, Gold
El Brocal, Silver
El Brocal, Lead
El Brocal, Zinc
El Brocal, Copper
Non Mining Units
Consolidated Cost of sales, excluding depreciation
and amortization
Julcani, Gold
Julcani, Silver
Julcani, Lead
Julcani, Copper
Mallay, Gold
Mallay, Silver
Mallay, Lead
Mallay, Zinc
Breapampa, Gold
Breapampa, Silver
Orcopampa, Gold
Orcopampa, Silver
Uchucchacua, Gold
Uchucchacua, Silver
Uchucchacua, Lead
Uchucchacua, Zinc
La Zanja, Gold
La Zanja, Silver
El Brocal, Gold
El Brocal, Silver
El Brocal, Lead
El Brocal, Zinc
El Brocal, Copper
Non Mining Units
Consolidated Exploration expenses in units in operation
0 0 0 0
25,429 21,273 91,520 97,853
0 0 0 0
0 0 0 0
0 0 0 0
0 0 0 0
-1 1 0 5
0 0 0 0
270 265 1,103 1,026
-24 13 11 115
8,138 5,613 25,222 24,125
445 375 1,453 1,482
327 271 1,358 1,438
2 0 6 1
1,613 6 267 32
9,643 9,937 40,307 50,378
532 831 2,399 2,711
125 65 1,554 463
902 791 3,073 2,942
542 643 1,990 2,155
21 23 121 83
60 0 77 0
2,641 2,253 11,598 10,072
190 184 956 824
Exploration expenses in units in operation by mine and
mineral(in thousands of US$)
4 4 25 2
Set forth below is a reconciliation of Exploration expenses in units in operation (by mine and mineral) to consolidated Exploration expenses in
mining units:
For the 3 months ended Dec 31 For the 12 months ended Dec 31
2015 2014 2015 2014
3,193 23,984 38,246 69,011
156,848 166,971 590,405 614,539
10,475 5,701 42,157 6,478
22,449 25,538 68,711 96,934
7,066 3,904 21,024 12,331
5,641 1,178 15,244 2,051
737 939 3,367 3,426
1,759 986 4,258 3,491
1,056 1,513 4,841 5,618
31,095 22,804 110,848 79,713
31,879 32,068 110,724 132,110
1,745 2,141 6,377 8,115
897 714 3,525 3,070
7 0 25 0
48 734 1,681 2,459
26,471 26,153 104,603 107,550
1,316 1,988 6,256 7,497
4 8,158 9,780 35,389
2,233 1,894 8,014 8,135
1,342 1,539 5,190 5,959
53 46 242 190
148 0 201 0
6,741 4,602 23,135 23,117
485 377 1,906 1,891
2015 2014 2015 2014
(in thousands of US$)
9 8 49 3
249,941 246,790 897,618 913,480
For the 3 months ended Dec 31 For the 12 months ended Dec 31
60,998 54,862 196,211 184,483
6,666 3,684 19,481 16,605
25,429 21,273 91,520 97,853
(in thousands of US$)
Consolidated Cost of sales excluding depreciation and
amortization156,848 166,971 590,405 614,539
For the 3 months ended Dec 31 For the 12 months ended Dec 31
2015 2014 2015 2014

Compañía de Minas Buenaventura S.A.A. Third Quarter and Nine-Month 2015 Results
Page 16 of 24
Set forth below is a reconciliation of Commercial Deductions in units in operation (by mine and mineral) to consolidated Commercial deductions:
Julcani, Gold
Julcani, Silver
Julcani, Lead
Julcani, Copper
Mallay, Silver
Mallay, Silver
Mallay, Lead
Mallay, Zinc
Breapampa, Gold
Breapampa, Silver
Orcopampa, Gold
Orcopampa, Silver
Uchucchacua, Gold
Uchucchacua, Silver
Uchucchacua, Lead
Uchucchacua, Zinc
La Zanja, Gold
La Zanja, Silver
El Brocal, Gold
El Brocal, Silver
El Brocal, Lead
El Brocal, Zinc
El Brocal, Copper
Non Mining Units
Consolidated Commercial deductions in units in
operation
Set forth below is a reconciliation of Selling expenses (by mine and mineral) to consolidated Selling expenses:
Selling expenses by mine and mineral
Julcani, Gold
Julcani, Silver
Julcani, Lead
Julcani, Copper
Mallay, Gold
Mallay, Silver
Mallay, Lead
Mallay, Zinc
Breapampa, Gold
Breapampa, Silver
Orcopampa, Gold
Orcopampa, Silver
Uchucchacua, Gold
Uchucchacua, Silver
Uchucchacua, Lead
Uchucchacua, Zinc
La Zanja, Gold
La Zanja, Silver
El Brocal, Gold
El Brocal, Silver
El Brocal, Lead
El Brocal, Zinc
El Brocal, Copper
Non Mining Units
Consolidated Selling expenses 6,666 3,684 19,481 16,605
879 232 2,217 470
1,713 737 4,110 5,677
431 34 912 120
799 165 2,522 379
134 28 255 204
539 113 1,258 722
248 401 1,172 1,382
6 17 36 59
58 58 186 190
35 41 141 132
0 0 1 0
1,063 868 3,228 3,099
190 223 823 929
6 6 28 27
0 62 99 367
2 6 17 26
98 115 376 484
96 148 453 609
11 0 15 0
162 141 580 661
13 22 79 80
1 3 10 8
(in thousands of US$)
0 0 2 0
181 265 963 979
For the 3 months ended Dec 31 For the 12 months ended Dec 31
2015 2014 2015 2014
0 0 0 0
60,998 54,862 196,211 184,483
6,903 3,320 24,622 4,105
25,762 30,590 81,479 102,258
3,992 3,587 13,583 12,345
2,269 642 6,669 1,317
6 0 18 4
1,925 1,203 4,847 3,777
1,499 1,012 5,457 3,850
53 38 194 240
12,517 9,530 37,753 35,786
675 632 2,161 2,248
0 1 0 1
2 0 7 0
0 0 5 0
55 87 255 288
1,158 1,295 4,313 5,153
0 23 62 99
1,216 832 4,098 3,687
735 654 2,655 2,620
17 12 81 53
60 0 89 0
2,007 1,295 7,258 6,148
144 106 591 502
Commercial Deductions in units in operation by mine and
mineral(in thousands of US$)
3 2 14 2
For the 3 months ended Dec 31 For the 12 months ended Dec 31
2015 2014 2015 2014

GOLD (OZ) SILVER (OZ) LEAD (MT) ZINC (MT) COPPER (MT) TOTAL GOLD (OZ) SILVER (OZ) LEAD (MT) ZINC (MT) COPPER (MT) TOTAL GOLD (OZ) SILVER (OZ) LEAD (MT) ZINC (MT) COPPER (MT) TOTAL GOLD (OZ) SILVER (OZ) LEAD (MT) ZINC (MT) COPPER (MT) TOTAL
Cost of Sales (without D&A) (US$000) 9 6,741 485 - 53 7,288 8 4,602 377 - 46 5,032 Cost of Sales (without D&A) (US$000) 49 23,135 1,906 - 242 25,333 3 23,117 1,891 - 190 25,202
Add: Add:
Exploration Expenses (US$000) 4 2,641 190 - 21 2,855 4 2,253 184 - 23 2,463 Exploration Expenses (US$000) 25 11,598 956 - 121 12,699 2 10,072 824 - 83 10,981
Commercial Deductions (US$000) 3 2,007 144 - 17 2,171 2 1,295 106 - 12 1,416 Commercial Deductions (US$000) 14 7,258 591 - 81 7,944 2 6,148 502 - 53 6,706
Sell ing Expenses (US$000) 0 181 13 - 1 195 0 265 22 - 3 290 Sell ing Expenses (US$000) 2 963 79 - 10 1,055 0 979 80 - 8 1,067
Cost Applicable to Sales (US$000) 16 11,570 832 - 92 12,510 14 8,414 689 - 84 9,202 Cost Applicable to Sales (US$000) 90 42,954 3,533 - 454 47,031 7 40,316 3,297 - 335 43,956
Divide: Divide:
Volume Sold 18 1,022,162 674 - 26 Not Appl icable 15 602,165 398 - 15 Not Applicable Volume Sold 94 3,493,166 2,478 - 103 Not Applicable 12 2,851,318 2,057 - 64 No Aplicable
CAS 870 11.32 1,233 - 3,544 Not Applicable 962 13.97 1,731 - 5,603 Not Applicable CAS 955 12.30 1,425 - 4,416 No Applicable 603 14.14 1,603 - 5,195 No Applicable
GOLD (OZ) SILVER (OZ) LEAD (MT) ZINC (MT) COPPER (MT) TOTAL GOLD (OZ) SILVER (OZ) LEAD (MT) ZINC (MT) COPPER (MT) TOTAL GOLD (OZ) SILVER (OZ) LEAD (MT) ZINC (MT) COPPER (MT) TOTAL GOLD (OZ) SILVER (OZ) LEAD (MT) ZINC (MT) COPPER (MT) TOTAL
Cost of Sales (without D&A) (US$000) 148 2,233 1,342 1,316 - 5,039 - 1,894 1,539 1,988 - 5,421 Cost of Sales (without D&A) (US$000) 201 8,014 5,190 6,256 - 19,661 - 8,135 5,959 7,497 - 21,591
Add: Add:
Exploration Expenses (US$000) 60 902 542 532 - 2,035 - 791 643 831 - 2,265 Exploration Expenses (US$000) 77 3,073 1,990 2,399 - 7,539 - 2,942 2,155 2,711 - 7,807
Commercial Deductions (US$000) 60 1,216 735 1,158 - 3,168 - 832 654 1,295 - 2,781 Commercial Deductions (US$000) 89 4,098 2,655 4,313 - 11,155 - 3,687 2,620 5,153 - 11,460
Sell ing Expenses (US$000) 11 162 98 96 - 367 - 141 115 148 - 404 Sell ing Expenses (US$000) 15 580 376 453 - 1,424 - 661 484 609 - 1,754
Cost Applicable to Sales (US$000) 278 4,512 2,716 3,101 - 10,608 - 3,659 2,950 4,263 - 10,872 Cost Applicable to Sales (US$000) 381 15,766 10,211 13,421 - 39,778 - 15,425 11,217 15,970 - 42,613
Divide: Divide:
Volume Sold 292 327,697 1,765 1,981 - Not Appl icable - 285,846 1,797 1,992 - Not Applicable Volume Sold 396 1,134,528 6,612 7,482 - Not Applicable - 1,121,202 7,253 8,609 - Not Applicable
CAS 954 13.77 1,539 1,566 - Not Applicable - 12.80 1,642 2,139 - Not Applicable CAS 960 13.90 1,544 1,794 - No Applicable - 13.76 1,547 1,855 - No Applicable
GOLD (OZ) SILVER (OZ) LEAD (MT) ZINC (MT) COPPER (MT) TOTAL GOLD (OZ) SILVER (OZ) LEAD (MT) ZINC (MT) COPPER (MT) TOTAL GOLD (OZ) SILVER (OZ) LEAD (MT) ZINC (MT) COPPER (MT) TOTAL GOLD (OZ) SILVER (OZ) LEAD (MT) ZINC (MT) COPPER (MT) TOTAL
Cost of Sales (without D&A) (US$000) 4 48 - - - 52 8,158 734 - - - 8,892 Cost of Sales (without D&A) (US$000) 9,780 1,681 - - - 11,462 35,389 2,459 - - - 37,848
Add: Add:
Exploration Expenses (US$000) 125 1,613 - - - 1,738 65 6 - - - 71 Exploration Expenses (US$000) 1,554 267 - - - 1,821 463 32 - - - 495
Commercial Deductions (US$000) 0 - - - - 0 23 - - - - 23 Commercial Deductions (US$000) 62 5 - - - 66 99 - - - - 99
Sell ing Expenses (US$000) 0 2 - - - 2 62 6 - - - 67 Sell ing Expenses (US$000) 99 17 - - - 116 367 26 - - - 393
Cost Applicable to Sales (US$000) 129 1,663 - - - 1,792 8,307 746 - - - 9,052 Cost Applicable to Sales (US$000) 11,495 1,970 - - - 13,466 36,318 2,517 - - - 38,835
Divide: Divide:
Volume Sold -0 4,381 - - - Not Appl icable 14,456 98,441 - - - Not Applicable Volume Sold 16,069 212,826 - - - Not Applicable 80,358 383,733 - - - Not Applicable
CAS - 379.64 - - - Not Applicable 575 7.57 - - - Not Applicable CAS 715 9.26 - - - No Applicable 452 6.56 - - - No Applicable
GOLD (OZ) SILVER (OZ) LEAD (MT) ZINC (MT) COPPER (MT) TOTAL GOLD (OZ) SILVER (OZ) LEAD (MT) ZINC (MT) COPPER (MT) TOTAL GOLD (OZ) SILVER (OZ) LEAD (MT) ZINC (MT) COPPER (MT) TOTAL GOLD (OZ) SILVER (OZ) LEAD (MT) ZINC (MT) COPPER (MT) TOTAL
Cost of Sales (without D&A) (US$000) 26,471 897 - - - 27,368 26,153 714 - - - 26,868 Cost of Sales (without D&A) (US$000) 104,603 3,525 - - - 108,128 107,550 3,070 - - - 110,620
Add: Add:
Exploration Expenses (US$000) 9,643 327 - - - 9,970 9,937 271 - - - 10,208 Exploration Expenses (US$000) 40,307 1,358 - - - 41,666 50,378 1,438 - - - 51,816
Commercial Deductions (US$000) 55 - - - - 55 87 1 - - - 88 Commercial Deductions (US$000) 255 0 - - - 255 288 1 - - - 289
Sell ing Expenses (US$000) 190 6 - - - 196 223 6 - - - 229 Sell ing Expenses (US$000) 823 28 - - - 851 929 27 - - - 955
Cost Applicable to Sales (US$000) 36,358 1,230 - - - 37,588 36,400 993 - - - 37,392 Cost Applicable to Sales (US$000) 145,988 4,912 - - - 150,900 159,144 4,536 - - - 163,680
Divide: Divide:
Volume Sold 52,488 139,557 - - - Not Appl icable 52,195 108,290 - - - Not Applicable Volume Sold 214,821 555,314 - - - Not Applicable 204,862 401,782 - - - Not Applicable
CAS 693 8.82 - - - Not Applicable 697 9.17 - - - Not Applicable CAS 680 8.85 - - - No Applicable 777 11.29 - - - No Applicable
GOLD (OZ) SILVER (OZ) LEAD (MT) ZINC (MT) COPPER (MT) TOTAL GOLD (OZ) SILVER (OZ) LEAD (MT) ZINC (MT) COPPER (MT) TOTAL GOLD (OZ) SILVER (OZ) LEAD (MT) ZINC (MT) COPPER (MT) TOTAL GOLD (OZ) SILVER (OZ) LEAD (MT) ZINC (MT) COPPER (MT) TOTAL
Cost of Sales (without D&A) (US$000) 7 31,879 1,745 1,056 - 34,687 - 32,068 2,141 1,513 - 35,723 Cost of Sales (without D&A) (US$000) 25 110,724 6,377 4,841 - 121,967 - 132,110 8,115 5,618 - 145,843
Add: Add:
Exploration Expenses (US$000) 2 8,138.49 445.38 269.57 - 8,855.2 - 5,613 375 265 - 6,253 Exploration Expenses (US$000) 6 25,222 1,453 1,103 - 27,784 - 24,125 1,482 1,026 - 26,633
Commercial Deductions (US$000) 2 12,517 675 1,499 - 14,694 - 9,530 632 1,012 - 11,174 Commercial Deductions (US$000) 7 37,753 2,161 5,457 - 45,379 - 35,786 2,248 3,850 - 41,884
Sell ing Expenses (US$000) 0 1,063 58 35 - 1,156 - 868 58 41 - 967 Sell ing Expenses (US$000) 1 3,228 186 141 - 3,555 - 3,099 190 132 - 3,421
Cost Applicable to Sales (US$000) 11 53,597 2,924 2,860 - 59,392 - 48,079 3,206 2,831 - 54,117 Cost Applicable to Sales (US$000) 39 176,927 10,177 11,543 - 198,685 - 195,120 12,035 10,626 - 217,781
Divide: Divide:
Volume Sold 12 4,132,034 1,993 1,520 - Not Appl icable - 3,206,509 1,665 1,013 - Not Applicable Volume Sold 38 12,666,673 6,560 4,750 - Not Applicable - 11,940,167 6,530 4,288 - Not Applicable
CAS 931 12.97 1,467 1,882 - No Applicable - 14.99 1,925 2,795 - No Applicable CAS 1,016 13.97 1,551 2,430 - No Applicable - 16.34 1,843 2,478 - No Applicable
UCHUCCHACUA UCHUCCHACUA
4Q 2015 4Q 2014 FY 2015 FY 2014
ORCOPAMPA ORCOPAMPA
4Q 2015 4Q 2014 FY 2015 FY 2014
BREAPAMPA BREAPAMPA
4Q 2015 4Q 2014 FY 2015 FY 2014
MALLAY MALLAY
4Q 2015 4Q 2014 FY 2015 FY 2014
JULCANI JULCANI 4Q 2015 4Q 2014 FY 2015 FY 2014

Compañía de Minas Buenaventura S.A.A. Third Quarter and Nine-Month 2015 Results
Page 18 of 24
GOLD (OZ) SILVER (OZ) LEAD (MT) ZINC (MT) COPPER (MT) TOTAL GOLD (OZ) SILVER (OZ) LEAD (MT) ZINC (MT) COPPER (MT) TOTAL GOLD (OZ) SILVER (OZ) LEAD (MT) ZINC (MT) COPPER (MT) TOTAL GOLD (OZ) SILVER (OZ) LEAD (MT) ZINC (MT) COPPER (MT) TOTAL
Cost of Sales (without D&A) (US$000) 31,095 737 - - - 31,832 22,804 939 - - - 23,743 Cost of Sales (without D&A) (US$000) 110,848 3,367 - - - 114,214 79,713 3,426 - - - 83,139
Add: Add:
Exploration Expenses (US$000) -24 -1 - - - -24 13 1 - - - 14 Exploration Expenses (US$000) 11 0 - - - 11 115 5 - - - 120
Commercial Deductions (US$000) 53 6 - - - 59 38 -0 - - - 38 Commercial Deductions (US$000) 194 18 - - - 212 240 4 - - - 244
Sell ing Expenses (US$000) 248 6 - - - 254 401 17 - - - 418 Sell ing Expenses (US$000) 1,172 36 - - - 1,207 1,382 59 - - - 1,441
Cost Applicable to Sales (US$000) 31,372 748 - - - 32,120 23,257 956 - - - 24,213 Cost Applicable to Sales (US$000) 112,224 3,421 - - - 115,645 81,450 3,495 - - - 84,944
Divide: Divide:
Volume Sold 37,706 68,585 - - - Not Appl icable 33,098 101,988 - - - Not Applicable Volume Sold 142,299 324,151 - - - Not Applicable 143,151 418,565 - - - Not Applicable
CAS 832 10.90 - - - Not Applicable 703 9.37 - - - Not Applicable CAS 789 10.55 - - - No Applicable 569 8.35 - - - Not Applicable
GOLD (OZ) SILVER (OZ) LEAD (MT) ZINC (MT) COPPER (MT) TOTAL GOLD (OZ) SILVER (OZ) LEAD (MT) ZINC (MT) COPPER (MT) TOTAL GOLD (OZ) SILVER (OZ) LEAD (MT) ZINC (MT) COPPER (MT) TOTAL GOLD (OZ) SILVER (OZ) LEAD (MT) ZINC (MT) COPPER (MT) TOTAL
Cost of Sales (without D&A) (US$000) 1,759 7,066 5,641 10,475 22,449 47,390 986 3,904 1,178 5,701 25,538 37,307 Cost of Sales (without D&A) (US$000) 4,258 21,024 15,244 42,157 68,711 151,394 3,491 12,331 2,051 6,478 96,934 121,285
Add: Add:
Exploration Expenses (US$000) - - - - - - - - - - - - Exploration Expenses (US$000) - - - - - - - - - - - -
Commercial Deductions (US$000) 1,925 3,992 2,269 6,903 25,762 40,851 1,203 3,587 642 3,320 30,590 39,343 Commercial Deductions (US$000) 4,847 13,583 6,669 24,622 81,479 131,200 3,777 12,345 1,317 4,105 102,258 123,801
Sell ing Expenses (US$000) 134 539 431 799 1,713 3,617 28 113 34 165 737 1,077 Sell ing Expenses (US$000) 255 1,258 912 2,522 4,110 9,056 204 722 120 379 5,677 7,103
Cost Applicable to Sales (US$000) 3,818 11,597 8,340 18,177 49,924 91,858 2,218 7,604 1,855 9,185 56,865 77,727 Cost Applicable to Sales (US$000) 9,359 35,865 22,826 69,301 154,300 291,650 7,472 25,398 3,488 10,962 204,869 252,189
Divide: Divide:
Volume Sold 2,835 881,192 5,870 12,586 9,150 Not Appl icable 2,278 672,417 1,609 6,955 10,436 Not Applicable Volume Sold 7,181 2,637,215 16,739 43,297 28,991 Not Applicable 7,874 1,928,243 2,759 8,007 40,198 Not Applicable
CAS 1,347 13.16 1,421 1,444 5,456 Not Applicable 973 11.31 1,152 1,321 5,449 Not Applicable CAS 1,303 13.60 1,364 1,601 5,322 No Applicable 949 13.17 1,264 1,369 5,096 Not Applicable
GOLD (OZ) SILVER (OZ) LEAD (MT) ZINC (MT) COPPER (MT) TOTAL GOLD (OZ) SILVER (OZ) LEAD (MT) ZINC (MT) COPPER (MT) TOTAL GOLD (OZ) SILVER (OZ) LEAD (MT) ZINC (MT) COPPER (MT) TOTAL GOLD (OZ) SILVER (OZ) LEAD (MT) ZINC (MT) COPPER (MT) TOTAL
Cost of Sales (without D&A) (US$000) - - - - - 3,193 - - - - - 23,984 Cost of Sales (without D&A) (US$000) - - - - - 38,246 - - - - - 69,011
Add: Add: - -
Sell ing Expenses (US$000) - - - - - 879 - - - - - 232 Sell ing Expenses (US$000) - - - - - 2,217 - - - - - 470
Total (US$000) - - - - - 4,073 - - - - - 24,216 Total (US$000) - - - - - 40,463 - - - - - 69,481
GOLD (OZ) SILVER (OZ) LEAD (MT) ZINC (MT) COPPER (MT) TOTAL GOLD (OZ) SILVER (OZ) LEAD (MT) ZINC (MT) COPPER (MT) TOTAL GOLD (OZ) SILVER (OZ) LEAD (MT) ZINC (MT) COPPER (MT) TOTAL GOLD (OZ) SILVER (OZ) LEAD (MT) ZINC (MT) COPPER (MT) TOTAL
Cost of Sales (without D&A) (US$000) 59,493 49,601 9,212 12,847 22,502 156,848 58,109 44,856 5,235 9,203 25,584 166,971 Cost of Sales (without D&A) (US$000) 229,763 171,470 28,718 53,254 68,953 590,405 226,146 184,648 18,016 19,593 97,124 614,539
Add: Add:
Exploration Expenses (US$000) 9,809 13,621 1,177 801 21 25,429 10,019 8,935 1,202 1,096 23 21,273 Exploration Expenses (US$000) 41,980 41,519 4,399 3,502 121 91,520 50,957 38,614 4,461 3,737 83 97,852
Commercial Deductions (US$000) 2,098 19,738 3,824 9,560 25,778 60,998 1,353 15,245 2,035 5,627 30,602 54,862 Commercial Deductions (US$000) 5,467 62,716 12,077 34,392 81,560 196,211 4,405 57,972 6,686 13,109 102,312 184,483
Sell ing Expenses (US$000) 583 1,959 599 930 1,715 6,666 714 1,415 228 354 740 3,684 Sell ing Expenses (US$000) 2,366 6,109 1,553 3,116 4,120 19,481 2,883 5,573 875 1,120 5,685 16,605
Cost Applicable to Sales (US$000) 71,983 84,919 14,812 24,139 50,016 249,941 70,196 70,450 8,700 16,279 56,949 246,790 Cost Applicable to Sales (US$000) 279,576 281,814 46,747 94,264 154,754 897,618 284,391 286,807 30,038 37,559 205,203 913,479
Divide: Divide:
Volume Sold 93,352 6,575,608 10,302 16,087 9,176 Not Appl icable 102,043 5,075,656 5,470 9,961 10,451 Not Applicable Volume Sold 380,899 21,023,873 32,389 55,529 29,094 Not Applicable 436,257 19,045,010 18,599 20,904 40,263 Not Applicable
CAS 771 12.91 1,438 1,501 5,451 Not Applicable 688 13.88 1,591 1,634 5,449 Not Applicable CAS 734 13.40 1,443 1,698 5,319 Not Applicable 652 15.06 1,615 1,797 5,097 Not Applicable
GOLD (OZ) SILVER (OZ) LEAD (MT) ZINC (MT) COPPER (MT) TOTAL GOLD (OZ) SILVER (OZ) LEAD (MT) ZINC (MT) COPPER (MT) TOTAL GOLD (OZ) SILVER (OZ) LEAD (MT) ZINC (MT) COPPER (MT) TOTAL GOLD (OZ) SILVER (OZ) LEAD (MT) ZINC (MT) COPPER (MT) TOTAL
Cost of Sales (without D&A) (US$000) 16,925 1,368 - - - 18,292 14,903 1,167 - - - 16,070 Cost of Sales (without D&A) (US$000) 55,952 4,576 - - - 60,527 55,041 4,237 - - - 59,278
Add: Add:
Exploration Expenses (US$000) 1,578 128 - - - 1,706 3,510 275 - - - 3,785 Exploration Expenses (US$000) 12,598 1,030 - - - 13,628 8,178 629 - - - 8,808
Commercial Deductions (US$000) 267 30 - - - 298 202 19 - - - 220 Commercial Deductions (US$000) 776 71 - - - 847 453 34 - - - 487
Sell ing Expenses (US$000) 380 31 - - - 411 278 22 - - - 300 Sell ing Expenses (US$000) 1,028 84 - - - 1,112 1,001 77 - - - 1,078
Cost Applicable to Sales (US$000) 19,151 1,556 - - - 20,707 18,893 1,482 - - - 20,375 Cost Applicable to Sales (US$000) 70,353 5,761 - - - 76,114 64,673 4,977 - - - 69,650
Divide: Divide:
Volume Sold 49,363 294,995 - - - Not Appl icable 39,776 233,169 - - - Not Applicable Volume Sold 143,791 874,271 - - - Not Applicable 142,084 741,525 - - - Not Applicable
CAS 388 5.28 - - - Not Applicable 475 6.36 - - - Not Applicable CAS 489 6.59 - - - No Applicable 455 6.71 - - - Not Applicable
COIMOLACHE COIMOLACHE
4Q 2015 4Q 2014 FY 2015 FY 2014
BUENAVENTURA CONSOLIDATED BUENAVENTURA CONSOLIDATED
4Q 2015 4Q 2014 FY 2015 FY 2014
NON MINING COMPANIES NON MINING COMPANIES
4Q 2015 4Q 2014 FY 2015 FY 2014
BROCAL BROCAL
4Q 2015 4Q 2014 FY 2015 FY 2014
LA ZANJA LA ZANJA 4Q 2015 4Q 2014 FY 2015 FY 2014

Compañía de Minas Buenaventura S.A.A. Third Quarter and Nine-Month 2015 Results
Page 19 of 24
All-in Sustaining Cost for 4Q15
Au Ounces Sold BVN 90,462
Au Ounces bought from La Zanja -37,652
Au Ounces Sold Net 52,810 37,847 49,363 92,684
Income Statement & Cash Flow US$ 000' US$/Oz Au US$ 000' US$/Oz Au US$ 000' US$/Oz Au US$ 000' US$/Oz Au
Cost of Sales3 78,768 1,492 19,617 518 18,292 371 96,511 1,041
Exploration in Operating Units 25,492 483 549 15 1,706 35 26,467 286
Royalties 5,041 95 0 0 0 0 5,041 54
Comercial Deductions4 20,088 380 873 23 298 6 20,671 223
Selling Expenses 1,913 36 254 7 411 8 2,212 24
Administrative Expenses5 11,481 217 1,051 28 821 17 12,368 133
Other Expenses 0 0 4,018 106 1,502 30 2,734 30
Other Incomes -2,898 -55 -5,638 -149 -2,249 -46 -6,791 -73
Other administrative charges 0 0 2,718 72 564 11 1,668 18
Sustaining Capex6 16,209 307 1,592 42 15,865 321 23,414 253
By-product Credit -93,749 -1,775 -977 -26 -4,346 -88 -96,010 -1,036
All-in Sustaining Cost 62,345 1,181 24,057 636 32,864 666 88,286 953
*All-in Sustaining Cost does not include: Depreciation and Amortization, Stoppage of mining units, Exploration in non-operating areas.
Notes:
1. Non-consolidated financial statements for Compañia De Minas Buenaventura S.A.A. (Does not consider El Brocal)
2. Considers 100% from Compañia De Minas Buenaventura S.A.A., 53.06% from La Zanja and 40.095% from Tantahuatay.
3. For Buenaventura does not consider purchase of concentrate from La Zanja.
4. For all metals produced.
5. For Buenaventura, does not consider management services charged to subsidiaries. For La Zanja does not consider US$ 3.8 MM Impairment.
6. Sustaining Capex + Growth Capex equals Acquisitions of mining concessions, development costs, property, plant and equipment.
4Q15 4Q15 4Q15 4Q15
Buenaventura1 La Zanja Tantahuatay Attributable Production2
4Q15 4Q15 4Q15 4Q15
APPENDIX 6: ALL-IN SUSTAINING COST

Compañía de Minas Buenaventura S.A.A. Third Quarter and Nine-Month 2015 Results
Page 20 of 24
All-in Sustaining Cost for FY15
Au Ounces Sold BVN 373,548
Au Ounces bought from La Zanja -142,129
Au Ounces Sold Net 231,419 138,465 143,791 362,541
Income Statement & Cash Flow US$ 000' US$/Oz Au US$ 000' US$/Oz Au US$ 000' US$/Oz Au US$ 000' US$/Oz Au
Cost of Sales3 307,709 1,330 106,749 771 60,527 421 388,619 1,072
Exploration in Operating Units 91,548 396 8,995 65 13,628 95 101,785 281
Royalties 21,942 95 0 0 0 0 21,942 61
Comercial Deductions4 64,799 280 3,367 24 847 6 66,925 185
Selling Expenses 7,001 30 1,207 9 1,112 8 8,087 22
Administrative Expenses5 47,125 204 2,251 16 2,185 15 49,195 136
Other Expenses 0 0 14,174 102 7,136 50 10,382 29
Other Incomes -6,881 -30 -21,676 -157 -9,270 -64 -22,099 -61
Other administrative charges 0 0 8,190 59 1,369 10 4,894 14
Sustaining Capex6 38,861 168 27,615 199 48,509 337 72,964 201
By-product Credit -320,485 -1,385 -4,947 -36 -13,468 -94 -328,510 -906
All-in Sustaining Cost 251,619 1,087 145,926 1,054 112,575 783 374,184 1,032
*All-in Sustaining Cost does not include: Depreciation and Amortization, Stoppage of mining units, Exploration in non-operating areas.
Notes:
1. Non-consolidated financial statements for Compañia De Minas Buenaventura S.A.A. (Does not consider El Brocal)
2. Considers 100% from Compañia De Minas Buenaventura S.A.A., 53.06% from La Zanja and 40.095% from Tantahuatay.
3. For Buenaventura does not consider purchase of concentrate from La Zanja.
4. For all metals produced.
5. For Buenaventura, does not consider management services charged to subsidiaries. For La Zanja does not consider US$ 3.8 MM Impairment.
6. Sustaining Capex + Growth Capex equals Acquisitions of mining concessions, development costs, property, plant and equipment.
FY15 FY15 FY15 FY15
Buenaventura1 La Zanja Coimolache Attributable Production2
FY15 FY15 FY15 FY15

APPENDIX 7
Compañía de Minas Buenaventura S.A.A. and Subsidiaries
Consolidated Statement of Financial PositionAs of December 31, 2015 and December 31, 2014
2,015 2,014
Assets US$(000) US$(000)
Current assets
Cash and cash equivalents 78,519 78,512
Trade and other accounts receivable, net 219,862 281,604
Income tax credit 45,919 53,746
Prepaid expenses 8,231 16,954
Hedge derivative financial instruments - 3,688
Embedded derivatives for concentrate sales, net - -
Inventory, net 101,473 150,284
Total current assets 454,004 584,788
Assets classified as held for sale 15,592 18,683
469,596 603,471
Non-current assets
Trade and other accounts receivable, net 162,567 26,651
Long-term inventory 26,029 34,088
Investment in associates 2,043,983 2,224,381
Mining concessions, development costs, property, plant and equipment, net 1,747,624 1,715,452
Investment properties 10,719 11,200
Deferred income tax asset 41,575 47,675
Prepaid expenses 29,235 -
Other assets, net 15,853 9,356
Total non-current assets 4,077,585 4,068,803
Total assets 4,547,181 4,672,274
Liabilities and shareholders’ equity
Current liabilities
Overdraft and bank loans 285,302 40,000
Trade and other accounts payable 247,114 254,000
Provisions 49,829 67,895
Income tax payable 2,444 3,556
Hedge derivative financial instruments 10,643 -
Embedded derivatives for concentrate sales, net 1,694 9,072
Financial obligations 33,394 69,950
Total current liabilities 630,420 444,473
Liabilities directly associated with assets classified as held for sale 20,611 28,890
651,031 473,363
Non-current liabilities
Financial liability at fair value through profit or loss 16,994 23,026
Trade and other accounts payable 15,057 15,240
Provisions 141,885 63,571
Financial obligations 320,316 313,355
Deferred income tax liability 12,662 21,594
Total non-current liabilities 506,914 436,786
Total liabilities 1,157,945 910,149
Shareholders’ equity
Issued capital, net of treasury shares for US$(000)62,665 750,497 750,497
Investment shares, net of treasury shares for US$(000)765 1,396 1,396
Additional paid-in capital 219,055 219,055
Legal reserve 162,714 162,710
Other reserves 269 269
Retained earnings 2,024,895 2,328,423
Other equity reserves 2,240 1,755
3,161,066 3,464,105
Non-controlling interest 228,170 298,020
Total shareholders’ equity 3,389,236 3,762,125
Total liabilities and shareholders’ equity 4,547,181 4,672,274

Compañía de Minas Buenaventura S.A.A. Third Quarter and Nine-Month 2015 Results
Page 22 of 24
Compañía de Minas Buenaventura S.A.A. and Subsidiaries
Consolidated Statement of IncomeFor the three and twelve month periods ended December 31, 2015 and 2014
2,015 2,014 2,015 2,014
US$(000) US$(000) US$(000) US$(000)
Operating income
Net sales 227,494 264,550 919,450 1,138,913
Royalty income 7,214 11,911 32,414 36,867
Total operating income 234,708 276,461 951,864 1,175,780
Operating costs
Cost of sales, without considering depreciation and amortization (156,848) (166,971) (590,405) (614,539)
Exploration in operating units (25,429) (21,273) (91,520) (97,852)
Depreciation and amortization (63,280) (57,684) (242,465) (208,698)
Mining royalties (5,444) (6,630) (27,407) (28,440)
Total operating costs (251,001) (252,558) (951,797) (949,529)
Gross profit (16,293) 23,903 67 226,251
Operating expenses
Administrative expenses (25,753) (28,443) (86,532) (101,102)
Exploration in non-operating areas (4,950) (17,632) (30,610) (50,007)
Selling expenses (6,666) (3,684) (19,481) (16,605)
Impairment of long-lived assets (7,172) 2,228 (11,255) -
Other, net 7,905 5,299 209 3,059
Total operating expenses (36,636) (42,232) (147,669) (164,655)
Operating profit (52,929) (18,329) (147,602) 61,596
Other income, net
Share in the results of associates under equity method (234,996) (113,842) (173,375) (74,600)
Financial income 8,585 4,209 11,026 8,408
Financial expenses (6,519) (4,313) (27,622) (11,318)
Net loss from currency exchange difference (6,158) (3,381) (13,683) (8,452)
Adquiscion gain generated by subsidiary - (27) - 59,852
Total other income, net (239,088) (117,354) (203,654) (26,110)
Profit before income taxes and non-controlling interest (292,017) (135,683) (351,256) 35,486
Income taxes (18,697) (23,928) (14,766) (66,012)
Net profit (310,714) (159,611) (366,022) (30,526)
Discontinued operations
Loss from discontinued operations (4,583) (4,830) (9,523) (31,114)
Net Income (315,297) (164,441) (375,545) (61,640)
Attributable to:Owners of the parent (292,554) (161,377) (317,210) (76,065)
Non-controlling interest (22,743) (3,064) (58,335) 14,425 (315,297) (164,441) (375,545) (61,640)
Basic and diluted earnings per share attributable
to owners of the parent, stated in U.S. dollars (1.15) (0.63) (1.25) (0.30)
Weighted average number of shares outstanding
(common and investment), in units 254,186,867 254,186,867 254,186,867 254,186,867
For the three month period
ended December, 31
For the twelve month period
ended December, 31

Compañía de Minas Buenaventura S.A.A. Third Quarter and Nine-Month 2015 Results
Page 23 of 24
Compañía de Minas Buenaventura S.A.A. and Subsidiaries
Consolidated Statement of Cash FlowsFor the three and twelve month periods ended December 31, 2015 and 2014
2,015 2,014 2,015 2,014
US$(000) US$(000) US$(000) US$(000)
Operating activities
Proceeds from sales (243,306) (288,003) 965,273 1,144,394
Value Added Tax (VAT) recovered (6,908) - 81,692 39,685
Royalties received (10,017) (9,104) 38,983 31,252
Dividends received (1,916) (6,012) 6,691 12,938
Interest received (1,153) (4,027) 3,650 8,333
Payments to suppliers and third-parties 173,546 285,678 (727,017) (805,413)
Payments to employees 47,409 46,424 (175,329) (203,496)
Payment of income tax 4,943 1,768 (22,330) (33,161)
Payment of royalties 5,429 5,783 (22,836) (22,631)
Payment of interest 4,235 4,032 (21,518) (9,405)
Net cash and cash equivalents provided by operating activities (27,738) 36,539 127,259 162,496
Investing activities
Proceeds from settlement of financial assets at fair value through profit or loss - 80 - -
Proceeds from collections of loans to associates 141 - - 15,553
Proceeds from sales of mining concessions, property, plant and equipment (2,892) (1,512) 5,481 1,681
Proceeds from settlement of investment in shares - - - -
Acquisitions of mining concessions, development costs, property, plant and equipment 44,759 (14,419) (211,286) (227,564)
Acquisitions of investment properties - (11,705) - -
Loans 104,829 - (125,629) -
Payments for acquisitions of other assets 10,238 - (10,238) -
Payment for purchase of investments - (57) - (80,316)
Opening of term deposits (7,350) - - -
Contributions and investments in associates 1,112 - (2,012)
Net cash and cash equivalents used in investing activities 149,725 (26,501) (341,672) (292,658)
Financing activities
Increase of bank loans (104,503) 504 344,503 40,000
Payment of bank loans (90,000) -
Increase in financial obligations 9,704 9,433 296 177,125
Payment of financial obligations 21 2,433 (29,891) (42,205)
Dividends paid (70) 5,845 - (8,642)
Dividends paid to non-controlling interest 2,440 2,640 (10,488) (8,880)
Purchase of associates' shares - -
Net cash and cash equivalents provided by (used in) financing activities (92,408) 20,855 214,420 157,398
Net increase (decrease) in cash and cash equivalents during the period 29,579 30,893 7 27,236
Cash and cash equivalents at the beginning of the period 48,940 47,619 78,512 51,276
Cash and cash equivalents at period-end 78,519 78,512 78,519 78,512
For the three month period
ended December, 31
For the twelve month period
ended December, 31

Compañía de Minas Buenaventura S.A.A. Third Quarter and Nine-Month 2015 Results
Page 24 of 24
APPENDIX 8
2,015 2,015
US$(000) US$(000)
Reconciliation of net profit (loss) to cash and cash equivalents provided by
Net profit (loss) attributable to owners of the parent 292,554 (317,210)
-
Plus (less): -
Depreciation and amortization (63,280) 242,465
Provision for impairment of inventories 973 12,737
Net loss (gain) on sales of mining concessions, property, plant and equipment 14,060 (440)
Net loss from currency exchange difference (6,039) 13,564
Provision for impairment of long-lived assets (7,452) 11,255
Accretion expense of provision for closure of mining units and exploration projects (412) 3,343
Provision for interest payable 1,659
Allowance for doubtful accounts 1,101
Provision for employee bonus 254 (119)
Net share in the results of associates under equity method (234,996) 173,375
Net profit (loss) attributable to non-controlling interest 22,743 (58,335)
Deferred income tax expense (income) (15,031) 541
Provision for estimated fair value of embedded derivatives related to concentrate 812 (7,159)
sales and adjustments on open liquidations 0
Other provisions (18,239) 18,670
-
Net changes in operating assets and liabilities -
-
Decrease (increase) in operating assets -
Trade and other accounts receivable, net 125,467 (73,497)
Inventory, net (58,592) 70,248
Income tax credit (2,437) 7,827
Prepaid expenses 27,727 (20,485)
-
Increase (decrease) in operating liabilities -
Trade and other accounts payable (25,779) (9,431)
Income tax payable (55,278) 54,331
Provisions (25,637) (1,112)
0
Dividends received (1,916) 6,691
Net cash and cash equivalents provided by operating activities (27,738) 127,259
For the three month
period ended December,
31
For the twelve month
period ended December,
31