budgeting for federal investment - congressional budget office
TRANSCRIPT

APRIL | 2021
Budgeting for Federal Investment
© Roschetzky Photography; fongbeerredhot; Krisana Antharith/Shutterstock.com

At a Glance
Federal investments can provide long-term benefits and can spur economic growth. The federal budget records expenses for investment projects up front, not over the project’s lifetime of use. Because of that mismatch between when costs are recorded and when benefits occur, investment projects may seem expensive relative to other government expenditures, and the large amounts of up-front funding required for some types of investments can make it difficult to fund them within the constraints of the budget process.
The economic benefits of increasing capital spending would depend on how well the additional funds were targeted to high-value projects and on the extent to which they displaced spending that would otherwise be undertaken by the private sector or by state and local governments. However, among competing uses of federal resources, more federal investment might not be the most warranted or desirable option.
This report examines budgetary options that would distinguish expenditures for investment in physical capital, education, and research and development from other expenditures.
• Adopting an accrual approach with a separate capital budget would spread the cost of investments over the period when potential benefits accrued rather than appearing in full when the spending occurred (the current cash-based approach). For physical capital, the budget would record costs as the assets lost value over time.
Such an approach would eliminate some of the spikes in programs’ budgets from up-front funding of new capital investments. In addition, accrual accounting would facilitate comparisons of competing programs’ costs and benefits. However, an accrual approach with a separate capital budget could lessen lawmakers’ control over budgetary resources, increase complexity, and diminish transparency. It would also make the federal budget process more prone to manipulation by federal agencies and policymakers that might adopt a broad definition of capital investment or understate depreciation costs.
• An alternative (more incremental) approach would provide both cash and accrual measures of capital spending in separate budgetary accounts within the unified budget, which shows the sum of all government activity. The accounts would be structured so that depreciation was reported in an agency’s budget (and netted out elsewhere), but the cash flows associated with an investment would affect the overall budget deficit, as they do now.
• Other options would retain cash-based accounting. To focus on investment spending, lawmakers could adopt a separate cash-based capital budget (an approach used by many states). A more limited change can be found in the Trump Administration’s 2021 budget, which proposed establishing a revolving fund to serve as a cash-based capital budget for federally owned buildings. Alternatively, lawmakers could establish a separate cap on investment funding within the unified budget.
www.cbo.gov/publication/56900
Contents
Summary 1
What Constitutes Federal Investment? 1
What Is the Cash-Based Approach to Federal Budgeting? 1
What Is the Accrual Approach toFederal Budgeting? 2
What Other Budgetary Approaches Could Lawmakers Pursue? 2
Chapter 1: Defining Federal Investment 5
The Congressional Budget Office’s Definition 6
The National Income and Product Accounts’ Definition 6
BOX 1-1. Depreciation as Measured in the National Income and Product Accounts 7
The Federal Financial Report’s Definition 8
Chapter 2: Federal Support for Investment 9
Trends in Investment Spending 9
Tax Expenditures 11
Nondefense Investment 12
Defense Investment 14
Chapter 3: The Current Budgetary Treatment of Investment and an Overview of Options to Change It 15
The Federal Budget and Federal Financial Reports 15
The Federal Budget’s Cash Treatment of Investment 16
The Federal Financial Report’s Accrual Treatment of Investment 17
An Example of the Different Treatments as Applied to an Infrastructure Investment 17
Options for Changing the Budgetary Treatment of Investment 18
Chapter 4: Options That Would Use an Accrual Approach to Capital Budgeting 21
Adopt an Accrual Approach With a Separate Capital Budget 21
Use a Mix of Cash and Accrual Measures in a Unified Budget 25
Chapter 5: Options That Would Use a Cash Approach to Capital Budgeting 27
Implement Separate Operating and Capital Budgets 27
Create a Separate Cap on Investment Funding 27
Create a Mandatory Capital Revolving Fund 28
Provide Supplemental Information on Investment Spending 32

II BUDGETING FOR FEDERAL INVESTMENT APRIL 2021
Appendix A: International Experience With Budgeting for Capital Investments 35
Accrual Budgeting in Practice 35
Controlling Spending With Accrual Budgeting 36
Challenges Posed by Accrual Budgeting 36
Appendix B: Capital Budgeting by the States 39
Capital Budgeting at the State Level 39
How States Define Capital Projects 40
Constraints on Capital Budgeting at the State Level 40
List of Tables and Figures 42
About This Document 43

Notes
Unless this report indicates otherwise, all years referred to are federal fiscal years, which run from October 1 to September 30 and are designated by the calendar year in which they end.
Numbers in the text and tables may not add up to totals because of rounding.
The Congressional Budget Office has corrected this report since its original publication. Corrections are listed at the end of the report.


Summary
In general, federal investment comprises spending on goods and services that provide benefits for a long time after their acquisition. The federal budget records the full cost of commitments for federal investments when they are incurred, and it records the associated cash expendi-tures as outlays when they are disbursed. That budgetary practice is consistent with the principle that the budget acknowledges commitments when they are made, which is when they are easiest to control and verify.
Some observers question whether that system provides lawmakers with the information they need to allocate the government’s resources most efficiently among compet-ing priorities. Different approaches to capital budgeting might provide lawmakers with more information about federal investments, but they would complicate the budget process and, in some cases, lessen control over spending.1
The alternative approach to budgeting for federal invest-ment most frequently considered by policymakers is an accrual-based accounting system with a separate capital budget. Under that system, budgetary obligations and outlays for federal investments would be spread over many years to match annual budgetary resources with the assets’ pace of depreciation (wear and tear and tech-nical obsolescence). That approach roughly corresponds to the system used by the private sector, by the federal government in its annual financial report, and by several other countries. It would better align the assets’ costs and benefits with their period of use.
What Constitutes Federal Investment?In general, federal investments are assets that are expected to contribute to the economy for years to come. Many types of federal spending on goods and services meet that broad definition, though. As defined by the Congressional Budget Office, federal investment consists of three broad categories of spending, which are listed in
1. This report updates and expands on Congressional Budget Office, Capital Budgeting (May 2008), www.cbo.gov/publication/41689.
order of their combined outlays for defense and nondefense investments in 2019.
• Physical capital, such as highways and buildings, which contributes to the functioning of the economy or national defense ($275 billion, or 6 percent of total federal outlays);
• Education and training, which helps produce a skilled and capable workforce ($126 billion, or 3 percent of total federal outlays); and
• Research and development (R&D), which encompasses a wide variety of work in government laboratories, universities, and the private sector ($124 billion, or 3 percent of total federal outlays).
What Is the Cash-Based Approach to Federal Budgeting? The federal budget generally reports outlays for federal activities, including investments—no matter how long their expected useful life—on a cash basis when the funds are disbursed. The authority to incur financial obligations that will result in outlays of federal govern-ment funds (which is called budget authority) is pro-vided up front by law before an asset can be acquired. (A notable exception is budget authority for major defense acquisitions, which can be provided over several years.) Appropriation acts provide that authority for most federal investments. Obligations of budget authority are recorded up front when the funds are legally committed, and estimates of how legislative proposals would affect the federal deficit reflect cash-based measures of costs over a 10-year period.
The main advantages of cash-based budgeting for federal investments are that it provides more complete informa-tion than accrual measures when funding decisions are being made, improves control over spending, and results in transparent and verifiable measures. The key disadvan-tage is that cash-based budgeting does not distinguish between investment spending and other types of spend-ing that support current consumption; as a result, too few resources might be devoted to federal investment.
2 BUDGETING FOR FEDERAL INVESTMENT APRIL 2021
What Is the Accrual Approach to Federal Budgeting?Accrual budgeting for federal investments differs from accrual budgeting for other federal activities and pro-grams.2 For most programs, accrual budgeting consoli-dates a long-term stream of future cash flows, but capital budgeting on an accrual basis would do the opposite: It would spread out the costs of investments that have large up-front expenditures and long-term benefits or useful-ness. One frequently proposed accrual approach would segregate cash spending on capital projects in a separate capital budget and report the cost in the regular (or “operating”) budget as the assets lost value. For physical capital, the operating budget would record costs as the assets depreciated. For education and training and R&D, which do not lose value at measurable rates, costs could be spread over the period when benefits were received.
According to proponents of an accrual approach with a separate capital budget, the large amount of up-front funding required for investments creates a bias against such spending and discourages additional spending that would benefit the economy by boosting productivity. Lawmakers might be reluctant to provide sharp increases in funding for new investments, especially if funding for other programs and activities declined as a result. (Some programs—like federal grants to state and local governments for transportation infrastructure—provide funding for many projects across the country, so large spikes in total federal spending for those programs would seldom occur.) Proponents assert that capital budget-ing would eliminate some of the spikes in programs’ budgets from new investments and would better match budgetary costs with benefit flows. The extent of any bias against investments that result in large spikes in funding is unknown, however, and whether lawmakers would allocate funding differently with a capital budget is uncertain.
Previous groups charged with exploring budgetary con-cepts have rejected capital budgeting for the federal gov-ernment.3 They contend that adopting capital budgeting on an accrual basis would increase complexity, diminish
2. See Congressional Budget Office, Cash and Accrual Measures in Federal Budgeting (January 2018), www.cbo.gov/publication/53461.
3. See President’s Commission to Study Capital Budgeting, Report of the President’s Commission to Study Capital Budgeting (February 1999), https://clintonwhitehouse3.archives.gov/pcscb/; and President’s Commission on Budget Concepts, Report of the
transparency, and make the federal budget process more sensitive to small changes in assumed parameters, such as depreciation rates. Furthermore, simply arriving at a uniform definition of investment for budgetary purposes would be a significant challenge (see Chapter 1). In addi-tion, providing special treatment to certain areas of the budget, such as capital spending, could make the process more prone to manipulation. Lawmakers could make projects appear less expensive, for instance, by adopting a broad definition of capital investment or by understating depreciation costs. Other countries’ experience with capi-tal budgeting suggests the need for additional controls on asset purchases, including annual limits on the acquisi-tion of capital, to limit any increase in debt.
What Other Budgetary Approaches Could Lawmakers Pursue?Switching from a cash-based system to a fully accrual- based system for federal investments would be a large undertaking. Lawmakers could pursue other approaches that were more incremental or that focused on a partic-ular aspect of the budget. Those approaches might focus on changing budget enforcement rules or implementing procedures that improved the incentives for policymakers and agencies to focus on the long-term benefits and costs of capital investments.
For example, lawmakers could provide cash and accrual measures of capital spending in different budgetary accounts within the current overall federal budget. The accounts would be structured so that depreciation was reported in an agency’s budget (and netted out elsewhere), and only the cash flows associated with an investment would affect the overall budget deficit, as they do now. That approach might avoid the spikes in agencies’ budgets caused by spending on major invest-ment projects.
If lawmakers wanted to retain a cash-based approach to budgeting, the federal government could prepare a capital budget on a cash basis that was separate from its operating budget. Many states already use that approach for their own investment spending. Alternatively, the Congress could establish a separate cap on funding for federal investments. (Currently, total defense and non-defense appropriations are capped.) Or lawmakers could establish a revolving fund to serve as a capital budget, in this case for federally owned buildings—a proposal
President’s Commission on Budget Concepts (October 1967), pp. 9 and 33–35, http://tinyurl.com/y7lxv3gp (PDF, 7.8 MB).

3SUMMARY BUDGETING FOR FEDERAL INVESTMENT
featured in the Trump Administration’s 2021 budget. That fund would use rent collections (as well as man-datory funding) to help finance its spending. That approach also might avoid the spikes in agencies’ budgets from spending on major investment projects.
Under any of those approaches, budget authority and outlays for federal investments would continue to be reported up front in the budget on a cash basis, so lawmakers would still control the amount of federal investment spending through the provision of budget authority.
The budget process is already complicated, and it would become even more so if any of the approaches examined in this report were implemented. Another consideration is that two of the approaches, the accrual-based approach with a separate capital budget and the states’ approach of having a separate cash-based capital budget, would undermine the concept of a unified federal budget, which shows the sum of all government activity and has been the basis for federal budgeting since the late 1960s. An alternative to capital budgeting would be having the Congress request supplemental information about federal investments before committing any funds.


Chapter 1: Defining Federal Investment
The federal budget mostly uses a cash-based approach to record expenses for investment projects—accounting for them in full when the spending occurs—even though the benefits of those projects can extend for years. An accrual approach with a separate capital budget would spread the cost of those investments over the useful life of the asset. Switching to an accrual or other accounting system for capital budgeting would be a major challenge, though, in part because there is no single accepted definition of federal investment.
In general, investment refers to assets—goods and services—that provide benefits over a long period after their acquisition. However, some government activities that are not typically categorized as investment also fit that broad definition. For example, some analysts classify government spending on programs to reduce child poverty as an investment.1
Specific definitions of investment can vary depending on who owns an asset or who pays for it. Although the government’s investments are public goods and services, they often provide a mix of public and private benefits and may be publicly or privately owned and operated. The federal government pays for more physical capital than it owns: Roads, airports, and mass transit systems, for instance, are paid for at least in part with federal revenues but are under the control of state and local gov-ernments or independent authorities. For analysts who are primarily interested in how investment affects pro-ductivity, it matters less whether the federal government owns an investment because the benefits are shared.2 For
1. See Hilary W. Hoynes, and Diane Whitmore Schanzenbach, Safety Net Investments in Children, Brookings Papers on Economic Activity (Spring 2018), pp. 89–138, https://tinyurl.com/sdw4c74a.
2. Some analysts favor limiting investment spending to activities that raise long-term private-sector productivity; see the testimony of Paul L. Posner, Director, Budget Issues, Accounting and Information Management Division, General Accounting Office (now the Government Accountability Office), before the Subcommittee on Government Management, Information,
analysts who are more interested in the federal balance sheet, which reports federal assets and liabilities, the question of ownership is more critical. One reason is that the federal government has little control over the mainte-nance and other upkeep of the infrastructure assets that it helps fund but does not own.
Some definitions of investment focus narrowly on physi-cal infrastructure, such as highways and water treatment facilities; others have a broader focus and include intan-gible assets, such as investment in education and social services. Recipients are the primary beneficiaries of those services, but the government also shares in the benefits through a stronger economy or the improved health and welfare of the population.
Deciding what types of goods and services meet the definition of investment—and therefore what spend-ing to include in a capital budget—could significantly affect the allocation of resources as well as the amount of spending recorded in the federal budget in a given year. A wide-ranging definition might encompass so many activities as to make the categorization unhelpful, and it could invite criticism that a capital budget would simply be a device for understating federal spending; a limited definition could lead to forgone spending in other areas—education and training or research and development, for instance—that might be as productive as investments in physical capital. This analysis examines three definitions of federal investment.
and Technology of the House Committee on Government Reform and Oversight, Budget Structure: Providing an Investment Focus in the Federal Budget, GAO/T-AIMD-95-178 (June 29, 1995), www.gao.gov/products/T-AIMD-95-178. Some analysts would include tax expenditures that support investments in that category of spending; see Steve Redburn, Budgeting for Investment, Discussion Papers on Re-Imagining the Federal Budget Process (Brookings Institution, March 2017), p. 5, www.brookings.edu/research/budgeting-for-investment/.

6 BUDGETING FOR FEDERAL INVESTMENT APRIL 2021
The Congressional Budget Office’s DefinitionIn CBO’s view, federal investment consists of spending in three broad areas.3
• Physical capital includes structures, such as government buildings, transportation infrastructure, and water and power projects; major equipment, such as computers, machinery, and vehicles; and software, information systems, and technology. To qualify as investment, physical capital must have an estimated useful life of at least two years. Most federal investment spending for defense programs and activities is for purchases of major equipment, such as ships and aircraft. Investment spending on physical capital for nondefense programs and activities, by contrast, is dominated by transportation spending, which provides infrastructure that contributes to the functioning of the economy.
• Research and development has three components: basic research, which seeks to discover scientific principles; applied research, which attempts to translate those discoveries into practical applications; and the development of new products and technologies. Federal R&D spending supports work in government laboratories, universities, and the private sector. That investment builds the stock of knowledge that helps expand the economy over time or strengthen national defense.
• Education and training includes early childhood, elementary, secondary, and postsecondary education, as well as job training and vocational training (but not military training) for veterans and other people. Federal spending on those activities helps produce a skilled, capable workforce that contributes to the country’s productivity and thus enhances the body of skills, knowledge, and experience that the population possesses (its human capital).
In some cases, it is difficult to determine what qualifies as federal investment and what does not. CBO does not regard spending on health care and school lunch pro-grams for children as investment spending, for example, because the goods and services are promptly consumed. Yet keeping children healthy and nourished improves
3. See Congressional Budget Office, Federal Investment, 1962 to 2018 (June 2019), www.cbo.gov/publication/55375.
their ability to learn and produces a healthier and more capable future workforce. A second reason the agency does not classify health care spending as investment spending is because the empirical link between increases in federal spending on health care and greater private-sector productivity is not well established.4 For similar reasons, spending on most social services does not qualify as investment spending, in CBO’s estimation.
CBO’s definition of federal investment is consistent with the categories used by the Office of Management and Budget (OMB).5 OMB defines federal capital assets more narrowly than federal investment, though, and it excludes grants to state and local governments, spending on R&D, and education and training.
The National Income and Product Accounts’ Definition The national income and product accounts (NIPAs) provide a general economic framework that describes the entire U.S. economy, and they show how the federal government fits into that framework. Compiled by the Bureau of Economic Analysis (BEA) in the Department of Commerce, the NIPAs are used to determine gross domestic product (GDP) and other measures. Specifically, the accounts detail current production and the resulting income over specific periods, the major sources of that production, and the recipients of that income.6 In the context of the NIPAs, the federal govern-ment is both a producer and a consumer.
BEA’s definition of investment includes most of what CBO identifies as investment but omits spending on education. Spending on R&D was first included as investment in the NIPAs in July 2013. BEA measures R&D as the sum of its production or input costs and
4. See Congressional Budget Office, The Macroeconomic and Budgetary Effects of Federal Investment (June 2016), www.cbo.gov/publication/51628.
5. For OMB’s discussion of federal investment, see Office of Management and Budget, Budget of the U.S. Government, Fiscal Year 2020: Analytical Perspectives (March 2019), Chapter 16, https://govinfo.gov/app/collection/budget. For details on OMB’s annual instructions to agencies’ budget officers, see Office of Management and Budget, Circular A-11, Appendix J and Supplement to Part 7: Capital Programming Guide (2019), p. 54, https://tinyurl.com/xtzpj9z3 (PDF, 1.7 MB).
6. See Congressional Budget Office, CBO’s Projections of Federal Receipts and Expenditures in the National Income and Product Accounts: 2019 to 2029 (July 2019), www.cbo.gov/publication/55466.

7CHAPTER 1: DEFINING FEDERAL INVESTMENT BUDGETING FOR FEDERAL INVESTMENT
treats all R&D as contributing to the stock of knowledge and the provision of public services.7
As part of their GDP account, the NIPAs estimate government investment. Like private investment, public investment yields a capital stock that is used to provide a stream of government consumption expenditures
7. See Carol E. Moylan and Sumiye Okubo, The Evolving Treatment of R&D in the U.S. National Economic Accounts (Bureau of Economic Analysis, 2020), https://go.usa.gov/x7yBT (PDF, 494 KB); Dylan G. Rassier, “BEA Briefing: Treatment of Research and Development in Economic Accounts and in Business Accounts,” Survey of Current Business, vol. 94, no. 3 (March 2014), https://apps.bea.gov/scb/toc/0314cont.htm; and Bureau of Economic Analysis, “Preview of the 2013 Comprehensive Revision of the National Income and Product Accounts: Changes in Definitions and Presentations,” Survey of Current Business, vol. 93, no. 3 (March 2013), pp. 13–39, https://apps.bea.gov/scb/toc/0313cont.htm.
(defense and nondefense) that is also part of GDP. In the NIPA income account (gross domestic income), the income attributable to government capital exactly equals capital consumption (economic depreciation).
The NIPA government accounts include multiple measures of government spending. Current government expenditures, which include government consumption and therefore capital consumption, are subtracted from current revenues to yield net saving, which is an accrual version of the current deficit. (For details, see Box 1-1.) Total government expenditures, which also include gov-ernment gross investment and other capital-type expen-ditures but exclude capital consumption, are subtracted from total receipts to yield net lending, which is more like a cash measure of the current deficit.
Box 1-1 .
Depreciation as Measured in the National Income and Product Accounts
The measure of depreciation used in the Bureau of Economic Analysis’s (BEA’s) national income and product accounts (NIPAs) is economic depreciation, which is the gradual decrease in the market value of an asset over time. That measure of depre-ciation differs from the depreciation that a corporation can take for tax purposes, in which the cost of acquiring an asset is expensed over a certain period of time according to a set schedule. Economic depreciation is not accelerated (unlike most depreciation for tax purposes), and it is based on an asset’s replacement cost, not its historic cost. (Accelerated depreciation allows greater expensing in the early years of the life of an asset.)
BEA’s measure of depreciation includes accidental damage, but it excludes losses from natural disasters and losses of military equipment during wartime, because the loss of structures and equipment produced in previous periods does not directly affect current production or income (except to the extent that it affects production capacity), which is what the NIPAs measure. Instead, losses of assets from natural disasters and wars are reported as changes in the net stock of produced assets, and the amount of the loss is deducted before depreciation is calculated.1
1. See Eugene P. Seskin and Shelly Smith, “Preview of the 2009 Comprehensive Revisions to the NIPAs,” Survey of Current Business, vol. 89, no. 3 (March 2009), pp. 11–15, https://apps.bea.gov/scb/
For investments in research and development (R&D), BEA bases its estimate of depreciation on the useful life of their contribution to output. Because that future contribution is not observable, BEA uses its judgment—in addition to annual sur-veys by the National Science Foundation on the rates at which new technology is introduced—to determine those estimates. Private-sector accounting, by contrast, expenses R&D up front rather than treat it as an investment.
Specifically, BEA uses different estimates of the annual depre-ciation rate for different types of federal R&D: 7 percent for space science, 9 percent for health, 16 percent for transporta-tion, and 16 percent or 20 percent for defense, depending on the project. Some of BEA’s estimates for federal R&D are the same ones it uses for private R&D, but others take into account the highly specialized nature of some types of federal tech-nology. For example, BEA’s estimates for investment in R&D for stealth technology are based on how long that technology would remain valuable for a particular military aircraft.2
toc/0309cont.htm; and Bureau of Economic Analysis, “Frequently Asked Questions: How Are the Measures of Production and Income in the National Accounts Affected by a Natural or Man-Made Disaster?” (November 28, 2012), www.bea.gov/help/faq/1013.
2. See Bureau of Economic Analysis, BEA Depreciation Estimates (2013), pp. 7 and 13, https://go.usa.gov/x7zEY (PDF, 83 KB).
CBO has corrected this page since the report was originally published. Corrections are listed at the end of the report.

8 BUDGETING FOR FEDERAL INVESTMENT APRIL 2021
A significant amount of what is often thought of as federal spending on physical capital shows up elsewhere in the NIPAs. Federal spending for infrastructure that is generally provided through grants to state and local governments—for air transportation, highways, tran-sit, and water treatment plants—is excluded from the NIPAs’ estimates of federal investment and from federal expenditures. Instead, such spending is recorded as state investment, and depreciation of those assets is part of the expenditure measure for states, which own the assets and pay most of the costs to maintain them.
The Federal Financial Report’s Definition The federal budget tracks the government’s cash flows, spending and receipts, and deficits and debt so that policymakers can see how fiscal policy changes over time and understand the nature and scope of government activities. To supplement that information, the fed-eral government supplies financial details in a separate annual report, the Financial Report of the United States Government. That report’s balance sheet and statement of net cost provide information on holdings of capital assets and depreciation of that capital.8 It helps show how the federal government’s net financial position (the difference between its assets and liabilities) changed during the year.
The Financial Report adopts a narrower definition of investment than CBO, limiting it to physical capital and excluding intangible assets, such as R&D and education and training. It provides an estimated value (original cost minus accumulated depreciation) of federal prop-erty, plant, and equipment (defined as tangible assets that have a useful life of at least two years and are not intended for resale). That category includes capital leases but excludes most federal lands—including military bases, national parks, and forests—as well as roads, air-ports, and other facilities that are owned or controlled by other entities.
8. See Department of the Treasury, Financial Report of the United States Government, FY 2019 (February 2020), https://go.usa.gov/xshpc.
Using those accounting guidelines, federal agencies report the value of their investments as an asset and report depreciation as an expense.9 At the end of fiscal year 2019, the federal government reported $1.1 trillion of property, plant, and equipment on its balance sheet. The original cost of those assets was $2.4 trillion, and the difference of $1.3 trillion is accounted for by deprecia-tion (see Table 1-1). Assets for national defense—mostly military equipment, such as ships, aircraft, combat vehicles, and weapons—account for about 70 percent of that value.
9. Ibid., pp. 59 and 86.
Table 1-1 .
Value of Federal Property, Plant, and Equipment as of September 30, 2019Billions of Dollars
Original Cost
Accumulated Depreciation Net Value
Buildings, Structures, andFacilities a 776 470 306Equipment, Furniture, and Fixtures 1,388 810 578Construction in Progress 172 n.a. 172Internal Use Software 52 32 19Land a 22 n.a. 22Other Assets 32 22 10
Total 2,440 1,333 1,107
Data source: Department of the Treasury, Financial Report of the United States Government, Fiscal Year 2019 (February 2020), p. 86. See www.cbo.gov/publication/56900#data.
Numbers may not add up to totals because of rounding.
n.a. = not applicable.
a. For financial reporting purposes, property, plant, and equipment excludes heritage assets and stewardship land. Heritage assets include national treasures like the Washington Monument. Stewardship land (such as national parks and forests) is held for the general welfare of the nation and is intended to be preserved and protected.
Chapter 2: Federal Support for Investment
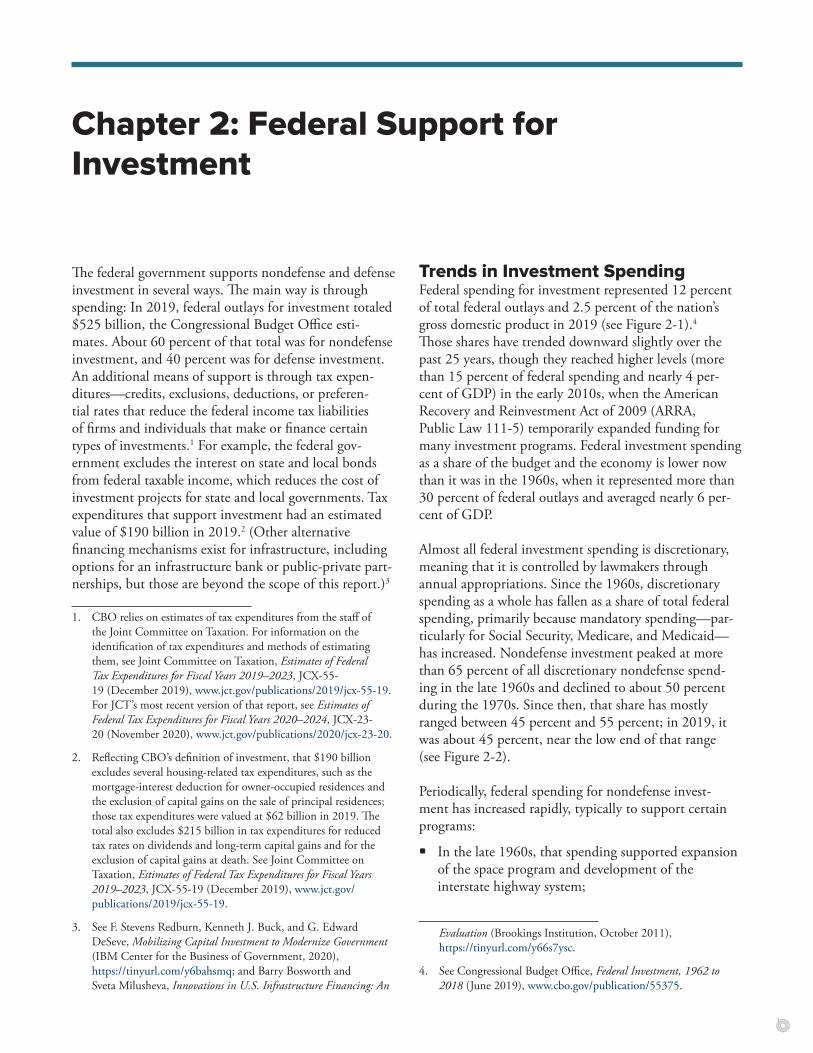
The federal government supports nondefense and defense investment in several ways. The main way is through spending: In 2019, federal outlays for investment totaled $525 billion, the Congressional Budget Office esti-mates. About 60 percent of that total was for nondefense investment, and 40 percent was for defense investment. An additional means of support is through tax expen-ditures—credits, exclusions, deductions, or preferen-tial rates that reduce the federal income tax liabilities of firms and individuals that make or finance certain types of investments.1 For example, the federal gov-ernment excludes the interest on state and local bonds from federal taxable income, which reduces the cost of investment projects for state and local governments. Tax expenditures that support investment had an estimated value of $190 billion in 2019.2 (Other alternative financing mechanisms exist for infrastructure, including options for an infrastructure bank or public-private part-nerships, but those are beyond the scope of this report.)3
1. CBO relies on estimates of tax expenditures from the staff of the Joint Committee on Taxation. For information on the identification of tax expenditures and methods of estimating them, see Joint Committee on Taxation, Estimates of Federal Tax Expenditures for Fiscal Years 2019–2023, JCX-55-19 (December 2019), www.jct.gov/publications/2019/jcx-55-19. For JCT’s most recent version of that report, see Estimates of Federal Tax Expenditures for Fiscal Years 2020–2024, JCX-23-20 (November 2020), www.jct.gov/publications/2020/jcx-23-20.
2. Reflecting CBO’s definition of investment, that $190 billion excludes several housing-related tax expenditures, such as the mortgage-interest deduction for owner-occupied residences and the exclusion of capital gains on the sale of principal residences; those tax expenditures were valued at $62 billion in 2019. The total also excludes $215 billion in tax expenditures for reduced tax rates on dividends and long-term capital gains and for the exclusion of capital gains at death. See Joint Committee on Taxation, Estimates of Federal Tax Expenditures for Fiscal Years 2019–2023, JCX-55-19 (December 2019), www.jct.gov/publications/2019/jcx-55-19.
3. See F. Stevens Redburn, Kenneth J. Buck, and G. Edward DeSeve, Mobilizing Capital Investment to Modernize Government (IBM Center for the Business of Government, 2020), https://tinyurl.com/y6bahsmq; and Barry Bosworth and Sveta Milusheva, Innovations in U.S. Infrastructure Financing: An
Trends in Investment Spending Federal spending for investment represented 12 percent of total federal outlays and 2.5 percent of the nation’s gross domestic product in 2019 (see Figure 2-1).4 Those shares have trended downward slightly over the past 25 years, though they reached higher levels (more than 15 percent of federal spending and nearly 4 per-cent of GDP) in the early 2010s, when the American Recovery and Reinvestment Act of 2009 (ARRA, Public Law 111-5) temporarily expanded funding for many investment programs. Federal investment spending as a share of the budget and the economy is lower now than it was in the 1960s, when it represented more than 30 percent of federal outlays and averaged nearly 6 per-cent of GDP.
Almost all federal investment spending is discretionary, meaning that it is controlled by lawmakers through annual appropriations. Since the 1960s, discretionary spending as a whole has fallen as a share of total federal spending, primarily because mandatory spending—par-ticularly for Social Security, Medicare, and Medicaid—has increased. Nondefense investment peaked at more than 65 percent of all discretionary nondefense spend-ing in the late 1960s and declined to about 50 percent during the 1970s. Since then, that share has mostly ranged between 45 percent and 55 percent; in 2019, it was about 45 percent, near the low end of that range (see Figure 2-2).
Periodically, federal spending for nondefense invest-ment has increased rapidly, typically to support certain programs:
• In the late 1960s, that spending supported expansion of the space program and development of the interstate highway system;
Evaluation (Brookings Institution, October 2011), https://tinyurl.com/y66s7ysc.
4. See Congressional Budget Office, Federal Investment, 1962 to 2018 (June 2019), www.cbo.gov/publication/55375.

10 BUDGETING FOR FEDERAL INVESTMENT APRIL 2021
• In the late 1970s, it paid for improvements to water systems mandated by the Clean Water Act;
• In the late 1990s and early 2000s, it funded research and development for health-related programs; and
• In the late 2000s and early 2010s, ARRA-related outlays fostered the development of infrastructure for transportation and boosted spending for education at all levels.5
For defense investment, the federal government’s spend-ing (both in inflation-adjusted dollars and as a share of the economy) has risen and fallen in tandem with the country’s international conflicts. Defense investment as
5. Ibid., p. 18.
a share of all discretionary defense outlays rose to about 50 percent—its peak—during the Vietnam War in the early 1960s. The other period of increased spending was during the intensifying Cold War arms race of the 1980s, when the share reached 45 percent (see Figure 2-2). Since then, that share has declined to a low of under 31 percent in 2015. In 2019, investment’s share of dis-cretionary defense outlays increased to about 33 percent, primarily because of a jump in weapons procurement.
In recent years, decisions about investment spending have been made in the context of annual caps on discretion-ary appropriations, which were initially set in 2012 by the Budget Control Act of 2011 (P.L. 112-25) and later extended through 2021. Those caps have limited most nonemergency discretionary funding to amounts that are
Figure 2-1 .
Federal Nondefense and Defense Investment Outlays, 1962 to 2019
0
1
2
3
4
5
6
7
1964 1969 1974 1979 1984 1989 1994 1999 2004 2009 2014 2019
0
100
200
300
400
500
600
700
1964 1969 1974 1979 1984 1989 1994 1999 2004 2009 2014 2019
Defense
Total
Nondefense
Defense
Total
Nondefense
Billions of 2019 Dollars
219
306
525
2.5
1.0
1.4
Percentage of Gross Domestic Product
Data sources: Office of Management and Budget; American Public Transportation Association; Bureau of Economic Analysis. See www.cbo.gov/publication/56900#data.
The figure reports budget outlays as the measure of investment spending.

11CHAPTER 2: FEDERAL SUPPORT FOR INVESTMENT BUDGETING FOR FEDERAL INVESTMENT
smaller than what would have been provided if annual appropriations had grown at the rate of inflation. Under current law, the caps are set to expire after 2021.6
6. For more details on the caps on appropriations, see Congressional Budget Office, The Budget and Economic Outlook: 2020 to 2030 (January 2020), pp. 1–23, www.cbo.gov/publication/56020.
Tax ExpendituresMeasured on a cash basis, most of the tax expenditures that supported investment in 2019 (roughly 70 percent) were for investments in physical capital. The largest source of such support stems from provisions that allow businesses to accelerate tax deductions for the depreci-ation of equipment, allowing for larger tax deductions earlier in the assets’ expected lifetime. Legislation enacted in December 2017 temporarily expanded that tax
Figure 2-2 .
Federal Nondefense and Defense Investment Outlays Relative to Federal Outlays, 1962 to 2019Percent
0
10
20
30
40
50
60
70
1964 1969 1974 1979 1984 1989 1994 1999 2004 2009 2014 2019
0
10
20
30
40
50
60
70
1964 1969 1974 1979 1984 1989 1994 1999 2004 2009 2014 2019
Defense
TotalNondefense
Defensec
Nondefenseb
4.96.9
11.8
33.1
45.2
Investment as a Share of Total Outlaysa
Investment as a Share of Nondefense or Defense Discretionary Outlays
Data sources: Office of Management and Budget; American Public Transportation Association. See www.cbo.gov/publication/56900#data.
Only a very small portion of federal investment is funded through mandatory spending.
The figure reports budget outlays as the measure of investment spending.
a. Includes discretionary spending, mandatory spending, and net interest.
b. Indicates nondefense investment as a share of total discretionary outlays for nondefense purposes.
c. Indicates defense investment as a share of total discretionary outlays for defense purposes.

12 BUDGETING FOR FEDERAL INVESTMENT APRIL 2021
expenditure by allowing for 100 percent bonus depreci-ation (or immediate expensing) of equipment purchases through 2022.
A cash measure may not be the most informative gauge of support, though, because it indicates the net amount of accelerated deductions claimed in a particular year independent of when the investment occurred. Because that tax expenditure provides a benefit by accelerating a tax deduction (decreasing revenues now while increas-ing revenues in the future, when the deduction would have otherwise been taken), the net present value of that timing benefit may more accurately reflect the economic effects. The net present value of the tax expenditure for investments in physical capital made in 2019, in CBO’s estimation, was smaller than the cash measure of deduc-tions claimed in 2019.
A smaller source of support arises from the exclusion from taxable income of the interest on bonds issued by state and local governments.
Beyond investments in physical capital, about 20 percent of the tax expenditures in 2019 supported investments in education and training, mainly through deductions for charitable giving to educational institutions, credits for tuition for postsecondary education, exclusions of earnings on qualified tuition plans, and deductions for interest on student loans. The remaining 9 percent of the 2019 tax expenditures supported research and develop-ment, mostly through credits for research activities.
Nondefense InvestmentMore than half of all federal investment is for nondefense purposes. In 2019, outlays for nondefense investment totaled $306 billion, accounting for 58 percent of total federal investment outlays. Of that total, the largest shares were for education and training (41 percent) and physical capital (37 percent). The rest (22 percent) was for research and development (see Figure 2-3).
Education and Training The majority of federal nondefense investment in educa-tion and training in 2019 went for two purposes: higher education (35 percent), and elementary, secondary, and vocational education (32 percent). Nearly all of the investment in higher education was made directly by the federal government, and most of it was provided through Pell grants.7 In contrast, federal investment in elementary,
7. The $126 billion spent on education and training in 2019 excludes a $26 billion investment in higher education
secondary, and vocational education was almost entirely in the form of grants to state and local governments.
Physical Capital Since the early 1960s, the largest category of federal non-defense investment in physical capital has been grants to state and local governments. In 2019, such grants accounted for 68 percent of the $112 billion in federal nondefense investment in physical capital.8 The majority (54 percent) was for transportation, nearly all of which was distributed as grants to state and local governments from federal trust funds, such as the Highway Trust Fund.9 The federal grants also covered investments in pollution control and abatement, as well as community and regional development.
Most infrastructure spending is handled by state and local governments, which own most of the highways, mass transit systems, airports, and water utilities nation-wide. State and local governments typically spend
provided through student loan programs (including discretionary administrative costs), as estimated under the rules established by the Federal Credit Reform Act of 1990. The loan programs can reduce the deficit or increase the deficit, depending in part on the size and direction of credit reestimates (changes to the estimated costs of the outstanding loan portfolio). In 2018, the budget reported a large negative reestimate ($9 billion), compared with a large positive reestimate in 2019 ($28 billion). Because of the negative reestimate, which generates budgetary savings, the programs yielded net savings of $11 billion for the federal government in 2018. (Whether the programs generate costs or savings under budget accounting rules also depends on other factors, such as the difference between the interest rate paid by borrowers and the average rate at which the Treasury borrows money, as well as the number of borrowers who default and the amounts recovered.)
8. Based on data from the American Public Transportation Association, CBO decreased the Office of Management and Budget’s estimates of grants by $4.5 billion to account for grants that went to support state and local governments’ operations, including infrastructure maintenance. See American Public Transportation Association, 2020 Public Transportation Fact Book, Appendix A: Historical Tables (March 2020), Tables 80 and 87, https://tinyurl.com/y4n5wy4j.
9. In its February 2021 baseline, CBO projects that under current law, the Highway Trust Fund would be exhausted in 2022. Sustaining it will require some or all of these approaches: continued transfers from the federal government’s general fund, reduced spending on highways and transit programs, increases in existing taxes on highway users, and new taxes credited to the Highway Trust Fund. For more details, see Congressional Budget Office, Reauthorizing Federal Highway Programs: Issues and Options (May 2020), www.cbo.gov/publication/56346; and Issues and Options for a Tax on Vehicle Miles Traveled by Commercial Trucks (October 2019), www.cbo.gov/publication/55688.

13CHAPTER 2: FEDERAL SUPPORT FOR INVESTMENT BUDGETING FOR FEDERAL INVESTMENT
roughly three times as much money on highways each year as the federal government does, not only on capital projects but also to operate and maintain roads.
To finance that investment, state and local governments use various mechanisms. Over the 2007–2016 period, 60 percent of the infrastructure investment that state and local governments made from their own funds (exclud-ing federal grants) was financed using mechanisms that impose costs on the federal government:
• Tax-exempt bonds,
• Tax credit bonds,
• Federal credit programs, which offer loans or loan guarantees for infrastructure projects,10 and
10. See Congressional Budget Office, Federal Support for Financing State and Local Transportation and Water Infrastructure (October 2018), www.cbo.gov/publication/54549.
• State revolving funds and infrastructure banks (“state banks”).
All levels of government face calls to improve highways and other transportation systems, and federal lawmakers are considering proposals to significantly increase infra-structure spending. Lawmakers at all levels of govern-ment also face demands to make water and wastewater treatment systems safer and less expensive for users.11
11. See Congressional Budget Office, Public-Private Partnerships for Transportation and Water Infrastructure (January 2020), www.cbo.gov/publication/56003; The Penn Wharton Budget Model, “The $2 Trillion Congressional Democrat and White House Infrastructure Proposal” (brief, University of Pennsylvania, May 21, 2019), https://tinyurl.com/y4llwzbd; and Diane Whitmore Schanzenbach, Ryan Nunn, and Greg Nantz, If You Build It: A Guide to the Economics of Infrastructure Investment (The Hamilton Project, Brookings Institution, February 2017), https://tinyurl.com/y4gt72ge.
Figure 2-3 .
Federal Nondefense and Defense Investment Outlays, 2019Billions of Dollars
0
100
200
300
400
Nondefense Defense
Total: $306 Billion
Total: $219 Billion$126 Billion(41%)
$68 Billion(22%)
$112 Billion(37%)
Education andTraining
Research andDevelopment
Physical Capital
$56 Billion (26%)
$163 Billion (74%)
Data sources: Office of Management and Budget; American Public Transportation Association. See www.cbo.gov/publication/56900#data.
The nondefense outlays for education and training exclude a $26.5 billion investment in higher education through student loan programs in 2019, as estimated under the rules established by the Federal Credit Reform Act of 1990.
The Department of Defense (DoD) also spends money on education and training, but it is not reflected in the data on federal investment spending because much of it goes to train service members and employees to do their jobs. However, in 2019, nearly $13 billion went to the military academies, the education of service members’ children, and certain specialized training—all of which aligns with CBO’s definition of investment. That spending is not included in this report because DoD reports it only as obligational authority; therefore, it is not consistent with the spending described throughout this report, which is reported as outlays.
The figure reports budget outlays as the measure of investment spending.

14 BUDGETING FOR FEDERAL INVESTMENT APRIL 2021
Research and DevelopmentFederal nondefense investment in R&D was $68 billion in 2019. Just over half of that amount went to health research, which is mostly directed by the National Institutes of Health, for investigating cancer, infectious diseases, and other conditions. An additional one-third or so of funding went to general science, space, and tech-nology. The two largest recipients of those funds were the National Aeronautics and Space Administration, for research in planetary and earth sciences and space opera-tions, and the National Science Foundation, for research in the physical sciences and engineering.
In response to the 2020–2021 coronavirus pandemic, the Congress appropriated about $48 billion in calen-dar year 2020 to assist in developing, manufacturing, and procuring vaccines, therapeutic aids, and diagnostic tools. (A precise breakout of the spending between R&D and procurement is not yet available.) Also in 2020, the federal government entered into contracts with manu-facturers of vaccines that totaled $15 billion and with manufacturers of therapeutic aids or diagnostic tools
that totaled approximately $3 billion. Outlays stemming from those contracts totaled about $8 billion in 2020.
Defense InvestmentOutlays for defense-related investment in 2019 totaled $219 billion. Three-quarters of that amount was spent on physical capital, such as weapons, equipment, and facilities. The remainder was spent on R&D, mostly on the development of weapon systems (see Figure 2-3 on page 13). The Department of Defense (DoD) spent money on education and training as well, but that spending is not reflected in the data on federal invest-ment spending because much of it goes to train service members and employees to do their jobs. However, in 2019, nearly $13 billion went to the military academies, the education of service members’ children, and certain specialized training—all of which aligns with CBO’s definition of investment. (That spending is not included in this report because DoD reports it only as obligational authority; therefore, it is not consistent with the spend-ing described throughout this report, which is reported as outlays. The difference between the two measures in this case is likely to be very small.)

Chapter 3: The Current Budgetary Treatment of Investment and an Overview of Options to Change It
To see how investment fits in to the budgetary frame-work of the federal government, it is helpful to first have an overview of the federal budget and federal financial reports—the government’s main tools for providing information and tracking financial resources. Neither document provides an all-purpose picture of the govern-ment’s fiscal position, but taken together they offer a way to gauge the current and future implications of present policies.1
The Federal Budget and Federal Financial ReportsThe federal budget measures the overall size and scope of federal activities. It is a key instrument in national policymaking, displaying the effects of the govern-ment on the economy and communicating the nature and breadth of government to the public. It is also the primary tool that policymakers use to decide how to allocate resources to meet national priorities, control spending, and promote economic stability and growth. The federal budget is “unified,” meaning it comprises all revenues and spending of the federal government, including those of the Social Security trust funds and the net cash flow of the Postal Service, which are considered off-budget for certain purposes.2
The federal budget process is a set of procedures that law-makers use to plan, establish, control, and account for spending and revenue policies. That process is governed by various rules and procedures for meeting budgetary
1. For more information about financial reporting, see Congressional Budget Office, Comparing Budget and Accounting Measures of the Federal Government’s Fiscal Condition (December 2006), www.cbo.gov/publication/18262; and Measures of the U.S. Government’s Fiscal Position Under Current Law (August 2004), www.cbo.gov/publication/15943.
2. See President’s Commission on Budget Concepts, Report of the President’s Commission on Budget Concepts (October 1967), http://tinyurl.com/y7lxv3gp (PDF, 7.8 MB).
goals, including the use of enforcement mechanisms that are applied largely on the basis of estimates of how new legislation would affect federal deficits over a 10-year period. As a result, the basis for how the net costs of federal activities are measured and reported has signifi-cant implications for how federal resources are allocated among competing priorities and for the overall outcome of that process.3
Currently, the budget records spending for most federal activities on a cash basis; the major exceptions are federal credit programs (including student loans) and interest on the public debt, which are recorded on an accrual basis. The principal difference between cash and accrual accounting lies in the timing of when the spending (or collection) of budgetary resources is recognized.4 In cash-based accounting, outlays and receipts are recorded when payments are made or receipts are collected. By contrast, accrual measures summarize in a single estimate the anticipated net financial effects when the government makes a commitment. Thus, for federal credit programs, the budget records the entire amount of expected budget authority—the positive or negative subsidy cost—when the government enters into a loan obligation or guar-antee commitment, even though the cash flows to and from the Treasury arising from the obligation or com-mitment may continue for many years into the future. In other words, accrual methods for federal credit programs record the cost of commitments—the estimated net pres-ent value of the government’s projected cash outlays and related receipts—when they are incurred, and the budget
3. For a discussion of the budget’s other purposes, see General Accounting Office (now the Government Accountability Office), Accrual Budgeting: Experience of Other Nations and Implications for the United States, GAO-AIMD-00-57 (February 2000), www.gao.gov/products/AIMD-00-57.
4. See Congressional Budget Office, Cash and Accrual Measures in Federal Budgeting (January 2018), www.cbo.gov/publication/53461.

16 BUDGETING FOR FEDERAL INVESTMENT APRIL 2021
shows the associated outlays from those commitments when the loans are disbursed (rather than recording the various cash transactions as they occur).5 The Federal Credit Reform Act of 1990 switched the government from cash to accrual accounting for credit programs to more accurately measure the full net cost of credit pro-grams over the long term and to facilitate comparisons of the net cost of direct loans, loan guarantees, and grants.
In addition to the budget, the federal government issues an annual report on its fiscal performance—the Financial Report of the United States Government. The budget and the financial reports serve different and complementary purposes.6 Unlike budget figures, which can encom-pass both past and future periods, financial reporting largely describes what has already happened and explains changes in the government’s financial position based on an accrual-based balance sheet and operating statement. That reporting requires agencies to prepare financial reports that are then audited. Together with internal accounting and administrative controls, those audited reports demonstrate accountability to taxpayers for money raised and expenses incurred.
The Federal Budget’s Cash Treatment of Investment When the federal government buys an asset (such as a building or a piece of equipment) or provides a grant to state and local governments for infrastructure invest-ment, the federal budget treats that investment spend-ing the same way it treats most other spending: on a cash basis.7 Budget authority is generally required and reported up front for the capital asset or investment when the resources are committed, and outlays are reported for the associated cash expenditures in the years
5. A present value is a single number that expresses a flow of future income or payments in terms of an equivalent lump sum received or paid at a specific time.
6. See Congressional Budget Office, Comparing Budget and Accounting Measures of the Federal Government’s Fiscal Condition (December 2006), www.cbo.gov/publication/18262.
7. For an alternative approach to valuing certain types of investments using market prices, see Deborah J. Lucas and Jorge Jimenez Montesinos, “A Fair Value Approach to Valuing Public Infrastructure Projects and the Risk Transfer in Public Private Partnerships,” in Edward L. Glaeser and James M. Poterba, eds., Economic Analysis and Infrastructure Investment (University of Chicago Press, forthcoming, October 2021).
they are disbursed.8 (For many capital investments, the outlays occur over a number of years.) No depreciation is reported, and spending on maintenance is recorded as it occurs. Likewise, to the extent that federal invest-ments affect cash flows in future years—for example, by generating income or by affecting an agency’s operating costs—those effects are reported in the years when they occur.
Cash measures convey more complete information about the budgetary effects of spending on investments when those decisions are made than accrual measures would. Cash budgeting reports the budget authority provided for an investment when the decision to approve that funding is made, which is usually the only point at which all or most of the costs are controllable.9 (To the extent that the government purchases marketable assets, like office buildings, some or all of the cost could be off-set if the government ultimately sold the asset.) Up-front recognition of costs has several advantages: It measures the value of the economic resources that the government will use, shows the trade-offs among spending choices, and helps keep lawmakers accountable for the budgetary effects of their decisions in the year they are made.
The current cash-based accounting system also has some disadvantages. The budget process does not focus on investment spending apart from other types of spend-ing that support current consumption. As a result, investment spending is less visible and explicit than it could be, and investment projects, which often have a mismatch between when costs are recorded and when benefits occur, may seem expensive relative to other
8. Budget authority is provided by federal law to incur financial obligations that will result in immediate or future outlays of federal government funds. In the case of federal investments, appropriation acts generally provide that authority. Funding for some high-cost defense items is provided over a period of several years but still a much shorter span of time than the useful life of the asset. Moreover, not all the life-cycle costs for those items are reported together up front in the budget request. For example, funds for operation and support and disposal costs are appropriated on an annual basis when needed. In addition, the federal government reimburses states for a share of their expenses for most of the major highway and transit infrastructure projects over the lifetime of the project as the states submit receipts.
9. Some expected costs associated with asset purchases, such as maintenance and repairs, do not require budget authority up front but rather are funded (and reported as outlays) when the work is done. Similarly, any remediation costs for environmental cleanup after an asset is retired are also funded when the work is done.

17CHAPTER 3: THE CURRENT BUDGETARY TREATMENT OF INVESTMENT AND AN OVERVIEW OF OPTIONS TO CHANGE IT BUDGETING FOR FEDERAL INVESTMENT
government expenditures. In addition, the large amount of up-front funding required for some investment projects can make it difficult to fund them.
The Federal Financial Report’s Accrual Treatment of Investment Like the financial statements of private companies, the federal government’s financial report consists of a balance sheet, an income statement, a cash flow state-ment, and notes to those financial statements.10 The financial statements describe what has already happened and provide more comprehensive information than the budget about the government’s financial operations and condition. As of September 30, 2019, the federal balance sheet reported more than $1 trillion of property, plant, and equipment (after subtracting depreciation).11 Other categories of investment—education and training or research and development—are not reported as assets on the federal balance sheet; nor are most roads and transit systems that receive federal funding, because they are not owned by the federal government.
As in private-sector financial reporting, purchases of capital assets (those owned by the federal government) are recorded on the federal government’s balance sheet as an exchange of assets. Those purchases therefore do not directly change the federal government’s reported net financial position. In contrast, the financial report recognizes up front the full costs of federal grants to state and local governments for infrastructure investments that are not reported on the federal balance sheet.
The federal government’s income statement recognizes the cost of federally owned property, plant, and equip-ment (fixed assets) as those items are consumed rather than when they are purchased. Depreciation is measured using a systematic method for assigning the cost of an asset to each period during its estimated useful life. Costs for education and training or R&D are recognized up
10. See Department of the Treasury, Financial Report of the United States Government, Fiscal Year 2019 (February 2020), p. 59, https://go.usa.gov/xshpc. The report’s version of an income statement is called the “statement of net cost” and “statement of operations and changes in net position.”
11. Ibid., p. 207. That estimate excludes stewardship land and heritage assets whose values may be indeterminable or are omitted for other reasons. Examples include museum collections, national forests, parks, and historic sites. The financial report also provides unaudited, supplemental information on deferred maintenance and repairs—valued at $183 billion as of September 30, 2019, compared with $167 billion in fiscal year 2018.
front and are not depreciated because the financial report does not classify those categories as assets.
Because costs in the federal budget and financial state-ments are recognized at different times, summary measures for those reports differ. In 2019, the budget recorded a deficit of $984 billion, whereas the equivalent measure in the financial report—net operating cost, or the cost of operations minus revenues—was $461 billion larger, at $1,445 billion. Most of the difference stemmed from the reporting of retirement costs for federal civil-ian and military personnel; the treatment of fixed assets accounted for only $22 billion of the difference. Depreciation expenses—which are not counted in the federal budget—added $88 billion to the net operating cost, while the purchase of fixed assets added $66 billion to the budget deficit.12 Over the 2009–2019 period, the cost of acquiring property, plant, and equipment has generally exceeded the cost of depreciation, though not in 2018 and 2019 (see Figure 3-1). As a result, net investment has generally been positive, as would be expected with a growing economy.
An Example of the Different Treatments as Applied to an Infrastructure InvestmentThe differences between cash measures and accrual measures hinge on timing. The following example uses a hypothetical infrastructure investment to highlight those differences.
Suppose that lawmakers approved a $3 billion infrastructure investment and that cash disbursements for construction costs were spread evenly over three years. For accounting purposes, assume that the useful life of that investment was 30 years. Under the current cash-based approach for invest-ments, the budget would record the full acquisition cost of $3 billion as budget authority in the first year and $1 billion of outlays in each of the first three years, when the construc-tion costs were paid (see Table 3-1).
Under an accrual approach to capital budgeting that reported the cost of depreciation on a straight-line basis (that is, evenly distributed the acquisition cost over the useful life of the investment), the budget would report $100 million ($3 billion divided by 30) of both bud-get authority and outlays each year for 30 years. That approach is similar to how acquisitions of property, plant, and equipment are reported in the federal govern-ment’s financial report.
12. Ibid., p. 57.

18 BUDGETING FOR FEDERAL INVESTMENT APRIL 2021
Costs under the accrual approach would be significantly influenced by assumptions about the useful life of the investment. The projection period used for most bud-get enforcement purposes is 10 years. In this example, only $1 billion of budget authority and outlays would be reported over the 10-year period using the accrual approach, compared with $3 billion under cash-based budgeting. If, instead of 30 years, the useful life of the investment was 10 years, the accrual approach would report $300 million of budget authority each year for 10 years, and the 10-year total would be the same as under the cash treatment. Thus, the longer the useful life of an asset, the greater the degree to which the accrual budgeting approach would differ from the cash approach in the timing of budget authority and outlays as mea-sured for accounting purposes.
Options for Changing the Budgetary Treatment of InvestmentVarious approaches to capital budgeting have been implemented by other levels of government, the private
sector, and other countries. At the federal level, capital budgeting could be instituted using either cash or accrual measures, and policymakers could choose to have sep-arate capital and operating budgets or to adhere to the unified budget framework (see Figure 3-2). Even though no consensus exists on what exactly is meant by capital budgeting, a capital budget treats investment spending differently from other types of spending because invest-ment spending provides a stream of future benefits rather than benefits at just a point in time.13
Some countries that budget on an accrual basis also use the accrual approach to capital budgeting, but they
13. See the following articles, all from Public Budgeting & Finance, vol. 18, no. 3 (Fall 1998): Marvin Phaup, “The President’s Commission to Study Capital Budgeting: An Interim Review,” pp. 1–10, https://doi.org/10.1046/j.0275-1100.1998.01138.x; Paul Posner, Trina V. Lewis, and Hannah Laufe, “Budgeting for Federal Capital,” pp. 11–23, https://doi.org/10.1046/j.0275-1100.1998.01139.x; and Cameron Gordon, “The Fables and Foibles of Federal Capital Budgeting,” pp. 54 –71, https://doi.org/10.1046/j.0275-1100.1998.01142.x.
Figure 3-1 .
The Federal Government’s Depreciation of Existing Assets Versus Acquisition Costs of New Assets, 2009 to 2019Billions of 2019 Dollars
Depreciation of Existing Assets
Acquistion Costs of New Assets
0
20
40
60
80
100
120
2009 2010 2011 2012 2013 2014 2015 2016 2017 2018 2019
Data source: The 2009 through 2019 editions of Department of the Treasury, Financial Report of the United States Government. See www.cbo.gov/publication/56900#data.
In this context, assets are property, plant, and equipment. Not shown is the expense (or gain) from disposals and revaluations of that property, plant, and equipment.
Acquisition costs are reported in the budget, whereas depreciation costs are reported in the federal financial statements. The differences between those two costs contribute to differences between summary measures in the budget and the financial statements.

19CHAPTER 3: THE CURRENT BUDGETARY TREATMENT OF INVESTMENT AND AN OVERVIEW OF OPTIONS TO CHANGE IT BUDGETING FOR FEDERAL INVESTMENT
typically limit capital budgeting to spending on physical capital (see Appendix A). Those countries generally use accrual measures of costs and revenues rather than cash in their budgets, and they report the estimated annual depreciation of the investment as a cost in the current year rather than the acquisition cost. (The national income and product accounts take a similar approach, reporting the depreciation of capital rather than outlays as a cost.) To control their debt, several countries have had to limit their asset purchases.
Capital budgeting could be implemented using cash measures only, which is the practice used by most states (see Appendix B). The capital budget records on a cash basis the up-front expenditures for certain types of investments, including physical infrastructure but gener-ally excluding education and training. Under the capital budget, states can borrow to fund their investments, which is consistent with the logic that future taxpayers would share in the benefits of those investments and
thus should help pay for them. In contrast, the operat-ing budget, which is separate from the capital budget, is typically subject to a balanced budget requirement.
This report examines six options for changing the budgetary treatment of investment. Some of the options are more complicated and would significantly alter budgetary outcomes, so they are explained in greater detail. Other options would have fewer budgetary impli-cations and thus are examined in less detail. The first two options would use an accrual-based approach (see Chapter 4).
• The federal government could adopt an accrual approach with a separate capital budget. That model, which is based on the financial accounting model of capital budgeting used by the United Kingdom and New Zealand, would report depreciation of physical capital as a cost in agencies’ budgets and in the
Table 3-1 .
Examples of Cash- and Accrual-Based Accounting for a Hypothetical $3 Billion Infrastructure Investment Under Two ScenariosMillions of Dollars
2021 2022 2023 2024 2025 2026 2027 2028 2029 2030
Total, 2021–2030
Costs When the Useful Life of the Investment Is 30 YearsCurrent Cash Budgeting
Budget authority 3,000 0 0 0 0 0 0 0 0 0 3,000Outlays 1,000 1,000 1,000 0 0 0 0 0 0 0 3,000
Accrual Capital Budgeting a
Budget authority 100 100 100 100 100 100 100 100 100 100 1,000Outlays 100 100 100 100 100 100 100 100 100 100 1,000
Costs When the Useful Life of the Investment Is 10 YearsCurrent Cash Budgeting
Budget authority 3,000 0 0 0 0 0 0 0 0 0 3,000Outlays 1,000 1,000 1,000 0 0 0 0 0 0 0 3,000
Accrual Capital Budgeting b
Budget authority 300 300 300 300 300 300 300 300 300 300 3,000Outlays 300 300 300 300 300 300 300 300 300 300 3,000
Data source: Congressional Budget Office. See www.cbo.gov/publication/56900#data.
The examples assume that the cash disbursements occur evenly over the first three years.
a. Calculated using straight-line depreciation over 30 years ($3 billion divided by 30).
b. Calculated using straight-line deprectiation over 10 years ($3 billion divided by 10).

20 BUDGETING FOR FEDERAL INVESTMENT APRIL 2021
government’s overall budget.14 If U.S. policymakers chose that approach, they would need to decide whether to extend the accrual treatment to spending on intangible assets (education and R&D).
• The federal government could use a mix of cash and accrual measures in a unified budget. Agencies would report budget authority and outlays for depreciation (or amortization) of their investments for each program on an accrual basis.15 The depreciation would flow to on-budget capital accounts and thus be netted out as an intragovernmental transaction. The capital accounts would report the budget authority and outlays associated with the acquisition on a cash basis, so total outlays and the unified budget deficit would not change.
14. New Zealand has had greater success with accrual budgeting for investment than have other countries, in part because program managers there have discretion in how they achieve their results. In addition, agencies can keep most of the savings from asset sales. Showing the depreciation of assets allows officials and the public to more easily monitor the government’s wealth (the difference between its assets and liabilities). That information allows New Zealand to spread the cost of long-lived assets across the generations that benefit from the investments. See New Zealand Treasury, 2018 Investment Statement (March 2018), https://tinyurl.com/j4js983y.
15. Amortization is an accounting method that allows the cost of an intangible asset to be reported over a set period of time as it loses value. Thus, amortization is similar to depreciation.
The other four options would use a cash-based approach (see Chapter 5).
• The federal government could implement separate operating and capital budgets (the model used by the states).
• The federal government could create a separate cap on investment funding for budget enforcement purposes while retaining cash-based budgeting for investment spending within the unified budget.
• The federal government could create a mandatory capital revolving fund in the unified budget. (A revolving fund charges for the sale of products or services and uses the proceeds to finance its spending, in a continuous cycle of activity.) At least initially, the fund would be limited to purchases and long-term capital leases of federal buildings. This option would apply only to assets that the federal government owned.
• Agencies could provide supplemental information on investments to allow policymakers to judge their value without changing the budget numbers or budget enforcement procedures.
Figure 3-2 .
Comparing Options for Budgeting for Federal Investment
Cash Measures
Unified BudgetCurrent TreatmentSeparate Cap on Investment Funding Mandatory Capital Revolving Fund for Federal Property Separate Operating and Capital BudgetsApproach Taken by Most States
Accrual Measures
Unified BudgetCapital Accounts in Agencies’ Budgets but Deficits on a Cash Basisa
Separate Capital Budget on Accrual BasisApproach Taken by Some Developed Countries
Data source: Congressional Budget Office.
a. Accrual measures reporting depreciation would be reported in federal agencies’ budgets. Depreciation would be reported on an intragovernmental basis (amounts paid by one part of the government to another) and would not affect the unified budget deficit. Only the cash payments for investments would affect the unified budget deficit.

Chapter 4: Options That Would Use an Accrual Approach to Capital Budgeting
The primary goal of an accrual approach to capital bud-geting is to more closely align the costs of investments with their long-term usefulness. Doing so would provide agencies with a more comprehensive understanding of how the costs of delivering their services relate to the benefits provided. This paper examines two options that would incorporate accrual measures. The first option is covered extensively because it represents the biggest departure from current practice and has been the main focus of policy debates and past Presidential budget commissions.1
Adopt an Accrual Approach With a Separate Capital Budget This approach would treat the purchases or commit-ments of capital resources as an exchange of assets in which the funding and outlays required to pay for the asset would be allocated to the future—in other words, spread over the period when that asset’s benefits were realized. Accrual budgeting for investment differs con-ceptually from accrual accounting for other activities and programs.2 For most programs, accrual accounting consolidates a long-term stream of future cash flows, but an accrual approach to capital budgeting would do the
1. See President’s Commission to Study Capital Budgeting, Report of the President’s Commission to Study Capital Budgeting (February 1999), https://clintonwhitehouse3.archives.gov/pcscb/; and President’s Commission on Budget Concepts, Report of the President’s Commission on Budget Concepts (October 1967), pp. 9 and 33–35, http://tinyurl.com/y7lxv3gp (PDF, 7.8 MB).
2. Accrual-based budgeting is mostly confined to activities that are financial in nature, including federal credit programs, the Troubled Asset Relief Program, U.S. contributions to the International Monetary Fund, and certain kinds of leases involving capital assets. The budget also reports the federal government’s interest costs as outlays when they accrue, not when they are paid. See Congressional Budget Office, Cash and Accrual Measures in Federal Budgeting (January 2018), www.cbo.gov/publication/53461.
opposite: It would spread up-front costs over time and thus reduce the recognition of the commitment when it was made.
The budget would report the depreciation (or amorti-zation) of the asset as both the annual budget authority and outlays.3 In technical terms, the operating budget would report the depreciation, and the capital budget would report the cash transactions for the investment. For investments in physical capital and possibly research and development, estimated depreciation from physical wear and tear or technological obsolescence would be reported as budget authority and outlays. For invest-ments in education and training programs, funding could be spread out over the period when benefits were expected to be received.
Benefits and Drawbacks of an Accrual ApproachSome benefits and drawbacks are common to any accrual approach to accounting for investments, and others are specific to this option.
A particular benefit of adopting an accrual approach with a separate capital budget, according to proponents, is that it would eliminate the bias against investment spending imposed by cash-based budgeting.4 Proponents claim that the bias arises in part because some invest-ment projects require up-front budget authority for the full cost of acquisition, which can make them seem
3. If, instead, the commitment for the investment was reported up front as budget authority, that reporting would not change how spending was controlled.
4. Proponents see a federal capital budget as the first step in increasing investment in infrastructure and R&D. See Sherle R. Schwenninger, A Capital Budget for Public Investment (policy paper, New America, 2007), https://tinyurl.com/23set5v6.

22 BUDGETING FOR FEDERAL INVESTMENT APRIL 2021
expensive relative to other government purchases.5 As a result, proponents argue, the federal government underspends on federal investment, thereby forgoing the long-run benefits—including higher productivity—of that investment relative to spending on other programs and activities whose benefits are largely realized sooner.
The accrual approach to capital budgeting would better align the appropriations provided to acquire the assets with the time period over which the benefits to society are accruing, according to proponents. (Benefits from investments can be greater or lesser than costs, and those benefits may vary greatly over the useful life of an investment.) That alignment would level the compari-son of investment spending with other spending, and it would eliminate some of the spikes in certain programs’ budgets from new investments. (Investments in physical assets, which often involve large single projects that will be completed in the future, are most prone to spikes. Investments in R&D and education are less prone to spikes because that spending generally recurs each year. Budgetary spikes also are less of a problem for federal investments in infrastructure, most of which are in the form of grants to states.)
An advantage that is common to all accrual approaches is that they align the costs of the investment with its use. By recognizing depreciation (or amortization) as a cost, an accrual approach might give policymakers and program managers more accurate and timely information about the cost to operate physical assets, like buildings, that the government owns. Such information might encourage them to sell underused assets, allowing agen-cies to reduce their depreciation expense. Recognition might also highlight the need for routine maintenance, which would be reported on a cash basis, or for major
5. Another potential source of bias in some cases is the exclusion of most future federal receipts to the Treasury in the form of fees or rents from the estimate of net cost. That potential problem could be addressed under the current budgeting approach, however, by offsetting the up-front budget authority by an estimate of future offsetting receipts. Such a change would diminish any bias against large capital projects in the appropriations process. See F. Stevens Redburn, Kenneth Buck, and G. Edward DeSeve, Mobilizing Capital Investment to Modernize Government (IBM Center for the Business of Government, 2020), https:// tinyurl.com/y6bahsmq; and Steve Redburn, Budgeting for Investment, Discussion Papers on Re-Imagining the Federal Budget Process (Brookings Institution, March 2017), p. 7, www.brookings.edu/research/budgeting-for-investment/.
repairs or refurbishments, which could be treated as new investments and depreciated because they extend the asset’s useful life.
The existence and extent of any current budgetary bias against investment depend on how differently policy-makers would behave with a capital budget instead. If there was an across-the-board bias against investment spending, one would expect to see widespread under-investment and high rates of return on new federal projects. In CBO’s assessment, based on its analyses and a review of relevant research, the average rate of return from federal investment spending on physical capital, education and training, and R&D is lower than that from private investment.6 That is because public invest-ment is not driven by market forces; its goals include not only achieving positive economic returns but also improving quality of life, reducing inequities, and addressing other objectives. In addition, an increase in federal investment spending is often partially offset by a decrease in investment spending by states and localities.
Evidence suggests that additional spending on invest-ment could have larger economic benefits than costs, on average. Nevertheless, the economic benefits of increas-ing capital spending would partly depend on how well the additional funds were targeted to high-value projects and on the extent to which they displaced spending that would otherwise be undertaken by the private sector or by state and local governments.
Groups charged with exploring budgetary concepts—including the 1967 President’s Commission on Budget Concepts and the 1999 President’s Commission to Study Capital Budgeting—cited several reasons for rejecting the idea of a separate capital budget for the
6. The average return on federal investment is uncertain, and the macroeconomic effects of an increase in federal investment would depend on how that spending was financed. See the following CBO publications: Shelia Campbell, Fiscal Substitution of Investment for Highway Infrastructure, Working Paper 2018-08 (August 2018), www.cbo.gov/publication/54371; “Estimating the Long-Term Effects of Federal R&D Spending: CBO’s Current Approach and Research Needs,” CBO Blog (June 21, 2018), www.cbo.gov/publication/54089; The Macroeconomic and Budgetary Effects of Federal Investment (June 2016), pp. 6–8, www.cbo.gov/publication/51628; and Approaches to Making Federal Highway Spending More Productive (February 2016), www.cbo.gov/publication/50150.
23CHAPTER 4: OPTIONS THAT WOULD USE AN ACCRUAL APPROACH TO CAPITAL BUDGETING BUDGETING FOR FEDERAL INVESTMENT
federal government.7 In particular, moving to a budget that relied more heavily on accrual-based accounting of investment could increase complexity, diminish trans-parency, and make the federal budget process more sensitive to small changes in assumed parameters, such as how long the stream of benefits from an investment would last.8 In addition, reporting only depreciation as an expense would delay recognition of the funding pro-vided for a program or activity and the resulting spend-ing. That delay would be particularly meaningful for investments with useful lives that extended beyond the 10-year period used in the Congressional budget process. Consequently, capital budgeting would understate the government’s draw on private-sector resources, reduce control over the accumulation of debt, and potentially leave underlying cash expenditures on capital uncon-trolled (in the absence of other constraints). Providing special treatment to certain areas of the budget, such as capital spending, could make the budget process more prone to manipulation as well. If increasing spending on programs and activities that were designated as invest-ments was easier, then policymakers and federal agencies would have strong incentives to seek that classification.9 A complicated accrual system could cause power to shift from the Congress to executive branch agencies, which would be responsible for categorizing their spending between capital and operating budgets. As a result, Congressional oversight of spending could be weakened.
Issues in Implementing an Accrual Approach One issue in implementing an accrual approach is determining what types of spending a capital budget would include. Policymakers would need to decide whether to include spending that enriches human capital or is used for weapon systems, for instance, and whether to include assets that the federal government helps fund but does not own, such as roads, airports, and mass transit systems. How to treat federal grants for broad purposes that include but are not limited to investment would be a particularly difficult question. From a budgetary accounting perspective, as long as
7. See President’s Commission on Budget Concepts, Report of the President’s Commission on Budget Concepts (October 1967), pp. 9 and 33–35, http://tinyurl.com/y7lxv3gp (PDF, 7.8 MB).
8. See Congressional Budget Office, Capital Budgeting (May 2008), pp. 9–13, www.cbo.gov/publication/41689.
9. Similar incentives already exist for appropriations designated for overseas contingency operations or emergency requirements because those categories are not constrained by the caps on discretionary funding.
the amount of depreciation (or amortization) reported in the federal budget matches the budget authority and outlays required to acquire the asset, ownership is not as relevant.
Another issue is the time period that would be used for allocating costs. To determine that period, policymakers would need to make assumptions about the useful life of an asset and the rate at which it depreciates. Various rate schedules could be used in capital budgeting, including straight-line depreciation (which shows the same rate each year) or accelerated depreciation (which shows higher rates in earlier years), and the schedules would vary across categories of assets based on their useful life.
Depreciation is not a perfect measure of an asset’s loss in value or of the benefits that it provides. For example, some investments turn out poorly and have costs that exceed their benefits; for other assets, the opposite out-come occurs. In addition, because reported depreciation imperfectly tracks changes in an asset’s economic value, that asset might have residual value after it has been fully depreciated for accounting purposes. Furthermore, depreciation rate schedules for physical capital can be imprecise and arbitrary. Despite those limitations, such schedules are already used in other settings, including for tax purposes.
A related issue is whether investment costs should cover all the costs of an asset throughout its life cycle. If an asset required remediation at the end of its useful life—to clean up environmental toxins, for example, or to break down radioactive waste—policymakers could decide to report those costs on a cash basis (as they do now) or try to budget for them up front, despite their uncertainty. Furthermore, if the cost of military equipment was depreciated in the budget, procedures and rules would need to be added to account for equip-ment lost or damaged on the battlefield or in training. Enforcing such rules would probably not be practical in wartime.
Determining an appropriate depreciation (or amorti-zation) rate for intangible capital, particularly human capital, would be even more complicated than for physical capital, because there is less basis for making the determination. (That difficulty explains in part why such investment is treated differently from physical invest-ment in financial reporting.) One possibility is that the budget could depreciate human capital over the length

24 BUDGETING FOR FEDERAL INVESTMENT APRIL 2021
of an “average” career. Significant timing differences would exist between spending on elementary, secondary, and higher education and the start of the average career, though, so analysts would still need to make adjust-ments. A common concern about depreciation of intan-gible capital (including R&D) is that changes in how such valuations are made and applied might be poorly understood, increasing the potential for manipulation.
Implementing an accrual approach with a separate capi-tal budget would require the creation of new budgetary accounts to reconcile the estimates of depreciation with the cash costs of the capital investments, as well as any proceeds from sales of assets.10 Funds appropriated to cover depreciation costs would probably be transferred to a nonbudgetary financing account, which would ensure that agencies did not spend the money twice.11 The federal government used that approach when it adopted accrual accounting for its credit programs. Policymakers would also need to decide if the depreciation amounts should ultimately match the asset’s real (inflation- adjusted) or nominal investment costs, which could differ considerably.
Control Over Spending With an Accrual Approach Transitioning to an accrual approach to capital budget-ing could create new challenges for the federal budget process. Spreading costs for capital investments over long periods could mean that much of the cost would be recorded beyond the 10-year period typically used for budget projections and enforcement. The change would be most significant for discretionary programs, because spending controls for those programs largely focus on the year in which funds are appropriated.
New mechanisms would therefore be needed to ensure accountability and to enforce budget discipline and limit the amount of debt being incurred for investments. Funding decisions for investment projects currently rely on the provision of budget authority (or obligation limitations for highway programs) to control the amount
10. See Congressional Budget Office, Cash and Accrual Measures in Federal Budgeting (January 2018), pp. 6–13, www.cbo.gov/publication/53461.
11. A financing account is a “below-the-line” means of financing the deficit. Financing accounts are currently used with each credit program to track cash flows and to reconcile subsidies calculated on an accrual basis with the cash flows associated with credit program.
of spending. In addition, if most discretionary funding continued to be limited by annual caps, greater spending on investments would have to be offset by less spending on other discretionary programs.
Implementing an accrual approach to capital budgeting for discretionary programs would require appropriations of budget authority in future time periods to cover costs for depreciation. That budget authority would be spread over many years rather than recorded up front, and the current 10-year period would be too short in many cases to capture all of those costs. Without limits on capi-tal investments, the accrual approach could prove less effective at controlling budget authority, and, ultimately, outlays for investment projects. The challenge would be particularly acute during a transition from cash-based to accrual-based budgeting for investments.
The appropriations that would be needed to account for accumulated depreciation would limit the amount of funding available for other uses, including new invest-ments. That pressure might create incentives for lawmak-ers to defer funding for depreciation. In the long run, the amount of appropriations under an accrual approach would be roughly the same as under a cash-based approach, unless the change in budgetary accounting encouraged lawmakers to alter their budgetary priorities and allocate more resources to investments.
Adopting an accrual approach would require setting up procedures to report costs if asset values had to be written off (depreciated to zero) following natural disas-ters (such as fires, earthquakes, or floods) that made the depreciation schedules irrelevant. One way to address that concern would be to have lawmakers appropriate a large sum of money to cover the write-offs, but the sudden need for such funds might make that approach unworkable. Alternatively, lawmakers could provide per-manent and indefinite budget authority to report such changes so that no Congressional action was needed. (That is how credit subsidy reestimates are handled under the Federal Credit Reform Act of 1990.)
Concerns about budget discipline explain why most countries that have switched to accrual measures for some budgetary costs have retained cash-based bud-geting for capital spending. Those countries concluded that cash-based budgeting provided better control over capital spending and that capital budgeting encouraged more spending on investments at the expense of other

25CHAPTER 4: OPTIONS THAT WOULD USE AN ACCRUAL APPROACH TO CAPITAL BUDGETING BUDGETING FOR FEDERAL INVESTMENT
priorities—and led to the accumulation of more debt. The United Kingdom, which has a capital budget, con-strains spending by explicitly limiting total annual capital expenditures. Australia, New Zealand, and Denmark, which also accrue the cost of investments, use other constraints to limit capital spending.12
Use a Mix of Cash and Accrual Measures in a Unified BudgetThis approach would establish separate capital and oper-ating accounts that would be consolidated in a unified budget. For capital spending, policymakers would know the cost under both cash and accrual measures, but only the cash flows would affect the unified budget deficit. The federal government already uses a similar approach to budget for federal employees’ pensions.13 In general, cash-based measures are used to record outlays for bene-fits and to calculate the effect of those benefit programs on the budget deficit. But most federal agencies use annual transactions that are calculated on an accrual basis to account for the future cost of pension benefits earned by their current employees. The accrual transac-tions are intragovernmental (payments from one part of the government to another) and thus have no net effect on the budget deficit.14
Because the budget deficit would be unchanged under this option, it would be less of a departure from current budgeting than the previous option, which would create a separate capital budget under an accrual approach. To implement this approach to capital budgeting, lawmak-ers would create a series of federal accounts.15
12. See Marc Robinson, Accrual Budgeting and Fiscal Policy, Working Paper WP/09/84 (International Monetary Fund, April 2009), pp. 7–10 and 21–25, https://tinyurl.com/dff5d5rb (PDF, 675 KB). For additional information on how other countries treat capital spending, see Government Accountability Office, Budget Issues: Accrual Budgeting Useful in Certain Areas but Does Not Provide Sufficient Information for Reporting on Our Nation’s Longer-Term Fiscal Challenge, GA-08-206 (December 2007), pp. 19, 22–24, and 28–29, www.gao.gov/products/GAO-08-206.
13. See Congressional Budget Office, Accounting for Federal Retirement and Veterans’ Benefits: Cash and Accrual Measures (September 2019), www.cbo.gov/publication/55499.
14. Ibid., pp. 7–11.
15. See the statement of Robert Eisner, Northwestern University, before the President’s Commission to Study Capital Budgeting, A Capital Budget for Truth in Packaging (April 24, 1998), https://clintonwhitehouse3.archives.gov/pcscb/wt_eisner.html.
• A capital account, which would show the cost of investments when the cash transaction occurred and reveal how the government is investing for the future;
• An operating account, which would include depreciation as a cost and show how much of the nation’s resources the government is consuming; and
• A consolidated budget, which would combine the operating and capital accounts into a unified view so that the measures used to estimate the unified budget deficit remained the same.
Depreciation would be an internal charge—the same amount would be debited from the operating account and credited to the capital account—leaving the uni-fied budget unchanged; that aspect distinguishes this approach from the previous one.16
If this option had been in use in the United States over the past few years, the unified budget totals would not have been affected. In 2019, for example, the unified budget would still have reported a deficit of $984 bil-lion. The operating accounts in that budget would have reported an expense of $88 billion for depreciation and a deficit of $1,007 billion (following the assumption that the definition of investment under this option aligned with that in the government’s financial report). The capital accounts in that budget would have recorded the $88 billion as income, which would have exceeded the $66 billion in capital expenditures that year, for a surplus of $22 billion (see Table 4-1).17 In previous years, includ-ing 2016 and 2017, the capital accounts would have reported deficits because capital expenditures exceeded depreciation expenses.
As long as up-front budget authority was required for capital spending, lawmakers would retain control over spending under this option. Because agencies would be charged with the cost of depreciation, they would have more accurate information about the cost of delivering
16. For more details, see Office of Management and Budget, Budget of the U.S. Government, Fiscal Year 2004: Analytical Perspectives (February 2003), pp. 157–165, https://govinfo.gov/app/details/BUDGET-2004-PER.
17. The capital budget could also be credited with earmarked tax receipts of the Highway Trust Fund and the Airport and Airway Trust Fund. The depreciation and capital acquisition amounts were taken from Office of Management and Budget, Financial Report of the United States Government, Fiscal Year 2019 (February 2020), p. 57, https://go.usa.gov/xshpc.

26 BUDGETING FOR FEDERAL INVESTMENT APRIL 2021
their services—which proponents of an accrual approach assert might lead to improved management of assets, particularly federal buildings and other properties, auto-mobiles, and investments in information technology.
Other countries’ experience with capital budgeting does not uniformly support claims of improved manage-ment, however. Both Australia and the United Kingdom abandoned capital charges that were levied on ministries (the equivalents to departments in the U.S. government) as a percentage of the value of their assets, for example.
The charge was intended to make ministries aware of the opportunity cost of their assets and give them incen-tives to carefully weigh whether new capital assets were needed and whether underused assets should be sold. In practice, that system was costly to operate. In addition, Australia abandoned the accrual approach to capital bud-geting because of a lack of control over government debt and a loss of transparency.18 This option would face most of the same implementation issues as the previous one, and the creation of new federal accounts could make the budget process more complex.
18. See Marc Robinson, “Budget Reform Before and After the Global Financial Crisis” (paper prepared for the 36th annual OECD senior budget officials meeting, June 2015), pp. 11–13, https://tinyurl.com/y6mdaenx (PDF, 990 KB).
Table 4-1 .
Comparison of the Actual Federal Budget With Accounts Under an Illustrative Budget That Uses a Mix of Cash and Accrual Measures in a Unified Budget, 2016 to 2019Billions of Dollars
2016 2017 2018 2019
Actual BudgetUnified Budget
Revenues 3,268 3,316 3,330 3,463Outlays 3,853 3,982 4,109 4,447
Deficit -585 -665 -779 -984
Illustrative BudgetOperating Accounts
Revenues 3,268 3,316 3,330 3,463Expenses
Depreciation 52 34 73 88Other 3,771 3,902 4,037 4,381
Total Expenses 3,823 3,935 4,110 4,469Deficit -555 -619 -780 -1,007
Capital AccountsDepreciation (Income) 52 34 73 88Capital expenditures 82 80 72 66
Deficit (-) or Surplus -30 -46 1 22Unified Budget
Revenues 3,268 3,316 3,330 3,463Outlays 3,853 3,982 4,109 4,447
Deficit -585 -665 -779 -984
Data source: Table 7-9 in Budget of the U.S. Government, Fiscal Year 2004: Analytical Perspectives, p. 159. See www.cbo.gov/publication/56900#data.
Estimates of depreciation and capital expenditures are from selected editions of Financial Report of the United States Government.

Chapter 5: Options That Would Use a Cash Approach to Capital Budgeting
Some approaches to budgeting for investment would make investment decisions more visible and more explicit without switching to accrual accounting. This chapter examines four of them.
Implement Separate Operating and Capital Budgets Unlike the federal government, most states prepare separate operating and capital budgets on a cash basis (see Appendix B). The major advantage of that approach is that a capital budget helps lawmakers focus on invest-ment spending separately from other types of spending, so it gets greater visibility and potentially more thorough planning and equitable treatment. In contrast to the accrual approach to capital budgeting, the states’ cash approach recognizes the full cost of investments at the same time as the obligation, so no loss of control over spending and debt occurs. Moreover, the states do not need to estimate depreciation or amortization expenses.
If separate operating and capital budgets were imple-mented at the federal level, the federal government would see many of the same benefits as the states but also some drawbacks. One drawback of such an approach is that it would depart from the longstanding practice of having a unified budget that encompasses all of the gov-ernment’s programs and activities.1 A second drawback is that having two separate budgets could lead to com-peting concepts of the deficit and the amount of total spending and thus cause confusion about the budget and federal fiscal performance. (To address that concern, the federal government could consolidate the operating and capital budgets and still report a unified budget defi-cit.) Also, the federal government faces different credit constraints than the states, so their approach may be less relevant at the federal level. States generally need to bal-ance their operating budgets, though many are allowed to borrow to fund their capital budgets. In addition,
1. President’s Commission on Budget Concepts, Report of the President’s Commission on Budget Concepts (October 1967), pp. 6 and 11–12, http://tinyurl.com/y7lxv3gp (PDF, 7.8 MB).
the states’ approach would not address the difficulty of up-front funding of federal investments and the resulting spikes in agencies’ budgets.
Create a Separate Cap on Investment Funding Compared with the previous option, this option rep-resents a more limited change to the current budget process. Creating a separate cap on investment funding might still accomplish the goal of focusing on capital investments but would be simpler to implement than a separate capital budget. Some analysts and observers favor considering this approach as part of new budget enforcement provisions.2
This option would complement the existing statutory caps on discretionary appropriations (in effect through 2021) by creating a distinct subcategory for capital spending that would be subject to its own budget enforcement procedures.3 Investment projects would compete for funding under the cap. Like the states’ approach to capital budgeting, this approach would provide lawmakers with transparent and accessible infor-mation on the federal government’s annual investments. Unlike the states’ approach, this one would retain the unified budget concept. That change would allow policy-makers to more easily identify and allocate resources to
2. Analysts have considered a range of options to provide policymakers with new information and better tools to confront the challenges of financing infrastructure investments. See Barry Anderson and Rudy Penner, Time for a New Budget Concepts Commission, Discussion Papers on Re-Imagining the Federal Budget Process, no. 3 (Brookings Institution, January 2016), p. 6, https://tinyurl.com/yayuuxxj; and Alice M. Rivlin and Pete Domenici, Proposal for Improving the Congressional Budget Process (Bipartisan Policy Center, July 2015), p. 22, https://tinyurl.com/yyqytb7d (PDF, 5.9 MB).
3. Alternatively, the House and Senate budget and appropriation committees could create separate budget allocations for investment spending and other types of spending without changing the discretionary funding caps.

28 BUDGETING FOR FEDERAL INVESTMENT APRIL 2021
spending with long-term benefits without undermining the unified budget’s functions.
The process of setting and enforcing budget caps makes particular types of spending more visible and allows lawmakers to explicitly decide about goals and budget-ary priorities. In the past, separate discretionary caps were in place for transportation and defense funding. By carving out separate limits for certain areas or programs, however, lawmakers may forgo some flexibility to make budgetary trade-offs between investment and other types of spending as needs change. In addition, if this approach was adopted, lawmakers would need to decide what types of investment funding would be covered by the new cap.
Create a Mandatory Capital Revolving FundA third option that would use a cash approach to capital budgeting involves the creation of a capital revolving fund. This approach would create a mandatory capital revolving fund while retaining cash measures for bud-geting and the concept of a unified federal budget. To show how a capital revolving fund could work in the budget, CBO has examined in detail a proposal designed to improve the efficiency of federal property manage-ment. That proposal, which was included in the Trump Administration’s 2021 budget, would establish a revolv-ing fund to serve as a capital budget for federally owned and leased buildings. It seeks to address problems with the current Federal Buildings Fund by changing how its spending is classified in the budget. This is only one example of a potential capital revolving fund.
Current Budgeting for the Federal Buildings FundTo lease or purchase a facility for most agencies, the Congress appropriates money from the Federal Buildings Fund of the General Services Administration (GSA). (Some agencies have independent authority to lease or purchase space.) GSA also uses the Federal Buildings Fund to manage leases of privately owned properties for agencies, which have become a growing share of the office space that GSA manages. In return, GSA receives rents from the agencies, which by law are supposed to be close to commercial rates. (Charging the agencies rent based on the space they use gives them an incentive to economize on space and amenities.) The rental income from agencies that occupy federally owned and GSA-held or -leased space is the primary source of funding for the Federal Buildings Fund, and those collections offset
the appropriations for the construction or leasing of other federal facilities.4
When, on behalf of an agency, the federal government buys or constructs a building (or enters into a long-term lease) through the Federal Buildings Fund, the lump-sum acquisition or construction cost (or the present value of the cost over the life of the long-term lease) is recorded up front as an obligation. That budgetary practice ensures that the entire cost to the government is reported when the decision is made, which allows the Congress to control spending. The full amount of bud-getary resources must be available in the fund to cover the obligation. For the agency or agencies that will be using the building, the costs are recorded as annual rental payments in the agency’s budget and thus spread out evenly over time. Without the Federal Buildings Fund, the purchase or long-term lease of a federal building by an agency could result in a “lumpy” investment—with large costs in some years and smaller costs in others—that would be hard for an agency to pay for while staying within its budget for ongoing operations.
In practice, the Federal Buildings Fund has not consis-tently led to efficient property management practices.5 Limited appropriations frequently constrain GSA’s ability to purchase buildings; to properly maintain, rehabilitate, and repair properties; and to enter into long-term capital leases, which transfer substantially all the benefits and risks of ownership to the lessee. (For budgetary purposes, a capital lease is any lease other than a lease-purchase agreement that does not meet the criteria for an operating lease.)6 The amount appropriated for the
4. For example, suppose the GSA rents a building from a private landlord and in turn rents space in that building to multiple federal agencies. The appropriation legislation provides the amount needed for the GSA to pay the private landlord for the rental of the full building. Those agencies in turn rent from the GSA their respective portions of the building. The agencies use their available appropriations to pay the GSA, and those rental receipts are credited to the fund and the appropriation legislation.
5. The Government Accountability Office found that even though purchases would generally be cheaper, GSA often recommended leasing over purchasing because of funding constraints. For more information on property management practices, see Government Accountability Office, Capital Financing: Alternative Approaches to Budgeting for Federal Real Property, GAO-14-239 (March 2014), pp. 10–17, www.gao.gov/products/GAO-14-239.
6. To qualify as an operating lease, the following terms must be met: The lease term cannot exceed 75 percent of the estimated economic life of the asset; the present value of the minimum

29CHAPTER 5: OPTIONS THAT WOULD USE A CASH APPROACH TO CAPITAL BUDGETING BUDGETING FOR FEDERAL INVESTMENT
Federal Buildings Fund is provided annually and is not tied to the amount of rental income the fund receives.7 When the estimated rental income to the fund exceeds the amount appropriated for the fund in a given year, the excess rental receipts offset the amounts appropriated for other purposes when the budgetary effects of the appro-priation bill are tabulated.
Because of limited funding, GSA has a budgetary incen-tive to opt for short-term leases even if they are more expensive than long-term leases or purchases. As a result, nearly all leases are structured as medium- or short-term operating leases that generally just report the first year’s lease cost up front rather than the cost over the life of the lease.8 Limited appropriations also have led GSA to defer maintenance and virtually stop buying new buildings.9
contractually required payments over the life of the lease cannot exceed 90 percent of the fair-market value of the asset at the beginning of the lease term; the asset must be a general-purpose asset and not built to the unique specifications of the government as lessee; and a private-sector market for the asset must exist. See Office of Management and Budget, Preparation, Submission, and Execution of the Budget, Circular A-11 (2020, revised March 24, 2021), Appendix B, https://go.usa.gov/x7h3W (PDF, 105 KB).
7. GSA must receive appropriations before spending money in the Federal Buildings Fund. Over the past two decades, appropriations have been less than the amount of rent collected in most years; the budget recorded those excess receipts as reductions in discretionary spending in those years. As a result, the fund had an accumulated balance of more than $6 billion at the end of 2019, but that amount is not available for spending unless appropriated by new legislation. For more information on funding issues, see Government Accountability Office, Capital Financing: Alternative Approaches to Budgeting for Federal Real Property, GAO-14-239 (March 2014), www.gao.gov/products/GAO-14-239.
8. Agencies that have independent authority to lease space have encountered similar problems. For example, the Department of Veterans Affairs (VA) may have incorrectly classified some of its leases of medical facilities as operating leases, in CBO’s estimation, even though they were akin to government purchases of facilities built specifically for VA’s use. The implications for VA are large: The department loses the residual value of a building that it has fully or mostly paid for when it vacates the facility at the end of the lease term, so the increase in costs from operating leases is greater for VA than it would be for other agencies. See Congressional Budget Office, Testimony of Robert A. Sunshine, Deputy Director, Congressional Budget Office, before the House Committee on Veterans’ Affairs, The Budgetary Treatment of Medical Facility Leases by the Department of Veterans Affairs (June 27, 2013), www.cbo.gov/publication/44368.
9. See Government Accountability Office, Capital Financing: Alternative Approaches to Budgeting for Federal Real Property,
In a competitive market, whether properties are leased or purchased should not matter because the cost should be the same in the long run. Studies have found that competition to lease building space to federal agencies is limited, though, which drives up costs, and that owning the property would be more cost-effective in the long run.10 Factors that limit competition include agencies’ preference for certain locations, specialized building and leasing requirements, and the length of GSA’s leasing process. A lack of budget authority can also push up leasing costs if needed upgrades, renovations, and other improvements to newly leased space (including installa-tion of security measures) are amortized over the cost of the lease rather than paid up front.
The Administration’s Proposal for a Federal Capital Revolving FundIn its 2021 budget, the Trump Administration pro-posed establishing within the unified budget a revolving fund—the Federal Capital Revolving Fund (FCRF)—to serve as a capital budget for projects in which civilian agencies fund the purchase or renovation of federally owned buildings, including government office build-ings. (The 2019 and 2020 budgets included a similar proposal.)11 By design, the capital revolving fund would function like state and local governments’ capital bud-gets: In the annual appropriation process, capital projects
GAO-14-239 (March 2014), pp. 28–29 and 40–41, www.gao.gov/products/GAO-14-239.
10. Ibid., pp. 26–39. Also see Government Accountability Office, High-Risk Series: Substantial Efforts Needed to Achieve Greater Progress on High-Risk Areas, GAO-19-157SP (March 2019), pp. 78-85, www.gao.gov/products/GAO-19-157sp; and Federal Real Property: GSA Could Decrease Leasing Costs by Encouraging Competition and Reducing Unneeded Fees, GAO-16-188 (January 2016), www.gao.gov/products/GAO-16-188.
11. See Office of Management and Budget, Budget of the U.S. Government, Fiscal Year 2021: Analytical Perspectives (February 2020), pp. 118–120, and Budget of the U.S. Government, Fiscal Year 2021: Appendix (February 2020), pp. 1153–1155, both available at https://govinfo.gov/app/collection/budget/2021. The proposal was introduced as the Federal Capital Revolving Fund of 2018; see Office of Management and Budget, letter to the Honorable Michael R. Pence about a proposal to create a Federal Capital Revolving Fund within the unified budget (June 12, 2018), https://go.usa.gov/xHCBe (PDF, 19 MB). The Government Accountability Office has analyzed similar proposals; see Government Accountability Office, Capital Financing: Alternative Approaches to Budgeting for Federal Real Property, GAO-14-239 (March 2014), pp. 26–39, www.gao.gov/products/GAO-14-239.
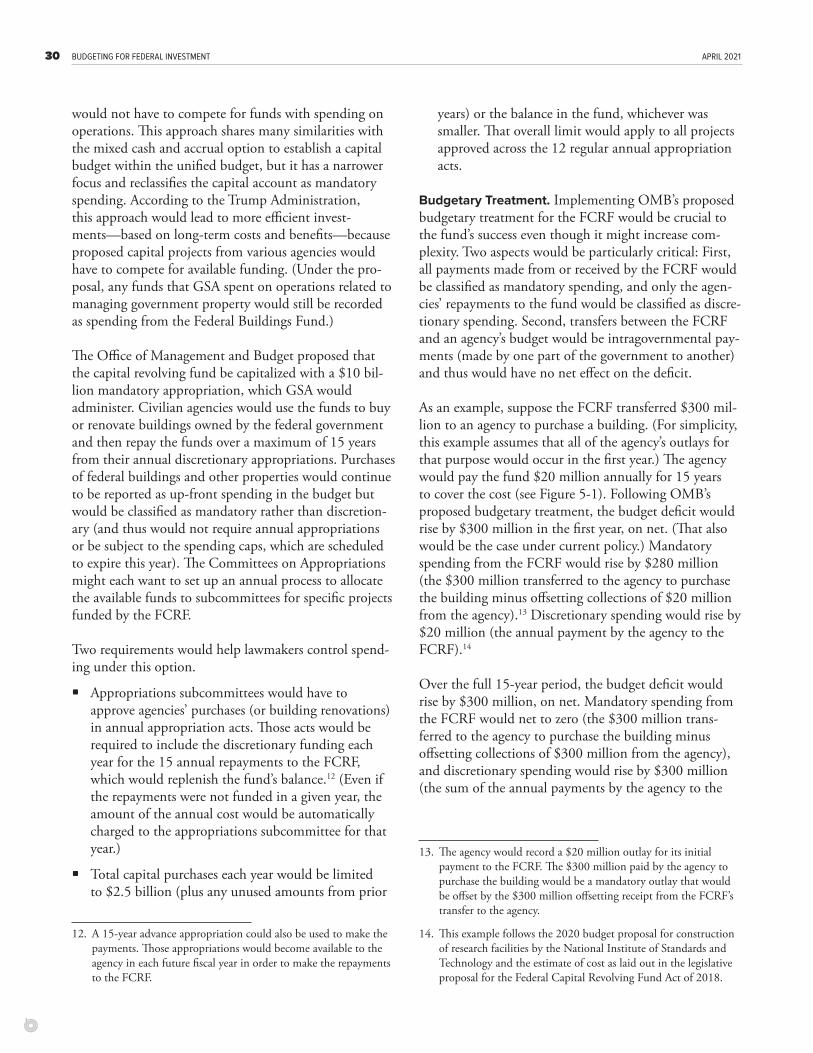
30 BUDGETING FOR FEDERAL INVESTMENT APRIL 2021
would not have to compete for funds with spending on operations. This approach shares many similarities with the mixed cash and accrual option to establish a capital budget within the unified budget, but it has a narrower focus and reclassifies the capital account as mandatory spending. According to the Trump Administration, this approach would lead to more efficient invest-ments—based on long-term costs and benefits—because proposed capital projects from various agencies would have to compete for available funding. (Under the pro-posal, any funds that GSA spent on operations related to managing government property would still be recorded as spending from the Federal Buildings Fund.)
The Office of Management and Budget proposed that the capital revolving fund be capitalized with a $10 bil-lion mandatory appropriation, which GSA would administer. Civilian agencies would use the funds to buy or renovate buildings owned by the federal government and then repay the funds over a maximum of 15 years from their annual discretionary appropriations. Purchases of federal buildings and other properties would continue to be reported as up-front spending in the budget but would be classified as mandatory rather than discretion-ary (and thus would not require annual appropriations or be subject to the spending caps, which are scheduled to expire this year). The Committees on Appropriations might each want to set up an annual process to allocate the available funds to subcommittees for specific projects funded by the FCRF.
Two requirements would help lawmakers control spend-ing under this option.
• Appropriations subcommittees would have to approve agencies’ purchases (or building renovations) in annual appropriation acts. Those acts would be required to include the discretionary funding each year for the 15 annual repayments to the FCRF, which would replenish the fund’s balance.12 (Even if the repayments were not funded in a given year, the amount of the annual cost would be automatically charged to the appropriations subcommittee for that year.)
• Total capital purchases each year would be limited to $2.5 billion (plus any unused amounts from prior
12. A 15-year advance appropriation could also be used to make the payments. Those appropriations would become available to the agency in each future fiscal year in order to make the repayments to the FCRF.
years) or the balance in the fund, whichever was smaller. That overall limit would apply to all projects approved across the 12 regular annual appropriation acts.
Budgetary Treatment. Implementing OMB’s proposed budgetary treatment for the FCRF would be crucial to the fund’s success even though it might increase com-plexity. Two aspects would be particularly critical: First, all payments made from or received by the FCRF would be classified as mandatory spending, and only the agen-cies’ repayments to the fund would be classified as discre-tionary spending. Second, transfers between the FCRF and an agency’s budget would be intragovernmental pay-ments (made by one part of the government to another) and thus would have no net effect on the deficit.
As an example, suppose the FCRF transferred $300 mil-lion to an agency to purchase a building. (For simplicity, this example assumes that all of the agency’s outlays for that purpose would occur in the first year.) The agency would pay the fund $20 million annually for 15 years to cover the cost (see Figure 5-1). Following OMB’s proposed budgetary treatment, the budget deficit would rise by $300 million in the first year, on net. (That also would be the case under current policy.) Mandatory spending from the FCRF would rise by $280 million (the $300 million transferred to the agency to purchase the building minus offsetting collections of $20 million from the agency).13 Discretionary spending would rise by $20 million (the annual payment by the agency to the FCRF).14
Over the full 15-year period, the budget deficit would rise by $300 million, on net. Mandatory spending from the FCRF would net to zero (the $300 million trans-ferred to the agency to purchase the building minus offsetting collections of $300 million from the agency), and discretionary spending would rise by $300 million (the sum of the annual payments by the agency to the
13. The agency would record a $20 million outlay for its initial payment to the FCRF. The $300 million paid by the agency to purchase the building would be a mandatory outlay that would be offset by the $300 million offsetting receipt from the FCRF’s transfer to the agency.
14. This example follows the 2020 budget proposal for construction of research facilities by the National Institute of Standards and Technology and the estimate of cost as laid out in the legislative proposal for the Federal Capital Revolving Fund Act of 2018.
31CHAPTER 5: OPTIONS THAT WOULD USE A CASH APPROACH TO CAPITAL BUDGETING BUDGETING FOR FEDERAL INVESTMENT
Figure 5-1 .
Potential Budgetary Treatment for the Use of a Federal Capital Revolving Fund to Purchase a $300 Million Building
ANNUALPAYMENT
(Discretionary)
NETEFFECT
ONE-TIMETRANSFER(Mandatory)
-$20 Million
O�setting Collection(Mandatory)
$280 Million
(Mandatory)
$20 Million
$20 Million
(Discretionary)
$300 Million
-$300 Million
FCRF AGENCY
BUILDINGPURCHASE
O�setting Collection(Mandatory)
Budgetary E�ects in the First Year
$300Million
Outlay(Mandatory)
$0 $300 Million
FCRF AGENCY
BUILDINGPURCHASE
(Discretionary)
Total Budgetary E�ects Over 15 Years
NETEFFECT
Data source: Office of Management and Budget, Budget of the U.S. Government, Fiscal Year 2021: Analytical Perspectives (February 2020), pp. 118–120, and Budget of the U.S. Government, Fiscal Year 2021: Appendix (February 2020), pp. 1153–1154, both available at https://govinfo.gov/app/collection/budget/2021.
The example assumes that an agency purchases a $300 million building (with all the outlays occurring in the first year) using funds transferred from the Federal Capital Revolving Fund and that it repays the fund $20 million annually over 15 years. All funds in the FCRF are treated as mandatory, as is the agency’s purchase of the building. In contrast, the agency’s annual payment to the fund is discretionary. Over 15 years, the agency will make a total of $300 million in discretionary payments to the FCRF, which will record those payments as mandatory offsetting collections. The net 15-year change is no increase in mandatory spending but a $300 million increase in discretionary spending.
Dashed lines indicate intragovernmental transactions (amounts paid by one part of the government to another).
FCRF = Federal Capital Revolving Fund.

32 BUDGETING FOR FEDERAL INVESTMENT APRIL 2021
FCRF).15 That budgetary accounting would continue to ensure that the full financial commitment was reported up front when the commitment was made, but the discretionary cost would be spread over several years instead of all at once. In contrast, under current policy, discretionary spending would rise by $300 million in the first year.16
Benefits and Drawbacks. Among this option’s benefits are that it might provide policymakers with more flexi-bility to allocate resources because discretionary spending would be spread out over 15 years instead of reported in full in the first year. As a result, decisions about pur-chasing versus renting office space might be made more efficiently. From a budgetary perspective, it might be easier to absorb the large up-front costs of a purchase.17 That is because the cost to the agency of purchasing the building would be treated as mandatory spending and would exactly net out against the funds transferred from the FCRF (which would also be treated as man-datory spending); the annual discretionary cost would be only one-fifteenth of the total cost. Lawmakers also might find it easier to stay within a cap on discretionary funding because they would not have to appropriate the entire amount. Establishing a pool of funding for capital purchases might also strengthen incentives for effective planning of capital investments.
One drawback of this option is that it would require the creation of new accounts and new budgetary treatments, which would further complicate the budget process and accounting. The complex bookkeeping involved would make the fund less understandable to the public and
15. Over the standard 10-year budget horizon, the budget deficit would rise by $300 million; mandatory spending from the FCRF would net to $100 million ($300 million transferred to the agency to purchase the building minus offsetting collections of $200 million from the agency); and discretionary spending would rise by $200 million (the sum of 10 annual payments by the agency to the FCRF).
16. In CBO’s reestimates of the President’s 2020 and 2021 budgets, the agency estimated this proposal on a cash basis, which is the current method for recording budgetary transactions. In the example cited, the agency would spend $300 million in discretionary funds in the first year.
17. See Art Stigile, “Solution: Federal Capital Revolving Fund” (blog entry, May 26, 2019), www.theartofscorekeeping.org/fcrf-solution/.
to lawmakers. Also, the legislative change required to establish the new mandatory spending account would be subject to Congressional pay-as-you-go enforcement mechanisms.18 Moreover, lawmakers would have to put in place additional budget accountability measures to ensure all 15 annual repayments were made. Finally, because agencies would not be able to use any savings they achieved from lower rental or purchase costs for other purposes, efficiency gains under the proposal might be limited. However, if there were savings, then agencies would not need as much funding over the longer term, which could allow the Congress to appropriate less fund-ing overall or to reallocate funding to other priorities.
Provide Supplemental Information on Investment SpendingThe final option that CBO examined is purely informa-tional. Lawmakers could request additional information on investment spending to supplement cash-based measures and to provide a more complete picture of the trade-offs involved and the potential budgetary and economic effects. Such information could include accrual estimates of costs, which would highlight the differences with cash estimates, as well as a broad analysis of the benefits of particular types of invest-ments, including their long-term effects on productivity, economic growth, and the government’s performance. That information could come from CBO, OMB, other government agencies, or private entities. Including such information in legislative cost estimates or possibly in reports might be useful for some big investment proj-ects.19 Lawmakers would need to determine the extent to which they would use such information when deciding how to allocate resources, as governed by the rules and
18. Under current rules, proposals that would increase mandatory spending would require offsets in mandatory spending for other programs or an increase in mandatory receipts. In the House and Senate, lawmakers can raise a point of order against mandatory spending legislation that would increase the budget deficit. Sixty votes would be needed to waive the point of order in the Senate.
19. CBO has issued many reports on investments. For example, see Congressional Budget Office, Reauthorizing Federal Highway Programs: Issues and Options (May 2020), www.cbo.gov/publication/56346; Approaches to Making Federal Highway Spending More Productive (February 2016), www.cbo.gov/publication/50150; and Federal Policies and Innovation (November 2014), www.cbo.gov/publication/49487.
33CHAPTER 5: OPTIONS THAT WOULD USE A CASH APPROACH TO CAPITAL BUDGETING BUDGETING FOR FEDERAL INVESTMENT
procedures of the Congressional budget process.20 The supplemental information would not directly affect bud-get totals, so it might not influence budget and policy decisions to the same extent as the other options exam-ined in this report.
An example of the kind of supplemental informa-tion that could be provided was that required by the Concurrent Resolution on the Budget for Fiscal Year 2016. That resolution applied to investments made through energy savings performance contracts (ESPCs).
20. For detailed information on federal investment and information technology, see “Information Technology” and “Federal Investment” in Office of Management and Budget, Budget of the U.S. Government, Fiscal Year 2021: Analytical Perspectives (February 2020), pp. 219–225 and 227–240, www.govinfo.gov/app/collection/budget/2021.
It specified a methodology for estimating—on a net-present-value basis—the budgetary effects of certain long-term contracts used by federal agencies to pro-cure energy conservation measures and related services. Those net-present-value estimates were valuable, for two reasons. First, they took into account all anticipated cash flows attributable to investments made through the ESPCs, including up-front capital costs and anticipated reductions in long-term energy costs; second, they were used in the Senate to enforce budget procedures.21
21. See Senate Committee on the Budget, Concurrent Resolution on the Budget for Fiscal Year 2016, 114th Congress, 1st session, www.congress.gov/bill/114th-congress/senate-concurrent-resolution/11/text. A similar rule applied to legislation considered in the House. For additional information on the budgetary treatment of ESPCs, see Congressional Budget Office, Using ESPCs to Finance Federal Investment in Energy-Efficient Equipment (February 2015), www.cbo.gov/publication/49869.


Appendix A: International Experience With Budgeting for Capital Investments
Most developed countries, including Germany and France, use a cash-based approach to budgeting, which generally recognizes the cost of a capital asset as an obligation when resources are committed.1 Some coun-tries budget on an accrual basis, and they generally also accrue the cost of their capital investments, which delays recognition of investment costs.2
Capital budgeting practices vary among countries. Appropriations can be presented on a cash basis (as in Canada), accrual and cash bases (as in Austria, Australia, and the United Kingdom), or accrual basis (as in New Zealand, the only country that uses full accrual spend-ing authorizations). France budgets for capital on both a commitment and a cash basis. Although France has a unified budget, its operating and capital accounts are separate, and appropriations cannot be transferred between them.3 Most countries—even those that have adopted a full or partial accrual approach—continue using cash spending limits to control spending and to link to their governments’ immediate financing requirements.4
1. Cash-based budgeting for investment in other developed countries can follow different practices than those used in the United States. Some countries do not report the cost of the commitment up front, as is done in the United States, and instead report the cash flows for acquisition costs only as they occur. In that case, the budget provides less control over spending.
2. See Organisation for Economic Co-operation and Development, Budgeting and Public Expenditures in OECD Countries 2019 (April 2019), pp. 131–145, https://tinyurl.com/y29mpmeq; and Organisation for Economic Co-operation and Development and International Federation of Accountants, Accrual Practices and Reform Experiences in OECD Countries (OECD, 2017), https://dx.doi.org/10.1787/9789264270572-en.
3. See Delphine Moretti and Dirk Kraan, “Budgeting in France,” OECD Journal on Budgeting, vol. 18, no. 2 (December 2018), pp. 8–72, https://dx.doi.org/10.1787/budget-18-5j8jt0pt4c0q.
4. See Delphine Moretti and Tim Youngberry, “Getting Added Value Out of Accruals Reforms,” OECD Journal on Budgeting,
Countries do not use a standard budgetary definition of capital spending. Although the definition depends on each country’s laws, it generally includes physical assets (property, plant, and equipment) with a useful life of more than one year, and capital improvements (but not routine maintenance and repairs) that extend the life of the asset. Outlays related to research and development, as well as education, are typically accounted for as current spending, not as investment.
Accrual Budgeting in PracticeAccrual budgeting treats the purchase of capital resources as an exchange of assets—in other words, the balance sheet shows less cash and more of the particular assets. Current capital costs are allocated to the future, spread-ing them over estimates of the assets’ useful life. The budget reports the depreciation of the assets, which covers both their physical wear and tear and their antici-pated technological obsolescence, as the annual cost. (A private firm’s income statement would use the same approach, although its cash statement would report the entire expenditure up front.)
The decision to report depreciation as an expense is not universally accepted. Australia, for example, changed its approach from reporting the depreciation expense to reporting the cash cost of asset purchases.5 Other decisions about capital budgeting relate to the valuation of assets—in particular, whether that value should reflect historical cost or replacement cost and how to determine how quickly depreciation occurs. In addition, countries
vol. 18, no. 1 (September 2018), p. 122, https://doi.org/ 10.1787/budget-18-5j8l804hpvmt.
5. Australia uses both cash and accrual measures in its budget but uses cash for appropriations. The cash estimate of the budget deficit (or surplus) receives more attention from policymakers and the public than the accrual measure of net operating costs (revenues minus expenses). See OECD and Ken Warren, “Time to Look Again at Accrual Budgeting,” OECD Journal on Budgeting, vol. 14, no. 3 (August 2015), pp. 113–129, http://dx.doi.org/10.1787/budget-14-5jrw6591hj6c.
36 BUDGETING FOR FEDERAL INVESTMENT APRIL 2021
need to decide whether to include military assets in their capital budgets, as the United Kingdom does.6
Controlling Spending With Accrual BudgetingCountries’ experience with accrual budgeting for capital investments suggests the need for additional budgetary controls on asset purchases. The United Kingdom has a capital budget but also explicitly limits total annual cap-ital expenditures (net of depreciation and any proceeds from the sale of nonfinancial assets) to help control the amount of debt and promote fiscal sustainability.7 New Zealand has a multiyear capital allowance, which ensures that the budget reflects and authorizes the funding for each investment and keeps cash disbursements to the agreed funding amounts. (Agencies can also build up cash to replace their assets; they have a permanent legis-lative authority to use their balance sheet assets to fund new investments.) Moreover, the government’s relevant ministries or cabinet must approve any large or high-risk capital investments. Other countries that also accrue the cost of investments, like Australia and Denmark, use different constraints to limit their capital spending.8
In New Zealand and the United Kingdom, net capi-tal investment (expressed as a share of gross domestic product) has trended downward in the past decade; in all likelihood, though, that trend reflects policy choices rather than budgetary enforcement mechanisms. Over
6. See Caridad Marti, “Accrual Budgeting: Accounting Treatment of Key Public Sector Items and Implications for Fiscal Policy,” Public Budgeting & Finance, vol. 26, no. 2 (June 2006), pp. 45–65, http://dx.doi.org/10.1111/j.1540-5850.2006.00846.x.
7. Departments are permitted to retain some of the income from sales of their fixed assets or privatizations of those assets in their capital budgets to give them more flexibility in their capital spending. See HM Treasury, Consolidated Budgeting Guidance 2020 to 2021 (March 2020), pp. 8, 23–24, and 80–88, https://tinyurl.com/hm9wuxa8 (PDF, 1.4 MB).
8. See Marc Robinson, Accrual Budgeting and Fiscal Policy, Working Paper WP/09/84 (International Monetary Fund, April 2009), pp. 7–10 and 21–25, https://tinyurl.com/dff5d5rb (PDF, 675 KB). For additional information on how other countries treat capital spending, see Davina F. Jacobs, A Review of Capital Budgeting Practices, Working Paper 08/160 (International Monetary Fund, June 2008), https://tinyurl.com/yxax7rqz; and Government Accountability Office, Budget Issues: Accrual Budgeting Useful in Certain Areas but Does Not Provide Sufficient Information for Reporting on Our Nation’s Longer-Term Fiscal Challenge, GAO-08-206 (December 2007), pp. 19, 22–24, and 28–29, www.gao.gov/products/GAO-08-206.
the past several years, both countries have increased their infrastructure spending to promote economic growth.9
Some countries have taken additional steps to make their approaches to capital budgeting more effective at controlling costs and boosting efficiency. To improve asset management and realize savings from property consolidation, for example, France added a capital charge to provide stronger incentives for agencies to use their resources efficiently.10 The charge is levied against the value of agencies’ assets. New Zealand’s capital charge exceeds the government’s cost of borrowing in order to reflect the cost of risk. By reducing assets, agencies lessen the charges that they pay, and a portion of the savings is retained in their budgets. That incentive is more powerful in New Zealand than in most other countries, because New Zealand allows agency managers more discretion in how funds are spent. In Canada, accrual accounting has led to more relevant cost information for policymakers to use when deciding whether to buy, lease, or sell buildings and equipment because of the focus on the depreciation of the asset.11 Some countries have abandoned capital charges because they made the budget process more complicated without producing the intended results.12
Challenges Posed by Accrual BudgetingA particular challenge that countries have faced in adopting accrual budgeting is incorporating depreciation into the operating budget.13 The amount of depreciation reported depends heavily on assumptions that can be
9. See Andrew Bailey and others, Euston, We Have a Problem: Is Britain Ready for an Infrastructure Revolution? (Resolution Foundation, March 2020), p. 23, https://tinyurl.com/y3rqkq5d (PDF, 6.2 MB); and New Zealand Treasury, Budget Policy Statement 2020 (December 2019), p. 6, https://treasury.govt.nz/system/files/2019-12/bps2020.pdf (1.3 MB).
10. See Delphine Moretti and Tim Youngberry, “Getting Added Value Out of Accruals Reforms,” OECD Journal on Budgeting, vol. 18, no. 1 (September 2018), pp. 114–166, https://doi.org/ 10.1787/budget-18-5j8l804hpvmt.
11. See Marc Robinson, “Budget Reform Before and After the Global Financial Crisis” (paper prepared for the 36th annual OECD senior budget officials meeting, June 11–12, 2015), p. 40, https://tinyurl.com/y6mdaenx (PDF, 990 KB).
12. Ibid., pp. 11–13.
13. Electronic communication from Delphine Moretti, Senior Policy Analyst, Organisation for Economic Co-Operation and Development, June 5, 2020.

37APPENDIX A: INTERNATIONAL EXPERIENCE WITH BUDGETING FOR CAPITAL INVESTMENTS BUDGETING FOR FEDERAL INVESTMENT
highly uncertain. For example, factors used to determine the useful life of an asset, such as physical wear and tear or technological obsolescence, are very subjective, although engineering norms can help inform them. In addition, even though depreciation indirectly reflects the need for maintenance, governments rarely use reported depreciation to indicate how much spending for main-tenance or repairs should be included in the budget. The exception is New Zealand, where agencies receive funds for the full cost of services and are expected to manage the condition and fitness of the assets for which they are responsible. Agencies are also expected to plan for the eventual replacement of those assets when their useful lives are over.
Another challenge posed by accrual budgeting is the val-uation of capital assets. Countries use different measures to value those assets—including market value, replace-ment cost, or depreciated cost—and the chosen measure affects what is reflected in the budget. When assets such as government buildings are valued at market prices, for instance, the operating budget may report the change in market value (the appreciation or depreciation of the asset), which can be more difficult for some people to interpret from a budgetary perspective. In the United Kingdom, any profit or loss (relative to net book value) on the sale of a fixed asset is reported in the department’s operating budget.

Appendix B: Capital Budgeting by the States
States pay for most of the immediate services they provide in a fiscal year using revenues collected during that year. The time frame is longer for capital projects, though: States typically spread the costs of capital assets over their useful life by issuing debt and paying those costs over time. Doing that allows states to at least partially align the benefits that taxpayers receive with the taxes they pay. Because capital projects are planned, exe-cuted, and paid for over several years, most states (unlike the federal government) prepare capital budgets that are distinct from their operating budgets. As of 2014, 32 states had separate capital and operating budgets, and the others required separate budgetary decisions on capital investments.1
The role of capital budgeting at the state level is similar to that in other countries and in the private sector: to provide a framework for developing near- and long-term capital and financial plans. There is no uniform method by which states develop their capital budgets, though. Approaches vary in many respects, from the constitu-tional, statutory, and administrative frameworks that govern capital budgets to the amount of centralization in planning and executing the budget.
Capital Budgeting at the State LevelA state’s capital budget contains statements of projects’ costs and sources of financing, reported on a cash basis, and generally has two sections. The first section describes expenditures for projects that are not financed using debt, and the second describes projects that are financed with borrowed funds. Annual payments for principal and interest on debt are generally paid through the operating budget.2
1. See National Association of State Budget Officers, Capital Budgeting in the States (Spring 2014), pp. 44–45, https://tinyurl.com/yupu6v8c.
2. Ibid., p. 86.
Some general observations about capital budgets are the following:
• States finance their capital expenditures with a mix of current revenues and fees, as well as debt;
• States do not report depreciation as spending because depreciation does not directly affect cash flows or current financial resources;
• States face credit-market constraints on their borrowing—if they increase their borrowing too much, they risk investors demanding higher interest rates. In addition, states have enacted, to varying degrees, requirements for balanced operating budgets and restrictions on the issuance of debt;3 and
• States must compete for taxpayers (unlike the federal government), which constrains their ability to shift the costs of today’s services to future taxpayers.
States spend substantial amounts each year on invest-ments in physical and human capital. The National Association of State Budget Officers (NASBO) esti-mates that in fiscal year 2019 states spent $114 billion on capital (about 5 percent of their total outlays), an increase of nearly 8 percent over amounts the previous year.4 Although capital financing patterns vary, over-all, 38 percent of projects were paid from state special funds (such as dedicated fees), 27 percent from bond proceeds, 27 percent from federal funds, and 8 percent from general funds. The largest category of state capital expenditures in that year was transportation spending (64 percent), followed by higher education (11 percent).
States’ investment in higher education, which is reported in their capital budgets, reflects financial support for public universities and colleges, career and technical
3. See the Pew Charitable Trusts, Strategies for Managing State Debt (June 2017, updated April 2018), https://tinyurl.com/y9exa5od.
4. States’ fiscal years generally run from July 1 to June 30. See National Association of State Budget Officers, State Expenditure Report (2019), pp. 5 and 85–98, www.nasbo.org/reports-data/state-expenditure-report.

40 BUDGETING FOR FEDERAL INVESTMENT APRIL 2021
education, and students’ financial aid. NASBO estimates that states spent $53 billion on debt-service payments in 2019. Almost half of all states transferred money to local governments for capital projects.
Adoption of a separate capital budget may boost invest-ment spending. Some studies find that states’ overall spending on public capital is lower when they do not have separate capital budgets.5
Beyond their effects on the amounts of investment spending, separate capital budgets have advantages and disadvantages when compared with combined budgets. Adoption of a separate capital budget may improve the efficiency of states’ spending on individual projects. Some research suggests that capital budgets reduce the volatility of that spending and thus help keep costs down for individual projects. When used to develop a multiyear plan, capital budgets make it easier for states to have more financial stability, because they provide clearer project timelines and allow the use of financial mech-anisms that result in fewer delays (and cost overruns).6 Disadvantages of separate capital budgets are that they complicate the budget process and may confuse both policymakers and the public about how capital budgets are incorporated in balancing the budget.
How States Define Capital ProjectsHow states identify what constitutes a capital project varies. Most often, the term is defined in statute and includes one or more categories of projects. Definitions may also be found in regulations and state codes. Some states define capital spending in their constitutions.7
All states define capital projects to include building projects, and nearly all include land acquisition. Capital projects also can include infrastructure, major repairs
5. See Ronald C. Fisher and Robert W. Wassmer, “An Analysis of State and Local Government Capital Expenditure Before and During the ‘Great Recession,’ ” Proceedings: Annual Conference on Taxation and Minutes of the Annual Meeting of the National Tax Association, vol. 105 (2012), pp. 37–45, www.jstor.org/stable/prancotamamnta.105.37.
6. See Arwiphawee Srithongrung, “Capital Budgeting and Management Practices: Smoothing Out Rough Spots in Government Outlays,” Public Budgeting & Finance, vol. 30 (June 2017), pp. 47–71, https://doi.org/10.1111/pbaf.12167.
7. See National Association of State Budget Officers, Capital Budgeting in the States (Spring 2014), pp. 5–31, https://tinyurl.com/yupu6v8c.
and improvements, and major equipment purchases, as well as planning, design, and construction. Some states include in their capital budgets grant payments to local governments and public authorities for aviation, economic development, port development, community colleges, mental health services, and housing projects.
Not all capital-related expenditures are included in states’ capital budgets. Because revenues for transportation primarily come from fuel taxes or federal grants, 19 states exclude capital expenditures for transportation infra-structure from their capital budgets. Most states exclude expenditures for routine maintenance and payments on leased property, which are instead included in operat-ing budgets. Also excluded in most cases are projects financed by debt issued by certain public authorities, including those for turnpikes, ports, and airports, and backed by revenues (such as tolls) collected by those authorities.
More than half of all states require a capital asset to be tangible, but some states allow intangible assets (including architectural and engineering services and environmental protection and remediation activities) to qualify. In most states, capital projects must meet additional requirements to be considered for the capital budget—for instance, projects must meet minimum cost thresholds, which may vary for capital equipment and capital construction. Finally, although minor repairs and routine maintenance are generally classified as operating expenses, many states classify deferred or major main-tenance as a capital expense. Of the states in the latter category, 29 have a specific mechanism in their capital budgets to set aside funds for maintenance.
Constraints on Capital Budgeting at the State LevelStates’ efforts to finance capital projects in the near and long term often require working within constraints that limit the amount of revenue a state can generate over the financing period. In some instances, constraints are self-imposed, through balanced budget requirements and debt limits. In other instances, the condition of the econ-omy, when combined with the state’s fiscal condition and bond ratings, can constrain the amount of debt a state can afford. For example, economic conditions may limit the amount of tax revenue that can be generated, and higher debt levels can increase the cost of additional borrowing.

41APPENDIX B: CAPITAL BUDGETING BY THE STATES BUDGETING FOR FEDERAL INVESTMENT
Balanced Budget Requirements Requirements to achieve a balanced budget vary by state. Most states require the governor to submit a balanced budget to the legislature; fewer states require the legisla-ture to pass the balanced budget and even fewer require the governor to sign it. Notably, none of those require-ments ensure that states’ operating budgets are balanced at the end of the fiscal year. In practice, states take addi-tional actions to balance their budgets:
• They draw on rainy-day funds or borrow to fund their operating deficits;
• They make midyear adjustments to appropriation levels by reallocating or eliminating spending authorizations; or
• They carry over deficits to the following fiscal year.
Budget overruns are usually small relative to total state expenditures (excluding spending for significant emer-gencies), which suggests that the requirements impose budget discipline on legislators.
Payments for capital investments that are made from states’ operating budgets are subject to the same balanced budget requirements. That constraint limits the amount of money available for capital investments in a given year by requiring cash outflows (for principal and debt-service payments, as well as payments for investment projects financed without borrowing) to compete with payments for other services and programs. (Depreciation is not subject to balanced budget requirements because it does not require a cash payment.) When unplanned events cause shortfalls in states’ revenue collections, competing demands for cash intensify. In that case, policymakers often rebalance and reallocate resources, which typically includes curtailing planned maintenance, upgrades, and purchases of equipment.
Constraints on Borrowing Capital projects often require that states make large expenditures periodically over an extended time. Because a state’s ability to make those large expenditures is constrained by its need to pay for regular operating costs out of revenues collected during the fiscal year, capital investments are generally financed, at least in part, by issuing debt and are excluded from balanced budget requirements. When the cost of a project is spread over several years (and sometimes as long as the life of the asset), states can spread the tax burden over time as well, allowing taxpayers who benefit years after a project is
completed to remit taxes that help pay for it. To keep taxes from becoming too burdensome for taxpayers, though, states often refinance their outstanding debt to take advantage of lower interest rates and reduce their debt-service costs.
The mechanisms that states use to manage the size and amount of their debt vary from state to state. The capac-ity to make debt-service payments changes as revenue collections fluctuate, so some states build flexibility into their debt limits by restricting outstanding debt to a per-centage of the state’s taxable property value or by holding debt service to a percentage of general fund revenues. Other states limit the total amount of debt outstand-ing or require voters’ approval before new debt may be issued. State-imposed controls that limit the amount of outstanding debt often can be overridden to allow a state to incur more debt by modifying the provision that controls the debt limit.
Constraints on Financing States’ budgeting practices reflect the reality that states compete with each other for tax revenues. That competi-tion imposes budget discipline because the fiscal policies of a state influence the capacity of its tax base to generate revenues and thus the state’s ability to finance long-term projects through the issuance of debt. In other words, capital budgets reflect the state’s balance of debt pref-erences, interest rates, and policy choices. When states amass large amounts of debt, their ability to meet finan-cial obligations diminishes. Interest rates on their debt may rise, making issuing bonds to finance projects more expensive. By constraining states in that way, financial markets impose some discipline on state budgeting.
Which financing option, or combination of options, a state uses to accommodate higher debt-service payments depends on the policy environment. Higher debt-service payments can cause project managers to scale back on aspects of a project to reduce costs so that more of the budget is available to service the debt; otherwise, the state will need to borrow even more. In that way, large amounts of debt and commensurate debt-service costs (which are generally paid through the operating budget) can crowd out other types of spending (on services and programs, for instance) or force policymakers to raise taxes. Such policy changes could ultimately reduce the size of the tax base if businesses and residents chose to relocate to another state in search of a lower tax burden or additional services.

List of Tables and Figures
Tables
1-1. Value of Federal Property, Plant, and Equipment as of September 30, 2019 8
3-1. Examples of Cash- and Accrual-Based Accounting for a Hypothetical $3 Billion Infrastructure Investment Under Two Scenarios 19
4-1. Comparison of the Actual Federal Budget With Accounts Under an Illustrative Budget That Uses a Mix of Cash and Accrual Measures in a Unified Budget, 2016 to 2019 26
Figures
2-1. Federal Nondefense and Defense Investment Outlays, 1962 to 2019 10
2-2. Federal Nondefense and Defense Investment Outlays Relative to Federal Outlays, 1962 to 2019 11
2-3. Federal Nondefense and Defense Investment Outlays, 2019 13
3-1. The Federal Government’s Depreciation of Existing Assets Versus Acquisition Costs of New Assets, 2009 to 2019 18
3-2. Comparing Options for Budgeting for Federal Investment 20
5-1. Potential Budgetary Treatment for the Use of a Federal Capital Revolving Fund to Purchase a $300 Million Building 31

About This Document
This report was prepared in response to interest expressed by Members of Congress. In keeping with the Congressional Budget Office’s mandate to provide objective, impartial analysis, the report makes no recommendations.
Barry Blom, Megan Carroll, and David Torregrosa wrote the report, with guidance from Sebastien Gay, Theresa Gullo, and Damien Moore (formerly of CBO) and with contributions from Kent Christensen (formerly of CBO), Brandon Lever, Aldo Prosperi, Justin Riordan, and Natalie Tawil. Useful comments were provided by Christina Hawley Anthony, Kathleen Burke, Sheila Campbell, Devrim Demirel, Michael Falkenheim, Tracy Henry, Christian Howlett, Justin Humphrey, Joseph Kile, Wendy Kiska, Vinay Maruri, John McClelland, Nathan Musick, Matthew Pickford, Lisa Ramirez-Branum, Dawn Sauter Regan, Mitchell Remy, Joseph Rosenberg, Chad Shirley, Jeffrey Werling, Christopher Williams, and Susan Willie.
Helpful comments were also provided by Alexandra Edwards and Susan Irving of the Government Accountability Office; Kerry Hollingsworth, Simon McLoughlin, and Ken Warren of the New Zealand Treasury; Deborah J. Lucas of the Massachusetts Institute of Technology (a consultant to CBO); Delphine Moretti of the Organisation for Economic Co-operation and Development; Steve Redburn of George Washington University; Allen Schick of the University of Maryland; and Art Stigile (formerly of the Office of Management and Budget). The assistance of external reviewers implies no responsibility for the final product, which rests solely with CBO.
Mark Doms, Mark Hadley, and Robert Sunshine reviewed the report. Christine Bogusz was the editor, and Jorge Salazar was the graphics editor. The report is available on CBO’s website (www.cbo.gov/publication/56900).
CBO continually seeks feedback to make its work as useful as possible. Please send any feedback to [email protected].
Phillip L. SwagelDirectorApril 2021

Corrections
The Congressional Budget Office has corrected this report since its original publication. Both the PDF and online versions were corrected, but for ease of reference, this list indicates the locations of the corrections in the PDF.
The following changes were made on April 30, 2021:
Page 7: The paragraphs beginning “As part of their GDP account” and “The NIPA government accounts” were added. The following paragraph was deleted: “The NIPAs do not track cash outlays for investments in their measure of federal expenditures. Rather, the NIPA counterpart to the federal budget recognizes the cost of investments when they are consumed, not when they are purchased. Consequently, the NIPA measure of federal expenditures for investments is based on estimates of the depreciation (consumption of fixed capital) of the stock of federal capital. (For details, see Box 1-1.)”