budget summary and narratives volume 5
TRANSCRIPT
BUDGET SUMMARY and NARRATIVES Volume 5
Table of Contents
1. Executive Summary
2. Summary Reports1. Operating and Maintenance expense comparisons with variance
explanations by FERC function between 2020 Actual and 2022Budget for NSPM Electric
2. Operating and Maintenance expense comparison by cost elementfor NSPM Electric between:A. 2020 Actual and 2022 Budget,B. 2022 Budget and 2023 Budget, andC. 2023 Budget and 2024 Budget.
3. Operating and Maintenance expense comparison by FERC accountfor NSPM Electric between:A. 2020 Actual and 2022 Budget,B. 2022 Budget and 2023 Budget, andC. 2023 Budget and 2024 Budget.
3. Budget Process
4. O&M Budget Narratives (2022-2024)
A. ENERGY SUPPLY
B. NUCLEAR GENERATION (including Outage Deferral & Amortization)
C. TRANSMISSION
D. DISTRIBUTION OPERATIONS and GAS ENGINEERING &OPERATIONS
E. OPERATION SERVICES
F. BENEFITS
G. CUSTOMER AND INNOVATION • Business Systems• Customer Care• Bad Debt• Chief Customer and Innovation Officer
PUBLIC DOCUMENT - NOT PUBLIC DATA HAS BEEN EXCISED

Budget Summary and Narratives (Volume 5) – Table of Contents (continued)
2
H. HUMAN RESOURCES AND EMPLOYEE SERVICES
• Human Resources, Corporate Giving, Enterprise Learning and Technical Training, and Workforce Relations and Safety
• Property Services and Aviation
I. SHARED SERVICE ORGANIZATIONS • Chief Executive Officer • Risk, Audit and Compliance • Strategy Planning and External Affairs • Corporate Other • Financial Operations • NSPM President • General Counsel
5. Inflation Trend Analysis 6. Budget Translation / Analysis of Miscellaneous Expenses 7. Capital Substitution / Contingent Process and Reports

Volume 5 – Executive Summary 1
Introduction The purpose of the budget summary, process, and documentation contained in Volumes 5 and 6 and of this filing is to provide information supporting the 2022 through 2024 operating and maintenance (O&M) expense and 2022 through 2024 capital expenditure budgets for the utility companies that make up Northern States Power Company – Minnesota (NSPM). This Executive Summary is designed to provide an overview of the Budget Documentation and explain how the different components fit together. Summary-level NSPM Electric Utility (NSPM Electric) reports are provided in the “Summary Reports” tab of this Volume 5. These reports show the 2020 actual versus 2022 budget O&M expenses and then forward-looking comparisons for 2022, 2023, and 2024, summarized across all business areas:
Summary Report 1 compares O&M expense by function between the 2020 actual and 2022 budget for NSPM Electric. The report includes an analysis of the major categories of cost changes over the two-year period.
Summary Report 2 compares O&M expense by cost element between the 2020 actual and 2022 budget (2A), 2022 budget and 2023 budget (2B), and the 2023 budget and 2024 budget (2C) periods for NSPM Electric.
Summary Report 3 compares O&M expense by FERC account between the 2020 actual and 2022 budget (3A), 2022 budget and 2023 budget (3B), and the 2023 budget and 2024 budget (3C) periods for NSPM Electric.
These reports reflect NSPM total electric utility costs. These exhibits reflect business area costs in total prior to Minnesota electric jurisdictional allocations and any test year adjustments, so not all of the above costs are reflected in the cost of service, nor are the costs all part of our request for rate recovery in this proceeding. A description of the budgeting process is provided in the Budget Process tab of this Volume 5. The O&M Budget Narratives section of Volume 5 includes detailed narrative, variance explanations, and expense schedule information for the 2022 - 2024 Multi-Year Rate Plan (MYRP) with walk forward information for these years starting with the 2021 year-end forecast as of July 2021. These summaries are organized by Business Area. Volume 5 of the budget documentation concludes with the IHS Markit Guideline Analysis of 2020 actuals to the 2022 budget amounts, the budget translation documents, and the capital substitutions and contintent fund reports. The IHS Markit Guideline Analysis includes both (1) analytical explanations (by FERC account) for significant differences between the 2022 budget and levels expected based on IHS Markit-inflated 2020 actuals and (2) a numeric summary of the inflated 2020 actual amounts compared to the 2022 budget amounts. The budget translation documents include translation reports linking cost element, cost activity, and project budgeting mechanisms on a common and consistent basis to ensure a proper audit trail. And the capital substitutions and contingent fund reports include information on the Company’s capital substitutions and contingent fund processes and reports for the primary capital business areas.

Volume 5 – Executive Summary 2
Volume 6 Variance Explanations compares the 2020 actual versus 2022 budget O&M expenses by FERC account. The Variance Explanations then provide, for any variances of at least ±$500,000 and at least five percent, an explanation of the reasons for the observed variance. Supporting Schedules are provided in Volume 6, as well, which provide information on billings, O&M by cost element, O&M by FERC account, and capital budgets. The billing information is provided for the 2022, 2023, and 2024 budgets. O&M information is provided in several formats by cost element and FERC account, providing variance information to allow comparisons between 2020 to 2022, 2022 to 2023, and 2023 to 2024. Finally, capital budget information for 2022, 2023, and 2024 is included by business area and by business area by utility. Volume 6 concludes with Supplemental Reports for the most recent three historical annual periods of 2018 through 2020. The Supplemental Reports section provides Xcel Energy Financial Performance Team (FPT) Reports summarizing total NSPM Company actual and budget O&M and capital expenditures by business area, including the annual budget variance and explanations. The process for compiling and reporting O&M and capital expenditure variance information changed significantly in 2019, resulting in a different deliverable for that year. Under the current process, Monthly Performance Review meetings area held with each business area and the final deliverable is a summarized presentation with explanations for the capital and O&M variance drivers for NSPM. The total variance for NSPM and each business area is provided along with a description of primary variance drivers. This section also contains summaries of the most recent three years of historical O&M expenses for NSPM Electric. Three annual schedules provide the actual and budget expenditures, including the variance and percent variance. The O&M expenses are organized by functional class and listed by FERC account. Summaries of the most recent three years of historical NSPM capital expenditures, organized by project, are also included in this section. The remainder of this Executive Summary provides an overview of Xcel Energy’s corporate organization, followed by more detailed descriptions of the information contained within Volumes 5 and 6.

Volume 5 – Executive Summary 3
Xcel Energy Operating Companies Budget information for the following companies was developed during the budget effort: • Northern States Power Company – Minnesota (NSPM), aka Operating Company
(OpCo) • Northern States Power Company – Wisconsin (NSPW) • Public Service Company of Colorado (PSCo) • Southwestern Public Service Company (SPS) • Xcel Energy Services Inc. (XES), aka Service Company (Svc Co), which includes
services provided to the subsidiaries of Xcel Energy The materials provided within Volume 5 and 6 include budget information specific to NSPM as well as any XES costs that are allocated to NSPM. NSPM is a direct subsidiary of Xcel Energy Inc. NSPM is an operating utility engaged in the generation, transmission, distribution, and sale of electricity in Minnesota, North Dakota, and South Dakota. NSPM also purchases, distributes, and sells natural gas to retail customers and transports customer-owned gas in Minnesota and North Dakota. NSPM provides electric utility service to approximately 1.5 million customers and gas utility service to approximately 0.5 million customers. NSPW is a direct subsidiary of Xcel Energy Inc. NSPW is an operating utility engaged in the generation, transmission, distribution, and sale of electricity to approximately 300,000 customers in northwestern Wisconsin and in the western portion of the Upper Peninsula of Michigan. NSPW is also engaged in the purchase, distribution, and sale of natural gas to retail customers and transports customer-owned gas in the same service territory to approximately 100,000 customers. PSCo is a direct subsidiary of Xcel Energy Inc. PSCo is an operating utility engaged principally in the generation, purchase, transmission, distribution, and sale of electricity and the purchase, transportation, distribution, and sale of natural gas. PSCo serves approximately 1.5 million electric and 1.4 million natural gas customers in Colorado. SPS is a direct subsidiary of Xcel Energy Inc. SPS is an operating utility engaged primarily in the generation, purchase, transmission, distribution, and sale of electricity. SPS serves approximately 400,000 electric customers in portions of Texas and New Mexico. A major portion of SPS’ retail electric operating revenues is derived from operations in Texas. XES is a direct subsidiary of Xcel Energy Inc. XES provides various administrative, managerial, environmental, and other support services to the other subsidiary companies of Xcel Energy Inc.

Volume 5 – Executive Summary 4
Corporate Organization Budget documentation is provided for each of the internal utility company business areas and the XES business areas that provide support to the utility companies. Each of the business areas has a senior officer responsible for its operation. There have been modifications to the organization of these business areas since the time of our last electric rate case. The business areas are listed below: • Energy Supply
o Business area that includes electric generation facilities, as well as various other supporting departments required to maintain their operations (Engineering and Construction, Technical Services, Environmental, Corporate, Minnesota Generation, and VP Operations, VP Energy Supply)
• Nuclear Generation (including Outage Deferral & Amortization) o Business area that provides oversight and financial responsibility for Nuclear
Generation. Reports the accounting for nuclear outage costs that are incurred in the Nuclear Generation business area
• Transmission o Business area that oversees Xcel Energy’s transmission and substation
business as well as System Performance and Standards • Distribution Operations and Gas Engineering & Operations
o The Distribution Operations organization provides oversight for Vegetation Management, Gas and Electric Distribution Design, Construction and Maintenance, Metering Systems, Facility Attachments, Electric Distribution Engineering and Emergency Response, and Outdoor Lighting. The Gas Engineering and Operations group manages the damage prevention function, which is responsible for locating underground electric facilities. It is also responsible for the mapping of underground electric assets.
• Operation Services o Business area that manages Xcel Energy’s Commercial Operations, electric
and gas fuel supply, and Supply Chain functions • Benefits
o Support area that contains the summary of labor additive costs, including payroll taxes, non-productive labor costs, insurance and pension costs, incentive costs, and workers’ compensation costs
• Customer and Innovation o Business areas that provide integrated services to Xcel Energy and its
operating companies in the following areas: Business Systems, Customer Care, Bad Debt, and Customer and Innovation.
• Human Resources and Employee Services o Business areas that provide integrated services to Xcel Energy and its
operating companies in the following areas: Human Resources and Employee Services, Talent Strategy and Transformation, Total Rewards, Workforce Strategy and Consulting and HR Strategy and Performance. Also includes Property Services and Aviation.
• Other Shared Services Organizations o Chief Executive Officer (CEO) includes the Chairman’s Fund and Chief
Executive Officer o Risk, Audit and Compliance helps to ensure the integrity of company finances
and operations through robust risk analytics, audit services and compliance with corporate ethics and other policies.

Volume 5 – Executive Summary 5
Corporate Organization (continued)
o Strategic Planning and External Affairs identifies strategies that promote the company’s value in a variety of business, policy and energy-related areas.
o Corporate Other contains the following functions: company use credits, overhead charges to affiliates, A&G charges to capital, non-regulated overheads, and permanent income tax differences. Detailed descriptions of each business function are described under the major business functions and key activities section of the narrative.
o Financial Operations leads financial governance and delivers superior financial services.
o NSPM President, manages Rates and Regulatory Affairs, and Community Relations
o General Counsel provides critical legal and strategy services to Xcel Energy, its operating companies and its subsidiaries with a focus on advancing strategic objectives.

Volume 5 – Executive Summary 6
Budget Documentation – Volume 5 Budgeting is the foundation and framework for developing supportable and attainable financial plans by legal entity, utility, and jurisdiction. Budget documentation provides a consistent basis for business planning and budget reviews, facilitates any necessary budget adjustments, provides transparency and a clear audit trail, and supports rate case filings. The format of each business area’s budget documentation is consistent and is generally comprised of the major sections discussed below: Narrative Documentation Major Business Functions and Key Activities Introduction This section generally describes the organization, primary focus, and overall responsibilities of the sub-areas included in the business area being discussed. Customer Value This section discusses the key priorities, strategic initiatives, and elements of the business area and how they optimize direct benefit to the customer. Examples include productivity improvements, overhaul management of the generation plants, environmental initiatives, infrastructure modernization and new technologies, increasing capacity requirements, and compliance with reliability standards to ensure the safe delivery of our energy products. Walk Forward of Major Cost Drivers This section consists of two parts: Walk forward schedules of the business drivers and amounts that comprise the majority of the increases and/or decreases in O&M costs in the form of tables and bar graphs comparing the 2021 July year-end forecast to the 2022 budget, the 2022 budget to the 2023 budget, and the 2023 budget to the 2024 budget. The walk forward tables are prepared on an activity-based perspective and include high-level explanations of the cost level changes. Detailed explanations are provided for each major cost driver following the walk forward table. This section also includes the Major Cost Categories, which provide the business area’s total 2022, 2023 and 2024 O&M budgets and the major spend components in the form of a pie chart. In some cases, brief explanations of some of the components are also provided. Expenses of business areas that are specific to NSPM have been provided at that level. Business areas that provide support to all of Xcel Energy’s operating companies reflect their total 2022 through 2024 budget O&M expenses.

Volume 5 – Executive Summary 7
Budget Documentation (continued) Functional Organization Chart This section includes an organizational chart that identifies all areas that fit within the organizational entity being discussed. For some business areas, there is no applicable functional organizational chart (e.g., Benefits). In these cases, “Not applicable” is noted on this page. Major Business Functions and Key Activities This section generally describes the overall responsibilities of each of the areas included in the organizational chart. Cost Allocation Methodologies This section is applicable to business areas that manage costs in XES that must be assigned to legal entities within Xcel Energy. Primary cost assignment or allocation methods used to distribute the business area’s budget dollars between legal entities and utilities are shown here. This includes explanations of how each area’s costs are assigned directly, or if allocated, the allocation methodology used. Company witness Mr. Ross L. Baumgarten provides a complete list of allocation methodologies in his Direct Testimony at Exhibit___(RLB-1), Schedule 4. The allocation methods used to distribute costs to legal entity and utility are identified below. Whenever possible, costs are charged directly to the relevant operating company. Operating Company Direct Charges – Costs incurred by a particular operating company. For example, the relevant operating company pays insurance premiums for operating company-specific policies. These premiums are charged directly to that operating company. Service Company Direct Charges – Costs incurred by the Service Company on behalf of an operating company. For example, some Budgeting personnel may be involved in a specific operating company initiative. Any Service Company labor costs associated with this initiative are billed directly to the relevant operating company. Service Company Allocated Charges – Costs for which a unique operating company cannot be determined, or which are incurred on behalf of all operating companies. For example, general budgeting services are provided on a centralized basis for all Xcel Energy legal entities. The Service Company labor costs associated with these services are allocated to the legal entities using allocations. The descriptions and specific allocation methods used by the various functional areas within business area being discussed are provided in a table.

Volume 5 – Executive Summary 8
Budget Documentation – Volume 6 Variance Explanations This section contains explanations for significant changes between the 2020 actual and 2022 budget O&M expenses, shown by FERC account, for the NSPM Company - electric utility. The explanations are aggregated to include each business area’s activities that contributed a variance within the specific FERC account of at least $500,000 and at least five percent over the two-year period. These explanations cover the variances shown in the 2020 to 2022 documentation of Schedule 4, Volume 6 of the budget documentation. The first report within the Variance Explanations section of Volume 6 - Budget Documentation included in the filing is titled “Summary Report 1.” This high-level report summarizes the NSPM Company - electric utility’s O&M expenses by FERC account function. This report subtotals the expenses recorded within the functional FERC accounts (Production and Power Supply, Transmission, and Distribution) and also subtotals the expenses recorded to Customer, Sales, and Administrative and General accounts. The report includes the respective change and the percentage change over the two-year period for each of the account groups. Two additional summary reports provide the O&M expenses by FERC account. The first of the two summary reports provides the expenses recorded within the functional FERC accounts. The second report provides a summary of the expenses recorded within the Customer, Sales, and Administrative and General FERC accounts. Together, these two reports summarize the total NSPM Company electric utility expenses by account for the 2020 actual and 2022 budget periods. The two reports also include the respective change and the percentage change over the two-year period for the accounts. Variance explanation reference numbers have been included on the two summary reports to be used as a key to the respective accounts’ variance explanations. A variance explanation report follows each of the two additional summary reports. The variance explanation reports include the variance explanation’s reference number, the FERC account number, the variance explanation, and the two-year variance amount. In addition, offsetting variance amounts that have been budgeted to other FERC accounts are indicated on this report. Finally, the net remaining variance amount reflected under the FERC account being explained is identified.

Volume 5 – Executive Summary 9
Budget Documentation (continued) Supporting Schedules The following budget schedules are included for each business area: Schedule 1 – Analysis of Billings This schedule summarizes business area total O&M expenses by Operating Company direct billed, Service Company direct billed, and Service Company allocated charges. The purpose of this schedule is to provide a breakdown of the amount of budgeted O&M expenses of each business area that originated in the Operating Company, the amount directly assigned to the Operating Company from the Service Company, and the amount that was assigned to the Operating Company from the Service Company through an allocation. Note: The Service Company total on Schedule 1 equals the NSPM total from Schedule 2, Service Company Billings. Schedule 2 – Service Company Billings Only This schedule summarizes the amount of billings from each business area that manages Service Company costs to NSPM and the other Xcel Energy subsidiaries. This schedule is intended to provide the amount of budgeted billings from each business area that manages Service Company costs, how much of those costs are billed to each Xcel Energy utility legal entity, and the amount billed to other non-regulated subsidiaries of Xcel Energy. Note: The NSPM total from Schedule 2, Service Company Billings, equals the Service Company total on Schedule 1. Schedule 3 – NSPM O&M by Cost Element Account The purpose of this schedule is to provide comparisons of actual O&M expenses recorded in 2020 by cost element account to the 2022 expense budget, the 2022 expense budget to the 2023 budget, and the 2023 expense budget to the 2024 budget for the total NSPM Company and by business area. This schedule summarizes and compares the O&M expenses by cost element account for the total NSPM Company. The first report set aggregates the expenses over all business areas, for all utilities. The second report set provides this comparison separated and subtotaled for each business area, including the grand total amount for the NSPM Company, for all utilities. The third set provides the total NSPM Company by utility (e.g. electric, gas, and non-utility), with aggregate expenses over all business areas. The fourth set provides the total NSPM Company by utility, with costs separated by business area.

Volume 5 – Executive Summary 10
Budget Documentation (continued) Supporting Schedules Schedule 4 – NSPM O&M by FERC Account (All Utilities) The purpose of this schedule is to provide comparisons of actual O&M expenses recorded in 2020 by FERC account to the 2022 expense budget, the 2022 expense budget to the 2023 budget, and the 2023 expense budget to the 2024 budget for the total NSPM Company and by business area. This schedule summarizes and compares the O&M expenses by FERC account for the total NSPM Company. The first report set aggregates the expenses over all business areas, for all utilities. The second report set provides this comparison separated and subtotaled for each business area, including the grand total amount for the NSPM Company, for all utilities. The third set provides the total NSPM Company by utility (e.g. electric, gas, and non-utility), with aggregate expenses over all business areas. The fourth set provides the total NSPM Company by utility, with costs separated by business area. Schedule 5 – NSPM 2022 - 2024 Capital Budgets (All Utilities) The purpose of these schedules is to provide a listing of the NSPM capital projects by business area and the amounts that are included in the 2022, 2023, and 2024 capital expenditure budgets. This schedule is not applicable for all business areas. If a business area has no capital expenditures budgeted they are not included on Schedule 5. The first set of reports provides this information for the total NSPM Company, across all utilities. The second set of reports provides the information for the total NSPM Company, by utility (e.g. electric, gas, and common).

Volume 5 – Executive Summary 11
Supplemental Reports 2018 - 2020 Financial Performance Team (FPT) O&M Reports This section contains explanations for significant differences between the NSPM Company’s year-end actual and budget business area departmental O&M expenses for the previous three years. The purpose of these schedules is to provide the Company’s historical actual versus budget performance and provide explanations for variances. The process for compiling and reporting O&M variance information changed significantly in 2019, resulting in a different deliverable for that year. Under the current process, Monthly Performance Review meetings area held with each business area and the final deliverable is a summarized presentation with explanations for the O&M variance drivers for NSPM. The total variance for NSPM and each business area is provided along with a description of primary variance drivers. The FPT Reports provided in this section are those referenced by Company witness Melissa L. Ostrom within her direct testimony discussion regarding the accuracy of the Company’s budgets to its actual costs. These reports are consistent with the values shown in Table 3 – NSPM Total Company Actual versus Budget O&M within her testimony. The total O&M amounts summarized on the FPT reports include NSPM Company electric, gas, and non-utility expenditures. Therefore, they do not match the total O&M expenses identified on the NSPM Company’s three-year historical electric utility O&M expense schedules described in the following section. 2018 - 2020 NSPM Company Electric Utility O&M Expenses This section contains summaries of the most recent three years of historical O&M expenses for the NSPM Company electric utility. Annual schedules provide the actual and budget expenditures, including the variance and percent variance for the periods 2018 through 2020. The expenses are summarized by FERC functional class and listed by FERC account. The expenses summarized in these schedules reflect the departmental expenses incurred by the Company’s business areas as well as the NSP transmission interchange agreement charges from NSPW to NSPM. These summaries do not include non-utility below the line FERC accounts. The purpose of these schedules is to enable comparison of the NSPM Company’s annual actual and budget electric utility O&M expenses by FERC account over the most recent three historical years. The schedules in this section are consistent with those shown in Table 4 – NSPM Electric Utility Actual versus Budget O&M in Company witness Melissa L. Ostrom’s direct testimony discussion regarding the accuracy of the Company’s budgets to its actual costs.

Volume 5 – Executive Summary 12
2018 - 2020 Financial Performance Team (FPT) Capital Expenditure Reports This section contains explanations for significant differences between the NSPM Company’s year-end actual and budgeted business area departmental capital expenditures for the previous three years. The purpose of these schedules is to provide the Company’s historical actual versus budget performance and provide explanations for variances. The process for compiling and reporting capital expenditure variance information changed significantly in 2019, resulting in a different deliverable for that year. Under the current process, Monthly Performance Review meetings area held with each business area and the final deliverable is a summarized presentation with explanations for the capital variance drivers for NSPM. The total variance for NSPM and each business area is provided along with a description of primary variance drivers. The FPT schedules provided in this section are those referenced by Company witness Melissa L. Ostrom in her direct testimony discussion regarding the accuracy of the Company’s budgets to its actual cost. These reports are consistent with the values shown in Table 2 – NSPM Total Company Actual versus Budget Capital within her testimony. The total capital expenditure amounts summarized on the FPT reports include NSPM Company electric, gas, and common utility expenditures.

Summary Reports There are three summary reports for NSPM Electric: Summary Report
1 Operating and Maintenance expense comparisons with variance explanations by FERC function between 2020 Actual and 2022 Budget for NSPM Electric
2 Operating and Maintenance expense comparison by cost element
between: (A) 2020 Actual and 2022 Budget, (B) 2022 Budget and 2023 Budget, and (C) 2023 Budget and 2024 Budget for NSPM Electric
3 Operating and Maintenance expense comparison by FERC account
between: (A) 2020 Actual and 2022 Budget, (B) 2022 Budget and 2023 Budget, and (C) 2023 Budget and 2024 Budget for NSPM Electric

Northern States Power - MN Electric(Thousands of Dollars)
Function 2020 Actual 2022 Budget 2020 - 2022 Variance
2020 - 2022 % Change
Avg Annual % Change
Steam Power Generation 82,606 75,489 (7,117) -8.6% -4.4% (1)Nuclear Power Generation 323,569 314,161 (9,408) -2.9% -1.5% (2)Hydraulic Power Generation 1,228 767 (461) -37.5% -21.0%Other Power Generation 52,038 86,481 34,444 66.2% 28.9% (3)Other Power Supply Expenses 7,540 6,965 (575) -7.6% -3.9% Total Power Production 466,980 483,863 16,883 3.6% 1.8%Transmission 150,346 171,808 21,462 14.3% 6.9% (4)Distribution 109,251 140,849 31,598 28.9% 13.5% (5)Customer Accounts 87,205 69,843 (17,362) -19.9% -10.5% (6)Customer Service 2,132 2,265 133 6.2% 3.1%Sales 2,433 8,513 6,079 249.8% 87.0% (7)Administrative & General 271,901 297,221 25,320 9.3% 4.6% (8)Non-Operating 1,992 3,821 1,829 91.8% 38.5%
Sum: 1,092,240 1,178,183 85,943 7.9% 3.9%
The variances are primarily made up of the following costs:
(1) Steam Power Generation2022 Original Variance (7,117) -8.6% -4.4%
8,215
Remaining Variance 1,098 1.3% 0.7%
(2) Nuclear Power Generation2022 Original Variance (9,408) -2.9% -1.5%
3,709 1,822
1,800Remaining Variance (2,077) -0.6% -0.3%
(3) Other Power Generation2022 Original Variance 34,444 66.2% 28.9%
(28,800)
(5,000)Remaining Variance 644 1.2% 0.6%
(4) Transmission2022 Original Variance 21,462 14.3% 6.9%
(18,672)
(1,331)
Remaining Variance 1,459 1.0% 0.5%
(5) Distribution2022 Original Variance 31,598 28.9% 13.5%
(20,000)
(4,441)
(2,984)(1,800)
(866)
Remaining Variance 1,507 1.4% 0.7%
(6) Customer Accounts2022 Original Variance (17,362) -19.9% -10.5%
17,500
Remaining Variance 138 0.2% 0.1%
Primarily due to lower long-term incentive costs when comparing 2020 vs 2022.
Increased costs are driven by additional E&S headcount positions expected to be filled as well as natural annual labor inflation.
This increase in interchange expense between 2020 and 2022 is primarily related to the increased billings from NSPW, due to fixed charges for return on rate base and book depreciation due to increased transmission plant in service (i.e., new project additions). The significant driver for the increase is due to increased transmission line investments going into service across many individual projects (largest new projects being the LaCrosse Coulee rebuild and the Bayfield Second Circuit).
Increase in costs due to major planned overhauls at Black Dog and Red Wing in 2022.
Higher costs are driven by investments in new wind farms, including new land easements, contingent blade LEP work and for maintenance agreements.
Increased O&M expenses in support of increased distribution capital investment.
Higher costs related to an increase in transmission vegetation management in order to ensure on-cycle performance.
Higher costs in 2022 is due to 2020 COVID impacts on vegetation management allowing the company to get back on cycle ($19M). Additionally, there was an increase in AGIS costs ($500k) for the AGIS FLISR program and an additional $500k in expected O&M from Capital growth.
2020 MN Residential Rate Relief Credit Program which was established in 2020 is not expected to recur in 2022.
Increase in damage prevention locate activity costs related to contractor costs and volumes for outside vendors, labor, material and transportation. Higher costs driven by an increase for AGIS Programs.
Summary Report 1
2020 Actual vs. 2022 BudgetO&M by Function
Lower nuclear outage amortization costs in the 2022 budget as compared to 2020 actual costs.Lower non-outage costs due to the Maintain reorganization and lower Site Mgmt labor, offset by an increase in contract labor due to an increase in engineering a programs/analysis work scheduled for 2022.
Reduced maintenance, overtime and outage costs across coal plants which includes changes to the maintenance schedule at Sherco due to upcoming Unit 2 retirement.

Northern States Power - MN Electric(Thousands of Dollars)
Function 2020 Actual 2022 Budget 2020 - 2022 Variance
2020 - 2022 % Change
Avg Annual % Change
Steam Power Generation 82,606 75,489 (7,117) -8.6% -4.4% (1)Nuclear Power Generation 323,569 314,161 (9,408) -2.9% -1.5% (2)Hydraulic Power Generation 1,228 767 (461) -37.5% -21.0%Other Power Generation 52,038 86,481 34,444 66.2% 28.9% (3)Other Power Supply Expenses 7,540 6,965 (575) -7.6% -3.9% Total Power Production 466,980 483,863 16,883 3.6% 1.8%Transmission 150,346 171,808 21,462 14.3% 6.9% (4)Distribution 109,251 140,849 31,598 28.9% 13.5% (5)Customer Accounts 87,205 69,843 (17,362) -19.9% -10.5% (6)Customer Service 2,132 2,265 133 6.2% 3.1%Sales 2,433 8,513 6,079 249.8% 87.0% (7)Administrative & General 271,901 297,221 25,320 9.3% 4.6% (8)Non-Operating 1,992 3,821 1,829 91.8% 38.5%
Sum: 1,092,240 1,178,183 85,943 7.9% 3.9%
The variances are primarily made up of the following costs:
Summary Report 1
2020 Actual vs. 2022 BudgetO&M by Function
(7) Sales2022 Original Variance 6,079 249.8% 87.0%
(6,023)
Remaining Variance 56 2.3% 1.2%
(8) Administrative & General2022 Original Variance 25,320 9.3% 4.6%
(14,249)
(6,896)
(5,192)(2,083)
5,434
4,542
Remaining Variance 6,876 2.5% 1.3%
Decrease in costs for Business Systems due to changes in the shared asset credit related to Network Equipment and Advanced Grid AMI shared assets. Shared asset costs are an allocation of Business Systems costs to or from NSPM operating company, depending on where the asset was purchased and how and investment will be utilized between Xcel Energy operating companies. This number fluctuates in part on the basis of the jurisdiction in which an investment is purchased, consistent with the Company's cost allocation policy. The variance from 2020 is due to a change in asset utilization by operating companies.
Increase in property insurance in 2022 vs 2020 is driven by year-over-year increases to property insurance premium amounts as well as a higher NEIL distribution received in 2020.
Increased costs are driven by Business Systems for higher IT Costs (App Dev & Maint: $566; Software: $11,070; Hardware: $673; and Network Data: $3,580) to support the capital assets built as a result of business demands.
Increase in costs primarily due to Sherco A&G credits related to Unit 3 major outage in 2020 compared to no Unit 3 outage projected in 2022. (The Company shares Unit 3 costs with SMMPA and does not share those costs with outages for Units 1 and 2)
Recognition of MN stay-out excess rate case costs in 2020, $2.4M. An additional $1.8M was a reserve against the deferral associated with North Dakota jurisdiction. These expenses are not expected to repeat in 2022.
Increase in injuries and damages related to forecast assumptions for higher insurance policy costs.
Increased costs in Strategic Partnership due to anticipated support for Electric Vehicle programs due to commission approved pilots and the growth of various programs.

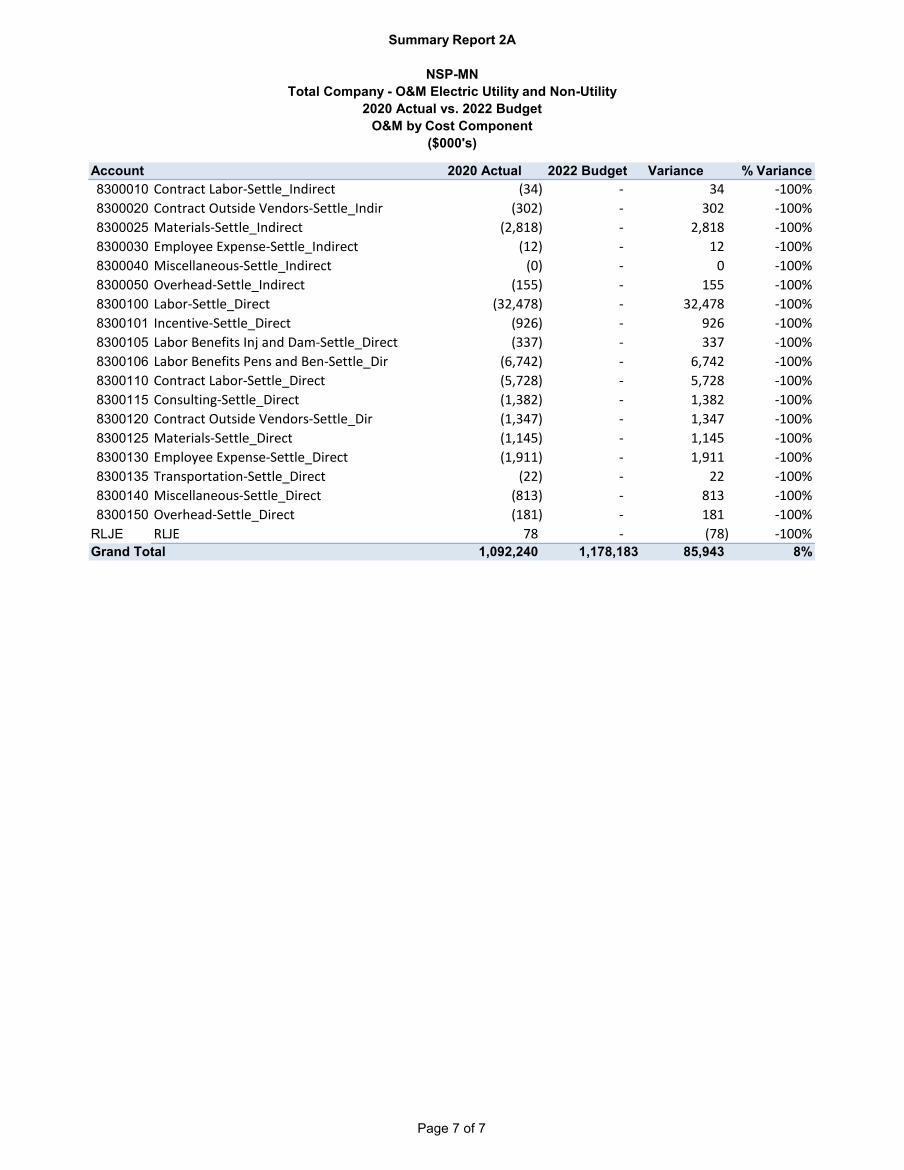
Summary Report 2A
NSP-MNTotal Company - O&M Electric Utility and Non-Utility
2020 Actual vs. 2022 BudgetO&M by Cost Component
($000's)
Account 2020 Actual 2022 Budget Variance % Variance5540001 Productive Labor 282,803 380,486 97,683 35%5540009 Labor Budget Adjustment - (5,634) (5,634) #DIV/0!5540010 Labor Load Non Productive 24 - (24) -100%5540180 Premium Time Labor 3,911 - (3,911) -100%5540185 Other Compensation Accruals 4,889 1,117 (3,772) -77%5540200 Medical Insurance Non Loading 181 - (181) -100%5540205 Workers Comp Non Loading (1) - 1 -100%5540210 Incentive Non Loading 17,449 16,135 (1,314) -8%5540220 Labor Overtime 33,295 56 (33,238) -100%5540230 Incentive 108 - (108) -100%5540235 Payroll Related Labor Costs (0) - 0 -100%5540240 Performance Share Plan & Deferred Comp I 20,925 5,784 (15,141) -72%5540250 Restricted Stock Units 12,295 10,937 (1,358) -11%5540255 Other Benefits Compensation 242 3,070 2,828 1167%5540260 Other Compensation 1,668 23 (1,644) -99%5540270 Welfare Fund 5,550 - (5,550) -100%5600001 Contract Labor 66,076 42,336 (23,740) -36%5600006 Consulting Professional Services Other 16,507 67,680 51,173 310%5600016 Consulting Professional Eng and Design 2,022 1 (2,021) -100%5600021 Consulting Professional Services Legal 2,960 3,910 950 32%5600026 Consulting Professional Svcs Accounting 2,026 2,274 248 12%5600031 Consulting Legal Regulatory 242 128 (113) -47%5600041 Outside Vendor Contract 44,246 97,843 53,597 121%5600051 Outside Services 21,495 16,245 (5,249) -24%5600066 Materials 11,402 30,797 19,395 170%5600068 Material Consumption 13,100 10,906 (2,194) -17%5600069 Service Consumption 26,579 17,447 (9,132) -34%5600070 Material - Direct Purchase 11,686 (51) (11,737) -100%5600071 MS Inventory Adjust - Obsolete Materials 78 - (78) -100%5600075 Transportation Fuel 1 523 522 63687%5600076 Chemicals - Other 1,642 1,565 (77) -5%5600078 Chemicals - Lime 1,144 1,213 69 6%5600080 Chemicals - Mercury Sorbent 1,131 611 (520) -46%5600082 Chemicals - Ammonia 714 589 (125) -17%5600083 Chemicals - Sulfuric Acid 379 276 (103) -27%5600085 Fuel Handling Ash Disposal (0) - 0 -100%5600091 Print and Copy Cost - Other 235 291 57 24%5600096 Print and Copy Cost - SEC Filings 50 33 (17) -34%5600101 Legal - Other 46 13 (33) -71%5600106 Equipment Maintenance 133 135 2 1%5600111 Equipment Maintenance - Customer Care 100 123 23 23%5600116 IT Hardware Maintenance 3,351 4,396 1,044 31%5600121 IT Hardware Purchases 431 376 (55) -13%5600126 Software License Purchase - Perpetual 242 560 318 131%5600131 Software License Purchase - Term 4,868 9,391 4,522 93%5600136 Software Maintenance 25,175 31,038 5,863 23%5600141 Network Services 34 849 814 2373%
Page 1 of 7

Summary Report 2A
NSP-MNTotal Company - O&M Electric Utility and Non-Utility
2020 Actual vs. 2022 BudgetO&M by Cost Component
($000's)
Account 2020 Actual 2022 Budget Variance % Variance5600146 Network Voice 2 2 0 6%5600151 Network Data 16,068 18,642 2,574 16%5600156 Network Telecommunication 3 9 6 200%5600161 Network Radio 1,438 630 (808) -56%5600166 Mainframe Services 586 867 281 48%5600171 Distributed Systems Services 496 620 124 25%5600176 Application Development and Maintenance 9,348 9,984 636 7%5600186 Software - ASP 1,973 2,771 798 40%5600187 Other IT 5,992 3,495 (2,496) -42%5600190 Fuel Procurement Non Labor Online 2 - (2) -100%5600191 Employee Expenses Airfare 483 1,224 741 153%5600196 Employee Expenses Car Rental 112 209 98 87%5600201 Employee Expenses Taxi and Bus 73 115 41 56%5600206 Employee Expenses Mileage 1,316 1,632 316 24%5600211 Employee Expenses Conf Seminar Trng 559 1,128 569 102%5600216 Employee Expenses Hotel 798 1,807 1,009 127%5600221 Employee Expenses Meals 1,305 1,512 207 16%5600226 Employee Expenses Meals Non-Employee 91 287 196 215%5600231 Employee Expenses Parking 124 244 120 97%5600236 Employee Expenses Per Diem 2,046 1,625 (422) -21%5600241 Employee Expenses Safety Equipment 2,073 1,090 (982) -47%5600246 Employee Expenses Other 824 964 141 17%5600251 Employee Expense Personal Communication 1,595 1,458 (137) -9%5600252 Fuel Handling Non Labor 86 - (86) -100%5600254 Nuclear Fuel Procurement NonLabor 189 323 134 71%5600256 Office Supplies 467 761 294 63%5600261 Workforce Administration Expense 398 380 (18) -5%5600271 Safety Recognition 137 54 (83) -61%5600276 Life Events 32 37 4 14%5600281 Employee Performance Recognition 1,281 1,211 (69) -5%5600286 Non - Recoverable Recognition 71 - (71) -100%5600291 Transportation Fleet Cost 23 12,188 12,165 53852%5600296 Janitorial - Routine 1,738 1,882 143 8%5600301 Janitorial - Special 160 0 (160) -100%5600306 Fire Life Safety Maintenance 184 172 (12) -6%5600311 General Interior Exterior Maintenance 3,670 3,117 (553) -15%5600316 Use Costs 5,561 6,125 564 10%5600321 Lawn Care Maintenance Costs 151 187 36 24%5600326 Sewer Maintenance Costs 7 56 49 715%5600331 Snow Removal Costs 1,337 1,787 450 34%5600336 Trash Removal Costs 630 520 (110) -17%5600341 Water Use Costs 916 847 (69) -8%5600351 Moves Adds Changes 262 423 161 61%5600356 Energy 11,193 15,708 4,515 40%5600361 AR - Reserve Change 8,040 - (8,040) -100%5600366 Non - Energy 676 82 (594) -88%5600371 Low Income - Personal Accounts 0 - (0) -100%
Page 2 of 7

Summary Report 2A
NSP-MNTotal Company - O&M Electric Utility and Non-Utility
2020 Actual vs. 2022 BudgetO&M by Cost Component
($000's)
Account 2020 Actual 2022 Budget Variance % Variance5600381 Rent - Space 14 79 65 460%5600382 Rent - Equipment 793 258 (534) -67%5600384 Rent - Nuclear Generation 82 75 (7) -8%5600386 Rent - Other Generation 6,195 14,559 8,364 135%5600387 Rent - Transmission Electric 12 - (12) -100%5600390 Rent - Distribution Electric 492 493 0 0%5600396 Rent - Equipment Customer Care 5 2 (4) -67%5600431 Lease Costs 8,575 8,300 (275) -3%5600436 Postage 4,081 4,038 (43) -1%5600446 Injuries and Damages Other 3 - (3) -100%5600451 Insurance - Property 5,513 8,254 2,741 50%5600456 Insurance - General Liability 4,778 5,836 1,058 22%5600461 Insurance - Excess Liability 4,931 8,136 3,205 65%5600466 Insurance - Auto Liability 200 285 85 43%5600471 Insurance - Directors and Officers 1,064 1,311 247 23%5600476 Insurance - Fiduciary 311 302 (9) -3%5600481 Insurance - Other 56 94 39 69%5600482 Insurance - Cyber 328 414 86 26%5600486 Insurance - Nuclear Property 4,001 3,984 (16) 0%5600491 Insurance - Nuclear Interruption 1,153 1,152 (1) 0%5600496 Insurance - Nuclear Liability 2,986 3,163 176 6%5600501 Insurance - Nuclear Liability ICRP (1,776) (1,760) 16 -1%5600506 Insurance - Surplus (8,811) (5,000) 3,811 -43%5600511 Advertising - Brand Image 1,142 1,033 (110) -10%5600516 Advertising - General 154 261 107 70%5600521 Advertising - Brand Sponsorship 2,530 2,604 74 3%5600526 Advertising - Conservation DSM 5 - (5) -100%5600531 Advertising - Conservation Other - 57 57 #DIV/0!5600536 Communication - Conservation DSM 8 - (8) -100%5600546 Customer Program - Advertising 12 41 29 232%5600561 Customer Program - Promotion 128 322 194 151%5600566 Customer Program - Non-Recoverable 4 0 (4) -96%5600571 Safety Advertising 699 928 229 33%5600576 Safety Information 150 2 (148) -99%5600581 Mandated Regulatory Notices 8 7 (1) -11%5600586 Mandated Inserts Communication 54 72 17 32%5600591 Dues - Professional Association 454 1,030 576 127%5600596 Dues - Utility Association Other 75 229 154 204%5600601 Dues - Utility Association 1,451 2,611 1,160 80%5600606 Dues - Lobbying 594 451 (143) -24%5600611 Dues - Nuclear Association 7,655 7,328 (327) -4%5600616 Dues - Chamber of Commerce 213 284 71 33%5600621 Dues - Social Service 9 16 7 83%5600626 Contributions - Charitable 1,401 492 (909) -65%5600631 Contributions - Community Sponsorships 875 1,601 726 83%5600636 Contributions - Civic and Political 72 55 (17) -24%5600641 Contributions - Economical Development 484 489 4 1%
Page 3 of 7

Summary Report 2A
NSP-MNTotal Company - O&M Electric Utility and Non-Utility
2020 Actual vs. 2022 BudgetO&M by Cost Component
($000's)
Account 2020 Actual 2022 Budget Variance % Variance5600646 Fees - Regulatory 27,415 29,151 1,736 6%5600651 Fees - Regulatory NERC 2,238 2,243 5 0%5600656 Fees - Directors 1,511 1,325 (186) -12%5600661 Fees - Remarketing and Rating 522 478 (43) -8%5600666 Fees - Credit Line 114 - (114) -100%5600671 Fees - Regulatory Direct 1,960 2,175 215 11%5600676 Fees - Regulatory Indirect 5,269 4,864 (405) -8%5600681 Fees - Regulatory NARUC 3 4 1 20%5600691 Shareholder Related Expenses 117 317 200 171%5600696 Deductions - Corporate Tickets 296 346 51 17%5600701 Deductions - Other (432) 177 608 -141%5600706 Bank Charges 686 963 278 41%5600712 Quarterly BMO Rebates (202) (489) (287) 142%5600721 Environmental Permits and Fees 1,155 2,194 1,039 90%5600726 License Fees and Permits 1,466 1,571 105 7%5600731 Penalties 23 1 (22) -96%5600746 IA -Transmission - OM Expense 11,307 127,820 116,512 1030%5600751 IA - Transmission - Fixed Charges Expens 97,840 - (97,840) -100%5600771 Nuclear Outage Cost Amortization 46,160 40,657 (5,503) -12%5600776 O and M Credits - Meter Transfer Install (10,338) (10,910) (572) 6%5600781 O and M Credits - Other (3,500) (4,143) (643) 18%5600786 O and M Credits - Company Elec and Gas U (22) - 22 -100%5600791 O and M Credits - AG to Capital (493) (805) (312) 63%5600796 O and M Credits - Company Elec and Gas (5,093) (5,582) (488) 10%5600826 O and M Credits - Damage Claims (98) - 98 -100%5600857 Rebates 0 - (0) -100%5600861 Shared Asset Costs 46,345 51,967 5,622 12%5600866 Shared Assets - Owning Co Credit (48,061) (60,363) (12,302) 26%5600867 Fuel Handling Expense Reclass (18,449) - 18,449 -100%5600868 Fuel Procurement Expense Reclass (845) - 845 -100%5600869 Nuclear Fuel Procurement Exp Reclass (805) - 805 -100%5600871 Other (2,317) (27,492) (25,175) 1087%5600896 Online Information Services 2,655 5,628 2,973 112%5600946 Cust Billing Srvcs to Other (111) - 111 -100%5600951 Purchasing Overhead Expense - 7 7 #DIV/0!5600956 Warehousing Overhead Expense - 1 1 #DIV/0!5600963 PowerPlan Overheads 0 - (0) -100%5610000 External Settlement Labor 25,790 - (25,790) -100%5610001 External Settlement Labor Ben-Injuries 360 - (360) -100%5610002 External Settlement Labor Ben-Pension 3,531 - (3,531) -100%5610003 External Settlement Contract Labor 1,316 - (1,316) -100%5610004 External Settlement Consulting 22 - (22) -100%5610005 External Settlement Contract Outside Ven 18,836 - (18,836) -100%5610006 External Settlement Materials 6,665 - (6,665) -100%5610007 External Settlement Employee Expense 420 - (420) -100%5610008 External Settlement Transportation 801 - (801) -100%5610009 External Settlement Miscellaneous 897 - (897) -100%
Page 4 of 7

Summary Report 2A
NSP-MNTotal Company - O&M Electric Utility and Non-Utility
2020 Actual vs. 2022 BudgetO&M by Cost Component
($000's)
Account 2020 Actual 2022 Budget Variance % Variance5610011 External Settlement Overhead 398 - (398) -100%5610017 External Settlement Incentive 30 - (30) -100%5660011 Gain on Disp of PPE Sys Op Unit (164) - 164 -100%5660012 Loss on Disp of PPE Sys Op Unit 66 - (66) -100%5660024 Loss on Investment (462) (351) 111 -24%8000000 Prod Labor Bargaining Benefit Group 1 (1,939) - 1,939 -100%8000004 Prod Labor Bargaining Benefit Group 5 0 - (0) -100%8000005 Prod Labor Bargaining Benefit Group 6 (51) - 51 -100%8000010 Prod Labor Bargaining Nuclear Ben Grp 1 70 - (70) -100%8000020 Prod Labor Non-Bargaining Benefit Grp 1 (2,527) - 2,527 -100%8000021 Prod Labor Non-Bargaining Benefit Grp 2 (79) - 79 -100%8000023 Prod Labor Non-Bargaining Benefit Grp 4 (16) - 16 -100%8000025 Prod Labor Non-Bargaining Benefit Grp 6 (0) - 0 -100%8000030 Prod Labor Non-Barg Nuclear Ben Grp 1 (78) - 78 -100%8000033 Prod Labor Non-Barg Nuclear Ben Grp 4 (0) - 0 -100%8000036 Productive Labor Bargaining No Load (0) - 0 -100%8000037 Productive Labor Non-Barg No Load (1) - 1 -100%8000100 Premium 20 - (20) -100%8000105 Overtime 6 - (6) -100%8000110 Other Compensation 1 - (1) -100%8000115 Other Compensation Craft Welfare Fund (11) - 11 -100%8010000 Budget Prod Labor Barg Benefit Group 1 - 168 168 #DIV/0!8010020 Budget Prod Labor Non-Barg Benefit Grp 1 - 149 149 #DIV/0!8010105 Budget Overtime - (0) (0) #DIV/0!8010110 Budget Other Compensation - (99) (99) #DIV/0!8010115 Budget Other Compensation CWF - (0) (0) #DIV/0!8100000 Non-Prod Labor Bargaining Benefit Grp 1 18,635 - (18,635) -100%8100010 Non-Prod Labor Barg Nuclear Ben Grp 1 3,439 - (3,439) -100%8100020 Non-Prod Labor Non-Bargaining Ben Grp 1 22,475 - (22,475) -100%8100023 Non-Prod Labor Non-Bargaining Ben Grp 4 181 - (181) -100%8100030 Non-Prod Labor Non-Barg Nuc Ben Grp 1 9,523 - (9,523) -100%8100033 Non-Prod Labor Non-Barg Nuc Ben Grp 4 7 - (7) -100%8100105 Pension & Insurance 77,007 - (77,007) -100%8100110 401K Match (0) 10,507 10,507 -3312235%8100115 Qualified Pension (2) 23,275 23,277 -1128187%8100120 Nonqualified Pension 0 326 326 419782%8100125 FAS 88 Settlement Expense 9 - (9) -100%8100130 Exec Nonqualified Deferred Comp Match 0 57 57 1562860%8100135 NMC Employer Retirement Contribution - 963 963 #DIV/0!8100140 Other Pension - Consult 0 555 555 6202413%8100150 Active Healthcare (2) 39,066 39,068 -1976014%8100155 Miscellaneous Benefit Programs and Costs (0) 1,884 1,884 -4493961%8100160 Life LTD and Business Travel Insurance (0) 2,232 2,232 -1174809%8100165 Retiree Medical (0) 102 103 -54831%8100170 FAS 112 LTD (0) 66 66 -95368%8100190 Workers' Compensation - FAS 112 Costs (0) 76 77 -115857%8100195 Workers' Compensation - Ins and Other 2,204 1,822 (383) -17%
Page 5 of 7

Summary Report 2A
NSP-MNTotal Company - O&M Electric Utility and Non-Utility
2020 Actual vs. 2022 BudgetO&M by Cost Component
($000's)
Account 2020 Actual 2022 Budget Variance % Variance8100200 Annual Incentive 14,280 12,933 (1,347) -9%8100205 AG Overhead 0 - (0) -100%8100260 Purchasing - Overhead 3,142 - (3,142) -100%8100315 Warehouse - Overhead 1,795 - (1,795) -100%8100425 Engineering and Super - Overhead 12 - (12) -100%8100426 Eng and Super Non-Service- Overhead (0) - 0 -100%8100502 NonProd NonBarg Labor G1_OH Alloc (2) - 2 -100%8100507 401K Match_OH Alloc (0) 106 106 -1842991%8100508 Qualified Pension_Overhead Allocation (1) (398) (397) 43620%8100509 Nonqualified Pension_Overhead Allocation 0 (27) (27) -902947%8100510 FAS 88 Settlement Expense_OH Allocation 2 - (2) -100%8100511 Exec Nonqual Def Comp Match_OH Alloc 0 (12) (13) -379366%8100512 Other Pension - Consult_OH Allocation 0 (129) (129) -114712%8100513 Active Healthcare_Overhead Allocation 1 (898) (899) -115191%8100514 Misc Benefit Programs and Costs_OH Alloc (0) (127) (127) 739230%8100515 Life LTD and Bus Travel Ins_OH Alloc (0) (95) (95) 207648%8100516 Retiree Medical_Overhead Allocation (0) (9) (9) 42449%8100517 FAS 112 LTD_Overhead Allocation 0 (3) (3) -5644%8100526 Workers' Comp-FAS 112_OH Allocation 0 (2) (2) -6050%8100527 Workers' Comp-Ins and Other_OH Alloc 1 (65) (66) -5578%8100528 Annual Incentive_Overhead Allocation 1 415 414 35812%8100529 NMC Employer Retirement Contr_OH Alloc - (0) (0) #DIV/0!8100530 Purchasing_OH Allocation 652 - (652) -100%8100531 Warehouse_OH Allocation (56) - 56 -100%8100550 Fleet-Base Rates 15,658 - (15,658) -100%8100551 Fleet-Idle Time (4,483) - 4,483 -100%8100552 Fleet-Utilization (33) - 33 -100%8110000 Budget Non-Prod Labor Barg Benefit Grp 1 - 40 40 #DIV/0!8110020 Budget Non-Prod Labor Non-Barg Ben Grp 1 - 27 27 #DIV/0!8110040 Budget Attrition - (13) (13) #DIV/0!8200451 Sherco - AG Overhead (3,176) - 3,176 -100%8200500 Facilities - Labor (156) - 156 -100%8200501 Fac - Incentive (4) - 4 -100%8200505 Facilities - Labor Benefits Inj and Dam (2) - 2 -100%8200506 Facilities - Labor Benefits Pens and Ben (29) - 29 -100%8200510 Facilities - Contract Labor (1) - 1 -100%8200515 Facilities - Consulting (6) - 6 -100%8200520 Facilities - Contract Outside Vendors (39) - 39 -100%8200525 Facilities - Materials (27) - 27 -100%8200530 Facilities - Employee Expense (2) - 2 -100%8200535 Facilities - Transportation (4) - 4 -100%8200540 Facilities - Miscellaneous (1,387) - 1,387 -100%8200550 Facilities - Overhead (1) - 1 -100%8200751 Service Co-AG Overhead-Direct (0) - 0 -100%8300000 Labor-Settle_Indirect (357) - 357 -100%8300005 Labor Benefits Inj and Dam-Settle_Indir (5) - 5 -100%8300006 Labor Benefits Pens and Ben-Settle_Indir (79) - 79 -100%
Page 6 of 7
Summary Report 2A
NSP-MNTotal Company - O&M Electric Utility and Non-Utility
2020 Actual vs. 2022 BudgetO&M by Cost Component
($000's)
Account 2020 Actual 2022 Budget Variance % Variance8300010 Contract Labor-Settle_Indirect (34) - 34 -100%8300020 Contract Outside Vendors-Settle_Indir (302) - 302 -100%8300025 Materials-Settle_Indirect (2,818) - 2,818 -100%8300030 Employee Expense-Settle_Indirect (12) - 12 -100%8300040 Miscellaneous-Settle_Indirect (0) - 0 -100%8300050 Overhead-Settle_Indirect (155) - 155 -100%8300100 Labor-Settle_Direct (32,478) - 32,478 -100%8300101 Incentive-Settle_Direct (926) - 926 -100%8300105 Labor Benefits Inj and Dam-Settle_Direct (337) - 337 -100%8300106 Labor Benefits Pens and Ben-Settle_Dir (6,742) - 6,742 -100%8300110 Contract Labor-Settle_Direct (5,728) - 5,728 -100%8300115 Consulting-Settle_Direct (1,382) - 1,382 -100%8300120 Contract Outside Vendors-Settle_Dir (1,347) - 1,347 -100%8300125 Materials-Settle_Direct (1,145) - 1,145 -100%8300130 Employee Expense-Settle_Direct (1,911) - 1,911 -100%8300135 Transportation-Settle_Direct (22) - 22 -100%8300140 Miscellaneous-Settle_Direct (813) - 813 -100%8300150 Overhead-Settle_Direct (181) - 181 -100%
RLJE RLJE 78 - (78) -100%Grand Total 1,092,240 1,178,183 85,943 8%
Page 7 of 7

Summary Report 2B
NSP-MNTotal Company - O&M Electric Utility and Non-Utility
2022 Budget vs. 2023 BudgetO&M by Cost Component
($000's)
Account 2022 Budget 2023 Budget Variance % Variance5540001 Productive Labor 380,486 401,062 20,576 5%5540009 Labor Budget Adjustment (5,634) (3,765) 1,868 -33%5540185 Other Compensation Accruals 1,117 1,068 (49) -4%5540210 Incentive Non Loading 16,135 16,619 484 3%5540220 Labor Overtime 56 56 - 0%5540240 Performance Share Plan & Deferred Comp I 5,784 5,976 193 3%5540250 Restricted Stock Units 10,937 11,749 812 7%5540255 Other Benefits Compensation 3,070 3,246 176 6%5540260 Other Compensation 23 23 - 0%5600001 Contract Labor 42,336 43,201 865 2%5600006 Consulting Professional Services Other 67,680 87,221 19,541 29%5600016 Consulting Professional Eng and Design 1 1 - 0%5600021 Consulting Professional Services Legal 3,910 3,909 (1) 0%5600026 Consulting Professional Svcs Accounting 2,274 2,297 23 1%5600031 Consulting Legal Regulatory 128 128 - 0%5600041 Outside Vendor Contract 97,843 101,104 3,261 3%5600051 Outside Services 16,245 13,105 (3,141) -19%5600066 Materials 30,797 34,239 3,441 11%5600068 Material Consumption 10,906 10,772 (135) -1%5600069 Service Consumption 17,447 16,804 (643) -4%5600070 Material - Direct Purchase (51) 830 882 -1713%5600075 Transportation Fuel 523 534 10 2%5600076 Chemicals - Other 1,565 1,740 175 11%5600078 Chemicals - Lime 1,213 1,198 (16) -1%5600080 Chemicals - Mercury Sorbent 611 573 (37) -6%5600082 Chemicals - Ammonia 589 570 (19) -3%5600083 Chemicals - Sulfuric Acid 276 285 9 3%5600091 Print and Copy Cost - Other 291 297 6 2%5600096 Print and Copy Cost - SEC Filings 33 33 0 0%5600101 Legal - Other 13 13 0 0%5600106 Equipment Maintenance 135 135 0 0%5600111 Equipment Maintenance - Customer Care 123 130 7 6%5600116 IT Hardware Maintenance 4,396 4,427 31 1%5600121 IT Hardware Purchases 376 373 (3) -1%5600126 Software License Purchase - Perpetual 560 581 21 4%5600131 Software License Purchase - Term 9,391 9,686 295 3%5600136 Software Maintenance 31,038 33,701 2,662 9%5600141 Network Services 849 849 (0) 0%5600146 Network Voice 2 2 - 0%5600151 Network Data 18,642 19,317 675 4%5600156 Network Telecommunication 9 9 - 0%5600161 Network Radio 630 630 (0) 0%5600166 Mainframe Services 867 893 26 3%5600171 Distributed Systems Services 620 638 19 3%5600176 Application Development and Maintenance 9,984 10,058 74 1%5600186 Software - ASP 2,771 2,841 70 3%5600187 Other IT 3,495 5,383 1,888 54%
Page 1 of 4

Summary Report 2B
NSP-MNTotal Company - O&M Electric Utility and Non-Utility
2022 Budget vs. 2023 BudgetO&M by Cost Component
($000's)
Account 2022 Budget 2023 Budget Variance % Variance5600191 Employee Expenses Airfare 1,224 1,220 (4) 0%5600196 Employee Expenses Car Rental 209 208 (1) 0%5600201 Employee Expenses Taxi and Bus 115 112 (2) -2%5600206 Employee Expenses Mileage 1,632 1,636 3 0%5600211 Employee Expenses Conf Seminar Trng 1,128 1,125 (3) 0%5600216 Employee Expenses Hotel 1,807 1,780 (27) -2%5600221 Employee Expenses Meals 1,512 1,498 (14) -1%5600226 Employee Expenses Meals Non-Employee 287 288 1 0%5600231 Employee Expenses Parking 244 214 (29) -12%5600236 Employee Expenses Per Diem 1,625 2,301 676 42%5600241 Employee Expenses Safety Equipment 1,090 1,093 2 0%5600246 Employee Expenses Other 964 1,109 145 15%5600251 Employee Expense Personal Communication 1,458 1,302 (156) -11%5600254 Nuclear Fuel Procurement NonLabor 323 306 (17) -5%5600256 Office Supplies 761 764 3 0%5600261 Workforce Administration Expense 380 385 5 1%5600271 Safety Recognition 54 54 0 0%5600276 Life Events 37 37 (0) 0%5600281 Employee Performance Recognition 1,211 1,267 55 5%5600291 Transportation Fleet Cost 12,188 12,193 5 0%5600296 Janitorial - Routine 1,882 1,917 35 2%5600301 Janitorial - Special 0 0 0 1%5600306 Fire Life Safety Maintenance 172 175 3 2%5600311 General Interior Exterior Maintenance 3,117 3,404 287 9%5600316 Use Costs 6,125 6,143 18 0%5600321 Lawn Care Maintenance Costs 187 187 0 0%5600326 Sewer Maintenance Costs 56 56 0 1%5600331 Snow Removal Costs 1,787 1,791 4 0%5600336 Trash Removal Costs 520 539 20 4%5600341 Water Use Costs 847 850 4 0%5600351 Moves Adds Changes 423 315 (107) -25%5600356 Energy 15,708 13,997 (1,711) -11%5600366 Non - Energy 82 82 - 0%5600381 Rent - Space 79 79 - 0%5600382 Rent - Equipment 258 468 210 81%5600384 Rent - Nuclear Generation 75 75 - 0%5600386 Rent - Other Generation 14,559 15,911 1,353 9%5600390 Rent - Distribution Electric 493 493 - 0%5600396 Rent - Equipment Customer Care 2 2 - 0%5600431 Lease Costs 8,300 8,395 95 1%5600436 Postage 4,038 4,344 306 8%5600451 Insurance - Property 8,254 9,068 814 10%5600456 Insurance - General Liability 5,836 6,125 289 5%5600461 Insurance - Excess Liability 8,136 9,198 1,063 13%5600466 Insurance - Auto Liability 285 291 6 2%5600471 Insurance - Directors and Officers 1,311 1,362 51 4%5600476 Insurance - Fiduciary 302 308 6 2%
Page 2 of 4

Summary Report 2B
NSP-MNTotal Company - O&M Electric Utility and Non-Utility
2022 Budget vs. 2023 BudgetO&M by Cost Component
($000's)
Account 2022 Budget 2023 Budget Variance % Variance5600481 Insurance - Other 94 88 (6) -6%5600482 Insurance - Cyber 414 436 23 6%5600486 Insurance - Nuclear Property 3,984 3,890 (94) -2%5600491 Insurance - Nuclear Interruption 1,152 1,174 22 2%5600496 Insurance - Nuclear Liability 3,163 3,226 63 2%5600501 Insurance - Nuclear Liability ICRP (1,760) (1,760) - 0%5600506 Insurance - Surplus (5,000) (5,000) - 0%5600511 Advertising - Brand Image 1,033 1,043 10 1%5600516 Advertising - General 261 262 1 0%5600521 Advertising - Brand Sponsorship 2,604 2,630 26 1%5600531 Advertising - Conservation Other 57 58 1 1%5600546 Customer Program - Advertising 41 41 - 0%5600561 Customer Program - Promotion 322 322 - 0%5600566 Customer Program - Non-Recoverable 0 0 - 0%5600571 Safety Advertising 928 937 9 1%5600576 Safety Information 2 2 - 0%5600581 Mandated Regulatory Notices 7 10 3 42%5600586 Mandated Inserts Communication 72 72 - 0%5600591 Dues - Professional Association 1,030 1,002 (28) -3%5600596 Dues - Utility Association Other 229 229 0 0%5600601 Dues - Utility Association 2,611 2,608 (4) 0%5600606 Dues - Lobbying 451 451 0 0%5600611 Dues - Nuclear Association 7,328 7,401 73 1%5600616 Dues - Chamber of Commerce 284 284 - 0%5600621 Dues - Social Service 16 16 - 0%5600626 Contributions - Charitable 492 3,865 3,373 685%5600631 Contributions - Community Sponsorships 1,601 1,602 1 0%5600636 Contributions - Civic and Political 55 55 0 0%5600641 Contributions - Economical Development 489 489 0 0%5600646 Fees - Regulatory 29,151 29,417 265 1%5600651 Fees - Regulatory NERC 2,243 2,243 - 0%5600656 Fees - Directors 1,325 1,398 73 5%5600661 Fees - Remarketing and Rating 478 468 (11) -2%5600671 Fees - Regulatory Direct 2,175 2,215 40 2%5600676 Fees - Regulatory Indirect 4,864 4,957 93 2%5600681 Fees - Regulatory NARUC 4 4 - 0%5600691 Shareholder Related Expenses 317 320 3 1%5600696 Deductions - Corporate Tickets 346 346 0 0%5600701 Deductions - Other 177 177 0 0%5600706 Bank Charges 963 971 8 1%5600712 Quarterly BMO Rebates (489) (489) - 0%5600721 Environmental Permits and Fees 2,194 1,945 (249) -11%5600726 License Fees and Permits 1,571 1,574 3 0%5600731 Penalties 1 1 0 1%5600746 IA -Transmission - OM Expense 127,820 138,563 10,744 8%5600771 Nuclear Outage Cost Amortization 40,657 45,199 4,542 11%5600776 O and M Credits - Meter Transfer Install (10,910) (10,910) - 0%
Page 3 of 4

Summary Report 2B
NSP-MNTotal Company - O&M Electric Utility and Non-Utility
2022 Budget vs. 2023 BudgetO&M by Cost Component
($000's)
Account 2022 Budget 2023 Budget Variance % Variance5600781 O and M Credits - Other (4,143) (4,266) (123) 3%5600791 O and M Credits - AG to Capital (805) (805) - 0%5600796 O and M Credits - Company Elec and Gas (5,582) (5,582) - 0%5600861 Shared Asset Costs 51,967 59,972 8,005 15%5600866 Shared Assets - Owning Co Credit (60,363) (66,820) (6,457) 11%5600871 Other (27,492) (54,506) (27,014) 98%5600896 Online Information Services 5,628 5,736 108 2%5600951 Purchasing Overhead Expense 7 7 0 1%5600956 Warehousing Overhead Expense 1 1 0 1%5660024 Loss on Investment (351) (323) 28 -8%8010000 Budget Prod Labor Barg Benefit Group 1 168 180 12 7%8010020 Budget Prod Labor Non-Barg Benefit Grp 1 149 155 6 4%8010105 Budget Overtime (0) - 0 -100%8010110 Budget Other Compensation (99) (95) 4 -4%8010115 Budget Other Compensation CWF (0) - 0 -100%8100110 401K Match 10,507 10,789 282 3%8100115 Qualified Pension 23,275 22,777 (498) -2%8100120 Nonqualified Pension 326 337 11 3%8100130 Exec Nonqualified Deferred Comp Match 57 61 3 6%8100135 NMC Employer Retirement Contribution 963 989 25 3%8100140 Other Pension - Consult 555 568 13 2%8100150 Active Healthcare 39,066 40,225 1,159 3%8100155 Miscellaneous Benefit Programs and Costs 1,884 1,890 5 0%8100160 Life LTD and Business Travel Insurance 2,232 2,291 58 3%8100165 Retiree Medical 102 99 (4) -4%8100170 FAS 112 LTD 66 62 (4) -6%8100190 Workers' Compensation - FAS 112 Costs 76 71 (6) -8%8100195 Workers' Compensation - Ins and Other 1,822 1,819 (3) 0%8100200 Annual Incentive 12,933 13,362 429 3%8100507 401K Match_OH Alloc 106 97 (9) -9%8100508 Qualified Pension_Overhead Allocation (398) (723) (325) 82%8100509 Nonqualified Pension_Overhead Allocation (27) (26) 1 -4%8100511 Exec Nonqual Def Comp Match_OH Alloc (12) (11) 1 -10%8100512 Other Pension - Consult_OH Allocation (129) (141) (12) 10%8100513 Active Healthcare_Overhead Allocation (898) (990) (92) 10%8100514 Misc Benefit Programs and Costs_OH Alloc (127) (171) (45) 35%8100515 Life LTD and Bus Travel Ins_OH Alloc (95) (103) (8) 9%8100516 Retiree Medical_Overhead Allocation (9) (11) (2) 26%8100517 FAS 112 LTD_Overhead Allocation (3) (3) (0) 7%8100526 Workers' Comp-FAS 112_OH Allocation (2) (2) (1) 34%8100527 Workers' Comp-Ins and Other_OH Alloc (65) (75) (10) 16%8100528 Annual Incentive_Overhead Allocation 415 416 1 0%8100529 NMC Employer Retirement Contr_OH Alloc (0) 0 1 -209%8110000 Budget Non-Prod Labor Barg Benefit Grp 1 40 43 3 8%8110020 Budget Non-Prod Labor Non-Barg Ben Grp 1 27 28 1 4%8110040 Budget Attrition (13) (13) (1) 6%Grand Total 1,178,183 1,230,146 51,963 4%
Page 4 of 4

Summary Report 2C
NSP-MNTotal Company - O&M Electric Utility and Non-Utility
2023 Budget vs. 2024 BudgetO&M by Cost Component
($000's)
Account 2023 Budget 2024 Budget Variance % Variance5540001 Productive Labor 401,062 406,393 5,331 1%5540009 Labor Budget Adjustment (3,765) (9,935) (6,170) 164%5540185 Other Compensation Accruals 1,068 1,065 (3) 0%5540210 Incentive Non Loading 16,619 17,118 499 3%5540220 Labor Overtime 56 56 - 0%5540240 Performance Share Plan & Deferred Comp I 5,976 6,308 331 6%5540250 Restricted Stock Units 11,749 12,336 587 5%5540255 Other Benefits Compensation 3,246 3,433 186 6%5540260 Other Compensation 23 23 - 0%5600001 Contract Labor 43,201 38,626 (4,575) -11%5600006 Consulting Professional Services Other 87,221 69,326 (17,894) -21%5600016 Consulting Professional Eng and Design 1 1 - 0%5600021 Consulting Professional Services Legal 3,909 3,908 (1) 0%5600026 Consulting Professional Svcs Accounting 2,297 2,319 23 1%5600031 Consulting Legal Regulatory 128 128 - 0%5600041 Outside Vendor Contract 101,104 103,960 2,856 3%5600051 Outside Services 13,105 9,930 (3,175) -24%5600066 Materials 34,239 33,874 (365) -1%5600068 Material Consumption 10,772 10,136 (636) -6%5600069 Service Consumption 16,804 17,956 1,152 7%5600070 Material - Direct Purchase 830 725 (106) -13%5600075 Transportation Fuel 534 550 16 3%5600076 Chemicals - Other 1,740 1,513 (227) -13%5600078 Chemicals - Lime 1,198 1,446 248 21%5600080 Chemicals - Mercury Sorbent 573 488 (85) -15%5600082 Chemicals - Ammonia 570 652 81 14%5600083 Chemicals - Sulfuric Acid 285 279 (6) -2%5600091 Print and Copy Cost - Other 297 298 1 0%5600096 Print and Copy Cost - SEC Filings 33 33 0 0%5600101 Legal - Other 13 13 (0) 0%5600106 Equipment Maintenance 135 136 0 0%5600111 Equipment Maintenance - Customer Care 130 137 7 6%5600116 IT Hardware Maintenance 4,427 4,443 16 0%5600121 IT Hardware Purchases 373 243 (129) -35%5600126 Software License Purchase - Perpetual 581 566 (15) -3%5600131 Software License Purchase - Term 9,686 10,051 365 4%5600136 Software Maintenance 33,701 35,114 1,413 4%5600141 Network Services 849 849 - 0%5600146 Network Voice 2 2 - 0%5600151 Network Data 19,317 19,619 302 2%5600156 Network Telecommunication 9 9 - 0%5600161 Network Radio 630 624 (5) -1%5600166 Mainframe Services 893 920 27 3%5600171 Distributed Systems Services 638 658 19 3%5600176 Application Development and Maintenance 10,058 10,118 61 1%5600186 Software - ASP 2,841 2,929 88 3%5600187 Other IT 5,383 9,677 4,294 80%
Page 1 of 4

Summary Report 2C
NSP-MNTotal Company - O&M Electric Utility and Non-Utility
2023 Budget vs. 2024 BudgetO&M by Cost Component
($000's)
Account 2023 Budget 2024 Budget Variance % Variance5600191 Employee Expenses Airfare 1,220 1,236 15 1%5600196 Employee Expenses Car Rental 208 210 1 1%5600201 Employee Expenses Taxi and Bus 112 113 1 1%5600206 Employee Expenses Mileage 1,636 1,642 6 0%5600211 Employee Expenses Conf Seminar Trng 1,125 1,150 24 2%5600216 Employee Expenses Hotel 1,780 1,801 21 1%5600221 Employee Expenses Meals 1,498 1,499 1 0%5600226 Employee Expenses Meals Non-Employee 288 290 1 0%5600231 Employee Expenses Parking 214 232 17 8%5600236 Employee Expenses Per Diem 2,301 1,552 (749) -33%5600241 Employee Expenses Safety Equipment 1,093 1,095 2 0%5600246 Employee Expenses Other 1,109 924 (185) -17%5600251 Employee Expense Personal Communication 1,302 1,498 196 15%5600254 Nuclear Fuel Procurement NonLabor 306 308 2 1%5600256 Office Supplies 764 849 85 11%5600261 Workforce Administration Expense 385 390 5 1%5600271 Safety Recognition 54 91 37 69%5600276 Life Events 37 37 0 0%5600281 Employee Performance Recognition 1,267 1,328 61 5%5600291 Transportation Fleet Cost 12,193 12,089 (103) -1%5600296 Janitorial - Routine 1,917 1,922 5 0%5600301 Janitorial - Special 0 0 0 1%5600306 Fire Life Safety Maintenance 175 175 0 0%5600311 General Interior Exterior Maintenance 3,404 3,408 4 0%5600316 Use Costs 6,143 6,189 46 1%5600321 Lawn Care Maintenance Costs 187 189 1 1%5600326 Sewer Maintenance Costs 56 56 0 1%5600331 Snow Removal Costs 1,791 1,798 7 0%5600336 Trash Removal Costs 539 530 (10) -2%5600341 Water Use Costs 850 840 (10) -1%5600351 Moves Adds Changes 315 235 (81) -26%5600356 Energy 13,997 14,765 768 5%5600366 Non - Energy 82 82 - 0%5600381 Rent - Space 79 79 0 0%5600382 Rent - Equipment 468 259 (210) -45%5600384 Rent - Nuclear Generation 75 75 - 0%5600386 Rent - Other Generation 15,911 17,582 1,671 11%5600390 Rent - Distribution Electric 493 493 - 0%5600396 Rent - Equipment Customer Care 2 2 - 0%5600431 Lease Costs 8,395 8,481 86 1%5600436 Postage 4,344 4,674 330 8%5600451 Insurance - Property 9,068 9,763 695 8%5600456 Insurance - General Liability 6,125 6,437 312 5%5600461 Insurance - Excess Liability 9,198 9,973 775 8%5600466 Insurance - Auto Liability 291 297 6 2%5600471 Insurance - Directors and Officers 1,362 1,392 30 2%5600476 Insurance - Fiduciary 308 314 7 2%
Page 2 of 4

Summary Report 2C
NSP-MNTotal Company - O&M Electric Utility and Non-Utility
2023 Budget vs. 2024 BudgetO&M by Cost Component
($000's)
Account 2023 Budget 2024 Budget Variance % Variance5600481 Insurance - Other 88 90 1 1%5600482 Insurance - Cyber 436 460 24 5%5600486 Insurance - Nuclear Property 3,890 3,988 98 3%5600491 Insurance - Nuclear Interruption 1,174 1,199 25 2%5600496 Insurance - Nuclear Liability 3,226 3,290 65 2%5600501 Insurance - Nuclear Liability ICRP (1,760) (1,760) 0 0%5600506 Insurance - Surplus (5,000) (3,500) 1,500 -30%5600511 Advertising - Brand Image 1,043 1,053 10 1%5600516 Advertising - General 262 263 1 0%5600521 Advertising - Brand Sponsorship 2,630 2,656 26 1%5600531 Advertising - Conservation Other 58 59 1 1%5600546 Customer Program - Advertising 41 41 - 0%5600561 Customer Program - Promotion 322 322 - 0%5600566 Customer Program - Non-Recoverable 0 0 - 0%5600571 Safety Advertising 937 947 9 1%5600576 Safety Information 2 2 - 0%5600581 Mandated Regulatory Notices 10 10 - 0%5600586 Mandated Inserts Communication 72 72 - 0%5600591 Dues - Professional Association 1,002 1,003 1 0%5600596 Dues - Utility Association Other 229 229 0 0%5600601 Dues - Utility Association 2,608 2,608 0 0%5600606 Dues - Lobbying 451 451 0 0%5600611 Dues - Nuclear Association 7,401 7,475 74 1%5600616 Dues - Chamber of Commerce 284 284 - 0%5600621 Dues - Social Service 16 16 - 0%5600626 Contributions - Charitable 3,865 3,868 3 0%5600631 Contributions - Community Sponsorships 1,602 1,603 1 0%5600636 Contributions - Civic and Political 55 55 0 0%5600641 Contributions - Economical Development 489 489 0 0%5600646 Fees - Regulatory 29,417 29,685 268 1%5600651 Fees - Regulatory NERC 2,243 2,243 - 0%5600656 Fees - Directors 1,398 1,471 73 5%5600661 Fees - Remarketing and Rating 468 500 32 7%5600671 Fees - Regulatory Direct 2,215 2,255 40 2%5600676 Fees - Regulatory Indirect 4,957 5,052 95 2%5600681 Fees - Regulatory NARUC 4 4 - 0%5600691 Shareholder Related Expenses 320 324 3 1%5600696 Deductions - Corporate Tickets 346 346 0 0%5600701 Deductions - Other 177 177 0 0%5600706 Bank Charges 971 998 27 3%5600712 Quarterly BMO Rebates (489) (489) - 0%5600721 Environmental Permits and Fees 1,945 1,809 (136) -7%5600726 License Fees and Permits 1,574 1,575 1 0%5600731 Penalties 1 1 0 1%5600746 IA -Transmission - OM Expense 138,563 143,662 5,099 4%5600771 Nuclear Outage Cost Amortization 45,199 46,847 1,648 4%5600776 O and M Credits - Meter Transfer Install (10,910) (10,910) - 0%
Page 3 of 4

Summary Report 2C
NSP-MNTotal Company - O&M Electric Utility and Non-Utility
2023 Budget vs. 2024 BudgetO&M by Cost Component
($000's)
Account 2023 Budget 2024 Budget Variance % Variance5600781 O and M Credits - Other (4,266) (3,738) 528 -12%5600791 O and M Credits - AG to Capital (805) (805) - 0%5600796 O and M Credits - Company Elec and Gas (5,582) (5,582) - 0%5600861 Shared Asset Costs 59,972 70,588 10,616 18%5600866 Shared Assets - Owning Co Credit (66,820) (75,986) (9,166) 14%5600871 Other (54,506) (28,886) 25,620 -47%5600896 Online Information Services 5,736 5,958 222 4%5600951 Purchasing Overhead Expense 7 7 0 1%5600956 Warehousing Overhead Expense 1 1 0 1%5660024 Loss on Investment (323) (294) 29 -9%8010000 Budget Prod Labor Barg Benefit Group 1 180 190 10 6%8010020 Budget Prod Labor Non-Barg Benefit Grp 1 155 161 7 4%8010105 Budget Overtime - 0 0 #DIV/0!8010110 Budget Other Compensation (95) (95) 1 -1%8010115 Budget Other Compensation CWF - (1) (1) #DIV/0!8100110 401K Match 10,789 11,084 294 3%8100115 Qualified Pension 22,777 22,899 121 1%8100120 Nonqualified Pension 337 349 12 4%8100130 Exec Nonqualified Deferred Comp Match 61 64 3 5%8100135 NMC Employer Retirement Contribution 989 1,020 31 3%8100140 Other Pension - Consult 568 582 14 2%8100150 Active Healthcare 40,225 41,960 1,735 4%8100155 Miscellaneous Benefit Programs and Costs 1,890 1,921 32 2%8100160 Life LTD and Business Travel Insurance 2,291 2,347 57 2%8100165 Retiree Medical 99 95 (4) -4%8100170 FAS 112 LTD 62 58 (4) -6%8100190 Workers' Compensation - FAS 112 Costs 71 64 (6) -9%8100195 Workers' Compensation - Ins and Other 1,819 1,812 (7) 0%8100200 Annual Incentive 13,362 13,778 416 3%8100507 401K Match_OH Alloc 97 114 17 18%8100508 Qualified Pension_Overhead Allocation (723) (992) (269) 37%8100509 Nonqualified Pension_Overhead Allocation (26) (25) 0 -2%8100511 Exec Nonqual Def Comp Match_OH Alloc (11) (9) 2 -18%8100512 Other Pension - Consult_OH Allocation (141) (153) (12) 8%8100513 Active Healthcare_Overhead Allocation (990) (602) 388 -39%8100514 Misc Benefit Programs and Costs_OH Alloc (171) (192) (21) 12%8100515 Life LTD and Bus Travel Ins_OH Alloc (103) (102) 1 -1%8100516 Retiree Medical_Overhead Allocation (11) (12) (1) 9%8100517 FAS 112 LTD_Overhead Allocation (3) (4) (0) 8%8100526 Workers' Comp-FAS 112_OH Allocation (2) (2) 1 -35%8100527 Workers' Comp-Ins and Other_OH Alloc (75) (77) (2) 3%8100528 Annual Incentive_Overhead Allocation 416 451 35 9%8100529 NMC Employer Retirement Contr_OH Alloc 0 0 (0) -97%8110000 Budget Non-Prod Labor Barg Benefit Grp 1 43 45 3 6%8110020 Budget Non-Prod Labor Non-Barg Ben Grp 1 28 30 1 5%8110040 Budget Attrition (13) (14) (1) 5%Grand Total 1,230,146 1,258,221 28,075 2%
Page 4 of 4

Summary Report 3A
NSP-MNTotal Company - Electric and Non-Utility
2020 Actual vs. 2022 BudgetO&M by FERC Account
($000's)
FERC FERC Description 2020 Actual 2022 Budget Variance % Variance408100 Tax Other Than Income Tax - Property (1,101) - 1,101 -100%408101 Tax Other Than Income Tax - Payroll 0 - (0) -100%417100 Expenses of nonutility operations 0 - (0) -100%421100 Gain on disposition of property (164) - 164 -100%421200 Loss on disposition of property 66 - (66) -100%426100 Donations 2,760 2,582 (178) -6%426300 Penalties 23 1 (22) -96%426400 Expendit for cert civic, politic and related activ 879 1,050 171 19%426500 Other deductions (472) 187 660 -140%500000 Operation supervision and engineering 3,744 3,213 (531) -14%501000 Fuel (1,347) - 1,347 -100%502000 Steam expenses 18,131 18,157 26 0%505000 Electric expenses 3,304 806 (2,498) -76%506000 Miscellaneous steam power expenses 14,414 15,249 835 6%507000 Rents 1,906 2,650 744 39%510000 Maintenance supervision and engineering 1,686 1,783 97 6%511000 Maintenance of structures 4,793 3,177 (1,616) -34%512000 Maintenance of boiler plant 21,090 21,114 24 0%513000 Maintenance of electric plant 5,815 3,959 (1,856) -32%514000 Maintenance of miscellaneous steam plant 9,070 5,381 (3,689) -41%517000 Operation supervision and engineering 42,626 40,166 (2,460) -6%519000 Coolants and water 7,518 7,474 (43) -1%520000 Steam expenses 48,337 48,383 46 0%523000 Electric expenses 2,798 1,901 (897) -32%524000 Miscellaneous nuclear power expenses 129,158 128,505 (653) -1%525000 Rents 8,509 8,778 269 3%528000 Maintenance supervision and engineering 8,158 7,573 (585) -7%530000 Maintenance of reactor plant equipment 36,338 34,775 (1,563) -4%531000 Maintenance of electric plant 13,216 12,309 (907) -7%532000 Maintenance of miscellaneous nuclear plant 26,911 24,296 (2,615) -10%535000 Operation supervision and engineering 24 94 70 287%538000 Electric expenses 523 139 (384) -73%539000 Miscellaneous hydraulic power generation expen 311 125 (185) -60%540000 Rents 60 61 1 1%541000 Maintenance supervision and engineering 1 168 168 22671%542000 Maintenance of structures 29 19 (10) -36%543000 Maintenance of reservoirs, dams and waterways 126 - (126) -100%544000 Maintenance of electric plant 151 - (151) -100%545000 Maintenance of miscellaneous hydraulic plant 3 161 158 5468%546000 Operation supervision and engineering 3,494 3,760 266 8%548000 Generation expenses 6,021 5,017 (1,004) -17%549000 Miscellaneous other power generation expenses 11,772 20,577 8,805 75%550000 Rents 7,265 15,558 8,293 114%551000 Maintenance supervision and engineering 1,949 2,100 151 8%552000 Maintenance of structures 5,776 4,756 (1,020) -18%553000 Maintenance of generating and electric plant 9,493 16,262 6,769 71%554000 Maint of miscellaneou other power generation p 6,267 18,450 12,183 194%
Page 1 of 3

Summary Report 3A
NSP-MNTotal Company - Electric and Non-Utility
2020 Actual vs. 2022 BudgetO&M by FERC Account
($000's)
FERC FERC Description 2020 Actual 2022 Budget Variance % Variance556000 System control and load dispatching 1,442 1,623 181 13%557000 Other expenses 6,098 5,342 (756) -12%560000 Operation supervision and engineering 10,169 10,390 221 2%561200 Load dispatch-Monitor and operate transmiss sys 4,721 5,195 474 10%561500 Reliability planning and standards development 13 179 166 1263%561600 Transmission Service Studies 57 - (57) -100%561700 Generation interconnection studies 894 584 (311) -35%561800 Reliability planning and standards develop servic 2,496 2,243 (253) -10%562000 Station expenses 3,441 2,581 (860) -25%563000 Overhead line expenses 830 1,209 379 46%564000 Underground line expenses 7 - (7) -100%565000 Transmission of electricity by others 109,147 127,820 18,672 17%566000 Miscellaneous transmission expenses 8,264 9,311 1,047 13%567000 Rents 1,168 1,151 (18) -2%568000 Maintenance supervision and engineering 8 - (8) -100%570000 Maintenance of station equipment 3,928 4,630 702 18%571000 Maintenance of overhead lines 4,732 6,158 1,426 30%572000 Maintenance of underground lines 83 - (83) -100%573000 Maintenance of miscellaneous transmission plan 63 - (63) -100%575100 Operation Supervision 187 246 60 32%575200 Day-ahead and real-time market administration 121 94 (27) -22%575500 Ancillary services market administration 0 1 0 116%575800 Rents 16 18 1 9%580000 Operation supervision and engineering 11,066 11,990 923 8%581000 Load dispatching 672 765 94 14%582000 Station expenses 2,535 2,750 215 8%583000 Overhead line expenses 502 (882) (1,384) -276%584000 Underground line expenses 8,278 18,037 9,759 118%585000 Street lighting and signal system expenses 622 840 218 35%586000 Meter expenses 730 1,913 1,183 162%587000 Customer installations expenses 2,839 2,693 (146) -5%588000 Miscellaneous distribution expenses 27,251 27,199 (52) 0%589000 Rents 4,104 4,022 (82) -2%590000 Maintenance supervision and engineering 33 0 (33) -99%591000 Maintenance of structures 0 - (0) -100%592000 Maintenance of station equipment 3,630 3,808 178 5%593000 Maintenance of overhead lines 37,467 57,634 20,168 54%594000 Maintenance of underground lines 7,692 7,180 (513) -7%595000 Maintenance of line transformers 132 31 (102) -77%596000 Maintenance of street lighting and signal system 1,319 1,089 (230) -17%597000 Maintenance of meters 151 889 737 487%598000 Maintenance of miscellaneous distribution plant 225 891 667 297%901000 Supervision 120 130 10 8%902000 Meter reading expenses 28,680 29,859 1,179 4%903000 Customer records and collection expenses 20,849 23,963 3,114 15%904000 Uncollectable Accounts - Commodity 19,234 15,708 (3,525) -18%904001 Uncollectable Accounts - Non Commodity 676 82 (594) -88%
Page 2 of 3

Summary Report 3A
NSP-MNTotal Company - Electric and Non-Utility
2020 Actual vs. 2022 BudgetO&M by FERC Account
($000's)
FERC FERC Description 2020 Actual 2022 Budget Variance % Variance905000 Miscellaneous customer accounts expenses 17,646 100 (17,546) -99%908000 Customer assistance expenses 1,087 920 (167) -15%909000 Informational and instruction advertising expens 903 1,059 156 17%910000 Miscell customer service and informational expe 142 286 144 101%912000 Demonstrating and selling expenses 2,404 8,468 6,064 252%916000 Miscellanous Sales Expense 29 44 15 51%920000 Administrative and general salaries 108,409 107,189 (1,220) -1%921000 Office supplies and expenses 53,311 72,210 18,899 35%922000 Administrative expenses transferred-Credit (53,958) (65,800) (11,842) 22%923000 Outside services employed 20,506 23,538 3,032 15%924000 Property insurance 2,056 8,675 6,619 322%925000 Injuries and damages 14,899 19,324 4,426 30%926000 Employee pensions and benefits 73,874 77,393 3,519 5%928000 Regulatory commission expenses 11,695 7,150 (4,545) -39%929000 Duplicate charges-Credit (5,091) (5,582) (490) 10%930100 General advertising expenses 3,830 3,898 68 2%930200 Miscellaneous general expenses 3,387 4,658 1,271 38%931000 Rents 38,797 43,309 4,512 12%935000 Maintenance of general plant 186 1,257 1,071 576%Grand Total 1,092,240 1,178,183 85,943 8%
Page 3 of 3

Summary Report 3B
NSP-MNTotal Company - O&M Electric and Non-Utility
2022 Budget vs. 2023 BudgetO&M by FERC Account
($000's)
FERC FERC Description 2022 Budget 2023 Budget Variance % Variance426100 Donations 2,582 5,956 3,374 131%426300 Penalties 1 1 0 1%426400 Expendit for cert civic, politic and related activ 1,050 1,041 (9) -1%426500 Other deductions 187 216 29 15%500000 Operation supervision and engineering 3,213 3,121 (91) -3%502000 Steam expenses 18,157 19,658 1,501 8%505000 Electric expenses 806 948 142 18%506000 Miscellaneous steam power expenses 15,249 15,959 710 5%507000 Rents 2,650 2,981 331 12%510000 Maintenance supervision and engineering 1,783 1,718 (65) -4%511000 Maintenance of structures 3,177 3,313 136 4%512000 Maintenance of boiler plant 21,114 26,842 5,728 27%513000 Maintenance of electric plant 3,959 3,744 (215) -5%514000 Maintenance of miscellaneous steam plant 5,381 5,320 (61) -1%517000 Operation supervision and engineering 40,166 40,784 618 2%519000 Coolants and water 7,474 7,824 350 5%520000 Steam expenses 48,383 49,111 728 2%523000 Electric expenses 1,901 1,772 (129) -7%524000 Miscellaneous nuclear power expenses 128,505 130,446 1,940 2%525000 Rents 8,778 9,852 1,073 12%528000 Maintenance supervision and engineering 7,573 7,070 (503) -7%530000 Maintenance of reactor plant equipment 34,775 35,934 1,158 3%531000 Maintenance of electric plant 12,309 12,490 181 1%532000 Maintenance of miscellaneous nuclear plant 24,296 27,102 2,806 12%535000 Operation supervision and engineering 94 101 7 8%538000 Electric expenses 139 142 3 2%539000 Miscellaneous hydraulic power generation expen 125 142 17 14%540000 Rents 61 66 5 9%541000 Maintenance supervision and engineering 168 175 7 4%542000 Maintenance of structures 19 22 3 18%545000 Maintenance of miscellaneous hydraulic plant 161 175 13 8%546000 Operation supervision and engineering 3,760 3,968 208 6%548000 Generation expenses 5,017 5,162 145 3%549000 Miscellaneous other power generation expenses 20,577 21,184 607 3%550000 Rents 15,558 17,036 1,478 9%551000 Maintenance supervision and engineering 2,100 2,035 (65) -3%552000 Maintenance of structures 4,756 4,811 54 1%553000 Maintenance of generating and electric plant 16,262 13,146 (3,116) -19%554000 Maint of miscellaneou other power generation p 18,450 18,417 (33) 0%556000 System control and load dispatching 1,623 1,681 58 4%557000 Other expenses 5,342 5,407 65 1%560000 Operation supervision and engineering 10,390 10,730 340 3%561200 Load dispatch-Monitor and operate transmiss sys 5,195 5,617 422 8%561500 Reliability planning and standards development 179 184 5 3%561700 Generation interconnection studies 584 601 17 3%561800 Reliability planning and standards develop servic 2,243 2,243 - 0%562000 Station expenses 2,581 2,633 52 2%
Page 1 of 3
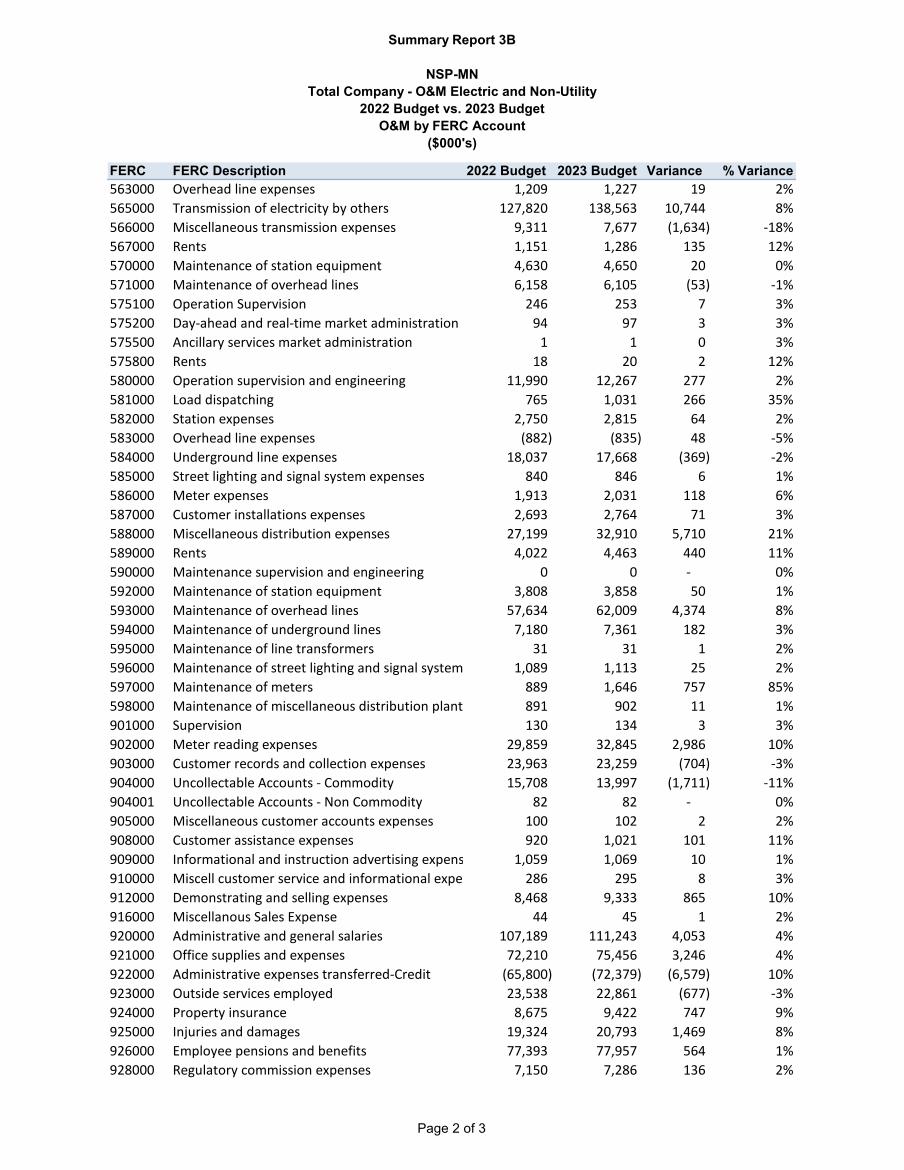
Summary Report 3B
NSP-MNTotal Company - O&M Electric and Non-Utility
2022 Budget vs. 2023 BudgetO&M by FERC Account
($000's)
FERC FERC Description 2022 Budget 2023 Budget Variance % Variance563000 Overhead line expenses 1,209 1,227 19 2%565000 Transmission of electricity by others 127,820 138,563 10,744 8%566000 Miscellaneous transmission expenses 9,311 7,677 (1,634) -18%567000 Rents 1,151 1,286 135 12%570000 Maintenance of station equipment 4,630 4,650 20 0%571000 Maintenance of overhead lines 6,158 6,105 (53) -1%575100 Operation Supervision 246 253 7 3%575200 Day-ahead and real-time market administration 94 97 3 3%575500 Ancillary services market administration 1 1 0 3%575800 Rents 18 20 2 12%580000 Operation supervision and engineering 11,990 12,267 277 2%581000 Load dispatching 765 1,031 266 35%582000 Station expenses 2,750 2,815 64 2%583000 Overhead line expenses (882) (835) 48 -5%584000 Underground line expenses 18,037 17,668 (369) -2%585000 Street lighting and signal system expenses 840 846 6 1%586000 Meter expenses 1,913 2,031 118 6%587000 Customer installations expenses 2,693 2,764 71 3%588000 Miscellaneous distribution expenses 27,199 32,910 5,710 21%589000 Rents 4,022 4,463 440 11%590000 Maintenance supervision and engineering 0 0 - 0%592000 Maintenance of station equipment 3,808 3,858 50 1%593000 Maintenance of overhead lines 57,634 62,009 4,374 8%594000 Maintenance of underground lines 7,180 7,361 182 3%595000 Maintenance of line transformers 31 31 1 2%596000 Maintenance of street lighting and signal system 1,089 1,113 25 2%597000 Maintenance of meters 889 1,646 757 85%598000 Maintenance of miscellaneous distribution plant 891 902 11 1%901000 Supervision 130 134 3 3%902000 Meter reading expenses 29,859 32,845 2,986 10%903000 Customer records and collection expenses 23,963 23,259 (704) -3%904000 Uncollectable Accounts - Commodity 15,708 13,997 (1,711) -11%904001 Uncollectable Accounts - Non Commodity 82 82 - 0%905000 Miscellaneous customer accounts expenses 100 102 2 2%908000 Customer assistance expenses 920 1,021 101 11%909000 Informational and instruction advertising expens 1,059 1,069 10 1%910000 Miscell customer service and informational expe 286 295 8 3%912000 Demonstrating and selling expenses 8,468 9,333 865 10%916000 Miscellanous Sales Expense 44 45 1 2%920000 Administrative and general salaries 107,189 111,243 4,053 4%921000 Office supplies and expenses 72,210 75,456 3,246 4%922000 Administrative expenses transferred-Credit (65,800) (72,379) (6,579) 10%923000 Outside services employed 23,538 22,861 (677) -3%924000 Property insurance 8,675 9,422 747 9%925000 Injuries and damages 19,324 20,793 1,469 8%926000 Employee pensions and benefits 77,393 77,957 564 1%928000 Regulatory commission expenses 7,150 7,286 136 2%
Page 2 of 3

Summary Report 3B
NSP-MNTotal Company - O&M Electric and Non-Utility
2022 Budget vs. 2023 BudgetO&M by FERC Account
($000's)
FERC FERC Description 2022 Budget 2023 Budget Variance % Variance929000 Duplicate charges-Credit (5,582) (5,582) - 0%930100 General advertising expenses 3,898 3,935 37 1%930200 Miscellaneous general expenses 4,658 4,733 74 2%931000 Rents 43,309 49,297 5,987 14%935000 Maintenance of general plant 1,257 1,304 47 4%Grand Total 1,178,183 1,230,146 51,963 4%
Page 3 of 3

Summary Report 3C
NSP-MNTotal Company - O&M Electric and Non-Utility
2023 Budget vs. 2024 BudgetO&M by FERC Account
($000's)
FERC FERC Description 2023 Budget 2024 Budget Variance % Variance426100 Donations 5,956 5,961 4 0%426300 Penalties 1 1 0 1%426400 Expendit for cert civic, politic and related activ 1,041 1,049 8 1%426500 Other deductions 216 245 29 13%500000 Operation supervision and engineering 3,121 2,924 (197) -6%502000 Steam expenses 19,658 18,492 (1,166) -6%505000 Electric expenses 948 888 (60) -6%506000 Miscellaneous steam power expenses 15,959 16,139 180 1%507000 Rents 2,981 2,953 (28) -1%510000 Maintenance supervision and engineering 1,718 1,648 (70) -4%511000 Maintenance of structures 3,313 3,194 (120) -4%512000 Maintenance of boiler plant 26,842 21,443 (5,399) -20%513000 Maintenance of electric plant 3,744 4,710 966 26%514000 Maintenance of miscellaneous steam plant 5,320 5,236 (83) -2%517000 Operation supervision and engineering 40,784 43,898 3,114 8%519000 Coolants and water 7,824 7,784 (40) -1%520000 Steam expenses 49,111 50,490 1,379 3%523000 Electric expenses 1,772 1,853 80 5%524000 Miscellaneous nuclear power expenses 130,446 132,869 2,424 2%525000 Rents 9,852 9,760 (91) -1%528000 Maintenance supervision and engineering 7,070 6,897 (173) -2%530000 Maintenance of reactor plant equipment 35,934 34,634 (1,300) -4%531000 Maintenance of electric plant 12,490 12,645 155 1%532000 Maintenance of miscellaneous nuclear plant 27,102 27,333 231 1%535000 Operation supervision and engineering 101 104 3 3%538000 Electric expenses 142 146 4 3%539000 Miscellaneous hydraulic power generation expen 142 125 (17) -12%540000 Rents 66 66 (0) 0%541000 Maintenance supervision and engineering 175 177 2 1%542000 Maintenance of structures 22 416 394 1774%545000 Maintenance of miscellaneous hydraulic plant 175 161 (14) -8%546000 Operation supervision and engineering 3,968 3,924 (44) -1%548000 Generation expenses 5,162 5,319 157 3%549000 Miscellaneous other power generation expenses 21,184 21,442 258 1%550000 Rents 17,036 18,696 1,660 10%551000 Maintenance supervision and engineering 2,035 2,049 14 1%552000 Maintenance of structures 4,811 4,904 93 2%553000 Maintenance of generating and electric plant 13,146 12,895 (251) -2%554000 Maint of miscellaneou other power generation p 18,417 18,397 (20) 0%556000 System control and load dispatching 1,681 1,740 59 4%557000 Other expenses 5,407 5,521 115 2%560000 Operation supervision and engineering 10,730 10,887 156 1%561200 Load dispatch-Monitor and operate transmiss sys 5,617 6,065 448 8%561500 Reliability planning and standards development 184 190 6 3%561700 Generation interconnection studies 601 619 18 3%561800 Reliability planning and standards develop servic 2,243 2,243 - 0%562000 Station expenses 2,633 2,707 74 3%
Page 1 of 3

Summary Report 3C
NSP-MNTotal Company - O&M Electric and Non-Utility
2023 Budget vs. 2024 BudgetO&M by FERC Account
($000's)
FERC FERC Description 2023 Budget 2024 Budget Variance % Variance563000 Overhead line expenses 1,227 1,231 4 0%565000 Transmission of electricity by others 138,563 143,662 5,099 4%566000 Miscellaneous transmission expenses 7,677 7,773 96 1%567000 Rents 1,286 1,274 (11) -1%570000 Maintenance of station equipment 4,650 4,755 105 2%571000 Maintenance of overhead lines 6,105 6,117 12 0%575100 Operation Supervision 253 260 7 3%575200 Day-ahead and real-time market administration 97 100 3 3%575500 Ancillary services market administration 1 1 0 3%575800 Rents 20 20 (0) -1%580000 Operation supervision and engineering 12,267 12,528 261 2%581000 Load dispatching 1,031 1,350 319 31%582000 Station expenses 2,815 2,903 88 3%583000 Overhead line expenses (835) (787) 48 -6%584000 Underground line expenses 17,668 18,010 342 2%585000 Street lighting and signal system expenses 846 853 7 1%586000 Meter expenses 2,031 2,190 159 8%587000 Customer installations expenses 2,764 2,857 92 3%588000 Miscellaneous distribution expenses 32,910 32,765 (144) 0%589000 Rents 4,463 4,425 (37) -1%590000 Maintenance supervision and engineering 0 0 - 0%592000 Maintenance of station equipment 3,858 3,939 81 2%593000 Maintenance of overhead lines 62,009 62,428 420 1%594000 Maintenance of underground lines 7,361 7,497 135 2%595000 Maintenance of line transformers 31 32 1 3%596000 Maintenance of street lighting and signal system 1,113 1,125 11 1%597000 Maintenance of meters 1,646 1,473 (173) -10%598000 Maintenance of miscellaneous distribution plant 902 911 9 1%901000 Supervision 134 137 4 3%902000 Meter reading expenses 32,845 34,728 1,883 6%903000 Customer records and collection expenses 23,259 24,149 890 4%904000 Uncollectable Accounts - Commodity 13,997 14,765 768 5%904001 Uncollectable Accounts - Non Commodity 82 82 - 0%905000 Miscellaneous customer accounts expenses 102 103 0 0%908000 Customer assistance expenses 1,021 1,044 24 2%909000 Informational and instruction advertising expens 1,069 1,079 10 1%910000 Miscell customer service and informational expe 295 322 27 9%912000 Demonstrating and selling expenses 9,333 9,980 647 7%916000 Miscellanous Sales Expense 45 45 0 0%920000 Administrative and general salaries 111,243 114,833 3,590 3%921000 Office supplies and expenses 75,456 77,128 1,671 2%922000 Administrative expenses transferred-Credit (72,379) (81,017) (8,638) 12%923000 Outside services employed 22,861 22,989 128 1%924000 Property insurance 9,422 11,747 2,325 25%925000 Injuries and damages 20,793 21,992 1,199 6%926000 Employee pensions and benefits 77,957 80,353 2,396 3%928000 Regulatory commission expenses 7,286 7,421 135 2%
Page 2 of 3

Summary Report 3C
NSP-MNTotal Company - O&M Electric and Non-Utility
2023 Budget vs. 2024 BudgetO&M by FERC Account
($000's)
FERC FERC Description 2023 Budget 2024 Budget Variance % Variance929000 Duplicate charges-Credit (5,582) (5,582) - 0%930100 General advertising expenses 3,935 3,973 37 1%930200 Miscellaneous general expenses 4,733 4,903 170 4%931000 Rents 49,297 60,179 10,882 22%935000 Maintenance of general plant 1,304 1,338 34 3%Grand Total 1,230,146 1,258,221 28,075 2%
Page 3 of 3

1
Budget Process The annual budget process is comprised of several activities to project earnings and rate base for each Xcel Energy subsidiary as well as Xcel Energy in total. The portions of the annual process covered in this documentation are mainly business area operating and maintenance (O&M) expense and business area capital expenditures. The business area O&M expense and the capital budget are developed within each business area in Xcel Energy. The budgeting effort associated with these items is coordinated by Corporate and each business area finance group. The O&M and capital budgets are developed at the Xcel Energy subsidiary company level. O&M expense budgeted at Xcel Energy Services (XES) are assigned to each of the other Xcel Energy subsidiaries as part of the budget process, resulting in complete O&M budgets for each subsidiary company. Capital investments are not budgeted at XES and therefore, no assignment process is necessary. The business areas are not responsible for budgeting expenses to the jurisdictional level. Once the budgets are developed and XES expenses are assigned, the Revenue Requirements business area assigns each utility’s total expense to the proper jurisdictions. In addition, in the development of the cost of service projections, Revenue Requirements may make specific regulatory adjustments to the budget levels consistent with the requirements of that jurisdiction. Business Area Operating and Maintenance Expenses Each business area is responsible for developing an operating and maintenance expense budget for each legal entity and XES. There are two primary types of expenses included as part of these budgets: labor expenses and non-labor expenses. Labor Labor expense budgets are created by identifying projected employee levels and appropriate wage rates. The wage rate of each active employee is loaded into the system at the beginning of the budget process. Estimated overall wage percentage increases for each Xcel Energy subsidiary and labor category (union vs. non-union, etc.) are also loaded into the budget system and applied to each employee’s wage rate to estimate the budget year total labor dollars. Employee benefit and other employee wage-related costs including payroll taxes, medical costs, pension costs, etc. are budgeted at a Corporate level. Non-labor Non-labor expenses are budgeted into several categories. These categories are identified for each business area in Schedule 3 of Volume 6. These categories are designed to assist in providing an overall summary of major cost component areas. Overall Each labor and non-labor budget record is assigned to an internal order (IO) which is attached to a work breakdown structure (WBS). The IO has an independent attribute called an SAP requesting cost center, which identifies which business area owns that budget. In addition, the budgeted information is linked to attributes on the IO, which includes cost element (GAAP account), regulatory indicator (FERC account), and profit center, which identifies which state/utility the charge is related to, in order to assign the expense to the appropriate legal entity. The assignment to the profit center is used as the basis to develop electric or gas cost of service, as there are separate profit centers for

Budget Process 2
common, electric, gas, thermal, or other. Common costs are allocated by FERC account to electric, gas, and thermal utilities. Business Area Capital Expenditures Each Business Area identifies its capital requirements for the budget year and at least four additional years (resulting in a required five-year capital projection) and assigns them to individual budget projects. A listing of the 2020 - 2022 Capital budgets for projects is provided for each business area in Schedules 5 and 5A in Volume 6. Jurisdictional Assignment Revenue Requirements is responsible for assigning each utility operating and maintenance expense and the capital expenditure amounts to the jurisdictions served. The assignments are based on various factors consistent with the requirements of that jurisdiction. Budget Review Budgets are reviewed at several levels in the Xcel Energy organization. Business area management reviews the developed budget several times during the budget cycle. Prior to the budget cycle closing, budgets are reviewed and accepted at the executive management level of Xcel Energy. The earnings budgets and capital budgets are then presented to the Board of Directors to complete the review process.

2022 – 2024 Budget Documentation
Energy Supply

Energy Supply 2
Introduction The Energy Supply business area generates power for the company’s electric system. Xcel Energy has added and is adding significant renewable resources to its generation mix and modifying facilities to reduce emissions while increasing power to build a clean energy future. Customer Value Energy Supply seeks to continuously add customer value by investing in clean energy to make our clean energy future a reality. Part of the path toward this future includes making investments that upgrade and extend the useful lives of key facilities to benefit customers through improved performance and availability. Maximizing the availability of our generation fleet allows us to rely less on market-based purchases through MISO, the costs of which can sometimes be unpredictable or inconsistent, to supply our customers’ needs. Thus, maximizing the availability of our generation fleet helps keep overall rates as consistent and low as practicable. Budget Overview The Energy Supply operations and maintenance (O&M) budget is largely devoted to costs associated with operating and maintaining our generation fleet. For example, significant labor is required to operate and maintain generating plants on a day-to-day basis, including operating power plant equipment from control rooms, performing checks on equipment operating parameters, cleaning and inspecting equipment, and performing routine maintenance such as repairing pumps and valves. Further, chemicals such as lime, activated carbon, and ammonia are used to reduce emissions at the plants. In addition to existing assets, O&M costs have been included in the budget for new assets that are being added to the portfolio. The Company’s Energy Supply function will be at the forefront of the Company’s implementation of its carbon reduction efforts and long-term carbon free goals. Over the next two years, we will begin to see the Company’s shift to more Company-owned renewable energy generating facilities. As we move to a carbon-free future, the Company expects to continue making significant investments over the next several years. Specifically, the Commission has approved and we have completed the development and construction of the Blazing Star I, Blazing Star II, Community Wind North, Foxtail, Freeborn, and Jeffers wind farms, and the repowering of Crowned Ridge, Lake Benton, and Mower wind farms which were all placed in-service in 2019 through 2021. In the remaining months of 2021 and then into 2023, we anticipate placing in-service Dakota Range and the repowering of Northern Wind, Nobles, and Grand Meadows. These renewable and other major capital investments contribute to our ability to achieve the Company’s and the State’s policy goals over the long term. Generation Types Below is a listing of generation facilities in NSPM, by type:
Coal-fired facilities
• Allen S. King • Sherco
RDF-fired facilities • Red Wing • Wilmarth
Gas-fired facilities
• Black Dog • High Bridge • Riverside

Energy Supply 3
Peaking facilities
• Angus Anson • Blue Lake • Inver Hills
Hydro facility
• St Anthony Falls
Wind facilities1 • Blazing Star I • Blazing Star II • Borders (repowering of existing facility planned for 2025) • Community Wind North • Courtenay • Crowned Ridge • Dakota Range • Foxtail • Freeborn • Grand Meadows (repowering of existing facility planned for 2023) • Jeffers • Lake Benton • Mower • Nobles (repowering of existing facility planned for 2022) • Northern Wind • Pleasant Valley (repowering of existing facility planned for 2025)
Major Business Functions and Key Activities The Energy Supply business area generates power for the company’s electric system. The Energy Supply organizational structure partners Operations with centralized primary support from Projects and Performance Optimization. Some of the individuals who provide primary support are located at generating facilities with key responsibility to specific designated facilities. Others are located centrally with responsibility across a region or the fleet. Energy Supply consists of Operations, Performance Optimization, Business Operations, Engineering & Construction, Environmental, and ES Corporate. Operations Operations is comprised of two primary functions: operations and maintenance. Operations is responsible for the startup, operation, and shutdown of plant equipment. Maintenance is responsible for maintenance plans, schedules and facilitates maintenance work and maintenance processes. In addition, both operations and maintenance share the responsibility for ensuring safe, environmentally compliant, and reliable plant operation using a partnership approach to efficiently complete work. The Operations department consists of the Vice President of Operations, General Managers of Regional Operations (one for each region), and the Director of Hydro. The main accountabilities of the Operations department are to:
• Operate plant equipment within requirements • Maintain plant equipment • Manage plant personnel in accordance with labor contracts
1 This list of wind facilities includes those in-service as of October 25, 2021, and those intended to be placed in-service during the 2022 to 2024 test years.

Energy Supply 4
• Suggest/implement plant improvements • Maintain community relationships • Establish operations and maintenance policies and procedures
Performance Optimization The Performance Optimization department was designed to provide a broad fleet focus with centralized functions and common processes to implement a fleet wide asset management strategy and effectively drive systematic improvement in fleet asset and equipment health. Performance Optimization will increase the use of data, advanced analytics, and financial analysis to improve business decision making. The Performance Optimization department can be further refined into Reliability Engineering, Fleet Engineering, and Analytics and Practices. Reliability Engineering The Reliability Engineering department is responsible for the daily engineering activities at the plants. This department is organized by plant technologies to optimize the sharing of best practices for each technology. The Reliability Engineers provide onsite support for operations and maintenance departments, ensure the plant design basis is maintained, and ensure a consistent asset strategy is implemented across the fleet. Fleet Engineering The Fleet Engineering department is responsible for developing and implementing asset and equipment strategies consistently across the fleet. This department is broken into fleet engineering teams for common systems and components including Electrical and Controls, Boilers and Balance of Plant, Steam Turbines and Gas Turbines, Materials Engineering, and Non-Destructive Examination and Testing. The department is organized by common systems and components to more efficiently and effectively share and implement system best practices and lessons learned. This department also includes an Asset Strategy and Budget Integration team to ensure that fleet asset strategies are effectively integrated and prioritized within budgets. Analytics and Practices The Analytics and Practices department includes both a Monitoring and Diagnostics team and a System and Equipment Analytics team. The Monitoring and Diagnostics team utilizes the Company’s remote monitoring capability and predictive analytics to identify abnormal operational issues and alert plant personnel for corrective actions prior to failure to minimize costs. The System and Equipment Analytics team integrates equipment monitoring, asset performance management analytical tools, and financial analysis to improve existing equipment maintenance practices and transition equipment maintenance towards performance based and condition based maintenance practices. Business Operations The Business Operations team is comprised of Strategic Asset Management, Technical Compliance, and Process and Performance teams. Strategic Asset Management The Strategic Asset Management group is responsible for providing financial analysis tools and expertise to evaluate funding and spending decisions within the Energy Supply business area. They also provide the operating reports to meet both internal and external-reporting requirements of generation related information. Technical Compliance The Technical Resources and Compliance group is responsible for providing specialized engineering and technical services through subject matter experts and technical experts who provide comprehensive technical direction as well as drive fleet wide initiatives and standardization. They are responsible for FERC/NERC Reliability Standard compliance management and oversight and also have responsibility of overall fleet equipment ownership and the System Owners for primary equipment. The group leads the establishment of equipment inspection procedures, maintenance guidelines/standards, and specifications.

Energy Supply 5
Process and Performance The Process and Performance group is responsible for:
• Researching and developing the Energy Supply business area business plan • Coordinating and developing required business area reporting to support quarterly reviews,
year-end reports and board presentations • Supporting and guiding document and policy management for Energy Supply • Supporting problem solving and daily management improvement activities • Supporting and providing benchmarking and analysis
Projects (formerly called Engineering and Construction) Energy Supply’s Projects is a service organization supporting all operating companies. The primary purpose and responsibilities of the Projects department include:
• Develop and manage the Energy Supply capital budget process and coordinate development of
the Energy Supply Strategic Capital Investment Plan (2-, 5- and 10-year capital projects/budgets).
• Develop and maintain a uniform project management process, including supporting tools, and the design and engineering process.
• Project management and execution of capital projects, and large, complex O&M projects. • Project management and execution of major capital projects for new generation (including
renewables and innovative technologies). • Execution and construction management services for major plant overhauls. • Management of a dedicated craft labor pool (Special Construction) which performs O&M and
capital work at NSP plants and facilities.
Projects also coordinates development, implementation, and maintenance of an Energy Supply Quality Assurance and Quality Control (QA/QC) Program. Environmental Services Environmental Services is a centralized organization responsible for supporting the Xcel Energy enterprise compliance with the rules and regulations governing air quality, water quality, hazardous waste, solid waste, storage tanks, remediation of acquired or divested property and emergency spill response. The organization’s customers within the enterprise include Energy Supply, electric transmission and distribution, high pressure gas, and gas distribution. The organization provides environmental permitting and compliance support in the four operating companies and obtains regulatory permits that provide the flexible and cost-effective authorization for company operations while protecting the environment. Environmental Services also provides training and compliance assistance services to its customers to help them comply with the various regulatory requirements. The audit function of the organization contributes to the environmentally responsible, long-term and cost-effective operations of Xcel Energy facilities by providing risk-based, objective and accurate assessments of compliance with environmental regulations, company environmental policies and environmental management systems. Environmental Services is also responsible for helping to develop and implement the Company’s environmental leadership strategy and associated policy initiatives. We support the development of Xcel Energy’s environmental strategy by providing technical and emission information, participating in industry associations and meetings, and developing comments on proposed regulations. We work with Operations to implement the compliance strategy by obtaining permits, development of reporting processes, and provide necessary compliance training. Energy Supply Corporate The ES Corporate area consists of the ES Senior Vice President, the Executive Assistant, and the planning and process enhancement team.

Energy Supply 6
The Senior Vice President is responsible for guiding Energy Supply according to the established business plan, setting the general direction of Energy Supply’s business plan, and providing guidance and support to all of Energy Supply.

Energy Supply 7
Energy Supply – NSPM 2022 O&M Budget Major Cost Drivers Costs are categorized in Energy Supply as Internal Labor, Contract Labor, Materials, Commodities, Land Easements, and Other. Main drivers of differences in these cost categories during the budget period are mainly new generation facilities, wage increases, headcount reductions, as well as some specific projects during each year. Internal Labor Costs: This cost category consists of labor for Energy Supply employees in a department or station, and overtime for recurring activities, required to operate stations or departments on a daily basis. Outside Services Costs: This cost category consists of outside vendor services and contracted labor performing work for Energy Supply. Primarily this is specialty work that cannot be performed by internal labor either due to skill set limitations or other constraints of existing employees. Materials Costs: This cost category consists of materials required to operate stations or departments on an ongoing basis for operations and maintenance activities. Commodity Costs: This cost category consists of chemical and water costs used in the generation process, and for the control of emissions. Chemicals include lime, ammonia, activated carbon, sulfuric acid and others. Land Easement Costs: This cost category consists of payments made to land owners for use of their land, primarily at our wind farm locations. Other Costs: This cost category consists of environmental fees, fleet costs, and other miscellaneous costs required to operate plants on a daily basis.

Energy Supply 8
Energy Supply – NSPM 2022 O&M Budget Major Cost Drivers

Energy Supply 9
Overall, the Energy Supply O&M budget increased by $5.1M between 2021 and 2022. The main drivers of this increase are noted below: Incremental Wind Spend: In 2021 and 2022, five new wind farms are set to be in-service that will require an additional $8.3M O&M dollars to operate. The wind farms that have been, or are planned to be, placed in-service in 2021 are Blazing Star II, Dakota Range, Freeborn, and Mower. The wind farm planned to be placed in-service in 2022 is Northern Wind. Overhauls and Projects: Sherco Unit 2 has an overhaul in 2022, which has a decreased scope compared to the 2021 Unit 1 overhaul for a decrease of $5.4M. Black Dog has significant overhaul and project work planned for 2022 requiring an additional $3.3M. Red Wing has incremental overhaul work of $0.7M in 2022. Angus has overhaul work of $0.5M in 2022. Riverside overhaul will not be repeated for a reduction of $0.5M. Other: Reductions of $1.5M in base spend at existing sites due to offsetting increases/reductions in internal labor, outside services, commodities, and materials over 2021 levels.
2021 July Year End Forecast 149.5$ Incremental wind spend for new wind farms
Incremental outside services spend 4.6Incremental land easements spend 2.9Incremental materials and labor spend 0.8
Overhauls and ProjectsSherco Unit 2 overhaul less than 2021 Unit 1 overhaul -5.4Black Dog overhaul and projects in 2022 3.3Red Wing overhaul in 2022 0.7Angus overhaul in 2022 0.5Riverside overhaul not repeated in 2022 -0.5
OtherReduced base spend at existing sites -1.5Other -0.3
2022 Budget 154.6$

Energy Supply 10
Energy Supply – NSPM 2023 O&M Budget Major Cost Drivers

Energy Supply 11
Overall, the budget increased by $6.2M between 2022 and 2023. The main drivers of this increase are noted below: Incremental Wind Spend: In 2022 and 2023 one new wind farm (Northern Wind) is set to be in-service that will require an additional $2.4M O&M dollars to operate for a full year of 2023 compared to a partial year of operation in 2022. Incremental Solar Spend: In 2023, Sherco Solar Unit 1 is set to be in-service and will require an additional $0.9M of O&M dollars to operate in 2023. Overhauls and Projects: The Sherco Unit 3 overhaul is $3.6M more costly than the Unit 2 outage in 2022. The Black Dog outage and projects will not continue from 2022, decreasing O&M in 2023 by $3.2M. In addition, High Bridge has additional overhaul and project work in 2023 compared to 2022 for an additional $1.4M. Outside Services: Decreased spend of $1.4M on outside services maintenance contracts at existing wind farms. Labor: Incremental spend of $2.1M on base internal labor due to assumed wage increases.
2022 Budget 154.6$ Incremental wind spend for new wind farms
Incremental outside services spend 1.7Incremental land easements spend 0.7
Incremental solar spend for new solar farmsIncremental materials and commodities 0.3Incremental land easements spend 0.4Incremental outside services spend 0.3
Overhauls and ProjectsSherco Unit 3 overhaul more than 2022 Unit 2 overhaul 3.6 High Bridge Unit 8 and Unit 9 Overhaul 1.4 No Black Dog overhaul in 2023 (3.2)
Outside ServicesDecreased spend on existing wind maintenance contracts (1.4)
LaborIncremental spend on internal base labor 2.1
Other 0.4
2023 Budget 160.8$

Energy Supply 12
Energy Supply – NSPM 2024 O&M Budget Major Cost Drivers

Energy Supply 13
Overall, the budget decreased by $3.1M between 2023 and 2024. The main drivers of this decrease are noted below: Sherco Unit 2 Retirement: Reduction of $4.0M related to retirement of Sherco Unit 2 made up of a $2.0M reduction for internal labor, a $0.7M reduction for materials, and a $1.4M reduction for outside services. Incremental Solar Spend: In 2024, Sherco Solar Unit 1 will be in-service for entire year and Sherco Solar Unit 2 is set to in-service. The combination will require an additional $3.5M of O&M dollars to operate. Overhauls and Projects: The Sherco Unit 1 overhaul is $2.8M less costly than the 2023 Unit 3 overhaul.
2023 Budget 160.8$ Sherco Unit 2 Retired
Decreased internal labor spend (2.0) Decreased material spend (0.7) Decreased outside services spend (1.4)
Incremental solar spend for new solar farmsIncremental materials and commodities 1.1Incremental land easements spend 1.4Incremental outside services spend 1.1
Overhauls and ProjectsSherco Unit 1 overhaul less than 2023 Unit 3 overhaul (2.7)
Other 0.1 2024 Budget 157.7

Energy Supply 14
Cost Allocation Methodologies The allocation methods used to distribute costs to legal entity and utility include: Operating Company Direct Charges
Costs incurred directly by a particular operating company. For example, the relevant operating company pays insurance premiums for operating-company-specific policies. These premiums are shown as direct charges to that operating company. Service Company Direct Charges Costs incurred by the Service Company on behalf of an operating company. For example, some Budgeting personnel may be involved in a specific operating company initiative (e.g., a rate case or other regulatory filing). Any Service Company labor costs associated with this initiative are billed directly to the relevant operating company. Service Company Allocated Charges Costs for which a unique operating company cannot be determined or which are incurred on behalf of all operating companies. For example, general Budgeting services are provided on a centralized basis for all Xcel Energy legal entities. The Service Company labor costs associated with these services are allocated to the legal entities using allocations. The primary methods utilized for each service area are described below. Please see Exhibit__(RLB-1), Schedule 4 for a complete list of the Company's allocators.

Energy Supply 15
Allocating Cost Center
JDE Subledger Code
Allocating Cost Center Name
Description
200078 410 Governmental Affairs
Governmental Affairs includes the labor and non-labor costs associated with the interpretation of laws regulations and environmental policy to ensure compliance and cost effectiveness for Xcel Energy customers and stockholders Internal legislative policy development and issues management, appraise management and internal customers of political and policy trends and developments, develop and maintain relationships with regulatory officials and staff.
200135 414 Energy Supply Business Resources
Energy Supply Business Resources services includes the labor and non-labor costs of performance analysis, specialists and analytical services provided to the operating companies' generation facilities.
200137 455 Energy Supply Miscellaneous Power Expense FERC 506, 539, & 549
Energy Supply Miscellaneous Power Expense FERC 506, 539, & 549 services include Energy Supply operations performance services labor and non-labor costs for non-management employees with the following accountabilities: Develop / suggest / implement improvements for multiple power plants, standardize best practices and process improvements across multiple power plants, establish operations and maintenance policies and procedures for multiple power plants.
200138 458 Energy Supply Operation Supervision & Engineering (S&E) FERC 500, 535, & 546
Energy Supply Operation Supervision & Engineering (S&E) FERC 500, 535, & 546 services include labor and expenses incurred in the general supervision and direction of the operation of steam powered generation stations, hydraulic power generating stations, and other power generating stations.
200139 461 Energy Supply Maintenance Supervision & Engineering (S&E) FERC 510, 541, & 551
Energy Supply Maintenance Supervision & Engineering (S&E) FERC 510, 541, & 551 services which include management and performance labor and non-labor costs for the following accountabilities: Researching, reviewing, recommending and facilitating the selection of technological alternatives for improved plant and environmental performance. Manage uniform project management process (policies). Planning for physical plant modifications, which includes consolidation and management of short-term and long-term plans for physical plant modifications. Develop and execute innovative technology projects such as: biomass, solar, wind. Implement enterprise project management (EPM) and planning tools. Establish uniform technology, design & equipment standards.
200143 456 Energy Supply Miscellaneous Power Expense NSPM & NSPW FERC 506, 539, & 549
Energy Supply Miscellaneous Power Expense NSPM & NSPW FERC 506, 539, & 549 services include Energy Supply operations performance services labor and non-labor costs for non-management employees with the following accountabilities: Develop / suggest / implement improvements for multiple power plants, standardize best practices and process improvements across multiple power plants, establish operations and maintenance policies and procedures for multiple power plants. This allocation is used when NSPM & NSPW jurisdictions are benefiting from the services.
200144 459 Energy Supply Operation Supervision & Engineering (S&E) NSPM & NSPW FERC 500, 535, & 546
Energy Supply Operation Supervision & Engineering (S&E) NSPM & NSPW FERC 500, 535, & 546 services include labor and expenses incurred in the general supervision and direction of the operation of steam powered generation stations, hydraulic power generating stations, and other power generating stations. This allocation is used when NSPM & NSPW jurisdictions are benefiting from the services.
200145 462 Energy Supply Maintenance Supervision & Engineering (S&E) NSPM & NSPW FERC 510, 541, & 551
Energy Supply Maintenance Supervision & Engineering (S&E) NSPM & NSPW FERC 510, 541, & 551 services which include management and performance labor and non-labor costs for the following accountabilities: Researching, reviewing, recommending and facilitating the selection of technological alternatives for improved plant and environmental performance. Manage uniform project management process (policies). Planning for physical plant modifications, which includes consolidation and management of short-term and long-term plans for physical plant modifications. Develop and execute innovative technology projects such as: biomass, solar, wind. Implement enterprise project management (EPM) and planning tools. Establish uniform technology, design & equipment standards. This allocation is used when NSPM & NSPW jurisdictions are benefiting from the services.
200181 464 Energy Supply Environmental Policy & Services
Energy Supply Environmental Policy & Services include the labor and non-labor costs dedicated to air quality, renewable energy, innovative technology and climate change, develop corporate compliance strategy, regulatory agency interaction (both at the federal and/or state level), permitting and compliance reporting, waste management, combustion byproducts management, environmental compliance auditing, provide support to the Environmental Council and assist with environmental communications strategies.

Energy Supply 16
Approvals This document has been checked for errors in calculations and content. Prepared By: /s/ Date: 10/11/2021
Hannah Hayes
Manager, Business Area Finance Approved By: /s/ Date: 10/8/2021
Jennifer Pytlik Director, Business Area Finance
Date: 10/13/21 /s/
Randy Capra
GM, Power Generation

2022 – 2024 Budget Documentation
Nuclear Generation (including Outage Deferral & Amortization)

Nuclear Generation 2
Major Business Functions and Key Activities Introduction The Nuclear Generation business area generates power for the Northern States Power (NSP) system, supplying both NSP-Minnesota and NSP-Wisconsin. Nuclear Generation operates two generating plant sites, the two-unit Prairie Island plant and the single unit Monticello plant. Together Prairie Island and Monticello comprise more than half of our carbon-free generation and approximately 30 percent of our total generation for the NSP system, and they serve more than one million customer homes.
Prairie Island Nuclear Generating Plant
NSP-Minnesota owns the Prairie Island Nuclear Generating Plant (PI) located in Welch (28 miles southeast of the Twin Cities) near Red Wing, Minnesota. The plant houses two pressurized water reactors, totaling 1,100 megawatts of capacity. Prairie Island began commercial operation under initial 40-year licenses on December 4, 1973 for Unit 1 and on December 21, 1974 for Unit 2. In June 2011, the Prairie Island Nuclear Generating Plant was granted a 20-year license extension by the Nuclear Regulatory Commission (NRC) to August 9, 2033 and October 29, 2034 for Units 1 & 2, respectively.
Monticello Nuclear Generating Plant
NSP-Minnesota owns the Monticello Nuclear Generating Plant (MT) located in Monticello, Minnesota (40 miles northwest of the Twin Cities). It is a one-unit, boiling water reactor, providing 671 megawatts of generating capacity after completion of a power uprate in 2013. The Monticello plant began commercial operation under an initial 40-year license on June 30, 1971. In November 2006, the Monticello Nuclear Generating Plant was granted a 20-year license extension by the NRC to September 8, 2030.
Organization
Nuclear Generation is led by the Senior VP & Chief Nuclear Officer (CNO), who reports directly to the Executive VP & Chief Operations Officer of Xcel Energy. The following organizations report to the CNO within Nuclear generation:
• Site Operations – Prairie Island • Site Operations – Monticello • Engineering & Technical Services • Fleet Operations • Strategy • Maintain
The role of each of these organizations is described below in the Functional Org Chart section.

Nuclear Generation 3
Major Business Functions and Key Activities Customer Value Xcel Energy’s stated mission is to provide our customers the safe, clean, reliable energy services they want and value at a competitive price. Nuclear Generation seeks to add customer value supporting that mission by providing:
• Individual, Operational, & Competitive Excellence, and • Carbon-free Generation
Nuclear generating stations are among the most reliable to the Xcel Energy fleet, in terms of providing base load energy to the NSP system on a consistent, reliable basis. Nuclear generation also is a carbon-free energy source, in that it generates virtually none of the greenhouse gas emissions associated with fossil fuels: carbon dioxide, sulfur dioxide, and nitrous oxide. Finally, nuclear generation helps deliver value to NSP’s customers by providing a reliable source of energy at a competitive price. The Company recognizes that operating nuclear facilities creates additional responsibility to ensure public safety. Nuclear Generation works closely with the NRC to monitor safety and intends to fully and continually comply with all regulatory requirements. Nuclear Generation O&M Trend 2018-2024
Nuclear Generation 4
Major Business Functions and Key Activities The chart above summarizes the major components of Nuclear Generation O&M expense:
• Non-Outage costs • Outage costs, net of deferral and amortization
Non-Outage O&M Costs Non-outage O&M costs include all workforce costs, regulatory fees, materials, employee expenses and other utility costs required to operate stations or departments on a regular basis. Said another way, Non-Outage costs are those not classified as Outage Costs, per the definition in the next section. To remain competitive with other generation resources and to keep customer rates low, the Nuclear Generation business has undertaken transformation efforts that have reduced Total O&M costs by $24.4M from 2018 – 2020. From 2020 forward, these expenses are forecast to remain relatively flat at a total level. This results in an average reduction of 1% annual from 2018 through the 2024 budget. The decrease in total non-outage costs since 2018 has been primarily driven by a drop in overall workforce expenses and material costs. Our work has focused on process development and refinement and the integration of technology to achieve efficiencies. Focused improvement of process as well as behaviors has the benefit of driving down costs while at the same time improving plant performance. In 2020 and 2021, the pandemic response further reduced our internal workforce costs. Specifically, our desire to keep our employees as safe as possible by minimizing travel and the number of personnel at our facilities, which resulted in natural reductions to workforce costs and employee expenses. In addition to the strides we’ve made in managing employee labor costs, we’ve significantly reduced security contractor costs as well. In 2017-2018 we made innovative staffing changes and in 2018-2019 we saw staffing reductions from capital strategy improvements at Monticello. We are also seeing similar savings from our Prairie Island capital project implemented in the final quarter of 2020, with full annual savings beginning in 2021. Outage O&M Costs Outage O&M costs include the incremental costs of those activities that can only be done safely and prudently during a plant shutdown. The incremental costs include primarily contract work, but also include overtime, materials, traveling maintenance labor, regular labor for non-native plant employees, craft labor and other expenses for outages. The outage O&M costs are smoothed under regulatory-approved methods of deferring and amortizing costs. Outage costs have decreased as higher costs from prior outages are smoothed. In addition, the best practice strategies and certain targeted capital improvements extended beyond just the Non-Outage O&M techniques deployed and helped Nuclear achieve some of the lowest cost outages and durations we’ve experienced over the past ten years. Beginning in 2023, outage costs will be increasing due to some large inspections that are required to be performed based on NRC requirements. For example, we will be replacing Baffle-Former Bolts in the 2023 and 2024 outages (costs for which are capital), which will cause Outage O&M costs to increase due to extended durations to do the work.
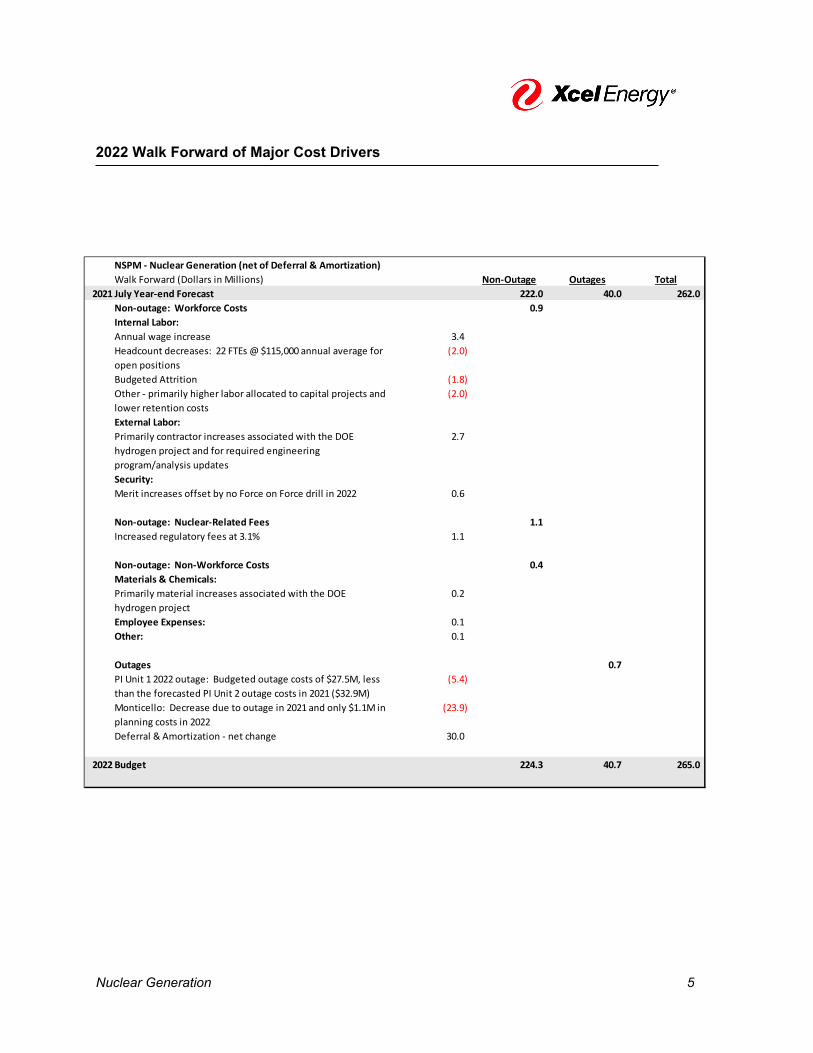
Nuclear Generation 5
2022 Walk Forward of Major Cost Drivers
NSPM - Nuclear Generation (net of Deferral & Amortization) Walk Forward (Dollars in Millions) Non-Outage Outages Total
2021 July Year-end Forecast 222.0 40.0 262.0 Non-outage: Workforce Costs 0.9 Internal Labor:Annual wage increase 3.4 Headcount decreases: 22 FTEs @ $115,000 annual average for open positions
(2.0)
Budgeted Attrition (1.8) Other - primarily higher labor allocated to capital projects and lower retention costs
(2.0)
External Labor:Primarily contractor increases associated with the DOE hydrogen project and for required engineering program/analysis updates
2.7
Security:Merit increases offset by no Force on Force drill in 2022 0.6
Non-outage: Nuclear-Related Fees 1.1 Increased regulatory fees at 3.1% 1.1
Non-outage: Non-Workforce Costs 0.4 Materials & Chemicals:Primarily material increases associated with the DOE hydrogen project
0.2
Employee Expenses: 0.1 Other: 0.1
Outages 0.7 PI Unit 1 2022 outage: Budgeted outage costs of $27.5M, less than the forecasted PI Unit 2 outage costs in 2021 ($32.9M)
(5.4)
Monticello: Decrease due to outage in 2021 and only $1.1M in planning costs in 2022
(23.9)
Deferral & Amortization - net change 30.0
2022 Budget 224.3 40.7 265.0

Nuclear Generation 6
2022 Walk Forward of Major Cost Drivers (continued)
Nuclear Generation 2022 O&M Budget Major Business Drivers
Non-OutageWorkforce Costs
Non-Outage Non-Workforce Costs Nuclear-Related Fees Outages - net
2021/2022Variance $0.9 $0.4 $1.1 $0.7
$-
$0.2
$0.4
$0.6
$0.8
$1.0
$1.2
NSPM Nuclear Generation2022 O&M Budget Business Drivers of $3.0M increase
in millions
63.9%Non-Outage
Workforce Costs
7.0%Non-Outage Non-Workforce Costs
13.8%Nuclear-Related Fees
15.3%Outages - net
NSPM Nuclear Generation2022 O&M Budget = $265M

Nuclear Generation 7
2022 Walk Forward of Major Cost Drivers (continued) The costs are categorized in Nuclear Generation as Non-outage or Outage related. Non-outage costs are further subdivided into Workforce Costs, Non-Workforce Costs, and Nuclear-Related Fees. The Outage costs include primarily contractor costs for refueling and for inspections and maintenance that cannot be done safely or efficiently online. Explanations of the variances in these major cost categories are described below. Non-outage Workforce Costs: This category consists of labor costs for all native employees in a department or station, overtime for recurring activities or projects that are not outage dependent, and all other premiums, operations bonuses, or other compensation expenses required to operate plants or departments on a regular basis. This category also includes external contractor costs including security. The Internal Labor decrease from the 2021 July forecast to 2022 budget is primarily related to headcount decreases, and budgeted attrition, offset by the 2022 wage increase. Wage increases of three percent for union and three percent for non-union are increasing labor by $3.4M. A decrease of 22 FTEs results in a labor decrease of $2.5M, and budgeted attrition of 3.3 percent, which lowers labor by $1.8M. In addition, we had other decreases of $1.5M due primarily to increased utilization of Internal Labor for capital projects and a reduction in retention costs. Additionally, the External Labor increase from the 2021 July forecast to 2022 budget is primarily contractor increases for the Hydrogen Phase 2 project and required engineering program/analysis updates. Security Contractor costs increase by $0.6M due to merit increases offset by no force- onforce drill in 2022. Non-outage Non-Workforce Costs: This category consists of materials, employee expenses and other utility costs required to operate stations or departments on a regular basis. The increase is primarily related to the Hydrogen Phase 2 project. Nuclear-Related Fees: Regulatory fees are a significant cost category for the Nuclear Generation business area and are considered non-discretionary based on NRC regulation, monitoring, and evaluation. Fees include dues and fees required by the Nuclear Regulatory Commission (NRC), Institute of Nuclear Power Operations (INPO), Electric Power Research Institute (EPRI), Nuclear Energy Institute (NEI), Pressurized Water Reactor Owners Group (PWROG), Boiling Water Reactor Owners Group (BWROG), and other nuclear specific dues and fees. This category in 2022 is approximately $36M of the $224M of non-outage costs, or 14 percent. Regulatory fees are increasing $1.1M, or 3.1 percent, primarily due to higher fees expected to be charged by NRC and FEMA/State EP. Outage Costs: This cost category includes only scheduled refueling and maintenance outages that are planned in advance. Costs in this category are incurred during the outage and are considered outage dependent. The costs are incremental to non-outage costs and include primarily contract work, but also include overtime, materials, traveling maintenance labor, regular labor for non-native plant employees, craft labor and other expenses for outages. Fixed or “base” costs incurred during outages are budgeted as non-outage and actual costs are recorded as non-outage labor or non-labor. The total budgeted 2022 amortized outage costs are expected to be $0.7M higher than 2021 amortized outage costs primarily due to higher upcoming outage costs for Prairie Island’s 2021 Unit 2 outage ($32.3M) vs the 2019 Unit 2 outage ($29.3M).
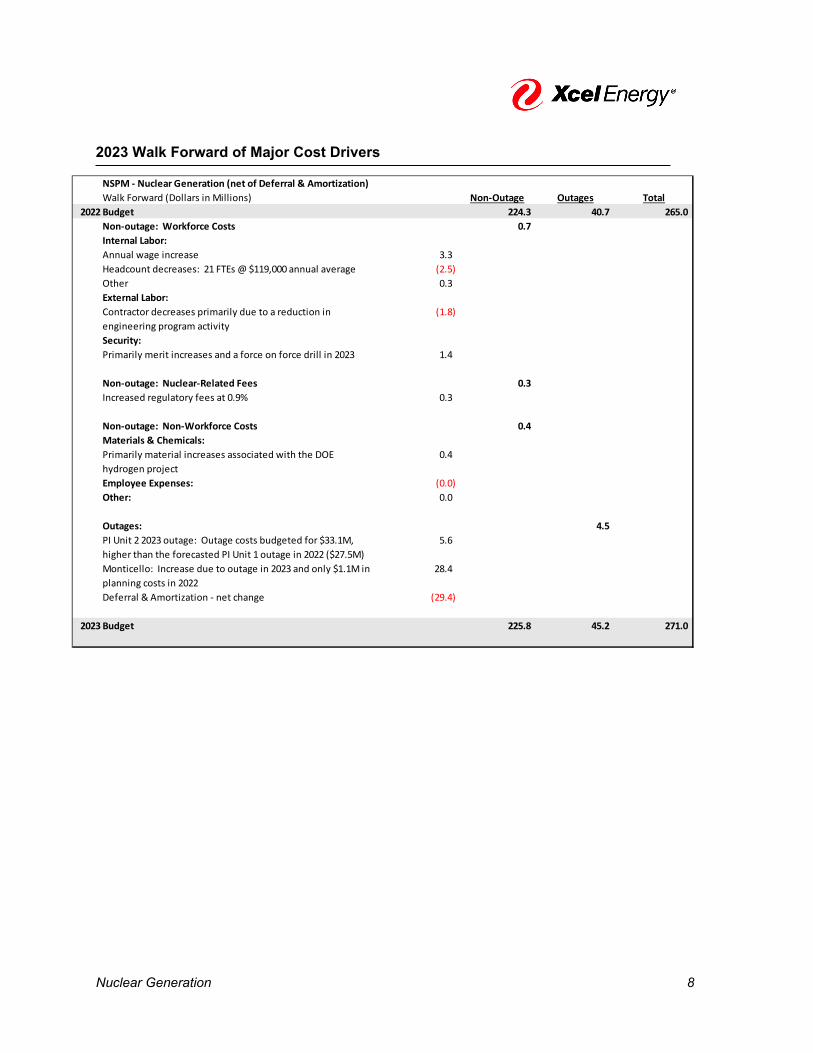
Nuclear Generation 8
2023 Walk Forward of Major Cost Drivers
NSPM - Nuclear Generation (net of Deferral & Amortization) Walk Forward (Dollars in Millions) Non-Outage Outages Total
2022 Budget 224.3 40.7 265.0 Non-outage: Workforce Costs 0.7 Internal Labor: Annual wage increase 3.3 Headcount decreases: 21 FTEs @ $119,000 annual average (2.5) Other 0.3 External Labor: Contractor decreases primarily due to a reduction in engineering program activity
(1.8)
Security: Primarily merit increases and a force on force drill in 2023 1.4
Non-outage: Nuclear-Related Fees 0.3 Increased regulatory fees at 0.9% 0.3
Non-outage: Non-Workforce Costs 0.4 Materials & Chemicals:Primarily material increases associated with the DOE hydrogen project
0.4
Employee Expenses: (0.0) Other: 0.0
Outages: 4.5 PI Unit 2 2023 outage: Outage costs budgeted for $33.1M, higher than the forecasted PI Unit 1 outage in 2022 ($27.5M)
5.6
Monticello: Increase due to outage in 2023 and only $1.1M in planning costs in 2022
28.4
Deferral & Amortization - net change (29.4)
2023 Budget 225.8 45.2 271.0

Nuclear Generation 9
2023 Walk Forward of Major Cost Drivers (continued)
Nuclear Generation 2023 O&M Budget Major Business Drivers
Non-OutageWorkforce Costs
Non-Outage Non-Workforce Costs Nuclear-Related Fees Outages - net
2022/2023Variance $0.7 $0.4 $0.3 $4.5
$- $0.5 $1.0 $1.5 $2.0 $2.5 $3.0 $3.5 $4.0 $4.5 $5.0
NSPM Nuclear Generation2023 O&M Budget Business Drivers - $6.0M increase
in millions
62.7%Non-Outage
Workforce Costs7.0%
Non-Outage Non-Workforce Costs
13.6%Nuclear-Related Fees
16.7%Outages - net
NSPM Nuclear Generation2023 O&M Budget = $271M

Nuclear Generation 10
2023 Walk Forward of Major Cost Drivers (continued) The costs are categorized in Nuclear Generation as Non-outage or Outage related. Non-outage costs are further subdivided into Workforce Costs, Non-Workforce Costs, and Nuclear-Related Fees. The Outage costs include primarily contractor costs for refueling and for inspections and maintenance that cannot be done safely or efficiently online. Explanations of the variances in these major cost categories are described below. Non-outage Workforce Costs: This category consists of labor costs for all native employees in a department or station, overtime for recurring activities or projects that are not outage dependent, and all other premiums, operations bonuses, or other compensation expenses required to operate plants or departments on a regular basis. This category also includes external contractor costs including security. The Internal Labor increase from the 2022 to 2023 budget is primarily related to the 2023 wage increase, offset by a decrease in headcount. Wage increases of three percent for union and three percent for non-union are increasing labor by $3.3M. This is offset by a decrease of 21 FTEs which results in a labor decrease of ($2.5M). Additionally, External Labor decreased from the 2022 to 2023 budget primarily related to reductions in engineering program updates. Security increased by $1.4M due to merit increases and the force on force drill planned for 2023 (no force on force drill in 2022). Non-outage Non-Workforce Costs: This category consists of materials, employee expenses and other utility costs required to operate stations or departments on a regular basis. The $0.4M increase is primarily related to the Hydrogen Phase 2 project. Nuclear-Related Fees: Regulatory fees are a significant cost category for the Nuclear Generation business area and are considered non-discretionary based on NRC regulation, monitoring, and evaluation. Fees include dues and fees required by the NRC, INPO, EPRI, NEI, PWROG, BWROG, and other nuclear specific dues and fees. This category in 2023 is approximately $37M of the $226M of non-outage costs, or 14 percent. Regulatory fees were assumed to increase $0.3M, or only 0.9 percent. Outage Costs: This cost category includes only scheduled refueling and maintenance outages that are planned in advance. Costs in this category are incurred during the outage and are considered outage dependent. The costs are incremental to non-outage costs and include overtime, contract work, materials, traveling maintenance labor, regular labor for non-native plant employees, craft labor and other expenses for outages. Fixed or “base” costs incurred during outages are budgeted as non-outage labor or non-labor. Total budgeted 2023 amortized outage costs are expected to be $4.5M higher than budgeted 2022 amortized outage costs due to higher costs assumed for the Prairie Island’s 2022 Unit 1 outage ($28.8M) vs the 2022 Unit 1 outage ($22.5M) and Monticello’s 2023 outage ($30.5M) vs Monticello’s 2021 outage ($26.2M).

Nuclear Generation 11
2024 Walk Forward of Major Cost Drivers
NSPM - Nuclear Generation (net of Deferral & Amortization) Walk Forward (Dollars in Millions) Non-Outage Outages Total
2023 Budget 225.8 45.2 271.0 Non-outage: Workforce Costs 3.2 Internal Labor: Annual wage increase 3.3 Headcount decreases: 21 FTEs @ $123,000 annual average (2.6) Other - increase in working days (2024 is a Leap Year) 1.0 External Labor:Primarily contractor increases due to the Hydrogen Phase 2 project
0.4
Security: Primarily related to merit increases 1.0
Non-outage: Nuclear-Related Fees 0.3 Increased regulatory fees at 0.9% 0.3
Non-outage: Non-Workforce Costs (0.2) Materials & Chemicals:Decreased materials (0.2) Employee Expenses: 0.0 Other: 0.0
Outages 1.6 PI Unit 1 2024 outage: Outage costs budgeted for $36.2M, higher than the forecasted PI Unit 2 outage in 2023 ($33.1M)
3.1
Monticello: Decrease due to outage in 2023 and only $1.1M in planning costs in 2024
(28.4)
Deferral & Amortization - net change 26.9
2024 Budget 229.2 46.8 276.0

Nuclear Generation 12
2024 Walk Forward of Major Cost Drivers (continued)
Nuclear Generation 2024 O&M Budget Major Business Drivers
Non-OutageWorkforce Costs
Non-Outage Non-Workforce Costs Nuclear-Related Fees Outages - net
2023/2024Variance $3.2 $(0.2) $0.3 $1.6
$(0.5) $-
$0.5 $1.0 $1.5 $2.0 $2.5 $3.0 $3.5
NSPM Nuclear Generation2024 O&M Budget Business Drivers - $5.0M increase
in millions
62.8%Non-Outage
Workforce Costs6.8%
Non-Outage Non-Workforce Costs
13.5%Nuclear-Related Fees
17.0%Outages - net
NSPM Nuclear Generation2024 O&M Budget = $276M

Nuclear Generation 13
2024 Walk Forward of Major Cost Drivers (continued) The costs are categorized in Nuclear Generation as Non-outage or Outage related. Non-outage costs are further subdivided into Workforce Costs, Non-Workforce Costs, and Nuclear-Related Fees. The Outage costs include primarily contractor costs for refueling and for inspections and maintenance that cannot be done safely or efficiently online. Explanations of the variances in these major cost categories are described below. Non-outage Workforce Costs: This category consists of labor costs for all native employees in a department or station, overtime for recurring activities or projects that are not outage dependent, and all other premiums, operations bonuses, or other compensation expenses required to operate plants or departments on a regular basis. This category also includes external contractor costs including security. The Internal Labor increase from the 2023 to 2024 budget is primarily related to the 2024 wage increase, offset by a decrease in headcount. Wage increases of three percent for union and three percent for non-union are increasing labor by $3.3M. This is offset by a decrease of 21 FTEs which results in a labor decrease of ($2.6M). Additionally, External Labor increases slightly by $0.4M due to the Hydrogen Phase 2 project. Security increases from the 2023 to 2024 budget is primarily related to security contractor merit increases. Non-outage Non-Labor Costs: This category consists of materials, employee expenses and other utility costs required to operate stations or departments on a regular basis. Nuclear-Related Fees: Regulatory fees are a significant cost category for the Nuclear Generation business area and are considered non-discretionary based on NRC regulation, monitoring, and evaluation. Fees include dues and fees required by the NRC, INPO, EPRI, NEI, PWROG, BWROG, and other nuclear specific dues and fees. This category in 2024 is approximately $37M of the $229M of non-outage costs, or 14 percent. Regulatory fees were assumed to increase $0.3M, or only 0.9 percent. Outage Costs: This cost category includes only scheduled refueling and maintenance outages planned in advance. Costs in this category are only incurred during the outage and are considered outage dependent. The costs are incremental to non-outage costs and include overtime, contract work, materials, traveling maintenance labor, regular labor for non-native plant employees, craft labor and other expenses for outages. Fixed or “base” costs are budgeted as non-outage labor or non-labor. Total budgeted 2024 amortized outage costs are expected to be $1.6M higher than budgeted 2023 amortized outage costs due to higher costs assumed for the 2024 Unit 1 outage ($36.2M) vs the 2022 Unit 1 outage ($28.8M) and Monticello’s 2023 outage ($30.5M) vs Monticello’s 2021 outage ($26.2M).

Nuclear Generation 14
Functional Organization Chart
In addition to direct responsibilities noted below, the leaders of these areas collaborate as a Nuclear Generation executive team for the oversight of business planning, project prioritization and funding, regulatory compliance, and other matters.
The Site Operations at each plant are led by a Site VP, who oversees the day-to-day operation of the generating plant and the strategic communication with the centralized support functions performing for the site, as well as with external stakeholders. These functions, which include a Plant Manager and a Director of Site Performance and Operations Support have the common objective of assuring the collective operations of the nuclear sites meet all nuclear industry and Company expectations.
VP Projects, Engineering, and Technical Services include teams that support each of those areas. Capital Projects oversees the planning and execution of capital projects for Nuclear Generation. Nuclear’s capital projects include initiatives mandated by regulators, upgrades to equipment to maintain reliability, efforts to improve operating performance, storage of spent nuclear fuel, and facilities. Engineering is a core competency of Nuclear in its operation, maintenance and construction activities. Fuel management and procurement are also significant responsibilities for supporting safe, reliable, and cost-effective nuclear operations. Also includes overseeing the Nuclear Oversight department.
VP Fleet Operations includes the Performance Improvement team responsible for ensuring improvement of operating performance through governance, oversight, and support of the plants, and oversight of the Nuclear departments of Security/Emergency Preparedness, Regulatory Services, Functional Area Management and Site Focus teams.
VP Strategy leads our strategic Nuclear strategies. It includes the Innovation team which is charged with transforming the way Nuclear executes day-to-day business ensuring we are continuously improving in order to be cost competitive.
VP Maintain is responsible for the day-to-day maintenance of the generating plants.
Chief Operations
Officer
Chief Nuclear Officer
Site VP Monticello Generating
Plant
Site VP Prairie Island Generating
Plant
VP Fleet Operations
VP Engineering
and Technical Services
Fleet Maintain
VP Strategy

Nuclear Generation 15
Cost Allocation Methodologies The methods used to distribute costs to legal entity and utility include: Operating Company Direct Charges All costs initiated in the Nuclear Generation business area are recorded at the plant level via Xcel Energy financial systems and the nuclear workorder management system. Nuclear maintains a work order management system for accumulating all costs on an activity, project, program, workorder or other appropriate basis. To the extent practicable, time records of hours worked by Xcel Energy and nuclear employees are kept by activity, project, program or workorder.

Nuclear Generation 16
Approvals This document has been checked for errors in calculations and content. Prepared By: /s/ Date: 10/13/2021
Chuck Jacobs
Manager, Nuclear Finance Approved By: /s/ Date: 10/8/2021
Linda Erickson Director, Nuclear Finance
Date:
Peter Gardner SVP and Chief Nuclear Officer
/s/ 10/13/2021

2022 – 2024 Budget Documentation
Transmission

Major Business Functions and Key Activities
Transmission and Operating Services 2
Introduction The Transmission business area oversees all aspects of Xcel Energy’s transmission system, including transmission lines and associated substation assets. The focus of the Transmission business area is to efficiently and effectively plan, construct, operate, and maintain this system in compliance with all regulations and requirements, in a safe and responsible manner, to best meet the reliability and energy needs of our customers and regions. Customer Value The Transmission organization provides customer value through three main operational drivers: New Assets: Includes planning, engineering, permitting and construction of large capital investment commitments and infrastructure modernization. The Transmission business unit manages risks and costs associated with transmission expansion and normal operations through a blended workforce resource. The blended workforce consists of internal and external resources acting as a homogeneous workforce. The external resources allow Xcel Energy to manage the flexibility of resources with transmission and substation construction schedules. Existing Assets: Includes operating, maintaining, restoring, and analyzing performance of the many existing transmission and substation assets. Transmission has many robust programs to address ever increasing reliability standards and compliance requirements that are focused on ensuring ongoing system reliability. In addition, there are efforts that focus on productivity initiatives such as:
• Prioritized work schedules with more structure and transparency to maintenance • More effective and efficient crew composition and scheduling • Appropriately trained and equipped replacements for retirements (including focused training
with simulations, standardized processes, compliance knowledge, etc.) • Continue to strengthen focus on real-time operations, system protection, and commissioning.
The transmission system includes both Transmission line and substation assets. See section below that summarizes the existing assets in the NSPM system. Strategic Business Operations: Planning, Policy, Competitive and Operational Strategy, Communication, and Process which includes comprehensive asset, business and project execution planning for asset development, standards compliance management, business relations and contract management, and operations in the evolving business environment. Strategic operations also includes assessing and integrating multiple drivers and requirements for new or upgraded transmission assets, influencing rules and standards development, regional planning, policy evolution, and facilitating execution and opportunity as well as participation in regional planning, project selection methodology, rule-making and cost allocation development (FERC Order 1000) Electric Transmission and Substations Infrastructure
Transmission Line Miles *
# of Substations, Transmission and
Distribution **
Control Centers
NSPM 5,776 352 1
NSPW 2,679 204 1 PSCo 4,867 236 1

Major Business Functions and Key Activities
Transmission and Operating Services 3
SPS 7,928 457 1 21,250 1,249 4
* FERC FORM NO. 1, 2020 - Line Miles Length measured by pole miles, in the case of underground lines reporting circuit miles. ** FERC FORM NO. 1, 2020 & 10K - Substations which serve only one industrial or street railway customer are not listed.

Major Business Functions and Key Activities
Transmission and Operating Services 4
Major Business Functions and Key Activities Key Organizations and Activities
• Transmission Strategy and Planning – Is responsible for (1) life cycle planning, transmission system planning, and associated capital budgeting; (2) negotiating transmission service-related contracts with generators, transmission owners, and distribution utilities; and (3) resolving wholesale customer transmissions service concerns. In addition, this organization manages Xcel Energy’s participation in key regional projects throughout its service territory, as well as other regional projects on and adjacent to Xcel Energy’s transmission systems, including the NSP System. This group is also responsible for Xcel Energy’s policies and procedures in the competitive transmission acquisition processes pursuant to various requirements of FERC Order 1000. All Transmission Strategy and Planning employees are in the Service Company.
• Business Operations – Provides guidance, consulting, project leadership and performance monitoring for transmission departments on regulatory compliance, strategic planning, and Transmission Resource Optimization business performance improvements. Business Operations emphasizes structured approaches to process improvements, achievement of performance goals, and administration and oversight of compliance processes to ensure adherence to rules mandated by the Electric Reliability Organization, North American Electric Reliability Corporation and Federal Energy Regulatory Commission. All Business Operations employees are in the Service Company.
• Field Operations – Provides transmission line and substation construction, maintenance, and
civil construction services. This area also oversees the Trucking/Hauling functions and includes mainly operating company employees and expenditures, with few Service Company employees.
• Portfolio Delivery and Engineering – Is responsible for capital project management, third-party
contractor management, and securing and managing transmission land rights. This area includes both Service Company and operating company employees and expenditures. Additionally, this group is responsible for transmission line and substation design and engineering, as well as protection system engineering and substation communications. All Portfolio Delivery and Engineering employees are in the Service Company.
• Substation Operations and Maintenance – Is responsible for substation maintenance
engineering, routine and emergency maintenance and operational activities for transmission and distribution substations for all operating companies of Xcel Energy. The organization also provides construction support for capital projects and is responsible for commissioning these new facilities when they are placed in service. This area includes both Service Company and operating company employees and expenditures.
• System Operations – Operates and controls the transmission line facilities and ensures regional reliability. The organization provides real-time planning, system commissioning and energy accounting. This area includes both Service Company and operating company employees and expenditures.
• Asset Management – Responsible for substation field engineering which includes routine and emergency maintenance and operational activities for all Xcel Energy substations. The organization also provides field implementation of certain NERC and Critical Infrastructure Protection (CIP) compliance activities, and “commissioning” new substation facilities. Commissioning of Xcel Energy substation facilities involves ensuring that our substation facilities meet the operational and reliability requirements of FERC and NERC as well as Xcel Energy. The Quality Assurance/Quality Control (QA/QC) process performed by Xcel Energy commissioning engineers and technicians thoroughly tests the equipment and control

Major Business Functions and Key Activities
Transmission and Operating Services 5
systems of our electric substations prior to energizing. This organization is also responsible for system sustainability. System sustainability provides, among other things, electric material and design standards for the design, construction, and maintenance of our transmission assets by interpreting industry standards such as the American National Standards Institute (ANSI). System sustainability is also responsible for developing Xcel Energy’s reliability-centered maintenance programs that ensure the health and reliability of existing assets. These processes establish the baseline performance expected by our operations and maintenance organizations and confirm the performance for compliance standards.

Walk Forward of Major Cost Drivers
Transmission and Operating Services 6
Transmission - NSPM 2022 – 2024 O&M Budget Major Cost Drivers
Dollars in Thousands 2021 Forecast 30,767 Base Pay - 3% 543 Employee Expenses 209 OT Security 338 Other (247) 2022 Budget 31,610 Base Pay - 3% 565 Other 62 2023 Budget 32,237 Base Pay - 3% 583
Other (5) 2024 Budget 32,815

Walk Forward of Major Cost Drivers
Transmission and Operating Services 7
Transmission – NSPM 2022 Budget Major Cost Drivers
Base Pay: The base pay increase of $543K is based on a three percent increase for union and non-union employees. Projects and Initiatives: OT Security: The Operational Technology Security program provides cyber-security to company assets. Efforts will include Security Monitoring & Logging, Vulnerability & Patch Management, Information management / Password Management & Asset Management. This program is an extension of what we perform today for the NERC CIP Medium Assets across a more broad asset base and will be a $338K increase in costs. Other: Continuous improvement efforts driving enhanced productivity and efficiency, in order to achieve aspirational expense targets and offset inflationary pressures, resulted in a $247K decrease. These costs are partially offset by anticipated Employee Expense increases due to the normalization of Covid-19.

Walk Forward of Major Cost Drivers
Transmission and Operating Services 8
Transmission – NSPM 2023 Budget Major Cost Drivers
Base Pay: The base pay increase of $565K is based on a three percent increase for union and for non-union employees.

Walk Forward of Major Cost Drivers
Transmission and Operating Services 9
Transmission – NSPM 2024 Budget Major Cost Drivers
Base Pay: The base pay increase of $583K is based on a 3 percent increase for union and non-union employees.

Walk Forward of Major Cost Drivers
Transmission and Operating Services 10
Labor60%Contract/Consulti
ng11%
Materials7%
Employee Expenses
6%
Reg Fees & Dues11%
Other5%
NSPM Transmission 2022 O&M Budget = $31.6M
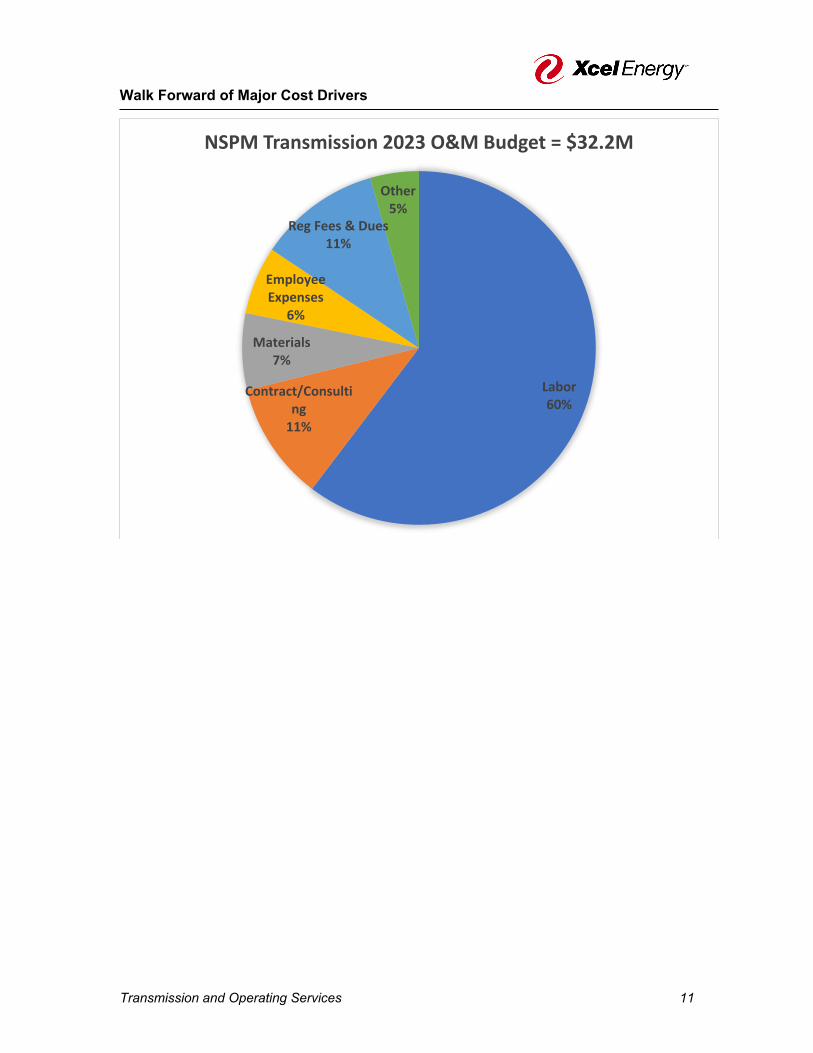
Walk Forward of Major Cost Drivers
Transmission and Operating Services 11
Labor60%
Contract/Consulting
11%
Materials7%
Employee Expenses
6%
Reg Fees & Dues11%
Other5%
NSPM Transmission 2023 O&M Budget = $32.2M

Walk Forward of Major Cost Drivers
Transmission and Operating Services 12

Functional Organization Chart
Transmission and Operating Services 13

Cost Allocation Methodologies
Transmission and Operating Services 14
Operating Company Direct Charges: Employees of the operating companies direct charge their labor and expenses to the legal entity that is receiving the benefit of their service. Direct billed or charged costs are incurred directly by a particular operating company. For example, insurance premiums for operating-company-specific policies are paid by the relevant operating company. These premiums are shown as direct billed to that operating company. Service Company Direct Charges: Service Company Direct costs include those costs incurred by the Service Company on behalf of one operating company. For example, some Budgeting and Management Reporting personnel may be involved in a specific operating company initiative (e.g., a rate case or other regulatory filing). Any Service Company labor hours and costs associated with this initiative are billed directly to the relevant operating company. Employees of the Service Company direct charge their labor costs to the specific legal entities and FERC accounts served whenever possible. Non-labor costs are direct charged when a specific legal entity is served. Transmission expenditures directly charged to NSPM and NSPW are included in the Interchange Agreement and shared between the two operating companies. Service Company Allocated Charges: Service Company Allocated costs would include those costs for which a unique operating company cannot be determined or which are incurred on behalf of all operating companies. For example, general Budgeting and Management Reporting services are provided on a centralized basis for all Xcel Energy legal entities. The Service Company labor hours and costs associated with these services are allocated to the legal entities using SEC-approved allocation methodologies. The primary methods utilized for each service area are described above. Please see Exhibit__(RLB-1), Schedule 4 for a complete list of the Company's allocators.
Allocating Cost Center
JDE Subledger
Code
Allocating Cost
Center Name
Description
200116 441 Distribution Electric
Supervision & Engineering (S&E) FERC
580
Distribution Electric Supervision & Engineering (S&E) FERC 580 services includes the labor and expenses incurred in the general supervision and direction of the operation of the electric distribution system.
200122 442 Transmission Electric
Supervision & Engineering (S&E) FERC
560
Transmission Electric Supervision & Engineering (S&E) FERC 560 services include labor and expenses incurred in the general supervision and direction of the operation of the electric transmission system as a whole.
200125 449 Transmission Electric
Supervision & Engineering
(S&E) NSPM & NSPW FERC 560
Transmission Electric Supervision & Engineering (S&E) NSPM & NSPW FERC 560 services include labor and expenses incurred in the general supervision and direction of the operation of the electric transmission system as a whole. This allocation is used when NSPM and NSPW are the only jurisdictions benefiting from the services.

This document has been checked for errors in calculations and content. Prepared By: Date:
Approved By: /s/ Date:
Erica Meyer Olson Director, Transmission Finance
Date:
Michael Lamb Senior Vice President, Transmission
10/13/2021
10/13/2021 /s/

2022 - 2024 Budget Documentation
Distribution Operations and Gas Engineering & Operations Business Areas

Major Business Functions and Key Activities
Distribution Operations 2
Narrative Overview This narrative covers the Distribution Operations and Gas Engineering & Operations business areas that are supported by the testimony of Ms. Kelly A. Bloch. These business areas work together to support both electric and gas customers. This narrative is focused on the work done by these organizations for the NSPM electric utility. It is organized as follows: Distribution Operations
• Introduction • Customer Value • Spend by functional area (Electric utility) • Headcount information
Gas Engineering & Operations
• Introduction • Customer Value • Spend by functional area (Electric utility) • Headcount information
Financial information (for the combined organizations)
• 2021 to 2022 walkforward • 2022 budget by cost category • 2022 to 2023 walkforward • 2023 budget by cost category • 2023 to 2024 walkforward • 2024 budget by cost category
Distribution Operations The NSPM Distribution Operations organization provides for the safe and reliable delivery of natural gas and electric service to customers in Minnesota, North Dakota, and South Dakota. It contains the following key areas: Distribution Operations, Control Center, Metering, Distribution Engineering, Distribution Business Operations, and Continuous Improvement & Performance Planning. Each is summarized below.
• Distribution Operations – Jurisdictional operators consisting of Design, Construction, and Maintenance.
• Distribution Control Center – Electric Distribution Control Center Operations including Electric Trouble Operations/Emergency Response.
• Distribution Metering/Advanced Grid Intelligence and Security (AGIS) – Gas/Electric Metering Systems and Support plus organization responsible for the deployment/implementation of AGIS
• Distribution Engineering – Technical Support and System Planning • Distribution Business Operations – Vegetation Management, Outdoor Lighting, Facility
Attachments, Builders Call-Line, Service Policy and Center of Excellence • Centralized Scheduling – mid and long-range work scheduling • Continuous Improvement & Performance Planning – Performance Management and
Business Planning, Design Strategy, Business Integration, and Distribution Change Management

Major Business Functions and Key Activities
Distribution Operations 3
Customer Value Distribution Operations seeks to continuously add customer value by maintaining a safe and reliable electric distribution system as well as supporting the Gas Organization in the areas of Gas Design, Business Operations, and Metering Support for the effective delivery of natural gas and electric service to our customers. We accomplish this by making prudent investments in the delivery system for the purposes of adding capacity, improving reliability, and replacing assets as necessary to maintain reliable and safe system performance. We also provide for safe and reliable performance through routine and prudent maintenance activities on the distribution system. Distribution Operations budgets for various electric and gas maintenance and asset replacement programs specifically for this purpose.
Note: Service Company employees provide supports to all of Xcel Energy Operating Companies. OpCo budget assumptions for Service Company employees are based on overall line miles and miles of gas main in all the service territories. Gas Engineering and Operations Introduction The Gas Engineering and Operations organizational focus is driving a proactive safety culture for both the public and our employees, developing and driving a gas strategy for the gas utility (which includes the gas organization as well as gas employees in the distribution organization), ensuring compliance, managing the risk of gas assets, managing costs for projects and programs, and engaging employees. The Gas Engineering and Operations business area is comprised of the following major areas: Gas Engineering, Gas Construction & Operations, Gas Governance, Project Delivery & Tech Services, Gas Systems Strategy & Business Operations, and Gas Utility Infrastructure Costs (GUIC). Customer Value The Gas Engineering and Operations business area is responsible for ensuring compliance with all federal, state, and Xcel Energy codes, regulations, and standards. By having public and employee safety as one of our main objectives, we evaluate the risk on our gas systems and recommend appropriate actions to mitigate these risks. We promote a pro-active approach to risk mitigation and problem resolution. We actively help shape new regulations, provide oversight and drive for consistent standardization across all gas areas. While most of the work done by this organization is in support of the gas utility, it is also responsible for managing the damage prevention function, which involves locating underground electric and gas facilities. This function accounts for almost all of the electric utility spend for this business area. There is also a small amount of spend for geospatial mapping of underground electric and gas assets. The Gas Engineering and Operations work area is responsible for delivering data integrity to ensure the data warehouse has accurate information for report generation and ensuring the overall integrity of the GIS system is maintained. This work includes both gas and electric distribution. This department is also responsible for the maintenance of the GIS landbase, AutoCAD mapping, and all other gas and electric mapping systems. The organization also ensures consistent standards are maintained in all mapping products for gas and electric delivery systems as well as ensuring the successful coordination of all GIS data acquisition and land data sharing activities.
Major Business Functions and Key Activities
Distribution Operations 4
The Organization is also responsible for the safe and efficient construction and operation of the gas transmission system, gas distribution system, peak shaving plants (Liquefied Natural Gas (LNG) and Liquefied Petroleum Gas (LPG) plants) and the quality of service to NSPM customers. The organization coordinates the responses and communications regarding the resolution of emergency, outage and other quality of service situations for the gas distribution system. This organization provides 24-hours-a-day, seven-days-a-week emergency response dispatching coverage for gas trouble orders, and provides the first responders to gas emergency orders for the St. Paul metropolitan area. Financial Information The NSPM Distribution Operations and Gas Engineering and Operations business areas overall electric utility O&M budgets will increase over the next three years from $121.0 million in 2021 to 132.9 million in 2024. This overall increase is primarily driven by programs such as Vegetation Management and Damage Prevention. Aside from these programs, the Distribution Operations organization expects to see labor and contract inflation increases over the next few years, partially offset by savings from continuous improvement initiatives.

2022 Electric Walk Forward of Major Cost Drivers
Distribution Operations 5
Advanced Grid and Information Security (AGIS) Program
• Deployment of our various AGIS programs began in 2019 and will continue to ramp up an additional $0.8M in 2022. As discussed by Company Witness Mr. Benj Halama, these costs are substantially recovered through the Transmission Cost Recovery rider rather than base rates.
Vegetation Management, Damage Prevention, Electric Vehicles • Expanding Corporate Strategic Programs in 2022 that will improve grid reliability, prevent
damage, and enhance the customer experience. One year Insourcing Damage Prevention Project in 2022 that caused $1.9M increase.
O&M from Capital Growth • Capital Investments in NSPM are increasing over $220M (60%) from 2021 to 2024. This
will cause additional O&M as some Capital Investments have small O&M components.
Inflation • Labor escalation is based on an average three percent base pay increase for non-union
employees and three percent for union employees. • Non-Labor escalation is based on an average of one percent increase annually.
Continuous Improvement
• Distribution operations has various continuous improvement saving efforts over the five-year budget period. These continuous improvements are expected to drive efficiency gains while executing work in the field. This is expected to result in a ($3.0M) O&M reduction.
2021 July Year-End Forecast 121.0$
Major DriversAGIS 0.8$ Vegetation Management 2.1$ Damage Prevention 1.9$ Electric Vehicles 0.3$ O&M from Capital Growth 1.5$ Inflation 3.0$ Continuous Improvement (3.0)$ Other 0.1$
2022 Budget 127.7$
Distribution Operations - Northern States Power Minnesota (Electric Utility)Walk Forward (Dollars in Millions)

2022 Distribution Operations and Gas Engineering & Operations NSP Minnesota Electric Utility O&M Budget Major Cost Drivers
Distribution Operations 6

2023 Electric Walk Forward of Major Cost Drivers
Distribution Operations 7
Advanced Grid and Information Security (AGIS)
• 2022 is expected to be the largest investment year for the AGIS program. Program continues field deployment in 2023 but at a slightly decreased rate.
Vegetation Management, Damage Prevention, Electric Vehicles • Expanding Corporate Strategic Programs in 2023 that will improve grid reliability, prevent
damage, and enhance the customer experience. One year Insourcing Damage Prevention Project in 2022 that caused program to slightly decrease in 2023.
O&M from Capital Growth • Capital Investments in NSPM are increasing over $220M (60%) from 2021 to 2024. This
will cause additional O&M as some Capital Investments have small O&M components. Inflation
• Labor escalation is based on an average three percent base pay increase for non-union employees and three percent for union employees.
• Non-Labor escalation is based on an average of one percent increase annually Continuous Improvement
• Distribution operations has various continuous improvement saving efforts over the five-year budget period. These continuous improvements are expected to drive efficiency gains while executing work in the field. This is expected to result in a ($2.0M) O&M reduction.
2022 Budget 127.7$
Major DriversAGIS (1.3)$ Vegetation Management 2.7$ Damage Prevention (0.6)$ Electric Vehicles 0.3$ O&M from Capital Growth 1.5$ Inflation 3.0$ Continuous Improvement (2.0)$ Other 0.3$
2023 Budget 131.6$
Distribution Operations - Northern States Power Minnesota (Electric Utility)Walk Forward (Dollars in Millions)

2023 Distribution Operations and Gas Engineering & Operations NSP Minnesota Electric Utility O&M Budget Major Cost Drivers
Distribution Operations 8

2024 Electric Walk Forward of Major Cost Drivers
Distribution Operations 9
Advanced Grid and Information Security (AGIS)
• Continued reduction in field deployments for our various AGIS programs in 2024 at an estimated decrease of $0.6M.
Vegetation Management, Damage Prevention, Electric Vehicles
• Expanding Corporate Strategic Programs in 2024 that will improve grid reliability, prevent damage, and enhance the customer experience.
O&M from Capital Growth
• Capital Investments in NSPM are increasing over $220M (60%) from 2021 to 2024. This will cause additional O&M as some Capital Investments have small O&M components.
Inflation
• Labor escalation is based on an average three percent base pay increase for non-union employees and three percent for union employees.
• Non-Labor escalation is based on an average of one percent increase annually Continuous Improvement
• Distribution operations has various continuous improvement saving efforts over the five-year budget period. These continuous improvements are expected to drive efficiency gains while executing work in the field. This is expected to result in a ($3.0M) O&M reduction.
2023 Budget 131.6$
Major DriversAGIS (0.6)$ Vegetation Management 0.2$ Damage Prevention 0.2$ Electric Vehicles 0.3$ O&M from Capital Growth 1.5$ Inflation 3.0$ Continuous Improvement (3.0)$ Other (0.3)$
2024 Budget 132.9$
Distribution Operations - Northern States Power Minnesota (Electric Utility)Walk Forward (Dollars in Millions)

2024 Distribution Operations and Gas Engineering & Operations NSP Minnesota Electric Utility O&M Budget Major Cost Drivers
Distribution Operations 10

Cost Allocation Methodologies
Distribution Operations 11
The methods used to distribute costs to legal entity and utility include: Operating Company Direct Charges: The Distribution Operations and Gas Engineering & Operations organizations operating company employees direct charge their labor and expenses to the legal entity that is receiving the benefit of their service. Service Company Direct Charges: The Distribution Operations and Gas Engineering & Operations organizations Service Company employees direct charge their labor and expenses to the legal entity that is receiving the benefit of their service whenever possible. Service Company Allocated Charges: The primary methods utilized for each service area are described below. Please see Exhibit__(RLB-1), Schedule 4 for a complete list of the Company's allocators.
Allocating Cost
Center
JDE Work Order No. Allocating Cost
Center Name Description
200116 441 Distribution Electric Supervision & Engineering (S&E) FERC 580
Distribution Electric Supervision & Engineering (S&E) FERC 580 services includes the labor and expenses incurred in the general supervision and direction of the operation of the electric distribution system.
200117 453 Distribution Electric Metering FERC 586
Distribution Electric Metering FERC 586 services include labor, materials used, and expenses incurred in the operation of customer meters and associated equipment (e.g. electric distribution meters standards and development, meter purchases, etc.
200126 423; 440; 525 Utilities Group Administrative & General (A&G) FERC 921
Utilities Group Administrative & General (A&G) FERC 921 services includes the labor and non-labor costs for utilities group leadership, management and support services for the Distribution, Transmission, transportation and supply chain areas.
200129 454 Distribution Gas Meters and House Regulators FERC 878
Distribution Gas Meters and House Regulators FERC 878 services include the cost of labor, materials used and expenses incurred in connection with removing, resetting, changing, testing, and servicing customer meters and house regulators.

Approvals
Distribution Operations 12
This document has been checked for errors in calculations and content. Prepared By: /s/ Date:
Nate Auer
Financial Consultant, Distribution Business Area Finance Approved By: /s/ Date:
Brian Broadwell Director, Distribution Business Area Finance
Date:
Kelly Bloch VP, NSP Distribution Operations
10/12/2021
10/8/2021
10/12/21 /s/

Operation Services
2022 - 2024 Budget Documentation
Operation Services
Major Business Functions and Key Activities
Operation Services 2
Introduction Operation Services includes Executive VP (EVP) Operations, Chief of Staff, Supply Chain and Commercial Operations. Alignment seeks to standardize processes, share best practices, and efficiencies of scale to improve productivity and control operating costs. The organization’s primary responsibility is to provide for the safe and reliable generation, transmission and distribution of electricity and natural gas to customers. Customer Value A centralized Operations organization facilitates economies of scale and knowledge transfer. Efficiency and productivity efforts across the Operations organization have helped offset rising costs and limited the growth in operating and maintenance expenses, as well as improved the cost efficiency of our capital projects.

O&M Budget Major Cost Drivers
Operation Services 3
Operation Services – NSPM O&M Budget Major Cost Drivers for Xcel Energy
Labor, 89%
Employee Expenses, 3%
Online Information, 2%
Outside Services, 2%
Dues, 2%
Workforce Admin Expense,
1%Other, 1%
2022 NSPM O&M Operations Services $7.1M
Labor, 91%
Employee Expenses, 3%
Online Information, 2%
Outside Services, 1%
Dues, 2%
Workforce Admin Expense,
1%Other, 1%
2023 NSPM O&M Operations Services $7.1M

O&M Budget Major Cost Drivers
Operation Services 4
Labor – Ops Services represents EVP Operations, Chief of Staff, Supply Chain and Commercial Operations. Labor also includes our Supplemental Incentive Program (SIP). Employee Expenses – Employee expenses for travel, continued education, and professional conferences. All Other – Online Information, Outside Services, Dues, Workforce Admin and Other.
Labor, 91%
Employee Expenses, 3%
Online Information,
2%
Outside Services, 1%
Dues, 2%
Workforce Admin
Expense, 1%Other, 1%
2024 NSPM O&M Operations Services $7.3M

Walk Forward of Major Cost Drivers
Operation Services 5
Dollars in Thousands (NSPM) 2021 July Year-End Forecast 7,785 Base Pay - 3% 147 Other Increases 156
Non-labor increases from one-time 2020 reductions 156
Other Decreases
(1,019)
Supplemental Incentive Plan for the Trading Organization
(1,182)
Labor force job code changes 164
2022 Budget 7,070 Base Pay - 3% 163 Other Increases
2
Workforce Administration 2
Other Decreases
(142)
Supplemental Incentive Plan for the Trading Organization
(49) Other non-labor reductions (51) Professional Fees (43) 2023 Budget 7,092 Base Pay - 3% 162
Other Increases 2
Work Force Administration 2
Other Decreases
(3) Supplemental Incentive Plan for the Trading Organization (3) 2024 Budget 7,252

Functional Organization Chart
Operation Services 6
EVP Operations FTE – 2
Total Ops Services FTE -695
Chief of Staff
FTE – 9
Commercial Operations
FTE - 101
Supply Chain
FTE - 583
Strategic Sourcing Process Governance & Performance
Strategic Planning
Fleet Management
Nuclear Supply Chain
Material Logistics
Major Capital Projects
Gas Supply and Planning
Market Operations and Analytics
Fuel Supply Operation
Energy Trading and Origination
Power Operations

Functional Organization Chart
Operation Services 7
Operations Services, under the EVP Operations, consist of Chief of Staff, Supply Chain, and Commercial Operations. Executive Vice President of Generation The Executive Vice President of Generation department consists of the Executive Vice President of Generation and an administrative assistant. The main accountabilities of the Executive Vice President of Generation department are to set the direction of the operations business plan, guide operations according to the established business plan, and provide guidance and support for the operations of Energy Supply and Nuclear, while also supporting the other areas of Operations, which include Distribution Operations, Gas Engineering & Operations and Transmission through the following business areas: • Chief of Staff • Commercial Operations • Supply Chain
Chief of Staff The Chief of Staff is responsible for: • Boosting productivity and performance through key improvements, particularly in our operations and
generations areas, which allows us to further contribute to the company’s bottom line in these uncertain economic times;
• Adding customer value by continuing to provide customers with reliable service and affordable power, today and well into the future;
• Working smarter by automating and streamlining essential work processes and procedures; and • Mitigating risk by ensuring employee knowledge transfer – capturing and retaining the hard-earned
expertise of our veteran employees for the ongoing benefit of future generations of employees. Commercial Operations The Commercial Operations area provides power operations, fuel procurement and energy trading services for Xcel Energy Operating Companies electric customers. Core functions include the following: Fuel Supply, Gas Supply & Gas Resource Planning • Fuel Supply is responsible for the purchase of fuels required to operate the power plants for the four
operating companies. Xcel Energy uses a strategy to diversify fuel sources to reduce fuel availability risks and secure more competitive bid prices, which potentially reduces customers’ fuel costs. The following departments fall under this organization: Fuel Supply Operations (solid fuels), Gas Resource Planning (gas commodity), and Gas Supply & Planning (pipeline transmission).
• Procures and manages annual coal Xcel Energy’s various jurisdictions; • Develops long-term test burn strategies for the company's coal plants; • Coordinates rail transportation of coal; • Purchases and schedules the transportation of natural gas; and • Plans for long-term gas commodity and transportation needs Power Operations • Manages the portfolio of Company owned generation and resources under long-term contracts to ensure
safe, reliable, and economic supply of electricity to customers • Dispatches electric generation resources and interfaces with regional electricity markets • Coordinates maintenance of system resources, including both season maintenance scheduling and urgent
needs

Functional Organization Chart
Operation Services 8
Trading Origination • Buys and sells wholesale electric capacity and energy for long-term transactions for proprietary and
regulated asset books; • Maintains market knowledge in regions surrounding operating companies; • Acquires transmission service to support the above requirements. Market Operations • Guides the company’s participation in existing and new regional transmission organizations • Participates in the development of regional electric reliability standards and in establishing business
practices and related commercial standards • Interacts with state and federal regulatory agencies, as well as independent market monitors, regarding
market operations and related activity Supply Chain The Supply Chain organization is designed to reduce overall costs of asset ownership through sourcing savings; improving operational performance in support of the operating companies and business units; managing risk inherent in contracting goods and services; and supporting Xcel Energy’s social and environmental leadership. The following departments fall under this organization and are responsible for the sourcing and procurement of goods and services for Xcel Energy; materials management supporting the of Energy Supply, Nuclear, Distribution Operations, Gas Engineering & Operations and Transmission business areas; investment recovery; and Xcel Energy’s fleet management functions: • Strategic Sourcing • Major Capital Projects • Material Logistics • Process Governance & Performance • Strategic Planning • Fleet Management • Nuclear Supply Chain Strategic Sourcing Strategic Sourcing provides services which include selecting and negotiating with suppliers, preparing bid packages and analyzing bids, managing contracts, and procuring goods and services needed by Xcel Energy. Goods and services are procured through a competitive bidding process that includes not only evaluation of price and other criteria such as the reliability of the supplier and its ability to meet the bid specifications. This process is applied to most goods and services contracts. Major Capital Projects Major Capital Projects provides services which include selecting and negotiating with suppliers, preparing bid packages and analyzing bids, managing contracts, and procuring of goods and services needed for major capital projects and Energy Supply sourcing, including, but not limited to, the construction of renewable power generation and construction of transmission power lines or substations. Material Logistics Material Logistics provides services which include materials and supplies inventory management for the four operating companies for Energy Supply, Nuclear, Gas, Transmission and Distribution. This includes responsibility for storeroom operations to receive and issue materials, perform inventory cycle counts, material strategy/planning/forecasting, provide equipment and material control and accounting in coordination with the Finance department. In addition, these services include establishing policies and procedures to provide appropriate and consistent inventory management practices throughout the business areas. Also included in this area is the salvaging and selling of materials that are no longer in use or used materials such as copper wire removed from retired facilities then recycled and resold.

Functional Organization Chart
Operation Services 9
Process Governance and Performance They assist the Supply Chain organization with the implementation of sustainable improvements for critical processes, and they ensure we have the right IT systems and that they are utilized appropriately. Strategic Planning Strategic Planning works to develop and manage a high-level Sourcing plan and SRM Program, and to provide commodity and spend analysis and reporting in order to support Supply Chain objectives. Fleet Management Fleet Management provides services which include working with the four operating companies to determine its vehicle requirements, performing life cycle analysis of the fleet, setting maintenance schedules, managing the garage functions and developing standards for the types of vehicles needed. The size of the vehicle fleet and the types of vehicles needed are analyzed to ensure that Xcel Energy is efficiently utilizing its fleet. For example, renting may be recommended for a specialty truck that would sit in the yard and be used only a few times in a year resulting in a reduction in the number of vehicles. By setting appropriate maintenance schedules, the life cycle of the equipment is maximized. Nuclear Supply Chain Nuclear Sourcing and Materials Management supports the functions of engineering, nuclear fuel supply, regulatory assurance and supply chain activities to provide strategic direction and uphold the standards of excellence in these organizations.

Cost Allocation Methodologies
Operation Services 10
The allocation methods used to distribute costs to legal entity and utility include: Operating Company Direct Charges Costs incurred directly by a particular operating company. For example, the relevant operating company pays insurance premiums for operating-company-specific policies. These premiums are shown as direct charges to that operating company. Service Company Direct Charges Costs incurred by the Service Company on behalf of an operating company. For example, some Budgeting personnel may be involved in a specific operating company initiative (e.g., a rate case or other regulatory filing). Any Service Company labor costs associated with this initiative are billed directly to the relevant operating company. Service Company Allocated Charges Costs for which a unique operating company cannot be determined, or which are incurred on behalf of all operating companies. For example, general Budgeting services are provided on a centralized basis for all Xcel Energy legal entities. The Service Company labor costs associated with these services are allocated to the legal entities using allocations. The primary methods utilized for each service area are described below. Please see Exhibit__(RLB-1), Schedule 4 for a complete list of the Company's allocators.
Allocating Cost
Center
JDE Subledger
Code
Allocating Cost Center
Name
Description 200063 110 Executive -
Corporate Governance
Executive Corporate Governance includes the labor and non-labor costs for executive corporate management, long-term business strategy development and other programs that ensure the continuity and development of management. Corporate governance activities are generally services that are performed on behalf of all Xcel Energy operating companies and affiliates, including Xcel Energy Inc.
200132 413 Payment & Reporting
Payment & Reporting services includes the labor and non-labor costs associated with processing payments to vendors, providing audit research and reconciliation support for Accounts Payable transactions, preparing statistical and 1099 reporting, and administering the purchase card programs.
200134 144 Proprietary Trading - Front/Mid Office
FERC 557
Proprietary Trading - Front/Mid Office FERC 557 includes the labor and non-labor costs associated with proprietary trading activities which are short term transactions undertaken in the wholesale electric markets where electricity is purchased for the purpose of selling it. Also included are supporting activities: evaluating the credit worthiness of counterparties, reviewing contracts to ensure that regulations are being complied with, evaluating profitability and appropriateness of trades to ensure they are in the best interest of shareholders and rate payers, and ensuring that trades identified as proprietary appropriately fall into that category.
200136 415 Energy Markets - Fuel
Energy Markets - Fuel includes the labor and non-labor costs for planning and implementing power supply portfolios to provide reliable service to native load and to capitalize on market opportunities including purchasing fuel for the operating companies' electric generation system (excluding nuclear) and resource planning and acquisition including purchase power and account management.

Cost Allocation Methodologies
Operation Services 11
Allocating
Cost Center
JDE Subledger
Code Allocating Cost
Center Name
Description 200146 429 Energy Markets -
Regulated Trading Energy Markets - Regulated Trading services include the labor and non-labor costs of providing electric trading services to the operating companies' electric generation systems, including load management, system optimization and origination.
200174 145 Generation Trading/Native
Hedge - Mid Office FERC 557
Generation Trading/Native Hedge - Mid Office FERC 557 includes the labor and non-labor costs associated with independent evaluation and risk measurement of trading and generation book transactions, including preparing daily P&L (profit and loss) reports and individual trader profit and loss reports for the prop book, daily generation book valuation reports for each system showing all net fuel positions and any forward sales values and/or hedges, ensuring that margin reporting follows all SEC rules and GAAP reporting and that credit and risk policies and procedures are complied with.

Approvals
Operation Services 12
This document has been checked for errors in calculations and content. Prepared By: /s/ Date:
Piera Huffman
Financial Consultant Approved By: /s/ Date:
Erica Meyer Olson Director, Transmission Finance & Ops Services Finance Approved By: /s/ Date:
Sangram S Bhosale VP – Supply Chain Approved By: /s/ Date:
John T Welch VP - Commercial Operations
10/17/2021
10/13/2021
10/15/2021
10/21/2021
2022 - 2024 Budget Documentation
Benefits

Major Business Functions and Key Activities
Benefits 2
BENEFIT COSTS PROCESSED THROUGH THE LABOR LOADING PROCESS ARE ALLOCATED FOLLOWING LABOR. THEREFORE, ALL LABOR LOADING COSTS ARE REFLECTED IN THE LABOR LOADING ACCOUNTS ASSOCIATED WITH EACH BUSINESS AREA. ALL BUSINESS AREAS PROVIDE EXPLANATIONS EXCLUDING THESE LABOR LOADING COSTS, AS THE BENEFITS AREA IS RESPONSIBLE FOR EXPLAINING THEM. THESE COSTS ARE BEST UNDERSTOOD AND EXPLAINED AT THE CORPORATE LEVEL, NOT AT THE INDIVIDUAL BUSINESS AREA LEVEL, AND THEREFORE ARE EXPLAINED AS A WHOLE IN THE BENEFITS AREA. THIS SECTION IS A SUMMARY OF THOSE COSTS. Health & Welfare Active Health Care The active health care budget consists of active employee healthcare costs. Active employee healthcare includes costs associated with medical, dental, prescription drug and vision plan options. Cigna, Delta Dental, Express Scripts and Vision Service Plan (VSP) provide these plan options. The budget calculations for Xcel Energy’s active healthcare programs are based on trended claims and administration fee experience related to each plan. An outside actuarial consulting company, Willis Towers Watson, provides these budget cost estimates. Life Insurance Group life and accidental death and dismemberment insurance costs are developed based on premium negotiations between Xcel Energy and insurance vendors. Life insurance plans are provided by MetLife. The budget calculations are provided by Benefits Accounting. Post Retirement Medical Xcel Energy accrues for post-retirement medical costs under accounting rule FAS 106. The net periodic post-retirement cost consists of service cost, interest cost, return on plan assets and the amortization of prior service costs and plan gains and losses caused by deviations from plan assumptions. Willis Towers Watson provides the budget cost estimates. Long-term Disability Xcel Energy accrues for long-term disability under accounting rule FAS 112 for all NSP bargaining employees disabled before 1/1/2014 and all other employees disabled before 1/1/2008. All employees disabled after these dates are covered under a fully insured plan. Accounting rule FAS 112 requires an accrual for all future expected disability benefit payments for employees who Xcel Energy believes will not return to work. Willis Towers Watson provides these budget cost estimates. The fully insured plan for long-term disability insurance is provided by The Hartford and the budget calculations are provided by Benefits Accounting. Miscellaneous Benefits Programs and Costs Xcel Energy provides numerous other health and welfare benefits to employees. They consist of programs such as the Employee Assistance Program, adoption assistance, leave administration, business travel accident insurance, health improvement programs, tuition reimbursement program, the HR Service Center to answer benefits and payroll questions, monthly maintenance fees for health saving accounts and the administration of flex spending accounts that include health, dependent care and transportation. Budget calculations are based on prior year trends, anticipated costs and administration fee experience related to each program.

Major Business Functions and Key Activities
Benefits 3
Pension & Retirement Related Pension There are four different pension plans that include a variety of pension formulas. The pension formulas include Pension Equity, NSP Traditional, NCE Account Balance, PSCo Traditional, SPS Traditional and 5 Percent Cash Balance. Xcel Energy Services, NSPW, Public Service Company of Colorado (PSCo) and Southwestern Public Service Company (SPS) recognize pension costs under ASC 715 (formerly FAS 87). NSPM continues to recognize pension costs based on the aggregate cost method (ACM). However, ASC 715 was adopted as required for GAAP accounting. The difference between ASC 715 and the ACM is recorded as a deferred credit as allowed by FAS 71. Willis Towers Watson provides the budget cost estimates. 401(k) Match There are three 401(k) Savings Plans (SPS, PSCo and Xcel Energy 401(k) Savings Plan). The 401(k) plan is a retirement savings plan for employees. Effective 5/6/2002, the Xcel Energy Employee Stock Ownership Plan was merged into the Xcel Energy 401(k) Savings Plan. There is also a retirement plan (NMC Savings and Retirement Plan) which contains a 401(k) component, with an employer matching contribution as well as an additional company non-contributory component. The Vanguard Group is our current record keeper and trustee for the 401(k) and NMC plans. The Plans are funded through voluntary pre-tax and after-tax contributions from participants and additional matching contributions from Xcel Energy. The 401(k) match and the NMC non-contributory match are included in the benefits budget and are calculated by Benefits Accounting. The budget calculations are based on prior year trends, adjusted for salary increases and anticipated changes, if any. Miscellaneous Items Other items also included are nonqualified pension which includes supplemental employee retirement plans (SERP), retirement related consulting costs, compensation consulting costs and deferred compensation. These budget estimates are provided by Willis Towers Watson, Benefits Accounting and the Total Compensation department.
Incentive and Recognition Annual Incentive The individual annual incentive budget is based on current eligible employees, their base salary and any applicable assumed base salary increases, and the percent of targeted incentive.
Xcel Energy’s Total Compensation department provides the incentive accruals and budget calculations. For NSPM and NSPW, annual incentive is not part of the benefit labor loadings; it is recorded directly in operations & maintenance (O&M). Performance-based Restricted Stock Units Performance-based Restricted Stock Units (PBRSU) seek to link the interest of executives and select employees with customers and shareholders. Key determinants for the grants are: (a) meeting certain time-based criteria, (b) Total Shareholder Return (TSR) ranking, and (c) attainment of certain environmental emissions reduction targets. If the performance measure in the grant is not achieved at the three year measurement, all associated PBRSU’s are forfeited. The actual number of PBRSU’s and the grant price of the units are based on the closing market price of Xcel Energy common stock on the date of grant,
Major Business Functions and Key Activities
Benefits 4
competitive practices and position. Units vest at the end of the three year service period after the date of grant with graded payouts dependent on meeting different levels of performance. The budget reflects 100 percent of target performance. The values for the future grants are provided by the Total Compensation department. These costs are recorded directly in O&M and do not go through the labor loading process. Performance Share Plan The Performance Share Plan provides executives with the potential to earn awards based on company performance relative to peer companies on two performance measurements: Total Shareholder Return (TSR) and stock price. TSR is measured cumulatively over a three-year period using overlapping cycles. Company TSR is measured against the executive compensation peer group. At the end of each three-year performance period, executives receive an award that correlates the extent to which the Company’s TSR out-performs or under-performs the peer group. Potential payouts of the awards range from zero to 200%. They are paid based on the closing stock price on the day before the Board of Director’s approval. The Total Compensation department and Benefits Accounting provides the budget estimates, and the budget reflects 100% or target performance. These costs are recorded directly in O&M and do not go through the labor loading process. Other Also included are the following:
• Years of Contribution program (service anniversary awards). The Total Compensation department provides the budget estimates.
• Employee performance recognition, which consists of Above & Beyond awards, company store items and recognition meals presented to acknowledge employees for a specific business-related action or result that aligns with the Company’s overall strategic priorities. The Total Compensation department provides the budget estimates.
• Spot On Awards, a performance based cash award program for non-exempt employees. The Total Compensation department provides the budget estimates.
These costs are recorded directly in O&M and do not go through the labor loading process. Workers Compensation Xcel Energy provides workers compensation benefits under the FAS 112 accounting standard to employees who are former or inactive employees after employment, but before retirement. Post-employment benefits are all types of benefits provided to former or inactive employees, beneficiaries and covered dependents. Those benefits include, but are not limited to, salary continuation, supplemental unemployment benefits, severance benefits and disability related benefits (including workers compensation). Willis Towers Watson provides this budget cost estimate. Xcel Energy also pays claims for employees who were injured prior to 8/1/2001 when the Company was self-insured. For employees who experience injuries after 8/1/2001, all workers compensation benefits are covered under an insured program. The only cost to Xcel Energy for this benefit cost is the insurance premium. The Hazard Insurance department within Xcel Energy provides the budget estimate for the insurance premium, which is obtained from outside vendors.

2022-2024 Major Cost Categories
Benefits 5
Cost Components Benefits NSPM
O&M and Non-Service (1) 2022 Budget
Pension & Retirement Related $38,544 Health & Welfare 46,460 Workers Compensation 2,041 Incentive & Recognition 53,695 Non-Service (non-O&M) (4,711) Total $136,029
(1) O&M and Non-Service is now used instead of O&M. New FASB guidance (ASU No. 2017-07) establishes that only the service cost component of pension cost may be presented as a component of operating income. As a result, all non-service costs are recorded to other income/expense (non-O&M). In order to capture all of the expense, and be comparable to prior cases, both O&M and non-service costs were included. This guidance did not impact FERC.
Health & Welfare – The major cost categories are healthcare (medical, pharmacy and dental costs) for both active employees and retirees, long-term disability costs, life insurance and various other programs and health and welfare related costs. Pension & Retirement Related – The major cost categories are qualified and nonqualified pension costs, 401(k) match costs, employer retirement contribution for nuclear bargaining employees and retirement related consulting costs. Incentive & Recognition – The major cost categories are annual incentive, performance based restricted stock units, performance share plan, deferred compensation interest, Spot On Awards, corporate recognition and the Years of Contribution (Service Anniversary Program). Workers Compensation – The major cost categories are workers compensation insurance premiums and FAS 112 workers compensation expense.
Pension & Retirement
Related28.3%
Health & Welfare34.2%
Workers Compensation
1.5%
Incentive & Recognition
39.5%
Non-Service-3.5%
Benefits NSPM O&M and Non-Service (1)
2022 Budget = $136.0M

2022-2024 Major Cost Categories
Benefits 6
Cost Components Benefits NSPM
O&M and Non-Service 2023 Budget
Pension & Retirement Related $38,000 Health & Welfare 47,671 Workers Compensation 2,028 Incentive & Recognition 55,982 Non-Service (non-O&M) (5,128) Total $138,553
Pension & Retirement
Related27.4%
Health & Welfare34.4%
Workers Compensation
1.5%
Incentive & Recognition
40.4%
Non-Service-3.7%
BenefitsNSPM O&M and Non-Service
2023 Budget = $138.6M

2022-2024 Major Cost Categories
Benefits 7
Cost Components
Benefits NSPM O&M and Non-Service
2024 Budget Pension & Retirement Related $38,288 Health & Welfare 50,124 Workers Compensation 2,016 Incentive & Recognition 58,247 Non-Service (non-O&M) (8,278) Total $140,397
Pension & Retirement
Related27.3%
Health & Welfare35.7%
Workers Compensation
1.4%
Incentive & Recognition
41.5%
Non-Service-5.9%
Benefits NSPM O&M and Non-Service
2024 Budget = $140.4M

Budget Walk Forward
Benefits 8
This section includes a high level walk forward schedule of the business drivers and amounts that comprise the majority of increases and/or decreases in costs beginning with the 2021 forecast, to the 2022 budget, 2023 budget and ending with the 2024 budget. NSPM Summary - 2021 Forecast to 2022 Budget
(6,094)
632
(274)
(1,622)
($7,000)
($5,000)
($3,000)
($1,000)
$1,000
$3,000
BENEFITS NSPM O&M and Non-ServiceDrivers of $7.4M Decrease from 2021 Forecast to 2022 Budget
Dollars in Thousands
Pension & Retirement Health & Welfare Workers Comp Incentive & Recognition

Budget Walk Forward
Benefits 9
Main Business Drivers
Benefits NSPM O&M and Non-Service Walk Forward from 2021 Forecast to 2022 Budget (Dollars in Thousands)
2021 O&M and Non-Service Forecast $143,387
Pension & Retirement Related (6,094)
Lower non-service actuarial (non-O&M) costs (6,007)
Lower qualified pension costs (761)
Higher 401k match costs mainly due to projected annual merit increases 476
Higher non-qualified pension costs 36
Net Other 161
Health & Welfare 632
Higher health & welfare costs mainly due to active healthcare inflation 928
Lower FAS 112 long-term disability costs (289)
Lower retiree medical costs (8)
Workers Compensation (274)
Lower workers compensation costs (274)
Incentive & Recognition (1,622)
Lower restricted stock unit costs (1,687)
Lower deferred comp expense (1,019)
Lower performance share plan costs (296)
Higher annual incentive costs mainly due to projected annual salary increases 1,032
Net Other 348
2022 O&M and Non-Service Budget $136,029

Budget Walk Forward
Benefits 10
Summary – 2022 Budget to 2023 Budget
(961)
1,211
(13)
2,288
($2,000)
($1,000)
$0
$1,000
$2,000
$3,000
$4,000
BENEFITS NSPM O&M and Non-Service Drivers of $2.5M Increase from 2022 Budget to 2023 Budget
Dollars in Thousands
Pension & Retirement Health & Welfare Workers Comp Incentive & Recognition

Budget Walk Forward
Benefits 11
Main Business Drivers
Benefits NSPM O&M and Non-Service Walk Forward from 2022 Budget to 2023 Budget (Dollars in Thousands)
2022 O&M and Non-Service Budget $136,029
Pension & Retirement Related (961)
Lower qualified pension costs (893)
Lower non-service actuarial (non-O&M) costs (417)
Higher 401k match costs mainly due to projected annual merit increases 303
Higher non-qualified pension costs 13
Net Other 32
Health & Welfare 1,211
Higher health & welfare costs mainly due to active healthcare inflation 1,223
Lower retiree medical costs (7)
Lower FAS 112 long-term disability costs (5)
Workers Compensation (13)
Lower workers compensation costs (13)
Incentive & Recognition 2,288
Higher annual incentive costs due to projected annual salary increases 971
Higher restricted stock unit costs 878
Higher performance share plan costs 193
Higher deferred comp expense 179
Net Other 67
2023 O&M and Non-Service Budget $138,553

Budget Walk Forward
Benefits 12
Summary – 2023 Budget to 2024 Budget
(2,862)
2,452
(12)
2,266
($4,000)
($3,000)
($2,000)
($1,000)
$0
$1,000
$2,000
$3,000
BENEFITS NSPM O&M and Non-Service Drivers of $1.8M Increase from 2023 Budget to 2024 Budget
Dollars in Thousands
Pension & Retirement Health & Welfare Workers Comp Incentive & Recognition

Budget Walk Forward
Benefits 13
Main Business Drivers
Benefits NSPM O&M and Non-Service Walk Forward from 2023 Budget to 2024 Budget (Dollars in Thousands)
2023 O&M and Non-Service Budget $138,553
Pension & Retirement Related (2,862)
Lower non-service actuarial (non-O&M) costs (3,150)
Lower qualified pension costs (115)
Higher 401k match costs mainly due to projected annual merit increases 350
Higher non-qualified pension costs 14
Net Other 39
Health & Welfare 2,452
Higher health & welfare costs mainly due to active healthcare inflation 2,462
Lower retiree medical costs (5)
Lower FAS 112 long-term disability costs (4)
Workers Compensation (12)
Lower workers compensation costs (12)
Incentive & Recognition 2,266
Higher annual incentive costs due to projected annual salary increases 1,032
Higher restricted stock unit costs 618
Higher performance share plan costs 352
Higher deferred comp expense 190
Net Other 73
2024 O&M and Non-Service Budget $140,397

Functional Organization Chart
Benefits 14
Functional Organization Chart Benefits does not have an organization chart.

Cost Allocation Methodologies
Benefits 15
Operating Company Direct Charges: The following costs are direct charged: • Annual incentive costs for NSPM and NSPW • Performance based restricted stock units • Performance share plan • Deferred compensation • Spot On Awards • Corporate recognition and Years of Contribution
Service Company Direct Charges: Service Company direct charges result from the labor loading process (as explained below) and are direct charged to the cost centers where labor was charged. Service Company Allocated Charges: Service Company allocated charges either result from the labor loading process (as explained below) and are allocated to the cost centers where labor was charged, or are allocated via an indirect allocation. The primary methods utilized for each service area are described below. Please see Exhibit__(RLB-1), Schedule 4 for a complete list of the Company's allocators.
Allocating Cost Center
JDE Subledger
Code Allocating Cost Center
Name Description
200063 110 Executive - Corporate Governance Executive Corporate Governance includes the labor and non-labor costs for executive corporate management, long-term business strategy development and other programs that ensure the continuity and development of management. Corporate governance activities are generally services that are performed on behalf of all Xcel Energy operating companies and affiliates, including Xcel Energy Inc.

Cost Allocation Methodologies
Benefits 16
Labor Loadings: The following costs are budgeted and processed through the labor loading process and distributed or direct charged to the business units where labor was charged: • Qualified and nonqualified pension • 401(k) match • Nuclear employer retirement contribution • Retirement related consulting costs • FAS 106 retiree medical • Active healthcare • Health and welfare related costs • Life and LTD insurance premiums • Business travel insurance costs • FAS 112 long-term disability • Workers compensation • Annual incentive costs for Xcel Energy Services Inc.
Labor Loading Process: The accounting process for labor loadings contains two separate processes:
1. The first process is the accrual of benefit costs in the clearing accounts. Accruals include the actual costs of retirement, insurance, incentive and workers compensation.
2. The second process is the allocation of benefit costs for retirement, insurance, incentive and workers
compensation using the labor loading rates. A separate rate is calculated for each type of benefit cost, for each legal entity and for each budget period. Benefit cost loadings for workers compensation are calculated by multiplying all productive labor by the associated workers compensation labor loading rates. Benefit cost loadings for retirement, insurance and incentive are calculated by multiplying benefit productive labor by the associated labor loading rates. All benefit cost labor loadings are charged to the cost center where labor was charged.

Approvals
Benefits 17
This document has been checked for errors in calculations and content. Prepared By: /s/ Date:
Kristin M Lindemann
Financial Consultant, Benefits Acctg & Finance Approved By: /s/ Date:
Todd M Degrugillier Manager, Benefits Accounting & Finance
Date:
Richard R Schrubbe AVP, Financial Analysis & Planning
10/12/2021
10/12/2021
10/7/2021 /s/

CI - Confidential Information-External
2022 – 2024 Budget Documentation
Customer and Innovation
Business Systems

Major Business Functions and Key Activities
Customer and Innovation – Business Systems 2
CI - Confidential Information-External
Introduction Business Systems provides the technologies and supporting services necessary for system reliability, security, operational decision-making, and improving customer support along with business capabilities for Xcel Energy, Inc. The Business Systems organization consists of five groups further described below:
• Governance, Strategy, and Performance (GS&P) • Enterprise Architecture • Infrastructure and Network • Application Delivery • Digital Analytics & Innovation
Customer Value
• Governance, Strategy, and Performance − Responsible for the overall management and coordination of the Business Systems
organization. This includes all information technology (IT) development, operations, governance, oversights, and communications
− Promotes innovation and transformation in the Company by leveraging technology to create business value
− Provides oversight and reporting regarding compliance activities, working to timely minimize risk
− Provides talent management tools, including skills inventory and workforce management
− Is accountable for developing and executing the strategic plan to optimize the IT footprint including:
Establishing and maintaining a financial review cadence by partnering with Business Area Finance
Improving the transparency of IT spending Establishing and maintaining a portfolio prioritization framework based on
strategic objectives, risks, and potential constraints − Project Management Office, a component of Governance, Strategy & Performance:
Provides standards, processes, services, and information essential for sound and efficient capital portfolio management and project execution
Ensures that IT projects deliver desired business value, and the risks associated with IT projects and programs are mitigated
• Enterprise Architecture
- Translates business vision and strategy into effective enterprise change by aligning technology direction and facilitating evolution
- Leads transformation of emerging and standardized technologies that promote speed, agility, and efficiency in Xcel Energy’s IT footprint, while ensuring solution direction and consistency with Enterprise Architecture standards
• Infrastructure and Shared Services - Data Center Services – responsible for data center facilities, compute, storage,
backup, disaster recovery, and active directory - Network Operational Technology (OT) Services – responsible for connectivity
(fiber/wireless), OT network, and field technicians - End-User Services – responsible for client support, unified communications, desktop
engineering, patching and application deployment

Major Business Functions and Key Activities
Customer and Innovation – Business Systems 3
CI - Confidential Information-External
- Network IT Services – responsible for application balancing, edge security, transport (WAN), engineering (LAN), voice
- Platform & Automation – responsible for cloud engineering, automation, engineering enablement, and monitoring
- IT Service Management – responsible for IT service and process management, INOC, and service desk
- Business Management – responsible for portfolio management, project management, business in-take, financial management, and process and governance
• Application Delivery
− Partners with business areas enterprise-wide to develop and align strategic technology solutions.
− Evaluates and partners with a large range of technology vendors to increase productivity for the Company’s large internal customer base.
− Enhances business applications across the enterprise in order to achieve value metrics and/or mitigate risks. This is accomplished by using Demand and Release Management practices, by making use of new and existing applications/tools, and by partnering with colleagues across Business Systems teams.
− The organization is made up of Functional Analysts, Consultants, Solution Architects, Business Managers, Project Managers, and Program Managers, who report to Directors which focus on supporting the Operations, Corporate, and Customer areas of Xcel Energy.
• Digital Analytics and Innovation
- Focused on enabling business process innovation through analytics, mobile, automation, and design thinking.
- Program Execution and Business Management is responsible for program and project delivery along with coordinating business management activities across the group. In addition, this area serves to manage the HR application delivery team.
- Enterprise Services focuses on managing the enterprise data and analytics teams and tools along with the Company’s mobility platforms.
- Customer Experience Transformation is focused on supporting the technical delivery for the Company’s CXT Program. This area also houses the Salesforce Center of Excellence and a Digital Transformation Support assurance team.
- SAP Center of Excellence focuses on maintaining, updating/patching, and improving SAP, the Company’s enterprise resource planning (ERP) software.
- Digital Ops Factory focuses on initiatives for the Company to gain efficiencies from moving to a digital state.
Advanced Grid Initiative
Customer and Innovation – Business Systems 4
CI - Confidential Information-External
The Advanced Grid Intelligence & Security (AGIS) initiative is a comprehensive plan that will advance the Company’s electric and gas distribution systems, provide customers with more choices, and enhance the way the Company serves its customers. AGIS provides the foundation for an interactive, intelligent, and efficient grid system that will be even more reliable and better prepared to meet the energy demands of the future. The core components of AGIS are the Advanced Distribution Management System (ADMS); Advanced Metering Infrastructure (AMI); the Field Area Network (FAN); Integrated Volt-VAr Optimization (IVVO); and Fault Location Isolation and Service Restoration (FLISR). More specifically:
• Advanced Distribution Management System (ADMS) is a foundational system for operational
hardware and software applications. It acts as a centralized decision support system that assists control room personnel, field operating personnel, and engineers with the monitoring, control and optimization of the electric distribution grid. ADMS also includes the data enhancements for the Geospatial Information System (GIS), which is a foundational data repository that provides location and specification information for all of the physical assets that make up the distribution system. ADMS uses this information to maintain the as-operated electrical model and advanced applications.
• Advanced Meter Infrastructure (AMI) is an integrated system of advanced meters,
communication networks, and data processing and management systems that enables secure two-way communication between Xcel Energy’s business and operational data systems and customer meters. AMI provides a central source of information that is shared through the communications network with many components of an intelligent grid design.
• Field Area Network (FAN) is the communications network that will enable communications
between the existing communications infrastructure at the Company’s substations, ADMS, AMI, and the new intelligent field devices associated with advanced grid applications.
• Integrated Volt-VAr Optimization (IVVO) is a significant additional component supported by
ADMS, as it automates and optimizes the operation of the distribution voltage regulating and VAr control devices to reduce electrical losses, electrical demand, and energy consumption; and is intended to provide increased distribution system ability to host distributed energy resources.
• Fault Location Isolation and Service Restoration (FLISR) involves software and automated
switching devices, as an additional component of the ADMS, that reduce the frequency and duration of customer outages. These automated switching devices detect feeder mainline faults, isolate the fault by opening section switches, and restore power to un-faulted sections by closing tie switches to adjacent feeders as necessary.
Overall, Business Systems is responsible for integrating AGIS systems and data with other back office applications existing at the Company. For example, Business Systems will implement the FAN that allows intelligent field devices, ADMS, AMI, and other systems to connect. Business Systems has already implemented many foundational components of the AMI software for use in Colorado and in Minnesota for the Residential Time of Use (TOU) pilot. This same software will provide features and data processing to support a full Minnesota rollout, and will be enhanced to support Minnesota requirements for capacity, performance, security, and functionality. From the AMI head-end, a combination of new or enhanced interfaces will be built to transfer the data to other applications, such as ADMS, the meter data management system, the billing and customer service system, and the asset inventory management system. The interfaces will transfer large volumes of data in a small amount of time. The Company will be obtaining significantly more data from the field devices than it has in the past. This increase in data

Advanced Grid Initiative
Customer and Innovation – Business Systems 5
CI - Confidential Information-External
consumption will require additional space for storage and a data management plan to ensure that Xcel Energy is keeping the necessary data only for as long as it is needed. The new software, additional server hardware, and increase in quantity of data stored will all need to be supported, which will require an increase in the Business Systems support personnel.

Customer Experience Transformation Initiative
Customer and Innovation – Business Systems 6
CI - Confidential Information-External
The Customer Experience Transformation Initiative (CXT) is a comprehensive plan to build upon and focus on enhancing customer relationships through new and improved services/products. CXT looks to reimagine customer experiences by transforming processes and associated technologies thereby expanding the Company’s role in customers’ lives. There is a focus of building upon Xcel Energy’s strong foundation of offering reliable, safe energy by delivering smarter, simple, and seamless experiences for customers. In building out a next-generation, integrated, scalable, and secure platform to deliver an industry leading experience for customers, the Business Systems organization will be relied upon to provide expertise in developing and maintaining the customer experience platform, which will be used to support new capabilities and experiences. This platform will be a foundational enterprise asset and will help position the Company for future success by focusing on key areas:
• Enhancing the Digital Experience • Improving Personalization and Preference • Streamline Data Aggregation and Distribution • Update Core Systems • Provide Tools for Future Enablement
Overall, Business Systems is responsible for building the technological vision, blueprint, and architecture necessary to make the desired customer experience a reality. This includes mobile application development, API development, Cloud development, system and software integration, data governance, data aggregation, and data science. The CXT program focuses on continuous improvement to empower the Company to adapt an agile and sustainable approach into the future.

Major Cost Drivers
Customer and Innovation – Business Systems 7
CI - Confidential Information-External
Network Services - costs related to the maintenance of existing circuits, phones, microwave and radio systems, along with other IT network infrastructure assets. Network activities provide operation and management of the Company’s internal and external data transmission requirements. Network services are budgeted based on a price times a quantity. These costs are dependent upon Xcel Energy’s service usage levels and the number of assets in use. Software Licenses & Maintenance - payments to vendors for license agreements associated with various applications and desktop tools used by the Company to perform services. These payments cover licensing, updates, support patches, fixes, and technical support. Labor – all benefit and non-benefit Business Systems employees. Distributed Systems Services (DSS) – support and maintenance of servers, data storage, personal computers, printers, and similar components of the overall computing environment. As the number of servers grows, so does the amount of storage because each new server requires storage to function. Since the 2016 NSPM electric rate case, we had an increase in servers of 3,340, bringing the total to 5,580. Application Development & Maintenance (ADM) - services to develop, enhance, maintain, and consult on new or existing IT software and hardware applications. Contract Labor & Consulting – fees and expenses for professional consultants or knowledge-based experts that are not employees of the Company. This category also includes staff augmentation through staffing agencies. Shared Assets - This category reflects the allocation of Business Systems costs to or from the NSPM operating company, depending on where the asset was purchased and how an investment will be utilized between Xcel Energy operating companies. The dollars associated with this category are, in a sense, a true-up of costs related to a certain investment by assigning to the appropriate jurisdiction(s). This number fluctuates in part based on the jurisdiction in which an investment is purchased, consistent with our cost allocation policy. For example, the dollars in this account will decrease when an asset is purchased in NSPM but is also utilized in other operating companies. Hardware Purchases and Maintenance – vendor contracts to support hardware systems. This cost category also includes miscellaneous hardware equipment purchases, such as batteries, memory cards, keyboards, headsets, and related technical tools. Employee Expenses – primarily related to employee travel, occurring on an as-needed basis. Mainframe - costs for maintaining the centralized applications running on the mainframe computer, which serve multiple business needs such as batch processing for customer billing and meter reading. Other – consists of administrative materials, fleet expenses, donations, dues and fees, and internal building moves.

2022 Xcel Energy Walk Forward of Major Cost Drivers
Customer and Innovation – Business Systems 8
CI - Confidential Information-External
Business Systems 2022 Xcel Energy O&M Budget Walk Forward (Dollars in thousands) 2021 July Year-End O&M Forecast $101,280 Software 8,167
Software Maintenance 2,827 Software Licenses 2,943 Software – ASP 392 Online Information Services 2,005
Labor 3,924 Internal Labor 3,011 Contract Labor & Consulting 913
Network Services 1,961 Hardware 468
Hardware Maintenance & Purchases (70) Distributed Systems Services 109 Mainframe Services 429
Application Development & Maintenance
274
Shared Assets AGIS
2,103
1,728
Internal Labor (31) Contract Labor & Consulting 1,042 Hardware Maintenance & Purchases 455 Software Maintenance & Purchases 609 Application Development & Maintenance 5 Miscellaneous (352)
Net Other 1,003 2022 O&M Budget $120,908
Labor21%ADM
9%Hardware
5%
Network 17%
Software40%
Contract Labor & Consulting6%
Employee Expenses0%
Shared Assets 1%
Materials and Commodities 0%
Miscellaneous1%
Other2%
Business Systems 2022 NSPM O&M Budget = $120.9M

2022 Xcel Energy Walk Forward of Major Cost Drivers
Customer and Innovation – Business Systems 9
CI - Confidential Information-External
Software: Includes the following: Software Maintenance, Software License Purchases (term and perpetual), Software Application Service Provider (ASP), and Online Information Services costs. Software includes expenses for payments to vendors for license agreements associated with various applications and desktop tools used by the Company to perform services. These payments cover updates, support patches, fixes, licenses, subscription fees, and technical support. There are five major drivers of increase to the 2022 budget in addition to continued overall increasing costs in the industry. First, software costs are driven by net new projects resulting in trailing maintenance needs. Second, there are increased licensing costs driven by users and upgrades. Third, maintenance and support must be updated to limit vulnerabilities. Fourth, as the AGIS initiative continues to evolve, additional Software is required to support the program. Fifth, as the CXT initiative begins to move to a supported run-steady state within Business Systems, additional Software is required to support the program. Overall, these factors translate to increased software license and maintenance costs. Labor (Internal): Base pay increase estimate for 2022 is three percent. Additional internal labor increases are due to in-sourcing initiatives of converting contractors to full-time employees as part of the organization’s strategy. Employee headcount is managed through a workforce plan process that monitors changes and includes attrition information as well as emergent needs. Changes to employee headcount for replacement related to attrition or for new headcount require assessment of the need for the personnel, the associated risks with not filling the position, and alternative options. Labor (Contract Labor & Consulting): Consists of fees and expenses for professional consultants or knowledge-based experts who are not employees of the Company, including staff augmentation. Overall, the budget is expected to increase in 2022 due to continued increase volume in capital projects, staff augmentation needs, and consulting with trusted advisors for contract negotiations. Shared Assets - This category reflects the allocation of Business Systems costs to or from the NSPM operating company, depending on where the asset was purchased and how an investment will be utilized between Xcel Energy operating companies. The dollars associated with this category are, in a sense, a true-up of costs related to a certain investment by assigning to the appropriate jurisdiction(s). This number fluctuates in part based on the jurisdiction in which an investment is purchased, consistent with our cost allocation policy. Network Services: Network system growth in 2022 reflects the increased usage of the organization’s network to support new applications, demand for greater speed, and the need for additional capacity to support existing systems. These usage and demand needs increase each year, driven by technology advances, as new requirements or capabilities are identified, and sites are added. Additional increased

2022 Xcel Energy Walk Forward of Major Cost Drivers
Customer and Innovation – Business Systems 10
CI - Confidential Information-External
costs have resulted from the need to upgrade and replace aging components of the network especially with a shift from analog circuits to digital circuits. For example, the SCADA circuits that have been in place for many years for transmission and distribution purposes are based on analog technology. New digital circuits now require maintenance to remain current. Another example is the Company’s investment in expanding the wireless network to aid productivity. This expansion places new assets in service that must be maintained. Hardware Maintenance: These costs relate largely to vendor contracts maintained to support hardware systems. Costs for this category are expected to fluctuate based on the work being performed. The major driver of the increase is related to the maintenance costs required to support the new hardware. Application Development and Maintenance (ADM): ADM costs continue to remain relatively flat due largely to contract renegotiations with IBM and Accenture. This has been partially offset by adding Cognizant for SAP support. In addition, the Company continues to thoroughly evaluate its application portfolio on a regular basis in effort to limit new development for those applications that are considered end-of-life. Contracts with IBM, Accenture, and Cognizant include a Cost of Living Adjustment, which is estimated at three percent annually for IBM contracts, four percent for Accenture per the current agreement, and three percent for Cognizant. Higher spending is primarily driven by these COLAs. AGIS: The types of O&M costs Business Systems is incurring and expects to incur for AGIS include hardware support, costs for the AMI head-end software (which is a shared asset), data storage, annual software maintenance, labor for software support and project oversight, and application support, which includes ongoing testing, review of processes, and application of security patches to respond to evolving threats. Other: Includes several smaller spend categories with the primary being Employee Expenses.

2023 Xcel Energy Walk Forward of Major Cost Drivers
Customer and Innovation – Business Systems 11
CI - Confidential Information-External
Business Systems 2022 Xcel Energy O&M Budget Chart (Dollars in thousands) 2022 O&M Budget $120,908 Software 1,659
Software Maintenance 1,149 Software Licenses 289 Software - ASP 75 Online Information Services 146
Labor 806 Internal Labor 833 Contract Labor & Consulting (27)
Network Services 837 Voice & Radio 0 Telecommunication 0 Data & Services 837
Hardware 126 Hardware Maintenance & Purchases 78
Distributed Systems Services 20
Mainframe Services 28
Application Development & Maintenance 85 Shared Assets AGIS 4,492
8,603 Internal Labor (69) Contract Labor & Consulting (519) Hardware Maintenance & Purchases (42) Software Maintenance & Purchases 1,628 Project O&M 7,605
Net Other 4 2023 O&M Budget $137,520
Labor19%ADM
8%Hardware
5%
Network 16%
Software37%
AGIS project costs6%
Contract Labor & Consulting 5%
Shared Assets 3%
Employee Expenses 0%
Materials and Commodities
0%
Miscellaneous1%
Other4%
Business Systems 2023 Xcel Energy NSPM O&M Budget = $137.5M

2023 Xcel Energy Walk Forward of Major Cost Drivers
Customer and Innovation – Business Systems 12
CI - Confidential Information-External
AGIS: The types of O&M costs Business Systems is incurring and expects to incur for AGIS include hardware support, costs for the AMI head-end software (which is a shared asset), data storage, annual software maintenance, labor for software support and project oversight, and application support, which includes ongoing testing, review of processes, and application of security patches to respond to evolving threats. Software: Includes the following: Software Maintenance, Software License Purchases (term and perpetual), Software Application Service Provider (ASP), and Online Information Services costs. Software includes expenses for payments to vendors for license agreements associated with various applications and desktop tools used by the Company to perform services. These payments cover updates, support patches, fixes, licenses, subscription fees, and technical support. There are five major drivers of increase to the 2023 budget in addition to continued overall increasing costs in the industry. First, software costs are driven by net new projects resulting in trailing maintenance needs. Second, there are increased licensing costs driven by users and upgrades. Third, maintenance and support must be updated to limit vulnerabilities. Fourth, as the AGIS initiative continues to evolve, additional Software is required to support the program. Fifth, supporting and maintaining the run-steady state of the CXT initiative. Overall, these factors translate to increased software license and maintenance costs. Network Services: Network system growth in 2023 reflects the increased usage of the organization’s network to support new applications, demand for greater speed, and the need for additional capacity to support existing systems. These usage and demand needs increase each year, driven by technology advances, as new requirements or capabilities are identified, and sites are added. Costs reductions were implemented by the Company by the in-sourcing of work previously performed by IBM, terminating that contract, and also changing the vendors who manage the network circuits. Additional increased costs have resulted from the need to upgrade and replace aging components of the network especially with a shift from analog circuits to digital circuits. For example, the SCADA circuits that have been in place for many years for transmission and distribution purposes are based on analog technology. New digital circuits now require maintenance to remain current. Another example is the Company’s

2023 Xcel Energy Walk Forward of Major Cost Drivers
Customer and Innovation – Business Systems 13
CI - Confidential Information-External
investment in expanding the wireless network to aid productivity. This expansion places new assets in service that must be maintained. Shared Assets - This category reflects the allocation of Business Systems costs to or from the NSPM operating company, depending on where the asset was purchased and how an investment will be utilized between Xcel Energy operating companies. The dollars associated with this category are, in a sense, a true-up of costs related to a certain investment by assigning to the appropriate jurisdiction(s). This number fluctuates in part based on the jurisdiction in which an investment is purchased, consistent with our cost allocation policy. Labor (Internal): Base pay increase estimate for 2023 is three percent. Employee headcount is managed through a workforce plan process that monitors changes and includes attrition information as well as emergent needs. Changes to employee headcount for replacement related to attrition or for new headcount require assessment of the need for the personnel, the associated risks with not filling the position, and alternative options. Labor (Contract Labor & Consulting): Consists of fees and expenses for professional consultants or knowledge-based experts who are not employees of the Company, including staff augmentation. Overall, the budget is expected to slightly decrease in 2023 due to bringing steady state work to Company employees rather than outside vendors, which results in Company labor increases. Hardware Maintenance: These costs relate largely to vendor contracts maintained to support hardware systems. Costs for this category are expected to fluctuate based on the work being performed. The major driver of the increase is related to the maintenance costs required to support the new software. Application Development and Maintenance (ADM): ADM costs continue to remain relatively flat due largely to contract renegotiations with IBM and Accenture. This has been partially offset by adding Cognizant for SAP support. In addition, the Company continues to thoroughly evaluate its application portfolio on a regular basis in effort to limit new development for those applications that are considered end-of-life. Contracts with IBM, Accenture, and Cognizant include a Cost of Living Adjustment, which is estimated at three percent annually for IBM contracts, four percent for Accenture per the current agreement, and three percent for Cognizant. Higher spending is primarily driven by these COLAs. Other Expenses: Includes several smaller spend categories with the primary being Employee Expenses.

2024 Xcel Energy Walk Forward of Major Cost Drivers
Customer and Innovation – Business Systems 14
CI - Confidential Information-External
Business Systems 2023 Xcel Energy O&M Budget Chart (Dollars in thousands) 2023 O&M Budget $137,520 Software 1,495
Software Maintenance 800 Software Licenses 376 Software - ASP 94 Online Information Services 225
Labor 1,271 Internal Labor 1,233 Contract Labor & Consulting 38
Network Services 312 Voice & Radio (5) Telecommunication 0 Data & Services 317
Hardware 129 Hardware Maintenance & Purchases 80 Distributed Systems Services 20 Mainframe Services 29
Application Development and Maintenance 69 Shared Assets AGIS
6,468 389
Internal Labor (23) Contract Labor & Consulting (491) Hardware Maintenance & Purchases (60) Software Maintenance & Purchases 713 Other 250
Net Other 123 2024 O&M Budget $147,776
Labor19%ADM
8%Hardware
4%
Shared Assets7%
AGIS project O&M5%
Network 15%
Software36%
Contract Labor & Consulting…
Miscellaneous1%
Employee Expenses0%
Materials and Commodities0%
Other6%
Business Systems2024 NSPM O&M Budget = $147.8M

2024 Xcel Energy Walk Forward of Major Cost Drivers
Customer and Innovation – Business Systems 15
CI - Confidential Information-External
Shared Assets - This category reflects the allocation of Business Systems costs to or from the NSPM operating company, depending on where the asset was purchased and how an investment will be utilized between Xcel Energy operating companies. The dollars associated with this category are, in a sense, a true-up of costs related to a certain investment by assigning to the appropriate jurisdiction(s). This number fluctuates in part based on the jurisdiction in which an investment is purchased, consistent with our cost allocation policy. Software: Includes the following: Software Maintenance, Software License Purchases (term and perpetual), Software Application Service Provider (ASP), and Online Information Services costs. Software includes expenses for payments to vendors for license agreements associated with various applications and desktop tools used by the Company to perform services. These payments cover updates, support patches, fixes, licenses, subscription fees, and technical support. There are five major drivers of increase to the 2024 budget in addition to continued overall increasing costs in the industry. First, software costs are driven by net new projects resulting in trailing maintenance needs. Second, there are increased licensing costs driven by users and upgrades. Third, maintenance and support must be updated to limit vulnerabilities. Fourth, as the AGIS initiative continues to evolve, additional Software is required to support the program. Overall, these factors translate to increased software license and maintenance costs. Labor (Internal): Base pay increase estimate for 2024 is three percent. Employee headcount is managed through a workforce plan process that monitors changes and includes attrition information as well as emergent needs. Changes to employee headcount for replacement related to attrition or for new headcount require assessment of the need for the personnel, the associated risks with not filling the position, and alternative options. Labor (Contract Labor & Consulting): Consists of fees and expenses for professional consultants or knowledge-based experts who are not employees of the Company, including staff augmentation. Overall, the budget is expected to minimally increase in 2024 due to bringing steady state work to Company employees rather than outside vendors, which results in Company labor increases.

2024 Xcel Energy Walk Forward of Major Cost Drivers
Customer and Innovation – Business Systems 16
CI - Confidential Information-External
Network Services: Network system growth in 2024 reflects the increased usage of the organization’s network to support new applications, demand for greater speed, and the need for additional capacity to support existing systems. These usage and demand needs increase each year, driven by technology advances, as new requirements or capabilities are identified, and sites are added. Cost reductions were implemented by the Company by the in-sourcing of work previously performed by IBM, terminating that contract, and also changing the vendors who manage the network circuits. Additional increased costs have resulted from the need to upgrade and replace aging components of the network especially with a shift from analog circuits to digital circuits. For example, the SCADA circuits that have been in place for many years for transmission and distribution purposes are based on analog technology. New digital circuits now require maintenance to remain current. Another example is the Company’s investment in expanding the wireless network to aid productivity. This expansion places new assets in service that must be maintained. Hardware Maintenance: These costs relate largely to vendor contracts maintained to support hardware systems. Costs for this category are expected to fluctuate based on the work being performed. The major driver of the increase is related to the maintenance costs required to support the new software. Application Development and Maintenance (ADM): ADM costs continue to remain relatively flat due largely to contract renegotiations with IBM and Accenture. This has been partially offset by adding Cognizant for SAP support. In addition, the Company continues to thoroughly evaluate its application portfolio on a regular basis in effort to limit new development for those applications that are considered end-of-life. Contracts with IBM, Accenture, and Cognizant include a Cost of Living Adjustment, which is estimated at three percent annually for IBM contracts, four percent for Accenture per the current agreement, and three percent for Cognizant. Higher spending is primarily driven by these COLAs. AGIS: The types of O&M costs Business Systems is incurring and expects to incur for AGIS include hardware support, costs for the AMI head-end software (which is a shared asset), data storage, annual software maintenance, labor for software support and project oversight, and application support, which includes ongoing testing, review of processes, and application of security patches to respond to evolving threats. Other Expenses: Includes several smaller spend categories with the primary being Employee Expenses.

Functional Organizational Chart
Customer and Innovation – Business Systems 17
CI - Confidential Information-External
Application Delivery
Digital Analytics & Innovation
Infrastructure & Network
Enterprise Architecture
Governance, Strategy, & Performance
Business Systems Chief Customer & Innovation
Customer & Brand Strategy
Customer Care
Customer Solutions & Innovation
Enterprise Security & Emergency Management
Strategic Partnerships
Customer & Innovation

Cost Allocation Methodologies
Customer and Innovation – Business Systems 18
CI - Confidential Information-External
Method of Assigning IT and Telecommunications Costs Business Systems charges costs (on the invoice, timesheet, expense report or other source document) either directly to the operating company(ies) benefiting from the service or to an indirect allocation internal order set up to allocate charges at set percentages to the operating companies for a specific system application or type of service. Small amounts of operating company direct costs are charged for union technicians in Northern States Power-Minnesota (NSPM), Northern States Power-Wisconsin (NSPW) and Southwestern Public Service Company (SPS). The allocation methods used to distribute costs to legal entity and utility include: Operating Company Direct Charges: Business Systems costs associated with NSPM, NSPW, PSCo, and SPS union network technology support are directly charged to the applicable operating company. Union technician labor, employee expenses, wireless communication devices, fleet costs and other expenses (including safety glasses, gloves, and boots) are charged to cost centers that are owned by the corresponding legal entity. Service Company Direct Charges: IT services, performed for a specific operating company or affiliate, are directly charged to that specific operating company. Business Systems is primarily a Service Company organization, with the exception of union technicians as noted above. Most costs are more efficient and effective when processed through the Service Company and charged directly when possible. Service Company Allocated Charges: The indirect allocation internal orders charge using a cost causative method to the companies benefiting from the system application or service. Different types of costs for providing the same application are charged to the same indirect allocating cost center, thus ensuring billing consistency. For example, costs for distributed systems support, application development and maintenance, and server fees are charged to internal orders that settle to allocating cost centers that allocate to the companies benefiting from this application based on a three-factor formula of assets, revenue and number of employees. Costs that can be identified as benefiting a particular service function are charged to an indirect allocation internal order using the approved allocation method for that service function. For instance, personal computer support for the Internal Audit business area is allocated using the approved three-factor formula of assets, revenue and number of employees assigned to the Internal Audit function. The indirect allocations are set up and monitored by the Service Company Accounting department, similar to the other Service Company indirect allocations. Charging the cost directly to the proper account as the cost is incurred eliminates or significantly reduces the number of transactions recorded to the clearing account. This process provides an audit trail for tracking charges back to the original source document and better regulatory reporting on how the costs are allocated. The primary methods utilized for each service area are described below. Please see Exhibit ___ (RLB-1), Schedule 4 for a complete list of the Company’s allocators.

Cost Allocation Methodologies
Customer and Innovation – Business Systems 19
CI - Confidential Information-External
Allocating Cost
Center
JDE Subled
ger Code
Allocating Cost Center
Name Description
200063 110 Executive - Corporate Governance
Executive Corporate Governance includes the labor and non-labor costs for executive corporate management, long-term business strategy development and other programs that ensure the continuity and development of management. Corporate governance activities are generally services that are performed on behalf of all Xcel Energy operating companies and affiliates, including Xcel Energy Inc.
200066 121 Accounting, Reporting & Tax - Corporate Governance
Accounting, Reporting & Tax - Corporate Governance includes the labor and non-labor costs associated with preparing and filing consolidated reporting and financial statements, preparing consolidated budgets, completing the consolidation process, maintaining the books and records of Xcel Energy Inc. and Service Company, composing the corporate-wide regulatory accounting policy and compliance, Sarbanes-Oxley (SOX) documentation and compliance, and Chief Financial Officer activities related to the Audit Committee. Provides financial leadership to Xcel Energy and provides policies, controls, and leadership to the Financial Operations business area. Corporate governance activities are generally services that are performed on behalf of all Xcel Energy operating companies and affiliates, including Xcel Energy Inc.
200072 180 Communications - Corporate Governance
Communications - Corporate Governance includes the labor and non-labor costs to assist and ensure Executive Management, Investor Relations and others communicate appropriately with shareholders, the public, and other key stakeholder audiences. Key projects include: development and production of the annual report and other communications to investors; speeches, videos, and major presentations delivered by top executives; and speeches, displays, video and presentations for the company's annual meeting of shareholders. Media Relations contributes to building Xcel Energy's reputation by developing media and public relations strategies for major company initiatives and issues; responding to news media inquiries; working pro-actively with the media to forward story ideas and information about company events, policies and actions, and providing media training for company spokespersons. Media Relations also plays a key role in crisis communications and emergency preparedness efforts. Corporate governance activities are generally services that are performed on behalf of all Xcel Energy operating companies and affiliates, including Xcel Energy Inc.
200079 409 Federal Lobbying Federal Lobbying services includes the labor and non-labor costs for federal and state lobbying activities and the federal Political Action Committee (PAC).
200081 120 Accounting, Reporting & Taxes
Accounting, Reporting & Taxes services includes the labor and non-labor costs for preparation of operating and non-operating financial statements, tax returns and reporting, performing accounting for the employee benefit plans, ensuring compliance with applicable laws and regulations of the operating and non-operating companies; composing the corporate-wide regulatory accounting policy, and coordinating the budgeting process with the operating and non-operating companies.
200086 170 Legal & Claims Services
Legal & Claims Services includes the labor and non-labor costs for operating and non-operating legal services related to: labor and employment law, litigation, rates and regulation, environmental matters, real estate, contracts, and claims services related to casualty, public, and company claims.
200087 123 Accounting, Reporting & Tax - Regulated
Accounting, Reporting & Tax - Regulated includes the labor and non-labor costs associated with operating company revenue accounting, budgeting, regulatory reporting, sales and use taxes, business area support for utility areas, operating company budgeting support, and capital asset accounting.

Cost Allocation Methodologies
Customer and Innovation – Business Systems 20
CI - Confidential Information-External
Allocating Cost
Center
JDE Subled
ger Code
Allocating Cost Center
Name Description
200096 431 Energy Markets - Business Services
Energy Markets Business Services includes the labor and non-labor costs for financial analysis, budgeting and administrative support, managerial reporting and business planning and process initiatives, independent daily forward valuation and risk measurement of commodity transactions and system fuel and purchase power requirements to meet system loads, as well as proprietary or trading transactions; creates retail system load and energy forecasts providing regular updates to senior management and analyses of key drivers, reviews and provides comments to dealmakers on non-standard agreements and associated confirmation agreements in the areas of coal supply, gas supply, wood fuel, rail, trucking, structured power purchases and nuclear/uranium concentrates and services; provides analyses for electric/gas hedge studies and sensitivities; creates load management forecast, jurisdictional peak demand forecasts, and cost of service studies for energy trading and marketing.
200097 533; 535; 539; 542
Accounting and Finance Software Applications Maintenance
Accounting and Finance Software Applications Maintenance services include the labor and non-labor operating costs for the application development and maintenance of the software applications used for accounting and finance business functions.
200108 N/A Advanced Metering Infrastructure (AMI)
Advanced Metering Infrastructure (AMI) includes the labor and non-labor costs associated with AMI.
200111 544 Enterprise Application Integration (EAI)
Enterprise Application Integration (EAI) includes the labor and non-labor costs associated with the management of information systems infrastructure and working with IT Project Managers to ensure that new systems are positioned to function as successfully as possible in terms of overall performance and communication with other systems.
200112 562 Mainframe Charges Mainframe Charges include labor and non-labor costs related to mainframe expenses for development, maintenance, and licensing. The Mainframe is comprised of three applications: Time, Gas Management System, and Monitoring Device Management System applications. This is used primarily by the Business Systems Organization.
200115 514 Miscellaneous Applications
Miscellaneous Applications includes the labor and non-labor costs associated with the management of information systems infrastructure and working with IT project managers to ensure that new systems are positioned to function as successfully as possible in terms of overall performance and communication with other systems.
200116 441 Distribution Electric Supervision & Engineering (S&E) FERC 580
Distribution Electric Supervision & Engineering (S&E) FERC 580 services includes the labor and expenses incurred in the general supervision and direction of the operation of the electric distribution system.
200118 527 Distribution Electric Load Dispatching/EMS FERC 581
Distribution Electric Load Dispatching/EMS FERC 581 services include labor, materials used, and expenses incurred in load dispatching operations pertaining to the distribution of electricity. This includes Energy Management Systems (EMS) which provides supervisory control and data acquisition (SCADA) of substation devices through Remote Terminal Units (RTU's).
200119 506; 507; 559
Distribution Electric & Gas Miscellaneous FERC 588 & 880
Distribution Electric & Gas Miscellaneous FERC 588 & 880 services include labor, materials used, and expenses incurred in distribution system operation not provided for elsewhere. This includes software system labor and non-labor costs for the maintenance that support the electric and gas distribution to our customers as well as non-capital engineering & supervision costs.

Cost Allocation Methodologies
Customer and Innovation – Business Systems 21
CI - Confidential Information-External
Allocating Cost
Center
JDE Subled
ger Code
Allocating Cost Center
Name Description
200124 526 Transmission Electric Load Dispatch-Monitor and Operate Transmission System FERC 561.2
Transmission Electric Load Dispatch-Monitor and Operate Transmission System FERC 561.2 services include labor, materials used, and expenses incurred to monitor, assess and operate the power system and individual transmission facilities in real-time to maintain safe and reliable operation of the transmission system. This also includes the expense incurred to manage transmission facilities to maintain system reliability and to monitor the real-time flows and direct actions according to regional plans and tariffs as necessary.
200126 423; 440; 525
Utilities Group Administrative & General (A&G) FERC 921
Utilities Group Administrative & General (A&G) FERC 921 services includes the labor and non-labor costs for utilities group leadership, management and support services for the Distribution, Transmission, transportation and supply chain areas.
200128 445 Distribution Gas Miscellaneous FERC 880
Distribution Gas Miscellaneous FERC 880 services include the cost of distribution maps and records, distribution office expenses, and the cost of miscellaneous labor and materials used, and expenses incurred in gas distribution systems. Additionally, the labor and non-labor costs for non-capital engineering and supervision.
200131 531 Distribution & Transmission Gas System Control and Load Dispatching FERC 851 & 871
Distribution & Transmission Gas System Control and Load Dispatching FERC 851 & 871 include the cost of labor, materials used, and expenses incurred in dispatching and controlling the supply and flow of gas through the gas distribution and transmission systems. Additionally, costs include the labor and non-labor costs for the application development and maintenance of the Gas SCADA system.
200134 144 Proprietary Trading - Front/Mid Office FERC 557
Proprietary Trading - Front/Mid Office FERC 557 includes the labor and non-labor costs associated with proprietary trading activities which are short term transactions undertaken in the wholesale electric markets where electricity is purchased for the purpose of selling it. Also included are supporting activities: evaluating the credit worthiness of counterparties, reviewing contracts to ensure that regulations are being complied with, evaluating profitability and appropriateness of trades to ensure they are in the best interest of shareholders and rate payers, and ensuring that trades identified as proprietary appropriately fall into that category.
200135 414 Energy Supply Business Resources
Energy Supply Business Resources services includes the labor and non-labor costs of performance analysis, specialists and analytical services provided to the operating companies' generation facilities.
200147 554 Business Objects Business Objects includes the labor and non-labor costs for the application that provides critical reporting from data universes and tables.
200148 500; 524 Business Systems Business Systems services includes the costs of providing assistance to computer users across the company. Specifically computer technology risk, software maintenance on applications Distributed to all users (e.g. Microsoft PC tools), governance and project management over all IT projects, fixed management fees with outside vendors, business analytics costs, corrective and preventative maintenance, security, data backup and recovery, help desk, and amortization of outside vendor fees and costs that are not specific to an application that has a specific allocator.
200149 534 Customer & Enterprise Solutions (CES)
Customer & Enterprise Solutions (CES) includes the labor and non-labor costs for the leadership of the Customer & Enterprise Solutions organization and their administrative support staff.

Cost Allocation Methodologies
Customer and Innovation – Business Systems 22
CI - Confidential Information-External
Allocating Cost
Center
JDE Subled
ger Code
Allocating Cost Center
Name Description
200150 520 Interactive Voice Response (IVR)
Interactive Voice Response (IVR) includes the labor and non-labor costs for the application development and maintenance of the Interactive Voice Response system which interacts with a customer calling Xcel Energy call centers. It is intended to help service customers without invoking a call center agent. If the call needs to be handled by an agent, account information and the reason for the call is determined which helps route the call to the appropriate agent.
200152 436 Customer Care FERC 902
Customer Care FERC 902 services includes the labor and non-labor costs for meter reading of retail and wholesale customers and determining consumption for billing purposes as well as executing field collections.
200154 403 Customer Service Information Technology (IT) FERC 903
Customer Service Information Technology (IT) FERC 903 services includes the labor and non-labor costs for IT applications related customer billing to customers, call center support and credit and collections.
200155 435 Customer Care FERC 903
Customer Care FERC 903 services includes the labor and non-labor costs for contact centers, remittance processing, credit and collections, customer resource management, and contact center training. This allocation is used when all four jurisdictions are benefiting from the services such as responding to residential customer inquiries regarding billings and outages, handling inbound credit calls, outbound collections calls, managing accounts receivables, training call center staffs, developing contact center call forecasts.
200159 405 Customer Service Information Technology (IT) NSPM & NSPW FERC 903
Customer Service Information Technology (IT) NSPM & NSPW FERC 903 services includes the labor and non-labor costs for IT applications related customer billing to customers, call center support and credit and collections. This allocation is used when NSPM & NSPW jurisdictions are benefiting from the services.
200160 439 Customer Care NSPM & NSPW FERC 903
Customer Care NSPM & NSPW FERC 903 services includes the labor and non-labor costs for contact centers, and credit and collections, such as responding to commercial customers inquiries at the Business Solution Center. This is primarily used by the Customer Care organization when NSPM and NSPW jurisdictions are benefiting from the services.
200164 198 Payroll Payroll services include the labor and non-labor costs for processing payroll including consolidation of time collection, calculation of salaries and wages, administration of employee deductions, account Distribution and reconciliation, allocation and accounting for employment taxes and compliance reports.
200165 515; 521; 552
Employee Management Systems
Employee Management Systems includes the labor and non-labor costs for the Security Operations Center (SOC), Time capture and processing for payroll and accounting and Human Resources software. These applications and services provide services for the whole company related to enterprise security, including physical access, security monitoring and investigations, payroll and time accounting and employee information databases.
200166 190; 197; 199
Human Resources (Diversity/Safety/Employee Relations)
Human Resources (Diversity/Safety/Employee Relations) includes the labor and non-labor costs for work performed for operating and affiliate company employees, such as diversity programs, providing workforce relations resources for labor agreements, arbitration, and training. Manage, design, and implement Corporate Safety initiatives. Staffing administration for non-bargaining positions and provides Affirmative Action plans (development) and government audit management (compliance).

Cost Allocation Methodologies
Customer and Innovation – Business Systems 23
CI - Confidential Information-External
Allocating Cost
Center
JDE Subled
ger Code
Allocating Cost Center
Name Description
200168 517 Gas Management System (GMS) FERC 866 & 880
Gas Management System (GMS) FERC 866 & 880 supports Xcel Energy gas transportation business including contracts, nominations/allocations, end-user measurement, imbalance management, and input for billing. also supports gas system supply, other balancing services. Costs include labor and non-labor for the application development and maintenance of the Gas Management System.
200169 504; 537; 553
Energy Supply Systems Miscellaneous FERC 417.1, 506, 539, & 549
Energy Supply Systems Miscellaneous FERC 417.1, 506, 539, & 549 includes the labor and non-labor costs for the non-critical applications that support the Energy Supply area. Such as Emissions Tracker, Labworks, SAP WAM, Documentum and Meridian.
200170 518; 540 Meter Reading and Monitoring Systems FERC 902
Meter Reading and Monitoring Systems FERC 902 includes the labor and non-labor operating costs for the application development and maintenance of the software applications needed to read and monitor gas and electric meters, including Meter Data Lake.
200171 503; 555 Customer Resource System (CRS) FERC 903
Customer Resource System (CRS) FERC 903 includes the labor and non-labor costs for the CRS system, specifically, application development and maintenance costs, licensing fees, server system costs and technology risk costs specific to disaster recovery of this application. CRS is Xcel Energy's customer service and billing system.
200172 523 Network Network services include the labor and non-labor costs for the operation, maintenance, and management of Xcel Energy's internal and external Information Technology Network. This includes circuits, firewalls and communication assets.
200176 412 Marketing & Sales Marketing & Sales services includes the labor and non-labor costs for marketing and sales services for the operating companies for their customers including strategic planning, segment identification, business analysis, sales planning, customer service, promoting products to the business market, and providing regulatory and policy support with respect to utility energy efficiency and demand response program design, evaluation, measurement and verification, cost effectiveness testing , and cost recovery.
200180 528 EMS-Shared (Energy Management System-SCADA) FERC 556, 561.2, & 581
EMS-Shared (Energy Management System-SCADA) FERC 556, 561.2, & 581 provides supervisory control and data acquisition of substation devices through Remote Terminal Units (RTU's). EMS-Shared system includes the labor and non-labor costs for the application development and maintenance of the Electric Transmission, Distribution and Production Plant information operations.
200184 516 PowerPlan PowerPlan includes the labor and non-labor operating costs for PowerPlan, which is the capital asset business system which includes the following modules. Fixed Assets, Power Tax, Property Tax, Projects, Budgets, Cost Repository, Depreciation studies and Depreciation forecast. This includes the application development and maintenance costs, licensing fees, server system costs and technology risk costs specific to disaster recovery of this application.
Benefits of Allocation of Costs Methodologies
• Allocates Business Systems costs using a more cost-causative driver per system application or service
• Increases the number of allocation cost pools, resulting in more accurate billing of costs • Uses consistent method of charging costs for specific system applications or services

Cost Allocation Methodologies
Customer and Innovation – Business Systems 24
CI - Confidential Information-External
• Uses SAP to allocate costs, thereby increasing efficiency in processing and making allocation methods more transparent than a journal entry from a feeder system
• Improves regulatory reporting • Is centrally established and monitored by Service Company Accounting, similar to other
Service Company indirect allocations, enabling better control • Creates a better audit trail by eliminating or significantly reducing transactions recorded to the
IT clearing account.

Approvals
Customer and Innovation – Business Systems 25
CI - Confidential Information-External
This document has been checked for errors in calculations and content. Prepared By: /s/ Date:
Rena Talbott
Manager, Budgeting & Reporting, Shared Services Finance Approved By: /s/ Date:
Adam Dietenberger Director, Shared Services Finance
Approved By: /s/ Date:
Michael O. Remington Regulatory Director, Advanced Grid
10/7/2021
10/13/2021
10/8/2021

2022 – 2024 Budget Documentation
Customer and Innovation
Customer Care

Major Business Functions and Key Activities
Customer and Innovation – Customer Care 2
Introduction The Customer Care organization is a part of Xcel Energy Services Inc. and provides a variety of support services to Xcel Energy Inc., its subsidiaries and customers. Services include Billings Services & Operations, Contact Center, Credit and Collections, Customer Care, Measurement and Analytics, Customer Policy and Assistance, and Meter Reading, Revenue Assurance & Field Collections.
Customer Value
Each business area within Customer Care plays its own role in providing customer value.
Billing Services & Operations focuses on securing revenue through timely, accurate, and cost-effective billing services and cash processing operations. Primary Functions are Retail Billing (residential, commercial, industrial), Cash/Remittance Processing, Meter Data Translation, Billing & Payment Exception Processing, Vendor Contract Management, Gas Transportation, Non-Commodity Billing, Taxing, Addressing, Bill Statements, Letters & Notices, System Testing, Complex Billing, MPUC/OAG Compliance, SOX Controls, and Benchmark Reporting. Contact Center’s mission is to deliver the highest quality and consistent customer experience. Functions include enhancing our customers’ experience and proactively attaining energy efficiency, products and service goals through the Residential Customer Contact Centers, Business Solution Center, Energy Expert Team, Correspondence, Residential Property Management Team and Specialists. Credit and Collections focuses on the use of a variety programs and methods to secure payments on delinquent accounts, to optimize cash flow and minimize bad debt; along with vacant premise management. Customer Care, Measurement and Analytics creates value by managing employee talent training and quality assurance, planning and forecasting, operational management, workforce management, performance reporting, advanced analytics, vendor management and fiscal oversight for all of Customer Care. Customer Policy and Assistance focuses on communicating with employees and customers, tracking and improving business area performance and processes, working with customers to resolve complaints, and managing customer policies and low-income assistance. Meter Reading, Revenue Assurance & Field Collections’ role is to ensure that all the energy our customers use is accurately measured, billed and paid for. Operational excellence, performance improvement, employee engagement, accurate readings, revenue protection and customer satisfaction are all part of Meter Reading’s value proposition. Meter reading services are provided by Landis+Gyr (Cellnet). Advanced Metering Infrastructure (AMI) deployment will reduce headcounts due to improved automated reading capabilities. Deployment delays or disapproval of AMI deployment may impact these Meter Reading costs. The Customer Care business area is a part of Xcel Energy Services Inc. and provides customer-related support services to Xcel Energy Inc. and its subsidiaries. These services are provided in accordance with Service Agreements that exist between the applicable subsidiaries. The Service Agreements are administered in accordance with Federal Energy Regulatory Commission regulations and, when required, are presented to the Minnesota Public Utilities Commission for review and approval. The Customer Care organization is comprised of the following major areas: Billing Services & Operations, Contact Center, Credit & Collections, Customer Care, Measurement and Analytics, Customer Policy and

Major Business Functions and Key Activities
Customer and Innovation – Customer Care 3
Assistance, and Meter Reading, Revenue Assurance & Field Collections. The major business functions and key activities for each area are summarized below.
Billing Services & Operations Major Functions Billing Services & Operations is responsible for working through billing and cash exception, meter data translation, delivery of billing statements, letters, and notices, remittance processing, and customer receivables for all Xcel Energy retail residential, industrial, large and small commercial customers across all jurisdictions. Key Activities • Manage retail customer billing, cash, and lockbox processing • Research and process all billing and cash exceptions • Manage billing and cash vendor relationships with associated contracts • Provide escalated customer service assistance regarding billing and cash issue resolution • Manage non-commodity bills, manual bills, gas transportation and daily gas, and meter data
translation Contact Center Major Functions Contact Center is responsible for the operation of the residential customer service and business solutions centers. Key Activities • Respond to customer inquiries through multiple channels. Typical contact types include:
- Establish, transfer and /or disconnect service - Analyze and explain customers’ bills - Negotiate payment arrangements - Consult and offer services and options - Handle gas/electric calls, including emergencies
Credit & Collections Major Functions The Credit and Collections organization is responsible for accounts receivable management and internal credit support. Key Activities • Manage accounts receivables through credit cycle to mitigate bad debt expense and manage Days
Sales Outstanding • Manage collections of delinquent accounts • Manage in-bound and outbound collections contacts with customers

Major Business Functions and Key Activities
Customer and Innovation – Customer Care 4
Customer Care, Measurement and Analytics Major Functions Customer Care, Measurement and Analytics is responsible for overall organizational operation support, Contact Center staff training and quality assurance. Key Activities • Train and provide quality assurance monitoring for phone staff • Develop Contact Center call forecasts, scheduling, regulatory reporting, and manage real-time
Contact Center operations • Provide planning and forecasting, operational management, workforce management, performance
reporting, advanced analytics, vendor management and fiscal oversight for all of Customer Care. Customer Policy and Assistance Major Functions Customer Policy and Assistance is responsible for communicating with employees and customers, managing customer policies, and low-income programs. Key Activities • Circulate communications to Customer Care staff and provide information to customers • Resolve customer complaints • Track and monitor organizational performance, customer data privacy processes and improve
internal processes • Manage and implement low-income programs and provide service support to low-income customers
and agencies Meter Reading, Revenue Assurance and Field Collections Major Functions Meter Reading, Revenue Assurance, and Field Collections is responsible for customer meter reads, field credit collections, and revenue assurance across all jurisdictions. Key Activities • Read meters • Execute field collections and disconnections/reconnections for nonpayment • Investigate tampering of service for theft and public safety

2022 Customer Care Xcel Energy O&M Major Cost Drivers
Customer and Innovation – Customer Care 5
Costs are categorized as Labor and Contract Labor, Outside Services and O&M Credits, Postage, Transportation Fleet Costs, and Employee Expenses. Labor and Contract Labor – Labor for the Customer Care organization is made up of exempt, part-time and full-time benefit, non-benefit, and union employees to perform the key activities described under the Major Business and Key Activities section. Contract labor is primarily utilized in Billing Services and Meter Reading. Billing Services uses contractors to help backfill labor in their Billing Operations and Cash Processing departments. Meter Reading uses contractor labor to execute field collections in NSPM. Outside Services and O&M Credits – Customer Care uses outside services in most of its business areas. Billing Services uses DST Output to process the Company’s bills and letters and notices. Credit and Collections utilizes third-party collection agencies to assist in collecting on delinquent accounts. In addition, outside companies are used to make courtesy calls when customers’ payments are late. Credit checks and information needed to research customer accounts are also outsourced to various companies. The Contact Center uses Language Line to help in language translation to assist agents in conversations with customers. The Resource Management group utilizes outside services to assist in overflow outage call handling and outbound contacts. Credit Policy, within Customer Policy and Assistance, has budget dollars for a monthly fee associated with data breach support from a third-party vendor. A large part of outside services resides in the Meter Reading area. The Company uses an outside company to perform most of the Company’s automated meter reads. Meter Reading also outsources reconnecting customers’ power and performing commercial and industrial reads, interval reads and other special contracted reads. The increase in Outside Services is offset by O&M Credit reimbursement from Cell net for the costs associated with any meter readers that are retained to read any non-automated and non-performing electric meters in NSPM. Postage – Postage is primarily made up of the mailing costs to send out bills and letters and notices to Xcel Energy’s customers. Transportation Fleet Costs – Many of the meter readers utilize company-owned vehicles. The Company will charge back a cost to the Meter Reading business units for the use of these vehicles.
Labor & Contract Labor 37%Outside Services &
O&M Credits 49%
Employee Expenses 1%
Postage 11%
Other 2%
2022 O&M Budget $41.6 M
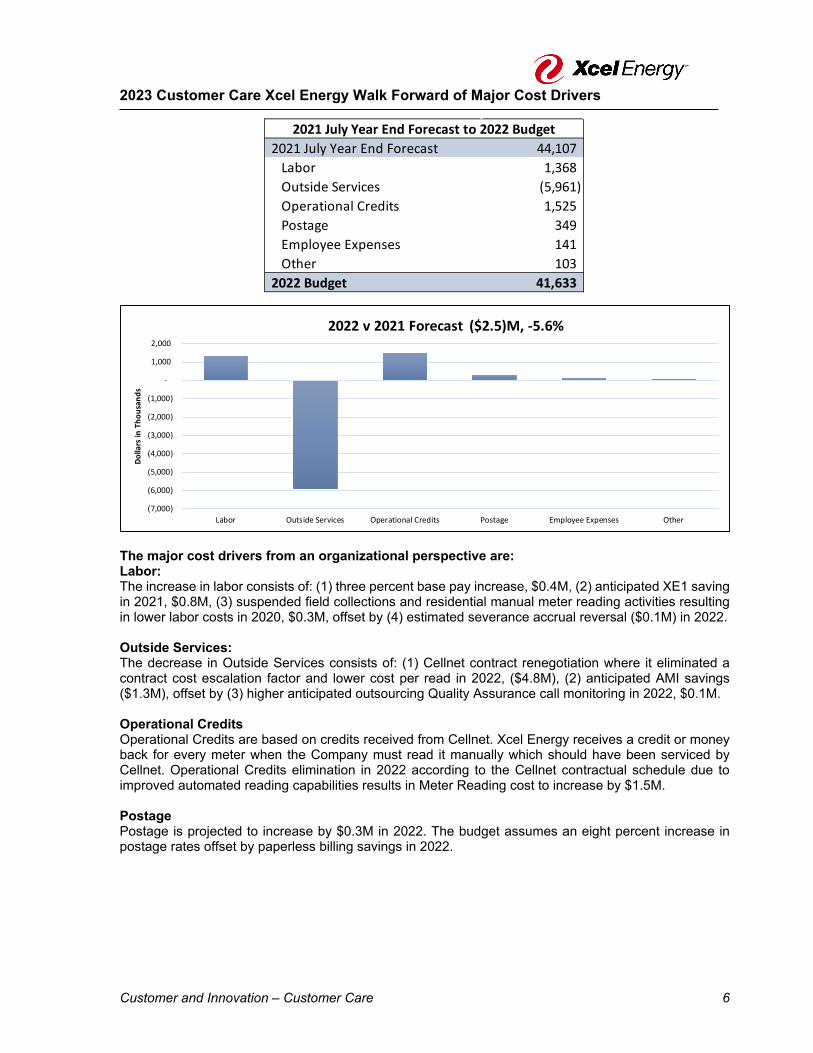
2023 Customer Care Xcel Energy Walk Forward of Major Cost Drivers
Customer and Innovation – Customer Care 6
The major cost drivers from an organizational perspective are: Labor: The increase in labor consists of: (1) three percent base pay increase, $0.4M, (2) anticipated XE1 saving in 2021, $0.8M, (3) suspended field collections and residential manual meter reading activities resulting in lower labor costs in 2020, $0.3M, offset by (4) estimated severance accrual reversal ($0.1M) in 2022. Outside Services: The decrease in Outside Services consists of: (1) Cellnet contract renegotiation where it eliminated a contract cost escalation factor and lower cost per read in 2022, ($4.8M), (2) anticipated AMI savings ($1.3M), offset by (3) higher anticipated outsourcing Quality Assurance call monitoring in 2022, $0.1M. Operational Credits Operational Credits are based on credits received from Cellnet. Xcel Energy receives a credit or money back for every meter when the Company must read it manually which should have been serviced by Cellnet. Operational Credits elimination in 2022 according to the Cellnet contractual schedule due to improved automated reading capabilities results in Meter Reading cost to increase by $1.5M. Postage Postage is projected to increase by $0.3M in 2022. The budget assumes an eight percent increase in postage rates offset by paperless billing savings in 2022.
2021 July Year End Forecast 44,107 Labor 1,368 Outside Services (5,961) Operational Credits 1,525 Postage 349 Employee Expenses 141 Other 103
2022 Budget 41,633
2021 July Year End Forecast to 2022 Budget
(7,000)
(6,000)
(5,000)
(4,000)
(3,000)
(2,000)
(1,000)
-
1,000
2,000
Labor Outside Services Operational Credits Postage Employee Expenses Other
Dolla
rs in
Tho
usan
ds
2022 v 2021 Forecast ($2.5)M, -5.6%

2023 Customer Care Xcel Energy Walk Forward of Major Cost Drivers
Customer and Innovation – Customer Care 7

2023 Customer Care Xcel Energy Walk Forward of Major Cost Drivers
Customer and Innovation – Customer Care 8
The major cost drivers from an organizational perspective are: Labor: Between 2022 and 2023, the overall cost of labor for Customer Care increases mainly due to three percent base pay increase, $0.4M. Outside Services: The decrease in Outside Services mainly due to anticipated AMI savings, (3.1M) between 2022 and 2023. Postage: Postage is projected to increase by $0.4M in 2023. The budget assumes an eight percent increase in postage rates offset by paperless billing savings in 2023.
2022 Budget 41,633 Labor 370 Outside Services (3,115) Postage 383 Other 9
2023 Budget 39,280
2022 Budget to 2023 Budget
(3,500)
(3,000)
(2,500)
(2,000)
(1,500)
(1,000)
(500)
-
500
1,000
Labor Outside Services Postage Other
Dolla
rs in
Tho
usan
ds
2023 v 2022 Budget ($2.4)M, -5.7%

2024 Customer Care Xcel Energy Walk Forward of Major Cost Drivers
Customer and Innovation – Customer Care 9
Labor & Contract Labor 44%
Outside Services & O&M Credits
38%
Employee Expenses 1%
Postage 15%
Other 2%
2024 O&M Budget $37.1 M

2024 Customer Care Xcel Energy Walk Forward of Major Cost Drivers
Customer and Innovation – Customer Care 10
The major cost drivers from an organizational perspective are: Labor: Between 2023 and 2024, the overall cost of labor for Customer Care increases mainly due to three percent base pay increase, $0.6M. Outside Services: The decrease in Outside Services mainly due to anticipated AMI savings, (3.1M) between 2023 and 2024. Postage: Postage is projected to increase by $0.4M in 2024. The budget assumes an eight percent increase in postage rates offset by paperless billing savings in 2024.
2023 Budget 39,280 Labor 554 Outside Services (3,149) Postage 413 Other 8
2024 Budget 37,107
2023 Budget to 2024 Budget
(3,500)
(3,000)
(2,500)
(2,000)
(1,500)
(1,000)
(500)
-
500
1,000
Labor Outside Services Postage Other
Dolla
rs in
Tho
usan
ds
2024 v 2023 Budget ($2.2)M, -5.5%

Functional Organization Chart
Customer and Innovation – Customer Care 11
Billing Services
Contact Center
Credit & Collection
Customer Care, Measurement, Data Analytics
Customer Policy & Assistance
Business Systems
Chief Customer & Innovation
Customer & Brand Strategy
Customer Solutions
Enterprise Security
Strategic Partnerships
Customer & Innovation
Customer Care
Bad Debt PSCO Donation
Meter Reading

Cost Allocation Methodologies
Customer and Innovation – Customer Care 12
Service Company Allocated Charges: Operating Company Direct Charges are costs incurred directly by a particular operating company. For example, the relevant operating company pays insurance premiums for operating-company-specific policies. These premiums are shown as direct charges to that operating company. Service Company Direct Charges are costs incurred by the Service Company on behalf of an operating company. For example, some Budgeting personnel may be involved in a specific operating company initiative (e.g., a rate case or other regulatory filing). Any Service Company labor costs associated with this initiative are billed directly to the relevant operating company. Service Company Allocated Charges are costs for which a unique operating company cannot be determined or which are incurred on behalf of all operating companies. For example, general Budgeting services are provided on a centralized basis for all Xcel Energy legal entities. The Service Company labor costs associated with these services are allocated to the legal entities using allocations. The primary methods utilized for each service area are described above. Please see Exhibit__(RLB-1), Schedule 4 for a complete list of the Company's allocators.
Allocating Cost Center
JDE Subledger
Code
Allocating Cost
Center Name
Description
200151 447 Customer Billing FERC
903
Customer Billing FERC 903 includes the labor and non-labor costs related to the delivery of billing statements, letters and notices to Xcel customers including postage and outside services costs, oversight and administration of customer billing area, research of billing exceptions, providing escalated customer service assistance with regard to billing issues resolution, and process remittances and receivables. This allocation is used when all four jurisdictions are benefiting from the services.
200152 436 Customer Care
FERC 902 Customer Care FERC 902 services includes the labor and non-labor costs for meter reading of retail and wholesale customers and determining consumption for billing purposes as well as executing field collections.
200155 435 Customer Care FERC 903
Customer Care FERC 903 services includes the labor and non-labor costs for contact centers, remittance processing, credit and collections, customer resource management, and contact center training. This allocation is used when all four jurisdictions are benefiting from the services such as responding to residential customer inquiries regarding billings and outages, handling inbound credit calls, outbound collections calls, managing accounts receivables, training call center staffs, developing contact center call forecasts.
200156 437 Customer Care FERC 901
Customer Care FERC 901 services includes the labor and non-labor costs for the leadership of the customer care organization and their administrative support staff such as consulting costs to support overall Customer Care organizational operations.
200160 439 Customer Care NSPM &
NSPW FERC 903
Customer Care NSPM & NSPW FERC 903 services includes the labor and non-labor costs for contact centers, and credit and collections, such as responding to commercial customers inquiries at the Business Solution Center. This is primarily used by the Customer Care organization when NSPM and NSPW jurisdictions are benefiting from the services.
200161 446 Customer Care Low Income Assistance FERC 908
Customer Care Low Income Assistance FERC 908 services includes the labor and non-labor costs associated with the low income energy customer program such as answering calls from customers for referral to low income assistance agencies, providing information to the agencies in order to process applications for assistance, take pledges/commitments from agencies and process payments from agencies.

Approvals
Customer and Innovation – Customer Care 13
This document has been checked for errors in calculations and content.
Prepared By: /s/ Date:
Kiem Thang
Financial Consultant
Approved By: /s/ Date:
Adam Dietenberger
Director, Shared Services Finance
Approved By: /s/ Date:
Chris Cardenas
VP, Customer Care
10/14/2021
10/13/2021
10/13/2021

2022 – 2024 Budget Documentation
Customer and Innovation
Bad Debt

Customer and Innovation – Bad Debt 2
Major Business Functions and Key Activities Introduction An estimate of the amount of billed commodity revenue that will ultimately become uncollectible is required so that expenses match the commodity and non-commodity revenue received during the period. In order to make an accurate estimate, it is necessary to use recent data to the extent it is representative of what can be expected in the budgeted periods. Bad Debt Expense is recognized in the Legal Entity where the customer account being written off resides. Corporate Services Bad Debt Expense is comprised of Commodity (Class “C”) write offs and recoveries, Non-Commodity (Class “N”) write offs and recoveries and change in accounts receivable reserve.
Bad Debt Major Functions Bad Debt Expense represents expense to an Xcel Energy legal entity for a customer account determined to be uncollectible and written off. Components of bad debt expense include:
• Write-offs – customer accounts written off • Recoveries – amounts recovered after being written off • Changes in Accounts Receivable (AR) Reserve – changes in balance sheet reserve for AR based
on AR reserve model. Measurement and Forecasting Commodity bad debt expense is forecasted and measured based on a percentage of billed commodity revenue on a monthly and an annual basis. The percentage used for the budget for NSP MN is typically about 0.35 percent based on the average of 2013-2019 actual bad debt expense as a percentage of revenue. The budget for 2022-2024 required additional consideration as the impacts of the COVID-19 pandemic on expected uncollectible accounts over these years. The assumptions used in this budget period were as follows: The commodity bad debt 2022 budget is calculated by using bad debt expense as a percentage of billed commodity revenue from 2010 for Xcel Energy including ($1.1M) Propensity to Pay (P2P) and ($0.8M) Worldwide Network Services (WNS) savings then the cost was allocated to NSPM based on 2020 actuals NSPM allocation %. The bad debt as percentage of revenue is 0.40 percent based on similar anticipation recovery after great recession due to the financial impacts of the housing bubble and subsequent subprime mortgage crisis in 2008. The Company anticipated that there are less write-off and bankruptcies related to pandemic in 2022 which is less than 2021. For 2023 and 2024, the Company used bad debt expense as a percentage of billed commodity revenue from 2019 for Xcel Energy including ($1.1M) P2P and ($0.8M) WNS savings then the cost was allocated to NSPM based on 2020 actuals NSPM allocation %. The bad debt as percentage of revenue is 0.35 percent. The Company anticipated bad debt expense is back to normal and no pandemic impact in 2023 and 2024. The non-commodity bad debt for 2022 budget is calculated by using the average of actual non-commodity bad debt from 2017 to 2020. For 2023 and 2024, the Company is using the same methodology as the 2022 Budget.

Customer and Innovation – Bad Debt 3
2022 NSPM Walk Forward of Major Cost Drivers
2021 July Year End Forecast 18,505 Revenue Variance 1,760 Rate Variance (2,130)
2022 Budget 18,134
2021 July Year End Forecast to 2022 Budget
(2,500)
(2,000)
(1,500)
(1,000)
(500)
-
500
1,000
1,500
2,000
Revenue Variance Rate Variance
Dolla
rs in
Tho
usan
ds
2022 v 2021 Forecast ($0.4)M, -2.0%

Customer and Innovation – Bad Debt 4
2022 NSPM Walk Forward of Major Cost Drivers The major cost drivers from an organizational perspective are: July 2021 Forecast commodity bad debt includes $2.9M COVID-19 incremental bad debt expense on billed commodity revenue. The Company anticipated bad debt to be impacted by recording incremental costs on arrearages and uncollectible expenses attributable to COVID-19 based on experience in past economic downturns and knowledge of the payment patterns for the various customer classes, resulting in increased reserves for billed account receivable with the resulting impact on reserves. The Company adjusted July 2021 bad debt year end forecast by increasing bad debt as percentage of billed commodity revenue to be the same as 2009 where there was great recession due to the financial impacts of the housing bubble and subsequent subprime mortgage crisis. July 2021 bad debt as percentage of revenue including ($0.8M) anticipated bad debt reduction from better collection effort in addition to ($1.1M) P2P and ($0.8M) WNS savings is 0.45 percent. Bad debt expense decreased ($0.4M) from the July 2021 year end forecast to the 2022 budget. The change is primarily made up of two drivers: Operating Company billed commodity revenue and percent of bad debt to revenue. Total billed commodity revenue in the July 2021 Forecast is $4.1B compared to $4.5B in 2022 Budget. The total impact to bad debt expense resulting from the change in total billed commodity revenues is $1.7M. Percent of total bad debt expense to billed commodity revenue is 0.45 percent in the July 2021 Forecast compared to 0.40 percent in 2022 budget. For 2021, the Company used bad debt expense as a percentage of billed commodity revenue from 2009 for Xcel Energy including ($0.8M) anticipated bad debt reduction from better collection effort in addition to ($1.1M) P2P and ($0.8M) WNS savings then the cost was allocated to NSPM based on 2020 actuals NPSM allocation %. For 2022, the Company used bad debt expense as a percentage of billed commodity revenue from 2010 for Xcel Energy including ($1.1M) P2P and ($0.8M) WNS savings then the cost was allocated to NSPM based on 2020 actuals NSPM allocation %. The total impact to bad debt expense resulting updating the percent of bad debt expense to billed commodity revenues is($2.1M).

Customer and Innovation – Bad Debt 5
2023 NSPM Walk Forward of Major Cost Drivers
2022 Budget 18,134 Revenue Variance 418 Rate Variance (2,382)
2023 Budget 16,170
2022 Budget to 2023 Budget
(3,000)
(2,500)
(2,000)
(1,500)
(1,000)
(500)
-
500
1,000
Revenue Variance Rate Variance
Dolla
rs in
Tho
usan
ds
2023 v 2022 Budget ($2.0)M, -10.8%

Customer and Innovation – Bad Debt 6
2023 NSPM Walk Forward of Major Cost Drivers The major cost drivers from an organizational perspective are: Bad debt expense decreased ($2M) from the 2022 budget to the 2023 budget. The change is primarily made up of two drivers: Operating Company billed commodity revenue and percent of bad debt to revenue. Total billed commodity revenue in the 2022 budget is $4.5B compared to $4.6B in the 2023 budget. The total impact to bad debt expense resulting from the change in total billed commodity revenues is $0.4M. Percent of total bad debt expense to billed commodity revenue in the 2022 budget is 0.40 percent compared to 0.35 percent in 2023 budgets. For 2022, the Company used bad debt expense as a percentage of billed commodity revenue from 2010 for Xcel Energy including ($1.1M) P2P and ($0.8M) WNS savings then the cost was allocated to NSPM based on 2020 actuals NSPM allocation %. For 2023, the Company used bad debt expense as a percentage of billed commodity revenue from 2019 for Xcel Energy including ($1.1M) P2P and ($0.8M) WNS savings then the cost was allocated to NSPM based on 2020 actuals NSPM allocation %. The total impact to bad debt expense resulting updating the percent of bad debt expense to billed commodity revenues is ($2.4M).

Customer and Innovation – Bad Debt 7
2024 NSPM Walk Forward of Major Cost Drivers
2023 Budget 16,170 Revenue Variance 632 Rate Variance 250
2024 Budget 17,052
2023 Budget to 2024 Budget
-
100
200
300
400
500
600
700
Revenue Variance Rate Variance
Dolla
rs in
Tho
usan
ds
2024 v 2023 Budget $0.9 M, 5.5%

Customer and Innovation – Bad Debt 8
2024 NSPM Walk Forward of Major Cost Drivers The major cost drivers from an organizational perspective are: Bad debt expense increased $0.9M from the 2023 budget to the 2024 budget. The change is primarily made up of two drivers: Operating Company billed commodity revenue and percent of bad debt to revenue. Total billed commodity revenue in the 2023 budget is $4.6B compared to $4.8B in the 2024 budget. The total impact to bad debt expense resulting from the change in total billed commodity revenues is $0.6M. Percent of total bad debt expense to billed commodity revenue in the 2023 budget is 0.347 percent compared to 0.352 percent in 2024 budgets. For 2023 and 2024, the Company used bad debt expense as a percentage of billed commodity revenue from 2019 for Xcel Energy including ($1.1M) P2P and ($0.8M) WNS savings then the cost was allocated to NSPM based on 2020 actuals NSPM allocation %. The total impact to bad debt expense resulting updating the percent of bad debt expense to billed commodity revenues is $0.3M.

Customer and Innovation – Bad Debt 9
Functional Organization Chart
Billing Services
Contact Center
Credit & Collection
Customer Care, Measurement, Data Analytics
Customer Policy & Assistance
Business Systems
Chief Customer & Innovation
Customer & Brand Strategy
Customer Solutions
Enterprise Security
Strategic Partnerships
Customer & Innovation
Customer Care
PSCO Donation
Meter Reading
Bad Debt

Customer and Innovation – Bad Debt 10
Cost Allocation Methodologies
The methods used to distribute costs to a legal entity and utility include: Operating Company Direct Charges: Bad Debt Expense is expensed in the Legal Entity where the customer account being written off resides. Service Company Allocated Charges: Not applicable. Service Company Direct Charges: Not applicable.
Customer and Innovation – Bad Debt 11
Approvals This document has been checked for errors in calculations and content. Prepared By: /s/ Date:
Kiem Thang
Financial Consultant Approved By: /s/ Date:
Adam Dietenberger Director, Shared Services Finance
Approved By: /s/ Date:
Chris Cardenas VP, Customer Care
10/14/2021
10/13/2021
10/13/2021

2022 – 2024 Budget Documentation
Customer and Innovation
Chief Customer and Innovation Officer

Major Business Functions and Key Activities
Customer and Innovation – Chief Customer and Innovation Officer 2
Introduction The Customer and Innovation organization is a part of Xcel Energy Services Inc. and provides critical services to meet the needs of Xcel Energy’s employees, technology users and energy customers. These services are provided in accordance with Service Agreements entered into with each subsidiary. The Service Agreements are administered in accordance with Federal Energy Regulatory Commission (FERC) regulations. The Chief Customer and Innovation Officer (CCIO) has oversight of eight groups: The Business Systems and Customer Care related groups are documented separately; this document outlines costs as they pertain to the remaining groups within Customer and Innovation. Chief Customer and Innovation Officer, provides ongoing support and leadership to Business Systems, Customer Care, Enterprise Security Services, Customer and Brand Strategy, Customer Solutions and Innovation, Innovation and Transformation Office, Strategic Partnerships and the non-regulated operations of HomeSmart. Business Systems, the technology business area of the Customer and Innovation group, manages the company’s information technology (IT) infrastructure to ensure that technology and security needs are met within the context of the enterprise’s business goals. Customer Care, provides a wide range of services including operating contact centers to provide a high quality and consistent customer experience, performing meter reading, billing services and credit and collections activities and managing the overall customer experience through training and quality assurance. Enterprise Security Services, is responsible for both the cyber and physical security to employees, protecting assets, performing investigations and incident response and assisting in regulatory compliance. Customer and Brand Strategy, services include producing and supervising the overall brand strategy and the placement of advertising and sponsorships. Additionally, the group manages our customer insights and experience related activities, as well as digital channel management. Customer Solutions and Innovation, provides customer related services to support the activities of Xcel Energy Inc. and its’ subsidiaries. These services include Demand Side Management (DSM) product development and management, Renewable product management, product strategy and development, DSM strategy, and economic development. Innovation and Transformation Office, manages enterprise wide projects and initiatives, to facilitate process redesign and continuous improvement, encourage collaboration across business areas and evaluate new and emerging technologies. Additionally provides project and change management support to the enterprise. Strategic Partnerships, focused on the identification and evaluation of opportunities to partner with outside entities to improve products and services provided by the enterprise, as well as, the development of electric vehicle and transportation initiatives.

2022 Walk Forward of Major Cost Drivers* (NSPM)
* Excludes Business Systems and Customer Care as they are addressed in separate documents.
Customer and Innovation – Chief Customer and Innovation Officer 3
Labor – Assumed staffing level and wages drive the costs of labor. Consulting – Costs incurred for initiatives and programs where outside expertise is required. Primarily focused on the development of new products, services and improved experiences for both internal and external stakeholders HomeSmart – Non-regulated business that provides repair, replacement, and maintenance of major appliances and systems. These costs are not recovered from ratepayers. Advertising – Spending related to both brand advertising and various sponsorships Employee Expenses – Employee expenses for travel, continued education, and professional conferences. IT Costs - Represents the support and maintenance costs for software and hardware technology and costs related to network services. Contributions & Dues – includes items such as professional association dues, community sponsorships, civic and political activity, utility associations, charitable contributions, and other deductions. Other – Includes the support and maintenance costs for software and hardware technology and costs related to network services, materials as well as bank charges, workforce administration expenses, license fees and permits, fleet costs, postage, employee workspace moves/adds/changes, and overheads.

2022 Walk Forward of Major Cost Drivers* (NSPM)
* Excludes Business Systems and Customer Care as they are addressed in separate documents.
Customer and Innovation – Chief Customer and Innovation Officer 4
The major cost drivers from an organizational perspective are: Labor: Increase is primarily due to the annual merit cycle as well as the timing of hiring open positions and the budget representing a fully staffed organization, less normal attrition. Consulting: Drivers for increased consulting include support for multiple initiatives ramping up in 2022. Distributed Intelligence work within the Innovation group, new focus on electric transportation, creation of more robust cyber defenses, and focus on more strategic revenue streams. HomeSmart – Non-regulated business that provides repair, replacement, and maintenance of major appliances and systems. These costs are not recovered from ratepayers. Advertising: Increase driven by broadened scope of advertising and brand imaging related to electric vehicles. Employee Expenses: Increase in employee expenses due to a return to more normal corporate travel and employee presence on property. Other: Primarily driven by increased spend related to cyber and physical security to respond to an everchanging risk environment and investments in new projects and innovative technologies.
2021 July Year End Forecast 36,457 Labor & Contractors 3,868 Consulting 5,150 HomeSmart 1,310 Advertising 784 IT Costs 653 Employee Expenses 1,217 Contributions & Dues 275 Other 6,739
2022 Budget 56,454
2021 July Year End Forecast to 2022 Budget

2023 Walk Forward of Major Cost Drivers* (NSPM)
* Excludes Business Systems and Customer Care as they are addressed in separate documents.
Customer and Innovation – Chief Customer and Innovation Officer 5
Labor – Assumed staffing level and wages drive the costs of labor. Consulting – Costs incurred for initiatives and programs where outside expertise is required. Primarily focused on the development of new products, services, and improved experiences for both internal and external stakeholders HomeSmart – Non-regulated business that provides repair, replacement, and maintenance of major appliances and systems. These costs are not recovered from ratepayers. Advertising – Spending related to both brand advertising and various sponsorships Employee Expenses – Employee expenses for travel, continued education, and professional conferences. IT Costs - Represents the support and maintenance costs for software and hardware technology and costs related to network services. Contributions & Dues – includes items such as professional association dues, community sponsorships, civic and political activity, utility associations, charitable contributions, and other deductions. Other – Includes the support and maintenance costs for software and hardware technology and costs related to network services, materials as well as bank charges, workforce administration expenses, license fees and permits, fleet costs, postage, employee workspace moves/adds/changes, and overheads.

2023 Walk Forward of Major Cost Drivers* (NSPM)
* Excludes Business Systems and Customer Care as they are addressed in separate documents.
Customer and Innovation – Chief Customer and Innovation Officer 6
The major cost drivers from an organizational perspective are: Labor: increase is primarily related to the annual merit increase Consulting: Distributed Intelligence work within the Innovation group, new focus on electric transportation, creation of more robust cyber defenses, and focus on more strategic revenue streams. HomeSmart – Non-regulated business that provides repair, replacement, and maintenance of major appliances and systems. These costs are not recovered from ratepayers.
2022 Budget 56,454 Labor & Contractors 1,229 Consulting 791 HomeSmart (515) Other 69
2023 Budget 58,028
2022 Budget to 2023 Budget

2024 Walk Forward of Major Cost Drivers* (NSPM)
* Excludes Business Systems and Customer Care as they are addressed in separate documents.
Customer and Innovation – Chief Customer and Innovation Officer 7
Labor – Assumed staffing level and wages drive the costs of labor. Consulting – Costs incurred for initiatives and programs where outside expertise is required. Primarily focused on the development of new products, services and improved experiences for both internal and external stakeholders HomeSmart – Non-regulated business that provides repair, replacement, and maintenance of major appliances and systems. These costs are not recovered from ratepayers. Advertising – Spending related to both brand advertising and various sponsorships Employee Expenses – Employee expenses for travel, continued education, and professional conferences. IT Costs - Represents the support and maintenance costs for software and hardware technology and costs related to network services. Contributions & Dues – includes items such as professional association dues, community sponsorships, civic and political activity, utility associations, charitable contributions, and other deductions. Other – Includes the support and maintenance costs for software and hardware technology and costs related to network services, materials as well as bank charges, workforce administration expenses, license fees and permits, fleet costs, postage, employee workspace moves/adds/changes, and overheads.

2024 Walk Forward of Major Cost Drivers* (NSPM)
* Excludes Business Systems and Customer Care as they are addressed in separate documents.
Customer and Innovation – Chief Customer and Innovation Officer 8
The major cost drivers from an organizational perspective are: Labor: increase is primarily related to the annual merit increase HomeSmart – Non-regulated business that provides repair, replacement, and maintenance of major appliances and systems. These costs are not recovered from ratepayers.
2023 Budget 58,028 Labor & Contractors 1,086 HomeSmart 243 Other 151
2024 Budget 59,508
2023 Budget to 2024 Budget

Functional Organization Chart
Customer and Innovation – Chief Customer and Innovation Officer 9
Customer and Innovation
Chief Customer and Innovation
Homesmart
Innovation Office
COS & EPMO
Customer & Brand Strategy
Strategic Partnership
Customer Solutions
Enterprise Security and Emergency
Management
Business Systems
Customer Care

Cost Allocation Methodologies
Customer and Innovation – Chief Customer and Innovation Officer 10
The primary methods utilized for each service area are described below. Please see Exhibit__(RLB-1), Schedule 4 for a complete list of the Company's allocators. Operating Company Direct Charges are costs incurred directly by a particular operating company. For example, the relevant operating company pays insurance premiums for operating-company-specific policies. These premiums are shown as direct charges to that operating company. Service Company Direct Charges are costs incurred by the Service Company on behalf of an operating company. For example, some Budgeting personnel may be involved in a specific operating company initiative (e.g., a rate case or other regulatory filing). Any Service Company labor costs associated with this initiative are billed directly to the relevant operating company. Service Company Allocated Charges are costs for which a unique operating company cannot be determined or which are incurred on behalf of all operating companies. For example, general Budgeting services are provided on a centralized basis for all Xcel Energy legal entities. The Service Company labor costs associated with these services are allocated to the legal entities using allocations. The primary methods utilized for each service area are described above. Please see Exhibit__(RLB-1), Schedule 4 for a complete list of the Company's allocators.
Allocating Cost
Center
JDE Subledger
Code
Allocating Cost
Center Name
Description
200063 110 Executive - Corporate Governance
Executive Corporate Governance includes the labor and non-labor costs for executive corporate management, long-term business strategy development and other programs that ensure the continuity and development of management. Corporate governance activities are generally services that are performed on behalf of all Xcel Energy operating companies and affiliates, including Xcel Energy Inc.
200074 529; 549; 551; 561 Corporate Systems – Corporate Governance
Corporate Systems – Corporate Governance includes the labor and non-labor costs for enterprise-wide corporate systems.
200108 N/A Advanced Metering Infrastructure (AMI)
Advanced Metering Infrastructure (AMI) includes the labor and non-labor costs associated with AMI.
200121 474 Distribution Electric & Gas and Transmission Gas Miscellaneous FERC 588, 880, & 859
Distribution Electric & Gas and Transmission Gas Miscellaneous FERC 588, 880, & 859 services include gas distribution, gas transmission, and electric distribution labor and non-labor costs associated with accounting, budgeting, and regulatory reporting.
200122 442 Transmission Electric Supervision & Engineering (S&E) FERC 560
Transmission Electric Supervision & Engineering (S&E) FERC 560 services include labor and expenses incurred in the general supervision and direction of the operation of the electric transmission system as a whole.
200149 534 Customer & Enterprise Solutions (CES)
Customer & Enterprise Solutions (CES) includes the labor and non-labor costs for the leadership of the Customer & Enterprise Solutions organization and their administrative support staff.
200152 436 Customer Care FERC 902
Customer Care FERC 902 services includes the labor and non-labor costs for meter reading of retail and wholesale customers and determining consumption for billing purposes as well as executing field collections.
200153 185 Customer Safety Advertising & Information Costs
Customer Safety Advertising & Information costs services includes the labor and non-labor costs associated with public safety advertising, information and education.

Cost Allocation Methodologies
Customer and Innovation – Chief Customer and Innovation Officer 11
Allocating Cost
Center
JDE Subledger
Code
Allocating Cost
Center Name
Description
200154 403 Customer Service Information Technology (IT) FERC 903
Customer Service Information Technology (IT) FERC 903 services includes the labor and non-labor costs for IT applications related customer billing to customers, call center support and credit and collections.
200162 519 Call Logging and Quality Management (CL/QM) FERC 903
Call Logging and Quality Management (CL/QM) FERC 903 includes the labor and non-labor operating costs for the application development and maintenance of the Call Logging and Quality Management system which is used to monitor and record calls for contact center training and leadership teams.
200171 503; 555 Customer Resource System (CRS) FERC 903
Customer Resource System (CRS) FERC 903 includes the labor and non-labor costs for the CRS system, specifically, application development and maintenance costs, licensing fees, server system costs and technology risk costs specific to disaster recovery of this application. CRS is Xcel Energy's customer service and billing system.
200805 N/A HomeSmart Revenue – Non-Utility 417.1
HomeSmart Revenue – Non-Utility 417,1 includes the labor and non-labor costs, including but not limited to business administration, advertising, marketing, software and technology costs related to all HomeSmart activity (Equipment Sales, Service Plan, and Service Call) across MN & CO Jurisdictions.

Approvals
Customer and Innovation – Chief Customer and Innovation Officer 12
This document has been checked for errors in calculations and content. Prepared By: /s/ Date:
Raynard Gray
Manager, Shared Services Finance Approved By: /s/ Date:
Adam Dietenberger Director, Shared Services Finance
Prepared By: Date:
Richard Schrubbe AVP, Financial Analysis and Planning
10/13/21
10/13/21
10/13/21 /s/

2022 – 2024 Budget Documentation
Human Resources and Employee Services: Human Resources, Corporate Giving, Enterprise Learning and Technical
Training, and Workforce Relations and Safety

Major Business Functions and Key Activities
Human Resources and Employee Services 2
Introduction Human Resources and Employee Services (HR) provides programs and services that attract, retain, and engage the employees necessary for the success of Xcel Energy businesses. These programs encompass the full employee life cycle. In addition to specific programs and services, HR, on behalf of Xcel Energy businesses, ensures that business areas are in full legal compliance with all HR-related laws and regulations, and tracks and reports information as required (e.g. compensation and benefits information and all equal employment opportunity (EEO) employment data).
HR consists of Human Resources, Corporate Giving, Enterprise Learning and Technical Training, and Workforce Relations and Safety. Additionally, Property Services and Aviation are included in Human Resources and Employee Services, but the budget overview is provided in a separate narrative.
Customer Value Xcel Energy’s HR organization is responsible for the design and administration of programs that enable the company to attract, retain and engage the employees necessary for the success of Xcel Energy businesses. Specifically, HR is responsible for the recruitment, selection and development of employees; the design and administration of various compensation and benefits programs; and compliance with state and federal law. HR’s objective is to ensure that such programs are market competitive, financially sustainable, and do not result in unreasonable costs for Xcel Energy customers. HR provides the tools and guidance to set employee performance goals in alignment with company strategy. HR helps manage and monitor compliance with employee labor laws. HR provides a call center to assist employees and managers with transactions including benefits enrollment, personnel and pay changes, and general HR questions and inquiries. HR’s centralized role builds efficiencies for the business by streamlining HR operations and executing on a long-term strategic vision. Due to a changing industry and workforce transition, Xcel Energy is facing a number of workforce challenges, for example, the ability to attracting and retain a qualified workforce which could have an adverse impact on operations. This requires that HR optimize the Company’s investments in human capital to maintain service levels while keeping overall customer rates as reasonable as possible. We have made it our mission to proactively shape an environment that attracts, retains, and engages high performing employees who fit well in Xcel Energy’s culture. With an emphasis on a performance-based culture, we have implemented a number of effective programs and improved our use of technology to strengthen planning, recruitment, and retention efforts. VP Human Resources – Executive office for the entire organization containing senior leadership and department wide administrative functions. Talent Strategy & Transformation – Creates value by aligning our human resources capability and capacity with our long term business goals. The outcome of our talent strategy ensures we are: hiring the right talent, building our leadership bench strength, and enhancing our reputation as an inclusive & diverse employer. • Talent Acquisition – Identifying, attracting, assessing, and selecting the right talent at the right
time • Training – Preparing our workforce to meet current business challenges, compliance standards
and regulatory requirements • Workforce Planning and Organizational Design – A consistent, data-driven approach to get the
right people in the right jobs while integrating budgeting and planning cycles, and enabling leaders to optimize the decisions about their workforce. Provides tools and guiding principles to enable leaders to create the right organizational structure, jobs, and/or roles to meet business objectives and support the Company’s strategic direction

Major Business Functions and Key Activities
Human Resources and Employee Services 3
• Culture – Energizing and enabling our workforce through diversity & inclusion and employee networking groups
Total Rewards - Responsible for delivering on Xcel Energy's employment value proposition by designing and delivering a total rewards package that is financially sustainable, market competitive, and employee valued. Our Total Rewards programs are built on a foundation of physical, financial, and emotional wellness with a focus on shared accountability between the employee and the company. Additionally, we reward based on performance and invest in employees with development. • Benefit Plan Design - Developing a comprehensive package of health and welfare programs.
Developing and administering retirement programs that are competitive with the utility industry to attract our specialized workforce including a 401(k) plan and a Cash Balance pension plan for new hires.
• Compensation - Providing base pay and short and long term incentives that in entirety align with 50% of the utility industry while recognizing the need to differentiate pay based on performance.
• Leadership development – Develop current and future leaders to improve company results, enhance leaders’ skill sets, and to build Xcel Energy’s leadership pipeline through a variety of leadership programs.
• Succession Planning – Matching our highest potential employees with our most critical opportunities to ensure business continuity through leadership.
• Employee Development – Design and manage learning opportunities to meet employee development needs, address career aspirations, and prepare for the future workforce through a variety of options such as developmental career assignments, customized mentoring and tuition reimbursement.
• Performance Management – Create a high performance-based culture with tools and guidance to create, accelerate and sustain high employee performance.
• HR Operations and Payroll - Administering benefits and pay programs. • HR Service Center - Interfacing with Xcel Energy employees and retirees on pay and benefits
questions.
Workforce Strategy & Consulting - Delivers value by working in close partnership and as a key advisor to business area leaders on a broad range of workforce strategies, actions, and practices. • Strategic Consulting - Leads business areas through planning process to address future
workforce needs, gaps, and solutions while ensuring alignment with corporate priorities and objectives
• HR Business Support – Supports business area management on full range of HR subjects and transactions
• Program Implementation Support - Leads implementation of HR programs within the business area
• Employment compliance - Ensures consistent application of HR policies and processes to minimize business area and corporate liability
HR Strategy & Performance – Aligns HR and Employee Services efforts with Company strategy, providing business oversight, strategic planning, communications, analytics, and consulting. • Workforce Analytics – Provides data-driven insights about Xcel Energy’s workforce in order to
improve company performance, enable leader accountability, and support the workforce transformation.
• Strategic Communications – Oversees and provides strategic consultation for communications from HR to employees and executive teams.
• O&M budget – Partners with Financial Operations to monitor the O&M budget and ensure alignment with company objectives
• Strategic Planning – Ensures the development and execution of a strategic plan for HR that aligns with Xcel Energy’s business goals and workforce objectives
• Employee Engagement – Administers annual Employee Engagement survey and provides consultative services to enable workforce engagement.

Major Business Functions and Key Activities
Human Resources and Employee Services 4
Enterprise Learning & Tech Training – Aligns HR and Employee Services efforts with Company strategy, providing enterprise learning and technical training. • Enterprise Learning – Oversees the company-wide non-technical training. • Nuclear Corporate Training – Oversees the training of nuclear employees and contractors. • Operations Technical Training – Oversees the training of all non-nuclear technical employees and
contractors.
Corporate Giving – Drive focused strategy-driven charitable programs that contribute to the success of Xcel Energy by supporting the economic strength and cultural vitality of our customer base, building goodwill among constituents, encouraging employee engagement and establishing the company's commitment to good corporate citizenship. • Work with the Xcel Energy Foundation to invest in nonprofits that are aligned with Xcel Energy
focus areas. Aiming to keep our communities desirable places to learn, work, and live. • Administration of the annual United Way campaign. Support the long-standing tradition of
employee giving, and leverages the United Way reach and reputation to extend the impact of our generosity and engagement
• Administration of the matched employee giving and volunteer contribution programs to create meaningful opportunities for employees to engage in their interest and service their communities
Workforce Relations and Safety – Support Xcel Energy in the development of safe, well trained, engaged and productive employees. Support Front Line Leadership Development, Improve Communications, Manage Workforce Transition, Align With Business Unit Partners, and last but not least, Employee Development and Accountability. • Workforce Relations provides management support for grievances, positive discipline and
bargaining employee relations issues. Workforce Relations represents the company in the negotiation and administration of Collective Bargaining Agreements. This team also oversees Equal Employment Opportunity (EEO) and employee relations, assisting employees and managers with investigation and consultation on matters of discrimination, harassment, policy violations, and workplace behavior.
• Safety is a core value at Xcel Energy. Our safety team works to lead the company on the Journey to Zero workplace injuries, and to provide for the safety of our customers and communities through appropriate programs and policies.

2022 Walk Forward of Major NSPM Cost Drivers
Human Resources and Employee Services 5
Labor & Contractors – HR employees design and administer multiple health, welfare, compensation, recruitment and selection, retirement, payroll, HR administration, labor relations, diversity, health services, learning and talent management programs, as well as provide consultation and advice to the business to manage workforce issues. HR uses contract outside vendors for staffing & recruitment administration and payroll & benefits program administration. Employee Expenses – Employee expenses for travel, continued education, and professional conferences. Contributions and Dues – Corporate giving funding of the Xcel Energy foundation, United Way campaign, Xcel Energy cost of company matched donations, and other charitable/community endeavors. Consulting and Outside Services – consulting costs are incurred for compensation, recruitment, selection and workforce planning, employee engagement, leadership training, and health services. All Other –Misc fees, postage and other general administrative costs.
Labor & Contractors 23.8
Employee Expenses 1.0
Consulting 0.7
Contributions & Dues
0.6 Other
2.1
Human Resources2022 O&M Budget = $28.3M

2022 Walk Forward of Major NSPM Cost Drivers
Human Resources and Employee Services 6
Human Resources 2022 O&M Budget Chart
(Dollars in thousands)
2021 July Year-End O&M Forecast $25,373
Labor 392
Company Labor with merit increase 160
Contract Labor for Staff Aug 232
Other 0
Employee Expenses 394
Consulting (54)
Consulting Professional Services Other (56)
Consulting Professional Services Accounting 2
Contributions & Dues 266
Dues 266
Net Other 1,921
2022 O&M Budget $28,292
Labor & Contractors – Base productive and non-productive labor costs are increased based on three percent base pay increases as well as the anticipation that the organization will be fully staffed in 2022. Employee Expenses – Increase driven assumed return to work and the workforce resuming some amount of travel and conference/training attendance.
(2,000)
-
2,000
4,000
Labor Employee Expenses Consulting Contributions &Dues
All Other
Human Resources 2022 O&M Budget Business Drivers
$2.6M increase, or 9.2%

2022 Walk Forward of Major NSPM Cost Drivers
Human Resources and Employee Services 7
Contributions and Dues – Increase driven primarily by an increase in charitable related contributions versus the 2021 forecast Other –The primary driver of this increases in spend across a variety of categories including software licenses, workforce administration expense, materials, advertising, and other costs.

2023 Walk Forward of Major NSPM Cost Drivers
Human Resources and Employee Services 8
Labor & Contractors – HR employees design and administer multiple health, welfare, compensation, recruitment and selection, retirement, payroll, HR administration, labor relations, diversity, health services, learning and talent management programs, as well as provide consultation and advice to the business to manage workforce issues. HR uses contract outside vendors for staffing & recruitment administration and payroll & benefits program administration. Employee Expenses - Employee expenses for travel, continued education, and professional conferences. Contributions and Dues – Corporate giving funding of the Xcel Energy foundation, United Way campaign, Xcel cost of company matched donations, and other charitable/community endeavors. Consulting – Consulting costs are incurred for compensation, recruitment, selection and workforce planning, employee engagement, leadership training, and health services. All Other –Misc fees, postage and other general administrative costs.
Labor & Contractors 24.9
Employee Expenses 1.0
Consulting 1.8
Contributions & Dues 4.2
Other 2.1
Human Resources2023 O&M Budget = $34.0M

2023 Walk Forward of Major NSPM Cost Drivers
Human Resources and Employee Services 9
Human Resources 2023 O&M Budget Chart
(Dollars in thousands)
2022 O&M Budget $28,292
Labor 1,060
Company Labor with merit increase 1,053
Contract Labor for Staff Aug 8
Employee Expenses (33)
Consulting 1,041
Consulting Professional Services Other 1,041
Contributions & Dues 3,583
Contributions 3,604
Dues (21)
Net Other 21
2023 O&M Budget $33,964
Labor & Contractors – Base productive and non-productive labor costs are increased based on three percent merit increases. Consulting – Ongoing software and product support for new HR system and potential for further development post deployment.
(1,000)
-
1,000
2,000
3,000
4,000
Labor Employee Expenses Consulting Contributions &Dues
All Other
Human Resources 2023 O&M Budget Business Drivers
$5.7M increase, or 16.7%

2023 Walk Forward of Major NSPM Cost Drivers
Human Resources and Employee Services 10
Contributions and Dues – HR resumes funding of all charitable gifts for Xcel Energy. These gifts/donations have been prefunded by proceeds from the sale of the Mankato Energy Center in years prior to 2023.

2024 Walk Forward of Major NSPM Cost Drivers
Human Resources and Employee Services 11
Labor & Contractors – HR employees design and administer multiple health, welfare, compensation, recruitment and selection, retirement, payroll, HR administration, labor relations, diversity, health services, learning and talent management programs, as well as provide consultation and advice to the business to manage workforce issues. HR uses contract outside vendors for staffing & recruitment administration and payroll & benefits program administration. Employee Expenses - Employee expenses for travel, continued education, and professional conferences. Contributions and Dues – Corporate giving funding of the Xcel Energy foundation, United Way campaign, Xcel cost of company matched donations, and other charitable/community endeavors. Consulting – Consulting costs are incurred for compensation, recruitment, selection and workforce planning, employee engagement, leadership training, and health services. All Other – Employee expenses, fees, postage and other general administrative costs.
Human Resources 2024 O&M Budget Chart
(Dollars in thousands)
2023 O&M Budget $33,964
Labor 792
Company Labor with merit increase 784
Contract Labor for Staff Aug 8
Labor & Contractors 25.7
Employee Expenses 1.0
Consulting 1.8
Contributions & Dues 4.2
Other 2.2
Human Resources2024 O&M Budget = $34.8M

2024 Walk Forward of Major NSPM Cost Drivers
Human Resources and Employee Services 12
Employee Expenses 10
Consulting 7
Consulting Professional Services Other 7
Contributions & Dues 6
Contributions 4
Dues 2
Net Other 22
2024 O&M Budget $34,801
Labor – Base productive and non-productive labor costs are increased based on three percent merit increases.
-
200
400
600
800
1,000
Labor Employee Expenses Consulting Contributions &Dues
All Other
Human Resources 2024 O&M Budget Business Drivers
$0.8M increase, or 2.4%

Functional Organization Chart
Human Resources and Employee Services 13
Human Resources and Employee Services
Corporate Giving
Human Resources
HR Business Consulting
HR Operations
HR Strategy & Performance
HR Talent Strategy & Transformation
HR Total Rewards
VP Human Resources
Enterprise Learning
Wrkforce Rel and Safety
Labor Negotiations
Safety
Strategy & Technical Training
Workforce Relations & Safety
Employee and Business Services
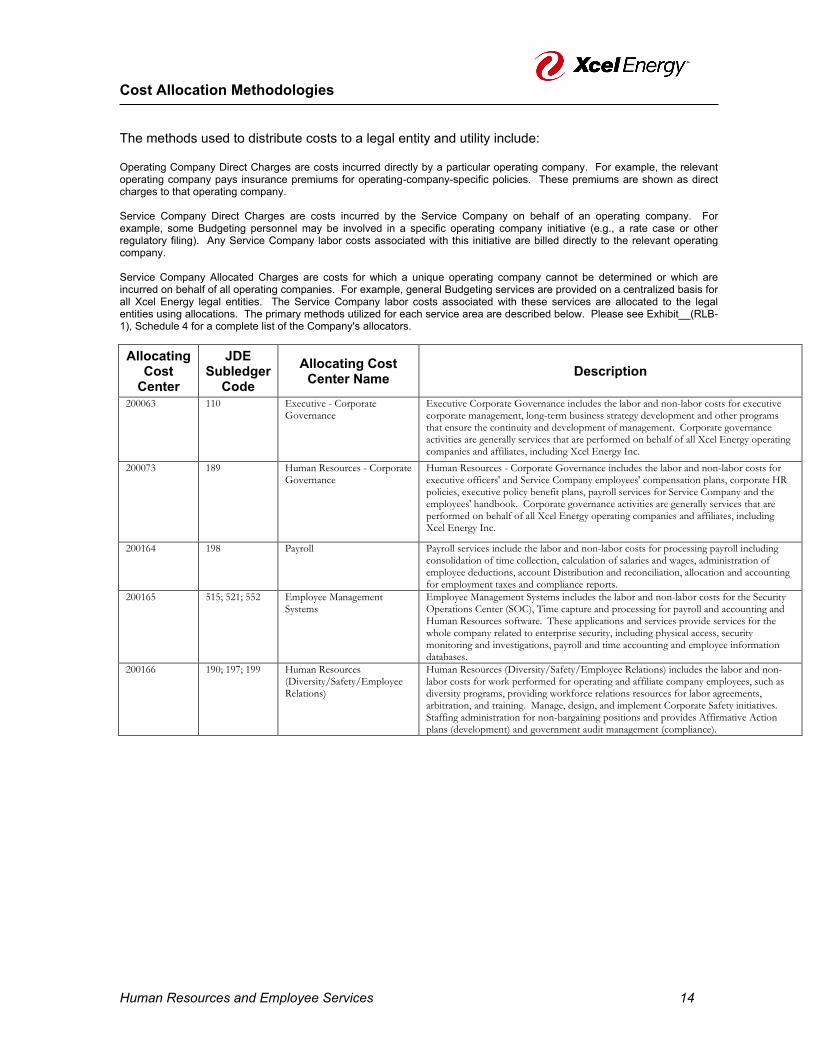
Cost Allocation Methodologies
Human Resources and Employee Services 14
The methods used to distribute costs to a legal entity and utility include:
Operating Company Direct Charges are costs incurred directly by a particular operating company. For example, the relevant operating company pays insurance premiums for operating-company-specific policies. These premiums are shown as direct charges to that operating company. Service Company Direct Charges are costs incurred by the Service Company on behalf of an operating company. For example, some Budgeting personnel may be involved in a specific operating company initiative (e.g., a rate case or other regulatory filing). Any Service Company labor costs associated with this initiative are billed directly to the relevant operating company. Service Company Allocated Charges are costs for which a unique operating company cannot be determined or which are incurred on behalf of all operating companies. For example, general Budgeting services are provided on a centralized basis for all Xcel Energy legal entities. The Service Company labor costs associated with these services are allocated to the legal entities using allocations. The primary methods utilized for each service area are described below. Please see Exhibit__(RLB-1), Schedule 4 for a complete list of the Company's allocators.
Allocating Cost
Center
JDE Subledger
Code
Allocating Cost Center Name
Description
200063 110 Executive - Corporate Governance
Executive Corporate Governance includes the labor and non-labor costs for executive corporate management, long-term business strategy development and other programs that ensure the continuity and development of management. Corporate governance activities are generally services that are performed on behalf of all Xcel Energy operating companies and affiliates, including Xcel Energy Inc.
200073 189 Human Resources - Corporate Governance
Human Resources - Corporate Governance includes the labor and non-labor costs for executive officers' and Service Company employees' compensation plans, corporate HR policies, executive policy benefit plans, payroll services for Service Company and the employees' handbook. Corporate governance activities are generally services that are performed on behalf of all Xcel Energy operating companies and affiliates, including Xcel Energy Inc.
200164 198 Payroll Payroll services include the labor and non-labor costs for processing payroll including consolidation of time collection, calculation of salaries and wages, administration of employee deductions, account Distribution and reconciliation, allocation and accounting for employment taxes and compliance reports.
200165 515; 521; 552 Employee Management Systems
Employee Management Systems includes the labor and non-labor costs for the Security Operations Center (SOC), Time capture and processing for payroll and accounting and Human Resources software. These applications and services provide services for the whole company related to enterprise security, including physical access, security monitoring and investigations, payroll and time accounting and employee information databases.
200166 190; 197; 199 Human Resources (Diversity/Safety/Employee Relations)
Human Resources (Diversity/Safety/Employee Relations) includes the labor and non-labor costs for work performed for operating and affiliate company employees, such as diversity programs, providing workforce relations resources for labor agreements, arbitration, and training. Manage, design, and implement Corporate Safety initiatives. Staffing administration for non-bargaining positions and provides Affirmative Action plans (development) and government audit management (compliance).

Approvals
Human Resources and Employee Services 15
This document has been checked for errors in calculations and content. Prepared By: /s/ Date:
Jack Haggard
Finance Manager Approved By: /s/ Date:
Adam Dietenberger Director, Shared Services Finance
Approved By: /s/ Date:
Rick Schrubbe AVP, Financial Planning & Analysis
10/17/2021
10/13/2021
10/11/2021

2022 – 2024 Budget Documentation
Human Resources and Employee Services:
Property Services and Aviation

Major Business Functions and Key Activities
Property Services & Aviation 2
Introduction The Property Services organization is a part of Xcel Energy Services Inc. and provides a variety of support services to Xcel Energy Inc. and its subsidiaries. Property Services includes management and maintenance of property and facilities, corporate mail, printing services, and facility space utilization. The Aviation and Travel Services organization is a part of Xcel Energy Services Inc. and provides a variety of support services to Xcel Energy Inc. and its subsidiaries. Aviation Services includes corporate aircraft operation and maintenance. Customer Value Property Services provides essential corporate services so employees can concentrate on serving Xcel Energy customers and the communities in which the company operates. Property Services operates and maintains corporate facilities, programs, and the real estate portfolio to maximize property utilization and functionality through activities such as site master planning, lease management, centralized mail and print services, records management, maintenance, and capital improvements. Property Services also makes important contributions to corporate costs savings through programs such as facility energy audits and facility space utilization.

2022 NSPM Major Cost Drivers
Property Services & Aviation 3
Labor & Contractors – Labor for Property Services and Aviation organization is made up of exempt and benefit personnel to perform the key activities described under the Major Business Functions and Key Activities section. Rents – Rents, leases, and property taxes for buildings in the entire Xcel Energy service territory, as well as two aircraft operated by the Aviation group leased through Bank of America. Facilities Costs – Property management and maintenance for buildings, generators, elevators, forklifts, compactors, fire systems, janitorial services, parking lot sweeping, snow removal and window and floor washing. Also, includes all utility and use costs such as electric, gas, water, sewer, and trash removal costs. Materials/Fuel – Driven mainly by fuel for Aviation’s two aircraft. Balance of spend are materials needed for facilities maintenance and repairs. All Other – Includes employee expense, consulting, fleet costs, postage, employee workspace moves/adds/changes, and copiers.
Facility Costs 11.0
Rents 9.0
Labor & Contractors
4.3
Materials/Fuel 0.7
Other 0.7
Property Services & Aviation2022 O&M Budget = 25.6M
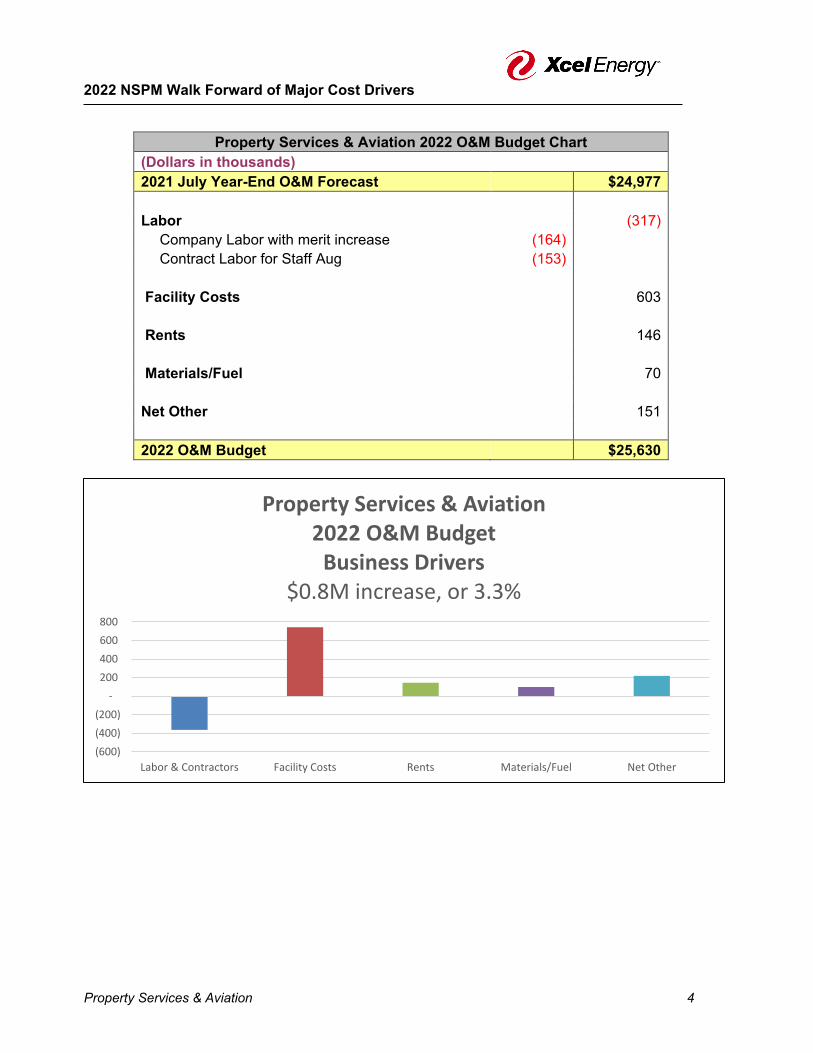
2022 NSPM Walk Forward of Major Cost Drivers
Property Services & Aviation 4
Property Services & Aviation 2022 O&M Budget Chart
(Dollars in thousands) 2021 July Year-End O&M Forecast $24,977 Labor (317)
Company Labor with merit increase (164) Contract Labor for Staff Aug (153)
Facility Costs 603
Rents 146 Materials/Fuel 70 Net Other 151 2022 O&M Budget $25,630
(600) (400) (200)
- 200 400 600 800
Labor & Contractors Facility Costs Rents Materials/Fuel Net Other
Property Services & Aviation2022 O&M Budget
Business Drivers$0.8M increase, or 3.3%

2022 NSPM Walk Forward of Major Cost Drivers
Property Services & Aviation 5
The major cost drivers from an organizational perspective are: Labor & Contractors: Reduction driven by some vacancies in 2021 not being filled or being repurposed, as well as some contractor costs being planned for under Facility Costs. Facilities Costs: The increase captures annual contract escalations and assumed year-over-year increased cost of services. As well as increased provisions for snow removal and utility costs based on historic trends. Rent: Increase in rent accounts for annual lease and property tax escalations, along with any planned renegotiated leases and associated fees. Fuel Costs / Material: Increase driven by assumed increase travel assumptions for 2022’s return to work. All Other: Increase driven by planned employee related expenses and cube restacks as office staff return to work.

2023 NSPM Major Cost Drivers
Property Services & Aviation 6
Labor & Contractors – Labor for Property Services and Aviation organization is made up of exempt and benefit personnel to perform the key activities described under the Major Business Functions and Key Activities section. Rents – Rents, leases, and property taxes for buildings in the entire Xcel Energy service territory, as well as two aircraft operated by the Aviation group leased through Bank of America. Facilities Costs – Property management and maintenance for buildings, generators, elevators, forklifts, compactors, fire systems, janitorial services, parking lot sweeping, snow removal and window and floor washing. Also, in includes all utility and use costs such as electric, gas, water, sewer, and trash removal costs. Materials/Fuel – Driven mainly by fuel for Aviation’s two aircraft. Balance of spend are materials needed for facilities maintenance and repairs. All Other – Includes employee expense, consulting, fleet costs, postage, employee workspace moves/adds/changes, and copiers.
Facility Costs 11.4
Rents 9.1
Labor & Contractors 4.4
Materials/Fuel 1.1
Other 0.1
Property Services & Aviation2023 O&M Budget = 26.1M

2023 NSPM Walk Forward of Major Cost Drivers
Property Services & Aviation 7
Property Services & Aviation 2023 O&M Budget Chart (Dollars in thousands) 2022 O&M Budget $25,630 Labor 99
Company Labor with merit increase 97 Contract Labor for Staff Aug 2
Facility Costs 394
Rents 106 Materials/Fuel 480 Net Other (571) 2023 O&M Budget $26,139
(800) (600) (400) (200)
- 200 400 600
Labor & Contractors Facility Costs Rents Materials/Fuel Net Other
Property Services & Aviation2023 O&M Budget
Business Drivers$0.5M increase, or 1.9%

2023 NSPM Walk Forward of Major Cost Drivers
Property Services & Aviation 8
The major cost drivers from an organizational perspective are: Labor & Contractors: The increase in labor is due to an assumed three percent annual merit increase. Facilities Costs: The increase captures annual contract escalations and assumed year-over-year increased cost of services. As well as increased provisions for snow removal and utility costs based on historic trends. Rent: Increase in rent accounts for annual lease and property tax escalations, along with any planned renegotiated leases and associated fees. Fuel Costs / Material: Increase driven by increased assumption for corporate travel coupled with fuel price assumptions and return to normal aviation maintenance schedule. All Other: Decrease driven drop off in assumed office configurations as the need for pandemic related cube restacks and floor reconfigurations declines.

2024 NSPM Major Cost Drivers
Property Services & Aviation 9
Labor & Contractors – Labor for Property Services and Aviation organization is made up of exempt and benefit personnel to perform the key activities described under the Major Business Functions and Key Activities section. Rents – Rents, leases, and property taxes for buildings in the entire Xcel Energy service territory, as well as two aircraft operated by the Aviation group leased through Bank of America. Facilities Costs – Property management and maintenance for buildings, generators, elevators, forklifts, compactors, fire systems, janitorial services, parking lot sweeping, snow removal and window and floor washing. Also, in includes all utility and use costs such as electric, gas, water, sewer, and trash removal costs. Materials/Fuel – Driven mainly by fuel for Aviation’s two aircraft. Balance of spend are materials needed for facilities maintenance and repairs. All Other – Includes employee expense, consulting, fleet costs, postage, employee workspace moves/adds/changes, and copiers.
Facility Costs 43%
Rents 34%
Labor & Contractors 17%
Materials/Fuel 6%
Other 0%
Property Services & Aviation2024 O&M Budget = 26.8M

2024 NSPM Walk Forward of Major Cost Drivers
Property Services & Aviation 10
Property Services & Aviation 2023 O&M Budget Chart
(Dollars in thousands) 2023 O&M Budget $26,139 Labor 124
Company Labor with merit increase 123 Contract Labor for Staff Aug 1
Facility Costs 42
Rents 97 Materials/Fuel 387 Net Other (17) 2024 O&M Budget $26,772
(100) -
100 200 300 400 500
Labor & Contractors Facility Costs Rents Materials/Fuel Net Other
Property Services & Aviation2024 O&M Budget
Business Drivers$0.6M increase, or 2.4%

2024 NSPM Walk Forward of Major Cost Drivers
Property Services & Aviation 11
The major cost drivers from an organizational perspective are: Labor & Contractors: The increase in labor is due to an assumed three percent annual merit increase Facilities Costs: Forecast increase in maintenance and utility costs resulting from inflation partially offset by cost reduction initiatives around facilities consolidation, prudent maintenance spend, and capital investment. Rent: Increase in rent accounts for annual lease and property tax escalations, along with any planned renegotiated leases and associated fees. Materials/Fuel – Increase driven by planned aircraft maintenance and engine overhauls coupled with escalation of assumed fuel prices.

Functional Organization Chart
Property Services & Aviation 12
Corporate Giving
Human Resources
Workforce Relations & Safety
Aviation & Travel Services
Corporate Admin Services
Corporate Real Estate
Facilities Operations & Maint
Project & Tenant Services
Property Services Mgmt
Property Services
Employee and Business Services
Human Resources & Employee Services

Functional Organization Chart
Property Services & Aviation 13
Property Services Corporate Administrative Services • Sorts and coordinates mail delivery. • Coordinates and executes copy and print services for customer requests of all size projects. • Coordinates and provides receptionist and switchboard conference call arrangements and
meeting room requests. • Provides personnel to answer calls to request service or report problems. • Develops record retention schedules, analyzes current filing systems, assists in developing or
converting file systems, and manages document destruction and off-site document storage. Corporate Real Estate • Provides negotiation, implementation and management of the cost and allocation of office
space leased and owned by Xcel Energy and affiliates. • Develops a long-range plan of action for managing and deploying the real estate portfolio
through consultation with management and analysis of business drivers that will influence efficient property utilization.
• Provides negotiation for acquisition, disposition, donation, exchange and lease of real property and facilities for Xcel Energy. These services include drafting and finalization of applicable and pertinent documentation to complete transactions.
• Manages real estate and land issues. Tasks include services related to resolving encroachment issues, trespass, condemnations, dedications, licenses, access agreements, leases and easements.
• Supports business areas pursuing special projects such as indenture filings, sale or acquisition of property, and protestation of taxes.
Facilities Operations and Maintenance • Provides for operations and maintenance, janitorial services, capital improvements, grounds
keeping and snow removal, signage, lighting, window washing, pest control and all other functions normally included in operating and maintaining facilities. Services also include negotiation, implementation and management of the associated costs.
• Implements special requests for site support for facilities that are not included in the Property Services portfolio of services.
Project and Tenant Services • Designs, plans and coordinates facility projects, manages construction, designs employee
workspace and relocation space projects, manages facility space utilization, and business area and space standards.
• Consults on special projects or studies requested by business areas, including engineering and design for civil and mechanical issues, building code compliance and training.
• Acts as primary contact for business area and customer facility requests. Coordinates employee moves, project planning, site visits and audits and conducts strategic planning.
Property Services Management • Provides leadership, vision and management direction for the operations of Property Services. • Reviews and approves policies, operational controls and the services portfolio of the Property
Services organization.
Aviation & Travel Services Aviation & Travel Services • Provides air travel via two aircraft, leased by Xcel Energy Services Inc. from Bank of America
Corporation, for Xcel Energy business purposes

Functional Organization Chart
Property Services & Aviation 14
• Provides scheduling, aircraft maintenance, operational administration and miscellaneous travel services to Xcel Energy employees for business purposes. Commercial travel services are administered by the Supply Chain organization.

Cost Allocation Methodologies
Property Services & Aviation 15
The methods used to distribute costs to a legal entity and utility include: Operating Company Direct Charges are costs incurred directly by a particular operating company. For example, the relevant operating company pays insurance premiums for operating-company-specific policies. These premiums are shown as direct charges to that operating company. Service Company Direct Charges are costs incurred by the Service Company on behalf of an operating company. For example, some Budgeting personnel may be involved in a specific operating company initiative (e.g., a rate case or other regulatory filing). Any Service Company labor costs associated with this initiative are billed directly to the relevant operating company. Service Company Allocated Charges are costs for which a unique operating company cannot be determined or which are incurred on behalf of all operating companies. For example, general Budgeting services are provided on a centralized basis for all Xcel Energy legal entities. The Service Company labor costs associated with these services are allocated to the legal entities using allocations. The primary methods utilized for each service area are described below. Please see Exhibit__(RLB-1), Schedule 4 for a complete list of the Company's allocators. Including the above Property Services uses the following methods to allocate facility costs to legal entities and utilities:
• Costs associated with facilities that benefit only the Operating Company where they are located are allocated across that specific Operating Company.
• Costs associated with facilities that are determined to benefit multiple Operating Companies (such as Corporate Headquarters or Call Centers) are allocated to the benefitting Operating Companies by specific allocators which are updated quarterly.
Allocating
Cost Center
JDE Subledger
Code
Allocating Cost Center Name Description
200063 110 Executive - Corporate Governance
Executive Corporate Governance includes the labor and non-labor costs for executive corporate management, long-term business strategy development and other programs that ensure the continuity and development of management. Corporate governance activities are generally services that are performed on behalf of all Xcel Energy operating companies and affiliates, including Xcel Energy Inc.
200073 189 Human Resources - Corporate Governance
Human Resources - Corporate Governance includes the labor and non-labor costs for executive officers' and Service Company employees' compensation plans, corporate HR policies, executive policy benefit plans, payroll services for Service Company and the employees' handbook. Corporate governance activities are generally services that are performed on behalf of all Xcel Energy operating companies and affiliates, including Xcel Energy Inc.
200164 198 Payroll Payroll services include the labor and non-labor costs for processing payroll including consolidation of time collection, calculation of salaries and wages, administration of employee deductions, account Distribution and reconciliation, allocation and accounting for employment taxes and compliance reports.
200165 515; 521; 552 Employee Management Systems
Employee Management Systems includes the labor and non-labor costs for the Security Operations Center (SOC), Time capture and processing for payroll and accounting and Human Resources software. These applications and services provide services for the whole company related to enterprise security, including physical access, security monitoring and investigations, payroll and time accounting and employee information databases.
200166 190; 197; 199 Human Resources (Diversity/Safety/Employee Relations)
Human Resources (Diversity/Safety/Employee Relations) includes the labor and non-labor costs for work performed for operating and affiliate company employees, such as diversity programs, providing workforce relations resources for labor agreements, arbitration, and training. Manage, design, and implement Corporate Safety initiatives. Staffing administration for non-bargaining positions and provides Affirmative Action

Cost Allocation Methodologies
Property Services & Aviation 16
plans (development) and government audit management (compliance).
Approvals
Property Services & Aviation 17
This document has been checked for errors in calculations and content. Prepared By: /s/ Date:
Jack Haggard
Manager, Shared Services Finance Approved By: /s/ Date:
Adam Dietenberger Director, Shared Services Finance
Approved By: /s/ Date:
Richard Schrubbe AVP, Financial Analysis and Planning
10/13/2021
10/11/2021
10/17/2021

Chief Executive Officer 1
2022 – 2024 Budget Documentation
Chief Executive Officer (CEO)

Chief Executive Officer 2
Major Business Functions and Key Activities Introduction The Chief Executive Officer (CEO) business area includes the CEO and support staff and the budget for the Chairman’s Fund and the Board of Director’s meetings, compensation and recruitment. The CEO oversees the vision, mission, values and strategic priorities of Xcel Energy: Vision We will be the preferred and trusted provider of the energy our customers need.
Mission We provide our customers the safe, clean, reliable energy services they want and value at a competitive price.
Values Our values reflect our core beliefs — who we are, how we conduct our business and the importance of our customers. They guide us in our work and in our interactions with each other. Strategic Priorities Lead the Clean Energy Transition Enhance the Customer Experience Keep Bills Low The Chairman's Fund contributions enhance Xcel Energy's leadership in emerging utility technologies, allowing for recognized involvement in projects that hold strategic, environmental, relationship and/or public relations value.

Chief Executive Officer 3
Chief Executive Officer – NSPM Total 2022 O&M Budget Major Cost Drivers
Utility Association Dues: Corporate dues include the Edison Electric Institute (EEI), the American Gas Association (AGA), American Clean Power (ACP), and American Renewable Energy (AREA). The portion of corporate dues used for lobbying is not recovered from ratepayers. Chairman’s Fund: Contributions and sponsorships are not recovered from ratepayers. Board of Directors: Board of Director compensation, meeting and travel expenses and recruiting costs to fill open director positions and compensation studies. Consulting: Consulting is comprised of services provided for public relations, culture change effort and executive communications efforts.

Chief Executive Officer 4
2022 Walk Forward of Major Cost Drivers
Labor: Budget includes funding for a new Executive Chairman of the Board position. Board of Directors: The decrease is driven reduced search firm expenses. Utility Association Dues: The increase is driven by anticipated renewable energy commitments.
2021 July Year End Forecast 4,464 Labor 300 BOD (76) Chairman's Fund 70 Dues-UtilAssoc 316 Other (35)
2022 Budget 5,041
2021 July Year End Forecast to 2022 Budget

Chief Executive Officer 5
Chief Executive Officer – NSPM Total 2023 O&M Budget Major Cost Drivers
Utility Association Dues: Corporate dues include the EEI, AGA, ACP, and AREA. The portion of corporate dues used for lobbying is not recovered from ratepayers. Chairman’s Fund: Contributions and sponsorships are not recovered from ratepayers. Board of Directors: Board of Director compensation, meeting and travel expenses and recruiting costs to fill open director positions and compensation studies. Consulting: Consulting is comprised of services provided for public relations, culture change effort and executive communications efforts.

Chief Executive Officer 6
2023 Walk Forward of Major Cost Drivers
Labor: Base productive and non-productive labor costs are increased based on three percent merit increases. Board of Directors: Costs fluctuate due to the requirements of the Board of Director functions and are dependent upon the nature of consulting needs from year to year.
2022 Budget 5,041 Labor 32 BOD 80
2023 Budget 5,152
2022 Budget to 2023 Budget

Chief Executive Officer 7
Chief Executive Officer – NSPM Total 2024 O&M Budget Major Cost Drivers
Utility Association Dues: Corporate dues include the EEI, AGA, ACP, and AREA. The portion of corporate dues used for lobbying is not recovered from ratepayers. Chairman’s Fund: Contributions and sponsorships are not recovered from ratepayers. Board of Directors: Board of Director compensation, meeting and travel expenses and recruiting costs to fill open director positions and compensation studies. Consulting: Consulting is comprised of services provided for public relations, culture change effort and executive communications efforts.

Chief Executive Officer 8
2024 Walk Forward of Major Cost Drivers
Labor: Base productive and non-productive labor costs are increased based on three percent merit increases. The decrease is driven by the lower budgeted headcount in 2023. Board of Directors: Costs fluctuate due to the requirements of the Board of Director functions and are dependent upon the nature of consulting needs from year to year.
2023 Budget 5,152 Labor (510) BOD 178 Other (5)
2024 Budget 4,815
2023 Budget to 2024 Budget

Chief Executive Officer 9
Chief Executive Officer Organization Chart
Chairman, President and Chief Executive Officer

Chief Executive Officer 10
Cost Allocation Methodologies The methods used to distribute costs to legal entity and utility. Operating Company Direct Charges: Direct Charges are costs incurred directly by a particular operating company. Whenever possible, the CEO organization direct charges items to the specific legal entities for which the service was performed or cost incurred. Service Company Direct Charges:
Service Company Direct Charges are costs incurred by the Service Company on behalf of an operating company. For example, some Budgeting personnel may be involved in a specific operating company initiative (e.g., a rate case or other regulatory filing). Any Service Company labor costs associated with this initiative are billed directly to the relevant operating company. Service Company Allocated Charges: Service Company Allocated Charges are costs for which a unique operating company cannot be determined or which are incurred on behalf of all operating companies. For example, general Budgeting services are provided on a centralized basis for all Xcel Energy legal entities. The Service Company labor costs associated with these services are allocated to the legal entities using allocations. The primary methods utilized for each service area are described above. Please see Exhibit__(RLB-1), Schedule 4 for a complete list of the Company's allocators.
Allocating Cost Center
JDE Subledger
Code Allocating Cost
Center Name Description
200063 110 Executive - Corporate Governance
Executive Corporate Governance includes the labor and non-labor costs for executive corporate management, long-term business strategy development and other programs that ensure the continuity and development of management. Corporate governance activities are generally services that are performed on behalf of all Xcel Energy operating companies and affiliates, including Xcel Energy Inc.
200075 114 Board of Directors - Corporate Governance
Board of Directors - Corporate Governance includes the labor and non-labor costs related to the Board of Directors (BOD). BOD costs may include Directors fees, retirement expenses and replacement fees; Board/Committee meetings and BOD related consulting. Corporate governance activities are generally services that are performed on behalf of all Xcel Energy operating companies and affiliates, including Xcel Energy Inc.
200088 127; 133 Accounting, Reporting, Tax & Audit Services -
Regulated Electric
Accounting, Reporting, Tax & Audit Services - Regulated Electric includes the labor and non-labor costs associated specifically with operating company electric utility revenue accounting, budgeting, regulatory reporting, sales and use taxes, business area support for utility areas, operating company budgeting support, capital asset accounting auditing operating companies , evaluating and improving risk management, ethical conduct and the implementation of best practices for operating companies electric utility, conducting financial operations and information system audits, performing audits and reviews for compliance with regulatory and legal requirements and contracts with vendors and other parties; establishing and reviewing internal controls for operating companies electric utility, establishing and reviewing SOX compliance requirements/control testing and evaluating contract risks for the operating companies electric utility. Additionally, costs for electric association dues including Edision Electric Institute (EEI).
200101 164 Legal Gas Legal Gas services include the labor and non-labor costs for operating companies gas utility legal services related to: labor and employment law, litigation, rates and regulation, environmental matters, real estate and contracts. This is primarily used by the General Counsel area.

Chief Executive Officer 11
Approvals This document has been checked for errors in calculations and content. Prepared By: /s/ Date:
Raynard Gray
Manager, Business Area Finance Approved By: /s/ Date:
Adam Dietenberger Director, Business Area Finance
Approved By: /s/ Date:
Rick Schrubbe AVP, Financial Analysis and Planning
10/13/2021
10/13/2021
10/11/2021

2022 – 2024 Budget Documentation
Risk, Audit and Compliance

Risk, Audit and Compliance 2
Major Business Functions and Key Activities Introduction Risk Management helps to ensure the integrity of company finances and operations through robust risk analytics, audit services and compliance with corporate ethics and other policies. Reporting to the Chief Risk Officer are Risk Management & Audit Services and Corporate Compliance.
Customer Value Risk Management & Audit Services The Vice President and Chief Risk Officer (CRO) provides leadership and oversight to the Risk Management organization, as well as facilitating and serving as a member of quarterly meetings of the Corporate Risk Management Oversight Committee and the Risk Management Committee. The CRO also participates as a member of the Transaction Review Committee, the Corporate Compliance and Business Conduct Council and the Investment Review Committee and has regular interaction with various other corporate governance councils and committees. Audit Services adds value and improves operations at Xcel Energy by serving as an independent, objective assurance, and consulting function. The group helps Xcel Energy achieve its goals and objectives by assisting management in the effective performance of duties and responsibilities by evaluating and improving risk management, internal controls, corporate governance, ethical conduct and the adoption of best practices Corporate Compliance Our corporate compliance and business conduct team ensures governance of our customer and corporate information and oversees our corporate compliance program. They also ensure continuity of our business should a corporate event, significant natural disaster or other event compromises our ability to serve customers.

Risk, Audit and Compliance 3
Risk, Audit and Compliance – 2022 NSPM O&M Budget Major Cost Drivers
Labor and Contractors – the Risk Management organization is made up of exempt, benefit, non-benefit, and contracted personnel to perform the key activities described under the Major Business and Key Activities section. Consulting – primarily for financial audits, regulatory compliance, cost studies and auditing co-source support Software – Online information services subscription. All Other – Primarily employee related expenses.
Labor & Contractors , 2.7
Consulting , 0.3
Software , 0.1 All Other , 0.1
Risk Management2022 Budget - $3.3M

Risk, Audit and Compliance 4
2022 Walk Forward of Major NSPM Cost Drivers
Risk Management 2021 NSPM O&M Budget Chart
(Dollars in thousands)
2021 July Year-End O&M Forecast $2,962
Labor 293
Company Labor with merit increase 363
Contract Labor for Staff Aug (66)
Other (3)
Consulting (7)
Consulting Professional Services - Accounting 51
Consulting Professional Services - Other (57)
Net Other 17
2022 O&M Budget $3,265

Risk, Audit and Compliance 5
2022 Walk Forward of Major NSPM O&M Cost Drivers (continued)
Labor: Primarily driven by three percent merit increases for internal labor offset by decreased reliance on contract labor
Consulting: Decreased use of consulting by performing some of those functions by department staff. Other: Increase primarily in employee expenses in 2022 due to employee return to work and assumed increased travel.

Risk, Audit and Compliance 6
Risk, Audit and Compliance – 2023 NSPM O&M Budget Major Cost Drivers
Labor and contract labor – the Risk Management organization is made up of exempt, benefit, non-benefit, and contracted personnel to perform the key activities described under the Major Business and Key Activities section. Consulting – primarily for financial audits, regulatory compliance, cost studies and auditing co-source support Software – Online information services. All Other – Primarily employee related expenses.
Labor & Contractors , 2.8
Consulting , 0.3
Software , 0.1
All Other , 0.1
Risk Management2023 Budget - $3.4M
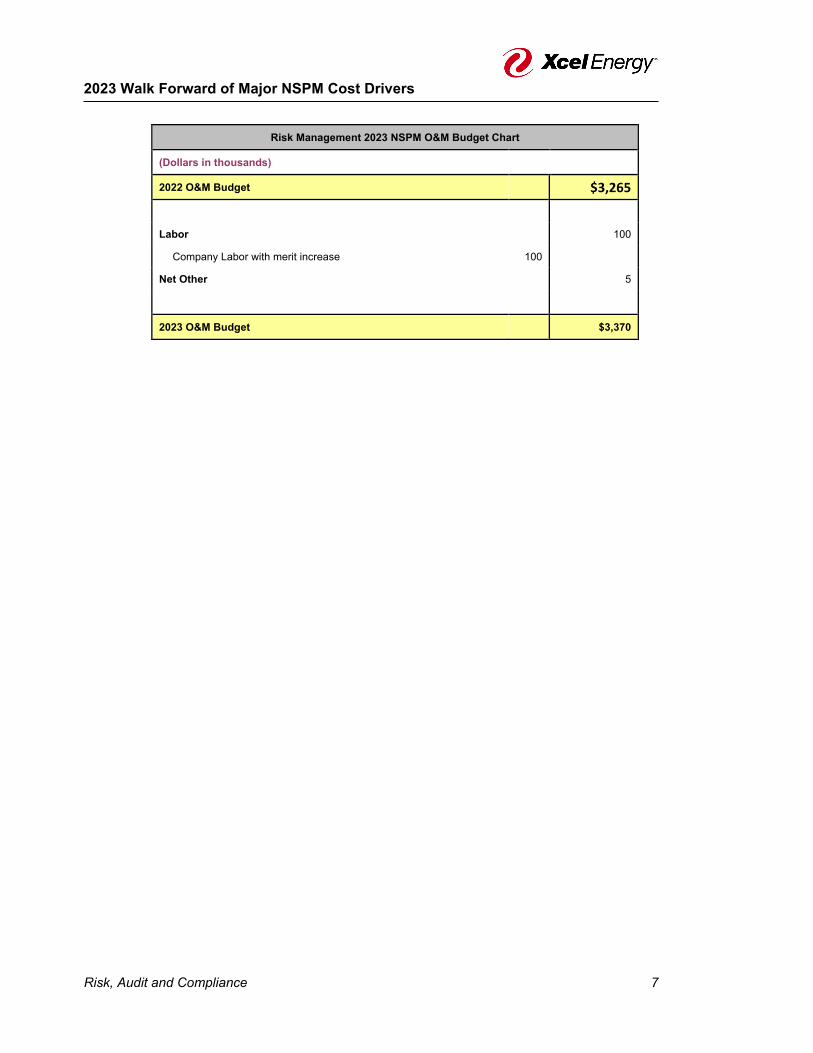
Risk, Audit and Compliance 7
2023 Walk Forward of Major NSPM Cost Drivers
Risk Management 2023 NSPM O&M Budget Chart
(Dollars in thousands)
2022 O&M Budget $3,265
Labor 100
Company Labor with merit increase 100
Net Other 5
2023 O&M Budget $3,370

Risk, Audit and Compliance 8
2023 Walk Forward of Major NSPM Cost Drivers (continued)
Labor: The year-over-year increase is primarily due to an assumed three percent annual merit increases for existing staff.

Risk, Audit and Compliance 9
Risk, Audit and Compliance – 2024 NSPM O&M Budget Major Cost Drivers
Labor and contract labor – the Risk Management organization is made up of exempt, benefit, non-benefit, and contracted personnel to perform the key activities described under the Major Business and Key Activities section. Consulting – primarily for financial audits, regulatory compliance, cost studies and auditing co-source support Software – Online information services. All Other – Primarily employee related expenses.
Labor & Contractors , 2.9
Consulting , 0.3
Software , 0.1 All Other , 0.1
Risk Management2024 Budget - $3.5M

Risk, Audit and Compliance 10
2024 Walk Forward of Major Cost Drivers
Risk Management 2023 NSPM O&M Budget Chart
(Dollars in thousands)
2023 O&M Budget $3,370
Labor 84
Labor 84
Net Other 6
2024 O&M Budget $3,460

Risk, Audit and Compliance 11
2024 Walk Forward of NSPM Major Cost Drivers (continued)
Labor: This year-over-year increase is primarily due to an assumed three percent annual merit increases for existing staff.
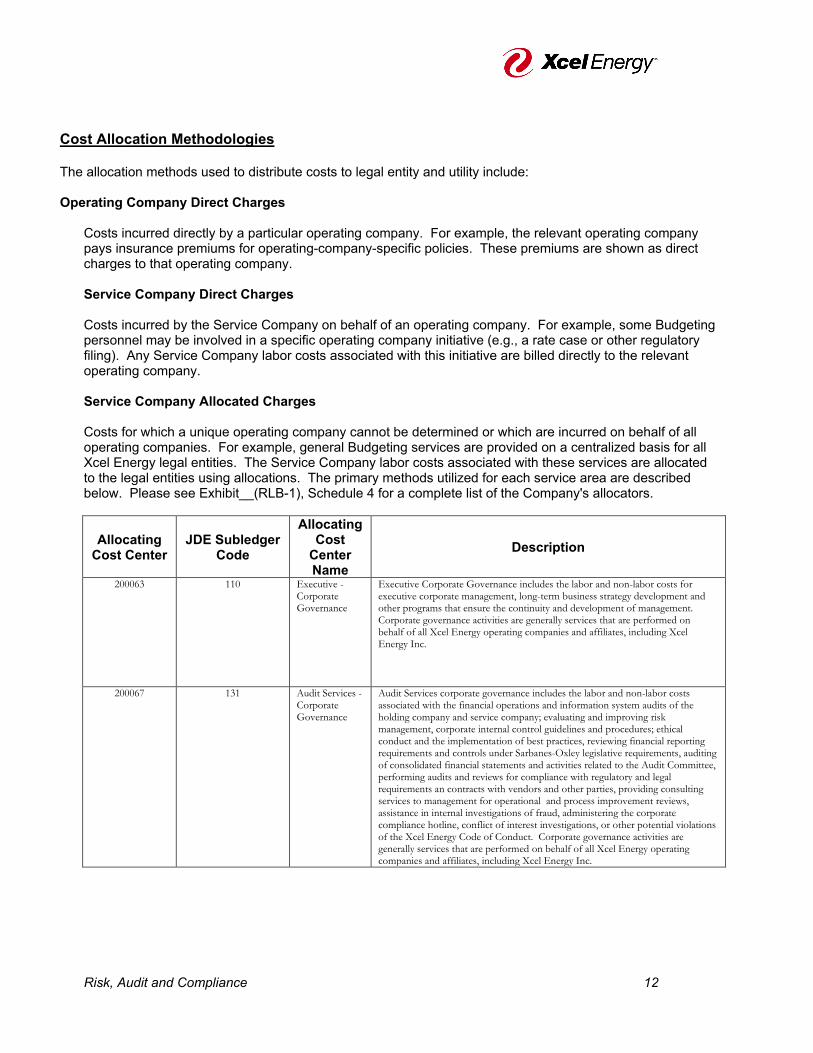
Risk, Audit and Compliance 12
Cost Allocation Methodologies The allocation methods used to distribute costs to legal entity and utility include: Operating Company Direct Charges
Costs incurred directly by a particular operating company. For example, the relevant operating company pays insurance premiums for operating-company-specific policies. These premiums are shown as direct charges to that operating company. Service Company Direct Charges Costs incurred by the Service Company on behalf of an operating company. For example, some Budgeting personnel may be involved in a specific operating company initiative (e.g., a rate case or other regulatory filing). Any Service Company labor costs associated with this initiative are billed directly to the relevant operating company. Service Company Allocated Charges Costs for which a unique operating company cannot be determined or which are incurred on behalf of all operating companies. For example, general Budgeting services are provided on a centralized basis for all Xcel Energy legal entities. The Service Company labor costs associated with these services are allocated to the legal entities using allocations. The primary methods utilized for each service area are described below. Please see Exhibit__(RLB-1), Schedule 4 for a complete list of the Company's allocators.
Allocating Cost Center
JDE Subledger Code
Allocating Cost
Center Name
Description
200063 110 Executive - Corporate Governance
Executive Corporate Governance includes the labor and non-labor costs for executive corporate management, long-term business strategy development and other programs that ensure the continuity and development of management. Corporate governance activities are generally services that are performed on behalf of all Xcel Energy operating companies and affiliates, including Xcel Energy Inc.
200067 131 Audit Services - Corporate Governance
Audit Services corporate governance includes the labor and non-labor costs associated with the financial operations and information system audits of the holding company and service company; evaluating and improving risk management, corporate internal control guidelines and procedures; ethical conduct and the implementation of best practices, reviewing financial reporting requirements and controls under Sarbanes-Oxley legislative requirements, auditing of consolidated financial statements and activities related to the Audit Committee, performing audits and reviews for compliance with regulatory and legal requirements an contracts with vendors and other parties, providing consulting services to management for operational and process improvement reviews, assistance in internal investigations of fraud, administering the corporate compliance hotline, conflict of interest investigations, or other potential violations of the Xcel Energy Code of Conduct. Corporate governance activities are generally services that are performed on behalf of all Xcel Energy operating companies and affiliates, including Xcel Energy Inc.

Risk, Audit and Compliance 13
Allocating Cost Center
JDE Subledger Code
Allocating Cost
Center Name
Description
200069 143 Risk Management - Corporate Governance
Risk Management Corporate Governance includes the labor and non-labor costs of providing administration of the Transaction Review Committee which handles contract and deal approvals for Commercial Operations, Resource Planning and Energy Supply, provides analysis associated with key risks facing Xcel Energy Inc., negotiates and manages required security (e.g., bank letters of credit, bonds and guarantees among others); reviews and approves all documents requiring Contracts area sign-off. Corporate governance activities are generally services that are performed on behalf of all Xcel Energy operating companies and affiliates, including Xcel Energy Inc.
200088 127; 133 Accounting, Reporting, Tax & Audit Services - Regulated Electric
Accounting, Reporting, Tax & Audit Services - Regulated Electric includes the labor and non-labor costs associated specifically with operating company electric utility revenue accounting, budgeting, regulatory reporting, sales and use taxes, business area support for utility areas, operating company budgeting support, capital asset accounting auditing operating companies , evaluating and improving risk management, ethical conduct and the implementation of best practices for operating companies electric utility, conducting financial operations and information system audits, performing audits and reviews for compliance with regulatory and legal requirements and contracts with vendors and other parties; establishing and reviewing internal controls for operating companies electric utility, establishing and reviewing SOX compliance requirements/control testing and evaluating contract risks for the operating companies electric utility. Additionally, costs for electric association dues including Edision Electric Institute (EEI).
200089 132 Audit Services - OpCo's & TransCo’s
Audit Services - OpCo's & TransCo’s includes the labor and non-labor costs for auditing operating companies, evaluating and improving risk management, ethical conduct and the implementation of best practices for operating companies, conducting financial operations and information system audits, performing audits and reviews for compliance with regulatory and legal requirements and contracts with vendors and other parties; establishing and reviewing internal controls for operating companies, establishing and reviewing SOX compliance requirements/control testing and evaluating contract risks for the operating companies.
200090 146 Risk Management - OpCo's & TransCo’s
Risk Management - OpCo's & TransCo’s includes the labor and non-labor costs of oversight and administrative of operating company risk management work, working with counterparties to establish enabling agreements with operating companies, risk management reports including all operating companies (such as CDAD - Contract Development, Approval & Delegation or TRC- Transaction Review Committee Reporting).
200100 134 Accounting, Reporting, Tax & Audit Services – Regulated Gas
Accounting, Reporting, Tax & Audit Services – Regulated Gas includes the labor and non-labor costs associated specifically with gas utility revenue accounting, budgeting, regulatory reporting, sales and use taxes, business area support for utility areas, capital asset accounting, auditing, evaluating and improving risk management, ethical conduct and the implementation of best practices for operating companies gas utility, conducting financial operations and information system audits, performing audits and reviews for compliance with regulatory and legal requirements and contracts with vendors and other parties; establishing and reviewing internal controls for operating companies gas utility, establishing and reviewing SOX compliance requirements/control testing and evaluating contract risks for the operating companies gas utility. Additionally, costs for gas association dues including American Gas Association (AGA).

Risk, Audit and Compliance 14
Allocating Cost Center
JDE Subledger Code
Allocating Cost
Center Name
Description
200134 144 Proprietary Trading - Front/Mid Office FERC 557
Proprietary Trading - Front/Mid Office FERC 557 includes the labor and non-labor costs associated with proprietary trading activities which are short term transactions undertaken in the wholesale electric markets where electricity is purchased for the purpose of selling it. Also included are supporting activities: evaluating the credit worthiness of counterparties, reviewing contracts to ensure that regulations are being complied with, evaluating profitability and appropriateness of trades to ensure they are in the best interest of shareholders and rate payers, and ensuring that trades identified as proprietary appropriately fall into that category.
200174 145 Generation Trading/Native Hedge - Mid Office FERC 557
Generation Trading/Native Hedge - Mid Office FERC 557 includes the labor and non-labor costs associated with independent evaluation and risk measurement of trading and generation book transactions, including preparing daily P&L (profit and loss) reports and individual trader profit and loss reports for the prop book, daily generation book valuation reports for each system showing all net fuel positions and any forward sales values and/or hedges, ensuring that margin reporting follows all SEC rules and GAAP reporting and that credit and risk policies and procedures are complied with.

Risk, Audit and Compliance 15
Approvals This document has been checked for errors in calculations and content. Prepared By: /s/ Date:
Jack Haggard
Manager, Shared Services Finance Approved By: /s/ Date:
Adam Dietenberger Director, Shared Services Finance
Approved By: /s/ Date:
Rick Schrubbe AVP Financial Planning & Analysis
10/13/2021
10/11/2021
10/17/2021

2022 – 2024 Budget Documentation Strategy Planning and External Affairs

Major Business Functions and Key Activities
Strategy Planning & External Affairs 2
Introduction The Strategy Planning and External Affairs organization is part of Xcel Energy Services, Inc and provides Xcel Energy’s business strategy development, communications and federal regulatory and legislative initiatives. The organization identifies strategies that promote the company’s value in a variety of business, policy and energy-related areas. Among other things, it develops strategies associated with sustainability, climate change, renewable energy, utility regulation, federal tax policy, energy markets, transmission and innovative technologies. It is also responsible for both business planning and generation resource planning. The organization develops Xcel Energy’s public policy positions and ensures those positions create value for the corporation, its customers and its many stakeholders. The organization designs and advocates for federal and state policies and represents the company before U.S. Congress and various federal agencies. Finally, it is responsible for Xcel Energy’s strategic communications and public relations. The Federal Government Affairs organization promotes the company’s interests in the federal policy development process, working directly with congressional and administration officials on a range of issues affecting our customers, shareholders and the communities we operate in. The group also leads the company's efforts to coordinate as necessary with national trade associations such as the Edison Electric Institute, Nuclear Energy Institute, and the American Gas Association. The Federal Regulatory Affairs group leads the company’s efforts related to the Federal Energy Regulatory Commission (FERC) and the North American Electric Corporation (NERC) on policy and regulatory issues including wholesale transmission and markets matters and electric grid reliability. Activities include management of the company’s filings and protesting and commenting on rulemakings, third party filings and reliability standards. The group also advises internal personnel on tariff and regulatory requirements and provides enterprise-wide oversight of compliance with FERC and NERC requirements. The Environmental Policy group is responsible for advancing Xcel Energy's public policy strategy in a way that ensures the company's positions create value for customers, shareholders, and many stakeholders. The organization designs and advocates for federal and state policies in the areas of climate and clean energy. It also supports the company’s environmental, social and governance reporting. Strategy, Planning and External Affairs is responsible for working with Senior Executives and Senior Management to ensure operating companies overall business plan and long-term strategy development is aligned with all organizational processes, systems, and structures. This involves the coordination of existing planning groups and tools to develop the business plans consistently throughout the organization. Strategy and Planning group helps facilitate corporate strategy and ensure that our goals, metrics, resource plans, and business plans focus on the long-term stability and direction of our organization. This team provides insight and analysis on competitive intelligence analysis, industry assessments and benchmarking studies. The group also oversees Company’s long-term strategic planning activities for all operating companies, which includes facilitating and developing asset and financial plans for the Operating Companies. Resource plans developed directs the systems, processes and personnel required to prepare, file and secure needed key stakeholder support and regulatory approval of effective and prudent long-term resource plans to continue to meet customers’ existing and forecasted future electric needs. In implementing these plans, Strategy and Planning directs competitive bidding power supply resource solicitation processes to procure needed capacity and energy to meet current and forecasted customer demand and energy requirements with a key emphasis on achieving cost reductions in the Xcel supply portfolios for each of the four Xcel Energy operating utilities while also meeting reliability and environmental requirements and Corporate objectives. The Strategic Communications team provides overall governance of our external brand and reputational messaging. They provide guidance and strategy on how we address critical issues and how we position Xcel Energy within our industry, with our customers and the communities that we serve. This team also supports communication on AGIS initiative across jurisdictions. They provide communications services support to major business areas including writing, graphic design, video production, senior leadership meeting and event

Major Business Functions and Key Activities
Strategy Planning & External Affairs 3
planning as well as supporting the internal communications channels. They also provide executive-level support in CEO communications, investor relations and messaging and branding around our growth efforts.
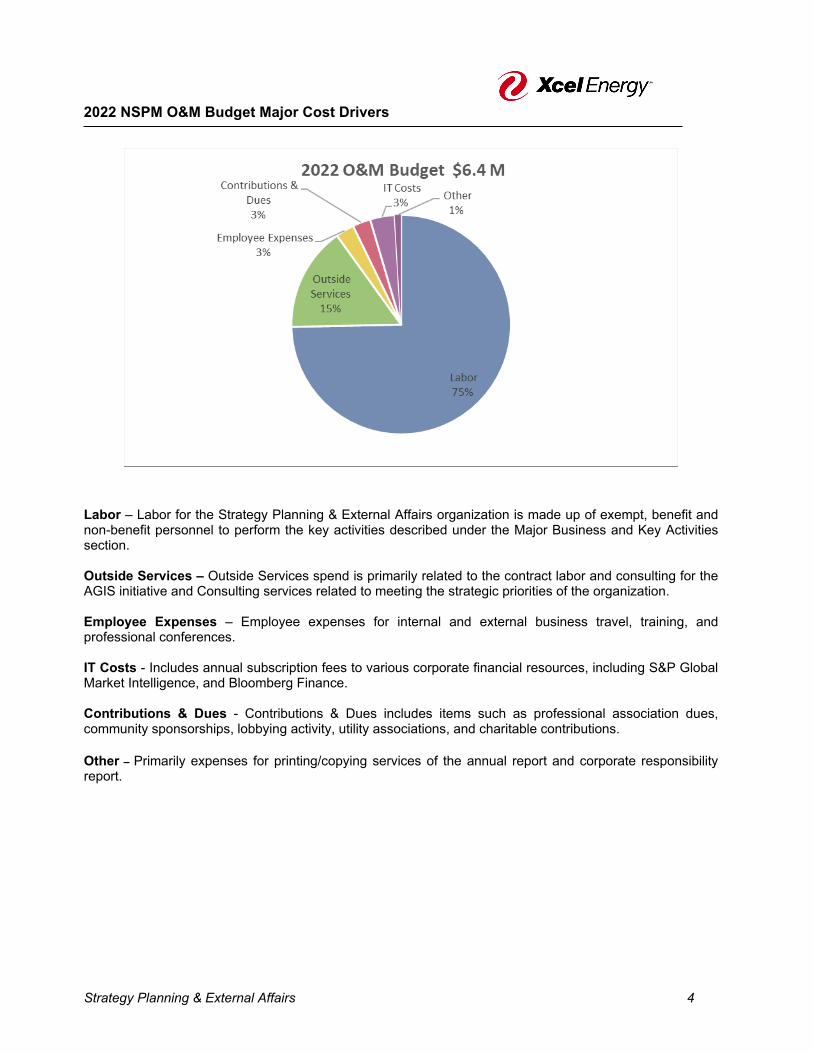
2022 NSPM O&M Budget Major Cost Drivers
Strategy Planning & External Affairs 4
Labor – Labor for the Strategy Planning & External Affairs organization is made up of exempt, benefit and non-benefit personnel to perform the key activities described under the Major Business and Key Activities section. Outside Services – Outside Services spend is primarily related to the contract labor and consulting for the AGIS initiative and Consulting services related to meeting the strategic priorities of the organization. Employee Expenses – Employee expenses for internal and external business travel, training, and professional conferences. IT Costs - Includes annual subscription fees to various corporate financial resources, including S&P Global Market Intelligence, and Bloomberg Finance. Contributions & Dues - Contributions & Dues includes items such as professional association dues, community sponsorships, lobbying activity, utility associations, and charitable contributions.
Other – Primarily expenses for printing/copying services of the annual report and corporate responsibility report.

2022 NSPM Walk Forward of Major Cost Drivers
Strategy Planning & External Affairs 5
Labor – Base productive and non-productive labor costs are increased based on three percent merit increases. The budget includes an updated workforce plan and full staffing levels. Employee Expenses – Increased year-over-year expenses are driven by reduced activity in 2021 due to companywide travel restrictions. 2022 is budgeted at 70 percent of 2019 levels with a marginal increase compared to 2021 in expected activity levels for the organization to achieve its objectives. Contributions & Dues –Year-over-year decrease in Lobbying-Dues due to one-time additional contributions in 2021 to support political associations affiliated with the company’s strategic plan. The additional contribution will not continue in 2022. Outside Services – Year-over-year decrease is due to additional spend on tax consulting in 2021 which will not continue in 2022, ($0.2M). The decrease was offset by increases for: (1) general consulting supporting Senior Management’s long-term strategy development, $0.1M and (2) spend on environmental federal policy strategy, $0.1M. Contract labor and consulting spend for AGIS initiative communications is flat to 2021. Other – Decrease in annual printing expenses for the annual report and corporate responsibility report.
2021 July Year End Forecast 5,952 Labor 405 Employee Expenses 71 Contributions & Dues (22) Outside Services (11) Other (45)
2022 Budget 6,350
2021 July Year End Forecast to 2022 Budget

2023 NSPM O&M Budget Major Cost Drivers
Strategy Planning & External Affairs 6
Labor – Labor for the Strategy Planning & External Affairs organization is made up of exempt, benefit and non-benefit personnel to perform the key activities described under the Major Business and Key Activities section. Outside Services – Outside Services spend is primarily related to the contract labor and consulting for the AGIS initiative and Consulting services for meeting the strategic priorities of the organization. Employee Expenses – Employee expenses internal and external business travel, training, and professional conferences. IT Costs - Includes annual subscription fees to various corporate financial resources, including S&P Global Market Intelligence, and Bloomberg Finance. Contributions & Dues - Includes items such as professional association dues, community sponsorships, lobbying activity, utility associations, and charitable contributions.
Other – Primarily expenses for printing/copying services of the annual report and corporate responsibility report.

2023 NSPM Walk Forward of Major Cost Drivers
Strategy Planning & External Affairs 7
Labor – Base productive and non-productive labor costs are increased based on three percent merit increases, $0.1M. The budget includes an updated workforce plan and full staffing levels. Outside Services – Decrease in AGIS consulting and contract labor spend as the program roll-out progresses.
2022 Budget 6,350 Labor 121 Outside Services (18)
2023 Budget 6,453
2022 Budget to 2023 Budget

2024 NSPM O&M Budget Major Cost Drivers
Strategy Planning & External Affairs 8
Labor – Labor for the Strategy Planning & External Affairs organization is made up of exempt, benefit and non-benefit personnel to perform the key activities described under the Major Business and Key Activities section. Outside Services – Outside Services spend is primarily related to the contract labor and consulting for the AGIS initiative and Consulting services related to meeting the strategic priorities of the organization. Employee Expenses – Employee expenses internal and external business travel, training, and professional conferences. IT Costs - Includes annual subscription fees to various corporate financial resources, including S&P Global Market Intelligence, and Bloomberg Finance. Contributions & Dues - Contributions & Dues includes items such as professional association dues, community sponsorships, lobbying activity, utility associations, and charitable contributions.
Other – Primarily expenses for printing/copying services of the annual report and corporate responsibility report.

2024 NSPM Walk Forward of Major Cost Drivers
Strategy Planning & External Affairs 9
Labor – Base productive and non-productive labor costs are increased based on three percent merit increases, $0.1M. The budget includes an updated workforce plan and full staffing levels. Outside Services – Decrease in AGIS consulting and contract labor spend as the program roll-out progresses.
2023 Budget 6,453 Labor 132 Outside Services (54)
2024 Budget 6,531
2023 Budget to 2024 Budget

Functional Organization Chart
Strategy Planning & External Affairs 10
Environmental Policy Federal Government Affairs Federal Regulatory Affairs Strategic Communications Strategy and Planning
Strategy Planning & External Affairs

Cost Allocation Methodologies
Strategy Planning & External Affairs 11
The methods used to distribute costs to legal entity and utility include: Operating Company Direct Charges: Strategy Planning and External Affairs direct charges non-labor costs to the specific legal entity for which the services were performed or costs incurred. Service Company Direct Charges: Service Company charges are direct charged whenever possible. Strategy Planning and External Affairs direct charges most labor and non-labor costs to the specific legal entity for which the services were performed or costs incurred. Service Company Allocated Charges: When direct charging is not practical, or where services performed are not specifically related to a legal entity, Strategy Planning and External Affairs allocates labor and non-labor costs to the legal entities benefiting from the services performed or costs incurred. The primary methods utilized for each service area are described below. Please see Exhibit__(RLB-1), Schedule 4 for a complete list of the Company's allocators.
Allocating Cost Center
JDE Subledger
Code Allocating Cost
Center Name Description
200070 161 Corporate Strategy & Business Development
- Corporate Governance
Corporate Strategy & Business Development - Corporate Governance includes the labor and non-labor costs associated with providing leadership for the implementation of company-wide business strategies and plans; portfolio management including the evaluation of potential opportunities for mergers, acquisitions and divestitures; providing financial, analytical and reporting support; researching and providing business intelligence information. Corporate governance activities are generally services that are performed on behalf of all Xcel Energy operating companies and affiliates, including Xcel Energy Inc.
200072 180 Communications - Corporate Governance
Communications - Corporate Governance includes the labor and non-labor costs to assist and ensure Executive Management, Investor Relations and others communicate appropriately with shareholders, the public, and other key stakeholder audiences. Key projects include: development and production of the annual report and other communications to investors; speeches, videos, and major presentations delivered by top executives; and speeches, displays, video and presentations for the company's annual meeting of shareholders. Media Relations contributes to building Xcel Energy's reputation by developing media and public relations strategies for major company initiatives and issues; responding to news media inquiries; working pro-actively with the media to forward story ideas and information about company events, policies and actions, and providing media training for company spokespersons. Media Relations also plays a key role in crisis communications and emergency preparedness efforts. Corporate governance activities are generally services that are performed on behalf of all Xcel Energy operating companies and affiliates, including Xcel Energy Inc.
200078 410 Governmental Affairs Governmental Affairs includes the labor and non-labor costs associated with the interpretation of laws regulations and environmental policy to ensure compliance and cost effectiveness for Xcel Energy customers and stockholders Internal legislative policy development and issues management, appraise management and internal customers of political and policy trends and developments, develop and maintain relationships with regulatory officials and staff.
200079 409 Federal Lobbying Federal Lobbying services includes the labor and non-labor costs for federal and state lobbying activities and the federal Political Action Committee (PAC).
200136 415 Energy Markets - Fuel Energy Markets - Fuel includes the labor and non-labor costs for planning and implementing power supply portfolios to provide reliable service to native load and to capitalize on market opportunities including purchasing fuel for the operating companies' electric generation system (excluding

Cost Allocation Methodologies
Strategy Planning & External Affairs 12
nuclear) and resource planning and acquisition including purchase power and account management.
200163 181 Employee Communications
Employee Communications includes the labor and non-labor costs for the development and enhancement of employee awareness and understanding of the company's strategies, priorities, decisions and performance objectives. It develops and produces regular communication vehicles, including TODAY (daily news bulleting on intranet); XTRA (monthly print publication for all employees and retirees); All Managers E-mail (real-time communication for employees who supervise and manage others); Focus on Financials for all employees; targeted communications for specific business areas, such as Human Resources, and employee meetings.
200177 418 Rates & Regulation - Electric
Rates & Regulation - Electric includes the labor and non-labor costs for determining the regulated utilities' electric utility revenue requirements and rates for electric customers regulatory strategy, coordinating the regulatory compliance requirements, establishing and maintaining relationships with regulatory bodies, policy development of regulatory and legislative strategy, preparing and organizing rate case filings.

Approvals
Strategy Planning & External Affairs 13
This document has been checked for errors in calculations and content. Prepared By: /s/ Date:
Raynard Gray
Manager, Business Area Finance Approved By: /s/ Date:
Adam Dietenberger Director, Business Area Finance
Date:
Rick Schrubbe AVP, Financial Analysis & Planning
/s/
10/13/2021
10/13/2021
10/11/2021
2022 - 2024 Budget Documentation
Corporate Other
Northern States Power Company - Minnesota (NSPM)

Major Business Functions and Key Activities Introduction Corporate Other includes the costs that are not directly attributable to a specific business area. Corporate Other contains the following functions: company use credits, overhead charges to affiliates, A&G charges to capital, non-regulated overheads, and permanent income tax differences. Detailed descriptions of each business function are described under the major business functions and key activities section of the narrative. A&G Charges to Capital: Each month, A&G overheads are applied to capital work orders that contain overhead eligible charges. During the month end close process, overheads are applied to each eligible install and removal type work order. The PowerPlan system gathers all eligible current month expenditures for each work order and applies the A&G percentage rate to those expenditures. This amount is then applied to work orders with the offsetting credit amount charged to the A&G capital clearing work order using the current monthly overhead rate The credits to A&G overhead O&M to transfer those costs to the Capital overhead pool (debit) are recorded within Corporate Other. A/P and Corporate Credit Card Accruals: The Company records unassigned monthly credit card expenses to Corporate Other business area as a reversing entry in order to correctly record the liability associated with employee expenses. Credit Card Rebates: The credit rebates we receive from our credit card vendors for rebates earned by using the credit cards. These credits offset NSPM expenses within Corporate Other. Company Use: Offsetting credits are recorded to the Corporate Other business area in Miscellaneous Operating and Maintenance (O&M) credits (Federal Energy Regulatory Commission (FERC) account 929, Administrative & General (A&G) Duplicate Charge Credit) for facilities that are company owned and use utility services that are provided by the company. For example, if an electric distribution substation uses electricity from the company grid, the cost of that electricity is charged to distribution. Similar transactions are recorded when a gas department facility uses gas and the steam department uses steam.
Non-regulated Overheads: Credits are recorded to the Corporate Other business area in Miscellaneous O&M credits (FERC account 922, A&G Admin Transferred Credit) to offset labor overheads, A&G overheads and the corporate residual applied to non-regulated business activities to insure fully allocated costing for services provided to the non-regulated businesses. NSP Transmission Joint Ventures: Credits are recorded to the Corporate Other business area in Miscellaneous O&M credits (FERC account 922, A&G Admin Transferred Credit) to offset the A&G expenses allowable per contract that are billed to 3rd party partners. This is to recover administrative costs that are not direct charged to the project – it’s a debit to our JV partners’ receivables and a credit back to NSPM/W FERC 922. Transmission Interchange: The Interchange Agreement, (I/A), is a FERC approved tariff that provides for the inter-company sharing of production and transmission costs of Northern States Power Company – Minnesota (NSPM) and Northern States Power Company – Wisconsin (NSPW). Fluctuations in cost are related to plant investment and business area expenses.

Corporate Other 3
2022 Corporate Other Budget
2022 Walk Forward of Major Cost Drivers
2022 Walk Forward of Major Cost Drivers Transmission Interchange ($7.5M increase in 2022): The Interchange Agreement, (I/A), is a FERC approved tariff that provides for the inter-company sharing of production and transmission costs of Northern States Power Company – Minnesota (NSPM) and Northern States Power Company – Wisconsin (NSPW). Fluctuations in cost are related to plant investment and business area expenses. The significant driver for the increase is due to increased transmission line investments going into service across many individual projects (largest new project being the Bayfield Second Circuit).

Corporate Other 4
2023 Corporate Other Budget
2023 Walk Forward of Major Cost Drivers
Transmission Interchange ($10.7M increase in 2023): The Interchange Agreement, (I/A), is a FERC approved tariff that provides for the inter-company sharing of production and transmission costs of Northern States Power Company – Minnesota (NSPM) and Northern States Power Company – Wisconsin (NSPW). Fluctuations in cost are related to plant investment and business area expenses. The significant driver for the increase is due to increased transmission line investments going into service across many individual projects (largest new project being the St. Croix River to Eau Claire line as well as the NSPW major line rebuild).
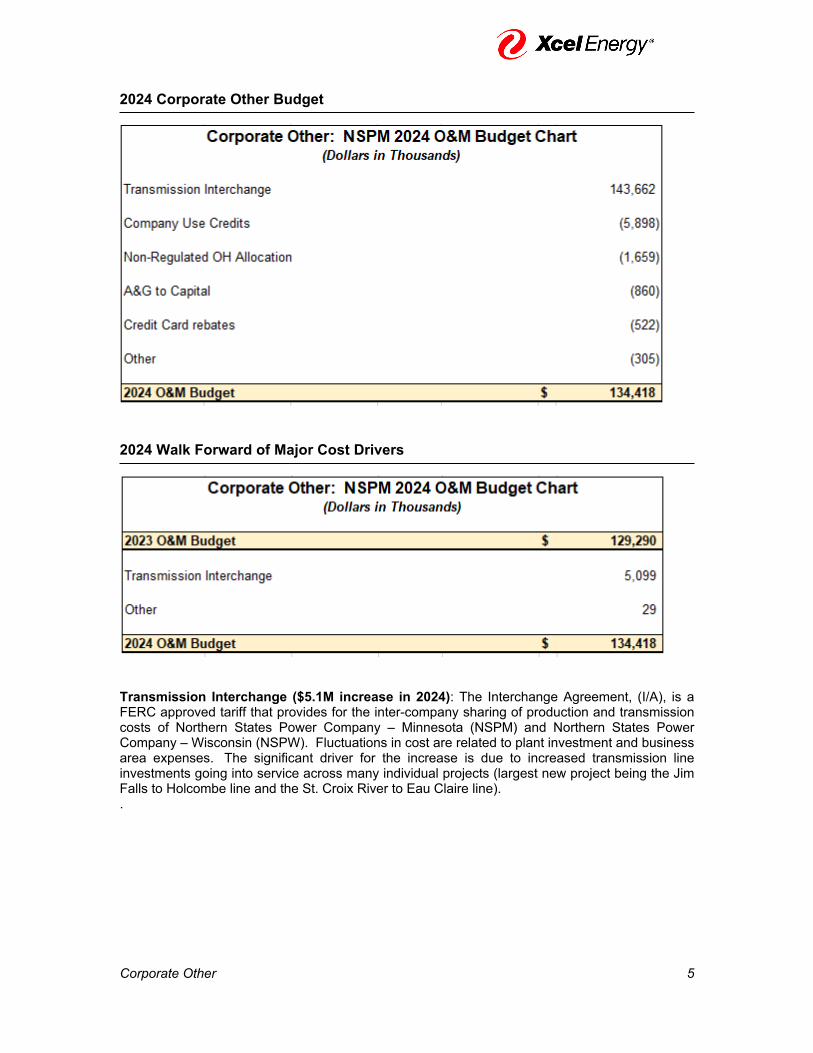
Corporate Other 5
2024 Corporate Other Budget
2024 Walk Forward of Major Cost Drivers
Transmission Interchange ($5.1M increase in 2024): The Interchange Agreement, (I/A), is a FERC approved tariff that provides for the inter-company sharing of production and transmission costs of Northern States Power Company – Minnesota (NSPM) and Northern States Power Company – Wisconsin (NSPW). Fluctuations in cost are related to plant investment and business area expenses. The significant driver for the increase is due to increased transmission line investments going into service across many individual projects (largest new project being the Jim Falls to Holcombe line and the St. Croix River to Eau Claire line). .

Corporate Other 6
Functional Organization Chart
Corporate Other does not have an organization chart.
Cost Allocation Methodologies The method used to distribute costs to the legal entity and utility include: Operating Company Direct Charges: Corporate Other, whenever possible, direct charges non-labor to the specific legal entity for which the costs were incurred and uses specific business units on the operating companies. Service Company Direct Charges: Not applicable Service Company Allocated Charges: The primary methods utilized for each service area are described below. Please see Exhibit__(RLB-1), Schedule 4 for a complete list of the Company's allocators.
Allocating Cost Center
JDE Subledger
Code Allocating Cost
Center Name Description
200087 123 Accounting, Reporting & Tax - Regulated
Accounting, Reporting & Tax - Regulated includes the labor and non-labor costs associated with operating company revenue accounting, budgeting, regulatory reporting, sales and use taxes, business area support for utility areas, operating company budgeting support, and capital asset accounting.

Corporate Other 7
Approvals
This document has been checked for errors in calculations and content.
Prepared By: /s/ Date:
Andy List
Manager, O&M and Capital Reporting & Analysis
Approved By: /s/ Date:
Melissa Ostrom
Director, Financial Forecasting and Reporting
10/13/2021
10/13/2021

2022 – 2024 Budget Documentation
Financial Operations

Major Business Functions and Key Activities
Financial Operations 2
Introduction
Financial Operations leads financial governance and delivers superior financial services. Reporting to the Chief Financial Officer are the Controller’s Organization, Investor Relations, Tax Services, Financial Planning & Corporate Development, and the Treasurer’s Organization.
Customer Value
Chief Financial Officer The Executive Vice President and CFO provides financial leadership to Xcel Energy, and provides leadership, policies and controls to Financial Operations and business areas. In close partnership with leaders within the organization, the CFO facilitates the mission, goals and objective for Investor Relations, Tax Services, Controller, and Finance & Corporate Development.
Controller’s Organization The Senior Vice President and Controller serves as the Principal Accounting Officer and provides financial policies, controls, financial governance and leadership to the company. Additionally, the Controller is responsible for the financial close process; property accounting, including depreciation for the fixed assets of various legal entities; and researching, documenting and resolving complex technical accounting issues for the preparation and filing of external reports to regulatory authorities and others. The Controller develops and maintains service agreements between the Service Company and operating companies and maintains and updates Service Company allocations. Accounting and reporting support for Commercial Operation’s regulatory mechanisms and, managing compliance with state and federal regulatory reporting requirements, also falls under the Controller’s purview, providing rate case support for and regulatory analysis.
Investor Relations The Investor Relations team develops investor relations programs, communications, presentation and supporting materials to ensure an appropriate financial valuation of Xcel Energy by the financial community. As the financial community engages Xcel Energy, the group responds to investor questions and requests for information and organizes meetings with current and prospective investors. Feedback from these interactions is provided to management, advising on key issues affecting Xcel Energy's position in the investment community.
Tax Services Tax Services is responsible for providing proactive tax counseling to executive management, business areas, and subsidiaries to mitigate the impact of taxation on operations and strategic business decisions, and potential transactions. The team monitors federal and state tax legislation, legal developments and rulemaking activities in the income tax, sales/use tax and property tax areas, and defends the company’s tax positions before various taxing authorities, as well as administering federal, state and local income, sales/use and property tax audits, protests and appeals, and testifying on key company tax issues. The team also prepares and files consolidated federal and state income tax returns and payments; property and sales/use tax returns and payments for the utility companies.
Finance & Corporate Development The Senior Vice President of Financial Planning is responsible for the oversight, governance and consolidation of budgets and forecasts across the company. The organization creates a working partnership with business areas to facilitate and assist with the development of annual five-year budgets, and monthly forecast updates, as well as preparation and consolidation of financial results and variance to senior leadership and the Xcel Energy Board of Directors.

Major Business Functions and Key Activities
Financial Operations 3
The Finance organization also provides revenue and cost of service analysis, expert testimony and support for rate cases and other regulatory filings; regulatory guidance related to budget development to meet rate case filing requirements. Additionally, the team creates forecasts of retail and system load and energy, jurisdictional peak demand and load management; and the production cost model used to develop forecasts of fuel and purchased power costs to serve energy requirements of our customers; and to support rate case and regulatory filings. Corporate Development is responsible for identification, evaluation, negotiation and execution of corporate growth opportunities including acquisitions, divestitures and joint ventures. Treasurer The Treasurer is responsible for developing and executing Xcel Energy’s financing plans by managing business relationships with Xcel Energy’s financial services suppliers. Additionally, the treasurer manages the company’s daily liquidity and coordinates cash flows for each Xcel Energy legal entity, including commercial paper issuance and bank facility drawdowns. The Treasurer issues bank loans, corporate guarantees and letters of credit, long-term debt and equity securities for Xcel Energy and each of the regulated utilities. The Treasurer also manages the hazard insurance portfolio for the company, providing corporate-wide protection of assets from catastrophic loss using risk financing mechanisms, including captive risk retention and design and negotiation of insurance contracts with commercial and industry mutual underwriters. Investment and pension management duties include coordinating with Xcel Energy’s investment advisor to perform asset allocation studies for the pension trust, the nuclear decommissioning trust and the VEBA trust assets, as well as Directing cash movements and investment account rebalancing required for the various trusts.

2022 NSPM O&M Budget Major Cost Drivers
Financial Operations 4
Insurance – includes property; general, excess and auto liability; nuclear, cyber, fiduciary and directors and officers insurance Labor and Contract – Labor for the Financial Operations organization is made up of exempt, benefit, non-benefit, and contracted personnel to perform the key activities described under the Major Business and Key Activities section. Consulting – primarily for financial audits, tax consulting, regulatory compliance, cost studies and auditing co-source support Regulatory & Other Fees – Bank charges, licenses fees and permits, and ratemaking fees. Other – Primarily employee related expenses.
Insurance Premiums , 28.1
Labor, Contractors, Overheads , 17.3
Consulting , 3.1
Regulatory & Other Fees , 1.7 Other , 0.7
Financial Operations 2022 Budget = $51.0M

2022 NSPM Walk Forward of Major Cost Drivers
Financial Operations 5
Financial Operations NSPM 2022 O&M Budget Chart (Dollars in thousands)
2021 July Year-End O&M Forecast $43,466 Insurance 5,275
Insurance - Surplus 1,867
Insurance - Property 1,309
Ins-General Liability (72)
Ins-Excess Liability 1,705
Misc. Other Insurance 466
Regulatory & Other Fees (28)
Shareholder Related Expenses 76
Bank Charges (136)
Other Fees 33
Labor 736
Company Labor with merit incr 800
Contract Labor for Staff Aug (64)
Net Other 1,565
2022 O&M Budget $51,013

2022 NSPM Walk Forward of Major Cost Drivers
Financial Operations 6
Insurance: Primarily driven by increases in premiums for property and excess liability policies. Factors for the increase include the company’s total asset base, recent loss history, as well as general insurance market conditions. Regulatory & Other Fees: Bank charges, licenses fees and permits, and ratemaking fees. Labor: Increased costs for internal labor due to three percent merit increases, headcount changes and partially offset by decreased by reduced reliance on staff augmentation contractors. Other: Usage of external consulting increasing to normal levels versus 2021 coupled with increased employee expenses related to return to office post pandemic.
- 2,000 4,000 6,000 8,000
Insurance PremiumsTotal
Regulatory & OtherFees Total
Labor, Contractors,Overheads Total
Net Other
Financial Operations 2022 O&M BudgetBusiness Drivers
$8.3M increase, or 16.2%

2023 NSPM O&M Budget Major Cost Drivers
Financial Operations 7
Insurance – includes property; general, excess and auto liability; nuclear, cyber, fiduciary and directors and officers insurance Labor and Contract – Labor for the Financial Operations organization is made up of exempt, benefit, non-benefit, and contracted personnel to perform the key activities described under the Major Business and Key Activities section. Consulting – primarily for financial audits, tax consulting, regulatory compliance, cost studies and auditing co-source support Regulatory & Other Fees – Bank charges, licenses fees and permits, and ratemaking fees. Other – Primarily employee related expenses.
Insurance Premiums 57%
Labor, Contractors, Overheads
33%
Consulting 6%
Regulatory & Other Fees 3%
Other 1%
Financial Operations 2023 Budget = $53.8M

2023 NSPM Walk Forward of Major Cost Drivers
Financial Operations 8
Financial Operations NSPM 2023 O&M Budget Chart (Dollars in thousands)
2022 O&M Budget $51,013
Insurance 2,416
Insurance - Property 869
Ins-General Liability 314
Ins-Excess Liability 1,156
Misc Other Insurance 76
Labor 519
Company Labor with merit incr 518
Contract Labor for Staff Aug 2
Net Other (141)
2023 O&M Budget $53,807
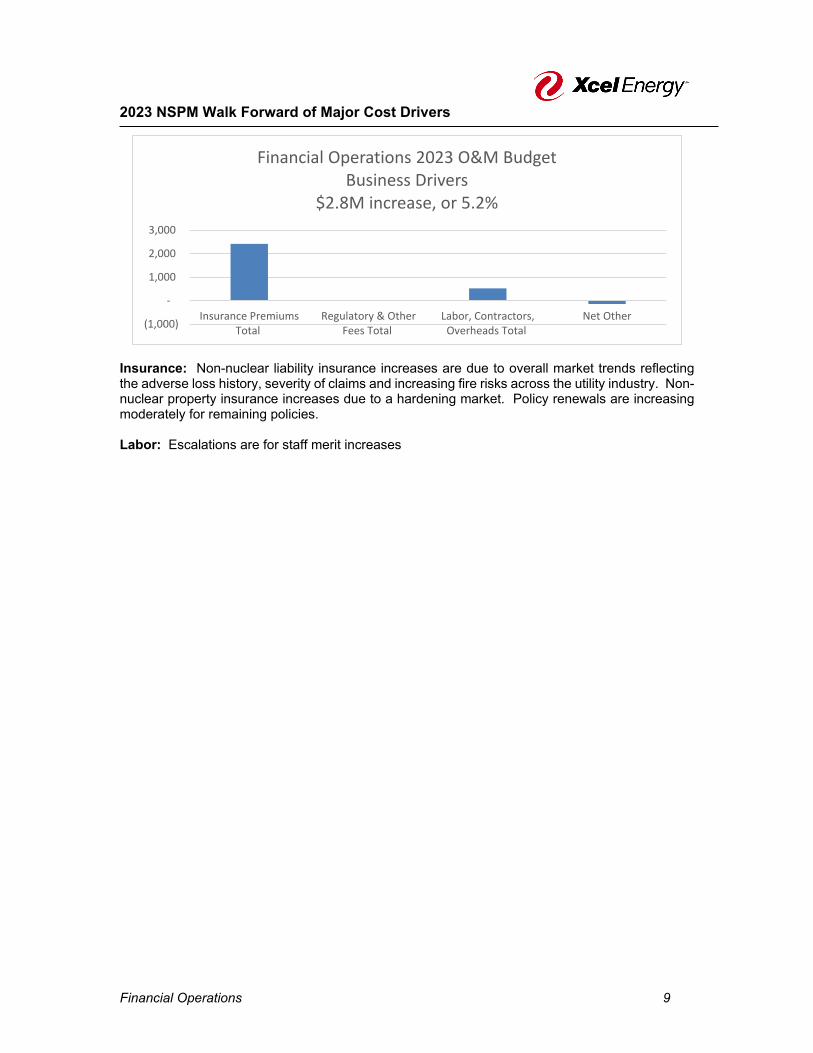
2023 NSPM Walk Forward of Major Cost Drivers
Financial Operations 9
Insurance: Non-nuclear liability insurance increases are due to overall market trends reflecting the adverse loss history, severity of claims and increasing fire risks across the utility industry. Non-nuclear property insurance increases due to a hardening market. Policy renewals are increasing moderately for remaining policies. Labor: Escalations are for staff merit increases
(1,000)
-
1,000
2,000
3,000
Insurance PremiumsTotal
Regulatory & OtherFees Total
Labor, Contractors,Overheads Total
Net Other
Financial Operations 2023 O&M BudgetBusiness Drivers
$2.8M increase, or 5.2%

2024 NSPM O&M Budget Major Cost Drivers
Financial Operations 10
Insurance – includes property; general, excess and auto liability; nuclear, cyber, fiduciary and directors and officers insurance Labor and Contract – Labor for the Financial Operations organization is made up of exempt, benefit, non-benefit, and contracted personnel to perform the key activities described under the Major Business and Key Activities section. Consulting – primarily for financial audits, tax consulting, regulatory compliance, cost studies and auditing co-source support Regulatory & Other Fees – Bank charges, licenses fees and permits, and ratemaking fees. Other – Primarily employee related expenses.
Insurance Premiums
59%
Labor, Contractors, Overheads
32%
Consulting 5%
Regulatory & Other Fees 3%
Other 1%
Financial Operations 2024 Budget = $58.1M

2024 NSPM Walk Forward of Major Cost Drivers
Financial Operations 11
Financial Operations NSPM 2024 O&M Budget Chart
(Dollars in thousands)
2023 O&M Budget $53,807
Insurance 3,687
Insurance - Surplus 1,500
Insurance - Property 743
Ins-General Liability 340
Ins-Excess Liability 843
Misc Other Insurance 261
Regulatory & Other Fees 67
Bank Charges 29
Other Fees 38
Labor 528
Labor 527
Company Labor with merit incr 2
Net Other 37
2024 O&M Budget $58,126

2024 NSPM Walk Forward of Major Cost Drivers
Financial Operations 12
Insurance: Non-nuclear liability insurance increases are due to overall market trends reflecting the adverse loss history, severity of claims and increasing fire risks across the utility industry. Non-nuclear property insurance increases due to a hardening market. Policy renewals are increasing moderately for remaining policies. Labor: Escalations are for staff merit increases
- 1,000 2,000 3,000 4,000
Insurance PremiumsTotal
Regulatory & OtherFees Total
Labor, Contractors,Overheads Total
Net Other
Financial Operations 2024 O&M BudgetBusiness Drivers
$4.3M increase, or 7.4%

Functional Organization Chart
Financial Operations 13
Controller Treasurer Finance & Corp Development Investor Relations TaxServices
Executive Vice Presidentand Chief Financial Officer
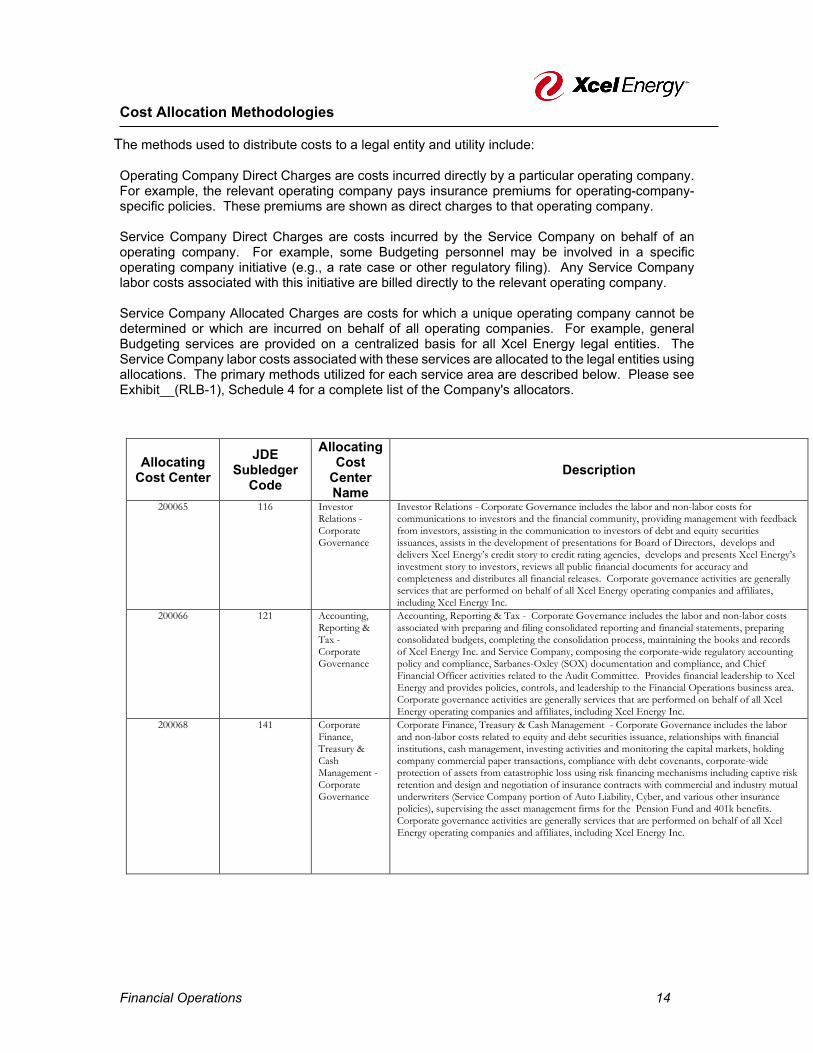
Cost Allocation Methodologies
Financial Operations 14
The methods used to distribute costs to a legal entity and utility include: Operating Company Direct Charges are costs incurred directly by a particular operating company. For example, the relevant operating company pays insurance premiums for operating-company-specific policies. These premiums are shown as direct charges to that operating company. Service Company Direct Charges are costs incurred by the Service Company on behalf of an operating company. For example, some Budgeting personnel may be involved in a specific operating company initiative (e.g., a rate case or other regulatory filing). Any Service Company labor costs associated with this initiative are billed directly to the relevant operating company. Service Company Allocated Charges are costs for which a unique operating company cannot be determined or which are incurred on behalf of all operating companies. For example, general Budgeting services are provided on a centralized basis for all Xcel Energy legal entities. The Service Company labor costs associated with these services are allocated to the legal entities using allocations. The primary methods utilized for each service area are described below. Please see Exhibit__(RLB-1), Schedule 4 for a complete list of the Company's allocators.
Allocating Cost Center
JDE Subledger
Code
Allocating Cost
Center Name
Description
200065 116 Investor Relations - Corporate Governance
Investor Relations - Corporate Governance includes the labor and non-labor costs for communications to investors and the financial community, providing management with feedback from investors, assisting in the communication to investors of debt and equity securities issuances, assists in the development of presentations for Board of Directors, develops and delivers Xcel Energy’s credit story to credit rating agencies, develops and presents Xcel Energy’s investment story to investors, reviews all public financial documents for accuracy and completeness and distributes all financial releases. Corporate governance activities are generally services that are performed on behalf of all Xcel Energy operating companies and affiliates, including Xcel Energy Inc.
200066 121 Accounting, Reporting & Tax - Corporate Governance
Accounting, Reporting & Tax - Corporate Governance includes the labor and non-labor costs associated with preparing and filing consolidated reporting and financial statements, preparing consolidated budgets, completing the consolidation process, maintaining the books and records of Xcel Energy Inc. and Service Company, composing the corporate-wide regulatory accounting policy and compliance, Sarbanes-Oxley (SOX) documentation and compliance, and Chief Financial Officer activities related to the Audit Committee. Provides financial leadership to Xcel Energy and provides policies, controls, and leadership to the Financial Operations business area. Corporate governance activities are generally services that are performed on behalf of all Xcel Energy operating companies and affiliates, including Xcel Energy Inc.
200068 141 Corporate Finance, Treasury & Cash Management - Corporate Governance
Corporate Finance, Treasury & Cash Management - Corporate Governance includes the labor and non-labor costs related to equity and debt securities issuance, relationships with financial institutions, cash management, investing activities and monitoring the capital markets, holding company commercial paper transactions, compliance with debt covenants, corporate-wide protection of assets from catastrophic loss using risk financing mechanisms including captive risk retention and design and negotiation of insurance contracts with commercial and industry mutual underwriters (Service Company portion of Auto Liability, Cyber, and various other insurance policies), supervising the asset management firms for the Pension Fund and 401k benefits. Corporate governance activities are generally services that are performed on behalf of all Xcel Energy operating companies and affiliates, including Xcel Energy Inc.

Cost Allocation Methodologies
Financial Operations 15
Allocating Cost Center
JDE Subledger
Code
Allocating Cost
Center Name
Description
200069 143 Risk Management - Corporate Governance
Risk Management Corporate Governance includes the labor and non-labor costs of providing administration of the Transaction Review Committee which handles contract and deal approvals for Commercial Operations, Resource Planning and Energy Supply, provides analysis associated with key risks facing Xcel Energy Inc., negotiates and manages required security (e.g., bank letters of credit, bonds and guarantees among others); reviews and approves all documents requiring Contracts area sign-off. Corporate governance activities are generally services that are performed on behalf of all Xcel Energy operating companies and affiliates, including Xcel Energy Inc.
200070 161 Corporate Strategy & Business Development - Corporate Governance
Corporate Strategy & Business Development - Corporate Governance includes the labor and non-labor costs associated with providing leadership for the implementation of company-wide business strategies and plans; portfolio management including the evaluation of potential opportunities for mergers, acquisitions and divestitures; providing financial, analytical and reporting support; researching and providing business intelligence information. Corporate governance activities are generally services that are performed on behalf of all Xcel Energy operating companies and affiliates, including Xcel Energy Inc.
200080 135 Capital Asset Accounting
Capital Asset Accounting includes the labor and non-labor costs associated with operating and non-operating company capital asset accounting, budgeting, regulatory reporting, business area support for utility areas, and operating company budgeting support.
200087 123 Accounting, Reporting & Tax - Regulated
Accounting, Reporting & Tax - Regulated includes the labor and non-labor costs associated with operating company revenue accounting, budgeting, regulatory reporting, sales and use taxes, business area support for utility areas, operating company budgeting support, and capital asset accounting.
200088 127; 133 Accounting, Reporting, Tax & Audit Services - Regulated Electric
Accounting, Reporting, Tax & Audit Services - Regulated Electric includes the labor and non-labor costs associated specifically with operating company electric utility revenue accounting, budgeting, regulatory reporting, sales and use taxes, business area support for utility areas, operating company budgeting support, capital asset accounting auditing operating companies , evaluating and improving risk management, ethical conduct and the implementation of best practices for operating companies electric utility, conducting financial operations and information system audits, performing audits and reviews for compliance with regulatory and legal requirements and contracts with vendors and other parties; establishing and reviewing internal controls for operating companies electric utility, establishing and reviewing SOX compliance requirements/control testing and evaluating contract risks for the operating companies electric utility. Additionally, costs for electric association dues including Edision Electric Institute (EEI).
200090 146 Risk Management - OpCo's & TransCo’s
Risk Management - OpCo's & TransCo’s includes the labor and non-labor costs of oversight and administrative of operating company risk management work, working with counterparties to establish enabling agreements with operating companies, risk management reports including all operating companies (such as CDAD - Contract Development, Approval & Delegation or TRC- Transaction Review Committee Reporting).
200091 147 Captive Insurance
Captive Insurance - The Property Loss Control Engineers services includes the labor and non-labor costs for each primary Operating Company(s) as well as all of Energy Supply Services. Having an expertise in an area, they lend support to each other and members of Energy Supply, and the Utilities Group, throughout the corporation. Fire Protection, Transformer Maintenance, Turbine Characteristics, Policies and Procedures are some of the areas in which expertise has been developed. This expertise is then shared on a regular basis to the benefit of all OpCo's and it is further shared at periodic Engineering meetings hosted by Hazard Insurance, which bring together Engineers from the OpCo's, the Property Loss Control Engineers and Insurance Company representatives to promote Loss Control.

Cost Allocation Methodologies
Financial Operations 16
Allocating Cost Center
JDE Subledger
Code
Allocating Cost
Center Name
Description
200096 431 Energy Markets - Business Services
Energy Markets Business Services includes the labor and non-labor costs for financial analysis, budgeting and administrative support, managerial reporting and business planning and process initiatives, independent daily forward valuation and risk measurement of commodity transactions and system fuel and purchase power requirements to meet system loads, as well as proprietary or trading transactions; creates retail system load and energy forecasts providing regular updates to senior management and analyses of key drivers, reviews and provides comments to dealmakers on non-standard agreements and associated confirmation agreements in the areas of coal supply, gas supply, wood fuel, rail, trucking, structured power purchases and nuclear/uranium concentrates and services; provides analyses for electric/gas hedge studies and sensitivities; creates load management forecast, jurisdictional peak demand forecasts, and cost of service studies for energy trading and marketing.
200098 468 Electric Transmission FERC 566
Electric Transmission FERC 566 services include Transmission electric labor and non-labor costs associated with accounting, budgeting, regulatory reporting, and capital asset accounting.
200100 134 Accounting, Reporting, Tax & Audit Services – Regulated Gas
Accounting, Reporting, Tax & Audit Services – Regulated Gas includes the labor and non-labor costs associated specifically with gas utility revenue accounting, budgeting, regulatory reporting, sales and use taxes, business area support for utility areas, capital asset accounting, auditing, evaluating and improving risk management, ethical conduct and the implementation of best practices for operating companies gas utility, conducting financial operations and information system audits, performing audits and reviews for compliance with regulatory and legal requirements and contracts with vendors and other parties; establishing and reviewing internal controls for operating companies gas utility, establishing and reviewing SOX compliance requirements/control testing and evaluating contract risks for the operating companies gas utility. Additionally, costs for gas association dues including American Gas Association (AGA).
200102 470 Gas Distribution FERC 880
Gas Distribution FERC 880 services include gas Distribution labor and non-labor costs associated with accounting, budgeting, regulatory reporting, and capital asset accounting.
200105 125 Accounting & Reporting - NSPM & NSPW
Accounting & Reporting - NSPM & NSPW includes the labor and non-labor costs associated with NSPM & NSPW accounting, budgeting, regulatory reporting, sales and use taxes, business area support for utility areas, operating company budgeting support, and capital asset accounting.
200126 423; 440; 525 Utilities Group Administrative & General (A&G) FERC 921
Utilities Group Administrative & General (A&G) FERC 921 services includes the labor and non-labor costs for utilities group leadership, management and support services for the Distribution, Transmission, transportation and supply chain areas.
200132 413 Payment & Reporting
Payment & Reporting services includes the labor and non-labor costs associated with processing payments to vendors, providing audit research and reconciliation support for Accounts Payable transactions, preparing statistical and 1099 reporting, and administering the purchase card programs.

Cost Allocation Methodologies
Financial Operations 17
Allocating Cost Center
JDE Subledger
Code
Allocating Cost
Center Name
Description
200133 128 Proprietary Trading - Back Office
Proprietary Trading - Back Office includes the labor and non-labor costs associated with the accounting support and vice president oversight of proprietary trading activities. This allocator should be primarily used by Accounting and Finance, or others providing Administrative & General (A&G) activities when the trading deal doesn’t involve Xcel Energy Utility generating resources, which is also considered non-asset-based trading activity.
200178 417 Rates & Regulation
Rates & Regulation includes the labor and non-labor costs for determining the regulated utilities' revenue requirements and rates for electric and gas customers regulatory strategy, coordinating the regulatory compliance requirements, establishing and maintaining relationships with regulatory bodies, policy development of regulatory and legislative strategy, preparing and organizing rate case filings.

Approvals
Financial Operations 18
This document has been checked for errors in calculations and content. Prepared By: /s/ Date:
Jack Haggard
Manager, Shared Services Finance Approved By: /s/ Date:
Adam Dietenberger Director, Shared Services Finance
Approved By: /s/ Date:
Richard Schrubbe AVP, Financial Analysis and Planning
10/17/2021
10/13/2021
10/11/2021

2022 – 2024 Budget Documentation
Group President, Utilities
NSPM President

Major Business Functions and Key Activities
Group President, Utilities – NSPM President 2
Introduction The NSPM President organization consists of the following key areas: Regulatory & Government Affairs, Community Relations and Large Account Management. The organization is responsible for meeting financial goals, improving customer satisfaction, identifying new market opportunities and ensuring regulatory compliance. Customer Value The NSPM President organization provides oversight and input into the NSPM business plan developed by the operational areas and works to maximize results. The business plan is designed with both short- and long-term views so that immediate issues are addressed without sacrificing the long-term sustainability of the system. Customers benefit from the integration through the successful execution of the plan designed to provide reliable energy and to support the environment. The Regulatory & Government Affairs area provides technical analysis and consulting services on issues that impact rate recovery, pricing, regulatory policy and regulatory compliance. These organizations provide testimony to support company positions in regulatory proceedings and coordinate the preparation of expert testimony of subject matter experts in other business areas. Regulatory & Government Affairs also manages ongoing communications with regulators to ensure constructive relationships and sharing of timely and accurate information so that both Regulators and Xcel Energy decision makers have the necessary facts to understand the implications of their actions on customers, shareholders, employees and the industry. The Community Relations area is responsible for the important priority of improving or maintaining relationships with the states and communities in which Xcel Energy operates. In all territories we serve, the company is a leader in corporate giving and employee volunteerism. Each group plays a significant role in engaging managed account customers, constituents, and businesses through grass roots efforts and appealing to elected leaders. The knowledge gained through these interactions assists the company in shaping strategy in on legislative bills championed or opposed, to protect the interests of our customers. The Large Account Management department is responsible for working with the 1,500 largest business customers in the jurisdiction. The department’s focus is to be a strategic resource to key customers on rates, reliability, energy efficiency, and project management. Account Managers are a single point of contact for both large regional and national customers to assist in customer extensions, reliability improvements, and project support while helping customers meet their sustainability and energy efficiency needs.

Major Business Functions and Key Activities
Group President, Utilities – NSPM President 3
Operating Company President - Northern State Power - Minnesota (NSPM) Community Relations
• Serves as a single point of contact for regional and local governments regarding outage communication, governmental billing and service issues, construction activities, municipal franchise renewals, utility service, and community events and activities.
• Coordinates new customer acquisitions for gas, electric, and builder developer relationships. • Provides a single customer service contact for large business customers, assisting them with
issues such as new service construction, billing, reliability, contracts, and participation in Demand Side Management (DSM) programs.
Regulatory & Government Affairs
• The lead group for filing and securing approvals of rate cases, resource plans, construction applications, compliance filings and other miscellaneous filings before state and/or federal regulatory agencies.
• Leads company efforts in pricing and rate design, fuel cost recovery and various other cost recovery mechanisms, regulatory policy analysis, customer contract negotiations, revenue forecasting for budgets and long-range planning. Assists Revenue Analysis Group in CFO organization in preparing financial analysis and revenue requirements to support various internal needs and external company filings with regulatory agencies.
• Coordinates company participation in state and federal regulatory proceedings. Consults with other Xcel Energy regulatory departments and other business areas to support their regulatory needs. Acts as liaison between company business areas and regulatory agencies.
• Determines the appropriate policy direction, alternatives, and primary directive for Xcel Energy’s regulatory and legislative strategy.
• Takes lead in securing regulatory approval of initiatives to meet legislative mandates. • Internal legislative policy development and issues management. • Informs management and internal customers of political and policy trends and developments. • Manages state-level policy development to create positive outcomes for the company. • Develops and maintain relationships with public officials and staff. • Lobbies elected officials and reports lobbying activities. • Operates, expands, and reports activities of Xcel Energy political action committees, as
required/authorized by law. • Educates employees on policy issues and election activities.
Large Account Management
• Work with customers to develop energy efficiency pipeline of projects to exceed DSM goals. • Facilitate customer needs with area engineering, design, billing, and managing contracts along
with credit and collection activity • Outage Communications, interface with Area Engineering, Control Center, Ops & Customer.

2022 Total NSPM O&M Budget Major Cost Drivers
Group President, Utilities – NSPM President 4
Costs are categorized as Labor, Regulatory & Other Fees, Contributions & Dues and Outside Services. Labor – Labor is made up of exempt, benefit and non-benefit personnel to perform the key activities described under the Major Business and Key Activities section. Regulatory & Other Fees – Direct and Indirect regulatory fees are an allocation of costs from the state of MN regulating agencies. Direct fees are costs associated with NSPM dockets. Indirect fees are an allocation of agency costs that are not captured through direct assessments. Contributions & Dues – Contributions & Dues includes items such as professional association dues, community sponsorships, civic and political activity, utility associations, charitable contributions, and other deductions. Employee Expenses – Employee expenses for travel, continued legal education, professional association dues, training and professional conferences. Outside Services – Consulting services related to organizational, regulatory and community efforts focused on meeting the strategic priorities of the NSPM President organization. Other – Primarily consists of funding for strategic planning initiatives. Materials expenses to support daily operations and communication with customers and Advertising to support strategic priorities such as customer acquisition are also included.

2022 Total NSPM Walk Forward of Major Cost Drivers
Group President, Utilities – NSPM President 5
Labor – Increase is primarily due to the annual merit cycle and increased total headcount of eight to support the NSPM President’s priorities in Regulatory, Account Management and Community Relations organizations. The timing of hiring open positions and the budget representing a fully staffed organization, less normal attrition also contributes to the year-over-year increase. Outside Services – Increased Consulting spend in: (1) Community Relations due to expanded scope with an existing consultant Rapp Strategies who supports public affairs strategy, $0.9M, (2) supporting the extension of nuclear fleet, $0.1M, (3) and general legislative matters and lobbying support, $0.4M.
Employee Expenses – Increased year-over-year expenses are driven by reduced activity in 2021 due to companywide travel restrictions. 2022 is budgeted at 2021 activity levels with a marginal increase in expected activity levels for the organization to achieve its objectives.
Contributions & Dues – Increase is driven by reduced activity in 2020 and 2021 due to economic impact of COVID 19. 2022 is budgeted to return to normal activity levels for the organization to achieve its objectives. Drivers include costs not recovered from rate payers associated with community sponsorships, association dues and corporate sponsored tickets. Regulatory & Other Fees – Indirect and direct fees are increased based upon anticipated revenue changes and case filings. Other – Primarily consists of funding for strategic planning initiatives.
2021 July Year End Forecast 19,786 Labor 876 Outside Services 1,465 Employee Expenses 137 Contributions & Dues 1,662 Regulatory & Other Fees 159 Other 742
2022 Budget 24,827
2021 July Year End Forecast to 2022 Budget

2023 Total NSPM O&M Budget Major Cost Drivers
Group President, Utilities – NSPM President 6
Costs are categorized as Labor, Regulatory & Other Fees, Contributions & Dues and Outside Services.
Labor – Labor for the NSPM President organization is made up of exempt, benefit and non-benefit personnel to perform the key activities described under the Major Business and Key Activities section.
Regulatory & Other Fees – Direct and Indirect regulatory fees are an allocation of costs from the state of MN regulating agencies. Direct fees are costs associated with NSPM dockets. Indirect fees are an allocation of agency costs that are not captured through direct assessments.
Contributions & Dues – Contributions & Dues includes items such as professional association dues, community sponsorships, civic and political activity, utility associations, charitable contributions, and other deductions.
Employee Expenses – Employee expenses for travel, continued legal education, professional association dues, training and professional conferences.
Outside Services – Consulting services related to organizational, regulatory and community efforts focused on meeting the strategic priorities of the NSPM President organization.
Other – Primarily consists of Materials expenses to support daily operations and communication with customers and Advertising to support strategic priorities such as customer acquisition.

2023 Total NSPM Walk Forward of Major Cost Drivers
Group President, Utilities – NSPM President 7
Labor – Base productive and non-productive labor costs are increased based on three percent merit increases. The budget includes an updated workforce plan and full staffing levels. Outside Services – Return to normal Consulting spend in Community Relations from 2022, ($0.9M). Regulatory & Other Fees – Indirect and direct fees are increased based upon anticipated revenue changes and case filings. Other – Reduced funding for strategic planning initiatives.
2022 Budget 24,827 Labor 83 Outside Services (900) Regulatory & Other Fees 147 Other (687)
2023 Budget 23,471
2022 Budget to 2023 Budget

2024 Total NSPM O&M Budget Major Cost Drivers
Group President, Utilities – NSPM President 8
Costs are categorized as Labor, Regulatory & Other Fees, Contributions & Dues and Outside Services. Labor – Labor for the NSPM President organization is made up of exempt, benefit and non-benefit personnel to perform the key activities described under the Major Business and Key Activities section. Regulatory & Other Fees – Direct and Indirect regulatory fees are an allocation of costs from the state of MN regulating agencies. Direct fees are costs associated with NSPM dockets. Indirect fees are an allocation of agency costs that are not captured through direct assessments. Contributions & Dues – Contributions & Dues includes items such as professional association dues, community sponsorships, civic and political activity, utility associations, charitable contributions, and other deductions. Outside Services – Consulting services related to organizational, regulatory and community efforts focused on meeting the strategic priorities of the NSPM President organization. Other – Primarily consists of Materials expenses to support daily operations and communication with customers and Advertising to support strategic priorities such as customer acquisition.

2024 Total NSPM Walk Forward of Major Cost Drivers
Group President, Utilities – NSPM President 9
Labor – Base productive and non-productive labor costs are increased based on three percent merit increases. The budget includes an updated workforce plan and full staffing levels. Regulatory & Other Fees – Indirect and direct fees are increased based upon anticipated revenue changes and case filings.
2023 Budget 23,471 Labor 320 Regulatory & Other Fees 146 Other (0)
2024 Budget 23,936
2023 Budget to 2024 Budget

Functional Organization Chart
Group President, Utilities – NSPM President 10
NSPM Regulatory & Government Affairs NSPM Community Relations NSPM Large Account Management
NSPM President
Cost Allocation Methodologies
Group President, Utilities – NSPM President 11
This business area direct charges all costs to the NSPM Company. There are no service company cost allocation methodologies used.

Approvals
Group President, Utilities – NSPM President 12
This document has been checked for errors in calculations and content. Prepared By: /s/ Date:
Raynard Gray
Manager, Business Area Finance Approved By: /s/ Date:
Adam Dietenberger Director, Business Area Finance
Approved By: /s/ Date:
Rich Schrubbe AVP, Financial Analysis and Planning
10/13/21
10/1320/21
10/15/2021

2022 – 2024 Budget Documentation
General Counsel

General Counsel 2
Introduction
General Counsel provides critical legal and strategy services to Xcel Energy, its operating companies and its subsidiaries with a focus on advancing strategic objectives. In addition to Legal Services, General Counsel includes Claims Services and Corporate Secretary.
Customer Value
The Legal Services group anticipates and fulfills the legal needs of Xcel Energy Inc., its Board of Directors, Officers, Subsidiaries, Business Areas, and Corporate Operations Areas. It provides services related to a myriad of complex legal issues related to corporate governance and compliance, securities, labor and employment law, litigation, contracts, franchises, rates and regulation, environmental matters, real estate, and other legal matters. In addition, Legal Services supports Xcel Energy and its subsidiaries in fulfilling Corporate and Business Area strategies, ranging from maintaining and improving stakeholder and regulatory relationships to continued leadership on environmental issues.
The Claims Services group provides effective, efficient, and professional claims services for Xcel Energy’s matters related to casualty, public, and legal entity claims against the company; ranging from simple liability claims to catastrophic loss investigations. When the company is entitled to indemnity or compensation from insurers or other third parties for losses or damages to company equipment and or facilities, Claims Services helps ensure that the company recovers amounts sufficient to compensate it for loss, to the extent possible. In addition to Legal Services support, the Claims group also provides as needed support to the Operating Companies and subsidiaries in their respective service territories and jurisdictions. The Corporate Secretary group provides a variety of support services to Xcel Energy Inc. and its subsidiaries. Services include management of Board of Directors, Shareholder’s meetings and Director recruitment. This team develops and coordinates the enterprise efforts to fulfill our strategic plans. These efforts are shaped to drive alignment and collective action to deliver on our corporate vision and strategic priorities.

General Counsel 3
Major Business Functions and Key Activities The General Counsel Business Area is a part of Xcel Energy Services Inc. (XES) and provides a variety of support services to Xcel Energy Inc. and its subsidiaries. These services are provided in accordance with the XES Service Agreements entered with each subsidiary. The Service Agreements are administered in accordance with Federal Energy Regulatory Commission (FERC) regulations regarding public utility holding companies.
Office of the General Counsel
Office of the General Counsel includes oversight of the work performed by Claims Services & Legal Services.
Legal Services • Anticipates and fulfills the legal needs of Xcel Energy, its Board of Directors, officers, legal entities,
business areas, and corporate operations in a responsive, timely and accurate manner to protect the assets and to minimize potential liability, which benefits company stakeholders: customers, shareholders, and employees.
• Provides services related to corporate governance and compliance, securities, labor and employment law, litigation, contracts, franchises, rates and regulation, environmental matters, real estate, and other legal matters.
• Supports Xcel Energy and its subsidiaries in fulfilling corporate and business area strategies ranging from maintaining/improving stakeholder and regulatory relationships to continued leadership on environmental issues.
Claims Services • Provides effective, efficient and professional 24 x 7 claims services for Xcel Energy’s matters
related to casualty, public and legal entity claims against the company; ranging from simple liability claims to investigations of catastrophic loss investigations. Pursues indemnification or compensation for losses or damages to company equipment and/or facilities.
• Supports Legal Services and the operating companies in their respective service territories within regional jurisdictions. Occasionally, Claims Services may be asked to provide services to an Xcel Energy non-utility subsidiary (e.g., Eloigne).
• Provides training seminars for employees to ensure compliance with claims investigation procedures.
Corporate Secretary Corporate governance practices:
• Board of Directors: o Ensure SEC, Nasdaq and legal compliance o Manage the creation & coordination of meeting materials and maintain official company
records o Annual Shareholders meeting
• Corporate Governance: o Annual review of charters and other governance documents o Board and Committee evaluations o Investor outreach
• Regulatory Filings: o Proxy Statement and Section 16 transactions o FERC Interlock and Informational Filings o Secretary of State annual reports
• Subsidiary Management o Quarterly Operating Company Board Meetings o Resolutions: Annual Officer and Director election, Dividend, Capital Investment
Projects o Entity management

General Counsel 4
2022 NSPM O&M Budget Major Cost Drivers
Labor – Labor for the General Counsel organization is made up of exempt, benefit and non-benefit personnel to perform the key activities described under the Major Business and Key Activities section. Outside Services – Expenses for outside legal costs (outside law firms, experts, court reporters, etc.). Employee Expenses – Employee expenses for travel, continued legal education, professional association dues, training and professional conferences.
IT Costs – IT costs are primarily for software support and maintenance costs associated with Legal Services’ software applications. Other – Consists primarily of Contributions and Dues which includes items such as professional association dues, community sponsorships, civic and political activity, utility associations, charitable contributions, and other deductions.

General Counsel 5
2022 Walk Forward of Major Cost Drivers
Labor – Base productive and non-productive labor costs are increased based on three percent merit increases. The budget includes an updated workforce plan and full staffing levels. Outside Services – Expenses for outside legal costs fluctuate year-to-year due to the number, type, and magnitude of legal matters or increase/decrease in outside legal fees. The increase consists of: (1) additional support in Corporate and Employment legal practice areas, $0.8M, (2) anticipated litigation, $0.5M, and (3) asset transactions and other increases, $0.7M. The increases are offset by: (1) decreases in Transmission related Real Estate and Federal Regulatory legal practice areas, ($0.1M), (2) decrease in Regulatory Commission expenses in a non-rate filing year ($0.3M), (3) miscellaneous matters spend ($0.3M).
Employee Expenses – Increased year-over-year expenses are driven by reduced activity in 2021 due to companywide travel restrictions. 2022 is budgeted at 2021 activity levels with a marginal increase in expected activity levels for the organization to achieve its objectives. Other – Incremental increase for normal activity in IT Costs, $18K and Insurance Premiums, $30K.

General Counsel 6
2023 NSPM O&M Budget Major Cost Drivers
Labor – Base productive and non-productive labor costs are increased based on three percent merit increases. The budget includes an updated workforce plan and full staffing levels. Outside Services – Expenses for outside legal costs fluctuate year-to-year due to the number, type, and magnitude of legal matters or increase/decrease in outside legal fees.
Employee Expenses – Employee expenses for travel, continued legal education, professional association dues, training and professional conferences. IT Costs – IT costs are primarily for software support and maintenance costs associated with Legal Services’ software applications. Other – Consists primarily of Contributions and Dues which includes items such as professional association dues, community sponsorships, civic and political activity, utility associations, charitable contributions, and other deductions.

General Counsel 7
2023 Walk Forward of Major Cost Drivers
Labor – Base productive and non-productive labor costs are increased based on three percent merit increases, $0.2M.
2022 Budget 9,864 Labor 158 Other 2
2023 Budget 10,025
2022 Budget to 2023 Budget
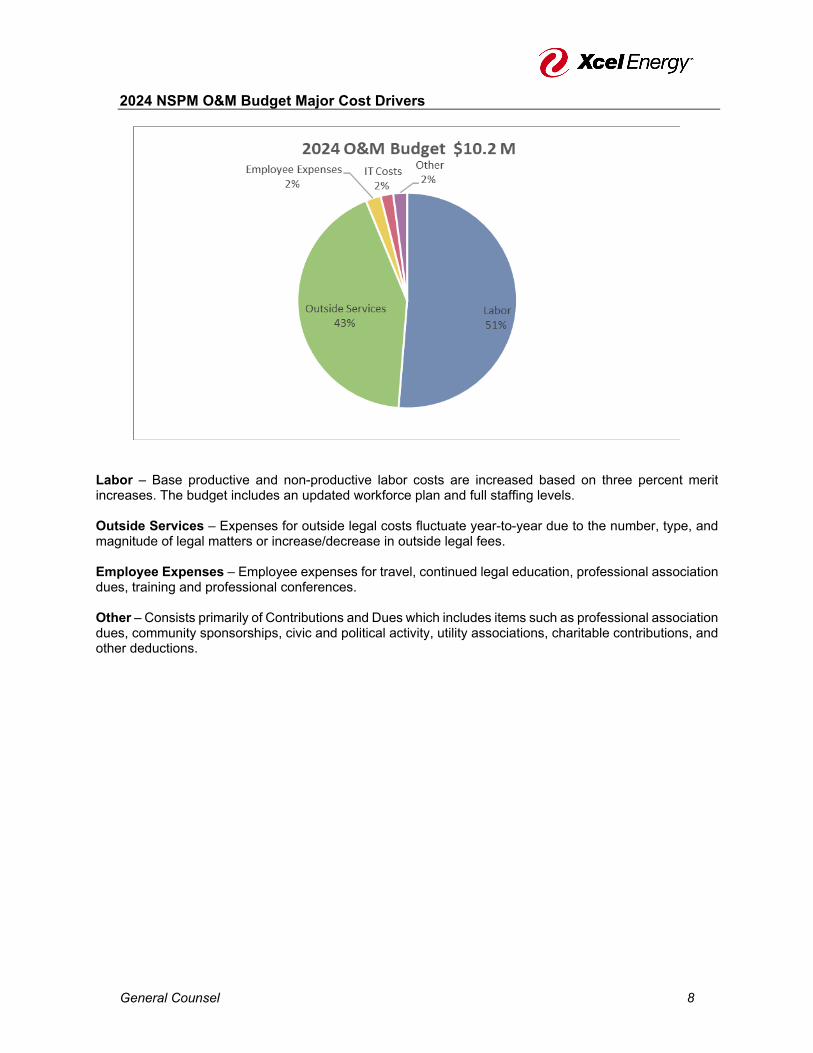
General Counsel 8
2024 NSPM O&M Budget Major Cost Drivers
Labor – Base productive and non-productive labor costs are increased based on three percent merit increases. The budget includes an updated workforce plan and full staffing levels. Outside Services – Expenses for outside legal costs fluctuate year-to-year due to the number, type, and magnitude of legal matters or increase/decrease in outside legal fees.
Employee Expenses – Employee expenses for travel, continued legal education, professional association dues, training and professional conferences. Other – Consists primarily of Contributions and Dues which includes items such as professional association dues, community sponsorships, civic and political activity, utility associations, charitable contributions, and other deductions.

General Counsel 9
2024 Walk Forward of Major Cost Drivers
Labor – Base productive and non-productive labor costs are increased based on three percent merit increases, $0.2M.

General Counsel 10
Functional Organization Chart
EVP
Legal Services Organization Claims Corporate Secretary
General Counsel

General Counsel 11
Cost Allocation Methodologies
The methods used to distribute costs to legal entity and utility include:
Operating Company Direct Charges:
General Counsel direct charges non-labor outside legal counsel costs to the specific legal entity for which the services were performed or costs incurred.
Service Company Direct Charges:
Service Company charges are direct charged whenever possible. General Counsel direct charges most labor and non-labor costs to the specific legal entity for which the services were performed or costs incurred.
Service Company Allocated Charges:
When direct charging is not practical, or where services performed are not specifically related to a legal entity, General Counsel allocates labor and non-labor costs to the legal entities benefiting from the services performed or costs incurred. The primary methods utilized for each service area are described below. Please see Exhibit__(RLB-1), Schedule 4 for a complete list of the Company's allocators.
Allocating Cost
Center
JDE Subledger
Code
Allocating Cost
Center Name
Description
200063 110 Executive - Corporate Governance
Executive Corporate Governance includes the labor and non-labor costs for executive corporate management, long-term business strategy development and other programs that ensure the continuity and development of management. Corporate governance activities are generally services that are performed on behalf of all Xcel Energy operating companies and affiliates, including Xcel Energy Inc.
200071 171 Legal - Corporate Governance
Legal - Corporate Governance includes the labor and non-labor costs for anticipating and fulfilling the legal needs of Xcel Energy, its Board of Directors, officers, legal entities, business areas and corporate operations to protect the company's assets and to minimize potential liability. Provides services related to labor and employment law pertaining to Service Company employees, litigation, contracts, rates and regulation, environmental matters and other legal matters. Supports Xcel Energy and its subsidiaries in fulfilling corporate and business area strategies ranging from maintaining/improving regulatory relationships to continued leadership on environmental issues. Corporate governance activities are generally services that are performed on behalf of all Xcel Energy operating companies and affiliates, including Xcel Energy Inc.
200086 170 Legal & Claims Services
Legal & Claims Services includes the labor and non-labor costs for operating and non-operating legal services related to: labor and employment law, litigation, rates and regulation, environmental matters, real estate, contracts, and claims services related to casualty, public, and company claims.
200093 174 Legal - OpCo's & TransCo’s
Legal - OpCo's & TransCo’s services include the labor and non-labor costs for operating companies legal services related to: labor and employment law, litigation, rates and regulation, environmental matters, real estate and contracts.
200101 164 Legal Gas Legal Gas services include the labor and non-labor costs for operating companies gas utility legal services related to: labor and employment law, litigation, rates and regulation, environmental matters, real estate and contracts. This is primarily used by the General Counsel area.

General Counsel 12
Operating Company Direct Charges are costs incurred directly by a particular operating company. For example, the relevant operating company pays insurance premiums for operating-company-specific policies. These premiums are shown as direct charges to that operating company. Service Company Direct Charges are costs incurred by the Service Company on behalf of an operating company. For example, some Budgeting personnel may be involved in a specific operating company initiative (e.g., a rate case or other regulatory filing). Any Service Company labor costs associated with this initiative are billed directly to the relevant operating company. Service Company Allocated Charges are costs for which a unique operating company cannot be determined or which are incurred on behalf of all operating companies. For example, general Budgeting services are provided on a centralized basis for all Xcel Energy legal entities. The Service Company labor costs associated with these services are allocated to the legal entities using allocations. The primary methods utilized for each service area are described above. Please see Exhibit__(RLB-1), Schedule 4 for a complete list of the Company's allocators.
General Counsel 13
Approvals This document has been checked for errors in calculations and content. Prepared By: /s/ Date:
Mohan Chehal
Senior Financial Analyst, Business Area Finance Approved By: /s/ Date:
Adam Dietenberger Director, Business Area Finance
Approved By: /s/ Date:
Rick Schrubbe AVP, Financial Analysis & Planning
10/15/2021
10/13/2021
10/11/2021
1
Before the Minnesota Public Utilities Commission State of Minnesota
In the Matter of the Application of Northern States Power Company Minnesota d/b/a Xcel Energy
For Authority to Increase Rates for the Electric Utility Service in the State of Minnesota
Docket No. E002/GR-21-630
IHS Markit Guideline Analysis
October 2021

2
TABLE OF CONTENTS
I. Overview of Comparison of Certain 2022 NSPM Budgeted Operating Expenses to IHS Markit-Inflated 2020 Actual Expenses
II. Explanations of 2022 Deviations from IHS Markit Guidelines
III. Computation of 2022 IHS Markit Guideline Amounts and Comparison to 2022 NSPM Budget

3
OVERVIEW OF COMPARSION OF 2022 NSPM BUDGETED OPERATING EXPENSES
TO IHS-INFLATED 2020 ACTUAL EXPENSES
Background In its final order for NSPM’s 1991 electric rate case, the Commission required that a Data Resource Institute (DRI) or comparable industry index be incorporated as a guideline in future rate cases and that explanations be provided for deviations from such guidelines. Global Insights (GI) acquired DRI which then merged with IHS to form IHS Markit. IHS Markit now maintains the quarterly indexes for many utility industry FERC accounts. As required, the Company has prepared an analysis comparing budgeted 2022 operating expenses to 2020 actual expenses, inflated to 2022 levels using IHS indexing. Analysis Provided The analysis consists of two parts: (1) analytical explanations (by FERC account number) for significant differences between the 2022 budget amounts and the expected levels based on IHS-Inflated 2020 actuals; and (2) a numeric summary of the inflated 2020 amounts in comparison to 2022 budgeted amounts. The analysis excludes certain costs such as purchased power, fuel, production interchange agreement billings, conservation improvement program costs (CIP), and other amortizations that are not budgeted as part of departmental operating and maintenance (O&M) expense, to develop the expense base for IHS indexing. Use of Indexing The corresponding 2020 and 2022 IHS index for each FERC account was applied to the 2020 actual costs to create a guideline expectation for 2022 for comparison to 2022 budget amounts included in NSPM’s 2022 test year rate filing. For amounts that did not have an IHS index available, the 2020 actual costs were not inflated in determining a 2022 expectation. Budgeting by FERC Account NSPM 2022 expenses have been budgeted by FERC account. In addition to this comparison of IHS guideline expenses to 2022 budget accounts, the Budget Documentation filed with this case (Volume 6) includes a summary of operating and maintenance expenses by FERC account and cost object account for 2022 budget and 2020 actual amounts. Finally, budget work papers that provide additional support for this documentation are available for review upon request.

4
Explanations of Deviations Explanations were provided for all significant deviations between the 2022 budgeted expense and the IHS escalated 2020 amounts. These explanations are on a FERC account-by-account basis within the attached exhibit NSPM O&M IHS Analysis. We have also attempted to provide an overall explanation of the aggregate deviation for each major expense category (production, transmission, etc.) as summarized below. Deviation explanations for certain smaller accounts were also included to provide the Commission with further information on the cost of labor and materials, or changes in the scope of project activity, from 2020 to 2022. In this regard, it is important to understand that the IHS index for individual FERC accounts represents a projected average benchmark for all utilities across the country at a point in time (in our case, the second quarter of 2021). Reasonable variations from the national average should be expected because NSPM, or any other individual utility, would not necessarily reflect the national average. In any year, individual utilities will have their own operating and maintenance programs designed to address the unique needs of their facilities at that time. The following table compares Northern States Power Minnesota Company’s total 2022 electric utility O&M budget to the respective projected cost based on the Company’s 2020 actual costs escalated to their 2022 levels, as calculated by applying IHS-inflation indices. The econometric models that determine these indices are based on average historical statistical relationships which do not isolate changes specific to one company, nor do they fully reflect current structural changes that are unique to a specific company. The summary also identifies expense items and cost increases that are unique to the Company. Allowing for these differences provides a more comparable view of the Company’s budgeted costs relative to the utility industry’s average cost escalation rates. This analysis reflects Northern States Power Minnesota Company total electric utility costs. The Regulatory area directly assigns or allocates costs to the State of Minnesota electric jurisdiction. In addition, the Regulatory area makes various test period adjustments to eliminate certain costs not included within the State of Minnesota electric jurisdiction cost of service. Thus these represent business area costs in total prior to adjustments, so not all of the above costs are reflected in the cost of service, nor are the costs all part of our request for rates.

5
Summary
Overall, the 2022 budgeted operating and maintenance (O&M) costs compared to IHS -inflated actuals are as follows:
NSPM’s total budgeted O&M levels are greater than the escalated levels by $20,648K. Two adjustments, as described below, have been made to reflect a more normalized view between the 2022 budget and the 2020 actuals inflated to 2022. After normalization the O&M levels are greater than the escalated levels by $14,962K.
The following adjustments have been made to normalize the variance between the 2022 budget and the 2020 actuals inflated to 2022. The normalization adjustments were calculated as the difference between the 2020 actual costs for the specific item, escalated to the 2022 level, compared to the Company’s 2022 budgeted amount.
The first normalization adjustment relates to decreased nuclear outage amortization costs of ($8,907K) between 2020 and 2022. Nuclear outage amortization expense was higher in 2020 than 2022. Higher outage amortization expense in 2020 was due to larger scale outages in 2019 at PI Unit 2 and Monticello (MT) and in both 2018 and 2020 at PI Unit 1. Nuclear outages at PI Unit 2 and Monticello (MT) forecast for 2021 and at PI Unit 1 forecast for 2022 were smaller in scale. Therefore, amortization expense in 2022 is lower.
The second normalization adjustment relates to the inter-company billing from NSPW Company to NSPM Company of transmission costs through the Interchange Agreement. The NSPM Transmission Interchange Agreement expense increased $14,592K from 2020 to 2022 driven primarily by higher fixed transmission charges in 2022. The Interchange Agreement billing is a revenue requirement calculation including fixed charges, such as return on rate base, depreciation and property tax.
Power Production
Transmission RegionalMarket
Distribution Cust. Accts Cust Serv &Inform
Sales A&G Total
IHS-Inflated 2020 Guideline 498,181,612 152,403,041 324,286 116,464,664 91,340,769 2,255,864 2,634,756 290,109,558 1,153,714,5512022 NSPM Budget 483,863,464 171,449,308 358,802 140,849,054 69,842,764 2,265,068 8,512,574 297,221,112 1,174,362,146Deviation (14,318,148) 19,046,267 34,515 24,384,390 (21,498,005) 9,204 5,877,818 7,111,554 20,647,595
Normalization AdjustmentNuclear Outage Amortization 8,906,907 8,906,907Transmission I/A bill from NSPW (14,592,093) (14,592,093)
Normalized Deviation (5,411,241) 4,454,173 34,515 24,384,390 (21,498,005) 9,204 5,877,818 7,111,554 14,962,409% Deviation -2.9% 12.5% 10.6% 20.9% -23.5% 0.4% 223.1% 2.5% 1.8%Normalized % Deviation -1.1% 2.9% 10.6% 20.9% -23.5% 0.4% 223.1% 2.5% 1.3%

6
EXPLANATIONS OF 2022 DEVIATIONS FROM IHS MARKIT GUIDELINES1
POWER PRODUCTION EXPENSES
The 2022 budget for Power Production expenses is ($14,318K) lower than 2022 projections using IHS Markit (IHS) indexes. This decrease is primarily the result of lower Steam Power Generation Expenses ($13,082K) and Nuclear Generation Expenses ($30,982K) offset by increased Other Power Generation Expenses ($30,878), primarily for new wind resources.
STEAM POWER GENERATION – Total IHS Adjusted Deviation = ($13,082K)
FERC 500 – Operation Supervision and Engineering
The costs included within this account consist of the cost of labor and other expenses incurred in the general supervision and direction of the operation of steam power generating stations.
FERC 501 – Fuel
The costs included within this account include the cost of fuel used in the production of steam for the generation of electricity including fuel-handling costs. Substantially all of the costs included in the account are cost of goods sold and are excluded from this analysis.
FERC 502 – Steam Expenses
The costs included within this account consist of labor, materials used and expenses incurred in production of steam for electric generation.
FERC 505 – Electric Expense
The costs included within this account consist primarily of labor, materials used and expenses incurred in operating electric equipment up to the point where electricity is delivered to the transmission or distribution system.
FERC 506 - Miscellaneous Steam Power Expenses
The costs included within this account consist of labor, materials used, and expenses incurred that are not specifically provided for or are not readily assignable to other steam generation operation expense accounts.
1 These explanations on a FERC account-by-account basis are included within the attached exhibit NSPM O&M IHS Analysis.
7
FERC 507 - Rents
The costs included within this account consist of rents of property used, occupied or operated in connection with steam power generation.
FERC 509 – Allowances
This account includes the cost of allowances expensed concurrent with the monthly emission of sulfur dioxide.
FERC 510 – Maintenance Supervision and Engineering
The costs included within this account consist of labor and expenses incurred in the general supervision and direction of maintenance activities at steam generation facilities.
FERC 511 – Maintenance of Structures
The costs included within this account consist of labor, materials used and expenses incurred in the maintenance of steam structures.
FERC 512 – Maintenance of Boiler Plant
The costs included within this account consist of labor, materials used and expenses incurred in the maintenance of steam boiler plant.
FERC 513 – Maintenance of Electric Plant
The costs included within this account consist of labor, materials used, and expenses incurred in the maintenance of electric plant.
FERC 514 – Maintenance of Miscellaneous Steam Plant
The costs included within this account consist of labor, materials used, and expenses incurred in maintenance of miscellaneous steam generation plant.
NUCLEAR POWER GENERATION –Total IHS Adjusted Deviation = ($30,982K)
FERC 517 – Nuclear Operation Supervision and Engineering
The costs included within this account consist of labor and expenses incurred in the general supervision and direction of the operation of nuclear power generation stations.
FERC 519 – Nuclear Coolants and Water

8
The costs included within this account consist of labor, materials used and expenses incurred for heat transfer materials and water used for steam and cooling.
FERC 520 –Nuclear Steam Expenses
The costs included within this account consist primarily of labor, materials used and expenses incurred in production of steam through nuclear processes.
FERC 523 – Nuclear Electric Expenses
The costs included within this account consist of labor, materials used and expenses incurred in operating electric equipment to the point where electricity is delivered to the transmission or distribution system.
FERC 524 – Miscellaneous Nuclear Power Expenses
The costs included within this account consist of labor, materials used and expenses incurred that are not specifically provided for or are not readily assignable to other nuclear generation operation accounts.
FERC 525 – Rents
The costs included within this account consist of rents of property used, occupied or operated in connection with nuclear generation.
FERC 528 – Maintenance Supervision and Engineering
The costs included within this account consist of labor and expenses incurred in the general supervision and direction of maintenance activities in nuclear generation facilities.
FERC 529 – Maintenance of Structures
The costs included within this account consist of labor, materials used and expenses incurred in the maintenance of structures.
FERC 530 – Maintenance of Reactor Plant Equipment
The costs included within this account consist of labor materials used and expenses incurred in the maintenance of reactor plant.
FERC 531 – Maintenance of Electric Plant

9
The costs included within this account consist of labor, materials used and expenses incurred in the maintenance of electric plant. FERC 532 – Maintenance of Miscellaneous Electric Plant The costs included within this account consist of labor, materials used and expenses incurred in maintenance of miscellaneous electric generating plant.
HYDRAULIC POWER GENERATION – Total IHS Adjusted Deviation = ($557K)
FERC 535 – Operation Supervision and Engineering The costs included within this account consist of labor and expenses incurred in the general supervision and direction of the operation of hydraulic power generation stations. FERC 536 – Water for Power The cost included within this account is the water used for hydraulic power generation. FERC 537 – Hydraulic Expenses The costs included within this account consist of labor, materials used and expenses incurred in operating hydraulic works including reservoirs, dams and waterways. FERC 538 – Electric Expenses The costs included in this account consist of labor, materials used and expenses incurred in operating electric equipment to the point where electricity is delivered for transmission or distribution. FERC 539 – Miscellaneous Hydraulic Power Generation Expenses The costs included in this account consist of labor, materials used and expenses incurred that are not specifically provided for or are not readily assignable to other hydraulic generation operation expense accounts. FERC 540 – Rents The costs included within this account consist of rents of property used, occupied or operated in connection with hydraulic generation. FERC 541 – Maintenance Supervision and Engineering

10
The costs included within this account consist of labor and expenses incurred in the general supervision and direction of maintenance activities in hydraulic generation stations.
FERC 542 – Maintenance of Structures
The costs included in this account consist of labor, materials used and expenses incurred in maintenance of hydraulic structures.
FERC 543 Maintenance of Reservoirs, Dams and Waterways
The costs included in this account consist of labor, materials used and expenses incurred in maintenance of reservoirs, dams and waterways.
FERC 544 Maintenance of Electric Plant
The costs included in this account consist of labor, materials used and expenses incurred in maintenance of hydraulic electric plant.
FERC 545 Maintenance of Miscellaneous Hydraulic Plant
The costs included in the account consist of labor, materials used and expenses incurred in maintenance of hydraulic plant.
OTHER POWER GENERATION – Total IHS Adjusted Deviation = $30,878K
FERC 546 – Operation Supervision and Engineering
The costs included within this account consist of labor and expenses incurred in the general supervision and direction of the operation of other power generation stations.
FERC 548 – Generation Expenses
The costs included within this account consist of labor, materials used and expenses incurred in operating generators and electric equipment in other power generation stations to the point where electricity is delivered to transmission or distribution.
FERC 549 – Miscellaneous Other Power Generation Expenses
The costs included in this account consist of labor, materials used and expenses incurred in the operation of other power generating stations that are not specifically provided for, or are not readily assignable to, other generation expense accounts.
FERC 550 - Rents
The costs included within this account consist of rents of property used, occupied or operated in connection with other power generation.

11
FERC 551 – Maintenance Supervision and Engineering
The costs included within this account consist of labor and expenses incurred in the general supervision and direction of maintenance activities in other power generation stations.
FERC 552 – Maintenance of Structures
The costs included in this account consist of labor, materials used and expenses incurred in maintenance of structures used in other power generation.
FERC 553 – Maintenance of Generating and Electric Plant
The costs included within this account consist of labor, materials used and expenses incurred in maintenance of plant.
FERC 554 – Maintenance of Miscellaneous Other Power Generation Plant
The costs included in this account consist of labor, materials used and expenses incurred in maintenance of other power generation plant.
OTHER POWER SUPPLY EXPENSE –Total IHS Adjusted Deviation = ($575K)
FERC 556 – System Control and Load Dispatching
The costs included in this account consist of labor and expenses incurred in load dispatching activities for system control.
FERC 557 – Other Expenses
The costs included in this account consist of any production expenses including expenses incurred directly in connection with the purchase of electricity, which is not specifically provided for in other production expense accounts.
TRANSMISSION EXPENSES
The 2022 Budget for Transmission Expenses is 19,046K more than 2022 projections using IHS Markit indexes. This is primarily due to an increase in Transmission Interchange expenses, which is a FERC approved tariff that provides for the inter-company sharing of production and transmission costs of Northern States Power Company – Minnesota (NSPM) and Northern States Power Company – Wisconsin (NSPW).Fluctuations in cost are related to plant investment and business area expenses.
FERC 560 - Operation Supervision and Engineering

12
The costs included within this account consist of labor and expenses incurred in the general supervision and direction of the operation of the transmission system as a whole.
FERC 561 – Load Dispatching
The costs included within this account consist of labor, materials used and expenses incurred in load dispatching operations pertaining to the transmission of electricity.
FERC 561.1 – Load Dispatch-Reliability
The costs included within this account consist of labor, materials used and expenses incurred by a transmission provider to manage the reliability coordination function as specified by the North American Electric Reliability Council (NERC) and individual reliability organizations including costs to calculate load forecasts and perform contingency analyses.
FERC 561.2 – Load Dispatch-Monitor and Operate Transmission System
The costs included within this account consist of labor, materials used and expenses incurred by a transmission provider to monitor, assess and operate the power system and individual transmission facilities in real-time to maintain safe and reliable operation of the transmission system.
FERC 561.3 – Load Dispatch-Transmission Service and Scheduling
The costs included within this account consist of labor, materials used and expenses incurred by a transmission provider to process hourly, daily, weekly and monthly transmission service requests using an automated system such as an Open Access Same-Time Information System (OASIS).
FERC 561.4 – Scheduling, System Control and Dispatch Services
The costs included within this account consist of costs billed to the transmission owner, load serving entity or generator for scheduling, system control and dispatching service.
FERC 561.5 – Reliability, Planning and Standards Development
The costs included within this account consist of labor, materials used and expenses incurred for the system planning of the interconnected bulk electric transmission systems within a planning authority area.

13
FERC 561.6 – Transmission Service Studies
The costs included within this account consist of labor, materials used and expenses incurred to conduct transmission service studies for proposed interconnection with the transmission system.
FERC 561.7– Generation Interconnection Studies
The costs included within this account consist of labor, materials used and expenses incurred to conduct generation interconnection studies for proposed interconnections with the transmission system.
FERC 561.8– Reliability, Planning and Standards Development Services
The costs included within this account consist of costs billed to the transmission owner, load serving entity, or generator for system planning of the interconnected bulk electric transmission system.
FERC 562 – Station Expense
The costs included within this account consist of labor, materials used and expenses incurred in operating transmission substations and switching stations.
FERC 563 – Overhead Line Expenses
The costs included within this account consist of labor, materials used and expenses incurred in the operation of overhead transmission lines.
FERC 564 – Underground Line Expenses
The costs included within this account consist of labor, materials used and expenses incurred in the operation of underground transmission lines.
FERC 565 – Transmission of Electricity by Others
This account includes costs payable to others for the transmission of the utility’s electricity over transmission facilities owned by others.
FERC 566 – Miscellaneous Transmission
The costs included in this account consist of labor, materials used and other transmission expenses incurred not provided for elsewhere.
FERC 567 – Rents
The costs included within this account consist of rents of property used, occupied or operated in connection with the transmission system.

14
FERC 568 – Maintenance Supervision and Engineering
The costs included within this account consist of labor and expenses incurred in the general supervision and direction of maintenance to the transmission system.
FERC 569 – Maintenance Structures
This account includes the cost of labor, materials used and expenses incurred in the maintenance of structures, the book cost of which is includible in account 352, Structures and Improvements.
FERC 570 – Maintenance of Station Equipment
The costs included within this account consist of labor, materials used and expenses incurred in the maintenance of transmission substation equipment.
FERC 571 – Maintenance of Overhead Lines
The costs included within this account consist of labor, materials used and expenses incurred in the maintenance of overhead transmission plant.
FERC 572 – Maintenance of Underground Lines
The costs included within this account consist of labor, materials used and expenses incurred in the maintenance of underground transmission plant.
FERC 573 – Maintenance of Miscellaneous Transmission Plant
The costs included within this account consist of labor, materials used and expenses incurred in the maintenance of transmission plant that is not provided for elsewhere.
REGIONAL MARKET EXPENSES
Regional Market Expenses are expected to increase $35K from 2020 actual costs to the 2022 budget.
FERC 575.1 – Operation Supervision
The costs included within this account consist of labor and expenses incurred in the general supervision and direction of the regional energy markets.
FERC 575.2 – Day-Ahead and Real-Time Market Facilitation
The costs included within this account consist of labor, materials used and expenses incurred to facilitate the Day-Ahead and Real Time markets.

15
FERC 575.3 – Transmission Rights Market Facilitation
The costs included within this account consist of labor, materials used and expenses incurred to manage the allocation and auction of transmission rights.
FERC 575.4 – Capacity Market Facilitation
The costs included within this account consist of labor, materials used and expenses incurred to manage the allocation of capacity rights.
FERC 575.5 – Ancillary Services Market Facilitation
The costs included within this account consist of labor, materials used and expenses incurred to manage all other ancillary services market functions.
FERC 575.6 – Market Monitoring and Compliance
The costs included within this account consist of labor, materials used and expenses incurred to review market data and operational decisions for compliance with market rules. It also includes the costs incurred to interface with external market monitors.
FERC 575.8 – Rents
The costs included within this account include all rents of property of others used, occupied, or operated in connection with market administration and monitoring.

16
DISTRIBUTION EXPENSES The 2022 budget for Distribution Expenses is $24,384K higher than 2022 projections using IHS Markit indexes. This increase is primarily related to work that is growing faster than inflation, including damage prevention locates and vegetation management.
FERC 580 – Operation Supervision and Engineering The costs included within this account consist of labor and expenses incurred in the general supervision and direction of the operation of the distribution system. FERC 581 – Load Dispatching The costs included within this account consist of labor, materials used and expenses incurred in load dispatching operations pertaining to the distribution of electricity. FERC 582 – Station Expenses The costs included in this account consist of labor, materials used and expenses incurred in the operation of distribution substations. FERC 583 – Overhead Line Expenses The costs included within this account consist of labor, materials used and expenses incurred in the operation of overhead distribution lines. FERC 584 – Underground Line Expenses The costs included within this account consist of labor, materials used and expenses incurred in the operation of underground distribution lines. FERC 585 – Street Lighting & Signal System Expenses The costs included within this account consist of labor, materials used and expenses incurred in the operation of street lighting and signal system plant. FERC 586 - Meter Expenses The costs included within this account consist of labor, materials used and expenses incurred in the operation of customer meters. FERC 587 – Customer Installations Expenses The costs included within this account consist of labor, materials used and expenses incurred in work on customer installations.

17
FERC 588 – Miscellaneous Distribution Expenses The costs included within this account consist of labor, materials used and expenses incurred in the distribution system operation not provided for elsewhere. FERC 589 – Rents The costs included within this account consist of rents of property used, occupied or operated in connection with the distribution system. FERC 590 – Maintenance Supervision and Engineering The costs included in this account consist of labor and expenses incurred in the general supervision and direction of maintenance of the distribution system. FERC 591 – Maintenance of Structures The costs included in this account consist of labor, materials used and expenses incurred in the maintenance of the structures. FERC 592 – Maintenance of Station Equipment The costs included within this account consist of labor, materials used and expenses incurred in maintenance of distribution substation equipment. FERC 593 – Maintenance of Overhead Lines The costs included within this account consist of labor, materials used and expenses incurred in the maintenance of overhead distribution line facilities. FERC 594 – Maintenance of Underground Lines The costs included within this account consist of labor, materials used and expenses incurred in the maintenance of underground distribution line facilities. FERC 595 - Maintenance of Line Transformers The costs included within this account consist of labor, materials used and expenses incurred in the maintenance of distribution line transformers. FERC 596 – Maintenance of Street Lighting and Signal Systems The costs included within this account consist of labor, materials used and expenses incurred in the maintenance of street lighting and signal plant.

18
FERC 597 – Maintenance of Meters
The costs included within this account consist of labor, materials used and expenses incurred in the maintenance of meters and meter testing equipment.
FERC 598 – Maintenance of Miscellaneous Distribution Plant
The costs included within this account consist of labor, materials used and expenses incurred in the maintenance of plant installed on the customer premises.
CUSTOMER ACCOUNTS EXPENSES
The 2022 budget amount for Customer Accounts Expenses is ($21,498K) greater than 2022 projections using IHS Markit indexes. This is primarily related to a one-time payment in 2020 related to the MN Residential Rate Relief Credit Program.
FERC 901 – Supervision
The costs included within this account consist of labor and expenses incurred in the general direction and supervision of customer accounting and collecting activities.
FERC 902 – Meter Reading Expenses
The costs included within this account consist of labor and materials used and expenses incurred in reading customer meters.
FERC 903 – Customer Records and Collection Expenses
The costs included within this account consist of labor, materials used and expenses incurred in work on customer applications, contracts, orders, credit investigations, billing and accounting, collection and complaints.
FERC 904 – Uncollectible Accounts
The costs included within this account consist of amounts to provide for losses from uncollectible utility accounts.
FERC 905 – Miscellaneous Customer Accounts Expenses
The costs included within this account consist of labor, materials used and expenses incurred that are not covered in other customer accounts.
CUSTOMER SERVICE AND INFORMATIONAL EXPENSES

19
The 2022 budget amount for Customer Service and Informational Expenses is $9K higher than 2022 projections using IHS Markit indexes.
FERC 908 – Customer Assistance Expenses The costs included within this account consist of labor, materials used and expenses incurred in providing instructions or assistance to customers to encourage safe, efficient and economical use of the utility’s service. FERC 909 – Informational and Instructional Expenses The costs included within this account consist of labor, materials used, and expenses incurred in activities to convey information to customers regarding the use of electric services. The use of electric services includes the safety and conservation aspects of the electric energy. FERC 910 – Miscellaneous Customer Service and Informational Expenses The costs included within this account consist of labor, materials used, and expenses incurred in connection with customer service and informational activities.
SALES EXPENSES The 2022 budget amount for Sales Expenses is $5,878K greater than 2022 projections using IHS Markit indexes. The increase is driven by $6,000K increase in costs to support current and future Electric Vehicle programs.
FERC 912 – Demonstration and Selling Expenses This account includes the cost of labor, materials used, and expenses incurred in promotional, demonstrating, and selling activities associated with electric marketing programs. FERC 916 – Miscellaneous Sales Expenses This account includes the cost of labor, materials used, and expenses incurred in connection with sales activities, except merchandising.
ADMINISTRATIVE AND GENERAL EXPENSES Administrative and General The2022 budget amount for Administrative and General Expenses is $7,112K greater than 2022 projections using IHS Markit indexes, primarily related to increased investments in information technology, including software maintenance and network data.
FERC 920 – Administrative and General Salaries

20
The costs included within this account consist of the total compensation expenses associated with employees of the Company that are properly chargeable to utility operations and not chargeable directly to a particular operating function. FERC 921 – Office Supplies and Expenses The costs included within this account consist of office supplies and expenses incurred in connection with the general administration of the Company’s operation. FERC 922 – Administrative Expenses Transferred – Credit This account includes a credit for administrative expenses recorded in FERC accounts 920 and 921 which are transferred to construction and non-utility accounts. FERC 923 – Outside Services Employed The costs included within this account consist of fees and expenses of professional consultants and others for general services which are not applicable to a particular operating function or other account. FERC 924 – Property Insurance The costs included within this account consist of the cost of insurance to protect the utility against losses and damages to property used in its utility operation. FERC 925 – Injuries and Damages The costs included within this account consist of the cost of insurance or reserve accruals for injuries and damage claims, losses not covered by insurance, and expenses incurred in settlement of injuries and damages claims. FERC 926 – Employee Pension and Benefits The costs included within this account primarily consist of employee medical and pension costs. FERC 928 – Regulatory Commission Expenses The costs included within this account consist of expenses properly incurred by the Company in connection with formal cases before regulatory commissions, or other regulatory bodies, or cases in which such a body is a party, including payments made to a regulatory commission for fees assessed against the utility for pay and expenses of such commission. FERC 929 – Duplicate Charges – Credit

21
This account includes credits for charges that may be made to operating expenses or to other accounts for the use of utility service from its own supply.
FERC 930.1 – General Advertising Expenses
This account includes the cost of labor, materials used and expenses incurred in advertising and related activities.
FERC 930.2 – Miscellaneous General Expenses
This account includes the cost of labor and expenses incurred in connection with the general management of the utility not provided for elsewhere.
FERC 931 – Rents
The costs included within this account consist of rents of property used, occupied or operated in connection with the customer accounts, customer service and informational, sales, and general and administrative functions of the utility.
FERC 935 – Maintenance of General Plant
The costs included within this account consist of costs assignable to customer accounts, sales and administrative and general functions of labor, materials used and expenses incurred in the maintenance of general plant.

Power Production Transmission Regional
Market Distribution Cust. Accts Cust Serv &Inform Sales A&G Total
IHS-Inflated 2020 Guideline 498,181,612 152,403,041 324,286 116,464,664 91,340,769 2,255,864 2,634,756 290,109,558 1,153,714,5512022 NSPM Budget 483,863,464 171,449,308 358,802 140,849,054 69,842,764 2,265,068 8,512,574 297,221,112 1,174,362,146Deviation (14,318,148) 19,046,267 34,515 24,384,390 (21,498,005) 9,204 5,877,818 7,111,554 20,647,595
Normalization AdjustmentNuclear Outage Amortization 8,906,907 8,906,907Transmission I/A bill from NSPW (14,592,093) (14,592,093)
Normalized Deviation (5,411,241) 4,454,173 34,515 24,384,390 (21,498,005) 9,204 5,877,818 7,111,554 14,962,409% Deviation -2.9% 12.5% 10.6% 20.9% -23.5% 0.4% 223.1% 2.5% 1.8%Normalized % Deviation -1.1% 2.9% 10.6% 20.9% -23.5% 0.4% 223.1% 2.5% 1.3%

PUBLIC DOCUMENTNOT PUBLIC DATA HAS BEEN EXCISED
Northern States Power Company MinnesotaElectric O&M Comparison2022 Budget vs. 2020 Actual
IHS Markit IHS Markit 2022 Budget2020 IHS 2021 IHS 2022 2022 Compared to %
Actual Index Inflated Index Inflated Budget IHS Deviation Deviation
POWER PRODUCTION EXPENSES
A. Steam Power GenerationOperation [PROTECTED DATA BEGINS
500 Operation Supervision & Engineering 3,743,604 4,013,722 3,212,550 (801,172) -19.96%
501 Fuel - COGS Excluded (1,347,340) (1,520,237) - 1,520,237 0.00%
502 Steam Expenses 18,130,663 19,802,434 18,157,131 (1,645,303) -8.31%
505 Electric Expenses 3,303,932 3,602,826 805,673 (2,797,153) -77.64%506 Miscellaneous Steam Power Expenses 14,413,994 15,221,071 15,248,813 27,742 0.18%
507 Rents 1,906,451 1,998,655 2,650,061 651,406 32.59%509 Allowances - - - - 0.00%
Total Operation 40,151,305 43,118,472 40,074,228 (3,044,244) -7.06%
Maintenance510 Maintenance Supervision & Engineering 1,685,793 1,824,951 1,783,249 (41,701) -2.29%
511 Maintenance of Structures 4,793,012 5,383,663 3,177,386 (2,206,277) -40.98%
512 Maintenance of Boiler Plant 21,090,323 22,469,288 21,114,265 (1,355,023) -6.03%
513 Maintenance of Electric Plant 5,815,433 6,241,810 3,959,188 (2,282,622) -36.57%
514 Maintenance of Miscellaneous Steam Plant 9,070,250 9,532,813 5,380,951 (4,151,862) -43.55%Total Maintenance 42,454,811 45,452,525 35,415,039 (10,037,485) -22.08%Total Steam Power Generation 82,606,116 88,570,997 75,489,267 (13,081,730) -14.77%
B. Nuclear Power GenerationOperation
517 Operation Supervision & Engineering 42,626,097 45,701,763 40,166,259 (5,535,504) -12.11%518 Fuel - COGS Excluded - - - - 0.00%
519 Coolants and Water 7,517,716 8,156,623 7,474,299 (682,324) -8.37%
520 Steam Expenses 48,337,462 52,051,902 48,383,250 (3,668,652) -7.05%
523 Electric Expenses 2,797,631 3,005,939 1,900,951 (1,104,989) -36.76%
524 Miscellaneous Nuclear Power Expenses - COGS Excluded 129,157,891 136,389,774 128,505,110 (7,884,665) -5.78%525 Rents 8,509,009 8,920,541 8,778,324 (142,217) -1.59%
Total Operation 238,945,805 254,226,543 235,208,192 (19,018,351) -7.48%
Page 2 of 7

PUBLIC DOCUMENTNOT PUBLIC DATA HAS BEEN EXCISED
Northern States Power Company MinnesotaElectric O&M Comparison2022 Budget vs. 2020 Actual
IHS Markit IHS Markit 2022 Budget2020 IHS 2021 IHS 2022 2022 Compared to %
Actual Index Inflated Index Inflated Budget IHS Deviation Deviation
Maintenance
528 Maintenance Supervision & Engineering 8,157,881 8,831,292 7,572,974 (1,258,318) -14.25%529 Maintenance of Structures - - - - 0.00%
530 Maintenance of Reactor Plant Equipment 36,338,283 39,237,100 34,775,446 (4,461,654) -11.37%
531 Maintenance of Electric Plant 13,215,647 14,184,595 12,308,682 (1,875,913) -13.22%
532 Maintenance of Miscellaneous Electric Plant 26,910,909 28,663,730 24,295,624 (4,368,106) -15.24%Total Maintenance 84,622,720 90,916,716 78,952,726 (11,963,990) -13.16%Total Nuclear Power Generation 323,568,525 345,143,259 314,160,918 (30,982,341) -8.98%
C. Hydraulic Power GenerationOperation
535 Operation Surpevision & Engineering 24,273 26,025 93,819 67,794 260.50%536 Water for Power - - - - 0.00%537 Hydraulic Expenses - - - - 0.00%538 Electric Expenses 523,108 570,035 139,090 (430,945) -75.60%539 Miscellaneous Hydraulic Power Generation Expenses 310,612 329,888 125,182 (204,706) -62.05%540 Rents 59,870 62,766 60,731 (2,035) -3.24%
Total Operation 917,864 988,714 418,822 (569,893) -57.64%
Maintenance541 Maintenance Supervision & Engineering 739 800 168,312 167,512 20934.96%542 Maintenance of Structures 29,164 32,758 18,810 (13,948) -42.58%543 Maintenance of Reservoirs, Dams and Waterways 126,204 136,883 - (136,883) 0.00%544 Maintenance of Electric Plant 151,124 162,207 - (162,207) 0.00%545 Maintenance of Miscellaneous Hydraulic Plant 2,894 3,032 161,129 158,097 5214.70%
Total Maintenance 310,125 335,680 348,251 12,571 3.74%Total Hydraulic Power Generation 1,227,990 1,324,394 767,073 (557,322) -42.08%
D. Other Power GenerationOperation
546 Operation Supervision & Engineering 3,494,429 3,746,567 3,760,117 13,550 0.36%547 Fuel - COGS Excluded - - - - 0.00%
548 Generation Expenses 6,021,095 6,532,335 5,017,450 (1,514,885) -23.19%
549 Miscellaneous Other Power Generation Expenses 11,771,663 12,523,826 20,577,115 8,053,289 64.30%
550 Rents 7,265,247 7,616,626 15,558,449 7,941,823 104.27%Total Operation 28,552,434 30,419,354 44,913,131 14,493,777 47.65%
Maintenance551 Maintenance Supervision & Engineering 1,949,100 2,109,993 2,099,930 (10,063) -0.48%
552 Maintenace of Structures 5,776,245 6,488,062 4,756,329 (1,731,733) -26.69%
Page 3 of 7

PUBLIC DOCUMENTNOT PUBLIC DATA HAS BEEN EXCISED
Northern States Power Company MinnesotaElectric O&M Comparison2022 Budget vs. 2020 Actual
IHS Markit IHS Markit 2022 Budget2020 IHS 2021 IHS 2022 2022 Compared to %
Actual Index Inflated Index Inflated Budget IHS Deviation Deviation
553 Maintenance of Generating and Electric Plant 9,492,999 9,998,981 16,261,564 6,262,584 62.63%
554 Maintenance of Miscellaneous Other Power Generation Plant 6,266,881 6,586,478 18,450,311 11,863,833 180.12%Total Maintenance 23,485,225 25,183,514 41,568,135 16,384,621 65.06%Total Other Power Generation 52,037,660 55,602,868 86,481,266 30,878,398 55.53%
E. Other Power Supply Expenses555 Purchased Power - COGS Excluded - - - - 0.00%556 System Control and Load Dispatching 1,442,425 1,442,425 1,623,058 180,633 12.52%
557 Other Expenses -Excluding Cost of Goods Sold and I/A 6,097,669 6,097,669 5,341,882 (755,787) -12.39%Total Other Power Supply Expenses 7,540,094 7,540,094 6,964,940 (575,153) -7.63%
TOTAL POWER PRODUCTION EXPENSES 466,980,384 498,181,612 483,863,464 (14,318,148) -2.87%(Excluding COGS included in Accounts 501, 518, 547, 555 and 557 )
TRANSMISSION EXPENSESOperation
560 Operation Supervision & Engineering 10,169,049 11,007,020 10,390,233 (616,786) -5.60%561 Load Dispatching - - - - 0.00%561.1 Load Dispatch-Reliability - - - - 0.00%561.2 Load Dispatch-Monitor and Operate Transmission System 4,720,501 4,844,316 5,194,744 350,428 7.23%561.3 Load Dispatch- Transmission Service and Scheduling - - - - 0.00%561.4 Scheduling, System Control and Dispatch Services - COGS excluded - - - - 0.00%561.5 Reliabilty, Planning and Standards Development 13,108 13,452 178,665 165,213 1228.17%561.6 Transmission Service Studies 56,917 58,410 - (58,410) 0.00%561.7 Generation Interconnection Studies 894,233 917,688 583,638 (334,050) -36.40%561.8 Reliability, Planning and Standards Development Services 2,496,145 2,561,616 2,243,130 (318,487) -12.43%
562 Station Expenses 3,441,285 3,699,200 2,581,213 (1,117,987) -30.22%563 Overhead Line Expenses 829,768 892,655 1,208,897 316,242 35.43%564 Underground Line Expenses 6,747 7,258 - (7,258) 0.00%
565Transmission of Electricity by Others - Includes Transmission I/A - COGS excluded 109,147,471 109,147,471 127,819,663 18,672,192 17.11%
566 Misc. Transmission Expenses 8,264,037 8,572,959 9,310,610 737,651 8.60%567 Rents 1,168,489 1,225,002 1,150,834 (74,168) -6.05%
Total Operation 141,207,749 142,947,046 160,661,626 17,714,580 12.39%
Maintenance568 Maintenance Supervision & Engineering 7,611 8,239 - (8,239) 0.00%569 Maintenance of Structures - - - - 0.00%570 Maintenance of Station Equipment 3,927,656 4,207,763 4,629,682 421,919 10.03%
Page 4 of 7

PUBLIC DOCUMENTNOT PUBLIC DATA HAS BEEN EXCISED
Northern States Power Company MinnesotaElectric O&M Comparison2022 Budget vs. 2020 Actual
IHS Markit IHS Markit 2022 Budget2020 IHS 2021 IHS 2022 2022 Compared to %
Actual Index Inflated Index Inflated Budget IHS Deviation Deviation
571 Maintenance of Overhead Lines 4,732,302 5,082,453 6,158,000 1,075,547 21.16%572 Maintenance of Underground Lines 83,419 90,798 - (90,798) 0.00%573 Maintenance of Miscellaneous Transmission Plant 62,930 66,743 - (66,743) 0.00%
Total Maintenance 8,813,919 9,455,995 10,787,682 1,331,686 14.08%
TOTAL TRANSMISSION 150,021,668 152,403,041 171,449,308 19,046,267 12.50%(Excluding COGS included in Accounts 565)
REGIONAL MARKET EXPENSESOperation
575.1 Operation Supervision 186,874 186,874 246,499 59,624 31.91%575.2 Day-Ahead and Real-Time Market Facilitation 121,069 121,069 94,209 (26,860) -22.19%575.3 Transmission Rights Market Facilitation - - - - 0.00%575.4 Capacity Market Facilitation - - - - 0.00%575.5 Ancillary Services Market Facilitation 234 234 505 271 115.59%575.6 Market Monitoring and Compliance - - - - 0.00%575.7 Market Facilitation, Monitoring and Compliance Services- COGS exclude - - - - 0.00%575.8 Rents 16,109 16,109 17,589 1,480 9.19%
Total Operation 324,286 324,286 358,802 34,515
Maintenance576.1 Maintenance of Structures and Improvements - - - - 0.00%576.2 Maintenance of Computer Hardware - - - - 0.00%576.3 Maintenance of Computer Software - - - - 0.00%576.4 Maintenance of Communication Equipment - - - - 0.00%576.5 Maintenance of Miscellaneous Market Op Expenses - - - - 0.00%
Total Maintenance - - - - 0.00%
TOTAL REGIONAL TRANSMISSION AND MARKET OPERATIONS 324,286 324,286 358,802 34,515 10.64%
DISTRIBUTION EXPENSESOperation
580 Operation Supervision & Engineering 11,066,496 11,837,356 11,989,628 152,272 1.29%581 Load Dispatching 671,930 715,338 765,482 50,143 7.01%582 Station Expenses 2,535,205 2,710,434 2,750,240 39,806 1.47%
583 Overhead Line Expenses 501,534 539,916 (882,426) (1,422,342) -263.44%
584 Underground Line Expenses 8,278,227 8,911,751 18,037,236 9,125,485 102.40%585 Street Lighting and Signal System Expenses 622,345 668,897 840,073 171,175 25.59%
586 Meter Expenses 730,273 784,999 1,912,817 1,127,818 143.67%587 Customer Installations Expenses 2,839,184 3,044,549 2,693,126 (351,423) -11.54%
588 Miscellaneous Distribution Expenses 27,251,382 28,532,736 27,199,335 (1,333,401) -4.67%589 Rents 4,104,362 4,302,866 4,022,229 (280,637) -6.52%
Total Operation 58,600,937 62,048,843 69,327,739 7,278,896 11.73%
Maintenance590 Maintenance Supervision & Engineering 33,428 36,085 191 (35,894) -99.47%
Page 5 of 7

PUBLIC DOCUMENTNOT PUBLIC DATA HAS BEEN EXCISED
Northern States Power Company MinnesotaElectric O&M Comparison2022 Budget vs. 2020 Actual
IHS Markit IHS Markit 2022 Budget2020 IHS 2021 IHS 2022 2022 Compared to %
Actual Index Inflated Index Inflated Budget IHS Deviation Deviation
591 Maintenance of Structures 0 0 - (0) 0.00%592 Maintenance of Station Equipment 3,629,713 3,885,194 3,807,873 (77,321) -1.99%
593 Maintenance of Overhead Lines 37,466,889 40,194,096 57,634,446 17,440,349 43.39%
594 Maintenance of Underground Lines 7,692,326 8,352,851 7,179,638 (1,173,213) -14.05%595 Maintenance of Line Transformers 132,106 139,794 30,554 (109,240) -78.14%596 Maintenance of Street Lighting and Signal Systems 1,319,279 1,405,133 1,088,833 (316,300) -22.51%597 Maintenance of Meters 151,472 160,300 888,639 728,339 454.36%598 Maintenance of Miscellaneous Distribution Plant 224,611 242,367 891,142 648,774 267.68%
Total Maintenance 50,649,822 54,415,821 71,521,315 17,105,494 31.43%
TOTAL DISTRIBUTION 109,250,759 116,464,664 140,849,054 24,384,390 20.94%
CUSTOMER ACCOUNTS EXPENSESOperation
901 Supervision 120,461 129,598 130,321 723 0.56%
902 Meter Reading Expenses 28,680,430 30,578,644 29,859,425 (719,219) -2.35%
903 Customer Records and Collection Expenses 20,848,510 22,422,876 23,962,810 1,539,934 6.87%
904 Uncollectible Accounts 19,909,049 19,909,049 15,790,188 (4,118,862) -20.69%
905 Miscellaneous Customer Accounts Expenses 17,646,104 18,300,602 100,021 (18,200,581) -99.45%Total 87,204,554 91,340,769 69,842,764 (21,498,005) -23.54%
CUSTOMER SERVICE AND INFORMATIONAL EXPENSESOperation
907 Supervision - - - - 0.00%908 Customer Assistance Expenses- CIP O&M excluded 1,086,966 1,177,450 919,746 (257,704) -21.89%909 Informational and Instructional Expenses 902,758 932,169 1,058,829 126,660 13.59%910 Miscellaneous Customer Service and Informational Expenses 142,448 146,246 286,493 140,247 95.90%
Total 2,132,172 2,255,864 2,265,068 9,204 0.41%
SALES EXPENSESOperation
911 Supervision - - - - 0.00%
912 Demonstrating and Selling Expenses 2,403,900 2,604,305 8,468,366 5,864,060 225.17%913 Advertising Expenses - - - - 0.00%916 Miscellaneous Sales Expenses 29,350 30,451 44,208 13,758 45.18%
Total 2,433,250 2,634,756 8,512,574 5,877,818 223.09%
ADMINISTRATIVE AND GENERAL EXPENSESOperation
920 Administrative and General Salaries 108,409,356 114,545,468 107,189,171 (7,356,297) -6.42%
Page 6 of 7

PUBLIC DOCUMENTNOT PUBLIC DATA HAS BEEN EXCISED
Northern States Power Company MinnesotaElectric O&M Comparison2022 Budget vs. 2020 Actual
IHS Markit IHS Markit 2022 Budget2020 IHS 2021 IHS 2022 2022 Compared to %
Actual Index Inflated Index Inflated Budget IHS Deviation Deviation
921 Office Supplies and Expenses 53,310,954 56,034,433 72,210,116 16,175,683 28.87%
922 Administrative Expenses Transferred-Credit (53,958,443) (53,958,443) (65,800,273) (11,841,830) 21.95%
923 Outside Services Employed 20,505,925 21,531,606 23,538,181 2,006,575 9.32%
924 Property Insurance 2,056,266 2,179,477 8,675,382 6,495,905 298.05%
925 Injuries and Damages - fuel handling O&M excluded 14,898,526 15,628,451 19,324,472 3,696,020 23.65%
926 Employee Pension and Benefits - non service P&B O&M excluded 73,874,406 78,502,264 77,392,980 (1,109,284) -1.41%927 Franchise Requirements - - - - 0.00%
928 Regulatory Commission Expenses - Amortization expense excluded 11,694,771 12,627,976 7,149,683 (5,478,293) -43.38%929 Duplicate Charges-Credit (5,091,443) (5,091,443) (5,581,716) (490,273) 9.63%930.1 General Advertising Expenses 3,830,009 3,949,851 3,897,922 (51,929) -1.31%
930.2 Miscellaneous General Expenses 3,387,060 3,505,557 4,658,422 1,152,865 32.89%931 Rents 38,797,494 40,458,203 43,309,359 2,851,155 7.05%
935 Maintenance of General Plant 186,064 196,158 1,257,414 1,061,256 541.02%Total 271,900,946 290,109,558 297,221,112 7,111,554 2.45%(Excluding non departmental O&M costs in Accts. 925, 926 & 928)
GRAND TOTAL - All Expenses 1,090,248,020 1,153,714,551 1,174,362,146 20,647,595 1.79%PROTECTED DATA END]
Note:
N/A in IHS Index column means the IHS Index is not available
Page 7 of 7

IHS Markit Inc.Electric Utility Operations and Maintenance Costs: Combined Labor, Materials and ServicesSteam and Nuclear Expenses Table A22Second Quarter 2021 Forecast
2020 2021 2022
STEAM PRODUCTION PLANT [PROTECTED DATA BEGINSTotal Operation and Maintence: JEFOM
Percent ChangeOperation: JEFO
Percent ChangeSupervision and Eng. 500: JES&E500
Percent ChangeFuel 501*: JEF501MS
Percent ChangeSteam Plant 502: JEF502
Percent ChangeElectric Plant 505: JEF505
Percent ChangeMiscellaneous 506: JEF506
Percent ChangeRents 507: JRENT
Percent ChangeMaintence: JEFM
Percent ChangeSupervision and Eng. 510: JES&E510
Percent ChangeStructures 511: JEF511
Percent ChangeBoiler Plant 512: JEF512
Percent ChangeElectric Plant 513: JEF513
Percent ChangeMiscellaneous 514: JEF514
Percent Change
NUCLEAR PRODUCTION PLANTTotal Operation and Maintence: JENOM
Percent ChangeOperation: JENO
Percent ChangeSupervision and Eng. 517: JES&E517
Percent ChangeCoolants and Water 519: JEN519
Percent ChangeSteam Expenses 520: JEN520
Percent ChangeElectric Expenses 523: JEN523
Percent ChangeMiscellaneous 524: JEN524
Percent ChangeRents 525: JRENT
Percent ChangeMaintence: JENM
Percent ChangeSupervision and Eng. 528: JES&E528
Percent ChangeStructures 529: JEN529
Percent ChangeReactor Plant 530: JEN530
Percent ChangeElectric Plant 531: JEN531
Percent ChangeMiscellaneous 532: JEN532
Percent ChangePROTECTED DATA END]
* This account receives no weight in forming the total operation and total operation and maintence cost indexes
PUBLIC DOCUMENT - NOT PUBLIC DATA HAS BEEN EXCISED

IHS Markit Inc.Electric Utility Operations and Maintenance Costs: Combined Labor, Materials and ServicesHydraulic and Other Expenses Table A23Second Quarter 2021 Forecast
2020 2021 2022
HYDRO PRODUCTION PLANT [PROTECTED DATA BEGINSTotal Operation and Maintenance: JEHOM
Percent ChangeOperation: JEHO
Percent ChangeSupervision and Eng. 535: JES&E535
Percent ChangeHydraulic Plant 537: JEH537
Percent ChangeElectric Plant 538: JEH538
Percent ChangeMiscellaneous 539: JEH539
Percent ChangeRents 540: JRENT
Percent ChangeMaintenance: JEHM
Percent ChangeSupervision and Eng. 541: JES&E541
Percent ChangeStructures 542: JEH542
Percent ChangeReserv.; Dams; Waterways 543: JEH543
Percent ChangeElectric Plant 544: JEH544
Percent ChangeMiscellaneous 545: JEH545
Percent Change
OTHER PRODUCTION PLANTTotal Operation and Maintenance: JEOOM
Percent ChangeOperation: JEOO
Percent ChangeSupervision and Eng. 546: JES&E546
Percent ChangeFuel 547*: JEO547MS
Percent ChangeGeneration Expenses 548: JEO548
Percent ChangeMiscellaneous 549: JEO549
Percent ChangeRents 550: JRENT
Percent ChangeMaintenance: JEOM
Percent ChangeSupervision and Eng. 551: JES&E551
Percent ChangeStructures 552: JEO552
Percent ChangeGeneration and Elec. Plant 553: JEO553
Percent ChangeMiscellaneous 554: JEO554
Percent ChangePROTECTED DATA ENDS]
* This account receives no weight in forming the total operation and total operation and maintenance cost indexes
PUBLIC DOCUMENT - NOT PUBLIC DATA HAS BEEN EXCISED
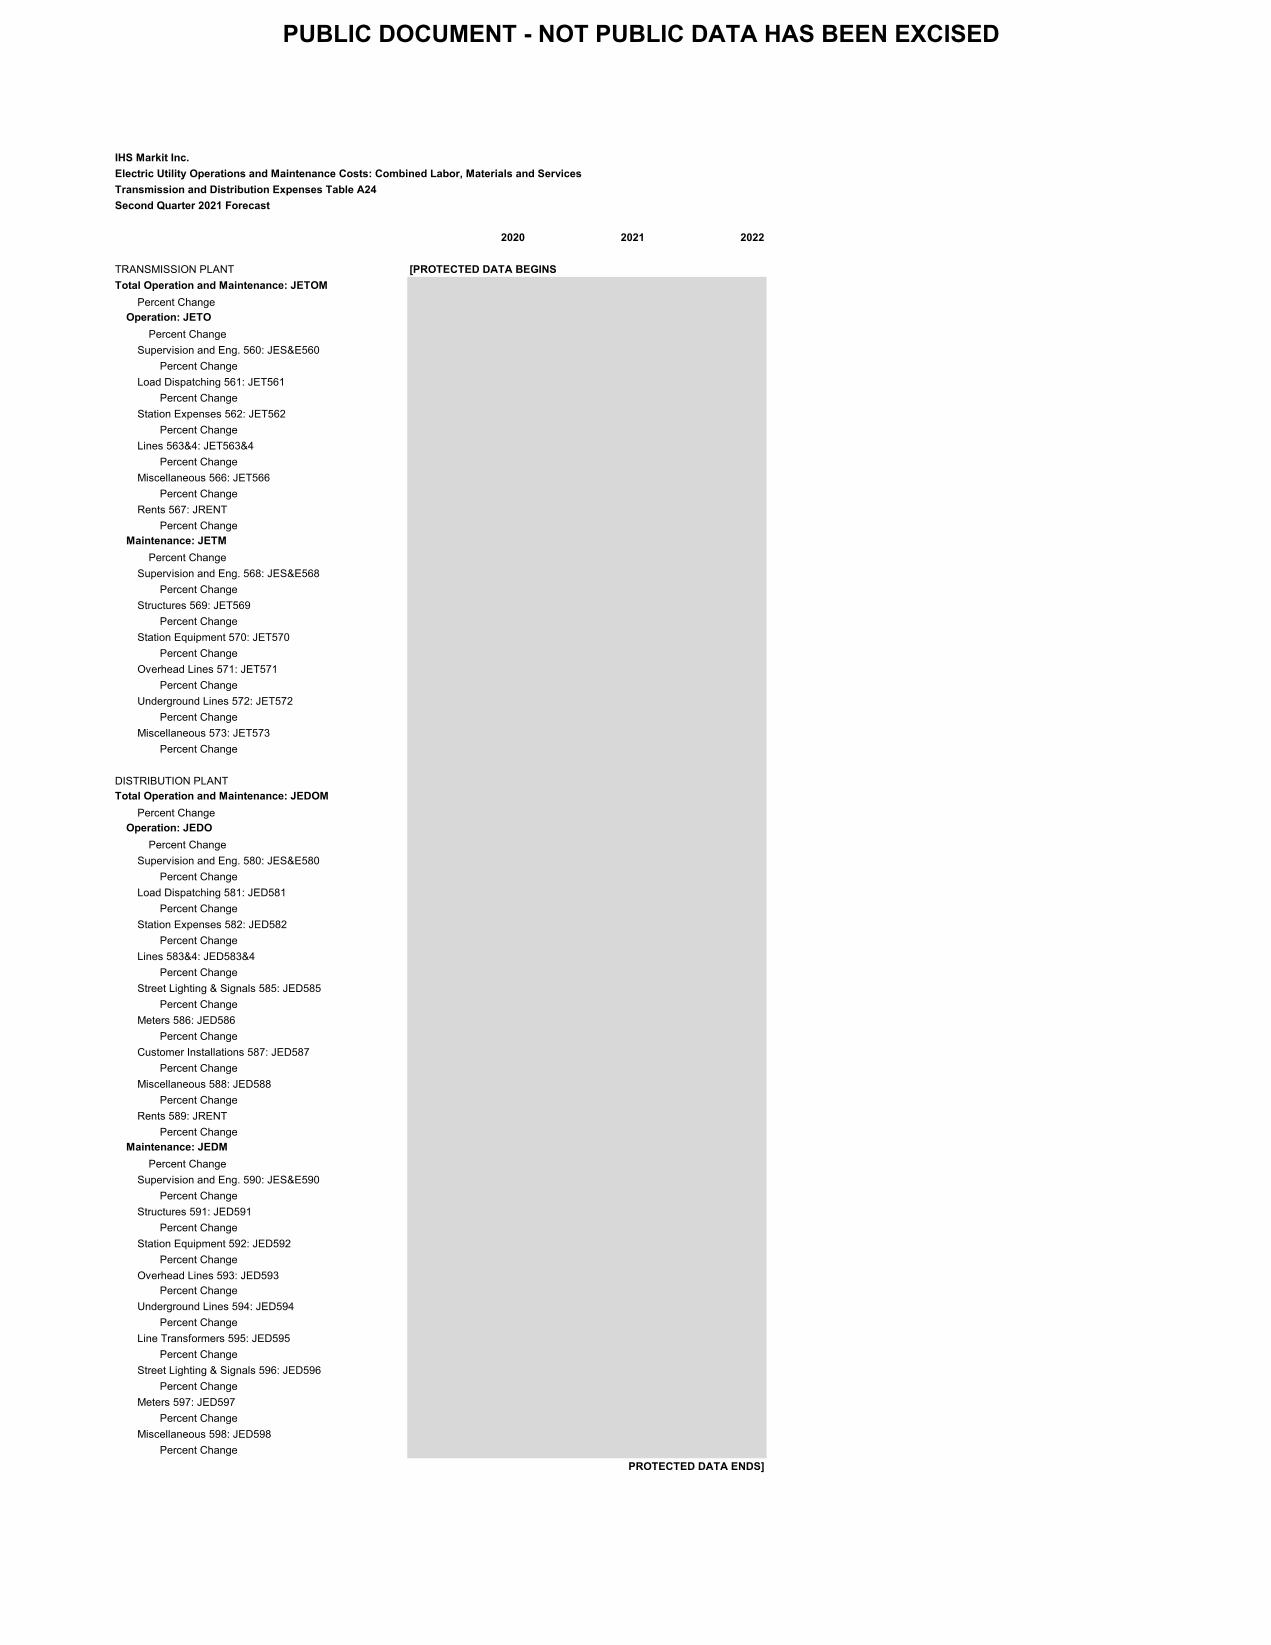
IHS Markit Inc.Electric Utility Operations and Maintenance Costs: Combined Labor, Materials and ServicesTransmission and Distribution Expenses Table A24Second Quarter 2021 Forecast
2020 2021 2022
TRANSMISSION PLANT [PROTECTED DATA BEGINSTotal Operation and Maintenance: JETOM
Percent ChangeOperation: JETO
Percent ChangeSupervision and Eng. 560: JES&E560
Percent ChangeLoad Dispatching 561: JET561
Percent ChangeStation Expenses 562: JET562
Percent ChangeLines 563&4: JET563&4
Percent ChangeMiscellaneous 566: JET566
Percent ChangeRents 567: JRENT
Percent ChangeMaintenance: JETM
Percent ChangeSupervision and Eng. 568: JES&E568
Percent ChangeStructures 569: JET569
Percent ChangeStation Equipment 570: JET570
Percent ChangeOverhead Lines 571: JET571
Percent ChangeUnderground Lines 572: JET572
Percent ChangeMiscellaneous 573: JET573
Percent Change
DISTRIBUTION PLANTTotal Operation and Maintenance: JEDOM
Percent ChangeOperation: JEDO
Percent ChangeSupervision and Eng. 580: JES&E580
Percent ChangeLoad Dispatching 581: JED581
Percent ChangeStation Expenses 582: JED582
Percent ChangeLines 583&4: JED583&4
Percent ChangeStreet Lighting & Signals 585: JED585
Percent ChangeMeters 586: JED586
Percent ChangeCustomer Installations 587: JED587
Percent ChangeMiscellaneous 588: JED588
Percent ChangeRents 589: JRENT
Percent ChangeMaintenance: JEDM
Percent ChangeSupervision and Eng. 590: JES&E590
Percent ChangeStructures 591: JED591
Percent ChangeStation Equipment 592: JED592
Percent ChangeOverhead Lines 593: JED593
Percent ChangeUnderground Lines 594: JED594
Percent ChangeLine Transformers 595: JED595
Percent ChangeStreet Lighting & Signals 596: JED596
Percent ChangeMeters 597: JED597
Percent ChangeMiscellaneous 598: JED598
Percent ChangePROTECTED DATA ENDS]
PUBLIC DOCUMENT - NOT PUBLIC DATA HAS BEEN EXCISED

IHS Markit Inc.Electric Utility Operations and Maintenance Costs: Combined Labor, Materials and ServicesCustomer Accounts; Customer Service and Information; Sales; and Administrative and General Expenses Table A25Second Quarter 2021 Forecast
2020 2021 2022
CUSTOMER ACCOUNTS {PROTECTED DATA BEGINSOperation: JECAO
Percent ChangeSupervision 901: JES&E901
Percent ChangeMeter Reading Exp. 902: JECA902
Percent ChangeCus. Records and Collections 903: JECA903
Percent ChangeMiscellaneous 905: JECA905
Percent Change
CUSTOMER SERVICE and INFORMATIONOperation: JECSIO
Percent ChangeSupervision 907: JES&E907
Percent ChangeCustomer Assistance 908: JECSI908
Percent ChangeInfo. and Instruc. Advertising 909: JECSI909
Percent ChangeMiscellaneous 910: JECSI910
Percent Change
SALESOperation: JESALO
Percent ChangeSupervision 911: JES&E911
Percent ChangeDemonstr. and Selling 912: JESAL912
Percent ChangeAdvertising 913: JESAL913
Percent ChangeMiscellaneous 916: JESAL916
Percent Change
ADMINISTRATIVE and GENERALTotal Operation and Maintenance: JEADGOM
Percent ChangeOperation: JEADGO
Percent ChangeAdmin and General 920: JEADG920
Percent ChangeOffice Supplies 921: JEADG921MS
Percent ChangeOutside Services 923: JEADG923MS
Percent ChangeProperty Insurance 924: JEADG924MS
Percent ChangeInjuries and Damages 925: JEADG925MS
Percent ChangePensions and Benefits 926: JEADG926MS
Percent ChangeFranchise Fees 927: JEADG927MS
Percent ChangeRegulatory Commission Exp. 928: JEADG928MS
Percent ChangeGeneral Advertising 930.1: JEADG9301
Percent ChangeMiscellaneous 930.2: JEADG9302
Percent ChangeRents 931: JRENT931
Percent ChangeMaintenance
General Plant 935: JEADG935Percent Change
PROTECTED DATA ENDS]
PUBLIC DOCUMENT - NOT PUBLIC DATA HAS BEEN EXCISED

Budget Translation Analysis of Miscellaneous Expenses
Budget Translation Report Docket No. E002/GR-21-630 Required Information
1
Filing Requirement The Commission order in Docket No. E-002/GR-91-001 states, as item 6b, the following requirement: “the Company shall file translation reports linking cost element, cost activity, and project budgeting mechanisms on a common and consistent basis to ensure a proper audit trail” (page 92 of the November 27,1991 Order). The body of the Commission order in Docket No. E-002/GR-91-001 states on page 25 in item 2: “File translation reports linking cost element, cost activity, and project budgeting mechanisms on a common and consistent basis to ensure an accurate accounting for expenses contained in ‘default’ cost elements like MS16.” (the budget system used by the Company at the time of the 1991 electric rate case filing identified components of cost using various cost elements such as Labor 10, Employee Expenses 11 etc. In that budget system a miscellaneous cost element Other Expenses 16 was used for items not specifically assignable to other cost components.) The Commission order in Docket No. E-002/GR - 92-1185 states as item 10 the following requirement: “In its next general rate case filing, the Company shall be exempted from including the following items: …translation reports linking cost element, cost activity, and project budgeting mechanisms on a common and consistent basis to assure an audit trail …Separately but contemporaneously with its next general rate case filing, however, the Company shall file this information with the Commission, serve copies on the Department and the RUD-OAG and make this information available for review by other parties upon their request.” Compliance The Company implemented a new budget system in 2014, Financial Management System (FMS), and a new financial management system in 2016, Systems, Applications, and Products in Data Processing (SAP). FMS is configured to build budgets consistent with actual accounting data. FMS assigns labor and non-labor costs to an SAP cost center, an SAP cost element, and an SAP internal order. This accounting string is used to assign the cost to the appropriate legal entity as well as provide the translation to the appropriate FERC account and the basis to develop electric or gas cost of service studies. Volume 6 of the filing contains budget documentation supporting the operating and maintenance expense for the 2022 test year for each business area. Schedule 3 includes a breakdown of the 2022 budgeted cost for each business area by cost elements. Schedule 4 provides a breakdown of the 2022 budgeted cost for each business area by FERC account. Both schedules also provide a comparison to 2020 actual costs. Explanations for significant changes between 2020 actual and 2022 budget operating and maintenance expenses, which link to the account variances shown on Schedule 4, are also provided in the budget documentation. In addition, budget work papers that provide additional support are available for review upon request.

Budget Translation Report Docket No. E002/GR-21-630 Required Information
2
To address the requirement to provide additional information on miscellaneous other costs, descriptions for all of the Operating and Maintenance SAP cost elements were reviewed to identify those where the descriptions were not clear. Through this process two SAP cost objects were identified: 5600871 Other 5600781 O and M Credits - Other The attached document provides additional descriptive details of the 2022 budgeted costs/credits included in these two SAP cost elements for the NSPM legal entity electric utility.

Legal Entity - NSP-MNElectric Utility 2022Object Account Business Area Additional Description of Cost/Credit Budget
5600871 Other Nuclear Generation The Company defers direct nuclear outage costs and amortizes those costs over the period between nuclear outages. This is the estimated direct costs for the scheduled nuclear outages that are being deferred and amortized to expense during this period.
($28,584,509)
5600871 Other All other miscellenaous costs across many Business Areas
Miscellaneous charges across many Business Areas that were not included in other cost elements.
$392,670
5600871 Other Customer and Innovation Budgeted costs related to electric transportion for advisory-fleet $700,000
5600781 O and M Credits - Other Benefits & Loadings ($712,568)
5600781 O and M Credits - Other Corporate Other ($2,006,277)
5600781 O and M Credits - Other Energy Supply ($1,081,671)
5600781 O and M Credits - Other Financial Operations
Credit related to the Human Resources Call Center which is already reflected in the NSPM labor loadings.
NSP Transmission Joint Ventures credits ($0.5M) are recorded to the Corporate Other business area in Miscellaneous O&M credits (FERC account 922, A&G Admin Transferred Credit) to offset the A&G expenses allowable per contract that are billed to 3rd party partners. In addition, non-regulated overhead allocation for non-regulated activities for NSPM are allocated a portion of administrative and general costs to insure the regulated utility isn’t subsidizing the non-utility business. The overhead allocation methods for NSPM are described in their Cost Assignment and Allocation Manuals (CAAM) filed with their respective Public Utilities Commission which amounted to ($1.6M) in the 2022 Budget.
Credits for O&M support for Sherco Unit 3 from Southern Minnesota Municipal Power Agency (SMMPA) for the shared ownership agreement.
System generated credits reflecting a reimbursement from captive insurance ($342,871)
Page 1 of 1

Capital Substitution/Contingent Fund Process and Reports

Contingent Fund Report Docket No. E002/GR-21-630
1
Filing Requirement The Commission order in Docket No. E-002/GR-92-1185 states as item 10 the following requirement: “In its next general rate case filing, the Company shall be exempted from including the following items: …month-by-month and year-end summary reports of contingency fund transactions and project substitutions. Separately but contemporaneously with its next general rate case filing, however, the Company shall file this information with the Commission, serve copies on the Department and the RUD-OAG and make this information available for review by other parties upon their request.” Compliance At the time of NSP’s electric rate case filing in 1992, the Company would set aside a portion of the capital budget authorization for each business area into a contingency fund. During the year the contingent fund would be utilized for one of the following reasons:
(1) Existing project requiring additional authorization (2) Existing project returning unused authorization (3) New project requiring original authorization (4) Canceled project returning authorization
A contingent fund summary report was prepared that showed the projects that either required or returned amounts to the contingency fund. The contingent fund transactions represented a transfer of project authorization amounts. These amounts were not necessarily indicative of capital expenditure budget deviations. Beginning in the mid-1990s, the Company moved away from the use of contingency funds as a general practice, and no longer routinely authorized unspecified capital budget amounts. Instead, business areas were required to budget all non-blanket capital related expenditures on a project-specific basis. During the year, as budgeted projects were changed or eliminated, and new projects were identified, each business area evaluated the changes and with consideration of the total budgeted amount available, revised their project list accordingly. If additional money was required to fund the updated project list, approval from the executive finance committee was necessary. The Company’s current process is similar. Each business area is responsible for identifying specific non-blanket projects in the budgeting process. Throughout the year each business area manages their capital spending in accordance with the approved budget levels. As new projects are identified, and changes to existing projects are made and approved, the project lists are updated. On a monthly basis, the capital budget for each business area is reviewed by the executive Finance Council. This review includes a comparison of year-to-date expenditures as compared to the budget, a year-end forecast, and a status review of deviations. If it is necessary to reassign the capital budget it is

Contingent Fund Report Docket No. E002/GR-21-630
2
done at the discretion of the Finance Council and is based on the benefits of the projects being funded. Summaries of the processes used for Energy Supply, Distribution, Transmission, Nuclear, and Business Systems, those business areas representing a majority of the 2021 capital budget, are included as Attachments A, B, C, D, and E.

Attachment A
Energy Supply
Capital Project Substitution and Change Process Capital Reallocation and Financial Reforecast Periodically, it may be necessary to reallocate and reforecast capital expenditures from the original budget approved through the Corporate Budgeting process. Initiating causes that may require reallocation and reforecast are likely to include: emergent work, new projects, project overruns or underruns, project cancellations and budget reductions. The undesignated capital account within the Energy Supply budget contains funds that have been budgeted and set aside for undefined capital projects (emergent work, including unexpected regulatory action, etc.) This fund is used for emergent work identified and approved throughout the year. If a project fits the criteria and is approved, funds are deducted from the undesignated account and designated to that plant during monthly financial updates. The same can be true in reverse. If a project is cancelled for a reason (not needed, over budgeted, out of time, outage cancelled, etc.) then funds that were budgeted are reduced from the specific plant and added back to the undesignated account. Exhibit 1 illustrates the tracking of these capital reallocations for projects that were budgeted and not executed in 2020, and those that were not funded, but spent in 2020.

NSP Minnesota Emergent ProjectsBy Plant and ProjectUpdated through December 2020 YTD Actuals
YTD Actuals/YTD Budget Committed/Approved Projects VarianceTotal Actuals/Fcst 10,980,963 12,562,199 (1,581,236)
Adjusted Forecast for Actual Projects 10,980,963 12,562,199 (1,581,236)
Total Emergent Projects Budget 4,885,284 Approved Offsets 884,200 Adjusted Emergent Budget Dollars 5,769,484 12,562,199 (6,792,715) PVW Transformer Budget 130,000 Granite City Demo Budget 18,000 Corp Tools Budget (less 71K for lab instrument which is being counted in offsets) 192,340 2020 Available Budget Dollars 6,109,824 12,562,199 (6,452,375)
Variance Actuals to Budget 4,871,139
Project Definition - TextSAP Parent (WBS Lev SAP WBS Lev 4 SAP WBS Lev 4 Desc YTD Actuals/YTD Budget Committed/Approved Projects VarianceIVH_Inver Hills A.0001561.500 A.0001561.500.001.001 IVH Emergent Fund -Other prod - -
A.0001561.500.001.017 IVH Emerg shop crane mono rplc 20,985 20,985 A.0001561.500.001.018 IVH0C Emerg ESC Stk Vision upgrade 114,504 55,000 59,504 A.0001561.500.001.019 IVH0C Emerg CR HVAC Contr Rplc 7,879 7,879
IVH1 - Fuel Gas Transmitter Upgrade 7,187 4,458 2,729 IVH2 - Fuel Gas Transmitter Upgrade 7,043 4,458 2,586 IVH3 - Fuel Gas Transmitter Upgrade 7,187 4,458 2,729 IVH4 - Fuel Gas Transmitter Upgrade 7,043 4,458 2,586 IVH5 - Fuel Gas Transmitter Upgrade 7,187 4,458 2,729 IVH6 - Fuel Gas Transmitter Upgrade 7,307 4,458 2,849
IVH_Inver Hills Total Forecast 186,321 81,746 104,575 Inver Hills 2020 Budget - 81,746 (81,746) Variance 186,321
Project Definition - TextSAP Parent (WBS Lev SAP WBS Lev 4 SAP WBS Lev 4 Desc YTD Actuals/YTD Budget Committed/Approved ProjectsREW_Red Wing A.0001562.500 A.0001562.500.001.001 REW Emergent Fund -Steam prod - -
A.0001562.500.001.013 REW0C POWERHOUSE EAST WALL WINDOWS 21,183 - 21,183 A.0001562.500.001.014 REW0C LANDFILL LEACHATE PUMPING SYSTEM 11,168 - 11,168 A.0001562.500.001.015 REW2C U2 ID FAN VFD (8,332) - (8,332) A.0001562.500.001.016 REW0 ADF LEACHATE SYSTEM 138,754 250,000 (111,247) A.0001562.500.001.017 REW0C #2 BFWP VFD 30,008 35,000 (4,992) A.0001562.500.001.018 REW1C U1 FRONT WALL INSULATION 34,746 34,746 A.0001562.500.001.019 REW0C KUBOTA RTV 19,745 20,000 (255) A.0001562.500.001.020 REW0 C9 BUBBLER PUMP 33,752 37,000 (3,248) A.0001562.500.001.021 REW0 CHEM FEED PUMP 5,046 4,500 546 A.0001562.500.001.022 REW0 #2 BFWP Motor 14,842 4,300 10,542 A.0001562.500.001.023 REW0 FP Underground Water Main 33,588 24,000 9,588 A.0001562.500.001.024 TDL Platform 27,944 19,500 8,444 A.0001562.500.001.026 REW0C ADF EAST CELL LEACHATE PUMP 9,939 7,000 2,939 A.0001562.500.001.027 LabUSA Demo & Land/Building Sale 204,331 265,000 (60,669) A.0001562.500.001.028 REW0 - Pump Room Sump Covers 73,894 45,000 28,894 A.0001562.500.001.012 REW0C #1 BFWP SEAL COOLING REDESIGN 466 466
REW0C SCRUBBER PUMP EMERG FUND - - U2 Turbine Front Standard Spring OH - - REW2 - 2102 Screwfeeder Motor - 5,650 (5,650)
- - REW_Red Wing Total Forecast 651,073.40 716,950 (65,877) Red Wing 2020 Budget 50,000 716,950 (666,950) Variance 601,073
Project Definition - TextSAP Parent (WBS Lev SAP WBS Lev 4 SAP WBS Lev 4 Desc YTD Actuals/YTD Budget Committed/Approved Projects VarianceWLM_Wilmarth A.0001565.500 A.0001565.500.001.001 WLM Emergent Fund -Steam prod - -
A.0001565.500.001.021 WLM New Shallow Well Pump 186,910 85,000 101,910 A.0001565.500.001.022 WLM2 Boiler Sootblower Control Valves 24,619 30,500 (5,881) A.0001565.500.001.023 WLM0 Install Mtnc Shop Fume Extractor 25,592 20,000 5,592 A.0001565.500.001.024 New Leachate Flowmeter CWIP 16,487 16,487 A.0001565.500.001.025 BCWP WLM Lime Pebble Vol Feeder 14,186 11,400 2,786 A.0001565.500.001.026 New U1 Slurry Density Meter 11,319 10,938 381 A.0001565.500.001.027 Unit 1 Sootblower Stop Valve Replacement 3,807 3,500 307 A.0001565.500.001.028 Unit 2 Sootblower Stop Valve Replacement 5,930 3,500 2,430 A.0001565.500.001.029 Replace Unit 2 Slurry Pump VFD 395 3,509 (3,114) A.0001565.500.001.030 WLM1 Scrubber Atomizing Lance and Nozzle Replaceme 14,274 10,171 4,103 A.0001565.500.001.031 WLM2 Scrubber Atomizing Lance and Nozzle Replaceme 21,582 10,171 11,411 A.0001565.500.001.032 WLM1 - Replace U1 Hotwell Pump Flow Meter 9,436 13,214 (3,778) A.0001565.500.001.033 WLM U1 SB Control Valve Repl 13,122 11,210 1,913 A.0001565.500.001.034 WLM U2 SB Control Valve Repl 13,122 11,210 1,913 A.0001565.500.001.035 WLM0- Replace City Water Backflow Prevention Valve T 8,475 8,100 375 A.0001565.500.001.036 WLM0 No2 Traveling Screen Repl 289,884 202,951 86,933 A.0001565.500.001.038 WLM1 Windswept Spouts 127,937 127,400 537 A.0001565.500.001.039 WLM Repl 280 Sq Ft Grating/Platform 24,144 48,000 (23,856) A.0001565.500.001.040 WLM1 HP FWH Valves 21,324 21,324 A.0001565.500.001.041 WLM2 HP FWH Valves 21,356 21,356 A.0001565.500.001.043 WLM2 Static Exciter Firing 6,145 7,500 (1,355) A.0001565.500.001.044 WLM0 New Inverter Lght System 8,987 10,000 (1,013) A.0001565.500.001.045 WLM0 New Ash Room Heater 347 18,000 (17,653) A.0001565.500.001.046 WLM2 Repl Static Exciter 17,452 4,500 12,952 A.0001565.500.001.050 Replace Unit 2 Windswept Spouts and Pant Legs 245,876 197,338 48,538
WLM1 - Replace U1 Hotwell Pump Flow Meter - - Substation Demo - 15,000 (15,000) WLM0 - New CEMS Shack HVAC - 19,000 (19,000) WLM0 - New Package Boiler Control Panel - 15,500 (15,500) WLM0 - DeltaV Room HVAC System - 14,500 (14,500) WLM0 - Slurry Building Doors - 9,100 (9,100)
- - - -
WLM_Wilmarth Total Forecast 1,132,706.25 921,211 211,495 Wilmarth 2020 Budget 100,000 921,211 (821,211) Variance 1,032,706
Summary
Attachment A, Page 1 of 5

Project Definition - TextSAP Parent (WBS LevSAP WBS Lev 4 SAP WBS Lev 4 Desc YTD Actuals/YTD Budget Committed/Approved ProjectsASK_Allen S King A.0001572.500 A.0001572.500.001.001 ASK Emergent Fund -Steam prod - -
A.0001572.500.001.013 ASK1C 2017 Lime Slaker Mechanical Seal 26,337 26,337 A.0001572.500.001.044 Front End Loader Transmission 40,643 41,000 (357) A.0001572.500.001.045 Fire Protection System Replacement 43,233 41,000 2,233 A.0001572.500.001.046 ASK1 Emergency Lighting Repl 15,516 15,516 A.0001572.500.001.047 ASK1 13FWH Limitorque Repl 20,759 20,759 A.0001572.500.001.048 King Plow Feeder VFD Replacement 12,350 23,300 (10,950) A.0001572.500.001.049 King TH5 Fan Motor Replacement 13,000 12,800 200 A.0001572.500.001.051 KING LP2 Expansion Joint Replacement 1,434 1,434 A.0001572.500.001.052 ASK 1 ID Fan Bldg Sump Pump Repl 6,091 6,091 A.0001572.500.001.053 ASK1 Feedwater O2 injection replacement 27,507 14,300 13,207 A.0001572.500.001.054 ASK1 Ammonia Injection Pump Replacement 7,343 10,300 (2,957) A.0001572.500.001.055 King Aux Cooling Water Disch Flowmeter Replacement 24,887 26,700 (1,813) A.0001572.500.001.056 ASK1 Op Area HVAC Repl 15,989 16,500 (511) A.0001572.500.001.057 ASK99 Coal Crusher Overhaul 70,090 45,457 24,633 A.0001572.500.001.058 ASK1 IKW Pump Repl 27,129 31,300 (4,171) A.0001572.500.001.059 ASK Booster Pump Basement Sump Pump Repl 31,934 38,675 (6,741) A.0001572.500.001.061 Turbine Bypass Valve Internals Replacement 101,757 148,800 (47,043) A.0001572.500.001.062 Ammertap Pump Replacement 15,641 37,200 (21,559) A.0001572.500.001.063 ASK1 Deluge Vlv Repl 15,519 21,750 (6,231) A.0001572.500.001.064 ASK1 Flame Scanner Repl 18,646 17,378 1,268
- - -
ASK_Allen S King Total Forecast 535,805.14 526,460 9,345 ASK 2020 Budget 350,287 526,460 (176,173) Variance 185,518
Project Definition - TextSAP Parent (WBS LevSAP WBS Lev 4 SAP WBS Lev 4 Desc YTD Actuals/YTD Budget Committed/Approved ProjectsBDS_Black Dog A.0001573.500 A.0001573.500.001.001 BDS Emergent Fund -Other prod 90,500 90,500
A.0001573.500.001.001 High Water Gate Fiber Replacement 10,000 44,000 (34,000) A.0001573.500.001.022 BDS0C Instl Insulation on Weld Shop (2) (2) A.0001573.500.001.028 BDS0C 31/32 Sewage Pumps 13,333 13,333 A.0001573.500.001.036 BDS0C No. 32 Cooling Water Pump 24,797 24,797 A.0001573.500.001.038 BDS2C Oil Quality Sensor Instal 442 442 A.0001573.500.001.039 BDS5C Rpl U5 HP Blow Down Valve 1326 98 98 A.0001573.500.001.041 BDS0 Replace 5/2 Bilge CV-1183 6,718 6,718 A.0001573.500.001.043 Process Network Firewall Replacement 6,533 7,000 (467) A.0001573.500.001.044 BDS0 Install South Berm Rip Rap 17,564 14,000 3,564 A.0001573.500.001.045 BDS5C Repl 5 CT Gas Flowmeter 17,574 17,574 A.0001573.500.001.046 BDS0 Repl 3-4 Bilge Mkup Lvl CV 11,360 10,000 1,360 A.0001573.500.001.047 BDS6 HMI Replacement 70,026 65,479 4,547 A.0001573.500.001.048 1-2 UPS Internals Replacement 75,737 62,838 12,899 A.0001573.500.001.049 BDS5 FW to LP Drum Bypass Valve replacement 43,551 24,500 19,051 A.0001573.500.001.050 Dilution Air Heater Replacement 12,385 14,758 (2,373) A.0001573.500.001.051 U5 Speed Card Redundancy Install 6,832 12,388 (5,556) A.0001573.500.001.052 BDS0 River Bank Stabilization 84,644 90,000 (5,356) A.0001573.500.001.053 BDS0 Bromicide Isol Vlv Repl 8,577 8,112 465 A.0001573.500.001.054 BDS2 Bently TDI Card Repl 5,000 5,050 (50)
U5 HGP with Flex - 100,000 (100,000) BDS- 2GSU Bushing Replacement - 145,738 (145,738) BDS5 - Gas Turbine PLP Controls - 195,000 (195,000)
- - - - - -
BDS_Black Dog Total Forecast 505,667 798,863 (293,196) Black Dog 2020 Budget 400,000 798,863 (398,863) Variance 105,667
Project Definition - TextSAP Parent (WBS LevSAP WBS Lev 4 SAP WBS Lev 4 Desc YTD Actuals/YTD Budget Committed/Approved Projects VarianceHBR_High Bridge A.0001575.500 A.0001575.500.001.001 HBR Emergent Fund -Other prod - -
A.0001575.500.001.034 HBC0C Process NW Server Visualization 8,751 8,751 A.0001575.500.001.036 HBC7C MS Block Valve (7MS-MOV-0004) 9,649 206,584 (196,935) A.0001575.500.001.037 HBC8C MS Block Valve (8MS-MOV-0004) 9,106 206,584 (197,478) A.0001575.500.001.040 HBC7-HRSG Modules 1&2 Penetration Seals 74,492 71,000 3,492 A.0001575.500.001.041 HBC8- HRSG Modules 2 Penetration Seals 47,394 36,250 11,144 A.0001575.500.001.042 HBC7- MS Bypass Vlv Internals with CESP 3,939 7,160 (3,221) A.0001575.500.001.043 HBC8- MS Bypass Vlv Internals with CESP 4,754 7,160 (2,406) A.0001575.500.001.044 HBC7- Purchase Valve Internals as CESP 52,138 52,138 A.0001575.500.001.046 HBC0C Install New Well 90,682 5,000 85,682 A.0001575.500.001.049 HBC7C HRSG SH and RH Drain Vlv Rplc 72,867 12,175 60,692 A.0001575.500.001.050 HBC8C HRSG Drain Vlv Rplc 65,555 202,318 (136,763) A.0001575.500.001.051 HBC8 MS-AOV-0003 DRAIN VALVE RPLC 16,396 12,175 4,221 A.0001575.500.001.053 HBC7C U7 Condensate ISO Vlv Install 20,987 55,700 (34,713) A.0001575.500.001.054 HBC U8 CONDENSATE MOV REPLC-24036 27,679 27,679 A.0001575.500.001.055 HBC U7 CONDENSATE MOV REPLC-24032 20,725 20,725 A.0001575.500.001.056 HBC0 Replc Emerg Stop Gas Vlv 46,494 49,551 (3,057) A.0001575.500.001.057 HBC 92 Hotwell Pump Motor and Cable Repl 80,446 89,020 (8,574) A.0001575.500.001.058 HBC0 Seal Water Pump Replc 6,275 7,250 (975) A.0001575.500.001.059 HBC 7 HP IP Econ Drain Vlv RPLC 32,312 38,469 (6,156) A.0001575.500.001.060 HBC 8 HP IP Econ Drain Vlv RPLC 45,611 38,470 7,142 A.0001575.500.001.061 HBC 7 Electronic Flame Detection 27,989 26,781 1,207 A.0001575.500.001.062 HBC 8 Electronic Flame Detection 25,899 26,781 (882) A.0001575.500.001.063 HBC7 BFW Dissolved 02 Analyzer 6,611 6,611 A.0001575.500.001.064 HBC0 No 1 Inst Air comp Replc 91,866 87,380 4,486
BCWP HBC Repl Stop Gas Valve - - HBC8- Unit 8 Fuel Nozzle Install - 30,000 (30,000) HBC8 - Unit 8 Fuel Nozzle Install - 30,000 (30,000)
- - - -
HBR_High Bridge Total Forecast 888,618.02 1,245,808 (357,190) High Bridge 2020 Budget 1,894,023 1,245,808 648,215 Variance (1,005,405)
Attachment A, Page 2 of 5

Project Definition - TextSAP Parent (WBS Lev SAP WBS Lev 4 SAP WBS Lev 4 Desc YTD Actuals/YTD Budget Committed/Approved Projects VarianceRIV_Riverside A.0001579.500 A.0001579.500.001.001 RIV Emergent Fund -Other prod - -
A.0001579.500.001.030 RIV10C CT Replacement 9,203 9,203 A.0001579.500.001.031 RIV0C Generator Monorail 38,436 38,436 A.0001579.500.001.032 RIV9C Fuel Valve Exchange 71,675 71,500 175 A.0001579.500.001.033 RIV0C - Rpl 72 Instr Air Comp Oil Cooler 15,256 13,500 1,756 A.0001579.500.001.034 RIV7C - 6 Circ Water Pmp Exp Joint Rpl 11,446 10,500 946 A.0001579.500.001.035 RIV7 GSU MOD/Switch Replace 21,728 115,000 (93,272) A.0001579.500.001.036 RIV U10 Aux Lube Oil Pump Motor Repl 33,624 38,120 (4,496) A.0001579.500.001.037 RIV7 Repl #7 Ball Recirc Pump 12,294 19,000 (6,706) A.0001579.500.001.038 RIV9 Repl #9 FW CV Bypass Valve 22,246 41,000 (18,754) A.0001579.500.001.039 RIV10 Rep 102 BFp Inboard Mech Seal 27,241 20,300 6,941 A.0001579.500.001.040 RIV0 Aux Boiler #2 FW Pump 16,445 15,000 1,445 A.0001579.500.001.041 Repl Unit 10 MS Stop Valve Actuator 14,519 13,500 1,019 A.0001579.500.001.042 RIV9 #7 Combustion Dynamics Xmtr Repl 12,547 17,306 (4,759) A.0001579.500.001.043 RIV10 Lub Oil Pump Repl 42,631 42,631 A.0001579.500.001.046 RIV9 CESP HP Bypass Valve Internals 105,614 5,562 100,052 A.0001579.500.001.047 RIV0 Deep Well PMP 22,334 9,857 12,477 A.0001579.500.001.048 RIV0 Repl Warming Pump 26,916 105,957 (79,041) A.0001579.500.001.049 RIV99 North Site Security Fence 32,267 25,000 7,267 A.0001579.500.001.052 RIV U10 #2 MUA Contractor 6,752 25,000 (18,248) A.0001579.500.001.055 RIV0 1200 Gallon Electric Wtr Htr 10,630 10,630
RIV99 - Riverside North Site Security Fence - 56,515 (56,515) RIV0 - 1200 Gallon Electric Water Heater - 12,417 (12,417) RIV10 - U10 Pegging Steam Digital Valve Controller - 9,867 (9,867) RIV9 - Rplc 91 Dilution Air Blower Motor Starter - 5,588 (5,588)
- - - -
RIV_Riverside Total Forecast 553,804 630,488 (76,684) Riverside 2020 Budget 1,400,000 630,488 769,512 Variance (846,196)
Project Definition - TextSAP Parent (WBS Lev SAP WBS Lev 4 SAP WBS Lev 4 Desc YTD Actuals/YTD Budget Committed/Approved Projects VarianceBLL_Blue Lake A.0001559.500 A.0001559.500.001.018 BLL8C Emg hyd anlzr E one contr pan rplc 4,298 4,298
A.0001559.500.001.019 BLL Emg U8 ignition sys upgr 12,211 12,000 211 A.0001559.500.001.020 BLL0C Emerg Fire Well Pump Rplc 65,031 58,812 6,219 A.0001559.500.001.021 BLL7 Generator Fixator Repl 282,908 225,900 57,008 A.0001559.500.001.022 BLL8 Generator Fixator Repl 263,903 225,900 38,003 A.0001559.500.001.023 BLL8 SRV Repl 7,883 7,883
- - - -
BLL_Blue Lake Total 636,235.07 522,612 113,623 Blue Lake 2020 Budget - 522,612 (522,612) Variance 636,235
Project Definition - Text SAP Parent (WBS Lev 2 SAP WBS Lev 4 SAP WBS Lev 4 Desc YTD Actuals/YTD Budget Committed/Approved Projects VarianceANS_Angus Anson A.0001571.500 A.0001571.500.001.001 ANS Emergent Fund -Other prod - -
A.0001571.500.001.028 U3 Water Injection Throttle Valve 48,889 48,169 720 A.0001571.500.001.029 ANS4C Emerg CT4 HIM Rplc 7,630 7,630 A.0001571.500.001.030 Angus Anson Sulfuric Acid Bulk Tank & Fill Line Replacem 36,414 36,765 (351) A.0001571.500.001.032 CT2 LO Heater Contactor/Fault Interrupter 8,755 4,933 3,822 A.0001571.500.001.034 ANS4C Emg U4 Natural gas vlv rplc - - A.0001571.500.001.033 HIM Controler Screen 17,394 8,890 8,504 A.0001571.500.001.031 ANS0 - Clear Well Pump Replacement 34,353 24,846 9,507
ANS4 Bard Unit Replacement CT4 PEECC - 17,965 (17,965) ANS4 - CT 4 N Gas Isolation Valve Replacement - 7,780 (7,780)
- - - -
ANS_Angus Anson Total Forecast 153,435.06 149,348 4,087 Anson 2020 Budget 200,000 149,348 50,652 Variance (46,565)
Project Definition - Text SAP Parent (WBS Lev 2 SAP WBS Lev 4 SAP WBS Lev 4 Desc YTD Actuals/YTD Budget Committed/Approved Projects VariancePVW - Emergent Fund A.001611.011 A.0001611.011.001.001 BUD PVW1-Transformer Replacements - -
A.0001611.010.001.004 PVW1 086 Generator Replacement 129,866 120,000 9,866 A.0001611.011.001.002 PVW1 - Transformer Repl 2020 - 23123 106,410 106,410 A.0001611.011.001.003 PVW0 Rpl Potl Transfmr Units VOY-20G 5,930 5,930 A.0001611.501.001.002 PVW1 - Replace T085 Blade 5,648 5,648
- PVW - Emergent Fund Total Fcst 247,853.39 120,000 127,853 PVW 2020 Budget 130,000 120,000 10,000 Variance 117,853
Project Definition - Text SAP Parent (WBS Lev 2 SAP WBS Lev 4 SAP WBS Lev 4 Desc YTD Actuals/YTD Budget Committed/Approved Projects VarianceBorders Wind - Emergen A.001610.500 A.0001610.500 Border Emergent Fund - -
A.0001610.500.001.002 BWF Blade Replacement Turbine 18 449,151 475,000 (25,849) - - - - - -
- Borders Wind - Emergent Fund 449,150.78 475,000 (25,849) Border Wind 2020 Budget 475,000 (475,000) Variance 449,151
Attachment A, Page 3 of 5

Project Definition - Text SAP Parent (WBS Lev 2 SAP WBS Lev 4 SAP WBS Lev 4 Desc YTD Actuals/YTD Budget Committed/Approved Projects VarianceCourtenay Wind - Emerg A.0001580.500. A.0001580.500. CWF0 Poseiden Sensing Project - 300,000 (300,000)
Asset Recovery - (20,000) 20,000 - - - - - -
- Borders Wind - Emergent Fund - 280,000 (280,000) Border Wind 2020 Budget 280,000 (280,000) Variance -
Project Definition - Text SAP Parent (WBS Lev 2 SAP WBS Lev 4 SAP WBS Lev 4 Desc YTD Actuals/YTD Budget Committed/Approved Projects VarianceGrand Meadows A.0001576.005 A.0001576.005.001.001 GDM0 - Gearbox replacements - -
A.0001576.005 A.0001576.005.001.002 GDM0 - Rplc T148 Gearbox (4,252) 38,000 (42,252) A.0001576.013 A.0001576.005.001.003 GDM - Gearbox Replc T131 342,204 342,204
A.0001576.005.001.004 GDM - Gearbox Replc T119 318,228 304,735 13,493 A.0001576.005.001.005 GDM0C - Replc T115 Gearbox 345,567 345,567
GDM-106 Generator Replacement - 89,760 (89,760) - - - -
GRM - Emergent Fund Total Fcst 1,001,747.82 432,495 569,253 GDM 2020 Budget 2,003,495.64 432,495 1,571,001 Variance (1,001,748)
Project Definition - Text SAP Parent (WBS Lev 2 SAP WBS Lev 4 SAP WBS Lev 4 Desc YTD Actuals/YTD Budget Committed/Approved Projects VarianceGranite City A.0001570.016 A.0001570.016.001.001 GRC0C Demo Phase 1 - decoupling 18,669 15,000 3,669
- - - - - - - - - -
Granite City - Emergent Fund Total Fcst 18,669 15,000 3,669 Granite City 2020 Budget 18,000 15,000 3,000 Variance 669
Project Definition - Text SAP Parent (WBS Lev 2 SAP WBS Lev 4 SAP WBS Lev 4 Desc YTD Actuals/YTD Budget Committed/Approved Projects VarianceHennepin Island A.0001564.500 A.0001564.500.001.005 Replace Transfer Switch for Canal Headgates 16,971 21,519 (4,548)
A.0001564.500.001.006 HNI Construct Operator Control Office 21,563 21,563 A.0001564.500.001.007 HNI0 Exterior Lighting Upgrade 759 10,000 (9,241)
- - - - - -
Hennepin Isl - Emergent Fund Total Fcst 39,292.52 31,519 7,774 Hennepin Isl 2020 Budget - 31,519 (31,519)
39,293
Project Definition - Text SAP Parent (WBS Lev 2 SAP WBS Lev 4 SAP WBS Lev 4 Desc YTD Actuals/YTD Budget Committed/Approved Projects Variance- 42,000 (42,000) - - - 20,000 (20,000)
- - -
- Corporate Tools Total Fcst - 62,000 (62,000) Tools 2020 Budget 263,340 62,000 201,340 Variance (263,340)
Project Definition - Text SAP Parent (WBS Lev 2 SAP WBS Lev 4 SAP WBS Lev 4 Desc YTD Actuals/YTD Budget Committed/Approved Projects VarianceTools A.0003000.214.001.002 C100C PMO Tool Blanket-New 130,120 130,120
A.0003000.313.001.002 SER CSC Tool Blanket 2,374 2,374 A.0003000.657.001.001 ANSC0 Misc Tools and Equi 7,733 7,733 A.0003000.658.001.001 ASK0C- Tool Blanket 27,743 27,743 A.0003000.659.001.001 BLLC0 Misc Tools and Equi 10,525 10,525 A.0003000.661.001.001 BDS0C Tool Blanket 3,722 3,722 A.0003000.667.001.001 GDMC0 Misc Tools and Equi 40,415 40,415 A.0003000.669.001.001 HBC0C Tool Blanket 45,880 45,880 A.0003000.679.001.001 RIV0C-Tool Blanket 16,123 16,123 A.0003000.680.001.001 REW0C RED WING TOOLS 42,679 42,679 A.0003000.682.001.001 SHCJC Tools & Equipment 162,258 162,258 A.0003000.683.001.001 SAFC0 small tools & equip 2,200 2,200 A.0003000.685.001.001 WLM0C Tools & Equipment B 27,263 27,263 A.0003000.698.001.001 SER0C CHM Misc Tools-MN 157,390 157,390 A.0003000.699.001.001 SER0C SMC Misc Tools Blanket 15,383 15,383 A.0003000.709.001.001 G100C PVW Eagle Take Permit-21488 (295) (295) A.0003000.738.001.001 LBW Capital Tools and Equipment 4,949 4,949 A.0003000.745.001.001 FTW Capital Tools and Equipment 632 632 A.0003000.749.001.001 CRW0-Crowned Ridge Tools-Equip 32,441 32,441
REW Screw Auger - 35,000 (35,000) Corporate - GE RVI (XLDP A6160) - 23,671 (23,671) HBC0 - Borescope Tool - 44,000 (44,000) Revised Lab Instrument - 42,000 (42,000) Rescue Retrieval System - 20,000 (20,000) WLM0 - John Deere 344J Front end Loader Bucket - 9,066 (9,066) WLM0 - Vadmire Cabinet TOOL - 35,000 (35,000) MAB 1300 Magnetic Drill - 5,335 (5,335) Clmap On Digital Electric Meter - 1,617 (1,617) Hydraulic Press - 2,200 (2,200) High Precision Transmitter Calibration Tool - 3,800 (3,800) REW0 - Grease Pump Tool - 2,963 (2,963) REW0 - Plasma Cutter Tool - 1,415 (1,415) RIV10 - 2 Hart TREX Communicators TOOL - 17,500 (17,500) SHC0 - 2 Impact Wrenches Tool - 2,308 (2,308) SHC0 Various Plant Computers - 18,400 (18,400) SHC99 - LUDECA Easy-Laser System Tool - 19,120 (19,120) SHC99 - Scissor Cart TOOL - 2,238 (2,238) SHC99- Maintenance Tool Cabinets - 11,034 (11,034) SHC99 - Rigging Tools Cabinets 1,224 (1,224) SHC99 - Rigging Tools Cabinets Tool 5,350 (5,350) SHC99 - Floor Cleaning Machine TOOL 16,978 (16,978) SHC99 - Portable HVAC units 19,200 (19,200) REW0 - Scrabber Cart Tool 4,130 (4,130) ASK Valve Actuator Tool - 18,140 (18,140) WLM0 - Aluminum Welder Tool - 7,500 (7,500) WLM0 - Panel Saw Tool - 1,654 (1,654) WLM0 - Table Saw Tool - 2,530 (2,530)
Corporate Tools Total Fcst 729,534.32 373,372 356,162 Tools 2020 Budget 263,340 373,372 (110,032) Variance 466,194
Attachment A, Page 4 of 5

Project Definition - TextSAP Parent (WBS Lev SAP WBS Lev 4 SAP WBS Lev 4 Desc YTD Actuals/YTD Budget Committed/Approved Projects VarianceSherco Unit 3 A.0001574.173 A.0001574.173.001.001 - -
A.0001574.173.001.009 SHC3C Replace Station DC Chargers-23310 30,355 30,355 A.0001574.173.001.010 SHC3C Turb Cntrl Vlv Internals-23266 303,600 303,600 A.0001574.173.001.013 SHC3 33 Air Compressor Mtr-23655 (8,402) (8,402) A.0001574.173.001.014 AQCS Instrument Air Compressor and Dryer 60,435 60,435 A.0001574.173.001.016 SHC3C 31 Air Compressor Motor Repl 2019 8,402 8,402 A.0001574.173.001.017 SCH3 Stack Mercury Room Cooling 13,737 13,737 A.0001574.173.001.018 SCH3 Landfill Haul Truck -1206 (853) 349,600 (350,453) A.0001574.173.001.019 SCH3 Landfill Haul Truck -558 7,652 349,600 (341,948) A.0001574.173.001.021 SHC3 14GB Bucket Replacement 254,599 215,787 38,812 A.0001574.173.001.023 SHC3 Repl HVAC Chiller Comp 33 CL6 HAQ 11,551 10,443 1,108 A.0001574.173.001.032 SHC3 - 32 Annulus Fan Replacement 16,311 24,461 (8,151) A.0001574.173.001.034 SHC3 - 33 Annulus Fan Replacement 16,311 24,461 (8,151) A.0001574.173.001.036 BCWP-Sherco U3 Stack Elevator SPR 30,195 30,195 A.0001574.173.001.037 SHC3 - AQCS Air Dryer Replacement 11,330 11,210 120 A.0001574.173.001.041 SHC3 Bottom Ash Jet Pump Supply Vlv 3,057 3,057 A.0001574.173.001.042 SHC3 Repl (QIR) 32 IADD 5,950 5,950
51 to 52 Chute Work - 337,480 (337,480) Replace Unit 3 Landfill garage HVAC Compressor - 4,425 (4,425) Portable HVAC units - 19,200 (19,200) SHC3 - Angled Air Wrench - Nut Runners - 3,806 (3,806) Spare SDA Motor - 36,000 (36,000) SHC3 - elevator Stack Power Cable replacement - 27,808 (27,808) SHC0 - Sales State Tax from 2013 - 357,256 (357,256) SHC Rep Lime Receiving Building Heaters - 6,490 (6,490) SHC3- Bottom Ash Jet Pump Supply Valve 4,720 (4,720) SHC3 - Replace (QIR) 32 IADD 5,900 (5,900) SHC3- ACI - 32-3 Eductor Vacuum Pressure Transmitter 3,245 (3,245) SHC3- ACI - 32-2 Eductor Vacuum Pressure Transmitter 3,245 (3,245)
- - Total Forecast 764,229 1,795,137 (1,030,908) Sherco Unit 3 2020 Budget 186,974 1,795,137 (1,608,163) Varaiance 577,255 577,255
Project Definition - TextSAP Parent (WBS Lev SAP WBS Lev 4 SAP WBS Lev 4 Desc YTD Actuals/YTD Budget Committed/Approved Projects VarianceSherco Common A.0001574.198 A.0001574.198.001.001 BUDG-SHCCC 2017 Emergent Work - -
A.0001574.198.001.007 SHCCC CESP #2 CC Rotor Assembly-23374 84,844 84,844 A.0001574.198.001.008 SHC0 Rep Admin Bldg Water Heater 13,605 13,605 A.0001574.198.001.009 SHC0 Rep Admin Buildg Chiller Compressor 30,195 30,195 A.0001574.198.001.011 SHC0 Rep Admin Bldg HVAC Compressor #2 27,218 20,800 6,418
SHC0 - Rigging Tools Cabinets Tool 5,350 (5,350) Replace River Water Valve - 65,000 (65,000) Rplc HVAC Chiller compressor, 33 CL6 HAQ - 10,443 (10,443) SHC0 - Sherco Land Special Assessment - 1,508,411 (1,508,411) SHC0 - Rplc 32 Demineralizer Degassifier Xnsfer Pump 13,400 (13,400)
- - -
- Total Forecast 155,862 1,623,404 (1,467,542) Sherco Common 2020 Budget 80,000 1,623,404 (1,543,404) Varaiance 75,862
Project Definition - TextSAP Parent (WBS Lev SAP WBS Lev 4 SAP WBS Lev 4 Desc YTD Actuals/YTD Budget Committed/Approved Projects VarianceSherco JV Common A.0001574.252 A.0001574.252.001.001 - -
A.0001574.252.001.013 SHCJC No 4 Barn Slurry Pump-23841 14,336 65,000 (50,664) A.0001574.252.001.014 SHCJC No 6 Barn Slurry Pump-23842 11,304 11,304 A.0001574.252.001.015 SHCJC Repl Hydrogen Gen Pwr Supply 2019 44,867 44,867 A.0001574.252.001.017 SHC99 Bulk Nitrogen Storage Tank & Line 43,996 43,996 A.0001574.252.001.018 #6 Well Pump 123,909 240,000 (116,091) A.0001574.252.001.020 SHC99 Yard Grader Overhaul 129 192,000 (191,871) A.0001574.252.001.021 SHC1 Coal Yard Ctrl Bldg Rf - 24471 63,254 72,000 (8,746) A.0001574.252.001.022 SHC99 Dust Suppression Chem Feed System 459,849 156,000 303,849 A.0001574.252.001.023 SHC0 - Fugitive Dust Fence 7,979 9,320 (1,341) A.0001574.252.001.024 SHC99 - Wheel Lock HPU Project 217,937 160,000 57,937 A.0001574.252.001.025 SHC99 Replace Hydrogen Storge Tank with Tube Trailer 87,771 60,000 27,771 A.0001574.252.001.027 BCWP SHC99 RCD DC Transport Blower 12,138 20,000 (7,862)
Rplc Warehouse #1 high bay lighting with LED - 11,200 (11,200) ERC Slurry Pump - 52,000 (52,000)
A.0001574.252.001.016 ERC Air Cannon - 72,000 (72,000) SHC99 - Fugitive Dust Fence - 9,320 (9,320) SHC99- 2 Nut Runners - 4,629 (4,629)
- Total Forecast 1,087,470 1,123,469 (35,999) Sherco JV Common 2020 Budget 64,000 1,123,469 (1,059,469) Varaiance 1,023,470
Project Definition - TextSAP Parent (WBS Lev SAP WBS Lev 4 SAP WBS Lev 4 Desc YTD Actuals/YTD Budget Committed/Approved Projects VarianceSherco U2 A.0001574.269 A.0001574.269.001.001 BUDG SHC2C PC Emergent Projects - -
A.0001574.269.001.001 BUDG SHC2C PC Emergent Projects - - A.0001574.269.001.007 SHC2 Mod 211 Upper Xfmr Cab Repl 30,143 40,250 (10,107) A.0001574.269.001.008 SHC2 - Replace 13 Fire Hydrant 40,110 85,000 (44,890) A.0001574.269.001.009 SHC2 Repl 204 Mod Ctrl Vlv 5,843 10,266 (4,423) A.0001574.269.001.010 SCH2 Repl 23 Condenser Exhauster 69,780 65,000 4,780
- - Total Forecast 145,876 200,516 (54,640) Sherco U2 2020 Budget 80,000 200,516 (120,516) Varaiance 65,876
Project Definition - TextSAP Parent (WBS Lev SAP WBS Lev 4 SAP WBS Lev 4 Desc YTD Actuals/YTD Budget Committed/Approved Projects VarianceSherco Unit 1 A.0001574.268 A.0001574.268.001.001 BUD-SHC1C Emergent Projects - -
A.0001574.268.001.003 SHC1C Mod 111 Transformer Repl - xxxxx - - A.0001574.268.001.005 SHERCO U1 11MSA TRANSFORMER REPLACEMENT 5,555 - 5,555 A.0001574.268.001.006 SHC1C Test WESP Power Supply 13,439 13,439 A.0001574.268.001.007 SHC1 Repl Valve and Acturator RW CV 1005 86,812 86,812 A.0001574.268.001.008 SHC1 12Closd Cooling Water Pmp Cable Rep 30,699 30,699 A.0001574.268.001.009 BCWP SHC1 Scrubber SUS Cmptr Rm HVAC - 24489 76,908 70,000 6,908
U1 Scrubber Power Supply Replacement - 54,000 (54,000) BCWP SHC1 110 Module's Reheater Bundle - 237,800 (237,800) BCWP Repl Valve and Actuator RWCV1005 - 65,000 (65,000) SHC1- Replace Scrubber Module 106 make-up valve - 10,000 (10,000)
Total Forecast 213,413.06 436,800 (223,387) Sherco Unit 1 2020 Budget 80,000 436,800 (356,800) Varaiance 133,413
Approved Offsets YTD Actuals/YTD Budget Committed/Approved Projects VarianceSHC99-Barn 54 Conv Chute 641,600 641,600 SHC99-U99 Coal Barn Dust Suppression System 89,000 89,000 SHC3-U3 Tur Gland Steam Isolation Valve 82,600 82,600 Lab Instrument 71,000 71,000
- - -
Total Offsets 884,200 - 884,200 Total 2020 Budget 884,200 - 884,200
Attachment A, Page 5 of 5
Attachment B
Distribution Operations
Capital Project Substitution and Change Process The Investment Planning organization within Distribution Operations analyzes system performance, load patterns and anticipated new customer growth projections to identify projects to be funded during the “budget” year. These projects are scored through a risk model and funded based on the authorized budget levels established through the Corporate Budgeting process. After the capital expenditures budget is finalized, the approved project list becomes the basis for the release of projects during the calendar year. This process must be somewhat flexible to allow for needed additions and deletions within a given year. For example, should an emergency occur during the year, priorities may change and result in an adjustment to the list of projects. Projects that were previously approved may be delayed to accommodate the emergent work. Through our budget deployment process we are therefore able to meet identified needs and requirements, adjust to changing circumstances and prudently ensure the long-term health of the distribution system. For example, our capital expenses for storm restoration are dependent on the magnitude and frequency of severe weather in a particular year. The unpredictable nature of severe weather makes precise budgeting difficult as the weather each year is different. Other examples of emergent work include customer driven or mandated projects that are identified after budget create. Exhibit 1 is a list of projects that were budgeted and not executed in 2020, and those that were not funded, but spent in 2020.

Distribution Operations Capital - NSPM - MN Jurisdiction
WBS L2 Description 2020 Actuals 2020 BudgetA.0010019.009 MN - Line Asset Health WCF Blanket - 11,432,000 A.0010011.004 MN - Mandate WCF Blanket - 5,000,000 A.0010133.075 SUB C Reinforce Green Isle TR1 - 1,800,000 A.0010077.022 T Rebuild West St Cloud to Millwood - 1,500,000 A.0010151.001 Rebuild Yellow Medicine YLM211 & YLM212 - 1,450,000 A.0010077.012 Rebuild Clara City CLC221 - 800,000 A.0010093.087 LINE Install Hiawatha West HWW Feeder - 700,000 A.0010133.072 SUB Install Hiawatha West HWW Feeder - 500,000 A.0010167.002 VAULT Relocation Hennepin Ave Rd Project - 410,000 A.0010093.024 LINE Reinforce Fair Park FAP TR1 & Fdr - 400,000 A.0010094.002 Extend Nordic NOR033 - 400,000 A.0010093.038 Reinforce Osseo OSS062 - 300,000 A.0010133.007 SUB Reinforce Westgate WSG Feeders - 300,000
- 24,992,000
WBS L2 Description 2020 Actuals 2020 BudgetA.0005585.001 MINNESOTA MAJOR STORM RECOVERY 11,418,286 - A.0010077.032 Rebuild Downtown St Paul Manholes 2,376,300 - A.0005560.002 VAR Network Devices 872,100 - A.0010077.041 Rebuild WRR052 Feeder and Ductline 841,945 - A.0010069.019 Relocate Belle Plaine BEL061 Feeder 698,651 - A.0010148.001 LAND Install Raptor RPO Sub 644,961 - A.0010069.021 Relocate Poles Bailey Road 629,306 - A.0010093.099 VAULT Install Vault at 34 S 3rd 507,726 - A.0010143.007 COMP Relocation MPLS SWLRT Road Project 483,358 - A.0010077.035 Convert OH-UG Pine View Lane 481,037 - A.0010071.003 8th Street Bridge Relocation 449,544 - A.0010061.005 Extend UG Service Gateway Develop 449,543 - A.0010069.029 Relocate Hassan HSN321 Main St 439,612 - A.0005587.001 SOUTH DAKOTA MAJOR STORM RECOVERY 369,338 - A.0010069.007 SCL 33rd South Improvements 363,166 - A.0010093.092 Install 406 S 6th St Vault 352,396 - A.0010071.005 Relocate Minnehaha MHA063 Feeder 351,702 - A.0010077.043 Convert Elliot Park ELP082 320,926 - A.0010069.023 Relocate Poles Hwy 212 314,598 - A.0010061.007 Extend Elm Creek 1/0 Boston Scientific 300,405 -
Projects less than $300,000 3,432,803 - 26,097,703 -
Budgeted Projects with No Actuals
Projects with No Budgets
Attachment B, Page 1 of 1

Attachment C
Transmission
Capital Project Substitution and Change Process Periodically, it may be necessary to reallocate and reforecast capital expenditures from the original budget approved through the Corporate Budgeting process. On a monthly basis, existing project actual to budget variances are reviewed and documented. Project forecasts are updated monthly reflecting the best known information at that time. Forecast variances create room for new emerging projects that were not anticipated during the budget. Projects that were not originally identified in the budget are considered to be “Out of Cycle Projects” and are presented at the monthly Transmission Base Capital Review meeting to determine whether funding should be approved. All projects that are greater than $10 million are also brought to the Investment Review Council and the Financial Council for authorization to proceed. The Interconnection Agreement (IA) Tariff Fund was created to help initial funding of all interconnection projects that often require short approval windows to meet customer needs. This fund is budgeted for this program of work and is based on historical averages and known demand of interconnection projects requests. Please see the attached exhibit for overview of the emergent Transmission projects approved for funding during 2020.

Transmission Out of Cycle Projects Attachmnent C, Page 1 of 4
Month Opco StatusDate
ProjectSubmitted
ProjectGrouping Project Name IA Funded
CustomerFunded ISD TCR Eligibility
2019 New funding
2020 New Funding
2021 New Funding
2022 New Funding
Total New Funding General Comments
January NSPM Approve 1/9/2019 GRE Brooks Lake Interconnect GRE Brooks Lake Interconnect - 0833 Yes No 10/30/2019 No 475,000 475000
The project for XE will consist of transmission line new deadend structures for an in-and-out tap connection. No work at the substation. GRE will accommodate metering needs (instantaneous and periodic). XE will review any change in protection settings required on Big Swan and Crow Rivers Subs.
January NSPM Approve 1/14/2019 GRE - Lebanon Hills Interco Install 115 kV structure on line 0836 - Pilot Knob to Inver Hills Yes No 12/30/2019 No 850,000 0 850000
Xcel Energy scope includes installing a 115 kV structure, re-energizing a currently retired line, selling a portion of 69 kV retired line to GRE and relay setting at four substation, Pilot Knob, Inver Hills, Farmington and Lebanon Hills.
January NSPM Approve 1/15/2019 F115 MMPA Dean Lake Upgrade F115/A698 MMPA Dean Lake Meter Upgrade YES Yes 12/30/2019 No 301,000 301000 MMPA has signed an agreement for Xcel Energyto upgade the behind the meter and relays at Dean lake substation.
January NSPM Approve 1/9/2018 NSPM Land Sales Line 0818 Land Sale No No 12/15/2019 No 10,000 10000
This property is a strip of land acquired in the 1920’s by NSP for the construction of Transmission Line 0818 in the City of South. St. Paul, Dakota County, MN. This portion of Line 0818 is located within a residential neighborhood and over the years Xcel Energy has issued permits to adjoining property owners for various encroachments and has received requests from adjoining property owners to purchase the property.
January Total 1,636,000 1636000
February NSPMApproved for $100K 11/14/2018 Relay Replacement SPIRe - Pilot Project NO No 12/31/2019 No 100,000 100000
The 2019 batch of relays will include transformers, bus or breaker protection equipment so the exucution brings additional experience and knowledgwe to the team.
February Total 100,000 100,000
March NSPM Approved 3/11/2019 St. Cloud TR2 Replacement St. Cloud Feeder Load Monitoring Installation No No 4/15/2020 No 100,000 10000 110,000
Limited existing analog point capability in Conitel line. Need new Orion LX RTU for feeder load monitoring installation that will occur simultaneusly with transformer replacement.
March NSPM Approved 3/11/2019 NSPM - Major Line Refurbishment NSM0953 Nobles to Split Rock, Replace OPGW No No 9/30/2019 No 75,000 75,000
The OPGW between Nobles and Split Rock has been damaged by lightning in several locations and only 14 of the fibers are still working. This request is to begin engineering the replacement of the damaged OPGW on this circuit.
March NSPMApproved for $500K 3/13/2019 J512 FEN-NOB Wind Interc on Ln5537 J512 Wind Interc - SUB YES Self Funding 6/15/2020 No 500,000 8100000 8,600,000
This request is for a new 150MW wind interconnect network facilities will be self-funded by Xcel. We are in the process of signing an agreement with the developer/customer for an aggressive summer of 2020 in-service date.
March NSPM
Approved see attached Chris A e-mail
3/13/2019 Railroads permit payment Railroad permits payments No No 7/13/1905 NO 100,000 100,000 100000 300,000
This request is to capitalize railroad permit payments by making a one-time, multi-year payment instead of annual O&M payments. Capitalizing one-time permit payments is allowed per CAA ruling.
March Total 775,000 8,210,000 100,000 9,085,000
May NSPM Approved 5/3/2019 Transmission Fleet Fleet Request - Fat Truck No No 12/15/2019 No -130,000 -130,000
TCLO has expressed the need to move people through areas where access would historically require a helicopter or frozen conditions. Other vehicles comparable existing fleet vehicles are not capable of transporting materials or as many people.

Transmission Out of Cycle Projects Attachmnent C, Page 2 of 4
Month Opco StatusDate
ProjectSubmitted
ProjectGrouping Project Name IA Funded
CustomerFunded ISD TCR Eligibility
2019 New funding
2020 New Funding
2021 New Funding
2022 New Funding
Total New Funding General Comments
May NSPM Approved 5/9/2019 CapX2020 Brookings MN Brookings County - Lyon County OPGW Replacement No No 7/31/2020 No 156,000 156,000
This out of cycle request is to cover Xcel's share of capital repair work on the CapX Brookings County - Hampton 345kV line. GRE constructed the line and is responsible for maintenance. Xcel's ownership share of the line is 69%.
When Xcel commissioned the new Hawk's Nest Lake substation in 2017, 3 miles of failed fiber was identified. Further investigation by GRE identified a total of 35 failed fibers over a 3 mile span, and the CapX E&O Committee approved replacement of 3 miles of OPGW. The work is complete, and GRE will submit an invoice to Xcel in accordance with our ownership share in June, 2019. The estimated "shared" cost of the work was $200,000, and the final "shared" cost is $225,000. Xcel's share of the final cost is $156,000.
May NSPM Approved 3/13/2019 Not yet created: AirGas interconnect (Jamaica)AirGas liquified air products retail customer interconnect No A small increme 9/15/2020 No 250,000 2,750,000 3,000,000
Tran line: $ 1.5 millionTran sub: $ 1.5 millionDist sub: $ 2.7 millionTransmission 2019 costs could be as high as $500,000 if grading is conducted in 2019.
May NSPM Approved 4/10/2019 Goose Lake East Fence Replacement - May NSPM Approved 4/22/2019 Mankato Energy Center, Reverse Power Relay Install -
May NSPM Approved 4/11/2019 Souris UVLS Removal -
4/18/19 - scope of project was combined with WBS A.0000395.078.001.002 Replace Relaying to MAL as work will occur at SOR as part of relay work. Funding is no longer needed for the UVLS Retirement
May Total 276,000 2,750,000 0 3,026,000
June NSPMApproved 5-22-19 per Email
5/22/2019 Project Pine 0827 SCL-SHC Relocation No No 6/15/2020 No 1,000,000 700,000 1,700,000See email approval from Tony Jandro 5/22/19; funds currently anticipated in 2020 pending 5-yr Budget Approval
June NSPM Approved 6/11/2019 Faribault Energy Park 0832 - Add 2 One-Way Switches Yes No 8/1/2020 No 30,000 320,000 350,000
This request is to install 2 one-way switches adjacent to the Faribault Energy Park Substation to accommodate an interconnection request by GRE. The interconnection will allow GRE to serve a new industrial customer in the area.
The point of interconnection be located just south of the Faribault Energy Park Substation. It will connect Line 0832 to a new GRE tap line. One switch will be installed on GRE's tap line and the other will be installed approximately a half span length south of the point of interconnection.
June NSPM
Approved for $192,00. Final quote increased to $204,000
6/6/2019 Tool Blanket MN Subs Meter Kits 13 No No 7/15/2019 No 192,000 192,000
The Ground Grid Integrity meters will be a tool to identify & create an EPZ zone within the substation, and also identify that your personal protection grounding placement is sufficient. Transmission’s Substation Grounding Manual will require steps to be taken to achieve this and the tool referenced above achieves that requirement.
June NSPM Approv ed 6/10/2019 Medford 4E257 Circuit Switcher No No 9/1/2019 65,000 65,000
The Cap bank circuit switcher 4E257 at Medford is currently out of service. Repairing the unit would require removing and sending to Southern States for service. We would then need to re-install the unit.
June NSPM Approved 612/2019 Synchrophasor Upgrades Synchrophasors Upgrades - Substation NO NO 12/15/2019 NO 40,000 - 40,000Without the required equipment install on the exisiting synchrophasor at Riverside, North Star and Buffalo Ridge the conversion will not work.
June Total 1,327,000 1,020,000 0 2,347,000
July NSPM
Aproved, pending addlt Information
7/10/2019 Revenue Meter Upgrade Lakefield Revenue Meter install No no 12/15/2019 no -
Contacted by todd sarkinen in the control center to replace 5 revenue meters at lakefield Junction because the old meters are obsolete and need replacing. New meters will be able to be electrical read by the control center
July NSPM Approved 7/10/2019 East River Wellington IA East River Wellington IA Yes no 9/1/2020 no 1280000 - 1280000East River contacted business relations for us to install an interconnection between east river and wellington for xcel energy to build and own the interconnection line
July NSPM
Approved, need Dist to fund their dollars
7/10/2019 SFE SFE No no no 833000 1,666,000 2499000Funding for Alan Lundberg based on New Capitalization Policy. Includes Trans and Dist for both NSPM and NSPW
July Total 2,113,000 1,666,000 0 3,779,000
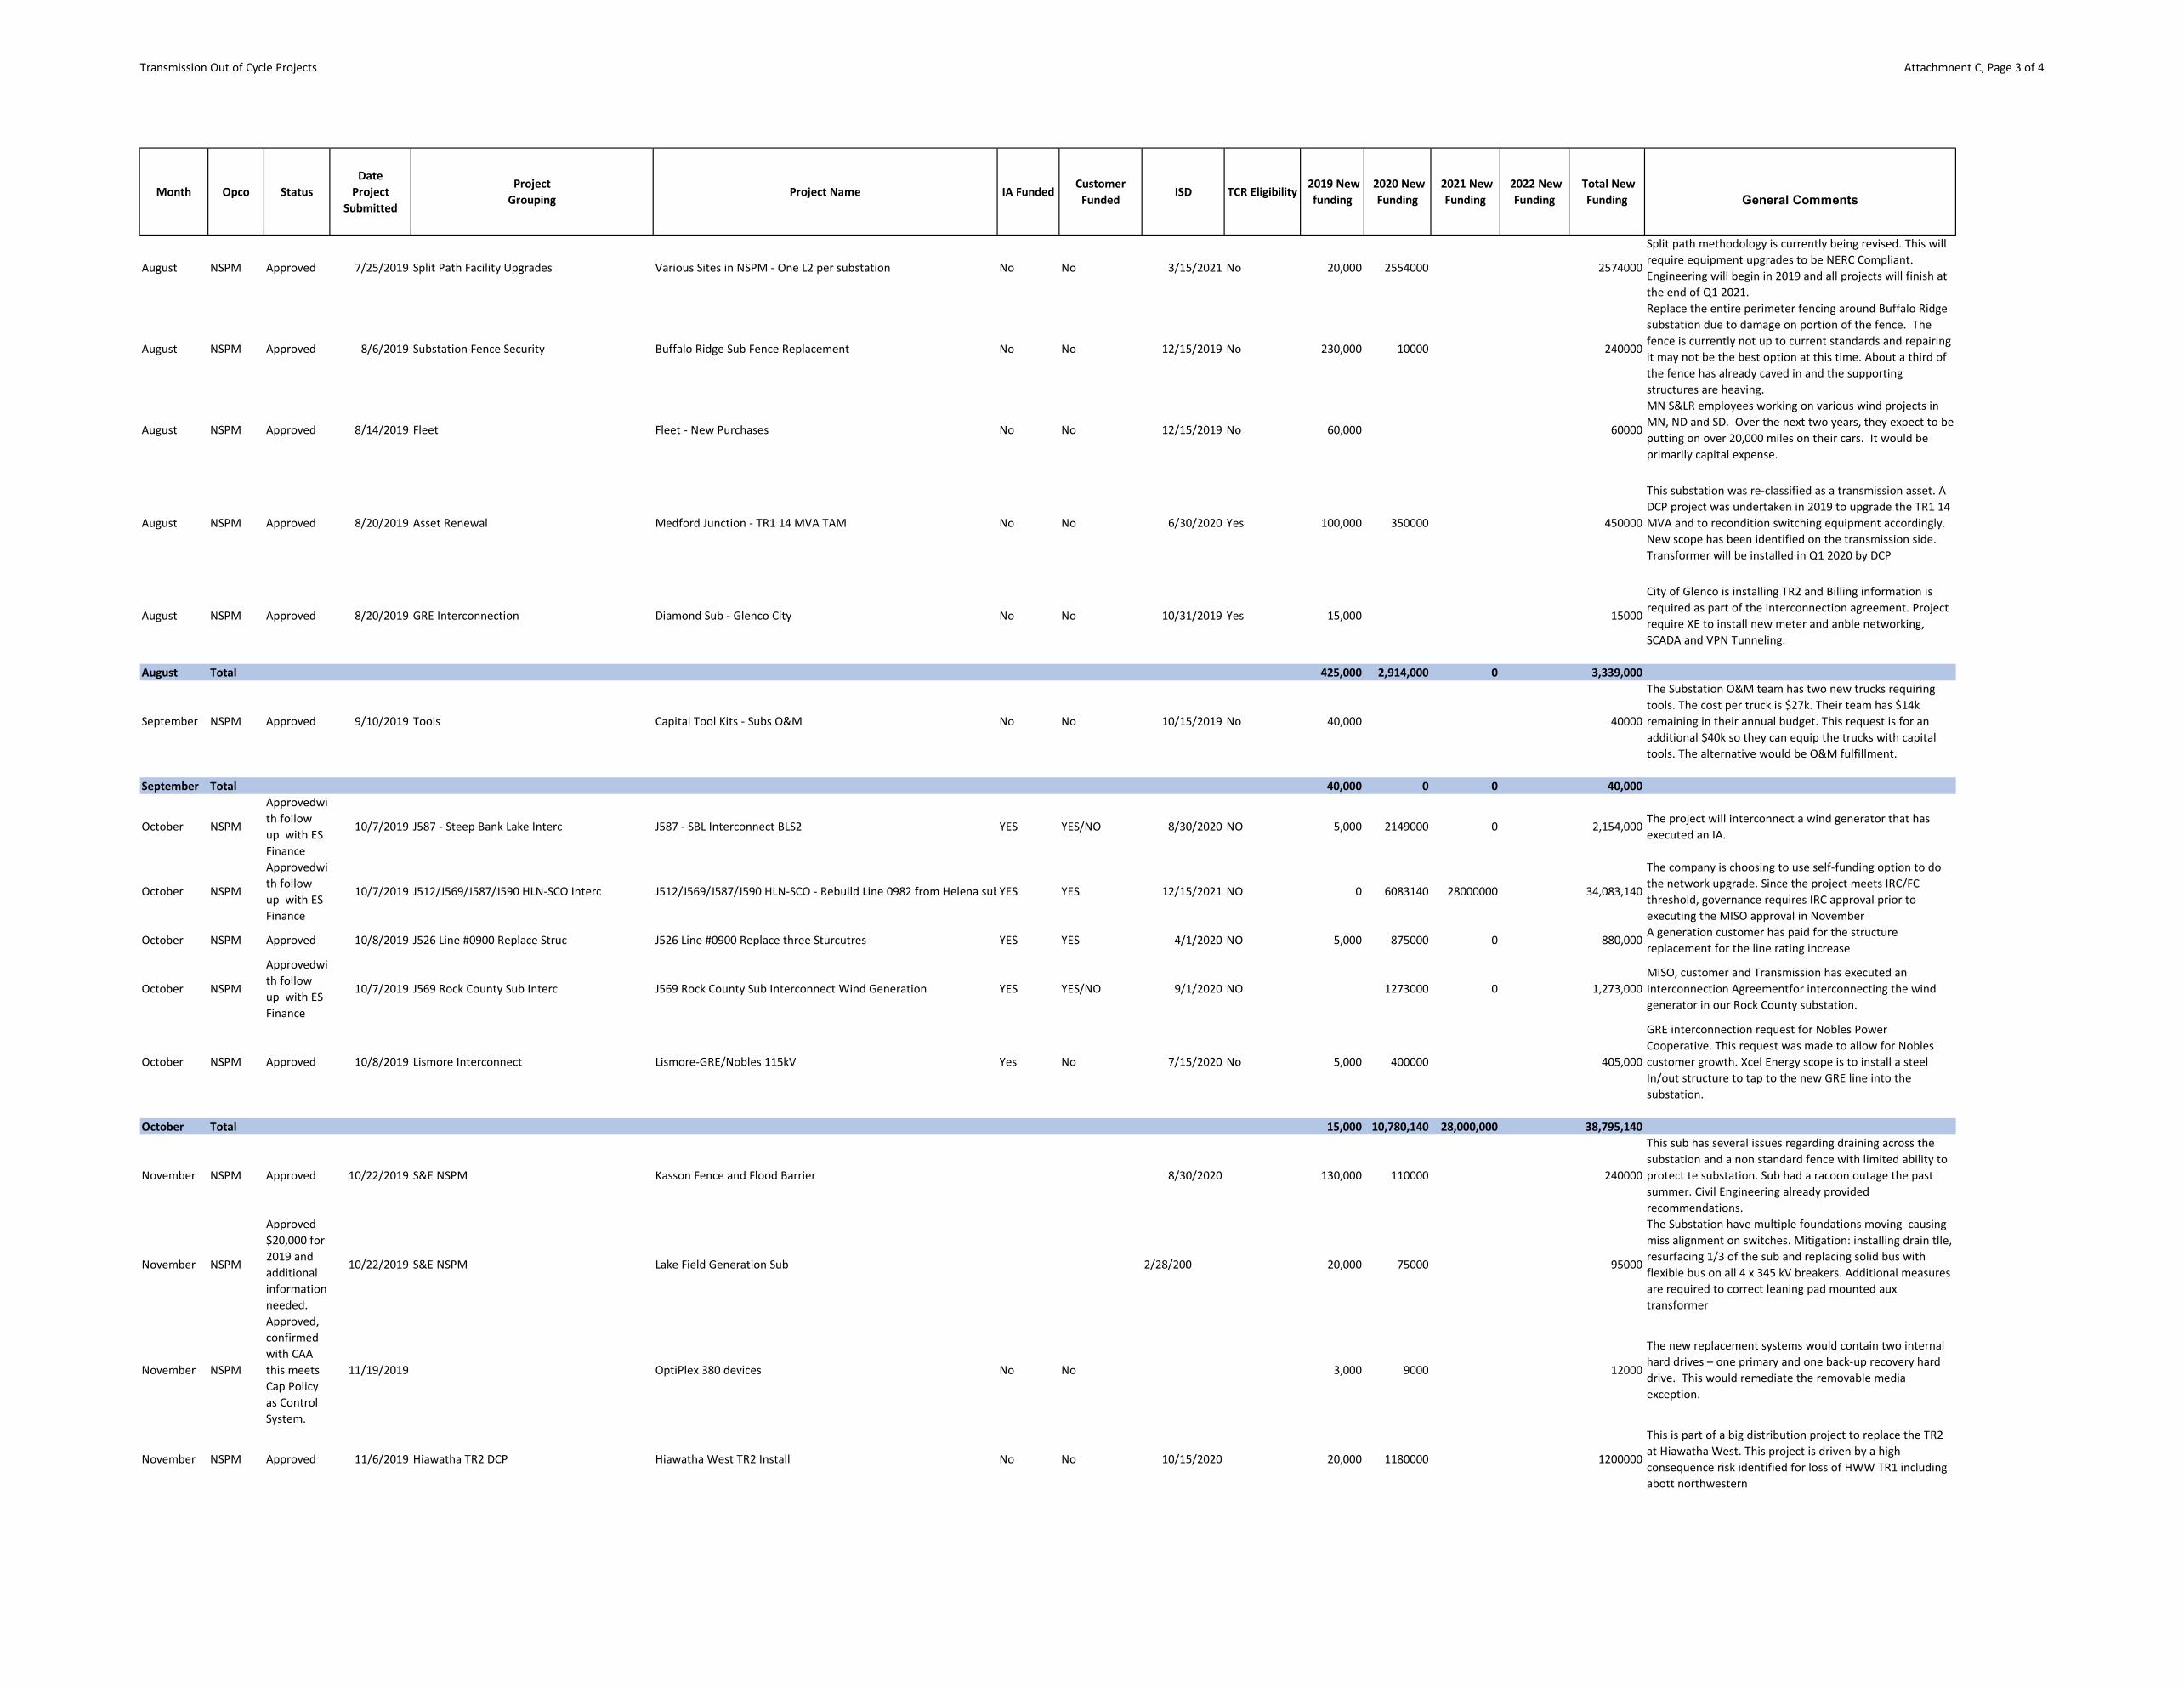
Transmission Out of Cycle Projects Attachmnent C, Page 3 of 4
Month Opco StatusDate
ProjectSubmitted
ProjectGrouping Project Name IA Funded
CustomerFunded ISD TCR Eligibility
2019 New funding
2020 New Funding
2021 New Funding
2022 New Funding
Total New Funding General Comments
August NSPM Approved 7/25/2019 Split Path Facility Upgrades Various Sites in NSPM - One L2 per substation No No 3/15/2021 No 20,000 2554000 2574000
Split path methodology is currently being revised. This will require equipment upgrades to be NERC Compliant. Engineering will begin in 2019 and all projects will finish at the end of Q1 2021.
August NSPM Approved 8/6/2019 Substation Fence Security Buffalo Ridge Sub Fence Replacement No No 12/15/2019 No 230,000 10000 240000
Replace the entire perimeter fencing around Buffalo Ridge substation due to damage on portion of the fence. The fence is currently not up to current standards and repairing it may not be the best option at this time. About a third of the fence has already caved in and the supporting structures are heaving.
August NSPM Approved 8/14/2019 Fleet Fleet - New Purchases No No 12/15/2019 No 60,000 60000
MN S&LR employees working on various wind projects in MN, ND and SD. Over the next two years, they expect to be putting on over 20,000 miles on their cars. It would be primarily capital expense.
August NSPM Approved 8/20/2019 Asset Renewal Medford Junction - TR1 14 MVA TAM No No 6/30/2020 Yes 100,000 350000 450000
This substation was re-classified as a transmission asset. A DCP project was undertaken in 2019 to upgrade the TR1 14 MVA and to recondition switching equipment accordingly. New scope has been identified on the transmission side. Transformer will be installed in Q1 2020 by DCP
August NSPM Approved 8/20/2019 GRE Interconnection Diamond Sub - Glenco City No No 10/31/2019 Yes 15,000 15000
City of Glenco is installing TR2 and Billing information is required as part of the interconnection agreement. Project require XE to install new meter and anble networking, SCADA and VPN Tunneling.
August Total 425,000 2,914,000 0 3,339,000
September NSPM Approved 9/10/2019 Tools Capital Tool Kits - Subs O&M No No 10/15/2019 No 40,000 40000
The Substation O&M team has two new trucks requiring tools. The cost per truck is $27k. Their team has $14k remaining in their annual budget. This request is for an additional $40k so they can equip the trucks with capital tools. The alternative would be O&M fulfillment.
September Total 40,000 0 0 40,000
October NSPM
Approvedwith follow up with ES Finance
10/7/2019 J587 - Steep Bank Lake Interc J587 - SBL Interconnect BLS2 YES YES/NO 8/30/2020 NO 5,000 2149000 0 2,154,000 The project will interconnect a wind generator that has executed an IA.
October NSPM
Approvedwith follow up with ES Finance
10/7/2019 J512/J569/J587/J590 HLN-SCO Interc J512/J569/J587/J590 HLN-SCO - Rebuild Line 0982 from Helena sub YES YES 12/15/2021 NO 0 6083140 28000000 34,083,140
The company is choosing to use self-funding option to do the network upgrade. Since the project meets IRC/FC threshold, governance requires IRC approval prior to executing the MISO approval in November
October NSPM Approved 10/8/2019 J526 Line #0900 Replace Struc J526 Line #0900 Replace three Sturcutres YES YES 4/1/2020 NO 5,000 875000 0 880,000 A generation customer has paid for the structure replacement for the line rating increase
October NSPM
Approvedwith follow up with ES Finance
10/7/2019 J569 Rock County Sub Interc J569 Rock County Sub Interconnect Wind Generation YES YES/NO 9/1/2020 NO 1273000 0 1,273,000MISO, customer and Transmission has executed an Interconnection Agreementfor interconnecting the wind generator in our Rock County substation.
October NSPM Approved 10/8/2019 Lismore Interconnect Lismore-GRE/Nobles 115kV Yes No 7/15/2020 No 5,000 400000 405,000
GRE interconnection request for Nobles Power Cooperative. This request was made to allow for Nobles customer growth. Xcel Energy scope is to install a steel In/out structure to tap to the new GRE line into the substation.
October Total 15,000 10,780,140 28,000,000 38,795,140
November NSPM Approved 10/22/2019 S&E NSPM Kasson Fence and Flood Barrier 8/30/2020 130,000 110000 240000
This sub has several issues regarding draining across the substation and a non standard fence with limited ability to protect te substation. Sub had a racoon outage the past summer. Civil Engineering already provided recommendations.
November NSPM
Approved $20,000 for 2019 and additional information needed.
10/22/2019 S&E NSPM Lake Field Generation Sub 2/28/200 20,000 75000 95000
The Substation have multiple foundations moving causing miss alignment on switches. Mitigation: installing drain tlle, resurfacing 1/3 of the sub and replacing solid bus with flexible bus on all 4 x 345 kV breakers. Additional measures are required to correct leaning pad mounted aux transformer
November NSPM
Approved, confirmed with CAA this meets Cap Policy as Control System.
11/19/2019 OptiPlex 380 devices No No 3,000 9000 12000
The new replacement systems would contain two internal hard drives – one primary and one back-up recovery hard drive. This would remediate the removable media exception.
November NSPM Approved 11/6/2019 Hiawatha TR2 DCP Hiawatha West TR2 Install No No 10/15/2020 20,000 1180000 1200000
This is part of a big distribution project to replace the TR2 at Hiawatha West. This project is driven by a high consequence risk identified for loss of HWW TR1 including abott northwestern

Transmission Out of Cycle Projects Attachmnent C, Page 4 of 4
Month Opco StatusDate
ProjectSubmitted
ProjectGrouping Project Name IA Funded
CustomerFunded ISD TCR Eligibility
2019 New funding
2020 New Funding
2021 New Funding
2022 New Funding
Total New Funding General Comments
November NSPMApproved Via e-mail 11-5-2019
11/19/2019 0953 Galloping 0953 Structure Inset Yes No 9/1/2020 160000 160000
NSPM and ITCM’s Transmission Line Engineeringing and Business Relations teams are engaged in a solution to mitigate galloping phases on a DC 345kV/161kV line (line 0953) near Lakefield, MN. The teams have agreed that installing a single structure to support one phase away from the existing structure is the best plan.
Novemeber Total 173,000 1,534,000 0 1,707,000
December Total 0 0 0 0
2019 Total 6,880,000 28,874,140 28,100,000 0 63,854,140

Attachment D
Nuclear
Capital Project Substitution and Change Process Periodically, it may be necessary to reallocate and reforecast capital expenditures from the original budget approved through the Corporate Budgeting process. Initiating causes that may require reallocation and reforecast are likely to include: emergent work (high priority equipment reliability/failures), new projects (emerging regulations), budget reductions, catastrophic equipment failures, project overruns or under-runs, project cancellations or projects that support long-term O&M reductions. On a monthly basis, a Fleet Project Review Group (PRG) meets to review Long Range Plan Committee recommended projects/changes that may impact the previous prioritization and spend, and approve where appropriate. Core team members will include the Director of Projects, Plant Managers, Director of Innovation, Maintain Equipment Reliability General Manager of Nuclear Fleet Operations and Maintain Resources General Manager of Nuclear Fleet Operations. If the amount reprioritized is greater than $3M, it must be approved by the Executive Project Review Group (EPRG) for approval. The EPRG consists of the Chief Nuclear Officer, his direct reports, Director of Nuclear Supply Chain and Director of Projects. Exhibit 1 includes a summary of new and repurposed capital project funds for 2020.

Nuclear Generation 2020 Spend Details
Company Code (Allocated) WBS Level 2 - Key WBS Level 2 Major Category Cost Ownership Level 3 Spend - Actuals YTD Spend - Budget YTD Spend - YTD VarianceNorthern States Power MN A.0000016.002 MT 2026 ISFSI Expansion DRY CASK STORAGE VP Eng. & Projects 56,449 56,449 Northern States Power MN A.0000019.001 PI-9 TN-40 Casks(39-47) DRY CASK STORAGE VP Eng. & Projects 6,067,814 9,009,581 (2,941,767) Northern States Power MN A.0000042.007 PI ISFSI Expansion DRY CASK STORAGE VP Eng. & Projects 1,193,799 2,941,454 (1,747,655) Northern States Power MN A.0000045.001 PI TN-40 Casks (48-64) DRY CASK STORAGE VP Eng. & Projects 9,286,424 10,344,026 (1,057,602)
DRY CASK STORAGE Total 16,604,486 22,295,061 (5,690,575) Northern States Power MN A.0000024.012 PI ETAP Software Upgrade FACILITIES & OTHER VP Eng. & Projects 1,164,609 1,500,000 (335,391) Northern States Power MN A.0000027.006 PI Facilities Infrastruct Upgr FACILITIES & OTHER VP Eng. & Projects 100,000 (100,000) Northern States Power MN A.0000027.020 PI Warehouse 1 Heating FACILITIES & OTHER VP Eng. & Projects 83,426 83,426 Northern States Power MN A.0000027.021 PI Paint Storage Shed Heating FACILITIES & OTHER VP Eng. & Projects 44,189 44,189 Northern States Power MN A.0000027.022 PI Paint Storage Room Heating FACILITIES & OTHER VP Eng. & Projects 34,127 34,127 Northern States Power MN A.0000027.023 PI Paint Room Heating FACILITIES & OTHER VP Eng. & Projects 32,567 32,567 Northern States Power MN A.0000027.024 PI Carpenter Shop Heating FACILITIES & OTHER VP Eng. & Projects 47,303 47,303 Northern States Power MN A.0000027.025 PI Steel Fabrication Shop Heating FACILITIES & OTHER VP Eng. & Projects 27,308 27,308 Northern States Power MN A.0000027.027 PI Green Warehouse Heating FACILITIES & OTHER VP Eng. & Projects 78,697 78,697 Northern States Power MN A.0000033.019 MNGP2019 Facilities Infrastru FACILITIES & OTHER VP Eng. & Projects 8,817 8,817 Northern States Power MN A.0000033.021 MT Rplc PAB Stairs & Ramp FACILITIES & OTHER VP Eng. & Projects 1,256,190 409,023 847,167 Northern States Power MN A.0000033.022 MT SAB to SAF Water FACILITIES & OTHER VP Eng. & Projects 8,732 1,000 7,732 Northern States Power MN A.0000033.023 MNGP 2020 Facilities Infrastru FACILITIES & OTHER VP Eng. & Projects 144,786 420,000 (275,214) Northern States Power MN A.0000033.025 MT PA Asphalt Rplc FACILITIES & OTHER VP Eng. & Projects 457,855 457,855 Northern States Power MN A.0000033.032 MTC Roof Replacement FACILITIES & OTHER VP Eng. & Projects 115,255 115,255 Northern States Power MN A.0000033.034 MT Sally Port Drainage Repairs FACILITIES & OTHER VP Eng. & Projects 30 30 Northern States Power MN A.0000033.036 MT Jib Crane & Monorail FACILITIES & OTHER VP Eng. & Projects 411,422 411,422 Northern States Power MN A.0000033.038 MT 2021 Turbine Deck Outage Power FACILITIES & OTHER VP Eng. & Projects 49,265 49,265 Northern States Power MN A.0000033.043 MT 2020 Scaffold Manlift Init FACILITIES & OTHER VP Eng. & Projects 226,239 226,239 Northern States Power MN A.0000033.044 MT Intake Structure Roof Rplc FACILITIES & OTHER VP Eng. & Projects 77,302 77,302 Northern States Power MN A.0000069.001 PI Misc Office Furniture FACILITIES & OTHER VP Eng. & Projects 122,638 122,638 Northern States Power MN A.0000070.001 MT Misc Office Furniture FACILITIES & OTHER VP Eng. & Projects 76,665 76,665
FACILITIES & OTHER Total 4,467,419 2,430,023 2,037,396 Northern States Power MN A.0000017.223 MT Equipment Sensors IMPROVEMENTS VP Eng. & Projects 380,132 450,000 (69,868) Northern States Power MN A.0000017.224 MT Automation/Innovation IMPROVEMENTS VP Eng. & Projects 362,513 (362,513) Northern States Power MN A.0000024.014 PI Robotics IMPROVEMENTS VP Eng. & Projects 75,000 (75,000) Northern States Power MN A.0000024.015 PI 3D Printing IMPROVEMENTS VP Eng. & Projects 10,000 (10,000) Northern States Power MN A.0000024.017 PI Scaffold and Man Lift Purch IMPROVEMENTS VP Eng. & Projects 268,988 268,988 Northern States Power MN A.0000024.018 PI Avert Tabletop Software IMPROVEMENTS VP Eng. & Projects 149,500 149,500 Northern States Power MN A.0000031.036 MNGP 2019 Plant Computer Blank IMPROVEMENTS VP Eng. & Projects 311 311 Northern States Power MN A.0000031.045 MT Risk Informed Completion Times IMPROVEMENTS VP Eng. & Projects 798,580 309,393 489,187 Northern States Power MN A.0000031.048 MNGP 2020 Plant Computer Blank IMPROVEMENTS VP Eng. & Projects 300,000 (300,000) Northern States Power MN A.0000031.049 MNGP HWC Mod IMPROVEMENTS VP Eng. & Projects 122,273 1,043,101 (920,828) Northern States Power MN A.0000031.054 MT Robotics IMPROVEMENTS VP Eng. & Projects 65,000 (65,000) Northern States Power MN A.0000031.060 MT Replace X-ray's IMPROVEMENTS VP Eng. & Projects 512,400 23,531 488,869 Northern States Power MN A.0000031.064 MT Surveillance Test Interval Prg IMPROVEMENTS VP Eng. & Projects 3,339 3,339 Northern States Power MN A.0000031.066 MT Risk Informed Eng Prgm IMPROVEMENTS VP Eng. & Projects 834,885 832,691 2,194 Northern States Power MN A.0000031.073 MT Rplc Telex Radios IMPROVEMENTS VP Eng. & Projects 266,096 266,096 Northern States Power MN A.0000031.074 MT 2020 All Metal Filter Modules IMPROVEMENTS VP Eng. & Projects 464,639 464,639 Northern States Power MN A.0000035.359 PI Simulator Windows 10 Upgrade IMPROVEMENTS VP Eng. & Projects 2,593 2,593 Northern States Power MN A.0000035.363 PI Mechanical Hogger 2R31 IMPROVEMENTS VP Eng. & Projects 341,226 433,410 (92,184) Northern States Power MN A.0000035.364 PI 2R31 Purification Modification IMPROVEMENTS VP Eng. & Projects 1,617,198 1,776,203 (159,005) Northern States Power MN A.0000035.367 PI Equipment Sensors (A/I) IMPROVEMENTS VP Eng. & Projects 608,573 450,000 158,573 Northern States Power MN A.0000035.426 PI EQ Rosemount Transmitter Repl 2020 IMPROVEMENTS VP Eng. & Projects 265,400 265,400 Northern States Power MN A.0000040.013 PI PRA Model Revision-SFCP IMPROVEMENTS VP Eng. & Projects (2,120) (2,120) Northern States Power MN A.0000040.056 PI Security Protective Strategy IMPROVEMENTS VP Eng. & Projects 8,273,484 6,048,849 2,224,635 Northern States Power MN A.0000040.062 PI 10CFR5069 Risk Informed Eng Prog IMPROVEMENTS VP Eng. & Projects 897,103 832,691 64,412 Northern States Power MN A.0000040.063 PI Risk Informed Completion Times IMPROVEMENTS VP Eng. & Projects 796,592 309,393 487,199 Northern States Power MN A.0000040.065 PI RCP Seal LAR IMPROVEMENTS VP Eng. & Projects (36,334) 50,000 (86,334) Northern States Power MN A.0000040.067 PI ILRT Interval Ext LAR IMPROVEMENTS VP Eng. & Projects 42,925 100,000 (57,075) Northern States Power MN A.0000040.068 PI Thermal Weapon Sights IMPROVEMENTS VP Eng. & Projects 73 73 Northern States Power MN A.0000040.071 PI Operating Cycle IMPROVEMENTS VP Eng. & Projects 162,855 162,855 Northern States Power MN A.0000040.072 PI Common Emergency Plan IMPROVEMENTS VP Eng. & Projects 134,658 134,658 Northern States Power MN A.0000053.006 PI Wireless Network Expansion IMPROVEMENTS VP Eng. & Projects 2,683,660 2,778,930 (95,270) Northern States Power MN A.0000054.005 MT Misc IT Purchases IMPROVEMENTS VP Eng. & Projects 125,280 125,280 Northern States Power MN A.0000054.006 MT Wireless Network Expansion IMPROVEMENTS VP Eng. & Projects 1,209,139 1,912,604 (703,465)
IMPROVEMENTS Total 20,923,447 18,163,309 2,760,138 Northern States Power MN A.0000023.001 MNGP Cyber Security 08-09 MANDATED COMPLIANCE VP Eng. & Projects (335) (335) Northern States Power MN A.0000029.011 MNGP NEI 09-05 Security Compli MANDATED COMPLIANCE VP Eng. & Projects 1,359,456 700,000 659,456 Northern States Power MN A.0000029.014 MNGP 316/B Ruling Implementati MANDATED COMPLIANCE VP Eng. & Projects 510 510 Northern States Power MN A.0000029.029 MNGP Fukushima Phase II MANDATED COMPLIANCE VP Eng. & Projects 36,156 66,000 (29,844) Northern States Power MN A.0000029.038 MT 2nd License Renewal MANDATED COMPLIANCE VP Eng. & Projects 137,419 1,000,000 (862,581) Northern States Power MN A.0000040.021 PI NFPA 805-01 U1 Train A AFW MANDATED COMPLIANCE VP Eng. & Projects (2) (2) Northern States Power MN A.0000040.025 PI NFPA 805-10 Loss OCT 4KV Br MANDATED COMPLIANCE VP Eng. & Projects 1,822,248 1,830,000 (7,752) Northern States Power MN A.0000040.046 PI U1 Rx Control Cluster Assemblies MANDATED COMPLIANCE VP Eng. & Projects 3,068,475 3,464,954 (396,479) Northern States Power MN A.0000040.047 PI U2 Rx Control Cluster Assemblies MANDATED COMPLIANCE VP Eng. & Projects 182,087 15,000 167,087
Attachment D, Exhibit 1 Page 1 of 4
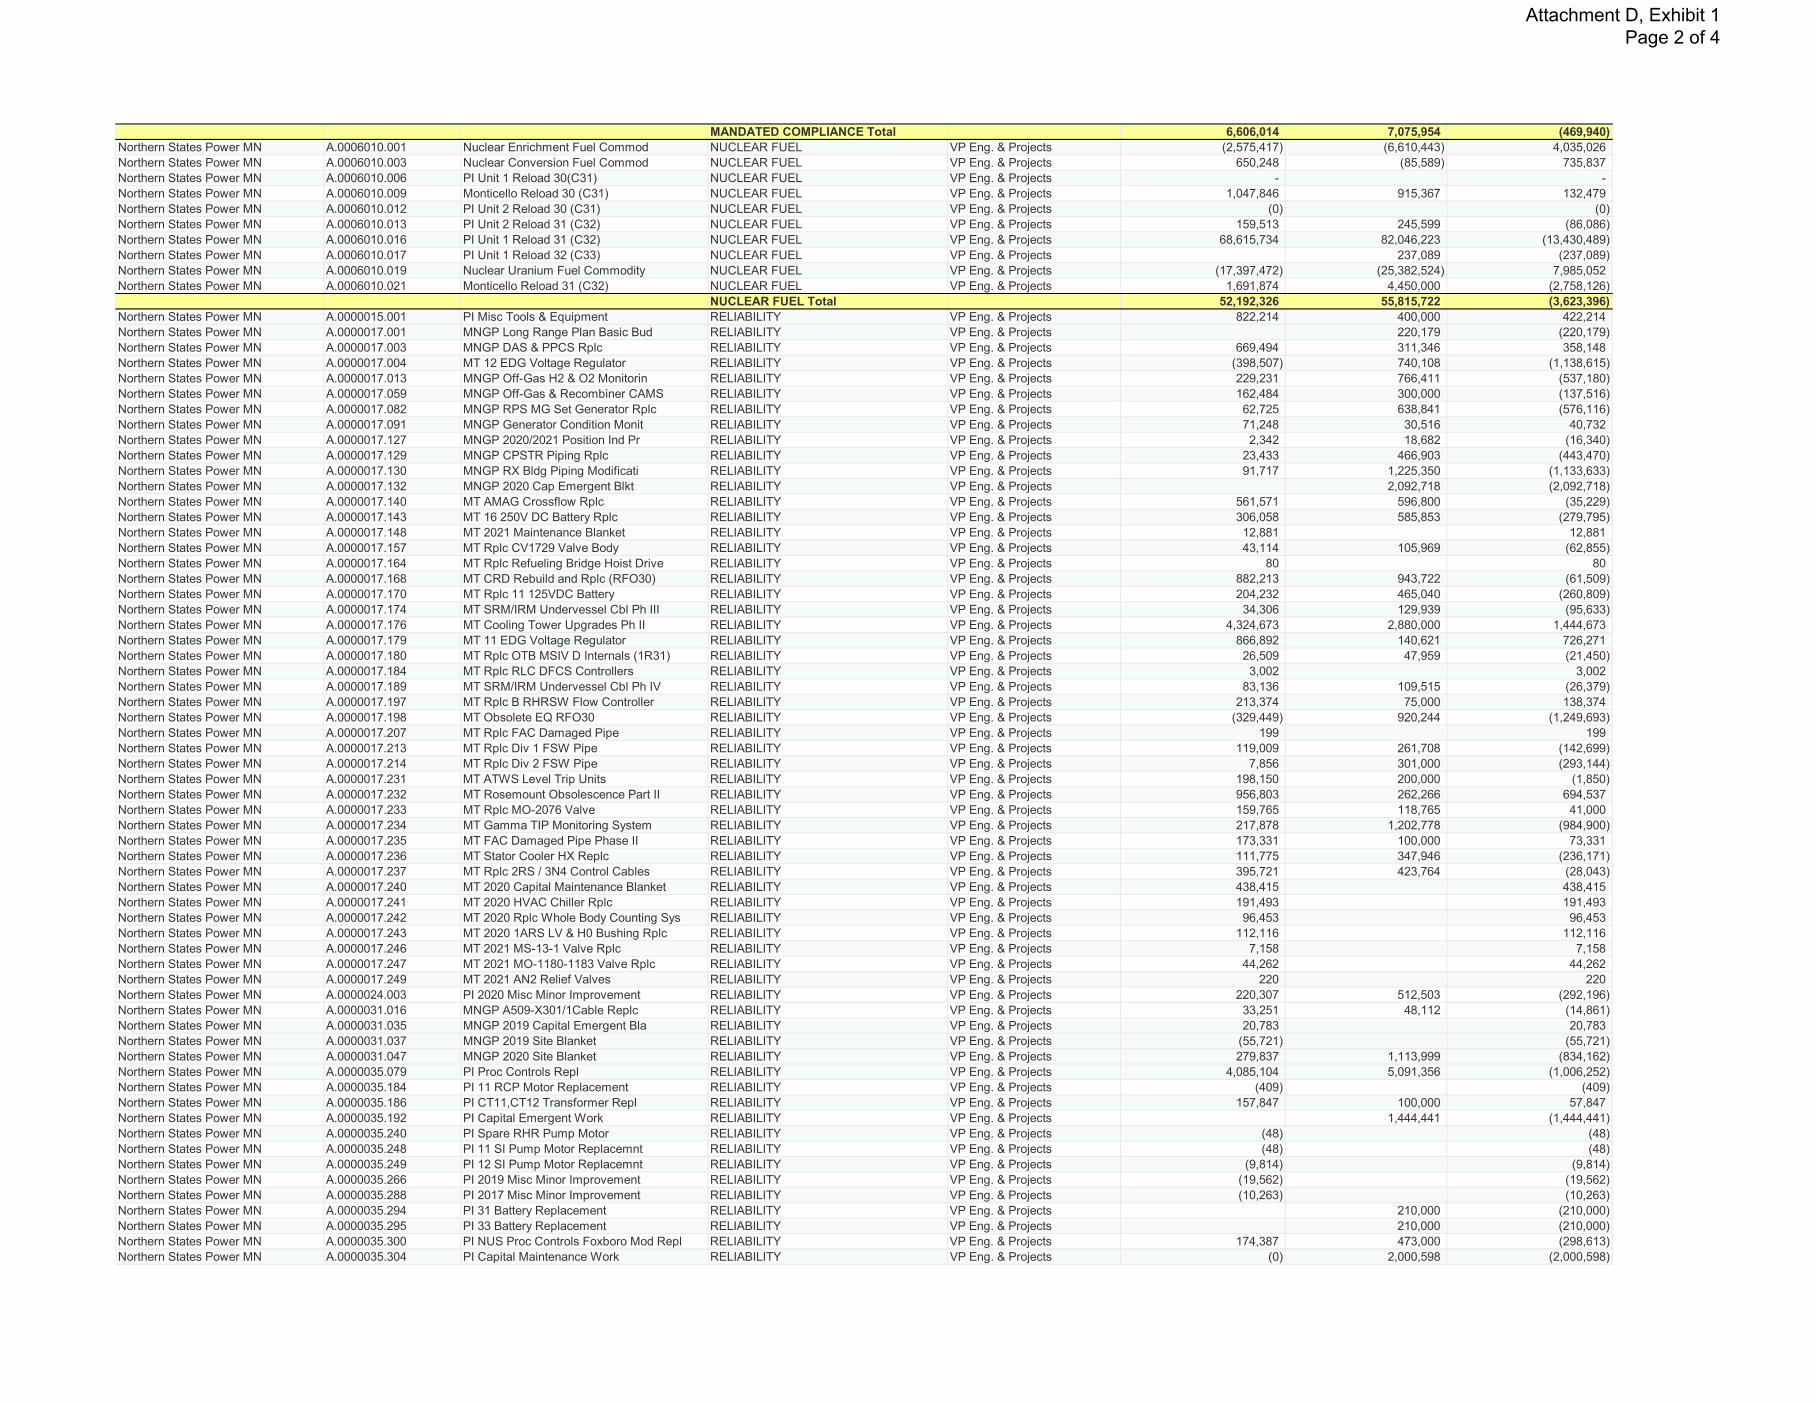
MANDATED COMPLIANCE Total 6,606,014 7,075,954 (469,940) Northern States Power MN A.0006010.001 Nuclear Enrichment Fuel Commod NUCLEAR FUEL VP Eng. & Projects (2,575,417) (6,610,443) 4,035,026 Northern States Power MN A.0006010.003 Nuclear Conversion Fuel Commod NUCLEAR FUEL VP Eng. & Projects 650,248 (85,589) 735,837 Northern States Power MN A.0006010.006 PI Unit 1 Reload 30(C31) NUCLEAR FUEL VP Eng. & Projects - - Northern States Power MN A.0006010.009 Monticello Reload 30 (C31) NUCLEAR FUEL VP Eng. & Projects 1,047,846 915,367 132,479 Northern States Power MN A.0006010.012 PI Unit 2 Reload 30 (C31) NUCLEAR FUEL VP Eng. & Projects (0) (0) Northern States Power MN A.0006010.013 PI Unit 2 Reload 31 (C32) NUCLEAR FUEL VP Eng. & Projects 159,513 245,599 (86,086) Northern States Power MN A.0006010.016 PI Unit 1 Reload 31 (C32) NUCLEAR FUEL VP Eng. & Projects 68,615,734 82,046,223 (13,430,489) Northern States Power MN A.0006010.017 PI Unit 1 Reload 32 (C33) NUCLEAR FUEL VP Eng. & Projects 237,089 (237,089) Northern States Power MN A.0006010.019 Nuclear Uranium Fuel Commodity NUCLEAR FUEL VP Eng. & Projects (17,397,472) (25,382,524) 7,985,052 Northern States Power MN A.0006010.021 Monticello Reload 31 (C32) NUCLEAR FUEL VP Eng. & Projects 1,691,874 4,450,000 (2,758,126)
NUCLEAR FUEL Total 52,192,326 55,815,722 (3,623,396) Northern States Power MN A.0000015.001 PI Misc Tools & Equipment RELIABILITY VP Eng. & Projects 822,214 400,000 422,214 Northern States Power MN A.0000017.001 MNGP Long Range Plan Basic Bud RELIABILITY VP Eng. & Projects 220,179 (220,179) Northern States Power MN A.0000017.003 MNGP DAS & PPCS Rplc RELIABILITY VP Eng. & Projects 669,494 311,346 358,148 Northern States Power MN A.0000017.004 MT 12 EDG Voltage Regulator RELIABILITY VP Eng. & Projects (398,507) 740,108 (1,138,615) Northern States Power MN A.0000017.013 MNGP Off-Gas H2 & O2 Monitorin RELIABILITY VP Eng. & Projects 229,231 766,411 (537,180) Northern States Power MN A.0000017.059 MNGP Off-Gas & Recombiner CAMS RELIABILITY VP Eng. & Projects 162,484 300,000 (137,516) Northern States Power MN A.0000017.082 MNGP RPS MG Set Generator Rplc RELIABILITY VP Eng. & Projects 62,725 638,841 (576,116) Northern States Power MN A.0000017.091 MNGP Generator Condition Monit RELIABILITY VP Eng. & Projects 71,248 30,516 40,732 Northern States Power MN A.0000017.127 MNGP 2020/2021 Position Ind Pr RELIABILITY VP Eng. & Projects 2,342 18,682 (16,340) Northern States Power MN A.0000017.129 MNGP CPSTR Piping Rplc RELIABILITY VP Eng. & Projects 23,433 466,903 (443,470) Northern States Power MN A.0000017.130 MNGP RX Bldg Piping Modificati RELIABILITY VP Eng. & Projects 91,717 1,225,350 (1,133,633) Northern States Power MN A.0000017.132 MNGP 2020 Cap Emergent Blkt RELIABILITY VP Eng. & Projects 2,092,718 (2,092,718) Northern States Power MN A.0000017.140 MT AMAG Crossflow Rplc RELIABILITY VP Eng. & Projects 561,571 596,800 (35,229) Northern States Power MN A.0000017.143 MT 16 250V DC Battery Rplc RELIABILITY VP Eng. & Projects 306,058 585,853 (279,795) Northern States Power MN A.0000017.148 MT 2021 Maintenance Blanket RELIABILITY VP Eng. & Projects 12,881 12,881 Northern States Power MN A.0000017.157 MT Rplc CV1729 Valve Body RELIABILITY VP Eng. & Projects 43,114 105,969 (62,855) Northern States Power MN A.0000017.164 MT Rplc Refueling Bridge Hoist Drive RELIABILITY VP Eng. & Projects 80 80 Northern States Power MN A.0000017.168 MT CRD Rebuild and Rplc (RFO30) RELIABILITY VP Eng. & Projects 882,213 943,722 (61,509) Northern States Power MN A.0000017.170 MT Rplc 11 125VDC Battery RELIABILITY VP Eng. & Projects 204,232 465,040 (260,809) Northern States Power MN A.0000017.174 MT SRM/IRM Undervessel Cbl Ph III RELIABILITY VP Eng. & Projects 34,306 129,939 (95,633) Northern States Power MN A.0000017.176 MT Cooling Tower Upgrades Ph II RELIABILITY VP Eng. & Projects 4,324,673 2,880,000 1,444,673 Northern States Power MN A.0000017.179 MT 11 EDG Voltage Regulator RELIABILITY VP Eng. & Projects 866,892 140,621 726,271 Northern States Power MN A.0000017.180 MT Rplc OTB MSIV D Internals (1R31) RELIABILITY VP Eng. & Projects 26,509 47,959 (21,450) Northern States Power MN A.0000017.184 MT Rplc RLC DFCS Controllers RELIABILITY VP Eng. & Projects 3,002 3,002 Northern States Power MN A.0000017.189 MT SRM/IRM Undervessel Cbl Ph IV RELIABILITY VP Eng. & Projects 83,136 109,515 (26,379) Northern States Power MN A.0000017.197 MT Rplc B RHRSW Flow Controller RELIABILITY VP Eng. & Projects 213,374 75,000 138,374 Northern States Power MN A.0000017.198 MT Obsolete EQ RFO30 RELIABILITY VP Eng. & Projects (329,449) 920,244 (1,249,693) Northern States Power MN A.0000017.207 MT Rplc FAC Damaged Pipe RELIABILITY VP Eng. & Projects 199 199 Northern States Power MN A.0000017.213 MT Rplc Div 1 FSW Pipe RELIABILITY VP Eng. & Projects 119,009 261,708 (142,699) Northern States Power MN A.0000017.214 MT Rplc Div 2 FSW Pipe RELIABILITY VP Eng. & Projects 7,856 301,000 (293,144) Northern States Power MN A.0000017.231 MT ATWS Level Trip Units RELIABILITY VP Eng. & Projects 198,150 200,000 (1,850) Northern States Power MN A.0000017.232 MT Rosemount Obsolescence Part II RELIABILITY VP Eng. & Projects 956,803 262,266 694,537 Northern States Power MN A.0000017.233 MT Rplc MO-2076 Valve RELIABILITY VP Eng. & Projects 159,765 118,765 41,000 Northern States Power MN A.0000017.234 MT Gamma TIP Monitoring System RELIABILITY VP Eng. & Projects 217,878 1,202,778 (984,900) Northern States Power MN A.0000017.235 MT FAC Damaged Pipe Phase II RELIABILITY VP Eng. & Projects 173,331 100,000 73,331 Northern States Power MN A.0000017.236 MT Stator Cooler HX Replc RELIABILITY VP Eng. & Projects 111,775 347,946 (236,171) Northern States Power MN A.0000017.237 MT Rplc 2RS / 3N4 Control Cables RELIABILITY VP Eng. & Projects 395,721 423,764 (28,043) Northern States Power MN A.0000017.240 MT 2020 Capital Maintenance Blanket RELIABILITY VP Eng. & Projects 438,415 438,415 Northern States Power MN A.0000017.241 MT 2020 HVAC Chiller Rplc RELIABILITY VP Eng. & Projects 191,493 191,493 Northern States Power MN A.0000017.242 MT 2020 Rplc Whole Body Counting Sys RELIABILITY VP Eng. & Projects 96,453 96,453 Northern States Power MN A.0000017.243 MT 2020 1ARS LV & H0 Bushing Rplc RELIABILITY VP Eng. & Projects 112,116 112,116 Northern States Power MN A.0000017.246 MT 2021 MS-13-1 Valve Rplc RELIABILITY VP Eng. & Projects 7,158 7,158 Northern States Power MN A.0000017.247 MT 2021 MO-1180-1183 Valve Rplc RELIABILITY VP Eng. & Projects 44,262 44,262 Northern States Power MN A.0000017.249 MT 2021 AN2 Relief Valves RELIABILITY VP Eng. & Projects 220 220 Northern States Power MN A.0000024.003 PI 2020 Misc Minor Improvement RELIABILITY VP Eng. & Projects 220,307 512,503 (292,196) Northern States Power MN A.0000031.016 MNGP A509-X301/1Cable Replc RELIABILITY VP Eng. & Projects 33,251 48,112 (14,861) Northern States Power MN A.0000031.035 MNGP 2019 Capital Emergent Bla RELIABILITY VP Eng. & Projects 20,783 20,783 Northern States Power MN A.0000031.037 MNGP 2019 Site Blanket RELIABILITY VP Eng. & Projects (55,721) (55,721) Northern States Power MN A.0000031.047 MNGP 2020 Site Blanket RELIABILITY VP Eng. & Projects 279,837 1,113,999 (834,162) Northern States Power MN A.0000035.079 PI Proc Controls Repl RELIABILITY VP Eng. & Projects 4,085,104 5,091,356 (1,006,252) Northern States Power MN A.0000035.184 PI 11 RCP Motor Replacement RELIABILITY VP Eng. & Projects (409) (409) Northern States Power MN A.0000035.186 PI CT11,CT12 Transformer Repl RELIABILITY VP Eng. & Projects 157,847 100,000 57,847 Northern States Power MN A.0000035.192 PI Capital Emergent Work RELIABILITY VP Eng. & Projects 1,444,441 (1,444,441) Northern States Power MN A.0000035.240 PI Spare RHR Pump Motor RELIABILITY VP Eng. & Projects (48) (48) Northern States Power MN A.0000035.248 PI 11 SI Pump Motor Replacemnt RELIABILITY VP Eng. & Projects (48) (48) Northern States Power MN A.0000035.249 PI 12 SI Pump Motor Replacemnt RELIABILITY VP Eng. & Projects (9,814) (9,814) Northern States Power MN A.0000035.266 PI 2019 Misc Minor Improvement RELIABILITY VP Eng. & Projects (19,562) (19,562) Northern States Power MN A.0000035.288 PI 2017 Misc Minor Improvement RELIABILITY VP Eng. & Projects (10,263) (10,263) Northern States Power MN A.0000035.294 PI 31 Battery Replacement RELIABILITY VP Eng. & Projects 210,000 (210,000) Northern States Power MN A.0000035.295 PI 33 Battery Replacement RELIABILITY VP Eng. & Projects 210,000 (210,000) Northern States Power MN A.0000035.300 PI NUS Proc Controls Foxboro Mod Repl RELIABILITY VP Eng. & Projects 174,387 473,000 (298,613) Northern States Power MN A.0000035.304 PI Capital Maintenance Work RELIABILITY VP Eng. & Projects (0) 2,000,598 (2,000,598)
Attachment D, Exhibit 1 Page 2 of 4

Northern States Power MN A.0000035.313 PI 121-128 Intake Travelling Screens RELIABILITY VP Eng. & Projects 62,204 62,204 Northern States Power MN A.0000035.318 PI 121 Hydrogen Recombiner Analyzers RELIABILITY VP Eng. & Projects 411,345 100,000 311,345 Northern States Power MN A.0000035.326 PI Security X-Ray Replacement RELIABILITY VP Eng. & Projects 470,041 276,000 194,041 Northern States Power MN A.0000035.330 PI Nuclear Instrumentation Display Repl RELIABILITY VP Eng. & Projects 12 4,000 (3,988) Northern States Power MN A.0000035.347 PI Beacon Server Repl RELIABILITY VP Eng. & Projects 198,000 (198,000) Northern States Power MN A.0000035.348 PI Aux Bldg Crane Control Sys Repl RELIABILITY VP Eng. & Projects 1,507,253 2,178,280 (671,027) Northern States Power MN A.0000035.350 PI U1 Condenser Expansion Joint Repl RELIABILITY VP Eng. & Projects 427,000 (427,000) Northern States Power MN A.0000035.354 PI 1H1,1H3 Breaker Replacement RELIABILITY VP Eng. & Projects 13,823 13,823 Northern States Power MN A.0000035.355 PI 1H5 Breaker Replacement RELIABILITY VP Eng. & Projects (2,277) (2,277) Northern States Power MN A.0000035.356 PI U1 Condenser Steam Bellow Repl RELIABILITY VP Eng. & Projects 250,000 (250,000) Northern States Power MN A.0000035.357 PI 1H2, 1H4 Breaker Replacement RELIABILITY VP Eng. & Projects 13,548 65,000 (51,452) Northern States Power MN A.0000035.368 PI CL Chemical Treatment Upgrade RELIABILITY VP Eng. & Projects 1,188,815 600,000 588,815 Northern States Power MN A.0000035.382 PI Analog Proc Controls Repl-Ph II RELIABILITY VP Eng. & Projects 766,848 766,848 Northern States Power MN A.0000035.395 PI 121 MDFP Panel Replacement RELIABILITY VP Eng. & Projects 46 46 Northern States Power MN A.0000035.396 PI Cathodic Protection GB JB-3,JB-4 RELIABILITY VP Eng. & Projects (0) 44,989 (44,989) Northern States Power MN A.0000035.398 PI CL Supply Header Piping Repl RELIABILITY VP Eng. & Projects 374,489 750,000 (375,511) Northern States Power MN A.0000035.399 PI EEQ Cntmt Dome Recirc Mtr Repl RELIABILITY VP Eng. & Projects 570,000 (570,000) Northern States Power MN A.0000035.401 PI 2020 Capital Maintenance RELIABILITY VP Eng. & Projects 2,797,726 2,797,726 Northern States Power MN A.0000035.402 PI 2021 Capital Maintenance RELIABILITY VP Eng. & Projects 241,271 241,271 Northern States Power MN A.0000035.428 PI NI Channel Bypass Panel RELIABILITY VP Eng. & Projects 54,335 54,335 Northern States Power MN A.0000040.048 PI SR Inverter Replacement RELIABILITY VP Eng. & Projects 50,000 (50,000) Northern States Power MN A.0000040.064 PI OBN Namco Limit Switch EQ Repl-2R31 RELIABILITY VP Eng. & Projects 5 5,000 (4,995) Northern States Power MN A.0000053.005 PI IT Capital Blanket RELIABILITY VP Eng. & Projects 100,000 (100,000) Northern States Power MN A.0000067.001 MT Misc Tools & Equipment RELIABILITY VP Eng. & Projects 996,356 400,000 596,356 Northern States Power MN A.0000073.005 PI 122 Cooling Tower Rebuild RELIABILITY VP Eng. & Projects 5,366,414 (5,366,414) Northern States Power MN A.0000073.007 PI 121 Cooling Tower Rebuild RELIABILITY VP Eng. & Projects 6,504,652 6,504,652
RELIABILITY Total 32,475,720 40,018,635 (7,542,915) Grand Total 133,269,412 145,798,704 (12,529,292)
133,269,412 145,798,704 (12,529,292)
Attachment D, Exhibit 1 Page 3 of 4

Attachment E
Business Systems
Capital Project Substitution and Change Process Technology Funding Process The Technology Investment Governance process is used throughout the year to evaluate new projects that were not identified in the original budget. New projects considered for funding may be a result of any of the following:
• New regulatory requirements • Changes in business direction after the creation of the budget, resulting in
shifts to specific project priority • Where the Portfolio Management categorization and ranking process
identifies projects with higher value “Repurposing” Process As projects are eliminated, changed, or come in under the allocated budget amount, the associated funds may be “repurposed”. A portfolio prioritization and balancing process is used to evaluate new demand or changes to the existing projects. This means that the dollars may be allocated to other existing projects, or to new projects identified through the Technology Investment Governance process stated above. If an existing project changes in scope, size, timing, etc., the forecast is updated to reflect the new budgeted amount. The Business Systems exhibit provided lists projects by Unifier ID, which is the project ID used by the organization based on its data strategy. Each SAP work breakdown structure (WBS) is tied to a Unifier project ID. Exhibit 1 is a list of projects that were budgeted and not executed in 2020, and those that were not funded, but spent in 2020.
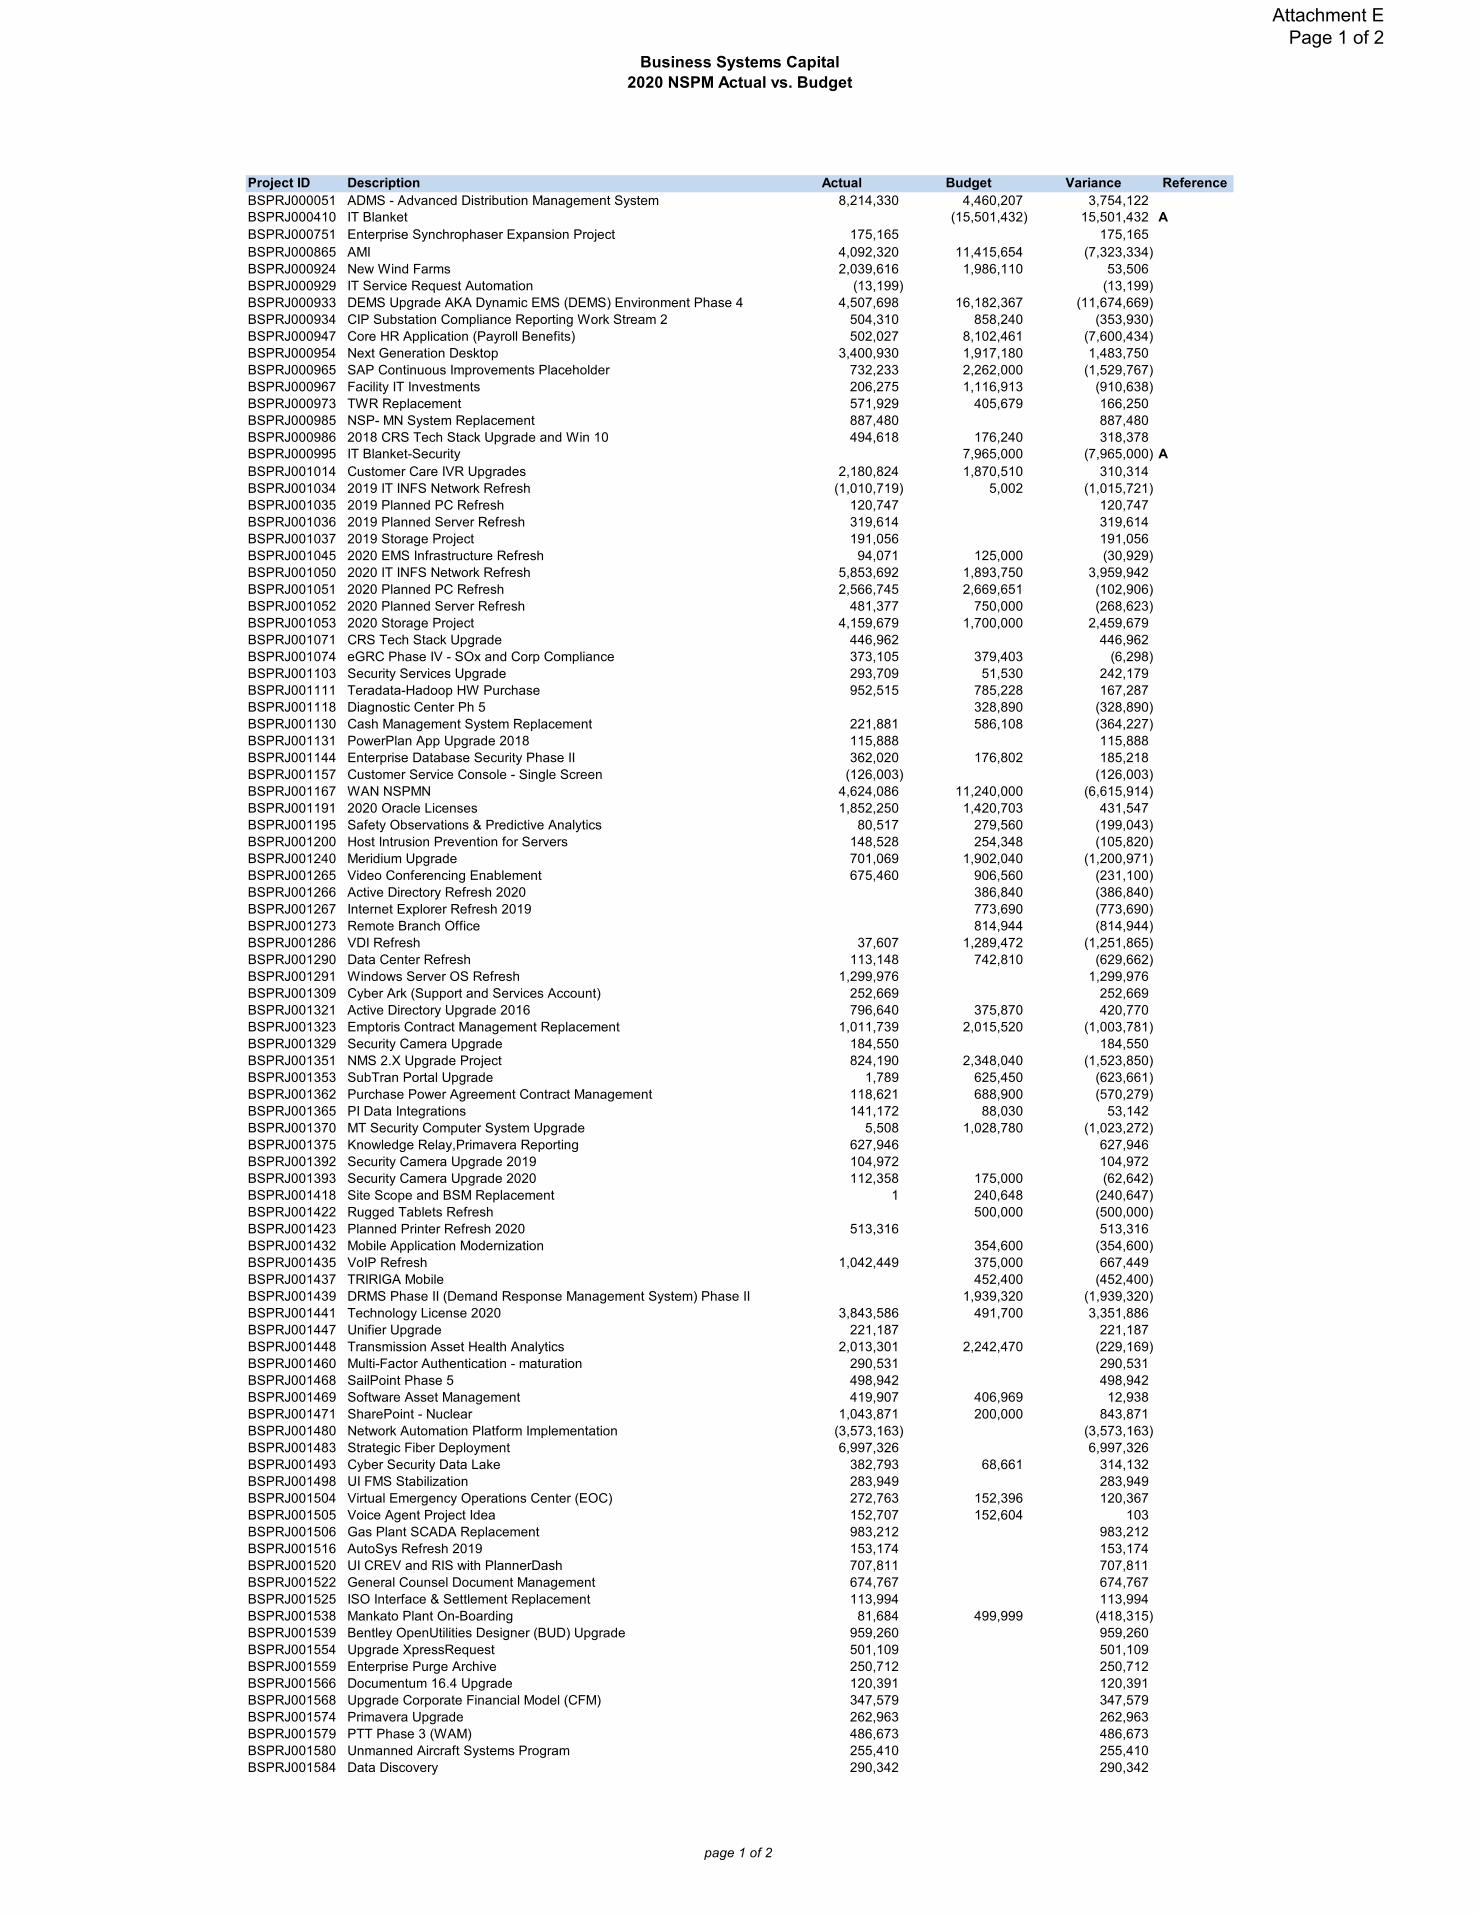
Business Systems Capital2020 NSPM Actual vs. Budget
Project ID Description Actual Budget Variance ReferenceBSPRJ000051 ADMS - Advanced Distribution Management System 8,214,330 4,460,207 3,754,122 BSPRJ000410 IT Blanket (15,501,432) 15,501,432 ABSPRJ000751 Enterprise Synchrophaser Expansion Project 175,165 175,165 BSPRJ000865 AMI 4,092,320 11,415,654 (7,323,334) BSPRJ000924 New Wind Farms 2,039,616 1,986,110 53,506 BSPRJ000929 IT Service Request Automation (13,199) (13,199) BSPRJ000933 DEMS Upgrade AKA Dynamic EMS (DEMS) Environment Phase 4 4,507,698 16,182,367 (11,674,669) BSPRJ000934 CIP Substation Compliance Reporting Work Stream 2 504,310 858,240 (353,930) BSPRJ000947 Core HR Application (Payroll Benefits) 502,027 8,102,461 (7,600,434) BSPRJ000954 Next Generation Desktop 3,400,930 1,917,180 1,483,750 BSPRJ000965 SAP Continuous Improvements Placeholder 732,233 2,262,000 (1,529,767) BSPRJ000967 Facility IT Investments 206,275 1,116,913 (910,638) BSPRJ000973 TWR Replacement 571,929 405,679 166,250 BSPRJ000985 NSP- MN System Replacement 887,480 887,480 BSPRJ000986 2018 CRS Tech Stack Upgrade and Win 10 494,618 176,240 318,378 BSPRJ000995 IT Blanket-Security 7,965,000 (7,965,000) ABSPRJ001014 Customer Care IVR Upgrades 2,180,824 1,870,510 310,314 BSPRJ001034 2019 IT INFS Network Refresh (1,010,719) 5,002 (1,015,721) BSPRJ001035 2019 Planned PC Refresh 120,747 120,747 BSPRJ001036 2019 Planned Server Refresh 319,614 319,614 BSPRJ001037 2019 Storage Project 191,056 191,056 BSPRJ001045 2020 EMS Infrastructure Refresh 94,071 125,000 (30,929) BSPRJ001050 2020 IT INFS Network Refresh 5,853,692 1,893,750 3,959,942 BSPRJ001051 2020 Planned PC Refresh 2,566,745 2,669,651 (102,906) BSPRJ001052 2020 Planned Server Refresh 481,377 750,000 (268,623) BSPRJ001053 2020 Storage Project 4,159,679 1,700,000 2,459,679 BSPRJ001071 CRS Tech Stack Upgrade 446,962 446,962 BSPRJ001074 eGRC Phase IV - SOx and Corp Compliance 373,105 379,403 (6,298) BSPRJ001103 Security Services Upgrade 293,709 51,530 242,179 BSPRJ001111 Teradata-Hadoop HW Purchase 952,515 785,228 167,287 BSPRJ001118 Diagnostic Center Ph 5 328,890 (328,890) BSPRJ001130 Cash Management System Replacement 221,881 586,108 (364,227) BSPRJ001131 PowerPlan App Upgrade 2018 115,888 115,888 BSPRJ001144 Enterprise Database Security Phase II 362,020 176,802 185,218 BSPRJ001157 Customer Service Console - Single Screen (126,003) (126,003) BSPRJ001167 WAN NSPMN 4,624,086 11,240,000 (6,615,914) BSPRJ001191 2020 Oracle Licenses 1,852,250 1,420,703 431,547 BSPRJ001195 Safety Observations & Predictive Analytics 80,517 279,560 (199,043) BSPRJ001200 Host Intrusion Prevention for Servers 148,528 254,348 (105,820) BSPRJ001240 Meridium Upgrade 701,069 1,902,040 (1,200,971) BSPRJ001265 Video Conferencing Enablement 675,460 906,560 (231,100) BSPRJ001266 Active Directory Refresh 2020 386,840 (386,840) BSPRJ001267 Internet Explorer Refresh 2019 773,690 (773,690) BSPRJ001273 Remote Branch Office 814,944 (814,944) BSPRJ001286 VDI Refresh 37,607 1,289,472 (1,251,865) BSPRJ001290 Data Center Refresh 113,148 742,810 (629,662) BSPRJ001291 Windows Server OS Refresh 1,299,976 1,299,976 BSPRJ001309 Cyber Ark (Support and Services Account) 252,669 252,669 BSPRJ001321 Active Directory Upgrade 2016 796,640 375,870 420,770 BSPRJ001323 Emptoris Contract Management Replacement 1,011,739 2,015,520 (1,003,781) BSPRJ001329 Security Camera Upgrade 184,550 184,550 BSPRJ001351 NMS 2.X Upgrade Project 824,190 2,348,040 (1,523,850) BSPRJ001353 SubTran Portal Upgrade 1,789 625,450 (623,661) BSPRJ001362 Purchase Power Agreement Contract Management 118,621 688,900 (570,279) BSPRJ001365 PI Data Integrations 141,172 88,030 53,142 BSPRJ001370 MT Security Computer System Upgrade 5,508 1,028,780 (1,023,272) BSPRJ001375 Knowledge Relay,Primavera Reporting 627,946 627,946 BSPRJ001392 Security Camera Upgrade 2019 104,972 104,972 BSPRJ001393 Security Camera Upgrade 2020 112,358 175,000 (62,642) BSPRJ001418 Site Scope and BSM Replacement 1 240,648 (240,647) BSPRJ001422 Rugged Tablets Refresh 500,000 (500,000) BSPRJ001423 Planned Printer Refresh 2020 513,316 513,316 BSPRJ001432 Mobile Application Modernization 354,600 (354,600) BSPRJ001435 VoIP Refresh 1,042,449 375,000 667,449 BSPRJ001437 TRIRIGA Mobile 452,400 (452,400) BSPRJ001439 DRMS Phase II (Demand Response Management System) Phase II 1,939,320 (1,939,320) BSPRJ001441 Technology License 2020 3,843,586 491,700 3,351,886 BSPRJ001447 Unifier Upgrade 221,187 221,187 BSPRJ001448 Transmission Asset Health Analytics 2,013,301 2,242,470 (229,169) BSPRJ001460 Multi-Factor Authentication - maturation 290,531 290,531 BSPRJ001468 SailPoint Phase 5 498,942 498,942 BSPRJ001469 Software Asset Management 419,907 406,969 12,938 BSPRJ001471 SharePoint - Nuclear 1,043,871 200,000 843,871 BSPRJ001480 Network Automation Platform Implementation (3,573,163) (3,573,163) BSPRJ001483 Strategic Fiber Deployment 6,997,326 6,997,326 BSPRJ001493 Cyber Security Data Lake 382,793 68,661 314,132 BSPRJ001498 UI FMS Stabilization 283,949 283,949 BSPRJ001504 Virtual Emergency Operations Center (EOC) 272,763 152,396 120,367 BSPRJ001505 Voice Agent Project Idea 152,707 152,604 103 BSPRJ001506 Gas Plant SCADA Replacement 983,212 983,212 BSPRJ001516 AutoSys Refresh 2019 153,174 153,174 BSPRJ001520 UI CREV and RIS with PlannerDash 707,811 707,811 BSPRJ001522 General Counsel Document Management 674,767 674,767 BSPRJ001525 ISO Interface & Settlement Replacement 113,994 113,994 BSPRJ001538 Mankato Plant On-Boarding 81,684 499,999 (418,315) BSPRJ001539 Bentley OpenUtilities Designer (BUD) Upgrade 959,260 959,260 BSPRJ001554 Upgrade XpressRequest 501,109 501,109 BSPRJ001559 Enterprise Purge Archive 250,712 250,712 BSPRJ001566 Documentum 16.4 Upgrade 120,391 120,391 BSPRJ001568 Upgrade Corporate Financial Model (CFM) 347,579 347,579 BSPRJ001574 Primavera Upgrade 262,963 262,963 BSPRJ001579 PTT Phase 3 (WAM) 486,673 486,673 BSPRJ001580 Unmanned Aircraft Systems Program 255,410 255,410 BSPRJ001584 Data Discovery 290,342 290,342
page 1 of 2
Attachment E Page 1 of 2

Business Systems Capital2020 NSPM Actual vs. Budget
Project ID Description Actual Budget Variance ReferenceBSPRJ001586 MRAS Upgrade to 64 Bit Operating System 136,112 136,112 BSPRJ001589 OT Shared Services 1,601,878 587,750 1,014,128 BSPRJ001593 Avaya Cloud Voice Deployment 5,956,623 5,956,623 BSPRJ001595 Monitoring and Diagnostics (M&D) Center On-line Thermal Performance 601,731 601,731 BSPRJ001596 Legal Hold Custodian Management 117,416 117,416 BSPRJ001612 Cloud - SAST_DAST 301,602 301,602 BSPRJ001615 OT Monitoring 2020 624,053 624,053 BSPRJ001616 Email Advanced Threat Protection 2,660,890 2,660,890 BSPRJ001621 Nuclear Meridium APM Implementation 2,071,278 2,071,278 BSPRJ001623 Archer 2020 121,589 121,589 BSPRJ001624 Risk Assessment as a Service 427,557 427,557 BSPRJ001625 Application Performance Monitoring 1,566,072 1,566,072 BSPRJ001627 PI for Wind farms 377,276 377,276 BSPRJ001635 Oracle Exadata Refresh 2,923,125 2,923,125 BSPRJ001658 Adobe Flash Remediation 434,700 434,700 BSPRJ001663 Planned PC Refresh 5,365,595 5,365,595 BSPRJ001664 Printer Refresh 186,336 186,336 BSPRJ001667 ServiceNow 2,549,305 2,549,305 BSPRJ001669 Business Systems Resiliency Project 1,572,875 1,572,875 BSPRJ001670 Kafka Data Streaming 1,645,896 1,645,896 BSPRJ001684 Blue Prism Licenses 109,891 109,891 BSPRJ001694 F5 Renewal 2,522,121 2,522,121 BSPRJ001696 Motorola LMR Core Upgrade 2,378,505 2,378,505 BSPRJ001709 Oracle Java 3 licensing 3 year 755,216 755,216 BSPRJ001721 Rational License Purchase 2020 775,449 775,449 BSPRJ001724 Ansible Automation and Licensing 1,236,552 1,236,552 BSPRJ001730 Digital Ops Factory 294,739 294,739 BSPRJ001731 Digital Ops Factory - Nuclear Lighthouse 595,474 595,474 BSPRJ001772 Field Area Network (FAN) 575,294 12,516,776 (11,941,482) BSPRJ001774 Distribution Load Planning and Forecast Tool 3,188,653 1 3,188,652 BSPRJ000990 XpressNET and PowerSource Productivity Enhancements 250,970 (250,970) BSPRJ001011 2018 EMS Infrastructure Refresh 247,000 (247,000) BSPRJ001057 2020 Planned Mobile (MDT) Refresh 2,434,870 (2,434,870) BSPRJ001388 SAP Purge Archive 1,315,770 (1,315,770) (blank) FLISR 362,692 (362,692)
Projects with actuals or budget between $100K/($100K) 1,373,021 562,091 810,930 Total 123,267,057 106,379,737 16,887,321
Notes:A: "Blanket" structures are used to fund projects from a budget and forecast perspective. These structures will not contain actuals.
page 2 of 2
Attachment E Page 2 of 2