budget statement 2008-09 - nsw treasury
TRANSCRIPT
Budget Statement
2008-09
New South Wales
Budget Paper No. 2
The Budget Overview previously included in this budget paper is now published as a separate document.
TABLE OF CONTENTS
Chapter 1: BUDGET POSITION 1.1 Introduction ............................................................................................ 1 - 2 1.2 Budget Results ...................................................................................... 1 - 3 1.3 Capital Expenditure ............................................................................... 1 - 15 1.4 Balance Sheet ....................................................................................... 1 - 16 1.5 Cash Flow .............................................................................................. 1 - 19 1.6 Key Budget Risks .................................................................................. 1 - 23
Chapter 2: FISCAL STRATEGY AND OUTLOOK 2.1 Introduction ............................................................................................ 2 - 2 2.2 Fiscal Strategy ....................................................................................... 2 - 2 2.3 2008-09 Budget ..................................................................................... 2 - 6 2.4 Budget Trends ....................................................................................... 2 - 7 2.5 Capital Expenditure ............................................................................... 2 - 14
Chapter 3: GENERAL GOVERNMENT EXPENDITURE 3.1 Introduction ............................................................................................ 3 - 1 3.2 Performance Budgeting ......................................................................... 3 - 2 3.3 Expenditure Trends and Composition .................................................... 3 - 5 3.4 Service Delivery ..................................................................................... 3 - 9
Chapter 4: GENERAL GOVERNMENT REVENUES 4.1 Introduction ............................................................................................ 4 - 1 4.2 Taxation Policy Measures ...................................................................... 4 - 2 4.3 Revenue Trends and Composition ........................................................ 4 - 7 4.4 Taxation Revenue .................................................................................. 4 - 17 4.5 Grant Revenue ...................................................................................... 4 - 23 4.6 Other Revenues ..................................................................................... 4 - 24
Chapter 5: TAX EXPENDITURES AND CONCESSIONS 5.1 Introduction ............................................................................................ 5 - 1 5.2 Concepts and Methods .......................................................................... 5 - 2 5.3 Tax Expenditures ................................................................................... 5 - 3 5.4 Concessions .......................................................................................... 5 - 5
Chapter 6: BALANCE SHEET MANAGEMENT 6.1 Introduction ............................................................................................ 6 - 2 6.2 Net Debt ................................................................................................. 6 - 2 6.3 Net Financial Liabilities ........................................................................... 6 - 10 6.4 Net Worth ............................................................................................... 6 - 14 6.5 Unfunded Superannuation...................................................................... 6 - 16 6.6 Insurance................................................................................................ 6 - 21 6.7 Financial Asset Management ................................................................ 6 - 26 6.8 Financial Risk Management ................................................................... 6 - 28
i

Chapter 7: PUBLIC TRADING ENTERPRISES 7.1 Introduction ............................................................................................ 7 - 1 7.2 Commercial Policy Framework .............................................................. 7 - 2 7.3 Operating Performance .......................................................................... 7 - 3 7.4 Capital Expenditure ............................................................................... 7 - 6 7.5 Major Sectors ........................................................................................ 7 - 13
Chapter 8: COMMONWEALTH-STATE FINANCIAL ARRANGEMENTS 8.1 Introduction ............................................................................................ 8 - 1 8.2 New COAG Reform Agenda .................................................................. 8 - 2 8.3 Specific Purpose Payments Reform ...................................................... 8 - 6 8.4 Commonwealth Grants .......................................................................... 8 - 9
Chapter 9: THE ECONOMY 9.1 Introduction ............................................................................................ 9 - 1 9.2 Overview ................................................................................................ 9 - 2 9.3 Recent Performance .............................................................................. 9 - 3 9.4 Outlook for 2008-09 ............................................................................... 9 - 9 9.5 Economic Risks ..................................................................................... 9 - 16
Chapter 10: UNIFORM REPORTING FRAMEWORK 10.1 Introduction ............................................................................................ 10 - 1 10.2 Uniform Presentation Framework ........................................................... 10 - 2 10.3 Uniform Presentation Tables .................................................................. 10 - 9 10.4 Loan Council Allocation .......................................................................... 10 - 40
APPENDICES A. Progress against Fiscal Responsibility Act 2005 Targets
and Principles ................................................................................... A - 1 B. Statement of Accounting Principles and Policies ........................... B - 1 C. Classification of Agencies .................................................................. C - 1 D. 2007-08 Budget - Summary of Variations ......................................... D - 1 E. Tax Expenditure and Concessional Charges Statement ................ E - 1
GLOSSARY ...................................................................................................... G - 1
INDEX
ii

CHAPTER 1: BUDGET POSITION
♦ A Budget surplus of $268 million is estimated for 2008-09, with an average surplus of $782 million per annum for the following three years.
♦ Budget reporting in the 2008-09 Budget is, for the first time, in accordance with Australian Accounting Standard AASB 1049 Whole of Government and General Government Sector Financial Reporting. This standard attempts to combine both accounting and government finance statistics (GFS) principles. Previous budgets were prepared on a GFS basis.
♦ The Budget surplus is estimated to be $700 million for 2007-08 ($1 billion on a GFS basis), compared with $40 million in the 2007-08 Budget ($376 million on a GFS basis) and $170 million in the 2007-08 Half-Yearly Budget Review ($506 million on a GFS basis).
♦ Total revenues are expected to rise by 3.2 per cent in 2008-09 to $47.9 billion. Revenues are expected to increase on average by 4.4 per cent per annum over the four years to 2011-12.
♦ Total expenses are expected to rise by 4.2 per cent in 2008-09 to $47.6 billion. Expenses are expected to increase on average by 4.5 per cent per annum over the four years to 2011-12.
♦ Major taxation policies announced in this Budget – reduction in payroll tax rates, indexation of payroll tax thresholds and bringing forward the abolition of transfer duty on non-land business assets – will reduce revenues by $148 million in 2008-09 rising to $948 million per annum in 2011-12. This is a total reduction in revenues of $2.2 billion over the next four years.
♦ Capital expenditure in the general government sector will be at record levels and is estimated to be $5.5 billion in 2008-09. It will average $5.3 billion per annum for the following three years.
♦ There will be an increase in general government net debt due to record levels of capital expenditure. Net debt will increase from $5 billion (1.4 per cent of GSP) at 30 June 2008 to $7.8 billion (1.7 per cent of GSP) at 30 June 2012. Net debt remains at a sustainable level and significantly lower than in 1995 when it was $12.2 billion (7.4 per cent of GSP).
♦ General government net financial liabilities will increase from $29.3 billion at June 2008 to $36.5 billion at June 2012. This represents a decrease from 8.2 per cent of GSP at June 2008 to 8 per cent at June 2012.
Budget Statement 2008-09 1 - 1

1.1 INTRODUCTION The budget papers report principally on the financial and service delivery performance of the general government sector. General government agencies typically deliver public services or are regulatory in nature.
The general government sector forms one part of the total state sector. The remainder comprises more commercially focused entities-public trading enterprises (PTE) and public financial enterprises (PFE). These agencies do not impact on the budget result, other than through payment of dividends and tax equivalents and where they receive funding to provide services on a subsidised basis.
This chapter focuses on the financial position and performance of the general government sector. An analysis of the financial position and performance of the PTE sector is provided in Chapter 7.
Financial reporting of the general government sector complies with the accrual based accounting and reporting principles of Australian Accounting Standard AASB 1049 Whole of Government and General Government Sector Financial Reporting.
AASB 1049 converges the reporting principles of Australian Accounting Standards and Government Finance Statistics (GFS) and applies, for the first time, to the 2008-09 financial year. The financial statements of prior reporting periods have been restated in these budget papers to AASB 1049 principles to ensure that performance trends can be assessed on a comparable basis.
The General Government Sector Operating Statement set out in Table 1.2 highlights the key operating statement aggregates disclosed under AASB 1049:
The Budget result or net operating balance reports the difference between the full cost of general government service delivery in the financial year, excluding new capital expenditure but including depreciation of the existing stock of fixed assets, and the revenues earned in that year to fund those services. Accordingly, this is the principal measure of a government’s financial performance and is the one that is focussed on in these budget papers.
♦
♦
♦
The operating result is the net operating balance plus other economic flows, such as net actuarial superannuation gains and losses.
The comprehensive result is the operating result plus other movements in equity, such as revaluations of fixed assets.
1 - 2 Budget Statement 2008-09
The net lending/(borrowing) result demonstrates the extent to which the current year’s activities impact the general government sector’s net financial liabilities.
♦
The Government has announced its intention to lease its power stations to private operators and transfer the retail operations of Country Energy, EnergyAustralia and Integral Energy to private operators.
Following normal budget practice, the Budget assumes that the current ownership and control of electricity assets remains unchanged.
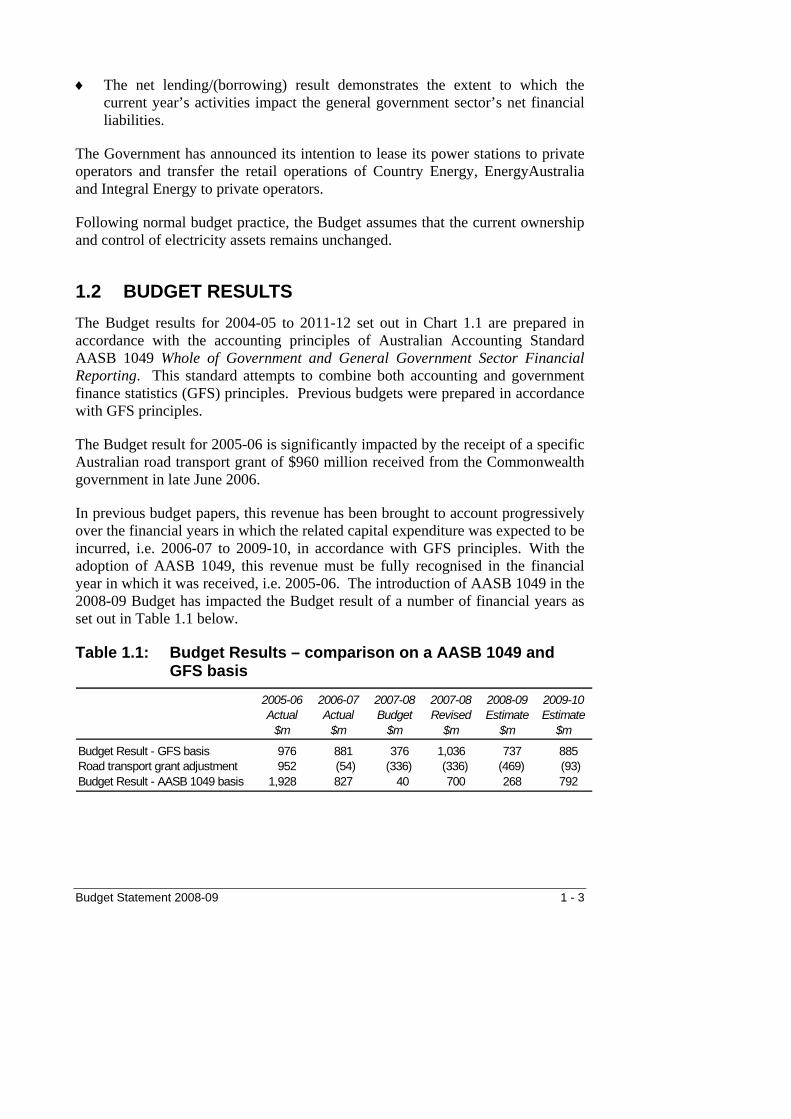
1.2 BUDGET RESULTS The Budget results for 2004-05 to 2011-12 set out in Chart 1.1 are prepared in accordance with the accounting principles of Australian Accounting Standard AASB 1049 Whole of Government and General Government Sector Financial Reporting. This standard attempts to combine both accounting and government finance statistics (GFS) principles. Previous budgets were prepared in accordance with GFS principles.
The Budget result for 2005-06 is significantly impacted by the receipt of a specific Australian road transport grant of $960 million received from the Commonwealth government in late June 2006.
In previous budget papers, this revenue has been brought to account progressively over the financial years in which the related capital expenditure was expected to be incurred, i.e. 2006-07 to 2009-10, in accordance with GFS principles. With the adoption of AASB 1049, this revenue must be fully recognised in the financial year in which it was received, i.e. 2005-06. The introduction of AASB 1049 in the 2008-09 Budget has impacted the Budget result of a number of financial years as set out in Table 1.1 below.
Table 1.1: Budget Results – comparison on a AASB 1049 and GFS basis
2005-06 2006-07 2007-08 2007-08 2008-09 2009-10Actual Actual Budget Revised Estimate Estimate
$m $m $m $m $m $m
Budget Result - GFS basis 976 881 376 1,036 737 885 Road transport grant adjustment 952 (54) (336) (336) (469) (93) Budget Result - AASB 1049 basis 1,928 827 40 700 268 792
Budget Statement 2008-09 1 - 3

Chart 1.1: Budget results 2004-05 to 2011-12
724827
268
792 775700
1,928
779
0
500
1,000
1,500
2,000
2004-05Actual
2005-06Actual
2006-07Actual
2007-08Revised
2008-09Budget
2009-10Estimate
2010-11Estimate
2011-12Estimate
$ m
illio
ns
Full details of the revenues and expenses underpinning these Budget results are set out in Table 1.2.
BUDGET RESULT FOR 2008-09 The Budget result for 2008-09 is expected to be a surplus of $268 million.
Revenue Total revenue for 2008-09 is estimated to be $47.9 billion. This is an increase of $1.5 billion or 3.2 per cent over the revised estimate for 2007-08.
Taxation revenue is expected to increase by $67 million to $18.5 billion in 2008-09, an increase of 0.4 per cent over 2007-08. This reflects a slowing in residential and commercial property market activity (which reduces transfer duty) due to higher interest rates; and the impact of policy changes including a reduction in payroll tax rates, indexation of payroll tax thresholds; and the abolition of mortgage duty on non-owner occupied residences and unquoted marketable securities.
Commonwealth general purpose grants are estimated to be $13 billion, an increase of 8 per cent over 2007-08. The growth results from increases in both the GST pool and New South Wales’ relative share of that pool. New South Wales continues to be short changed on the GST - generating an estimated $15 billion GST in New South Wales in 2008-09, yet getting back only $13 billion from the Commonwealth.
1 - 4 Budget Statement 2008-09
Commonwealth specific purpose grants of $7.2 billion in 2008-09 are expected to decrease by $291 million or 3.9 per cent over 2007-08, primarily due to some SPPs such as drought assistance no carrying through to 2008-09.
Other grants and contributions are expected to fall to $782 million from $1.1 billion, or by 25.7 per cent, compared with 2007-08. In 2007-08, the Tugun Bypass was completed and transferred to the NSW Government. Under the relevant accounting standards, the value of the capital expenditure incurred in 2007-08 by the Queensland Government is recognised as revenue to the NSW Government.
Sale of goods and services is expected to increase to $3.6 billion, an increase of 4.2 per cent over 2007-08. The increase relates mainly to health, education and road services. There are generally offsetting additional expenses associated with this revenue increase.
Interest income in 2008-09 is expected to be $706 million, which reflects anticipated long run average investment returns. This follows the significant reduction in 2007-08 to $162 million, arising from sharp falls in global financial markets.
Dividends and income tax equivalent payments are expected to decrease to $1.8 billion, a fall of 1.3 per cent from 2007-08. Higher payments from the property, resources and water sectors will be more than offset by lower payments from the electricity sector. The recent rise in interest rates is likely to significantly increase borrowing costs and thereby reduce profits for the electricity network businesses. A significant portion of their capital expenditure is debt funded.
Fines, regulatory fees and other revenue is estimated to increase by $354 million to $2.2 billion in 2008-09, an increase of 19.4 per cent over 2007-08. The increase is primarily due to higher mining royalties (up $400 million), arising from expected increases in the price for coal.
A comprehensive discussion of revenue estimates is in Chapter 4.
Expenses Total expenses for 2008-09 are estimated to be $47.6 billion. This is an increase of 4.2 per cent over the revised estimate for 2007-08.
Budget Statement 2008-09 1 - 5

Priorities in the 2008-09 Budget include:
Health – expanding mental health services, increasing acute care capacity, integrating primary health care facilities, implementing reform initiatives agreed by the Council of Australian Governments (COAG), further reducing elective surgery waiting times, investing in oral health, renal treatment and ambulance services, and continuing to expand nurse numbers and enhance their clinical expertise.
♦
♦
♦
♦
Education and Training – continued implementation of NSW Government election commitments including the Best Start initiative, Connected Classrooms, Support for Beginning Teachers, the Transition to Year 7 initiative, School Sport and the Training our Workforce and Learn or Earn initiatives.
Disability Services – improving options for people with disabilities, providing increased welfare and support for carers, and expanding prevention and early intervention services.
Aboriginal Affairs – community officers in 40 partnership communities to connect services to needs, further expansion of programs to raise awareness and prevention of child sexual assault, water and sewerage maintenance programs and the establishment of an evaluation and strategic planning unit in the Department of Aboriginal Affairs.
Employee expenses (excluding superannuation) are estimated to increase by $828 million over the 2007-08 revised estimate, an increase of 4.1 per cent. The Government’s wages policy is to limit the cost of future wage increases to 2.5 per cent per annum. The growth in expenses above this amount principally reflects additional key frontline service staffing numbers, including additional mental health professionals, nurses, ambulance operatives and acute care clinicians and the full year impact of wage increases granted in 2007-08.
Superannuation expenses are estimated to increase by $224 million over the 2007-08 revised estimate, a rise of 9.8 per cent. This is primarily due to the decline in the value of superannuation assets following negative investment returns in 2007-08 resulting in lower projected fund investment returns and therefore higher costs to the Government.
Depreciation and amortisation expenses are estimated to increase by $125 million or 5 per cent in line with the growth in fixed assets. Interest expenses are estimated to increase by $143 million or 11 per cent in line with the projected increase in borrowings and interest rates.
After allowing for the inclusion of the Treasurer’s Advance in 2008-09, other operating expenses are projected to increase by 6.6 per cent, reflecting the impact of a favourable movement in insurance expenses in 2007-08.
1 - 6 Budget Statement 2008-09

The Treasurer’s Advance provision is being increased from $215 million in 2007-08 to $300 million in 2008-09. This is to better provide for unforseen expenses that normally arise in any year. The new provision is only 0.6 per cent of total expenses.
Capital grants are estimated to be $2 billion, or $109 million below the 2007-08 revised estimate. A rail debt repayment associated with the Epping to Chatswood Rail Line of $390 million, which was budgeted to be paid in 2008-09, will now be repaid a year earlier in 2007-08. Offsetting this are additional expenses related to land transfers associated with the South West Rail Link ($84 million).
Further information on expense trends and budget initiatives is in Chapter 3. The details of general government agency level activity and expenses are provided in Budget Paper No. 3 Budget Estimates. 9
Table 1.2: General Government Sector Operating Statement
2006-07 2008-09 2009-10 2010-11 2011-12Actual (a) Budget (a) Revised Budget
$m $m $m $m $m $m $m
Revenue from TransactionsTaxation 17,697 17,553 18,466 18,533 19,194 20,034 20,923 Grant revenue
- Commonwealth - general purpose 10,938 11,926 12,060 13,020 13,972 14,738 15,547 - Commonwealth - specific purpose 6,815 6,854 7,540 7,249 7,875 8,195 8,346 - Other grants and contributions 1,021 812 1,053 782 781 870 903
Sale of goods and services 3,303 3,423 3,474 3,620 3,739 3,852 3,953 Interest income 1,239 720 162 706 742 781 818 Dividend and income tax equivalent
income from other sectors 1,925 1,766 1,820 1,796 1,957 2,002 2,121 Dividends from associates 29 ... ... ... 58 70 81 Fines, regulatory fees and other revenue 1,760 1,591 1,821 2,176 2,347 2,681 2,494
Total Revenue 44,727 44,645 46,396 47,882 50,665 53,223 55,186
Expenses from TransactionsEmployee expenses 18,773 20,034 20,237 21,065 22,155 22,846 23,766 Superannuation expenses
- Superannuation interest cost 749 501 420 598 601 524 513 - Other superannuation expenses 1,822 1,880 1,870 1,916 1,937 1,976 2,007
Depreciation and amortisation 2,308 2,429 2,478 2,603 2,791 2,940 3,067 Interest expenses 1,257 1,321 1,297 1,440 1,540 1,666 1,773 Other property expenses 2 ... 2 3 3 3 3 Other operating expenses(b) 8,724 9,268 9,160 10,064 10,205 10,650 10,885 Grant expenses
- Current grants and subsidies 7,426 7,531 8,161 7,963 8,107 8,452 8,586 - Capital grants 2,839 1,641 2,071 1,962 2,534 3,391 3,807
Total Expenses 43,900 44,605 45,696 47,614 49,873 52,448 54,407
BUDGET RESULT - SURPLUS/(DEFICIT)[Net Operating Balance] 827 40 700 268 792 775 779
Forward estimates2007-08
Budget Statement 2008-09 1 - 7

Table 1.2: General Government Sector Operating Statement (cont)
2006-07 2008-09 2009-10 2010-11 2011-12Actual (a) Budget (a) Revised Budget
$m $m $m $m $m $m $m
Other economic flows included in the operating resultOther revenue (dividends from asset sale proceeds) ... ... ... ... 147 ... ... Share of net profit/(loss) from associates excluding
dividends 7 97 100 114 66 50 43 Net actuarial superannuation gains/(losses)(c) 3,316 (169) (2,710) (79) (2,418) (121) (126) Other net gains/(losses) (191) (4) (87) (114) 40 125 152
Operating result (accounting basis) 3,959 (36) (1,997) 189 (1,373) 829 848
Other economic flows - other movements in equityRevaluations 2,470 822 928 911 1,165 1,041 1,076 Net gain/(loss) on equity investments in other sectors 3,833 871 2,803 1,584 2,443 2,931 3,376 Net gain/(loss) on financial instruments at fair value (590) ... 414 124 14 1 ... Other ... ... ... ... ... ... ...
Comprehensive result - total change in net worth(d) 9,672 1,657 2,148 2,808 2,249 4,802 5,300
KEY FISCAL AGGREGATES
Comprehensive result - total change in net worth(d) 9,672 1,657 2,148 2,808 2,249 4,802 5,300 Less: Net other economic flows 8,845 1,617 1,448 2,540 1,457 4,027 4,521
equals: Budget Result - net operating balance 827 40 700 268 792 775 779
less Net acquisition of non-financial assetsPurchase of non-financial assets 4,140 4,691 4,541 5,158 5,227 5,182 4,847 Sales of non-financial assets (499) (469) (527) (594) (632) (685) (657) less Depreciation (2,308) (2,429) (2,478) (2,603) (2,791) (2,940) (3,067) plus Change in inventories 36 (2) 4 (2) 12 2 (2) plus Other movements in non-financial assets
- assets acquired utilising finance leases 132 245 324 319 125 293 129 - other 346 16 246 15 141 (110) 140
equals Total Net acquisition of non-financial assets 1,847 2,052 2,110 2,293 2,082 1,741 1,390
equals Net Lending/(Borrowing) [Fiscal Balance] (1,020) (2,012) (1,410) (2,025) (1,290) (966) (611)
OTHER AGGREGATESCapital Expenditure (e) 4,272 4,937 4,865 5,477 5,352 5,475 4,976
2007-08Forward estimates
Notes
(a) Australian Accounting Standard AASB 1049 has been adopted for the first time for the 2008-09 Budget. Amounts prior to 2008-09 have been classified according to the new standard, where practicable. However, where some historic dissections have not been available, the financial information has been reported on a best available basis. The 2007-08 Budget column has been restated to reflect AASB 1049 treatments. The original GFS based Budget Result of $376million surplus is now restated to a $40 million surplus due to the GFS accrual treatment for Australian road transport grant revenue, which is recorded under AASB 1049 on a cash basis.
(b) Includes Treasurer’s Advance of $300 million per annum from 2008-09.
(c) In 2007-08, the major component relates to lower investment returns compared with the long term earnings assumption. In 2009-10, the major component results from a change in the superannuation discount rate from a forecast of 6.35 per cent in 2009 to a long term parameter of 5.85 per cent in 2010.
(d) Total change in net worth is before transactions with owners as owners and changes resulting from revisions to accounting policies. Therefore, it might not equal the movement in balance sheet net worth.
(e) Capital expenditure comprises purchases of non-financial assets plus assets acquired utilising finance leases.
1 - 8 Budget Statement 2008-09
BUDGET RESULTS FOR 2009-10 TO 2011-12 The budget result is expected to remain in surplus in the forward years with surpluses of $792 million in 2009-10, $775 million in 2010-11 and $779 million in 2011-12 (see Table 1.2).
Revenue Total revenue is forecast to increase at an average 4.8 per cent per annum over the three years to 2011-12.
Taxation revenue is expected to increase by an average of 4.1 per cent per annum. This reflects moderate growth in the property market and a return to trend growth for wages and employment. These factors are offset by the impact of the tax measures announced in this Budget i.e. reductions in the payroll tax rate, indexation of payroll tax thresholds and bringing forward the abolition of transfer duty on non-land business assets.
General purpose grants from GST revenues are projected to increase by an average of 6.1 per cent per annum due to continued steady growth in the GST pool and a projected relative improvement in New South Wales’ GST relativity.
Commonwealth specific purpose grants are expected to increase by an average of 4.8 per cent. This is in line with indexation and population growth estimates.
Interest income is expected to increase by an average of 5 per cent per annum, based on expectations of returning to long term investment earning rates.
Dividends and income tax equivalent revenues are projected to grow by an average of 5.7 per cent per annum, mainly within the electricity network (transmission and distribution) businesses. This is in expectation that the Australian Energy Regulator will allow a return on an increasing asset base arising from a growing capital program over that period.
Expenses Total expenses are forecast to increase at an average 4.5 per cent per annum over the three years to 2011-12.
Employee-related expenses are estimated to increase by an average 4.1 per cent. This is based on the expectation that wages growth will be constrained within the government’s policy of 2.5 per cent per annum and on expected growth in numbers of key frontline services. For example, the Government has provided for year-on-year increases in the number of hospital beds, resulting in additional doctors, nurses and allied health staff to be employed to meet this additional demand.
Budget Statement 2008-09 1 - 9
Superannuation expenses are expected to remain at broadly the same levels over the forward estimates period, reflecting an increase in the membership of accumulation schemes, offset by a reduction the number of members in the Defined Benefit Scheme.
Depreciation and amortisation expenses are estimated to increase by 5.6 per cent in line with the growth in fixed assets.
Interest expenses are estimated to increase by 7.2 per cent, which is in line with the growth in borrowings and changes in the effective interest rate of debt.
Capital grants will increase significantly in the forward estimates period, by an average of 24.7 per cent. This is primarily within the rail sector, representing funding for the recently announced North West Metro and South West Rail Link. Additional funding of $530 million has been provided in 2009-10 to retire debt incurred to finance the Clearways program.
BUDGET RESULT FOR 2007-08 The Budget result for 2007-08 is estimated to be a surplus of $700 million compared with an estimated surplus of $170 million at the time of the Half-Yearly Budget Review, and a budgeted surplus of $40 million (see Table 1.3). In the absence of the rail debt repayment brought forward from 2008-09, the Budget result for 2007-08 would have been a surplus of $1.1 billion or $1.4 billion under GFS principles.
The 2007-08 Budget Papers and Half-Yearly Budget Review were prepared in accordance with government finance statistics (GFS) principles. The 2008-09 Budget papers have been prepared in accordance with the new Australian Accounting Standard AASB 1049 Whole of Government and General Government Sector Financial Reporting.
The 2007-08 Budget estimates in these budget papers have been restated in accordance with Australian Accounting Standard AASB 1049 principles, to facilitate comparison of budget results.
The impact of this restatement is to reduce the budgeted surplus for 2007-08 in the 2007-08 budget papers from $376 million to $40 million and in the 2007-08 Half-Yearly Budget Review from $506 million to $170 million. This is because Commonwealth funds received in 2005-06 for the Hume and Pacific Highways are treated as revenue in the year of receipt (i.e. 2005-06) under AASB 1049, whereas previously, under GFS principles, these grants are treated as revenue when the related capital expenditure is incurred (budgeted to be $336 million in 2007-08).
1 - 10 Budget Statement 2008-09
Revenue Total revenue for 2007-08 is projected to be $46.4 billion, $1.8 billion above the budget estimate of $44.6 billion.
Taxation revenue is estimated to be $913 million above the 2007-08 budget estimate of $17.6 billion. The principal reasons for this variance are:
Transfer duty receipts are higher by $394 million, due to a significant, albeit temporary, increase in residential property prices and volumes, primarily in the premium property market.
♦
♦
♦
Payroll tax revenue is $190 million higher due to stronger than expected wage and employment growth.
Land tax revenue is higher by $218 million, due to a larger number of land tax assessments processed for the 2007 year and higher land value growth, particularly for high value properties.
GST revenue grants are estimated to be above budget by $134 million due to an increase in the Commonwealth’s estimate of the GST revenue pool.
Commonwealth specific purpose grants are estimated to exceeded budget by $686 million primarily from new grants and increases in existing grant programs. New grants include: Groundwater Adjustments ($79 million), various educational COAG programs ($57 million), Equine Influenza ($49 million) and The Living Murray program ($35 million).
Increases in existing programs include Exceptional Circumstances Grants ($205 million) for drought relief and the Australian Health Care Agreement ($165 million). These revenues are generally offset by corresponding increases in expenses.
Other grants and contributions are expected to be higher than budget by $241 million. This is mainly due to the completion and transfer of the Tugun Bypass by the Queensland Government.
Offsetting the revenue increases noted above, interest income is estimated to be $558 million below budget, due to the significant falls in financial markets during 2007-08.
Budget Statement 2008-09 1 - 11
Expenses Total expenses in 2007-08 are projected to be $45.7 billion, which is higher than budget by $1.1 billion.
The additional Commonwealth grants of $686 million noted above broadly have a corresponding increase in expenses.
The stronger than expected budget position in 2007-08 allowed the government to repay debt of $390 million associated with the Epping to Chatswood Rail Line in 2007-08, rather than as anticipated in 2008-09.
A rigorous expenditure review process ensured that agencies’ expenses were largely constrained within budget, including the delivery of around $300 million in additional efficiency dividends.
During the year, the Government sought additional appropriations for: the expansion of contracted private buses ($6 million), higher expenditure on out-of-home care allowances ($34.8 million), additional school teaching costs ($26.6 million), additional hospital beds ($10 million) and New South Wales’ share of National Equine Influenza Response Plan costs ($1.2 million).
A detailed agency by agency analysis of expected variances to the 2007-08 Budget estimates is included at Appendix D.
1 - 12 Budget Statement 2008-09
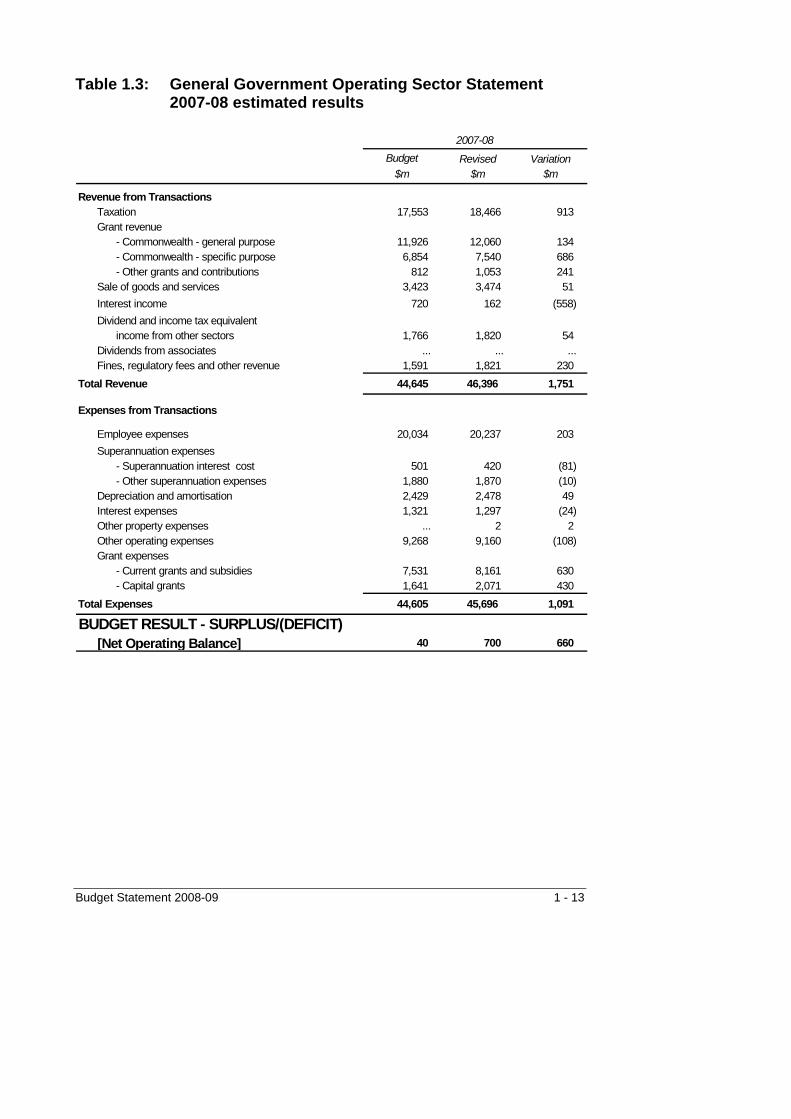
Table 1.3: General Government Operating Sector Statement 2007-08 estimated results
Budget Revised Variation$m $m $m
Revenue from TransactionsTaxation 17,553 18,466 913 Grant revenue
- Commonwealth - general purpose 11,926 12,060 134 - Commonwealth - specific purpose 6,854 7,540 686 - Other grants and contributions 812 1,053 241
Sale of goods and services 3,423 3,474 51 Interest income 720 162 (558) Dividend and income tax equivalent
income from other sectors 1,766 1,820 54 Dividends from associates ... ... ... Fines, regulatory fees and other revenue 1,591 1,821 230
Total Revenue 44,645 46,396 1,751
Expenses from Transactions
Employee expenses 20,034 20,237 203 Superannuation expenses
- Superannuation interest cost 501 420 (81) - Other superannuation expenses 1,880 1,870 (10)
Depreciation and amortisation 2,429 2,478 49 Interest expenses 1,321 1,297 (24) Other property expenses ... 2 2 Other operating expenses 9,268 9,160 (108) Grant expenses
- Current grants and subsidies 7,531 8,161 630 - Capital grants 1,641 2,071 430
Total Expenses 44,605 45,696 1,091
BUDGET RESULT - SURPLUS/(DEFICIT)[Net Operating Balance] 40 700 660
2007-08
Budget Statement 2008-09 1 - 13

OPERATING RESULTS, COMPREHENSIVE RESULTS AND NET LENDING RESULTS FOR 2007-08 TO 2011-12
The principal focus of these budget papers in assessing the financial performance of the general government sector is the Budget result or net operating balance.
The general government sector operating statement, at Table 1.2, prepared in accordance with Australian Accounting Standard AASB 1049 discloses other aggregates.
The operating results for the period 2007-08 to 2011-12 are broadly consistent with the Budget results except for 2007-08 and 2009-10, when operating losses of $2 billion and $1.4 billion respectively are expected to be incurred.
In 2007-08 higher superannuation liabilities follow negative investment returns due to the global credit crisis and sub prime failures in the United States. In 2009-10, superannuation liabilities increase sharply reflecting a decrease in the discount rate used to estimate liabilities from a forecast of 6.35 per cent in 2009 to a longer term parameter estimate of 5.85 per cent.
Without these superannuation revaluations the results for 2007-08 and 2009-10 would also have been broadly similar to the Budget result.
The comprehensive results are strongly in surplus for all of the years from 2007-08 to 2011-12, ranging from $2.1 billion in 2007-08 to $5.3 billion in 2011-12. This is a result of the Budget surpluses and the impact of anticipated revaluations of both land and other fixed assets and investments in PTEs.
The net lending result is expected to be in deficit in all the years from 2007-08 to 2011-12. In 2007-08 net lending result will be a deficit of $1.4 billion, rising to $2 billion in 2008-09 and averaging $956 million per annum in the forward years.
The net lending deficits reflect the fact that the Government is partly funding its record capital expenditure program through increased borrowings.
1 - 14 Budget Statement 2008-09
1.3 CAPITAL EXPENDITURE
Chart 1.2: Capital Expenditure 2004-05 to 2011-12
5,477 5,352 5,475
3,331
4,272
3,949
4,865 4,976
0
500
1,000
1,500
2,000
2,500
3,000
3,500
4,000
4,500
5,000
5,500
6,000
2004-05Actual
2005-06Actual
2006-07Actual
2007-08Revised
2008-09Budget
2009-10Estimate
2010-11Estimate
2011-12Estimate
$ m
illio
ns
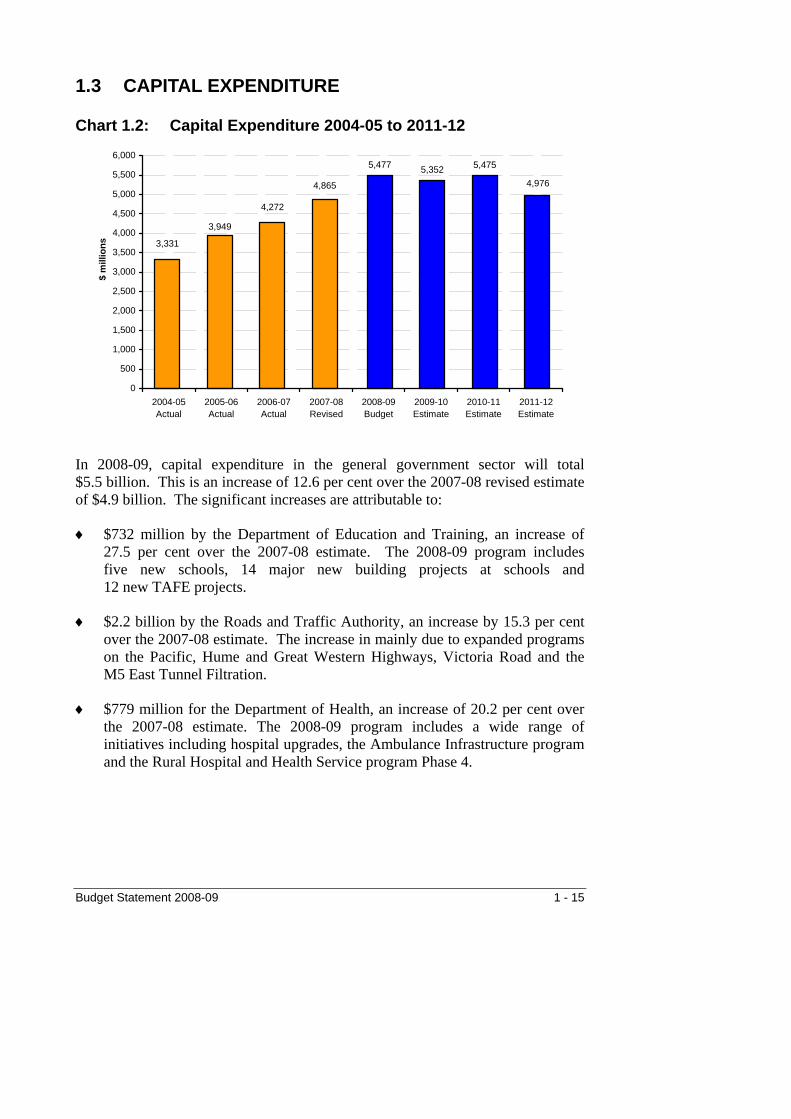
In 2008-09, capital expenditure in the general government sector will total $5.5 billion. This is an increase of 12.6 per cent over the 2007-08 revised estimate of $4.9 billion. The significant increases are attributable to:
$732 million by the Department of Education and Training, an increase of 27.5 per cent over the 2007-08 estimate. The 2008-09 program includes five new schools, 14 major new building projects at schools and 12 new TAFE projects.
♦
♦
♦
$2.2 billion by the Roads and Traffic Authority, an increase by 15.3 per cent over the 2007-08 estimate. The increase in mainly due to expanded programs on the Pacific, Hume and Great Western Highways, Victoria Road and the M5 East Tunnel Filtration.
$779 million for the Department of Health, an increase of 20.2 per cent over the 2007-08 estimate. The 2008-09 program includes a wide range of initiatives including hospital upgrades, the Ambulance Infrastructure program and the Rural Hospital and Health Service program Phase 4.
Budget Statement 2008-09 1 - 15

The Minister Administering the Environmental Planning and Assessment Act will have a capital program of $233 million in 2008-09, compared to $130 million in 2007-08, for the Sydney Regional Development Fund, an increase of 79.2 per cent. This principally reflects the ongoing purchase of rail corridors for the North West Metro and South West Rail Link.
♦
In the four years to June 2012, capital expenditure in the general government sector is expected to total $21.3 billion, an increase of 29.6 per cent or $4.9 billion over spending in the previous four year period.
The details of general government agency capital expenditure and projects are contained in Budget Paper No. 4 Infrastructure Statement.
1.4 BALANCE SHEET The general government balance sheet (Table 1.4) is currently strong. Net debt and net financial liabilities will increase over the next four years to fund the Government’s record capital expenditure program. However, they will remain at sustainable levels and below the levels of the early to mid-1990s.
Net debt Net debt is estimated to be $5 billion (1.4 per cent of gross state product) in June 2008 and to increase to $7.8 billion (1.7 per cent of GSP) in June 2012. The increase in net debt reflects an expanded capital works program.
Discussion of the Government’s fiscal strategy, including a comprehensive assessment of the Government’s performance against its fiscal targets, is set out in Chapter 2.
Net financial liabilities Net financial liabilities include the full range of the general government sector’s financial obligations (including debt, unfunded superannuation liabilities, insurance liabilities and employee-related liabilities) less its financial assets (including cash and investments).
Net financial liabilities are estimated to be $29.3 billion (8.2 per cent of GSP) in June 2008 and increase to $36.5 billion by June 2012. However, this represents a decrease from 8.2 per cent of GSP at June 2008 to 8 per cent at June 2012.
The record levels of capital expenditure contribute to the increase in net financial liabilities.
1 - 16 Budget Statement 2008-09
In addition, superannuation liabilities are expected to increase between June 2007 and June 2008 due to the impact of negative investment returns in 2007-08 arising from the significant falls in financial markets. These liabilities will also increase between June 2009 and June 2010 because the discount rate used to value them decreases from 6.35 per cent in 2009 to a long term parameter estimate of 5.85 per cent.
Net worth Net worth is estimated to be $139 billion at June 2008, an increase of $2.2 billion on the $136.8 billion at June 2007.
Net worth is then estimated to increase significantly over 2008-09 and the forward estimates period so that by June 2012 it is estimated to be $154.6 billion.
The significant increase in net worth reflects record levels of capital expenditure as well as the impact of cyclical revaluations of assets by agencies.
A comprehensive analysis of assets, liabilities and net worth is included in Chapter 6.
Budget Statement 2008-09 1 - 17

Table 1.4: General Government Sector Balance Sheet June 2007 June 2009 June 2010 June 2011 June 2012
Actual Budget Revised Budget$m $m $m $m $m $m $m
ASSETS
Financial AssetsCash and deposits 2,421 2,933 2,451 2,681 2,985 3,371 3,818 Advances paid 795 894 861 908 912 924 922
7,165 7,042 6,417 7,014 7,517 8,063 8,661 Receivables 11,193 9,757 10,570 10,217 10,515 10,527 10,649 Equity investments
in other public sector entities 68,040 67,770 70,842 72,426 74,870 77,801 81,177 accounted for using the equity method 1,519 1,662 1,619 1,733 1,799 1,849 1,892 in other entities 4 4 4 4 4 4 4
Total Financial Assets 91,137 90,062 92,764 94,983 98,602 102,539 107,123
Non-financial AssetsLand and other fixed assets
Inventories 173 156 177 176 187 189 188 Property, plant, equipment and infrastructure 91,599 94,161 94,247 97,306 100,215 103,095 105,724 Investment property 312 398 356 356 356 356 356 Assets held for sale 208 176 170 133 179 153 106 Biological assets 6 ... 6 6 6 6 6 Intangible (produced) assets 545 556 723 960 1,145 1,193 1,167
Other non-financial assetsIntangible (non-produced) assets ... 12 ... ... ... ... ... Other (non-financial assets) 1,587 1,467 1,734 1,884 2,040 2,183 2,337
Total Non-financial Assets 94,430 96,926 97,413 100,821 104,128 107,175 109,884
Total Assets 185,567 186,988 190,177 195,804 202,730 209,714 217,007
LIABILITIESDeposits held 92 39 67 77 76 76 76 Advances received 892 865 865 836 807 778 748 Borrowing 12,705 15,297 13,775 15,881 17,453 18,971 20,386 Superannuation 14,363 16,441 17,126 17,389 19,921 20,016 20,024 Other employee benefits 8,402 8,621 8,814 8,995 9,301 9,506 9,699 Payables 3,013 2,231 2,415 2,457 2,546 2,634 2,738 Other provisions 5,071 5,135 4,807 4,959 5,168 5,391 5,618 Other liabilities 4,254 1,992 3,316 3,299 3,244 3,196 3,168
Total Liabilities 48,792 50,621 51,185 53,893 58,516 60,568 62,457
NET ASSETS 136,775 136,367 138,992 141,911 144,214 149,146 154,550
NET WORTH Accumulated funds 100,885 100,065 102,318 104,230 105,383 109,301 113,657 Reserves 35,890 36,302 36,674 37,681 38,831 39,845 40,893
NET WORTH 136,775 136,367 138,992 141,911 144,214 149,146 154,550
OTHER KEY AGGREGATESNet Financial Worth 42,345 39,441 41,579 41,090 40,086 41,971 44,666 Net Financial Liabilities 25,695 28,329 29,263 31,336 34,784 35,830 36,511 Net Debt 3,308 5,332 4,978 6,191 6,922 7,467 7,809
Forward estimates
Investments, loans and placements
June 2008
1 - 18 Budget Statement 2008-09

1.5 CASH FLOW The general government sector is expected to incur cash deficits in all four years from 2008-09 to 2011-12. The deficit is estimated to be $811 million in 2008-09 and to average $397 million in the three subsequent years.
The deficits principally arise from the impact of the record levels of capital expenditure and broadly mirror the growth in net debt.
It is also expected that there will be a cash deficit of $1.4 billion in 2007-08, although this is lower than the budgeted deficit of $1.7 billion, principally because of better than expected revenues.
The general government sector cash flow statements are set out in Table 1.5.
Budget Statement 2008-09 1 - 19

Table 1.5: General Government Sector Cash Flow Statement
2006-07 2008-09 2009-10 2010-11 2011-12Actual Budget Revised Budget
$m $m $m $m $m $m $m
Cash Receipts from Operating ActivitiesTaxes received 17,467 17,569 18,139 19,063 19,195 20,052 20,968 Receipts from sales of goods and services 3,420 3,692 3,820 3,921 4,069 4,221 4,258 Grants and subsidies received 18,158 19,249 20,060 20,716 22,304 23,396 24,359 Interest receipts 1,332 786 196 774 815 857 907 Dividends and income tax equivalents 1,697 1,497 1,870 1,710 1,872 1,997 2,005 Other Receipts 3,791 3,461 3,774 3,975 4,137 4,525 4,454
Total Cash Receipts from Operating Activities 45,865 46,254 47,859 50,159 52,392 55,048 56,951
Cash Payments from Operating ActivitiesPayments for employees (27,139) (22,033) (22,095) (23,260) (24,296) (25,195) (26,212) Payments for goods and services (10,391) (10,857) (11,237) (11,657) (11,800) (12,235) (12,519) Grants and subsidies paid (8,494) (7,384) (8,317) (7,904) (8,702) (9,621) (10,367)Interest paid (859) (956) (962) (1,004) (1,077) (1,173) (1,248)Other payments (2,730) (2,546) (2,635) (2,581) (2,581) (2,633) (2,635)
Total Cash Payments from Operating Activities (49,613) (43,776) (45,246) (46,406) (48,456) (50,857) (52,981)
Net Cash Flows from Operating Activities (3,748) 2,478 2,613 3,753 3,936 4,191 3,970
Cash Flows from Investments in Non-Financial Assetsfor Policy Purposes
Sales of Non-Financial Assets 524 487 547 595 633 686 658 Purchases of Non-Financial Assets (4,116) (4,695) (4,551) (5,159) (5,230) (5,185) (4,850)
Net Cash Flows from Investments in Non-Financial Assets (3,592) (4,208) (4,004) (4,564) (4,597) (4,499) (4,192)
Cash Flows from Investments in Financial Assetsfor Policy Purposes
Receipts 290 148 123 195 294 197 181 Payments (51) (90) (111) (251) (156) (64) (62)
Total Cash Flows from Investments inFinancial Assets for Policy Purposes 239 58 12 (56) 138 133 119
Net Flows from Investments in Financial Assetsfor Liquidity Purposes
Receipts 8,431 584 802 121 146 185 162 Payments (1,690) (545) (136) (738) (674) (729) (760)
Net Cash Flows from Investments inFinancial Assets for Liquidity Purposes 6,741 39 666 (617) (528) (544) (598)
Estimate2007-08
1 - 20 Budget Statement 2008-09

Budg
Table 1.5: General Government Sector Cash Flow Statement (cont)
et Statement 2008-09
2006-07 2008-09 2009-10 2010-11 2011-12Actual Budget Revised Budget
$m $m $m $m $m $m $m
Cash Flows from Financing ActivitiesAdvances received ... ... ... ... ... ... ... Advances repaid (46) (51) (49) (51) (51) (56) (55) Proceeds from borrowings 537 2,614 1,540 2,237 1,866 1,707 1,766 Repayments of borrowings (153) (207) (798) (482) (457) (544) (562) Deposits received (net) 16 ... (26) 9 (2) (1) (1) Other financing (net) ... ... ... ... ... ... ...
Net Cash Flows fromFinancing Activities 354 2,356 667 1,713 1,356 1,106 1,148
Net Increase/(Decrease) in(6) 723 (46) 229 305 387 447
Cash and Cash Equivalents at beginning of year 2,449 2,210 2,421 2,451 2,681 2,985 3,371 Reclassifications of cash and cash equivalents (22) ... 76 1 (1) (1) ...
Cash and Cash Equivalents at end of year 2,421 2,933 2,451 2,681 2,985 3,371 3,818
Derivation of the Cash Result
Net cash flows from operating activities (3,748) 2,478 2,613 3,753 3,936 4,191 3,970 Net Cash Flows from Investments in
Non-Financial Assets (3,592) (4,208) (4,004) (4,564) (4,597) (4,499) (4,192)
Cash Surplus/(Deficit) (7,340) (1,730) (1,391) (811) (661) (308) (222)
Impact of deferred superannuationcontributionsLiability Management Fund 5,308 ... ... ... ... ... ...
Adjusted Surplus/(Deficit) (2,032) (1,730) (1,391) (811) (661) (308) (222)
Estimate
Cash held
2007-08
1 - 21
1 - 22 B
udget Statem
ent 2008-09
YearAsset Acquisitions
Asset Sales
SuperannuationAdjustments
Outlays$m
Receipts$m
Result$m
Outlays ( b )
$mReceipts
$mResult
$mPayments (c)
$mReceipts
$mResult
$m $m (d) $m $m (e)
1992-93 16,748 16,749 1 2,892 1,776 (1,116) (1,115) 1993-94 17,069 18,178 1,109 3,315 1,310 (2,005) (896) 1994-95 17,819 19,122 1,303 2,941 1,048 (1,893) (590) 1995-96 18,325 20,417 2,092 3,175 936 (2,239) ... (147) 1996-97 19,717 22,100 2,383 3,316 1,086 (2,230) ... 153 1997-98 24,635 26,807 2,172 (2,476) 522 ... 218 1998-99 29,231 28,596 (636) (2,496) 784 3,266 918 1999-2000 26,440 30,459 4,018 (2,483) 626 (1,005) 1,156 2000-01 28,412 32,757 4,345 (2,609) 344 (1,058) 1,022 2001-02 29,646 34,738 5,092 (2,766) 424 (1,134) 1,616 2002-03 31,569 37,002 5,433 (3,078) 498 (1,651) 1,202 2003-04 34,360 38,779 4,419 (2,915) 407 (1,200) 711 2004-05 36,094 40,249 4,155 (3,097) 484 (1,150) 392 2005-06 38,826 44,485 5,659 (3,859) 430 (1,307) 923 2006-07 49,613 45,865 (3,748) (4,116) 524 5,308 (2,032) 2007-08 (est) 45,246 47,859 2,613 (4,551) 547 ... (1,391) 2008-09 (est) 46,406 50,159 3,753 (5,159) 595 ... (811) 2009-10 (est) 48,456 52,392 3,936 (5,230) 633 ... (661) 2010-11 (est) 50,857 55,048 4,191 (5,185) 686 ... (308) 2011-12 (est) 52,981 56,951 3,970 (4,850) 658 ... (222)
Current Capital Cash Flows from Operating ActivitiesUnderlying
Surplus/ (Deficit)
$m
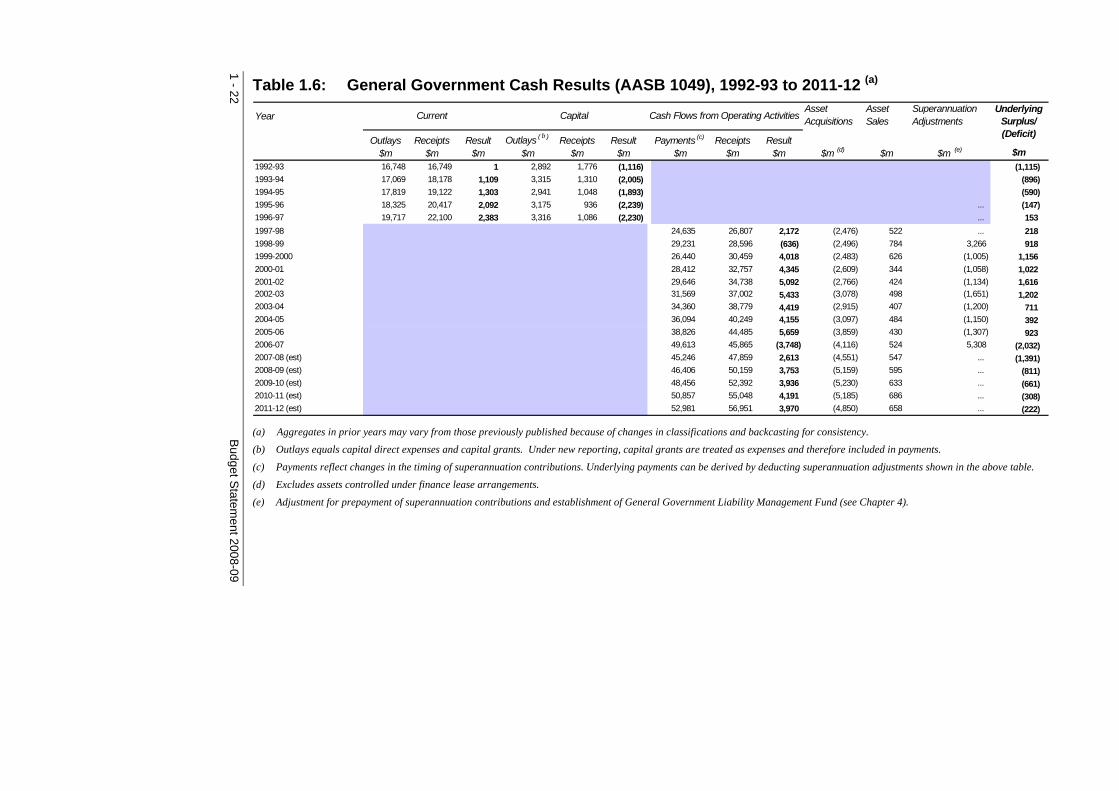
(c) Payments reflect changes in the timing of superannuation contributions. Underlying payments can be derived by deducting superannuation adjustments shown in the above table.
(b) Outlays equals capital direct expenses and capital grants. Under new reporting, capital grants are treated as expenses and therefore included in payments.
(e) Adjustment for prepayment of superannuation contributions and establishment of General Government Liability Management Fund (see Chapter 4).
Table 1.6: General Government Cash Results (AASB 1049), 1992-93 to 2011-12 (a)
(a) Aggregates in prior years may vary from those previously published because of changes in classifications and backcasting for consistency.
(d) Excludes assets controlled under finance lease arrangements.
1.6 KEY BUDGET RISKS Each year the annual budget is framed around government policy and priorities as well as economic and other parameters for the immediate and medium-term. Any change to the underlying assumptions represents a risk that may vary the anticipated budget outcomes. The risks may be economic, policy or demand driven and include unforeseen events such as natural disasters.
Wages growth The most significant risk relates to public sector wages growth. Employee related costs are the largest component of total expenses. In 2008-09, employee related costs are budgeted at 49.5 per cent of total general government expenses. Employee-related costs rise if wages rise, numbers employed rise or the average grading of employees increases. Each 1 per cent increase in employee related costs permanently increases government expenses by around $240 million per annum.
The large occupational groups (e.g. teachers, nurses, and police) are covered by wage agreements that have begun to expire after February 2008. Following their expiry, the Government’s policy is to allow for wage increases of 2.5 per cent per annum, with increases above 2.5 per cent tied to negotiated productivity. Agencies are funded for wage increases of 2.5 per cent.
During 2007-08, wage outcomes were negotiated consistent with the wages policy. It is expected that wages outcomes negotiated in 2008-09 will be consistent with the policy. Further details of the Government’s wages policy are set out in Chapter 2.
The Economy and revenue The main State taxes–payroll tax and transfer duty–are sensitive to economic factors. Employment levels and wage rates affect payroll tax collections. Transfer revenue is sensitive to the property cycle–both the value and volume of property transactions have a significant impact. These two taxes represent around 55 per cent of total tax revenue.
The economic risks to these and other budget outcomes are discussed in detail in Chapter 9.
Budget Statement 2008-09 1 - 23
Efficiency dividends Since 2005-06, the Government has required efficiency improvements from general government agencies. The aim is to develop a culture where agencies continue to revisit their operations and activities so that services are maintained but in the most efficient and cost effective way possible.
As outlined in the Government’s February 2006 Economic and Financial Statement, an efficiency dividend of approximately $300 million (around 1 per cent of agency controllable expenses) has been applied each year. The cumulative total of savings achieved from 2005-06 to 2007-08 will be around $1.7 billion. Budget outcomes are predicated on agencies continuing the efficiency improvement focus.
Specific purpose payments Specific purpose payments (SPPs) from the Commonwealth provide both revenue and expense side risks to Budget outcomes.
Typically SPPs have had matching State funding requirements and Commonwealth funding is contingent on compliance with certain conditions. Following the election of the new Federal Government in November 2007, the way these payments are allocated and reported is undergoing significant reform. SPPs will move from being input-focussed to outcomes-focussed. This refocussing on outcomes should provide greater certainty to state governments as well as improved services. The Commonwealth has guaranteed that these changes will occur “without a reduction in total Commonwealth funding for these activities”. Further details on the reforms are contained in Chapter 8.
While New South Wales is fully committed to working with the Commonwealth to support the reforms, the developments in Commonwealth-State financial arrangements will need to be carefully monitored and assessed in terms of risks to Budget outcomes. In 2008-09, SPPs total $7.2 billion or 15.1 per cent of total revenue.
Contingencies The Treasurer’s Advance provides for contingencies such as those associated with natural disasters and the costs of policy responses that may be required in the budget year. A separate Treasurer’s Advance is provided for capital works. In 2008-09, the Treasurer’s Advance is $300 million for recurrent services, and $100 million for capital works and services. To the extent that unanticipated expenditures are funded from the Treasurer’s Advance, there will be no effect on budget outcomes.
1 - 24 Budget Statement 2008-09
CHAPTER 2: FISCAL STRATEGY AND OUTLOOK
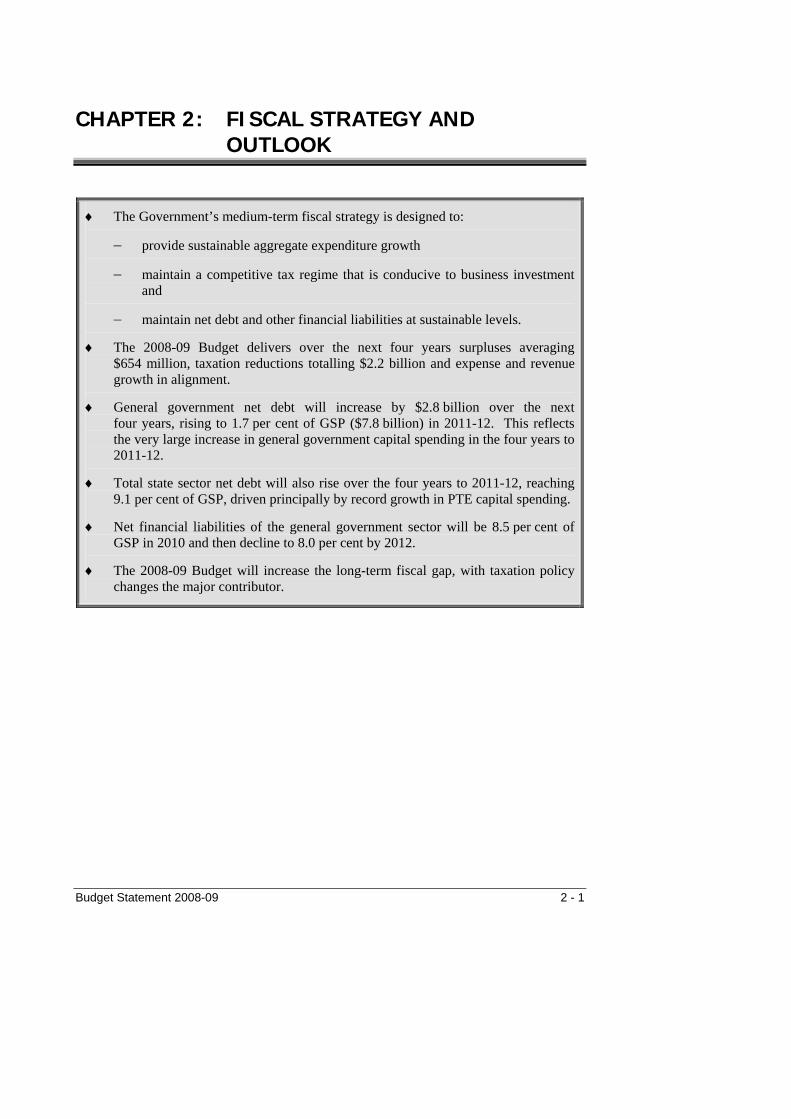
♦ The Government’s medium-term fiscal strategy is designed to:
− provide sustainable aggregate expenditure growth
− maintain a competitive tax regime that is conducive to business investment and
− maintain net debt and other financial liabilities at sustainable levels.
♦ The 2008-09 Budget delivers over the next four years surpluses averaging $654 million, taxation reductions totalling $2.2 billion and expense and revenue growth in alignment.
♦ General government net debt will increase by $2.8 billion over the next four years, rising to 1.7 per cent of GSP ($7.8 billion) in 2011-12. This reflects the very large increase in general government capital spending in the four years to 2011-12.
♦ Total state sector net debt will also rise over the four years to 2011-12, reaching 9.1 per cent of GSP, driven principally by record growth in PTE capital spending.
♦ Net financial liabilities of the general government sector will be 8.5 per cent of GSP in 2010 and then decline to 8.0 per cent by 2012.
♦ The 2008-09 Budget will increase the long-term fiscal gap, with taxation policy changes the major contributor.
Budget Statement 2008-09 2 - 1

2.1 INTRODUCTION The Fiscal Responsibility Act 2005 sets out both medium-term and long-term fiscal targets and principles for budgeting in New South Wales. In addition, maintaining a Triple A credit rating is a priority of the State Plan (P5). It is within this legislative and government policy framework that the budget is set each year.
The budget estimates extend over the immediate four year time horizon. However, the medium-term nature of the fiscal strategy is important because there are fiscal pressures looming beyond this period – notably the economic and budgetary effects of an ageing population. These pressures need to be taken into account to ensure that key services being delivered today remain affordable over the medium term.
The Government’s medium-term fiscal strategy is designed to:
provide sustainable aggregate expenditure growth ♦
♦
♦
maintain a competitive tax regime that is conducive to business investment and
maintain net debt and other financial liabilities at sustainable levels.
2.2 FISCAL STRATEGY The Government’s fiscal policy is medium-term in its focus and emphasises fiscal sustainability and a strong balance sheet. The objective is to maintain the State’s finances in such a condition that they can support a consistent growth in services through time in the face of any economic and fiscal shocks that may arise. For example, expenditure decisions made in times of strong revenue growth need to remain affordable in times of weaker revenue growth. A key focus of the fiscal strategy, therefore, is to align the growth rate of expenses with the growth rate of revenues that will be sustainable in the long run. A strong balance sheet can absorb short-term differences in timing between expenses and revenues, such as the effects of weaker cyclical revenues. A strong balance sheet can also provide time for structural adjustment to increases in expenses and capital spending or lower revenues.
The balance sheet is now considerably stronger than it was in the mid-1990s, which puts the State in a much better position to handle both unexpected developments and the pressures that can be reasonably anticipated to emerge over the medium-term. However, the Budget has come under pressure in recent years, with strong growth in expenses in key areas such as health, transport, community services and police and justice, and a substantial increase in capital expenditure.
2 - 2 Budget Statement 2008-09

As capital expenditure has to be funded from operating surpluses, asset sales or borrowing, there are tensions between increases in the level of capital expenditure and operating expenses. For any given balance sheet constraint, increased expenditure on capital needs to be weighed up in terms of expenditure foregone on other services. The State’s fiscal strategy is designed to manage the balance between spending on capital and operating expenses in a way that does not present a potential threat to the State’s Triple A credit rating.
Chart 2.1 illustrates how expense growth in some key policy areas has been consistently exceeding overall expense growth. Spending on health, which accounts for over a quarter of the total NSW Budget, has risen substantially, growing by an average of 7 per cent a year over the four years to 2007-08 as the Government met its commitment to increase public access to quality health care. Public transport spending has increased by around 5.5 per cent a year over the four years to 2007-08 – in line with total expenses – and is expected to increase sharply over the coming four years, reflecting increased financial support for bus reform and rail services. Spending by the Department of Community Services has increased by an average of 11 per cent a year in the four years to 2007-08 as the Government dealt with a significant increase in child protection reports.
Chart 2.1: Selected agency expense growth rates – four year average
0
2
4
6
8
10
12
14
2004-05 2005-06 2006-07 2007-08
Per c
ent
0
2
4
6
8
10
12
14
Department of Health Ministry of Transport DOCs Total Expenses
Budget Statement 2008-09 2 - 3
The Government responded to these increased spending pressures by introducing efficiency dividends, implementing a wages policy that will limit the cost of future wage increases to 2.5 per cent and delivering State Plan priorities within a budget-neutral framework. Notwithstanding these efforts, fiscal pressures will continue to mount with ongoing expenditure pressures, particularly in transport, and medium-term tax competition pressures requiring tax reductions to ensure New South Wales remains competitive with other jurisdictions.
Looking forward, expense pressures are set to intensify with the fiscal impact of the ageing of the population strengthening in the period beyond the forward estimates, with the population aged 65 and over increasing at double recent rates from 2011. The existing trend for health care costs to grow faster than the economy and revenues is expected to intensify thereafter, and the demand for improvements in the level of government services will grow as living standards continue to rise.
In addition, a slow down in the growth in the working age population, and consequently employment and gross state product (GSP) growth, can be expected to slow the growth of revenues. The combined effects of these anticipated trends in expenses and revenues will place the budget under pressure. It also brings into sharp focus the current and prospective expenditure and revenue responsibilities of the Commonwealth and the States/Territories. Current structural arrangements are unsustainable in the long run.
A significant factor in the fiscal outlook is the Government’s infrastructure program, to be detailed in the 10 year State Infrastructure Strategy (SIS). Total infrastructure spending over the four years to 2007-08 increased by 47 per cent, and is set to increase by a further 58 per cent over the four years to 2011-12. Public trading enterprise (PTE) sector spending is forecast to increase by more than 80 per cent and general government sector spending by 30 per cent. Beyond the forward estimates the capital program includes high levels of expenditure on the planned North West Metro and other rail network investments. Non-commercial PTE capital spending (principally rail), and general government capital spending, both need to be funded through budget surpluses and/or higher debt.
2 - 4 Budget Statement 2008-09

The Government has developed new budget processes to provide greater scrutiny and risk management of the capital program. These processes provide a whole-of-government planning and prioritisation of infrastructure plans over a medium-term (10 year) time horizon. They incorporate a new Infrastructure Review that considers agencies’ 10 year Total Asset Management (TAM) plans within projected funding limits and allows the Government to consider major upcoming infrastructure priorities and risks early in the planning process. The results of the Infrastructure Review then feed into the annual budget process to provide a medium-term planning and fiscal context for considering final project funding approvals.
The new SIS budget process thus provides a link between long-term planning strategies and final project approvals, and assists Treasury, service-delivery agencies and the Government through a clearer understanding of infrastructure needs and funding constraints over the medium term.
A significant decision impacting upon the State’s medium-term capital requirements was the Government’s announcement last year to sell electricity retail assets and lease existing electricity generators to private operators, while keeping them in public ownership. The private sector is well placed to make the required future investment in electricity and would help ensure that electricity supply and reliability keeps pace with growing demand.
Creating the conditions for the private sector to make the investment in baseload capacity means that the government will not have to fund up to $15 billion in investment in electricity requirements as the private sector will make the necessary investment. Therefore the Government will be able to focus its infrastructure budget in other areas (roads, trains, hospitals, schools and other essential infrastructure), where only the public sector is in a position to undertake the investment. If the Government were to fund the electricity investment in order to keep electricity supply secure, it would have to reprioritise the existing capital program that is set out in this Budget.
The Government’s fiscal management strategy is built around controlling the growth in expenses over time, keeping the budget in surplus and maintaining a strong balance sheet. The Fiscal Responsibility Act 2005 contains a number of benchmarks for balance sheet and operating performance which are designed to help achieve stronger fiscal outcomes for the State. Performance against all targets and principles is covered in detail at Appendix A.
Budget Statement 2008-09 2 - 5
General government net debt will remain above the target due to the large capital program, and will stabilise at a sustainable 1.7 per cent of GSP. The higher level of net debt will also see net financial liabilities remain above the 2010 fiscal target. Previous offsetting factors, such as falling unfunded superannuation liabilities as a share of GSP, were unwound over 2007-08 because of cyclical financial market developments. Weak investment returns during the year resulted in lower financial asset values which contributed to higher unfunded superannuation liabilities. General government net debt and net financial liabilities will, however, be considerably lower as a share of GSP than mid-1990s levels (see Charts 2.7 and 2.8). The operating statement principles are designed to constrain the growth in expenses, keep the budget in surplus and therefore help to limit the build up in liabilities. The target of fully funding general government superannuation liabilities by 2030 remains on track.
The Fiscal Responsibility Act targets are primarily directed at the general government sector because that is where services are generally provided free of charge or at a subsidised cost to the user. The cost of providing the services is met either directly from taxpayer revenues, or through additional borrowings, which ultimately have to be repaid by taxpayers. That said, the fiscal strategy does take into account the financial position of the State sector in total, because non-commercial PTEs receive support from the Budget through grants and subsidies and because the State’s credit rating is determined by the level of total state net debt and net financial liabilities.
Maintaining a Triple A credit rating is a high priority for the Government, as reflected in the State Plan (priority P5). The highest credit rating provides a sign that the State’s balance sheet is strong and sustainable and that service delivery growth can be maintained. The level of the rating is important because it influences the interest rate at which the State can borrow. The higher the rating, the lower are interest costs for a given level of debt. Lower interest costs in turn mean that more of the State’s revenue can be used to provide services. Perhaps even more important is the influence that a high credit rating has on business confidence and, through that, business investment and employment in the State’s economy. Ratings agencies have recently and repeatedly endorsed the Government’s fiscal strategy.
2.3 2008-09 BUDGET Despite the significant challenges evident in a number of policy areas the expense and revenue plans in the 2008-09 Budget are consistent with the medium-term fiscal strategy in that overall aggregate expense growth rates are projected to be kept broadly in alignment with revenue growth rates. The budget surplus is expected to stabilise at modest levels and net debt as a share of the economy is also forecast to stabilise at low levels.
2 - 6 Budget Statement 2008-09

The operating result is projected to be in surplus over the next four years at an average of $654 million, which is stronger than last year’s budget estimates (recast on the new harmonised accounting standard basis). The net lending deficits will be higher than last year because of a larger general government capital expenditure program.
The level of net debt as a share of GSP is expected to be broadly the same over the forward estimates as was expected last year, stabilising at 1.7 per cent of GSP (compared to 1.8 per cent last year). Net financial liabilities are expected to be one percentage point above the target of 7.5 per cent in 2010, which is about 0.7 percentage points higher than was expected last year. This is largely because the downturn in financial markets during 2007-08 (commentary on financial market conditions is provided in chapter 9) lowered asset values resulting in a higher recorded level of unfunded superannuation liabilities. Importantly, net financial liabilities will continue to track lower beyond 2010.
2.4 BUDGET TRENDS
EXPENSE TRENDS A key requirement for maintaining a sustainable fiscal position over the longer term is to align the growth of expenses with long-run average growth in revenue. While revenues can fluctuate significantly, expenses tend to rise consistently through time. Over the four years to 2006-07, expense growth exceeded revenue growth by around one percentage point per year. Measures have been taken to slow the growth in expenses, and these measures will continue to apply in the budget and forward estimates years, including:
a wages policy which seeks to moderate the growth in employee costs while maintaining the significant real wage gains made in key sectors and
♦
♦ the ongoing application of efficiency dividends and productivity reforms.
Drivers of expense growth have been health, education, and transport, both because of the size of these portfolios relative to the general government sector and because they reflect the policy priorities of the Government.
Over the past three years, new budget processes, better budget management and achieving savings targets have seen underlying expense outcomes very close to original budget estimates. In 2007-08, abstracting from changes in “pass-through” funding from the Commonwealth for specific initiatives and the one-off repayment of rail debt, expenses will exceed the budget estimate by 0.6 per cent.
Budget Statement 2008-09 2 - 7
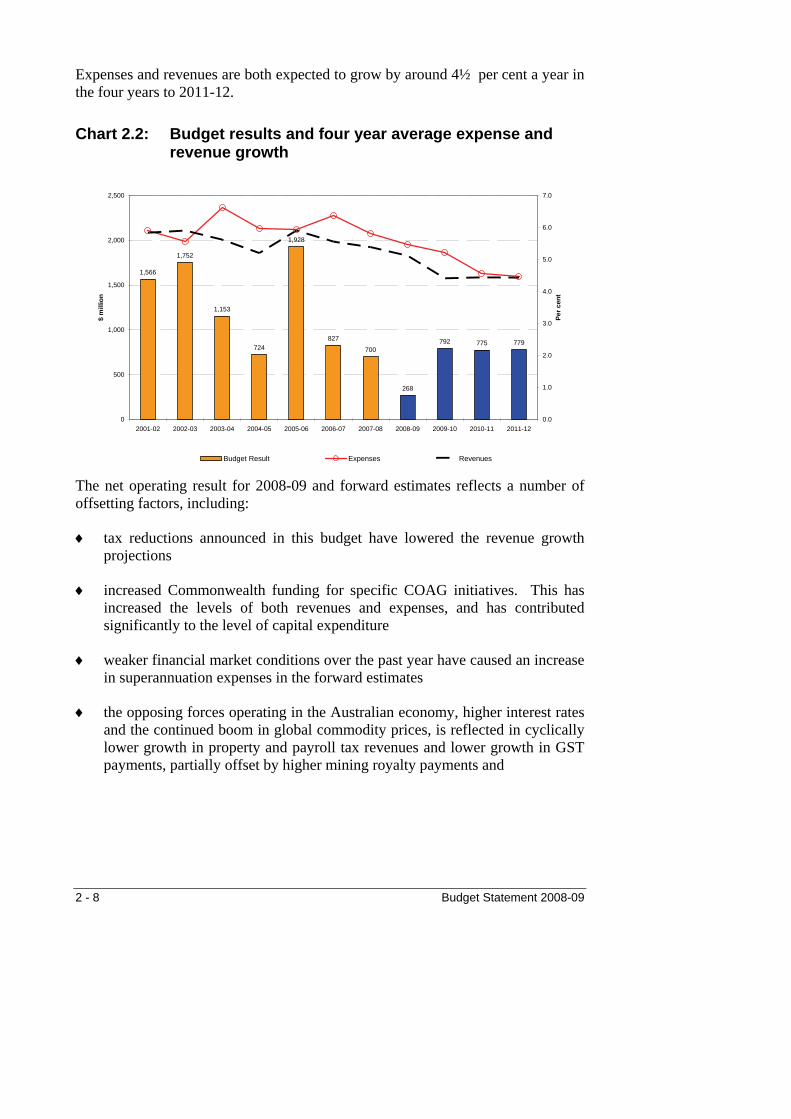
Expenses and revenues are both expected to grow by around 4½ per cent a year in the four years to 2011-12.
Chart 2.2: Budget results and four year average expense and revenue growth
1,566
1,752
1,153
724
1,928
827
700
268
792 775 779
0
500
1,000
1,500
2,000
2,500
2001-02 2002-03 2003-04 2004-05 2005-06 2006-07 2007-08 2008-09 2009-10 2010-11 2011-12
$ m
illio
n
0.0
1.0
2.0
3.0
4.0
5.0
6.0
7.0
Per c
ent
Budget Result Expenses Revenues
The net operating result for 2008-09 and forward estimates reflects a number of offsetting factors, including:
tax reductions announced in this budget have lowered the revenue growth projections
♦
♦
♦
♦
increased Commonwealth funding for specific COAG initiatives. This has increased the levels of both revenues and expenses, and has contributed significantly to the level of capital expenditure
weaker financial market conditions over the past year have caused an increase in superannuation expenses in the forward estimates
the opposing forces operating in the Australian economy, higher interest rates and the continued boom in global commodity prices, is reflected in cyclically lower growth in property and payroll tax revenues and lower growth in GST payments, partially offset by higher mining royalty payments and
2 - 8 Budget Statement 2008-09

♦
Chart 2.3:
an increase in the level of expenses from increased capital grant funding for the North West Metro and South West Rail Link rail programs. This is recorded as an expense on the general government operating statement.
Medium-term expense drivers Beyond the forward estimates, the ageing of the population will bring more intense fiscal pressures. Chart 2.3 shows that the proportion of the population aged 65 years or more will almost double from 13.7 per cent in 2005 to 24.8 per cent in 2044. However, the fiscal and economic impacts of this demographic shift will be felt much sooner. The annual increase in this age group will more than double from 19,000 in 2005 to 40,000 in 2011 and remain at that elevated rate for the subsequent 20 years.
Change of state population aged 65 and over
0
5
10
15
20
25
30
35
40
45
1994 2004 2014 2024 2034 2044
Pers
ons
('000
)
10
15
20
25
Per c
ent
Annual Change in State Population aged 65 and over ('000) LHS)Population Aged 65 and over as per cent o f Total Population (RHS)
Projections
Actuals
Source: 2006-07 NSW Budget Paper No.6 Long-Term Fiscal Pressures Report.
Health expenditure has grown at an annual average rate of 7.5 per cent over the past five years. Rising costs, confronted by all health systems in all developed countries, are driven by:
increased presentations at hospital emergency departments of patients with chronic and complex conditions or primary care needs
♦
♦
♦
increasing rates of obesity, diabetes and other lifestyle related illnesses
a growing and ageing population
Budget Statement 2008-09 2 - 9

changes in health technology including the availability of new and more advanced procedures
♦
♦
♦
rising community expectations and
worldwide skill shortages for clinical staff.
Expense pressures in transport over the medium term are being driven by the ongoing growth of Sydney as a global city. Progressively more expensive transport infrastructure has to be fitted into the existing urban landscape (e.g. providing underground roadways and tunnels and metro style underground rail systems). The growth of Sydney will continue to present challenges in the area of urban congestion, and in the provision of public transport. This includes rising operating costs for public transport and increased construction costs for public transport infrastructure.
Education expenditure has grown by an average rate of 5.3 per cent over the past four years. This reflects a shift in the proportion of students in government and non-government schools as well as various education initiatives, which have led to expenditure per student rising over that period. Looking forward, student numbers are forecast to decline slightly in the short term, but then increase gradually in the medium to longer term. This, combined with demands for greater use of technology and increasing costs of educating students with special needs, will add to cost pressures.
The COAG reform agenda is a key medium-term response to future demographic pressures. The commencement of preventative health programs and early childhood education programs today will help to increase productivity and participation in coming generations. In turn this will lift economic growth and help to limit any slippage in the State’s fiscal position. However, the cost of these programs needs to be met upfront while the benefits accrue over a considerable length of time.
WAGES POLICY Restraining growth in employee expenses, particularly wages, is critical to overall budget results because employee expenses account for nearly half of total expenses. This is true in the short run and in the long run because wage increases become embedded in the cost base and any extraordinary increases represent a structural weakening of the budget position which would require a commensurate structural change in revenues or other expenses.
2 - 10 Budget Statement 2008-09

Chart 2.4: Real wage growth
100.0
105.0
110.0
115.0
120.0
Sep-97
Mar-98
Sep-98
Mar-99
Sep-99
Mar-00
Sep-00
Mar-01
Sep-01
Mar-02
Sep-02
Mar-03
Sep-03
Mar-04
Sep-04
Mar-05
Sep-05
Mar-06
Sep-06
Mar-07
Sep-07
Mar-08
Qua
rter
ly in
dex
num
bers
NSW - Public Sector NSW - Private Sector RoA - Public Sector
Source: ABS 6345.0, Labour Price Index, ABS 6401.0, CPI and NSW Treasury estimates.
Over the last decade NSW public sector employees have experienced wage increases well in excess of both inflation and those of employees in the NSW private sector and the public sector in the rest of Australia (refer Chart 2.4). The Government’s wages policy is to maintain the real value of these significant wage increases over time. The Government will fund wage increases and associated costs at 2.5 per cent per year, the mid-point of the Reserve Bank of Australia’s (RBA) 2–3 per cent target inflation range1. The policy permits wage outcomes in excess of 2.5 per cent, but only where the additional expense is offset by employee-related cost savings. This policy will assist in containing total expense growth.
The RBA actively pursues monetary policy to achieve its 2–3 per cent target inflation range. While inflation may fall below or rise above this target level, as is the recent experience, the RBA has a Charter with the Australian Government to keep consumer price inflation between 2–3 per cent on average over the cycle. Moreover, over the last decade or more, the RBA has achieved this target on average.
1 Growth in employee related costs will also reflect other factors, including importantly changes in the
numbers employed. Refer Chapter 3, p. 3-8.
Budget Statement 2008-09 2 - 11

While current forecasts put the expected level of inflation above 2.5 per cent for at least the next year, the Government is not proposing to increase the indexation factor. To do so would require lowering the indexation factor below 2.5 per cent in years where inflation is expected to fall below 2.5 per cent. While forecasts are not certain, what is certain is that the RBA will maintain its inflation target at 2.5 per cent. The RBA has also indicated that if higher inflation expectations were to be reflected in higher wage claims, the task of reducing inflation would be made more difficult.
The sensitivity of the budget result to wages and the modest levels of projected surpluses mean that if the wages policy is not strictly adhered to then the fiscal strategy will be under pressure. For example, if the cost of new wage agreements exceeds the 2.5 per cent target by one per cent per annum then employee-related expenses will increase by $219 million in 2008-09, $471 million in 2009-10 and $1 billion in 2011-12, with clear consequences for the Budget position.
REVENUE TRENDS Revenue as a share of gross state product (GSP) is estimated to be around 1½ percentage points lower by the end of the forward estimates than it was in 1997-98 (refer Chart 2.5)2. This is influenced by taxation reductions undertaken by the Government since August 2005. The Government has taken a deliberate decision to reduce taxation where possible in order to support economic activity in the State.
The decline as a share of the economy also reflects the State’s taxation base which, unlike the Commonwealth, does not benefit significantly from the recent and prospective large increase in commodity prices, but is substantially affected by higher interest rates. Demographic change will also impact on all of the main state revenues and on GST grants from the Commonwealth over the medium term.
2 Expenses have also declined as a share of GSP, but by less than revenue, falling by around one percentage
point over the same period
2 - 12 Budget Statement 2008-09

Chart 2.5: Total general government revenue and expenses as a share of GSP
11.0
11.5
12.0
12.5
13.0
13.5
14.0
1998Act
1999Act
2000Act
2001Act
2002Act
2003Act
2004Act
2005Act
2006Act
2007Act
2008Rev
2009Bud
2010Est
2011Est
2012Est
Per c
ent
Expenses Revenue
The 2008-09 Budget revenue estimates assume growth at slightly stronger rates (average 4.4 per cent) over the coming four years than was expected in the 2007-08 Budget (see Chapter 4 for detailed discussion of revenues). In contrast, nominal GSP is projected to grow by an average of 6.4 per cent over the next four years, boosted by the significant lift in the terms of trade in 2008-09. Expense and revenues as a share of the economy are therefore projected to continue to decline over the coming four years.
Revenues will benefit from an increase in the size of the GST pool lifting the level of GST grants paid to New South Wales, which reflects past growth in consumer spending. Mining royalty duties have been revised up substantially due to a doubling in coal contract prices. Commonwealth grants for roads and health have also been revised upwards, lifting overall revenue levels. However, higher interest rates will produce cyclically lower property market revenues and some slow down in the growth in payroll tax revenues, as well as slower discretionary income spending. Reductions in payroll tax rates and a bringing forward of the abolition of transfer duty on non-real business assets as announced in this Budget will also affect revenue growth.
Over the longer term the assumption is for revenue to increase by an average of 5 per cent per annum – which reflects historical growth patterns, adjusted for policy changes. While there are a range of risks surrounding any long-run projections, demographic changes represent a downside risk to a number of revenue components.
Budget Statement 2008-09 2 - 13

Demographic change and revenues Payroll tax revenue growth is related to the state of the labour market and has been growing more strongly than the economy in general. Over the four years to 2007-08 payroll tax revenue has been growing at 9 per cent per year compared to average nominal growth in the economy of around 6 per cent. It is reasonable to assume, however, that the growth of employment will slow in the future, and with it the growth in payroll tax revenue. One reason is that, abstracting from short-term cyclical influences, the unemployment rate has returned to historically low levels and the available pool of unemployed will cease to contribute to employment growth as it has over the last decade or more. With employment growth constrained due to ageing of the population, payroll tax revenue growth should slow, in line with slower economic growth.
Transfer duty on residential property is driven primarily by economic growth, mobility and house prices in the long term. The ageing of the population is likely to result in a decline in GSP growth (due to slower growth in labour supply) and in mobility, as older people are less likely to move. Countervailing this to some extent is the tendency for house prices to increase with wages rather than with inflation in general. Although the ageing effect will result in a decline in the rate of growth of this revenue, it may not necessarily decline as a share of GSP.
GST revenues are likely to grow more slowly than the economy over time, with health expenditure, which is not subject to the GST, assuming a larger proportion of consumer expenditure. This will mean slower growth in the overall size of the GST revenue pool.
Demographic changes rank as a common and significant factor in the preceding discussion of pressures that are likely to impact on both expenses and revenues over the medium term. They highlight the range and scale of the possible budget challenges that face state governments, and bring into sharp focus the importance of negotiating changes in financial relations between the Commonwealth and the States.
2.5 CAPITAL EXPENDITURE The Government’s capital expenditure program plays an integral role in delivering services to the people of New South Wales. The Government’s 10 year program will be detailed in the State Infrastructure Strategy (SIS). The SIS links the four year budget cycle with the Government’s metropolitan and regional planning strategies. This strategy delivers on the State Plan priority to maintain and invest in infrastructure (P2). The strategy importantly recognises the need to deliver the infrastructure program in a way that is fiscally sustainable.
2 - 14 Budget Statement 2008-09

The level of investment in infrastructure has grown significantly over the past decade, with total State infrastructure spending now more than double, in real terms, the average of the 1990s. The majority of the infrastructure investment and the source of most growth, was in the PTE sector, where levels are now more than two and a half times higher than the average of the 1990s in real terms. In the four years to 2008-09, the growth in total State infrastructure spending is estimated to average 13.9 per cent per annum in real terms. For the PTE sector that growth is 18.2 per cent a year in real terms.
Investment in the PTE sector (e.g. electricity, water and rail networks) tends to be driven by periodic requirements for major capacity expansions or replacement of assets that have reached the end of their economic life. Infrastructure trends in the general government sector on the other hand are smoother, with demand driven by the need to meet ongoing service delivery requirements in health, education and roads. Ultimately, however, all capital expenditure has to be funded from operating surpluses and borrowing, so the capital program has to comply with the Government’s strategy for ensuring fiscal sustainability.
Chart 2.6: State Capital Expenditure Program (2008-09 dollars)
0
2
4
6
8
10
12
14
16
1963-64 1967-68 1971-72 1975-76 1979-80 1983-84 1987-88 1991-92 1995-96 1999-00 2003-04 2007-08 2011-12
$ bi
llion
s
PTE Sector General Government Sector
2008-09 Budget
Budget Statement 2008-09 2 - 15
In 2007 the Government responded to recommendations in the report of the Inquiry into Electricity Supply in New South Wales (the Owen Inquiry) by committing to divest its electricity generation and retail assets. This will ensure continuity and reliability of electricity supply and avoid the Government having to fund up to $15 billion in future investment in electricity requirements over the next 10 to 15 years. As noted in the report, there was a risk that if the Government financed the investment required, in addition to the large infrastructure program set out in this Budget, total State debt levels could approach proportions last experienced in the early 1990s, when the State was placed on credit watch by Moody’s rating services for a possible credit rating downgrade.
BALANCE SHEET
Net debt Maintaining a strong balance sheet is a cornerstone of the Government’s medium-term fiscal strategy, as it reflects the State’s capacity to deliver and expand services in the future. Since the mid-1990s general government net debt as a share of GSP has declined significantly. Although it is projected to rise over the next four years to help fund a rapid acceleration in the level of infrastructure spending, it will remain at relatively low and sustainable levels. It is projected to stabilise at around 1.7 per cent of GSP, well below levels of the mid-1990s and below the levels projected last year.
Funding a rapid increase in infrastructure investment in the PTE sector is expected to cause total State net debt to increase substantially over the budget and forward estimates period. Total State net debt, therefore, after falling from around 12 per cent of GSP in 1995 to 4.7 per cent in 2006 is projected to rise to 9.1 per cent of GSP by 2012.
2 - 16 Budget Statement 2008-09

Net debt as a percentage of gross state product(a) Chart 2.7:
2.0 1.7 1.7
11.9
10.0
8.77.9
6.35.6 5.7
6.2
8.79.1
7.4
1.21.71.61.4
1.0
6.35.9 5.2
4.74.2
2.7
0.9 0.8 0.4
5.25.2
7.4
9.4
7.38.1
11.1
4.7
0
2
4
6
8
10
12
14
1995Act
1996Act
1997Act
1998Act
1999Act
2000Act
2001Act
2002Act
2003Act
2004Act
2005Act
2006Act
2007Act
2008Rev
2009Bud
2010Est
2011Est
2012Est
Per
cen
t
General Govt Total State
(a) Excluding the impacts of prepayment/deferral of superannuation contributions.
Source: NSW Treasury for net debt; ABS for GSP (actual) and NSW Treasury for estimates from 2006-07.
Beyond the forward estimates period the overall balance sheet position will depend on the balance between the size of budget surpluses and the strength of the capital spending program. Further increases in capital spending would require higher budget surpluses in order to slow the growth in net debt. Ratings agencies focus on total State net debt, its size relative to other comparable states, its rate of increase, and its composition (viewing PTE net debt as less creditworthy than general government net debt). Thus, even if all commercial PTE net debt were to be sustainably funded by regulated price increases, high levels of PTE net debt place constraints on general government net debt and, as a consequence, non-commercial capital spending for a given credit rating.
Net financial liabilities Net financial liabilities include net debt, unfunded superannuation liabilities, net self-insurance liabilities and other, primarily employee-related liabilities, such as long service leave. As a result of a concerted effort in this area, total State net financial liabilities have declined significantly as a share of GSP, nearly halving from 1995 to 2005. Over the budget and forward estimates period they are projected to increase, largely reflecting the partial debt funding of the significant increase in capital spending, particularly in the PTE sector, and will remain well below the unsustainable highs of the early to mid 1990s.
Budget Statement 2008-09 2 - 17

General government net financial liabilities are projected to be higher as a share of GSP than they were in last year’s budget (0.7 percentage points in 2010) because of unfavourable movements in financial asset values during the course of 2007-08. Weaker financial markets during 2007-08 mean that the value of superannuation assets, for example, are lower than previously projected, leaving a larger measured unfunded superannuation liability on the State’s balance sheet. Financial market volatility is a regular phenomenon and is to be expected (refer Chapter 9, p. 9-18). However, the fiscal targets were based on long-run average returns. While the measure of net financial liabilities recorded on the accrual accounting basis is at a higher level, more importantly the Government’s cash contributions schedule to fully fund superannuation liabilities by 2030 remains on track.
Chart 2.8: Net financial liabilities as a percentage of gross state product(a)
19.918.6
15.914.8
13.4
11.010.0 9.8 9.5 8.8 8.3 8.7
7.7 8.2 8.1 8.5 8.3 8.0
26.725.5
22.420.9
19.5
16.5 16.2 15.8 16.015.1 14.5
16.015.2
16.0
18.318.217.916.7
0
5
10
15
20
25
30
1995Act
1996Act
1997Act
1998Act
1999Act
2000Act
2001Act
2002Act
2003Act
2004Act
2005Act
2006Act
2007Act
2008Rev
2009Bud
2010Est
2011Est
2012Est
Per
cen
t
General Govt Total State
(a) Series break in 2005-06 as a result of the adoption of Australian Equivalents to International Financial Reporting Standards. It has the effect of increasing the reported level of net financial liabilities.
Source: NSW Treasury for net financial liabilities; ABS for GSP (actual) and NSW Treasury (estimates from 2006-07).
FISCAL TARGETS AND PRINCIPLES: PROGRESS The Government reports every year in the budget papers on the progress achieved against the fiscal targets and principles that underlie the Government’s fiscal strategy.
2 - 18 Budget Statement 2008-09
The fiscal target for the level of net debt in the general government sector is to keep net debt at or below its level as at 30 June 2005 (originally foreseen as one per cent of GSP, but subsequent revisions have lowered 2005 net debt to 0.8 per cent of GSP). Since the targets were set, the Government has significantly increased its program of infrastructure investment, which will be partly funded from increased borrowings. Net debt as a share of GSP, therefore, is forecast to be 0.9 percentage points above the fiscal target in 2010.
As a result, net financial liabilities as a share of GSP in the general government sector is forecast to be one percentage point above the medium-term target of 7.5 per cent by June 2010. Importantly, general government net financial liabilities as a share of GSP will decline thereafter.
The headline level of net debt and net financial liabilities will be significantly improved over the medium term as a result of the announced plans to transfer electricity retail and generation operations to the private sector. An underlying improvement in State finances will come from two sources:
a lower risk profile associated with financial assets allocated to the Community Infrastructure (Intergenerational) Fund compared with dividends and tax equivalent revenues from the electricity businesses and
♦
♦ the avoidance of additional capital expenditure associated with securing electricity supply. This will remove a significant threat to the State’s credit rating as outlined in the report of the Owen Inquiry.
Although the recorded level of general government unfunded superannuation liabilities has increased since last budget, this is based on the Australian Accounting Standard AASB 119 (see Chapter 6 for further discussion). On a funding basis the long-term fiscal target in the Act to fully fund superannuation liabilities by 2030 remains on track.
Appendix A summarises the progress achieved against each of the fiscal targets and fiscal principles, and assesses the achievability of fiscal targets and principles in the future.
Budget Statement 2008-09 2 - 19

2 - 20 Budget Statement 2008-09
Impact of 2008-09 Budget on the long-term fiscal gap The 2006-07 Budget provided a benchmark estimate of the long-term fiscal pressures that New South Wales may face by comparing the actual budget outcomes for 2004-05 to the projected budget outcome for 2043-44. It was estimated that demographic and other pressures could lead to a fiscal gap3 of around 3.4 per cent of GSP over the 40 year horizon.
One feature of the Fiscal Responsibility Act 2005 is a requirement to report in every budget the long-term fiscal consequences of expenditure and revenue measures. As such, in addition to the usual budget reporting on the immediate effects of policy initiatives, the Government now provides an assessment as to whether policy changes will widen or narrow the long-term fiscal gap (as reported in 2006-07 Budget Paper No. 6 Long-Term Fiscal Pressures Report). This reporting considerably increases fiscal transparency.
The cumulative impact of changes introduced in the 2006-07 and 2007-08 Budgets was estimated to increase the fiscal gap to 3.5 per cent of GSP. New policy changes since the 2007-08 Budget, will increase the fiscal gap by 0.4 percentage points. The largest cause of the increased gap is tax reductions announced in this Budget, which account for 0.2 percentage points. A further 0.1 percentage points are attributed to the expense side of the budget, resulting from growth in demand for services in areas including health, transport and community services. The significant increase in capital expenditure plans contained in this Budget are also estimated to add around 0.1 percentage points to the fiscal gap.
3 The fiscal gap is the difference between the base period primary balance as a share of GSP and the primary balance as a share of GSP at the end of the projection period, on a no policy change basis. The primary balance is the gap between spending and revenue excluding interest transactions but including net capital expenditure. A positive gap implies that fiscal pressures will be building over the projection period.
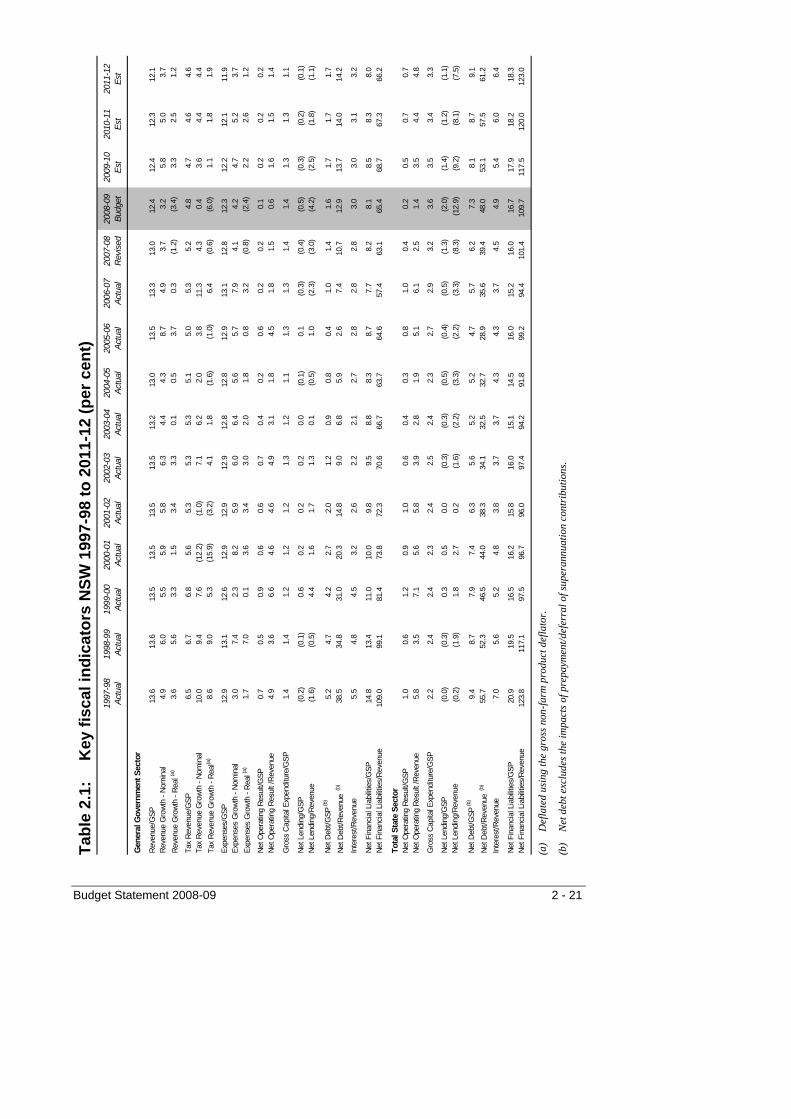
Budget Statement 2008-09 2 - 21
Tabl
e 2.
1:
Key
fisc
al in
dica
tors
NSW
199
7-98
to 2
011-
12 (p
er c
ent)
1997
-98
Ac
tual
1998
-99
Ac
tual
1999
-00
Ac
tual
2000
-01
Ac
tual
2001
-02
Ac
tual
2002
-03
Ac
tual
2003
-04
Ac
tual
2004
-05
Ac
tual
2005
-06
Ac
tual
2006
-07
Ac
tual
2007
-08
R
evis
ed20
08-0
9
Budg
et20
09-1
0
Est
2010
-11
Es
t20
11-1
2
Est
13.6
13.6
13.5
13.5
13.5
13.5
13.2
13.0
13.5
13.3
13.0
12.4
12.4
12.3
12.1
4.9
6.0
5.5
5.9
5.8
6.3
4.4
4.3
8.7
4.9
3.7
3.2
5.8
5.0
3.7
3.6
5.6
3.3
1.5
3.4
3.3
0.1
0.5
3.7
0.3
(1.2
)
(3.4
)
3.3
2.5
1.2
6.5
6.7
6.8
5.6
5.3
5.3
5.3
5.1
5.0
5.3
5.2
4.8
4.7
4.6
4.6
10.0
9.4
7.6
(12.
2)
(1
.0)
7.
1
6.
2
2.
0
3.
8
11
.3
4.
3
0.
4
3.
6
4.
4
4.
4
8.
6
9.
0
5.
3
(1
5.9)
(3.2
)
4.1
1.8
(1.6
)
(1.0
)
6.4
(0.6
)
(6.0
)
1.1
1.8
1.9
12.9
13.1
12.6
12.9
12.9
12.9
12.8
12.8
12.9
13.1
12.8
12.3
12.2
12.1
11.9
3.0
7.4
2.3
8.2
5.9
6.0
6.4
5.6
5.7
7.9
4.1
4.2
4.7
5.2
3.7
1.7
7.0
0.1
3.6
3.4
3.0
2.0
1.8
0.8
3.2
(0.8
)
(2.4
)
2.2
2.6
1.2
0.7
0.5
0.9
0.6
0.6
0.7
0.4
0.2
0.6
0.2
0.2
0.1
0.2
0.2
0.2
4.9
3.6
6.6
4.6
4.6
4.9
3.1
1.8
4.5
1.8
1.5
0.6
1.6
1.5
1.4
1.4
1.4
1.2
1.2
1.2
1.3
1.2
1.1
1.3
1.3
1.4
1.4
1.3
1.3
1.1
(0.2
)
(0.1
)
0.6
0.2
0.2
0.2
0.0
(0.1
)
0.1
(0.3
)
(0.4
)
(0.5
)
(0.3
)
(0.2
)
(0.1
)
(1.6
)
(0.5
)
4.4
1.6
1.7
1.3
0.1
(0.5
)
1.0
(2.3
)
(3.0
)
(4.2
)
(2.5
)
(1.8
)
(1.1
)
5.2
4.7
4.2
2.7
2.0
1.2
0.9
0.8
0.4
1.0
1.4
1.6
1.7
1.7
1.7
38.5
34.8
31.0
20.3
14.8
9.0
6.8
5.9
2.6
7.4
10.7
12.9
13.7
14.0
14.2
5.5
4.8
4.5
3.2
2.6
2.2
2.1
2.7
2.8
2.8
2.8
3.0
3.0
3.1
3.2
14.8
13.4
11.0
10.0
9.8
9.5
8.8
8.3
8.7
7.7
8.2
8.1
8.5
8.3
8.0
109.
0
99
.1
81
.4
73
.8
72
.3
70
.6
66
.7
63
.7
64
.6
57
.4
63
.1
65
.4
68
.7
67
.3
66
.2
1.0
0.6
1.2
0.9
1.0
0.6
0.4
0.3
0.8
1.0
0.4
0.2
0.5
0.7
0.7
5.8
3.5
7.1
5.6
5.8
3.9
2.8
1.9
5.1
6.1
2.5
1.4
3.5
4.4
4.8
2.2
2.4
2.4
2.3
2.4
2.5
2.4
2.3
2.7
2.9
3.2
3.6
3.5
3.4
3.3
(0.0
)
(0.3
)
0.3
0.5
0.0
(0.3
)
(0.3
)
(0.5
)
(0.4
)
(0.5
)
(1.3
)
(2.0
)
(1.4
)
(1.2
)
(1.1
)
(0.2
)
(1.9
)
1.8
2.7
0.2
(1.6
)
(2.2
)
(3.3
)
(2.2
)
(3.3
)
(8.3
)
(12.
9)
(9
.2)
(8
.1)
(7
.5)
9.4
8.7
7.9
7.4
6.3
5.6
5.2
5.2
4.7
5.7
6.2
7.3
8.1
8.7
9.1
55.7
52.3
46.5
44.0
38.3
34.1
32.5
32.7
28.9
35.6
39.4
48.0
53.1
57.5
61.2
7.0
5.6
5.2
4.8
3.8
3.7
3.7
4.3
4.3
3.7
4.5
4.9
5.4
6.0
6.4
20.9
19.5
16.5
16.2
15.8
16.0
15.1
14.5
16.0
15.2
16.0
16.7
17.9
18.2
18.3
123.
8
11
7.1
97.5
96.7
96.0
97.4
94.2
91.8
99.2
94.4
101.
4
10
9.7
117.
5
12
0.0
123.
0
Tota
l Sta
te S
ecto
r
Net D
ebt/R
even
ue (b
)
Net D
ebt/G
SP (b
)
Gen
eral
Gov
ernm
ent S
ecto
r
Tax
Reve
nue/
GSP
Tax
Reve
nue
Gro
wth
- Nom
inal
Tax
Reve
nue
Gro
wth
- Rea
l(a)
Expe
nses
/GSP
Expe
nses
Gro
wth
- Nom
inal
Expe
nses
Gro
wth
- Rea
l (a)
Gro
ss C
apita
l Exp
endi
ture
/GSP
Net O
pera
ting
Resu
lt/G
SP
Net L
endi
ng/R
even
ue
Net F
inan
cial
Lia
bilit
ies/
Reve
nue
Net O
pera
ting
Resu
lt /R
even
ue
Inte
rest
/Rev
enue
Net F
inan
cial
Lia
bilit
ies/
GSP
Net F
inan
cial
Lia
bilit
ies/
Reve
nue
Net F
inan
cial
Lia
bilit
ies/
GSP
Reve
nue
Gro
wth
- Nom
inal
Reve
nue
Gro
wth
- Rea
l (a)
Reve
nue/
GSP
Net O
pera
ting
Resu
lt /R
even
ue
Net L
endi
ng/G
SP
Net D
ebt/R
even
ue (b
)
Net D
ebt/G
SP (b
)
Inte
rest
/Rev
enue
Net O
pera
ting
Resu
lt/G
SP
Net L
endi
ng/R
even
ueNe
t Len
ding
/GSP
Gro
ss C
apita
l Exp
endi
ture
/GSP
(a)
Def
late
d us
ing
the
gros
s non
-farm
pro
duct
def
lato
r.
(b)
Net
deb
t exc
lude
s the
impa
cts o
f pre
paym
ent/d
efer
ral o
f sup
eran
nuat
ion
cont
ribu
tions
.

2 - 22 Budget Statement 2008-09
Tabl
e 2.
2:
Key
fisc
al in
dica
tors
NSW
199
7-98
to 2
011-
12 ($
m)
1997
-98
Ac
tual
1998
-99
Ac
tual
1999
-00
Ac
tual
2000
-01
Ac
tual
2001
-02
Ac
tual
2002
-03
Ac
tual
2003
-04
Ac
tual
2004
-05
Ac
tual
2005
-06
Ac
tual
2006
-07
Ac
tual
2007
-08
R
evis
ed20
08-0
9
Budg
et20
09-1
0
Est
2010
-11
Es
t20
11-1
2
Est
27,0
07
28,6
36
30,2
25
32,0
18
33,8
88
36,0
25
37,6
14
39,2
17
42,6
29
44,7
27
46,3
96
47,8
82
50,6
65
53,2
23
55,1
86
12,8
97
14,1
15
15,1
85
13,3
37
13,2
10
14,1
46
15,0
18
15,3
24
15,9
02
17,6
97
18,4
66
18,5
33
19,1
94
20,0
34
20,9
23
25,6
93
27,5
95
28,2
22
30,5
31
32,3
22
34,2
73
36,4
61
38,4
93
40,7
01
43,9
00
45,6
96
47,6
14
49,8
73
52,4
48
54,4
07
1,31
4
1,
041
2,
003
1,
487
1,
566
1,
752
1,
153
72
4
1,92
8
827
70
0
268
79
2
775
77
9
2,76
1
3,
002
2,
733
2,
859
3,
102
3,
349
3,
331
3,
331
3,
949
4,
272
4,
865
5,
477
5,
352
5,
475
4,
976
(4
25)
(132
) 1,
322
52
5
573
46
1
41
(178
) 43
1
(1,0
20)
(1,4
10)
(2,0
25)
(1,2
90)
(966
) (6
11)
10,3
89
9,96
7
9,35
5
6,48
6
5,02
6
3,23
2
2,57
6
2,32
0
1,11
4
3,30
8
4,97
8
6,19
1
6,92
2
7,46
7
7,80
9
1,49
0
1,
363
1,
348
1,
021
86
8
803
78
9
1,06
1
1,18
4
1,25
7
1,29
7
1,44
0
1,54
0
1,66
6
1,77
3
29,4
40
28,3
77
24,5
90
23,6
35
24,5
02
25,4
18
25,0
72
24,9
92
27,5
28
25,6
95
29,2
63
31,3
36
34,7
84
35,8
30
36,5
11
33,6
98
35,2
37
37,9
10
39,7
58
41,4
10
43,6
90
45,5
10
47,6
29
51,0
72
53,8
95
56,3
91
58,8
69
62,1
89
65,4
09
68,0
95
31,7
39
34,0
02
35,2
37
37,5
15
39,0
11
41,9
84
44,2
49
46,7
12
48,4
87
50,5
89
54,9
62
58,0
38
60,0
34
62,5
37
64,8
01
1,95
9
1,
235
2,
673
2,
243
2,
399
1,
706
1,
260
91
8
2,58
6
3,30
6
1,42
9
831
2,
155
2,
872
3,
294
4,
436
5,14
2
5,46
0
5,36
5
6,08
0
6,69
7
6,70
5
6,98
2
8,37
9
9,77
6
11,3
38
13,9
30
14,1
11
14,5
87
15,0
13
(57)
(675
) 69
6
1,08
0
63
(698
) (9
84)
(1,5
77)
(1,1
45)
(1,7
74)
(4,6
91)
(7,5
91)
(5,7
24)
(5,3
02)
(5,0
83)
18,7
61
18,4
19
17,6
13
17,4
95
15,8
52
14,8
91
14,7
83
15,5
55
14,7
41
19,1
86
22,1
98
28,2
43
33,0
05
37,6
26
41,6
98
2,35
0
1,
966
1,
987
1,
906
1,
567
1,
626
1,
675
2,
065
2,
210
2,
008
2,
523
2,
878
3,
357
3,
936
4,
371
41
,705
41
,259
36
,959
38
,452
39
,769
42
,562
42
,891
43
,705
50
,664
50
,893
57
,164
64
,567
73
,045
78
,471
83
,749
19
9,20
5
21
1,06
0
224,
039
23
7,52
0
250,
944
26
6,58
2
284,
605
30
0,63
6
315,
709
33
5,14
4
357,
422
38
5,60
7
408,
278
43
2,32
9
457,
760
Net F
inan
cial
Lia
bilit
ies
Tax
Reve
nue
Net D
ebt
Net D
ebt
Tota
l Rev
enue
Inte
rest
Exp
ense
s
Tota
l Exp
ense
s
Net L
endi
ng/(B
orro
wing
) G
ross
Cap
ital E
xpen
ditu
reNe
t Ope
ratin
g Re
sult
Gro
ss S
tate
Pro
duct
(cur
rent
pric
es)
Tota
l Rev
enue
Inte
rest
Exp
ense
s
Tota
l Exp
ense
s
Net L
endi
ng/B
orro
wing
Tota
l Sta
te S
ecto
r
Net F
inan
cial
Lia
bilit
ies
Net O
pera
ting
Resu
lt G
ross
Cap
ital E
xpen
ditu
re
Gen
eral
Gov
ernm
ent S
ecto
r
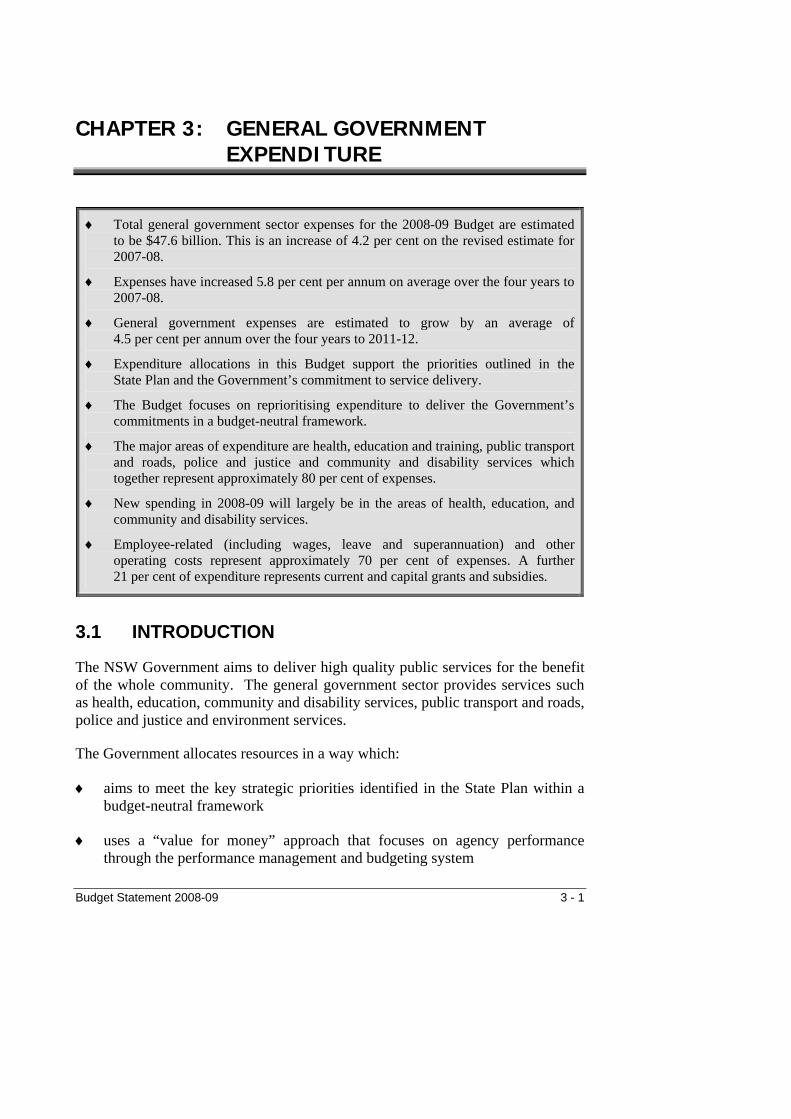
CHAPTER 3: GENERAL GOVERNMENT EXPENDITURE
♦ Total general government sector expenses for the 2008-09 Budget are estimated to be $47.6 billion. This is an increase of 4.2 per cent on the revised estimate for 2007-08.
♦ Expenses have increased 5.8 per cent per annum on average over the four years to 2007-08.
♦ General government expenses are estimated to grow by an average of 4.5 per cent per annum over the four years to 2011-12.
♦ Expenditure allocations in this Budget support the priorities outlined in the State Plan and the Government’s commitment to service delivery.
♦ The Budget focuses on reprioritising expenditure to deliver the Government’s commitments in a budget-neutral framework.
♦ The major areas of expenditure are health, education and training, public transport and roads, police and justice and community and disability services which together represent approximately 80 per cent of expenses.
♦ New spending in 2008-09 will largely be in the areas of health, education, and community and disability services.
♦ Employee-related (including wages, leave and superannuation) and other operating costs represent approximately 70 per cent of expenses. A further 21 per cent of expenditure represents current and capital grants and subsidies.
3.1 INTRODUCTION
The NSW Government aims to deliver high quality public services for the benefit of the whole community. The general government sector provides services such as health, education, community and disability services, public transport and roads, police and justice and environment services.
The Government allocates resources in a way which:
aims to meet the key strategic priorities identified in the State Plan within a budget-neutral framework
♦
♦ uses a “value for money” approach that focuses on agency performance through the performance management and budgeting system
Budget Statement 2008-09 3 - 1

makes provision for growing demand for services, population and economic growth and changing demographics and technology and
♦
♦
♦
♦
♦
♦
♦
♦
♦
♦
♦
ensures high quality front-line services are delivered more efficiently and at a sustainable level of expenditure growth.
The Government’s approach to managing expenditure includes specific strategies to restrain expenditure growth and processes to improve the planning, funding and prioritising of government activities and spending. These include:
a performance management and budgeting system which focuses on agency performance and value for money
a wages policy which seeks to moderate the growth in employee costs while maintaining the real value of gains made in the recent past
the ongoing application of efficiency dividends to drive productivity reforms
reforms to Commonwealth-State funding agreements which will take effect from 1 January 2009 and
reprioritisation of existing budget allocations to fund the delivery of State Plan priorities and service delivery improvements within a budget-neutral framework.
3.2 PERFORMANCE BUDGETING
The Government’s performance management and budgeting system (PMBS) strengthens the links between planning, and the funding, monitoring and reporting elements of the performance management cycle.
The State Plan sets clear priorities and targets for Government action and establishes accountability structures to deliver on the priorities, including:
the Cabinet Standing Committee on State Plan Performance to monitor progress against State Plan priorities and targets
allocation of State Plan priorities and targets to lead and partner Ministers and agencies
preparation by lead agencies of Priority Delivery Plans to coordinate lead and partner agency service delivery strategies and
establishment of a Performance Review Unit within the Department of Premier and Cabinet to review State Plan service delivery performance and conduct agency and functional area reviews.
3 - 2 Budget Statement 2008-09

The Government is committed to integrating the State Plan with priority setting and decision making in the budget cycle. Implementation has progressed in three areas.
PLANNING All budget dependent agencies prepare a Results and Services Plan (RSP) to inform decisions about the level of agency funding. The RSP sets out the links between results, services and service costs.
As part of preparations for the 2008-09 Budget, lead and partner agencies were required to integrate State Plan priorities and targets with their RSPs, and to identify links with existing agency budgets. This is the first step in achieving a clear “line of sight” between the State Plan, Priority Delivery Plans and agency business plans.
Reforms to Commonwealth-State financial relations will affect agency planning processes in 2008-09. The reforms, under the auspice of the Council of Australian Governments (COAG), will improve arrangements for specific purpose payments (SPPs) so that the present focus on input controls will be replaced with outcomes-based accountability NSW agencies. For example, in the health sector this could involve replacing a focus on inputs such as patient separations or occasions of service with a focus on delivering outcomes such as improvement in mortality rates or the percentage of patients who require unplanned readmission. A separate category of national partnership (NP) agreements will be created to support the delivery of specified outputs or projects, and to enable or reward the implementation of significant national reforms. Funding provided under the NPs will be subject to the achievement of performance benchmarks.
The reforms, which take effect from 1 January 2009, will establish new monitoring and accountability arrangements that will be integrated into the PMBS. Greater detail on the reforms is provided in Chapter 8.
BUDGETING An important element of the Government’s expenditure strategy is delivering State Plan priorities within a budget-neutral framework. To support this, the 2008-09 Budget process aligned with State Plan accountability structures to ensure that proposed service delivery enhancements were funded from the reprioritisation of existing agency budgets. For example, reprioritisation of existing agency budget allocations will fund the delivery of cross-agency initiatives in Aboriginal affairs.
Budget Statement 2008-09 3 - 3
Key changes to the budget process include:
a streamlined business case process that required lead and partner agencies to make joint-agency budget submissions using their RSPs to identify how existing agency allocations could be better applied to State Plan priorities
♦
♦
♦
a cross-portfolio priority setting stage that reviewed current performance of State Plan priorities relative to targets and determined the basis for inviting detailed budget submissions and
a new capital budget process that integrated the State Infrastructure Strategy and agency capital and maintenance planning, and required earlier and more strategic review of capital projects to enhance project risk management and prioritisation.
This year, the Government is reporting in Budget Paper No. 3 Budget Estimates on a results and services basis. This replaces program statements with service group statements featuring service measures and summary operating statements consistent with agency RSPs. The new format strengthens the performance focus of agency commentary, and supports ongoing alignment of agency RSPs and budgets with State Plan priorities and targets.
MONITORING To drive accountability for service delivery improvement and the efficient use of resources, the Government is strengthening arrangements for monitoring agency performance. The Cabinet Standing Committee on Expenditure Review plays a key role in monitoring the effectiveness of agencies’ budget allocations and the scope for achieving better value for money.
In 2008-09, new processes and systems will be implemented to support the work of the Committee and to integrate output from the strategic review program of the Performance Review Unit.
The Committee’s role includes monitoring agencies’ efficiency improvement plans and the delivery of efficiency dividends. An additional efficiency dividend of one per cent (approximately $300 million) on total discretionary expenses will be delivered by agencies in 2008-09, 2009-10 and 2010-11. Discretionary expenses exclude items an agency cannot directly control like depreciation and the pass through of Commonwealth grants. The efficiency dividends have been set at a level which agencies can absorb through the iterative reform of their processes while not affecting front-line service delivery. Including the efficiency dividends implemented since 2005-06, the cumulative total of this saving to the budget will be around $1.8 billion per annum by the end of 2010-11.
3 - 4 Budget Statement 2008-09
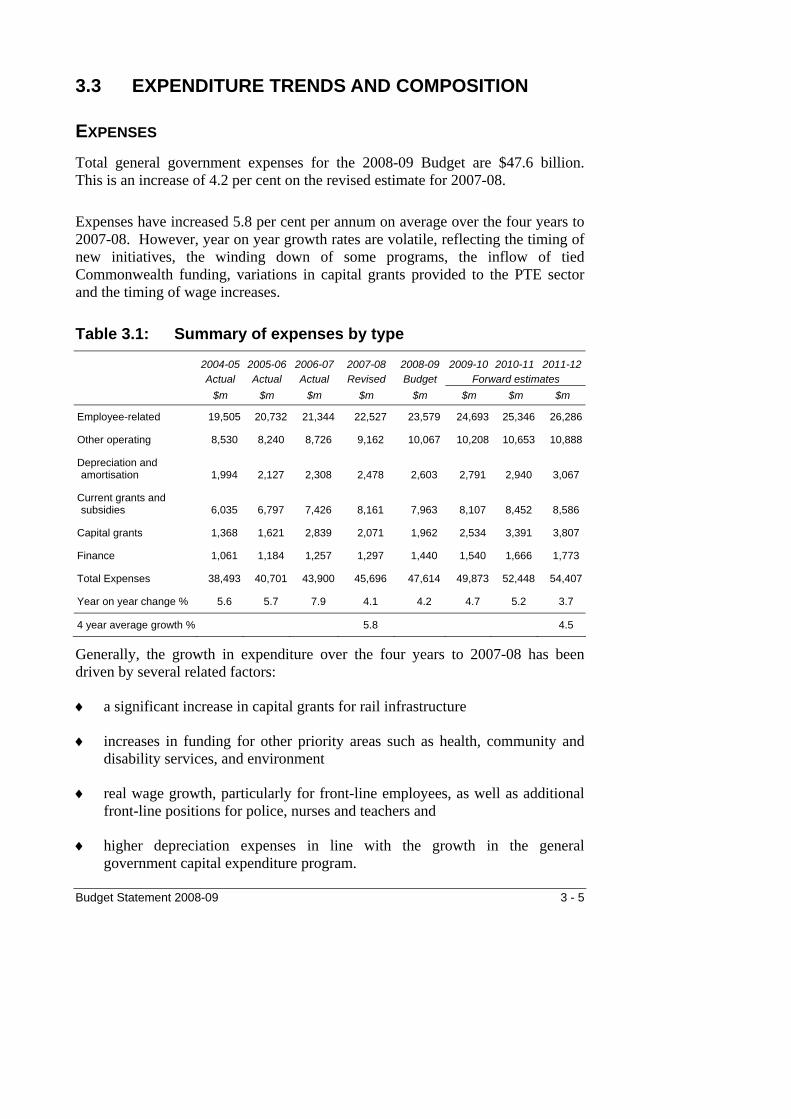
3.3 EXPENDITURE TRENDS AND COMPOSITION
EXPENSES Total general government expenses for the 2008-09 Budget are $47.6 billion. This is an increase of 4.2 per cent on the revised estimate for 2007-08.
Expenses have increased 5.8 per cent per annum on average over the four years to 2007-08. However, year on year growth rates are volatile, reflecting the timing of new initiatives, the winding down of some programs, the inflow of tied Commonwealth funding, variations in capital grants provided to the PTE sector and the timing of wage increases.
Table 3.1: Summary of expenses by type
2004-05 2005-06 2006-07 2007-08 2008-09 2009-10 2010-11 2011-12 Actual Actual Actual Revised Budget Forward estimates $m $m $m $m $m $m $m $m
Employee-related 19,505 20,732 21,344 22,527 23,579 24,693 25,346 26,286
Other operating 8,530 8,240 8,726 9,162 10,067 10,208 10,653 10,888
Depreciation and amortisation 1,994 2,127 2,308 2,478 2,603 2,791 2,940 3,067
Current grants and subsidies 6,035 6,797 7,426 8,161 7,963 8,107 8,452 8,586
Capital grants 1,368 1,621 2,839 2,071 1,962 2,534 3,391 3,807
Finance 1,061 1,184 1,257 1,297 1,440 1,540 1,666 1,773
Total Expenses 38,493 40,701 43,900 45,696 47,614 49,873 52,448 54,407
Year on year change % 5.6 5.7 7.9 4.1 4.2 4.7 5.2 3.7
4 year average growth % 5.8 4.5
Generally, the growth in expenditure over the four years to 2007-08 has been driven by several related factors:
a significant increase in capital grants for rail infrastructure ♦
♦
♦
♦
increases in funding for other priority areas such as health, community and disability services, and environment
real wage growth, particularly for front-line employees, as well as additional front-line positions for police, nurses and teachers and
higher depreciation expenses in line with the growth in the general government capital expenditure program.
Budget Statement 2008-09 3 - 5

Expenditure over the Budget year and forward estimates period is forecast to grow at a slower rate, an average of 4.5 per cent per annum. This reflects the Government’s efforts to manage expenditure growth through the wages policy, and the application of efficiency dividends and productivity reforms.
Expenditure pressures will continue over the next four years as a result of:
the ageing of the population ♦
♦
♦
♦
♦
an increase in the demand for government services as living standards and community expectations continue to rise
the demand for new technologies increasing the cost of service delivery
an increase in investment in transport infrastructure, particularly for rail, funded through grants from the Budget and
higher finance costs resulting from an expanded capital works program funded in part by an increase in general government net debt over the forward estimates period.
Chart 3.1: Composition of total expenses – by type 2008-09
Capital grants4.1%
Finance3%
Employee-related49.5%
Other operating21%
Depreciation and amortisation
5.5%
Current grants and subsidies
16.7%
Employee expenses account for around 50 per cent of total expenses reflecting the labour intensive nature of government services. Employee expenses consist of salaries and wages, annual leave, long service leave and superannuation expenses.
3 - 6 Budget Statement 2008-09
The NSW Government employs some 370,000 people, equivalent to about 300,000 full-time employees. More than 80 per cent are employed in the general government sector with the majority of employees providing frontline services in the areas of health, education, and public order and safety.
Other operating costs account for around 21 per cent of total expenses and represent the day-to-day running costs incurred in the normal operation of agencies. They include the non-labour costs of providing goods and services, such as repairs and maintenance and rental accommodation.
Current grants and subsidies and capital grants are 20.8 per cent of total expenses. These are provided to local government authorities, non-government organisations and state public trading enterprises (PTEs) to fund services and infrastructure in health, education, community services, housing and transport. Grants are also provided for rural and regional assistance. Of the total grants, around 35 per cent represent Ministry of Transport grants and subsidies to public trading entities and private operators for the provision of rail, bus and ferry services. The Ministry’s share of funding will grow significantly over the forward estimates period reflecting the Government’s increased investment in transport infrastructure.
Other expenses include depreciation and amortisation (5 per cent) which represents the whole-of-life cost of assets, and finance costs (3 per cent) such as interest on finance leases and other public sector borrowings.
Total general government expenses are expected to decrease from an average 5.8 per cent per annum in the four years ending 2007-08, to 4.5 per cent per annum over the four years ending 2011-12. A slowing in the growth of employee expenses is central to the Budget outlook.
EMPLOYEE COSTS Table 3.2 shows growth in employee expenses over the forward estimates.
The growth in total employee expenses (including superannuation) is expected to decrease from 4.7 per cent in 2008-09 to 3.7 per cent in 2011-12. Future growth in employee expenses will be tempered by a combination of a reduction in the reported superannuation expense1 and moderation of wages growth.
1 Under AASB 119 the interest assumed to determine superannuation interest costs falls from 6.35 per cent to
5.85 per cent in 2010-11.
Budget Statement 2008-09 3 - 7

Table 3.2: General government employee expense growth, 2004-05 to 2011-12
2004-05 2005-06 2006-07 2007-08 2008-09 2009-10 2010-11 2011-12 Actual Actual Actual Revised Budget Forward estimates $m $m $m $m $m $m $m $m
Employee – other 17,061 18,033 18,773 20,237 21,065 22,155 22,846 23,766
Employee superannuation 2,444 2,699 2,571 2,290 2,514 2,538 2,500 2,520
Total Employee Expenses 19,505 20,732 21,344 22,527 23,579 24,693 25,346 26,286
Year on year change % 6.6 6.3 3.0 5.5 4.7 4.7 2.6 3.7
4 year average growth % 5.3 3.9
The Government has confirmed a range of initiatives to manage employee costs. The most significant of these is the wages policy which is to maintain the real value of past significant wage increases over time.
Premier’s Memorandum M2007-12 was issued on 11 September 2007 to announce the Government’s wages policy. The Government will fund wage increases and associated costs at 2.5 per cent per year, the mid-point of the Reserve Bank of Australia’s (RBA) 2–3 per cent target inflation range. The policy permits wage outcomes in excess of 2.5 per cent, but only where the additional expense is offset by employee-related cost savings. Growth in employee related expenses will also reflect other factors including, importantly, changes in the number of employees.
Most major award agreements will expire in 2008-09. Agreements to be renegotiated over this period cover employees working in the areas of health, education, emergency services, and the general public service. The current agreement for police does not expire until 30 June 2009.
While the Government’s wages policy will act to constrain wages growth on a unit cost basis, other factors will continue to exert upward pressure on employee costs such as:
recruitment of additional staff to deliver key front-line services including: ♦
♦
• additional doctors, nurses and allied health professionals to meet the NSW Government’s commitment for year-on-year increases in the number of hospital beds
• an increase in the NSW Police Force to allow for a further 750 officers by December 2011
ongoing industrial awards that provide a significant proportion of employees (ie. teachers and police) with pay increases above 2.5 per cent in 2008-09
3 - 8 Budget Statement 2008-09

the flow-through of Commonwealth funding into areas of State service delivery resulting in additional positions
♦
♦
♦
the increased value of accrued staff entitlements over the forward estimates period and
the filling of existing vacancies within agencies.
3.4 SERVICE DELIVERY
The NSW general government sector has over 100 agencies.
Under the Government Finance Statistics (GFS) framework, the activities or services of these agencies are categorised according to broad policy or function areas. These include health, education, social security and welfare, transport and communications, and public order and safety.
GFS policy areas will not necessarily align with individual agency level expenditure shown in Budget Paper No. 3 Budget Estimates. For example, the School Student Transport Scheme, which is categorised under the education policy area, is allocated in the Ministry of Transport’s budget.
While not directly corresponding to agency structures, the GFS policy area categories have been adopted here to show the allocation of resources to service delivery at a high level. It is also consistent with data presented in Chapter 10 as part of the disclosure requirements of the Uniform Presentation Framework for the Australian Loan Council.
Expenditure grouped in the other purposes category includes government and economic services (regulatory, policy and legal), environmental protection, agriculture and natural resources.
GFS policy areas assist in inter-jurisdictional comparisons but the categories do not necessarily align with state level service delivery structures.
Budget Statement 2008-09 3 - 9
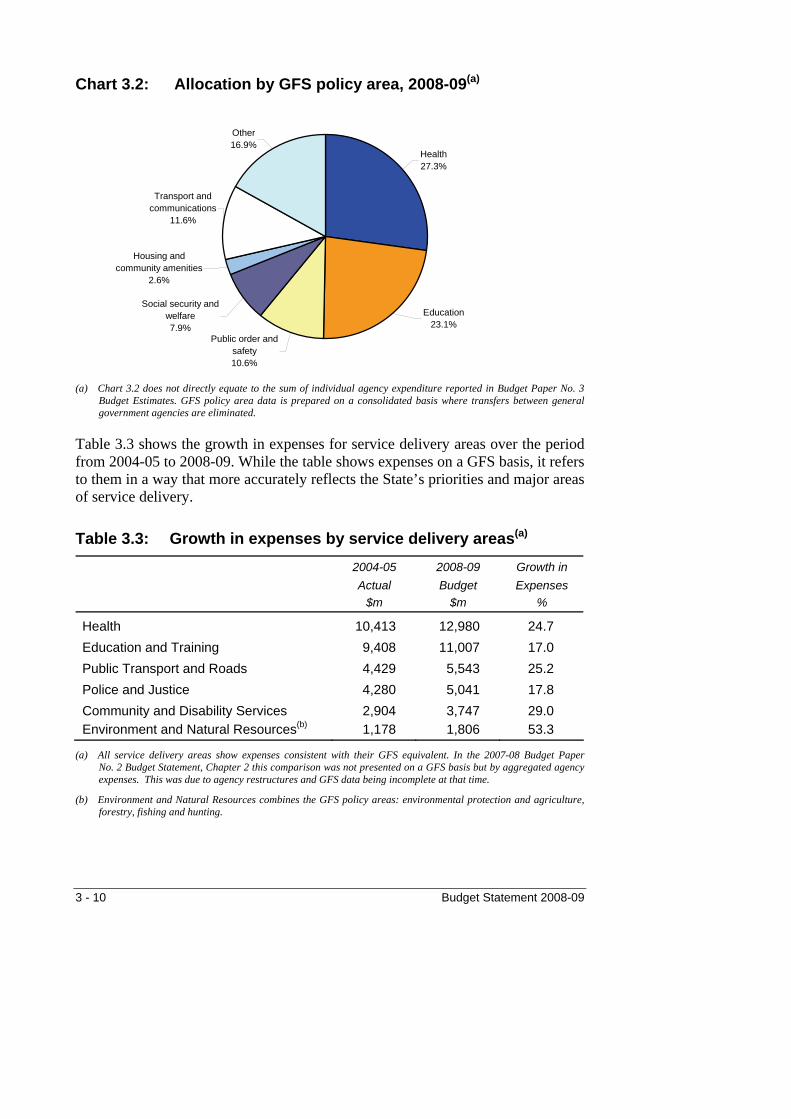
Chart 3.2: Allocation by GFS policy area, 2008-09(a)
Housing and community amenities
2.6%
Transport and communications
11.6%
Health27.3%
Education 23.1%
Other16.9%
Public order and safety10.6%
Social security and welfare 7.9%
(a) Chart 3.2 does not directly equate to the sum of individual agency expenditure reported in Budget Paper No. 3
Budget Estimates. GFS policy area data is prepared on a consolidated basis where transfers between general government agencies are eliminated.
Table 3.3 shows the growth in expenses for service delivery areas over the period from 2004-05 to 2008-09. While the table shows expenses on a GFS basis, it refers to them in a way that more accurately reflects the State’s priorities and major areas of service delivery.
Table 3.3: Growth in expenses by service delivery areas(a)
2004-05 2008-09 Growth in Actual Budget Expenses
$m $m %
Health 10,413 12,980 24.7 Education and Training 9,408 11,007 17.0 Public Transport and Roads 4,429 5,543 25.2 Police and Justice 4,280 5,041 17.8 Community and Disability Services 2,904 3,747 29.0 Environment and Natural Resources(b) 1,178 1,806 53.3
(a) All service delivery areas show expenses consistent with their GFS equivalent. In the 2007-08 Budget Paper No. 2 Budget Statement, Chapter 2 this comparison was not presented on a GFS basis but by aggregated agency expenses. This was due to agency restructures and GFS data being incomplete at that time.
(b) Environment and Natural Resources combines the GFS policy areas: environmental protection and agriculture, forestry, fishing and hunting.
3 - 10 Budget Statement 2008-09
The areas which have experienced the highest rates of growth reflect the Government’s response to changing external conditions and policy responses to climate change and drought, the need to upgrade transport infrastructure, increased demands in the area of child protection and support for people with disabilities.
The majority of general government spending is directed to health, education and training, public transport and roads which comprise over 60 per cent of total expenditure. This reflects the government’s key State Plan commitment:
delivering better services to the whole population in health, education and transport
♦
♦
♦
♦
♦
♦
♦
♦
the significant resource requirements (labour, technology and infrastructure) to deliver services effectively to the whole NSW population and
the provision of these services on a universal basis without discrimination (other than the basis of need) and often with free access.
A further 18.5 per cent of resources are directed to the areas of police and justice, and community and disability services. These areas support the State Plan activity including:
rights, respect and responsibility – the justice system and services that promote community involvement and citizenship and
fairness and opportunity – services that promote social justice and reduce disadvantage.
The remaining 19.5 per cent includes expenditure on environmental protection, and natural resources, government and economic services and housing and associated amenities. These areas provide general support to the State Plan in a lead and partner agency capacity to help achieve:
growing prosperity – activities that promote productivity and economic growth, particularly in rural and regional New South Wales
environment for living – planning for housing and jobs, environmental protection, arts and recreation and
core government responsibilities including regulatory, policy, planning and legal services.
The State Plan delivery structures support a collaborative and cross-portfolio approach to the implementation of priorities. Agencies may have lead and/or partner responsibilities under the State Plan that extend across traditional service delivery structures.
Budget Statement 2008-09 3 - 11

HEALTH The NSW health system aims to keep people healthy by delivering high quality health care and providing the health care that people need. A wide range of health services such as inpatient hospital care, emergency care, community health and mental health are delivered through eight Area Health Services and State-wide services such as the Ambulance Service.
The current Commonwealth-State split in roles and responsibilities for the funding, regulation and provision of health services is complex and provides scope for service gaps, overlaps, poor coordination and other inefficiencies. The NSW Government is working through COAG on reforms that will extend across the full range of preventative, primary, acute and aged care sectors and contribute to a more integrated and effective health system.
Key priorities outlined in the State Plan include: improved access to quality health care (S1); improved survival rates and quality of life for people with potentially fatal or chronic illness (S2); improved health through reduced obesity, smoking, illicit drug use and risk drinking (S3); improved outcomes in mental health (F3); and reduced avoidable hospital admissions (F5).
Health outcome indicators point to a NSW health system that is world class. Life expectancy at birth in New South Wales is 78.9 years for males and 83.7 years for females. Outside Australia, only males born in Iceland, and females born in Japan, France and Spain can expect to live longer.
Public access to quality health care is an ongoing priority of the Government. To meet this commitment, total expenditure by NSW Health will reach $13.2 billion in 2008-09. This is an increase of $632 million or five per cent on the 2007-08 Budget. Health spending represents around 27 per cent of the total NSW Budget, up from around 24 per cent in 1996-97.
NSW Health has been provided with substantial real funding increases for priorities such as mental health, improved access to emergency and acute services, and early intervention and prevention. Budgeted expenses for NSW Health will grow by an annual average rate of 7.2 per cent from 2004-05 to the 2008-09 Budget.
Funding provided in recent budgets and service improvements introduced by NSW Health have enabled the health system to continue to improve performance during 2007-08, despite a significant increase in demand and activity. For example, emergency department attendances for the nine months to March 2008 were up by 76,273 patients or 5.7 per cent compared to the same period last year.
3 - 12 Budget Statement 2008-09

Even with this increase in demand, considerable improvements have been realised in health service performance and productivity. For example, the number of patients waiting longer than 12 months for elective surgery has declined from over 10,000 in March 2005 to only 153 in February 2008.
The public health system continues to face increasing demand pressures driven by an ageing and growing population, worldwide workforce shortages, rising consumer expectations and technological change. These pressures require a Government policy response that manages expenditure growth, ensures best value for money and directs resources to areas of the highest clinical need.
To address these demographic and technological challenges, NSW Health has set strategic directions for the health system over the next ten to twenty years that include making prevention everybody’s business, strengthening primary health and continuing care in the community, creating better experiences for people using health services, ensuring a fair and sustainable health system and building a sustainable health workforce.
Some of the key programs and strategies for NSW Health in 2008-09 are:
continuing the focus on improving hospital productivity; reforming services in light of evidence and best practice; investing in early intervention and prevention activities; and increasing the emphasis on health care at home
♦
♦
♦
♦
♦
♦
introducing episode funding for hospital services as part of a nationally consistent approach to activity-based funding for hospital services and internal capital charging to recognise the cost of capital
continuing the expansion of after hours GP clinics and HealthOne services which involve the integration of public and private sector general practices and other health care services
implementing the third year of the Government’s five year, $939 million plan for A New Direction in Mental Health, to provide earlier and better access to a greater range of mental health services to the people of New South Wales.
funding of $48.9 million for the full year cost of operating an additional 180 acute beds added in 2007-08 to ease the pressure on the busiest emergency departments
using Commonwealth elective surgery funding of $28.9 million in 2008-09 to ensure that no elective surgery patients are overdue for their recommended timeframe of treatment by the end of December 2008
Budget Statement 2008-09 3 - 13

investing in oral health services including $7.5 million over three years to expand water fluoridation in NSW communities and a further $4 million for recruitment and retention of public oral health practitioners State-wide
♦
♦
♦
♦
♦
♦
spending $3 million as part of its $14 million commitment over four years to create a further 80 clinical nurse educator positions across the State to increase nursing workforce skills and enhance patient safety
funding for Aboriginal communities including $19.1 million over four years to provide quality access to early childhood health services and $15.2 million over four years to expand the existing Housing and Accommodation Support Initiative to provide improved housing
investing $839.5 million in the 2008-09 capital works program including: redevelopment of Narrabri Hospital; the Lismore Hospital Stage 2 Integrated Cancer Care Centre; mental health units in Gosford, Bloomfield, St George and James Fletcher Hospitals; radiotherapy services; investment in diagnostic and treatment equipment; and completion of the Newcastle Mater Hospital redevelopment and the Forensic Hospital at Long Bay Correctional Facility as privately financed projects
the continuation of current major projects including redevelopment at Auburn, Liverpool and Royal North Shore Hospitals, and rural projects including redevelopments at Orange and Queanbeyan and
the continuing rollout of the Rural Hospital and Health Service Program Phase 4.
EDUCATION AND TRAINING The Government’s education and training services include school education services, vocational and workforce training, technical and further education (TAFE) services, and student support services, including school student transport.
Most of the Government’s expenditure in this area goes towards delivering a quality public school education system that provides equitable opportunities for all students. School education services are provided through primary schools, secondary schools and grants to non-government schools. Its other core service provides a vocational training system that improves the skills and qualifications of students and provides life-long learning opportunities for all people in New South Wales.
3 - 14 Budget Statement 2008-09

Improved educational outcomes are a key Government priority. Education and training services contribute directly to the State Plan by focusing on: increasing levels of attainment for all students (S4); more students completing Year 12 or recognised vocational training (S5); more people participating in education and training throughout their life (P4); and better access to training in rural and regional New South Wales to support local economies (P7).
Overall, NSW students perform strongly against national literacy and numeracy benchmarks. Scores achieved for maths in recent Trends in International Mathematics and Science Study (TIMSS) are amongst the highest in Australia for Year 4 and the highest for Year 8, with scores for science being the highest in Year 8. In addition, NSW students rank highly in international maths, science and literacy tests, with 15 year old students near the top of the international rankings for reading.
The Government’s activities in education and training are affected by a range of expenditure drivers.
Education in NSW government schools is provided on a universal basis, free of charge. A core commitment in government schools is access for all students (including those with special needs and geographic, economic, social, or cultural disadvantage), and the provision of free or subsidised travel to schools for all students. Costs of educating and supporting students with special needs are expected to increase.
♦
♦
♦
♦
♦
Teaching is labour intensive, with over 50,000 front-line teachers. There has been real wage growth for teachers under the current wage agreement.
There are 2,240 government schools and 134 TAFE campuses across the State. Costs arise from the maintenance and upgrade of buildings, and the rapid expansion into school classrooms of new technologies with high up-front and ongoing costs.
External conditions also affect education services.
Long-term demographic trends show an ageing population and a shrinking proportion of the school-aged population. While this proportion is decreasing, the total number of students will increase gradually in the medium to longer term.
Employers and students require an increasingly wide range of training solutions, driven by significant skilled labour shortages, technological change in the workplace, and the changing patterns of work and job roles.
Budget Statement 2008-09 3 - 15
The 2008-09 total expenses for the education and training policy area will be $11 billion. This includes an increase of $494 million for the Department of Education and Training, which is a 4.7 per cent increase on the 2007-08 Budget. This increase is mainly due to an additional $403 million for school education. Other government agencies, including the Office of the Board of Studies and the Ministry of Transport, will provide over $500 million to support education services in 2008-09.
Some of the key strategies and programs for the Department of Education and Training include:
To help all students achieve their potential, the Government supports targeted interventions including: equity programs for disadvantaged students; additional services for students with learning difficulties or disabilities; and programs for gifted and talented students.
♦
♦
♦
♦
♦
Support for travel to school for students costs over $500 million and includes transport services such as private transport for students with disabilities.
Over the last four years, new expenditure of nearly $1 billion has targeted a broad range of educational improvements including literacy and numeracy programs, improved teacher quality, an expanded range of support options for students with disruptive behaviour, equity programs for disadvantaged students, improved learning outcomes for Aboriginal school students, and school maintenance and technology initiatives. An additional 1,500 teacher positions were created to reduce class sizes in years K-2 to State-wide averages of 20, 22 and 24 children, respectively.
Other continuing initiatives will further improve educational outcomes for students, will provide extra support to new teachers, will introduce a consistent literacy and numeracy assessment for Kindergarten students in public schools, and provide support for the transition of students from primary to secondary schools at 463 secondary schools State-wide.
Capital expenditure of about $650 million in 2008-09 will upgrade NSW government school buildings and infrastructure including: initiatives to improve sport facilities and encourage physical activity; the Connected Classrooms initiative to provide videoconferencing, interactive whiteboards, and information-sharing tools in schools; and the $280 million four year Building Better Schools initiative to provide additional toilet upgrades, electrical upgrades, security fences and halls and gyms and 800 science laboratory upgrades.
3 - 16 Budget Statement 2008-09
In 2008-09, TAFE NSW, the largest provider of workforce training in Australia through its ten institutes, has an estimated operating cost of $1.7 billion and $85 million for the construction and upgrading of buildings and other infrastructure.
To meet new and emerging demands for training, TAFE NSW is strengthening its relationships with industry and enterprises, is customising services locally, and is investing in staff and technology. It will offer greater service diversity and flexibility for students.
♦
♦
♦
Targeted funded programs are increasing enrolments in skill shortage areas.
Current vocational education and training initiatives include: the Training our Workforce initiative to generate more than 33,000 additional training opportunities, including establishing a network of ten NSW Skill Centres; and the Learn or Earn initiative to improve trade skills for young people and increase take up and completion of apprenticeships and vocational education. This initiative is providing guaranteed places for 5,850 young people under 18 years of age who have not completed Year 12 and do not have a job; from 13,000 new training places at TAFE NSW.
PUBLIC TRANSPORT AND ROADS The public transport and roads portfolio area has two components: the management of the road system and road users undertaken by the Roads and Traffic Authority of New South Wales (RTA) and the provision of public transport which is funded through the Ministry of Transport.
An efficient transport system is intrinsic to a productive state economy as well as connecting individuals to the community and maintaining their wellbeing.
The State Plan has identified three related priorities: increasing the share of peak hour journeys on a safe and reliable public transport system (S6); improving the efficiency of the road network (E7); and safer roads (S7).
Forecast budget expenses for the transport area in 2008-09 (including grants to transport operators) are $5.5 billion. Over the period from 2004-05 to 2008-09, transport expenses will grow by around 25.2 per cent.
In 2008-09, RTA expenses are forecast to grow by 5.9 per cent (to around $2.4 billion), after having grown by an average of 3.2 per cent per annum over the past four years (including 3.9 per cent in 2007-08).
Budget Statement 2008-09 3 - 17

The overall rate of expenditure growth on roads is linked to funding from vehicle taxes and charges and also is tied to growth in the consumer price index and vehicle registrations. A major factor in the longer term, which will affect road expenditures (mainly capital), is the planned implementation of new infrastructure funding arrangements with the Commonwealth.
Growth in expenses over the period to 2008-09 predominantly reflects increases in the level of support for public transport, which comprises approximately 55 per cent of total transport expenses. The additional funding has been largely used to improve the performance of rail services. Significant additional financial support has been also provided for bus reform, which has led to improved services for commuters reflected in increased bus patronage figures.
In March 2008, the Government announced SydneyLink, a series of major transport projects to transform Sydney’s public transport infrastructure. The first stages of SydneyLink will be the $12 billion North West Metro and the $1.36 billion South West Rail Link. SydneyLink is the largest expansion of the rail network since the 1930s and will put services into the growing areas of the north west and south west of Sydney.
Funding for passenger rail services (including grants to RailCorp and to the Transport Infrastructure Development Corporation) have grown by 17.3 per cent over the four years from 2003-04 to 2007-08. This is budgeted to increase a further 18.1 per cent in 2008-09.
The growth in funding for passenger rail services reflects several related factors including:
The growth in budget grants for capital spending for rail more than doubling from $331 million in 2000-01 to $729 million in 2008-09, reflecting new rollingstock (new Millennium, Outer Suburban and Hunter rail cars) and the Epping Chatswood Rail Line and a private public partnership to deliver and maintain 626 new air-conditioned rail cars (with a total contract value of $3.6 billion).
♦
♦
♦
An increase in funding for CityRail maintenance commencing in 2000-01.
The slow down of CityRail revenue growth relative to expenses. Over the period 2001-02 to 2006-07, regulated fare revenue increased by 14.3 per cent, or an average of 2.9 per cent per annum, compared to an increase in operating expenses over the same period of 40 per cent, or an average of 8 per cent per annum. In 2007-08 fares are only forecast to recover around 24 per cent of projected CityRail operating expenses, compared with nearly 30.3 per cent in 2001-02.
3 - 18 Budget Statement 2008-09
Major service initiatives including recruiting and training 600 transit officers and recruiting additional drivers and guards (around 350 since January 2004).
♦
♦
♦
Implementation of the $1.8 billion Rail Clearways program to increase operational flexibility and capacity of the CityRail network.
Initiatives to improve the capital structure of transport businesses, including debt reduction.
The focus of the additional funding is not merely to maintain current performance, but to lay a foundation to secure the improved performance of CityRail into the next decade and to contribute towards meeting the State Plan priorities.
Customer service has been a major focus during 2007-08. The Customer Service Improvement Program is a plan for RailCorp that puts the customer at the centre of its operational planning and management. RailCorp have already started to deliver the first changes from this program.
The program will ensure that RailCorp focuses its efforts on getting the basic essentials right. This plan will involve a set of deliverables in 2008, 2009 and 2010 to systemically improve the customer service performance of RailCorp through a variety of measures.
The aim of the program is to significantly improve the quality and consistency of the day-to-day service provided by RailCorp to its customers, by lifting RailCorp’s performance and increasing its ability to deliver consistently acceptable levels of service across the network.
It consists of inter-related initiatives that address each customer service challenge. The program will ensure that the customer is at the centre RailCorp’s service and operations.
Funding for government and private bus services and other private transport, including the School Student Transport Scheme, will increase 6.9 per cent to $897 million in 2008-09. This compares to $684 million in 2004-05 immediately prior to the commencement of bus reform.
The future rate of growth of transport expenditure reflects significant emerging spending on major rail initiatives, particularly SydneyLink projects including the North West Metro and the South West Rail Link ($4.1 billion over four years) and the delivery of 626 new passenger rail carriages over three years from mid 2010.
Budget Statement 2008-09 3 - 19
POLICE AND JUSTICE The police and justice area covers the activities of agencies in the criminal justice system, including services provided by the NSW Police Force, the Attorney General’s Department, the Department of Corrective Services, and other emergency services agencies.
Keeping People Safe and Building Harmonious Communities are specific goals for the State Plan. Key priorities include: reducing rates of crime, particularly violent crime (R1); reducing re-offending (R2); and reducing levels of antisocial behaviour (R3).
Strategies to support the State Plan are targeted at achieving reductions of 10 per cent in the incidence of violent crimes against individuals and 15 per cent in the incidence of property crimes against households by 2016. The State Plan also aims to reduce the proportion of the NSW population who perceive problems with anti-social behaviour such as noisy neighbours and public drunkenness.
Between 2004-05 and 2008-09 expenditure in the police and justice area is expected to grow by 17.8 per cent to $5 billion, mainly due to increased police numbers and higher numbers of inmates in the correctional system.
The NSW Police Force’s average authorised police strength has been increased from 14,454 officers at 30 June 2003 to 15,206 officers as at 31 January 2007. Authorised strength will be progressively increased by a further 750 positions to 15,956 by December 2011.
The services and performance of criminal justice agencies are often sequential and interdependent. The key results of one agency can be influenced by the performance of other agencies as a person moves through the criminal justice system from one agency to another until their matter is finalised.
Increased policing activities and investigations have affected the courts system. Between 2003-04 and 2006-07, the number of criminal cases finalised in the Supreme, District and Local Courts increased by 4.4 per cent, with the largest increase occurring in the District Court.
The increased level of activity in the criminal courts has in turn resulted in more inmates within correctional centres. Between June 2003 and April 2008, the number of full time adult inmates increased from 8,113 to in excess of 9,600. Other factors contributing to this increase include legislative amendments that impose longer prison sentences and make obtaining bail more difficult. Changes in bail laws have increased the number of people on remand from 1,864 in June 2003 to 2,447 in April 2008.
3 - 20 Budget Statement 2008-09
Legislative amendments have also increased the number of juveniles in detention. Total juvenile admissions have risen from an average of 3,403 in 2003-04 to an estimated 5,610 in 2007-08, with around 90 per cent of those in custody on remand.
The NSW Police Force’s budget represents approximately 39 per cent of the police and justice area and is a major driver, both directly and indirectly, of expenditure growth. In addition to increasing police numbers, the growth in the Force’s expenditure reflects the provision of additional recurrent funding to support police operations, enhanced DNA testing and maintenance and other costs associated with the significant and ongoing upgrade of information technology and communications systems.
Funding of $191.2 million has been allocated over the next four years to increase the Police Force’s authorised strength by a further 750 officers by December 2011, along with further funding of $20 million for DNA testing and related initiatives. Capital funding totalling $67.5 million has been allocated in 2008-09 for new and ongoing information technology and communications works, including $26.4 million towards the upgrade of the Force’s Core Operating Policing System (COPS).
Expenditures by the departments of Corrective Services and Juvenile Justice have increased by 23.6 per cent from a combined $877.4 million in 2004-05 to an estimated $1.1 billion in 2008-09. This increase reflects demand pressures created by increasing inmate numbers and new initiatives to better monitor and supervise offenders serving community based orders to improve completion rates and reduce re-appearances in court.
The number of community based orders completed by young offenders remains high at around 90 per cent, while the percentage of all young offenders showing a reduction in their assessed risk of re-offending has increased from 56 per cent to 63 per cent between 2005-06 and 2007-08.
Current performance in reducing re-offending by inmates managed by the Department of Corrective Services is also showing some promising trends, with the percentage of offenders returning to court within 24 months of a conviction decreasing from 32.2 per cent in 2000 to 29.9 per cent in 2004. The department’s Throughcare program is addressing offender transitional needs through an improved assessment process and targeted programming directed at achieving and sustaining reduced rates of re-offending.
Budget Statement 2008-09 3 - 21

The Attorney General’s Department’s expenditures are expected to grow from $582 million in 2004-05 to $745.7 million in 2008-09, an increase of $163.7 million or 28.1 per cent. Around 78 per cent of the department’s expenditures in 2008-09 will be directed towards the provision of court services and crime prevention and community support services. The balance of funding is spent on a range of activities, including the provision of legal and regulatory services and services provided by the Crown Solicitor’s Office.
The department is continuing to develop and support new court diversion and intervention programs such as the Rural Alcohol Diversion Program, the Magistrates’ Early Referral Into Treatment program, Young Adult Conferencing, and the implementation of the Domestic Violence Intervention Court Model.
Other recent initiatives have also had a significant impact on those coming into contact with courts, including reforms to improve the protection of sexual assault complainants and additional safeguards for children and other vulnerable witnesses. The successful Circle Sentencing Program, which is targeted at reducing re-offending rates in Aboriginal communities, has also been expanded beyond regional New South Wales into Sydney.
Over the next four years, the Attorney General’s Department will continue to focus on improving court facilities and support systems, further developing Alternate Dispute Resolution mechanisms through court-based mediation and Community Justice Centres and expanding the Aboriginal Mediation Program with the aim of reducing the current over-representation of Aboriginal people in the legal system.
COMMUNITY AND DISABILITY SERVICES The Government provides community and disability services to support those who are most disadvantaged in our community or who need support during times of crisis. There is a wide range of responsive services, including accommodation for people with a disability, support and intervention to help families and children at risk, and community-based services to assist frail older people and people with a disability to participate in community life and live at home.
Access to community and disability services that improves opportunities for the most disadvantaged and vulnerable is a key priority for the Government. Services such as preschool programs and community care programs will be expanded and reshaped to focus on strategies for prevention and early intervention. Total expenditure in this area will reach $3.7 billion in 2008-09. Expenses will grow by an annual average rate of 6.6 per cent from 2004-05 to 2008-09.
3 - 22 Budget Statement 2008-09
Specific State Plan priorities which support the delivery of these broad outcomes include: improved health and education outcomes for Aboriginal people (F1); increased employment and community participation for people with disabilities (F2); increased proportion of children with skills for life and learning at school entry (F6); and reduced rates of child abuse and neglect (F7).
The Department of Community Services promotes the safety and wellbeing of children and young people by supporting vulnerable families and intervening where there is a risk of harm or neglect to children or young people. For those children who are not able to safely remain with their families, the department supports their carers to provide a safe, well-functioning placement.
The Department has dealt with an increase in child protection reports, from reports concerning 85,000 children in 2001-02 to reports concerning more than 132,100 children estimated in 2007-08, an increase of over 55 per cent for the period. To respond to this increase, by June 2008 the Department of Community Services expects to employ an extra 1,025 caseworkers in early intervention, child protection and out-of-home care compared with June 2004. In 2008-09, the department will spend:
$195 million to purchase services that support families in crisis such as homelessness or domestic violence, and help them to re-establish independent living arrangements.
♦
♦
♦
♦
$263 million on prevention and early intervention, including $49 million on the Brighter Futures early intervention program to support vulnerable families and reduce child abuse and neglect and $141 million on support for preschools and children’s services. An extra $21 million per year under the Government’s Preschool Investment and Reform Plan will achieve universal access to a preschool program for children in the year before school by providing preschool opportunities for an additional 10,500 children for two days per week.
$395 million on child protection services including investigation, support services such as counselling and health assessments, and referral to court if necessary.
$495 million on out-of-home care services. In addition to caseworkers who manage individual placements, out-of-home care services are being expanded to provide increased placements and services such as counselling and health assessments.
The Department of Ageing, Disability and Home Care is responsible for delivering programs and policies that assist older people and people with a disability and their carers to participate in community life.
Budget Statement 2008-09 3 - 23
In 2006-07, the Government committed a record $1.3 billion in new funding over a five year period to support the strategy, Stronger Together: A new direction for disability services. The Department will use these funds to manage demand pressures from the impact of ageing carers and improved life expectancies for people with disabilities. Stronger Together will provide more assistance for people with disabilities to live in their own home and increase the range of specialist accommodation services for those unable to live at home.
Some of the key programs and strategies for the Department of Ageing, Disability and Home Care in 2008-09 include:
expanding community support programs, resulting in additional places for post school programs for disabled people who leave school but are unable to enter the workforce ($47.4 million in 2008-09), additional attendant care places offering intensive in-home support ($14.1 million in 2008-09), and new flexible respite places ($14.7 million in 2008-09)
♦
♦
♦
♦
♦
providing $5 million over four years ($1.5 million in 2008-09) for intensive assistance to 410 children and their families with managing problem behaviours, both at home and at school; and $500,000 over four years to keep children with autism spectrum disorder at school and
620 additional supported accommodation places ($109.3 million in 2008-09) to improve the circumstances of young people in nursing homes and provide alternative models of support for young people living in nursing homes.
Aboriginal people within the community remain disadvantaged with various economic and social indicators showing a considerable level of disparity in outcomes. The Government’s continued commitment to Aboriginal communities is reflected in the following priorities for 2008-09:
There will be a strengthened focus on improving the safety and wellbeing of Aboriginal children, particularly through the implementation of the New South Wales Interagency Plan to Tackle Child Sexual Assault in Aboriginal Communities. This includes providing a Community Officer and community activities in ‘Focus Communities’ to raise awareness and prevention of child sexual assault in Aboriginal communities.
Providing Community Officers in 40 Partnership Communities, who will work with government and non-government agencies to connect services to needs in Aboriginal communities.
3 - 24 Budget Statement 2008-09

ENVIRONMENT AND NATURAL RESOURCES The Government is pursuing a range of environmental initiatives and programs targeted at addressing the impact of climate change and reducing greenhouse gas emissions; reducing environmental degradation and pollution; improving waste management; and improving the management of land and water resources and of the coastal environment.
Expenditure in this policy area is influenced by a number of factors including: the changing values and expectations of the community; the changing condition of the environment and the natural resource base; and the need to strike a balance between economic growth and environmental and natural resource protection.
In 2008-09, total expenses for the environment and natural resources area will be approximately $1.8 billion, an increase of 53 per cent since 2004-05. Key drivers of expenditure include initiatives to improve water management and address the impacts of climate change, increased drought assistance funding and the NSW Government’s response to the equine influenza virus.
Specific State Plan priorities which support the environment and conserve our natural resources include: a secure and sustainable water supply for all users (E1); a reliable electricity supply with increased use of renewable energy (E2); cleaner air and progress on greenhouse gas reductions (E3); and better outcomes for native vegetation, biodiversity, land, rivers and coastal waterways (E4).
The Department of Environment and Climate Change (DECC) is responsible for environment and natural resource policy and developing programs to address the impacts of climate change and broader sustainability issues. The department works closely with the Department of Water and Energy (DWE) on resource security and sustainability initiatives. DWE has responsibility for delivering policy reform in the water and energy sectors and carries out a regulatory and enforcement function within these sectors.
At a regional level, Catchment Management Authorities (CMAs) work in partnership with the community and other areas of government to develop and implement programs at a catchment level. In 2008-09, CMAs will spend $219.5 million on administering and implementing natural resource management programs, funded by the Commonwealth and NSW Governments.
A Memorandum of Understanding on Murray-Darling Basin reform was agreed in principle at the Council of Australian Governments’ (COAG) meeting on 26 March 2008. New South Wales is working with the Commonwealth and other state governments to develop an investment plan for priority water saving projects in the Murray-Darling Basin.
Budget Statement 2008-09 3 - 25
COAG also agreed to adopt a single national emissions trading scheme to address the impacts of climate change. The national scheme will replace existing state and territory schemes including the NSW Greenhouse Gas Abatement Scheme, and in combination with complementary initiatives will establish a nationally consistent set of climate change measures. Progress is continuing on the development of a national renewable energy target.
Major initiatives and achievements include:
The $340 million Climate Change Fund will fund projects aimed at saving water and energy and reducing CO2 emissions.
♦
♦
♦
♦
♦
♦
The $439 million City and Country Environment Restoration Program continues to support the protection of high conservation value crown lands and marine environments.
The NSW Rivers Environmental Restoration Program (RERP), funded jointly by the Commonwealth ($71.77 million) and NSW Government ($101.5 million), aims to arrest the decline of rivers and wetlands.
The Department of Primary Industries will spend $442.6 million in 2008-09 to support and enhance the value of New South Wales’ primary industry exports, which currently represent approximately 40 per cent of the State’s export revenue.
The Government has continued to expand the national park estate. The reserve system has been expanded by 600,000 hectares since 2005-06 with an additional 12 new parks and reserves in 2007-08. Expenditure in 2008-09 for land acquisitions for parks across New South Wales is budgeted at $12.6 million. A further $3.4 million has been allocated for national park fire management and $3.9 million for upgrading public infrastructure in the Kosciuszko National Park.
During 2008-09, the Government is providing $13.2 million in waste service improvement payments to Councils to drive and reward improved Council waste systems and management.
3 - 26 Budget Statement 2008-09
CHAPTER 4: GENERAL GOVERNMENT REVENUES
♦ The NSW Government has undertaken substantial tax reductions since August
2005, including the abolition of vendor duty, reduced club gaming machine duty rates and major changes to land tax.
♦ The NSW Government continues to reduce tax and improve tax competitiveness in this Budget.
♦ The payroll tax threshold will be indexed annually in line with the Consumer Price Index (CPI).
♦ The payroll tax rate will be cut from 6 per cent to 5.5 per cent:
− The rate will be reduced to 5.75 per cent from 1 January 2009.
− The rate will be further reduced to 5.65 per cent from 1 January 2010.
− The rate will fall to 5.5 per cent from 1 January 2011.
♦ Transfer duty on non-land business assets will be abolished from 1 January 2011, 18 months ahead of the previous schedule.
♦ Tax changes in the 2008-09 Budget together with other measures taking effect in the forward estimates will reduce taxation revenue by $344 million in 2008-09, rising to $1.4 billion in 2011-12, with a cumulative cost over the forward estimates of $3.6 billion.
♦ Revenue is expected to grow by 3.2 per cent in 2008-09, following growth of 3.7 per cent in 2007-08.
4.1 INTRODUCTION
Government revenue is essential to fund the delivery of services in New South Wales. At the same time, a competitive revenue and tax system is critical for the New South Wales economy.
Tax reductions in this and recent budgets have kept New South Wales competitive with other states. New tax policy measures in this Budget will improve the tax competitiveness of New South Wales.
Budget Statement 2008-09 4 - 1
Key influences on New South Wales tax revenue are employment and wage growth (payroll tax), volume and price growth in property sales (transfer duty), and land values (land tax). Commonwealth grant revenue is influenced by growth in the GST pool and by movements in the NSW share of the GST pool. These influences, and influences on other revenues, are discussed in detail in this chapter.
4.2 TAXATION POLICY MEASURES
There have already been substantial tax reductions since August 2005, including the abolition of vendor duty and mortgage duty for owner-occupiers and changes to land tax including a reduction in the land tax rate.
The NSW Government is committed to maintaining a competitive tax regime while meeting the service delivery needs of the people of New South Wales. The ability to enhance tax competitiveness is hampered by New South Wales receiving the second lowest GST revenue per capita of all the states and territories. This forces New South Wales to rely more heavily on tax revenue than most other states and territories.
Nonetheless, New South Wales has introduced a number of tax reductions and abolished a number of taxes over recent budgets in order to improve our tax competitiveness. When total revenue is assessed, New South Wales has one of the lowest ratios of total revenue per capita of all states.
This Budget introduces a number of measures which will further improve NSW interstate tax competitiveness.
The payroll tax threshold will be indexed annually from 1 July 2008, in line with movements in the Sydney Consumer Price Index (CPI). The threshold from 1 July 2008 will be $623,000.
♦
♦
♦
♦
The payroll tax rate will be reduced to 5.75 per cent from 1 January 2009, with further reductions to 5.65 per cent from 1 January 2010 and to 5.5 per cent from 1 January 2011.
Changes to payroll tax will exceed $1.9 billion over the forward estimates period.
The abolition of transfer duty on non-land business assets will be brought forward by 18 months from 1 July 2012 to 1 January 2011.
4 - 2 Budget Statement 2008-09
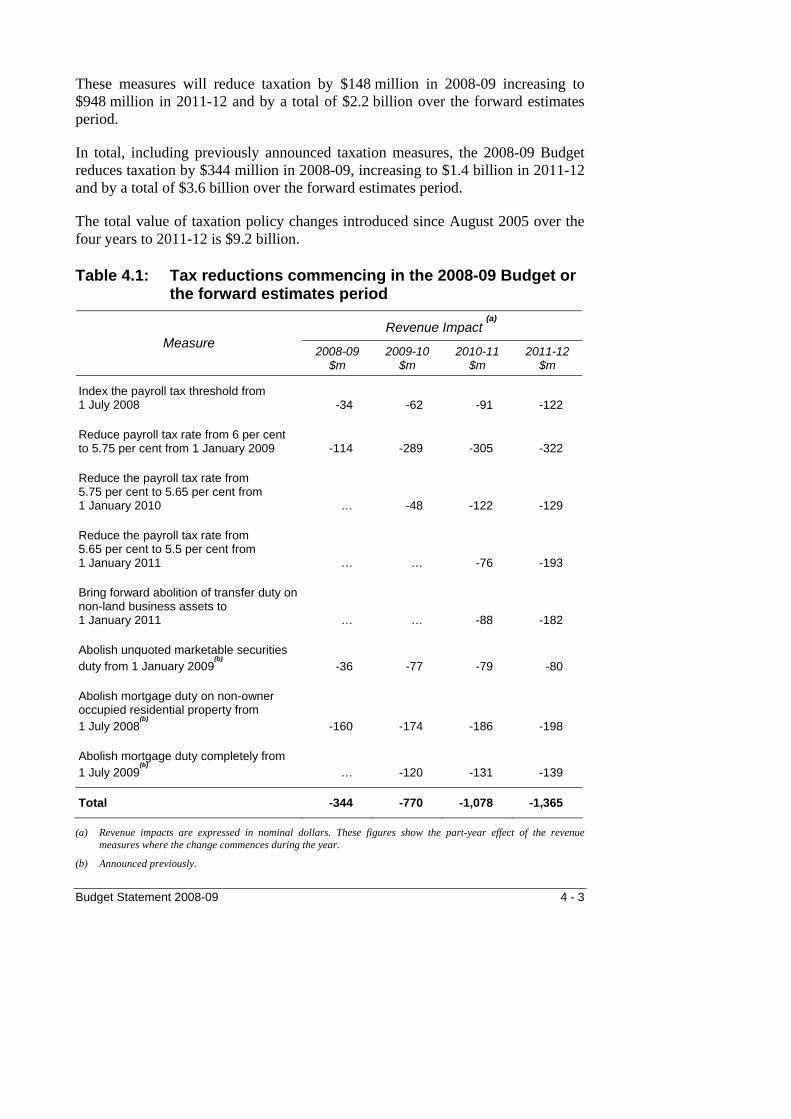
These measures will reduce taxation by $148 million in 2008-09 increasing to $948 million in 2011-12 and by a total of $2.2 billion over the forward estimates period.
In total, including previously announced taxation measures, the 2008-09 Budget reduces taxation by $344 million in 2008-09, increasing to $1.4 billion in 2011-12 and by a total of $3.6 billion over the forward estimates period.
The total value of taxation policy changes introduced since August 2005 over the four years to 2011-12 is $9.2 billion.
Table 4.1: Tax reductions commencing in the 2008-09 Budget or the forward estimates period
Revenue Impact (a)
Measure 2008-09
$m 2009-10
$m 2010-11
$m 2011-12
$m
Index the payroll tax threshold from 1 July 2008 -34 -62 -91 -122
Reduce payroll tax rate from 6 per cent to 5.75 per cent from 1 January 2009 -114 -289 -305 -322
Reduce the payroll tax rate from 5.75 per cent to 5.65 per cent from 1 January 2010 … -48 -122 -129
Reduce the payroll tax rate from 5.65 per cent to 5.5 per cent from 1 January 2011 … … -76 -193
Bring forward abolition of transfer duty on non-land business assets to 1 January 2011 … … -88 -182
Abolish unquoted marketable securities duty from 1 January 2009
(b)-36 -77 -79 -80
Abolish mortgage duty on non-owner occupied residential property from 1 July 2008
(b)-160 -174 -186 -198
Abolish mortgage duty completely from 1 July 2009
(b)… -120 -131 -139
Total -344 -770 -1,078 -1,365
(a) Revenue impacts are expressed in nominal dollars. These figures show the part-year effect of the revenue measures where the change commences during the year.
(b) Announced previously.
Budget Statement 2008-09 4 - 3

2008-09 BUDGET MEASURES
Payroll tax threshold indexation The Government will introduce annual indexation of the payroll tax threshold from 1 July 2008.
The payroll tax threshold will be indexed annually, from 1 July, based on the movement in the Sydney CPI over the year to the previous March quarter, which will be the most up to date information available.
The threshold applying from 1 July 2008 will be $623,000.
New South Wales will be the only state to annually index the payroll tax threshold.
This measure will provide tax relief to businesses by allowing for the impact of inflation on their wages bill.
This measure will reduce payroll tax revenue by $34 million in 2008-09 and by $309 million over the four years to 2011-12.
Payroll tax rate reduction The Government will reduce the payroll tax rate from 6 per cent to 5.5 per cent in three stages, starting from 1 January 2009.
The first reduction from 6 per cent to 5.75 per cent will occur from 1 January 2009, followed by a reduction to 5.65 per cent from 1 January 2010, and a further reduction to 5.5 per cent from 1 January 2011.
These lower rates will improve NSW payroll tax competitiveness. The 5.5 per cent rate will place New South Wales around the middle of the range of rates levied in the other states and territories and will improve NSW payroll tax competitiveness with the neighbouring states of Victoria and Queensland.
The reduction in the payroll tax rate is estimated to reduce payroll tax revenue by $114 million in 2008-09, rising to $644 million in 2011-12 when all three stages have been introduced.
Total cost to revenue over the four years 2008-09 to 2011-12 is $1.6 billion.
4 - 4 Budget Statement 2008-09

Abolition of transfer duty on non-land business assets In the 2006-07 Budget, the Government announced it would abolish transfer duty on non-land business assets from 1 July 2012. The Government will now abolish the duty from 1 January 2011, bringing forward the abolition by 18 months. These non-land assets include goodwill, patents, trademarks and other intellectual property (some assets, such as inventory and stock-in-trade, are not dutiable items).
Abolishing duty on non-land business assets will improve economic efficiency by removing this disincentive to move business capital to different ownership structures and investment opportunities.
The accelerated abolition of transfer duty on non-land business assets will reduce revenue by $88 million in 2010-11 and by $182 million in 2011-12.
Abolition of transfer duty on non-land business assets is the last of the taxes New South Wales decided to abolish following consideration of the taxes listed for review in the Intergovernmental Agreement on the Reform of Commonwealth-State Financial Relations (IGA). This tax is now being abolished 18 months ahead of schedule.
New South Wales has fulfilled all its obligations under the IGA.
Corporate reconstruction of property trusts A specific exemption from stamp duty will be provided to allow property trusts to restructure. The Commonwealth has already provided relief from capital gains tax for these restructures and the stamp duty exemption will match this relief. These restructures are to align Australian property trusts with real estate investment trusts in other markets.
There is no revenue impact from this exemption because these restructures would not occur without stamp duty relief.
MEASURES ANNOUNCED SINCE THE 2007-08 BUDGET
Casino taxation agreement In October 2007, the Government and Tabcorp Ltd announced a new taxation and exclusivity agreement for Star City Casino.
The Casino will pay higher duty rates under the agreement. From 1 July 2008, there will be a single rate scale applying to both table games and electronic gaming machines. Previously, table games and electronic gaming machines had separate tax scales.
Budget Statement 2008-09 4 - 5
Under the new arrangements tax will be calculated on a marginal rate scale related to gaming revenue. The new base rate will be 13.04 per cent in 2008-09, rising to 16.41 per cent from 2012-13. The new maximum marginal rate will be 38.04 per cent in 2008-09, rising to 38.91 per cent from 2009-10.
The agreement also provides for a $100 million exclusivity payment. This is accrued at $8.3 million a year under accounting rules.
Additional tax revenue is estimated to be $65.9 million over the four years 2008-09 to 2011-12, and includes the $8.3 million per year exclusivity payment. This tax estimate is based on current numbers of table games.
Keno extension to hotels The NSW Government granted an extension of Keno into hotels from 11 September 2007. Previously, only registered clubs and the Casino could offer Keno in New South Wales. In other states, hotels offer Keno.
The marginal tax rates for Keno in hotels are 8.91 per cent and 14.91 per cent. The higher marginal tax rate of 14.91 per cent applies above annual player loss of $37.7 million. This is a lower threshold than clubs, because of the lower anticipated size of the game in hotels.
This measure is estimated to generate $1.8 million in 2008-09 and $13 million over the forward estimates period.
4 - 6 Budget Statement 2008-09
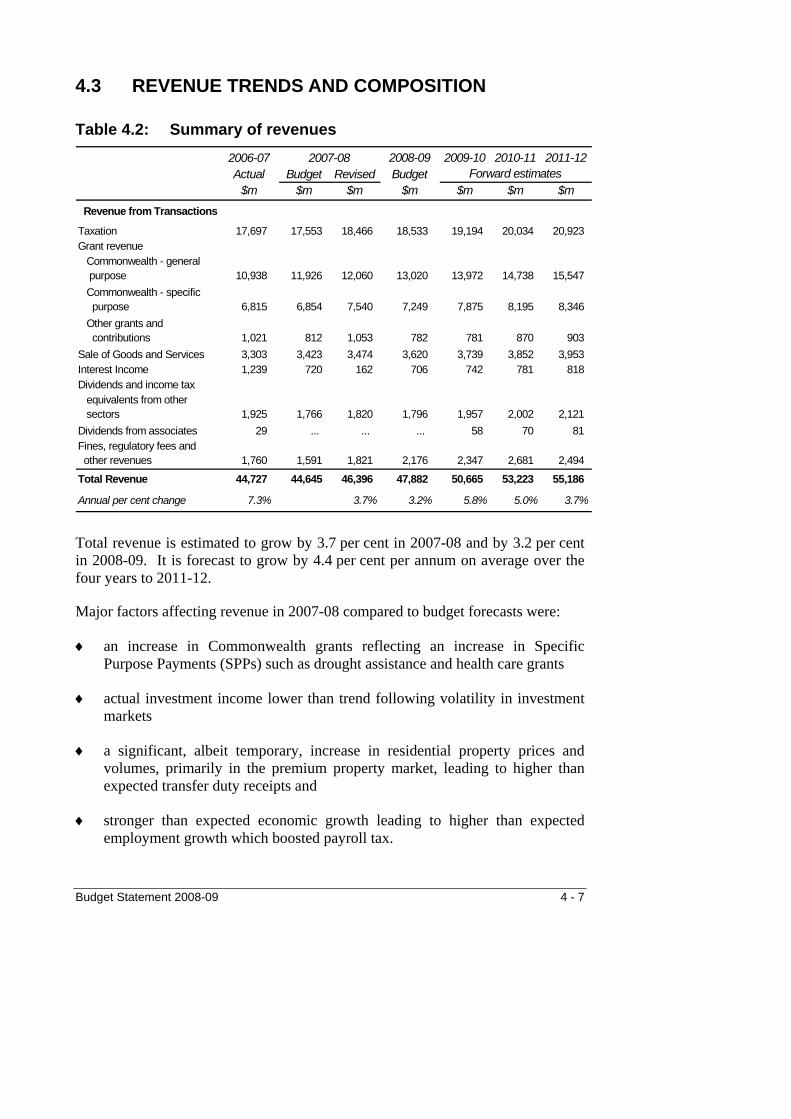
4.3 REVENUE TRENDS AND COMPOSITION
Table 4.2: Summary of revenues 2006-07 2008-09 2009-10 2010-11 2011-12Actual Budget Revised Budget
$m $m $m $m $m $m $m
Revenue from Transactions
Taxation 17,697 17,553 18,466 18,533 19,194 20,034 20,923 Grant revenue Commonwealth - general purpose 10,938 11,926 12,060 13,020 13,972 14,738 15,547 Commonwealth - specific purpose 6,815 6,854 7,540 7,249 7,875 8,195 8,346 Other grants and contributions 1,021 812 1,053 782 781 870 903 Sale of Goods and Services 3,303 3,423 3,474 3,620 3,739 3,852 3,953 Interest Income 1,239 720 162 706 742 781 818 Dividends and income tax equivalents from other sectors 1,925 1,766 1,820 1,796 1,957 2,002 2,121 Dividends from associates 29 ... ... ... 58 70 81 Fines, regulatory fees and other revenues 1,760 1,591 1,821 2,176 2,347 2,681 2,494
Total Revenue 44,727 44,645 46,396 47,882 50,665 53,223 55,186
Annual per cent change 7.3% 3.7% 3.2% 5.8% 5.0% 3.7%
2007-08Forward estimates
Total revenue is estimated to grow by 3.7 per cent in 2007-08 and by 3.2 per cent in 2008-09. It is forecast to grow by 4.4 per cent per annum on average over the four years to 2011-12.
Major factors affecting revenue in 2007-08 compared to budget forecasts were:
an increase in Commonwealth grants reflecting an increase in Specific Purpose Payments (SPPs) such as drought assistance and health care grants
♦
♦
♦
♦
actual investment income lower than trend following volatility in investment markets
a significant, albeit temporary, increase in residential property prices and volumes, primarily in the premium property market, leading to higher than expected transfer duty receipts and
stronger than expected economic growth leading to higher than expected employment growth which boosted payroll tax.
Budget Statement 2008-09 4 - 7
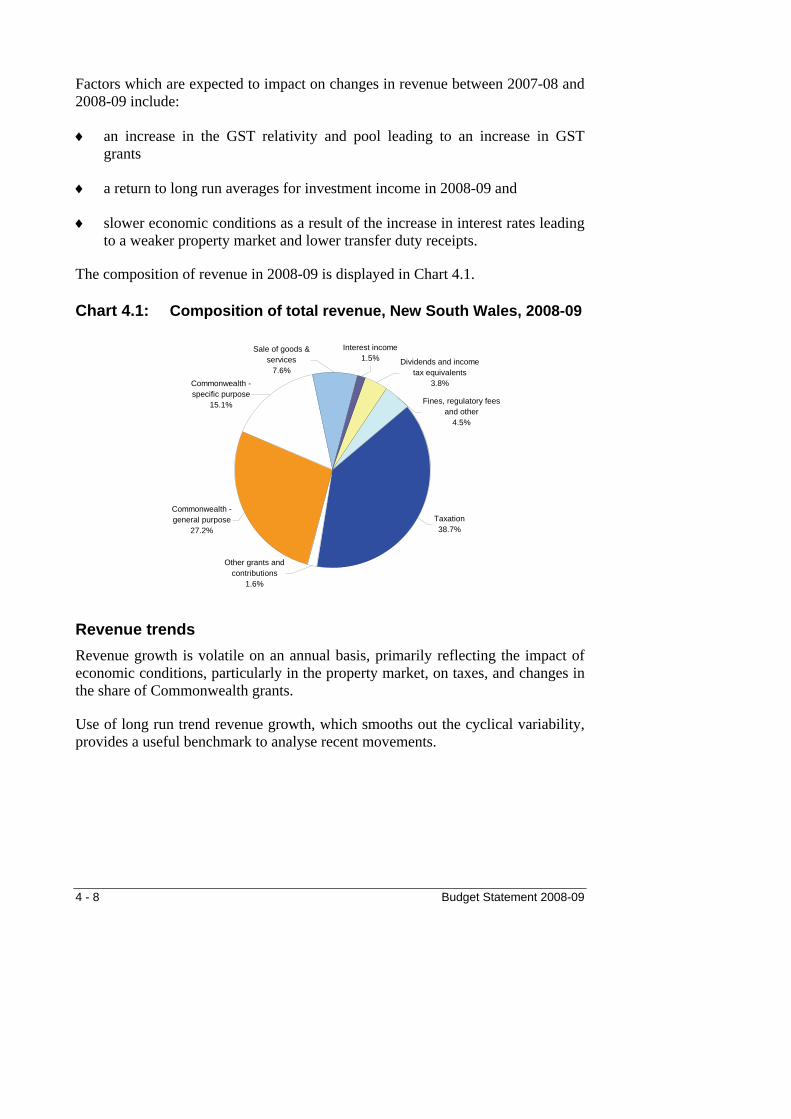
Factors which are expected to impact on changes in revenue between 2007-08 and 2008-09 include:
an increase in the GST relativity and pool leading to an increase in GST grants
♦
♦
♦
a return to long run averages for investment income in 2008-09 and
slower economic conditions as a result of the increase in interest rates leading to a weaker property market and lower transfer duty receipts.
The composition of revenue in 2008-09 is displayed in Chart 4.1.
Chart 4.1: Composition of total revenue, New South Wales, 2008-09
Dividends and income tax equivalents
3.8%
Fines, regulatory fees and other
4.5%
Interest income1.5%
Taxation38.7%
Other grants and contributions
1.6%
Commonwealth - general purpose
27.2%
Sale of goods & services
7.6%Commonwealth - specific purpose
15.1%
Revenue trends Revenue growth is volatile on an annual basis, primarily reflecting the impact of economic conditions, particularly in the property market, on taxes, and changes in the share of Commonwealth grants.
Use of long run trend revenue growth, which smooths out the cyclical variability, provides a useful benchmark to analyse recent movements.
4 - 8 Budget Statement 2008-09
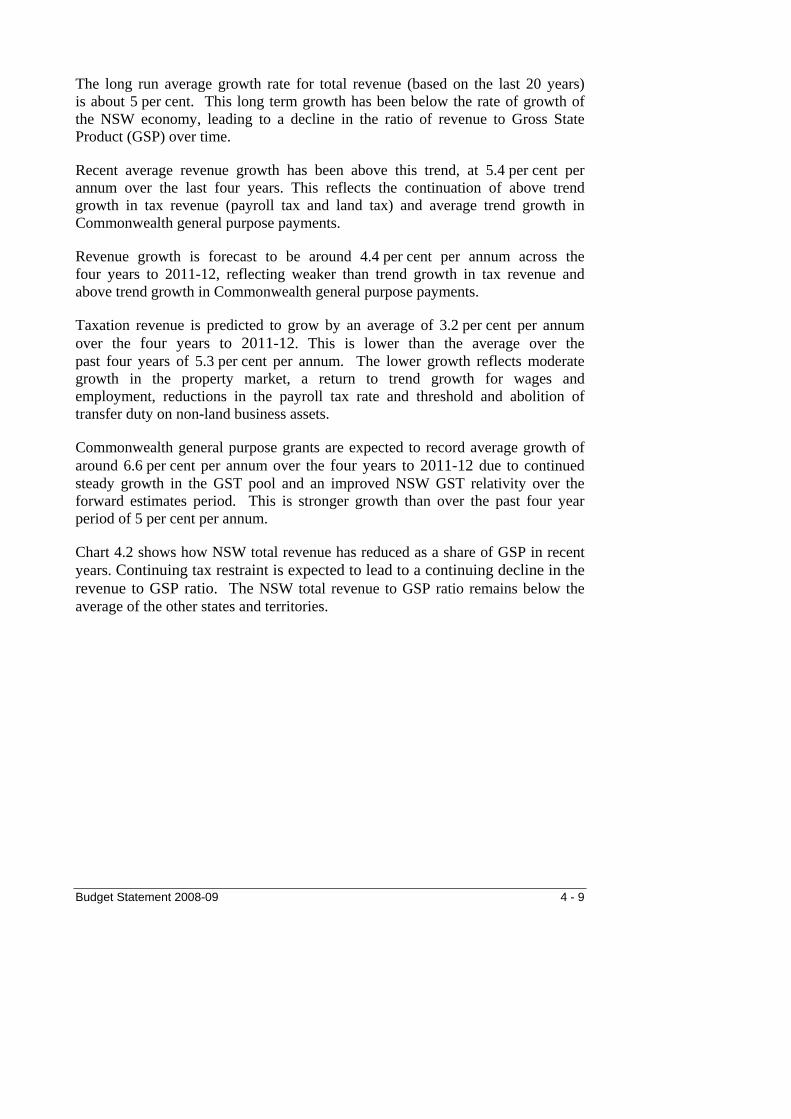
The long run average growth rate for total revenue (based on the last 20 years) is about 5 per cent. This long term growth has been below the rate of growth of the NSW economy, leading to a decline in the ratio of revenue to Gross State Product (GSP) over time.
Recent average revenue growth has been above this trend, at 5.4 per cent per annum over the last four years. This reflects the continuation of above trend growth in tax revenue (payroll tax and land tax) and average trend growth in Commonwealth general purpose payments.
Revenue growth is forecast to be around 4.4 per cent per annum across the four years to 2011-12, reflecting weaker than trend growth in tax revenue and above trend growth in Commonwealth general purpose payments.
Taxation revenue is predicted to grow by an average of 3.2 per cent per annum over the four years to 2011-12. This is lower than the average over the past four years of 5.3 per cent per annum. The lower growth reflects moderate growth in the property market, a return to trend growth for wages and employment, reductions in the payroll tax rate and threshold and abolition of transfer duty on non-land business assets.
Commonwealth general purpose grants are expected to record average growth of around 6.6 per cent per annum over the four years to 2011-12 due to continued steady growth in the GST pool and an improved NSW GST relativity over the forward estimates period. This is stronger growth than over the past four year period of 5 per cent per annum.
Chart 4.2 shows how NSW total revenue has reduced as a share of GSP in recent years. Continuing tax restraint is expected to lead to a continuing decline in the revenue to GSP ratio. The NSW total revenue to GSP ratio remains below the average of the other states and territories.
Budget Statement 2008-09 4 - 9

Chart 4.2: Total revenue as a ratio to gross state product
12
13
14
15
16
1999-00 2002-03 2005-06 2008-09
Per c
ent
NSW Australia excluding NSW
Sources: NSW total revenue 1999-2000 to 2008-09 is on a GFS-GAAP harmonised basis. Other states are ABS Government Finance Statistics Cat. 5512.0 and 2008-09 Budgets or 2007-08 Mid-Year Reviews less Commonwealth Grants for on-passing (payments ‘through’ the states).
ABS Gross state product: Cat. 5220.0 and NSW Treasury estimates.
Chart 4.3 shows New South Wales maintains lower revenue per capita than the average of the other states.
4 - 10 Budget Statement 2008-09

Chart 4.3: Total revenue per capita
4000
4800
5600
6400
7200
8000
8800
1999-00 2002-03 2005-06 2008-09
$ m
illio
n
NSW Australia excluding NSW
Sources: NSW total revenue 1999-2000 to 2008-09 is on a GFS-GAAP harmonised basis. Other states are ABS 2006-07 Government Finance Statistics Cat. 5512.0 and State and Territory 2008-09 Budgets or 2007-08 Mid-Year Reviews less Commonwealth Grants for on-passing (payments ‘through’ the states).
Table 4.3 shows that New South Wales has the second lowest total revenue per capita of all the states and territories. As a consequence of receiving the second lowest GST grants per capita, New South Wales has the third highest tax per capita of the eight states and territories.
Budget Statement 2008-09 4 - 11
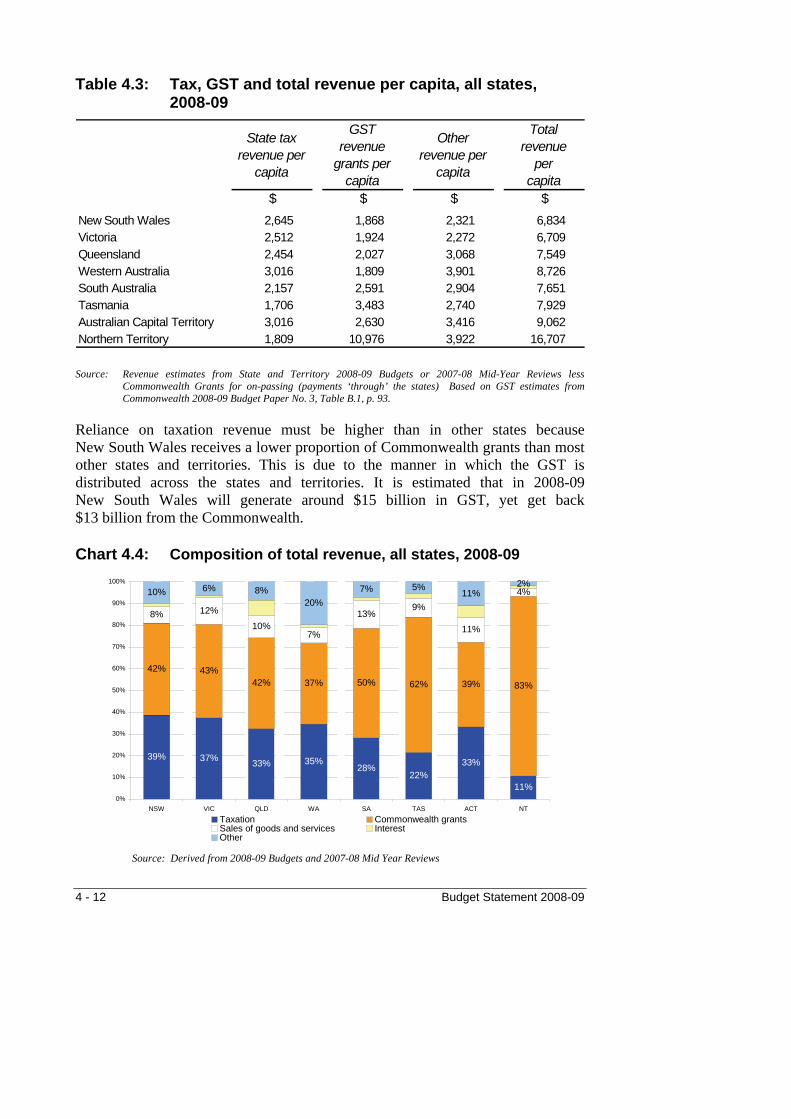
Table 4.3: Tax, GST and total revenue per capita, all states, 2008-09
State tax revenue per
capita
GST revenue
grants per capita
Other revenue per
capita
Total revenue
per capita
$ $ $ $New South Wales 2,645 1,868 2,321 6,834 Victoria 2,512 1,924 2,272 6,709 Queensland 2,454 2,027 3,068 7,549 Western Australia 3,016 1,809 3,901 8,726 South Australia 2,157 2,591 2,904 7,651 Tasmania 1,706 3,483 2,740 7,929 Australian Capital Territory 3,016 2,630 3,416 9,062 Northern Territory 1,809 10,976 3,922 16,707
Source: Revenue estimates from State and Territory 2008-09 Budgets or 2007-08 Mid-Year Reviews less
Commonwealth Grants for on-passing (payments ‘through’ the states) Based on GST estimates from Commonwealth 2008-09 Budget Paper No. 3, Table B.1, p. 93.
Reliance on taxation revenue must be higher than in other states because New South Wales receives a lower proportion of Commonwealth grants than most other states and territories. This is due to the manner in which the GST is distributed across the states and territories. It is estimated that in 2008-09 New South Wales will generate around $15 billion in GST, yet get back $13 billion from the Commonwealth.
Chart 4.4: Composition of total revenue, all states, 2008-09
39% 37% 33% 35%28%
22%33%
11%
42% 43%42% 37% 50% 62% 39% 83%
8% 12%
10%7%
13%9%
11%
4%10% 6% 8%20%
7% 5%11%
2%
0%
10%
20%
30%
40%
50%
60%
70%
80%
90%
100%
NSW VIC QLD WA SA TAS ACT NT
Taxation Commonwealth grantsSales of goods and services InterestOther
Source: Derived from 2008-09 Budgets and 2007-08 Mid Year Reviews
4 - 12 Budget Statement 2008-09
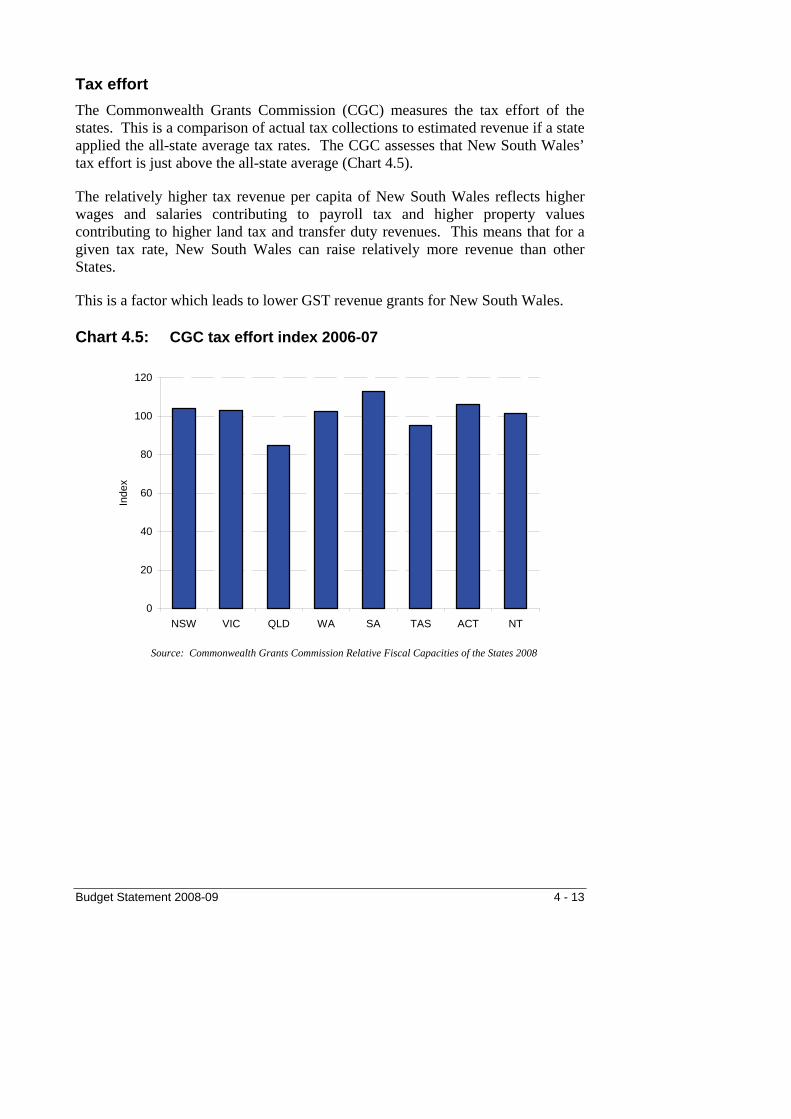
Tax effort The Commonwealth Grants Commission (CGC) measures the tax effort of the states. This is a comparison of actual tax collections to estimated revenue if a state applied the all-state average tax rates. The CGC assesses that New South Wales’ tax effort is just above the all-state average (Chart 4.5).
The relatively higher tax revenue per capita of New South Wales reflects higher wages and salaries contributing to payroll tax and higher property values contributing to higher land tax and transfer duty revenues. This means that for a given tax rate, New South Wales can raise relatively more revenue than other States.
This is a factor which leads to lower GST revenue grants for New South Wales.
Chart 4.5: CGC tax effort index 2006-07
0
20
40
60
80
100
120
NSW VIC QLD WA SA TAS ACT NT
Inde
x
Source: Commonwealth Grants Commission Relative Fiscal Capacities of the States 2008
Budget Statement 2008-09 4 - 13

Box 4.1: IPART review of taxation
In 2007, the Premier commissioned IPART to conduct a review of the State’s tax system. The terms of reference are:
♦ Given the existing GST agreement, assess the impact of the current system of Commonwealth-State fiscal relations on NSW revenue mix and the ability of NSW to fund essential public services.
Compare the efficiency of the taxes available to NSW and the Commonwealth. ♦
♦ Review the existing NSW tax system according to standard taxation principles (that is, efficiency, equity, simplicity and transparency) and the interstate competitiveness of NSW taxes.
♦ Recommend options to improve the efficiency, equity, interstate competitiveness, simplicity and transparency of NSW tax system, given the taxes available to it.
The terms of reference require IPART to provide a draft and final report. The Government will assess the IPART recommendations following receipt of the final report, expected in August.
The Prime Minister announced on 21 April 2008 that the Commonwealth would consider ‘root-and-branch’ reform of the Australian taxation system. He indicated the review would be a top-down approach encompassing Commonwealth and state taxes. A review of this nature could address the persistent problems of the states’ revenue base including vertical fiscal imbalance and the states’ narrow tax bases. The IPART report will cover these issues.
New South Wales welcomes a broad inquiry into the interaction between Commonwealth and state tax systems. New South Wales will participate in any substantial review of the total Australian tax system.
4 - 14 Budget Statement 2008-09
TAX RESTRAINT
In 2007-08, tax measures introduced since August 2005 reduced tax revenue by more than $900 million, or 4.8 per cent. This is a reduction of over $130 in tax revenue per capita, and a reduction of 0.3 per cent in tax as a share of GSP.
Tax reductions commencing in this budget will save taxpayers $344 million in 2008-09.
The Fiscal Responsibility Act 2005, Fiscal principle No. 10 requires:
that any adjustments to legislated tax rates, thresholds and bases are to be made with the maximum possible restraint having regard to the effect of these adjustments on the overall level of tax revenue, and policies should be pursued that are consistent with a reasonable degree of predictability and stability of tax rates, thresholds and bases for future years.
Some taxes have in-built restraint. For example, the land tax threshold is both indexed and averaged: this restrains land tax growth to the average growth in land values over the longer run.
Table 4.4 shows the effect of tax changes from new policy for each budget year from 1988-89 to 2011-12.
Budget Statement 2008-09 4 - 15
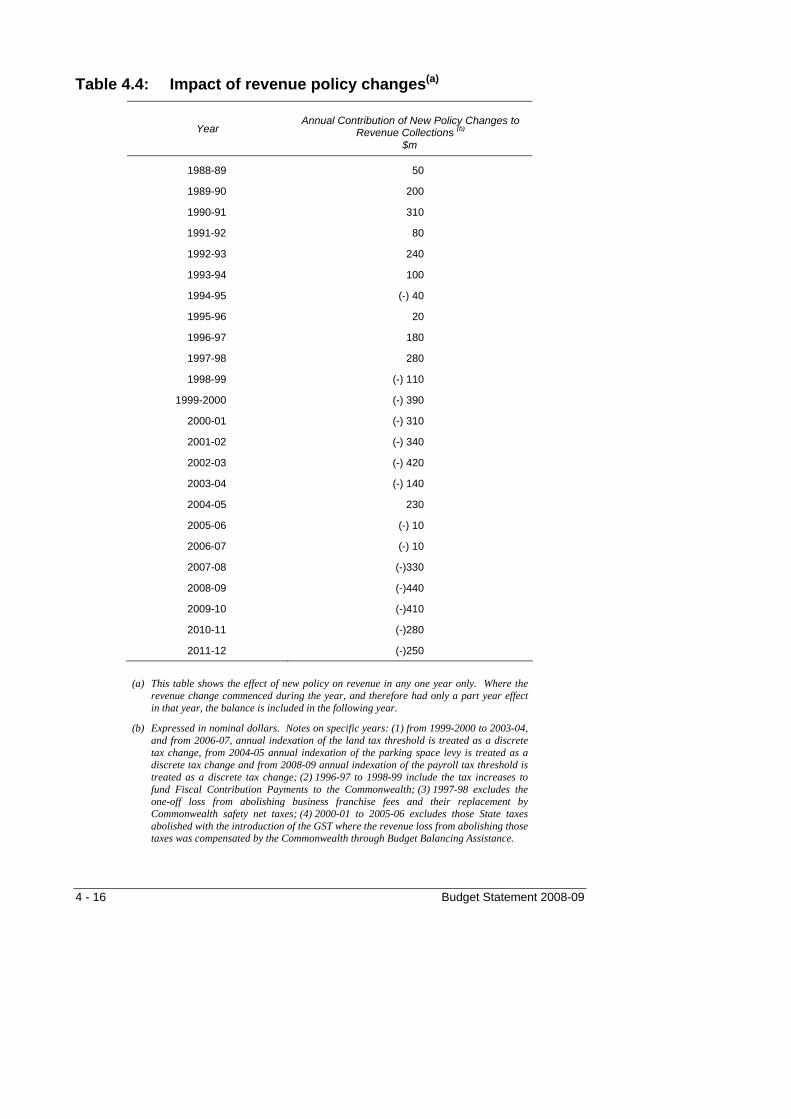
Table 4.4: Impact of revenue policy changes(a)
Year Annual Contribution of New Policy Changes to
Revenue Collections (b)
$m
1988-89 50
1989-90 200
1990-91 310
1991-92 80
1992-93 240
1993-94 100
1994-95 (-) 40
1995-96 20
1996-97 180
1997-98 280
1998-99 (-) 110
1999-2000 (-) 390
2000-01 (-) 310
2001-02 (-) 340
2002-03 (-) 420
2003-04 (-) 140
2004-05 230
2005-06 (-) 10
2006-07 (-) 10
2007-08 (-)330
2008-09 (-)440
2009-10 (-)410
2010-11 (-)280
2011-12 (-)250
(a) This table shows the effect of new policy on revenue in any one year only. Where the revenue change commenced during the year, and therefore had only a part year effect in that year, the balance is included in the following year.
(b) Expressed in nominal dollars. Notes on specific years: (1) from 1999-2000 to 2003-04, and from 2006-07, annual indexation of the land tax threshold is treated as a discrete tax change, from 2004-05 annual indexation of the parking space levy is treated as a discrete tax change and from 2008-09 annual indexation of the payroll tax threshold is treated as a discrete tax change; (2) 1996-97 to 1998-99 include the tax increases to fund Fiscal Contribution Payments to the Commonwealth; (3) 1997-98 excludes the one-off loss from abolishing business franchise fees and their replacement by Commonwealth safety net taxes; (4) 2000-01 to 2005-06 excludes those State taxes abolished with the introduction of the GST where the revenue loss from abolishing those taxes was compensated by the Commonwealth through Budget Balancing Assistance.
4 - 16 Budget Statement 2008-09
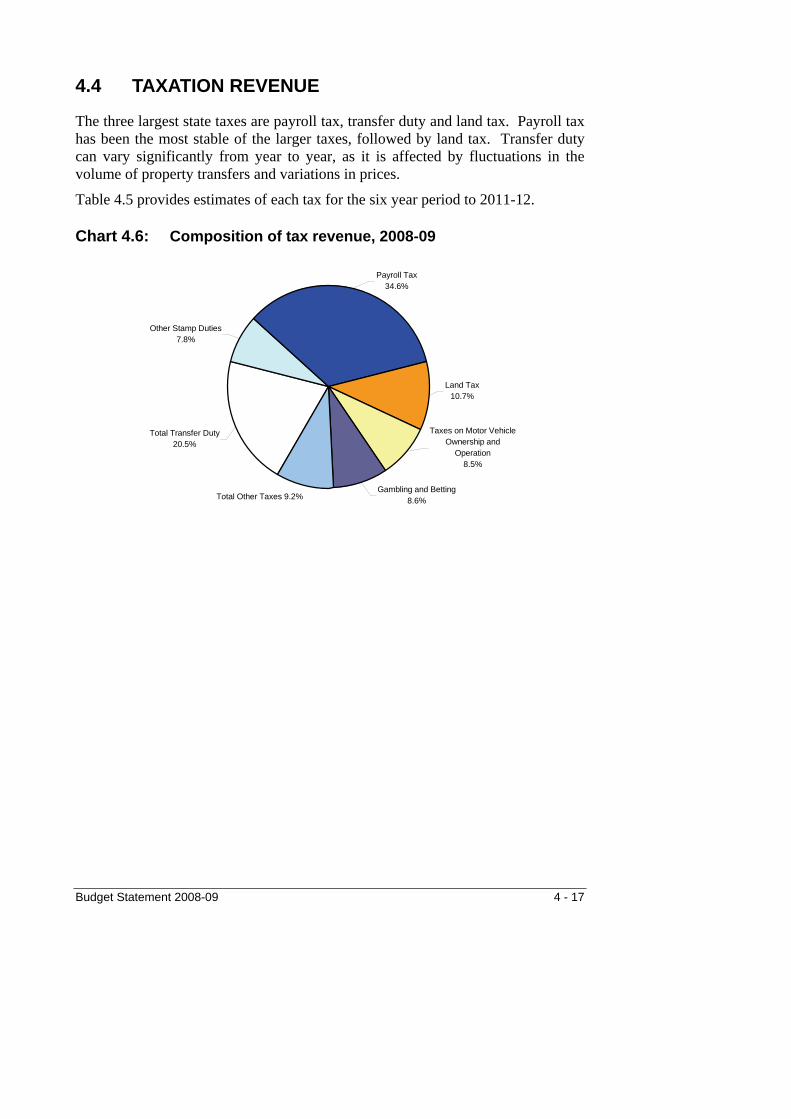
4.4 TAXATION REVENUE
The three largest state taxes are payroll tax, transfer duty and land tax. Payroll tax has been the most stable of the larger taxes, followed by land tax. Transfer duty can vary significantly from year to year, as it is affected by fluctuations in the volume of property transfers and variations in prices.
Table 4.5 provides estimates of each tax for the six year period to 2011-12.
Chart 4.6: Composition of tax revenue, 2008-09
Total Transfer Duty 20.5%
Other Stamp Duties 7.8%
Payroll Tax 34.6%
Land Tax 10.7%
Taxes on Motor Vehicle Ownership and
Operation 8.5%
Total Other Taxes 9.2%Gambling and Betting
8.6%
Budget Statement 2008-09 4 - 17
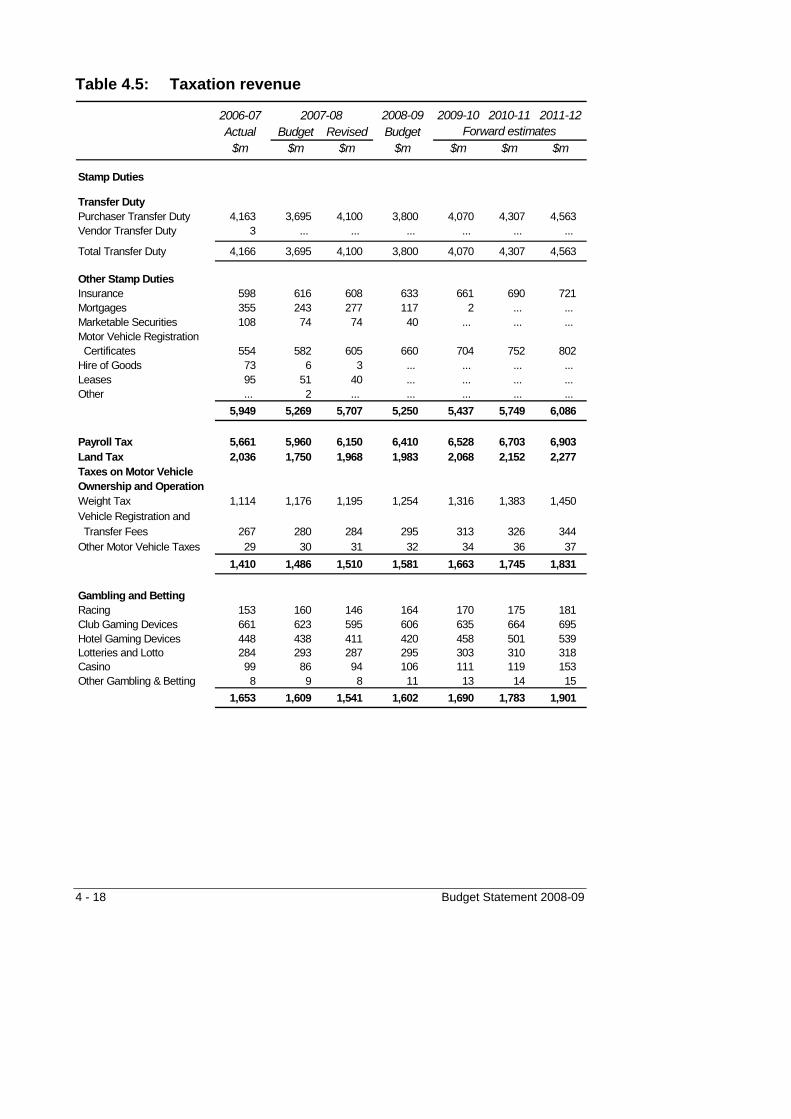
Table 4.5: Taxation revenue
2006-07 2008-09 2009-10 2010-11 2011-12Actual Budget Revised Budget
$m $m $m $m $m $m $m
Stamp Duties
Transfer DutyPurchaser Transfer Duty 4,163 3,695 4,100 3,800 4,070 4,307 4,563 Vendor Transfer Duty 3 ... ... ... ... ... ...
Total Transfer Duty 4,166 3,695 4,100 3,800 4,070 4,307 4,563
Other Stamp DutiesInsurance 598 616 608 633 661 690 721 Mortgages 355 243 277 117 2 ... ... Marketable Securities 108 74 74 40 ... ... ... Motor Vehicle Registration Certificates 554 582 605 660 704 752 802 Hire of Goods 73 6 3 ... ... ... ... Leases 95 51 40 ... ... ... ... Other ... 2 ... ... ... ... ...
5,949 5,269 5,707 5,250 5,437 5,749 6,086
Payroll Tax 5,661 5,960 6,150 6,410 6,528 6,703 6,903 Land Tax 2,036 1,750 1,968 1,983 2,068 2,152 2,277 Taxes on Motor Vehicle Ownership and OperationWeight Tax 1,114 1,176 1,195 1,254 1,316 1,383 1,450 Vehicle Registration and Transfer Fees 267 280 284 295 313 326 344 Other Motor Vehicle Taxes 29 30 31 32 34 36 37
1,410 1,486 1,510 1,581 1,663 1,745 1,831
Gambling and Betting Racing 153 160 146 164 170 175 181 Club Gaming Devices 661 623 595 606 635 664 695 Hotel Gaming Devices 448 438 411 420 458 501 539 Lotteries and Lotto 284 293 287 295 303 310 318 Casino 99 86 94 106 111 119 153 Other Gambling & Betting 8 9 8 11 13 14 15
1,653 1,609 1,541 1,602 1,690 1,783 1,901
Forward estimates2007-08
4 - 18 Budget Statement 2008-09
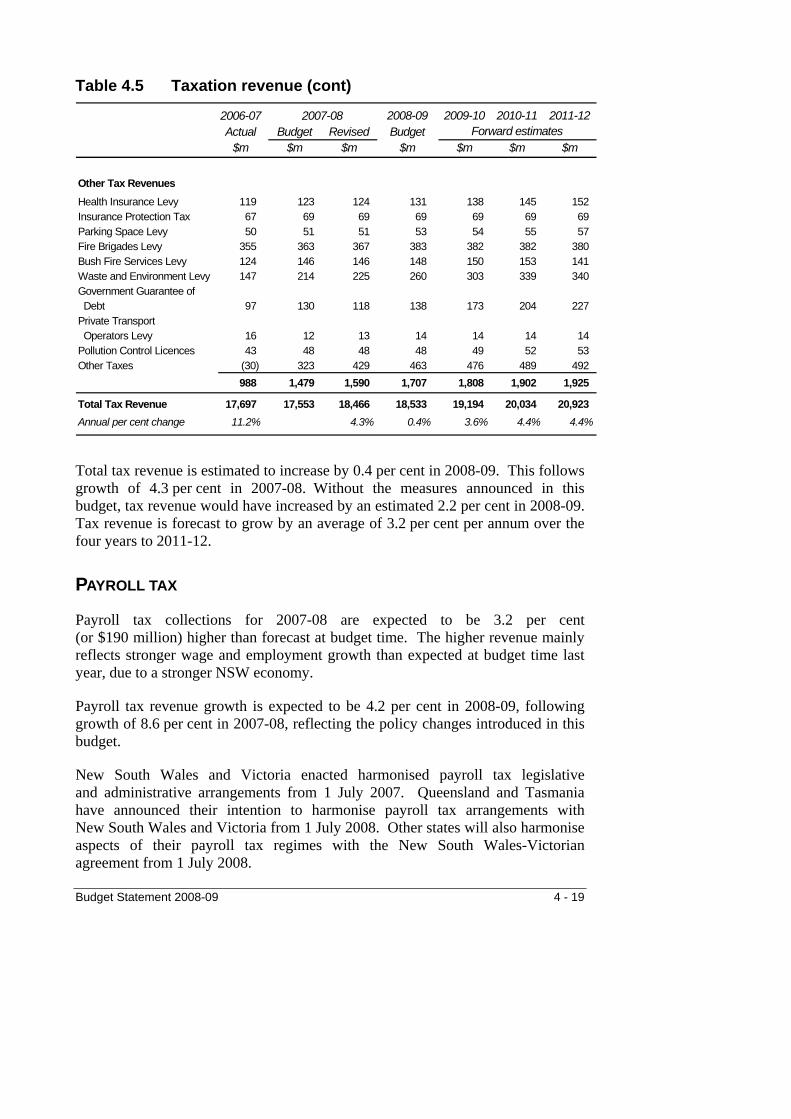
Table 4.5 Taxation revenue (cont)
2006-07 2008-09 2009-10 2010-11 2011-12Actual Budget Revised Budget
$m $m $m $m $m $m $m
Other Tax Revenues Health Insurance Levy 119 123 124 131 138 145 152 Insurance Protection Tax 67 69 69 69 69 69 69 Parking Space Levy 50 51 51 53 54 55 57 Fire Brigades Levy 355 363 367 383 382 382 380 Bush Fire Services Levy 124 146 146 148 150 153 141 Waste and Environment Levy 147 214 225 260 303 339 340 Government Guarantee of Debt 97 130 118 138 173 204 227 Private Transport Operators Levy 16 12 13 14 14 14 14 Pollution Control Licences 43 48 48 48 49 52 53 Other Taxes (30) 323 429 463 476 489 492
988 1,479 1,590 1,707 1,808 1,902 1,925
Total Tax Revenue 17,697 17,553 18,466 18,533 19,194 20,034 20,923 Annual per cent change 11.2% 4.3% 0.4% 3.6% 4.4% 4.4%
2007-08Forward estimates
Total tax revenue is estimated to increase by 0.4 per cent in 2008-09. This follows growth of 4.3 per cent in 2007-08. Without the measures announced in this budget, tax revenue would have increased by an estimated 2.2 per cent in 2008-09. Tax revenue is forecast to grow by an average of 3.2 per cent per annum over the four years to 2011-12.
PAYROLL TAX
Payroll tax collections for 2007-08 are expected to be 3.2 per cent (or $190 million) higher than forecast at budget time. The higher revenue mainly reflects stronger wage and employment growth than expected at budget time last year, due to a stronger NSW economy.
Payroll tax revenue growth is expected to be 4.2 per cent in 2008-09, following growth of 8.6 per cent in 2007-08, reflecting the policy changes introduced in this budget.
New South Wales and Victoria enacted harmonised payroll tax legislative and administrative arrangements from 1 July 2007. Queensland and Tasmania have announced their intention to harmonise payroll tax arrangements with New South Wales and Victoria from 1 July 2008. Other states will also harmonise aspects of their payroll tax regimes with the New South Wales-Victorian agreement from 1 July 2008.
Budget Statement 2008-09 4 - 19
This project aims to support business investment, improve competitiveness and increase productivity by simplifying administration and reducing red tape and compliance costs for businesses that operate in multiple states. The payroll tax harmonisation project is a key example demonstrating the Government’s commitment to cutting red tape, which is a Government priority in the State Plan.
TRANSFER DUTY
Transfer duty is the largest component of stamp duty revenue. It is also the most volatile component because it is affected by both volume and price fluctuations in property transfers. Annual changes in transfer duty have ranged from minus 30 per cent to plus 97 per cent in the last 20 years.
Purchaser transfer duty in 2007-08 is estimated to be $405 million, or 11 per cent, higher than expected at budget time last year. Revenue from residential and small commercial property transfers has been 5.1 per cent higher than expected, mainly due to a marked increase in the volume of higher-price residential purchases in the second half of 2007.
Revenue from large commercial transfers (where duty exceeds $1 million) has also been much stronger than expected. In total, more than $600 million in large transaction revenue is expected to be received in 2007-08 compared to an average of $325 million over the past five years (excluding one very large, unique transaction in 2006-07). Activity in the large transactions sector is expected to be closer to average historical levels in 2008-09.
Purchaser duty revenue is expected to decline by 7.3 per cent in 2008-09. Revenue from residential and small commercial property sales has slowed considerably since March 2008 as the recent interest rate increases have started to take effect. This slowing is expected to persist through 2008-09, with transfer duty growth returning to trend levels in 2009-10.
Forecasts for the forward estimates period reflect moderate growth in the property market.
LAND TAX
Land tax is assessed on a calendar year basis and is based on the three year average of unimproved land values as at 1 July each year, as determined by the NSW Valuer General. Notices of assessment are issued throughout the year, with most issued in either January or February.
4 - 20 Budget Statement 2008-09
Over the past three years the NSW Government has undertaken significant changes to land tax, including:
increasing the land tax free threshold from $330,000 to $352,000 in 2006 ♦
♦
♦
♦
indexing the threshold to movements in state-wide average land values from 2006
introducing three-year averaging of land values in 2007 and
cutting the land tax rate from 1.7 per cent to 1.6 per cent in 2008.
These changes are estimated to save land tax payers around $300 million in 2008-09.
Land tax revenue accrued in a financial year depends on the issue date of assessments and land values. For the 2008-09 financial year, land tax revenue accrued will include some residual assessments relating to the 2008 land tax year as well as the assessments relating to the 2009 land tax year.
Land tax is projected to be $218 million higher than budget in 2007-08, although this is still $68 million, or 3.3 per cent, less than in 2006-07. This reflects a combination of the processing of a higher than expected number of assessments related to the 2007 land tax year, faster than expected land value growth, particularly for high value properties, and additional compliance and administrative activity.
Policy decisions taken by the NSW Government reduced land tax in 2007-08 by around $230 million.
Land tax, after excluding revenue from the additional compliance and administrative activity in 2007-08, is estimated to grow by 5.7 per cent in 2008-09. Average land value is forecast to grow by 4.6 per cent for the year to 1 July 2008.
MOTOR VEHICLE TAXES
Motor vehicle weight tax and vehicle registration and transfer fees are the largest components of this category. Together, they represent 98 per cent of motor vehicle tax revenue in 2007-08. Revenue from motor vehicle registration and transfer fees is estimated to be 1.4 per cent above forecast for 2007-08, while weight tax is estimated to be 1.6 per cent above forecast.
Motor vehicle taxes are estimated to increase by 4.7 per cent in 2008-09.
Budget Statement 2008-09 4 - 21
GAMBLING AND BETTING TAXES
The decline in club and hotel gaming revenue in 2007-08 was larger than expected, with revenue estimated to be 5.2 per cent below forecast for the year. Club and hotel gaming revenue estimates for 2008-09 reflect the full year effect of the smoking ban, and slower growth in disposable income.
The totalisator (racing) revenue estimate for 2008-09 unwinds the one-off decrease in revenue in the second half of 2007 from equine influenza.
The relatively strong growth in other gambling and betting revenue in 2008-09 reflects the gradual introduction of Keno in hotels (offered from September 2007).
OTHER TAXES
The small negative result for 2006-07 is the result of a $292 million downward adjustment for the Electricity Tariff Equalisation Fund. Large outflows from the Fund were caused by high electricity spot prices in June 2007, after the 2007-08 Budget was finalised.
Box 4.2: Review of revenue forecasting
Econtech economic consultants reviewed Treasury’s forecasting methods for the major taxes and GST revenue grants.
The review found that the models used to obtain the forecasts were logically sound and include the main economic drivers in taxation calculations. Forecasts generally have relatively low forecasting errors and compare well relative to the performance of other states and territories.
The review also found that internal governance appeared robust with sound clearance processes, and that there was consultation with outside bodies to obtain and discuss the most up to date information to determine the forecasts.
Econtech suggested some further improvements to fine-tune the forecasting models, including establishing the relationship between land values and gross state product for land tax forecasts and using historical data to develop a growth rate forecast for motor vehicle transfers.
Treasury will investigate these suggestions and introduce those that improve forecast accuracy.
4 - 22 Budget Statement 2008-09

4.5 GRANT REVENUE
COMMONWEALTH GENERAL PURPOSE PAYMENTS
General purpose grants from the Commonwealth in 2007-08 are estimated to be $12.1 billion, $134 million above the budget forecast, mostly due to a larger than expected increase in the GST pool size, which more than offsets a slight decrease in NSW population share.
General purpose grants for 2008-09 are estimated to increase by around $960 million, or 8 per cent.
The NSW share of the GST pool increased from 27.7 per cent in 2006-07 to 28.2 per cent in 2007-08 and will increase to 28.9 per cent in 2008-09. Further details are in Chapter 8.
Table 4.6: Grant revenue 2006-07 2008-09 2009-10 2010-11 2011-12Actual Budget Revised Budget
$m $m $m $m $m $m $m
Commonwealth - general purpose 10,938 11,926 12,060 13,020 13,972 14,738 15,547
Commonwealth - specific purpose 6,815 6,854 7,540 7,249 7,875 8,195 8,34
Total Commonwealth grants 17,753 18,780 19,600 20,269 21,847 22,933 23,893
Annual per cent change in Commonwealth Grants 3.9% 10.4% 3.4% 7.8% 5.0% 4.2%
Other grants and contributions 1,021 812 1,053 782 781 870 903
Total grant revenue 18,774 19,592 20,653 21,051 22,628 23,803 24,796
2007-08Forward Estimates
6
Source: NSW Treasury estimate for GST Revenue and Commonwealth Treasury SPP estimates
COMMONWEALTH SPECIFIC PURPOSE PAYMENTS
Specific purpose payments for 2007-08 are estimated to be $686 million above the budget forecast. Increases include $205 million in rural (drought) assistance, $167.5 million in Australian Health Care Grants, $129 million in water and environmental programs and $49 million for equine influenza response.
Budget Statement 2008-09 4 - 23
Specific purpose payments are estimated to fall by $291 million, or 3.9 per cent, in 2008-09. A number of 2007-08 specific purpose payments, such as drought assistance, do not carry through to 2008-09.
The Council of Australian Governments has agreed to significant changes to specific purpose payment arrangements. Details are set out in Chapter 8.
OTHER GRANTS AND CONTRIBUTIONS
Other grants and contributions includes donations and bequests to general government entities such as schools, gardens (e.g. the Botanic Gardens and Domain Trust), museums and art galleries, as well as cash contributions from public trading enterprises and industry associations to various joint projects. These wide sources for grants mean this revenue has significant fluctuations.
The revised estimate for 2007-08 includes the Tugun Bypass. The bypass was completed and transferred to New South Wales in 2007-08, rather than 2008-09 as expected. The value of the grant recognised as revenue in each of 2006-07 and 2007-08 reflects the project construction costs.
Other grants and contributions are expected to fall from $1.1 billion in 2007-08 to $782 million in 2008-09, a fall of 25.7 per cent.
4.6 OTHER REVENUES
SALE OF GOODS AND SERVICES Sale of goods and services revenue arises from the use of government assets as well as from revenue generated by agencies in their normal trading activities. From 2006-07, the fees for service item includes payments for the supply of employee services from general government agencies to certain public trading enterprises.
Hospital inpatient fees in 2007-08 grew significantly over budget estimates with higher patient numbers. These fees are paid for private patients in public hospitals.
Revenue from sale of goods and services is expected to grow by 4.2 per cent in 2008-09.
4 - 24 Budget Statement 2008-09
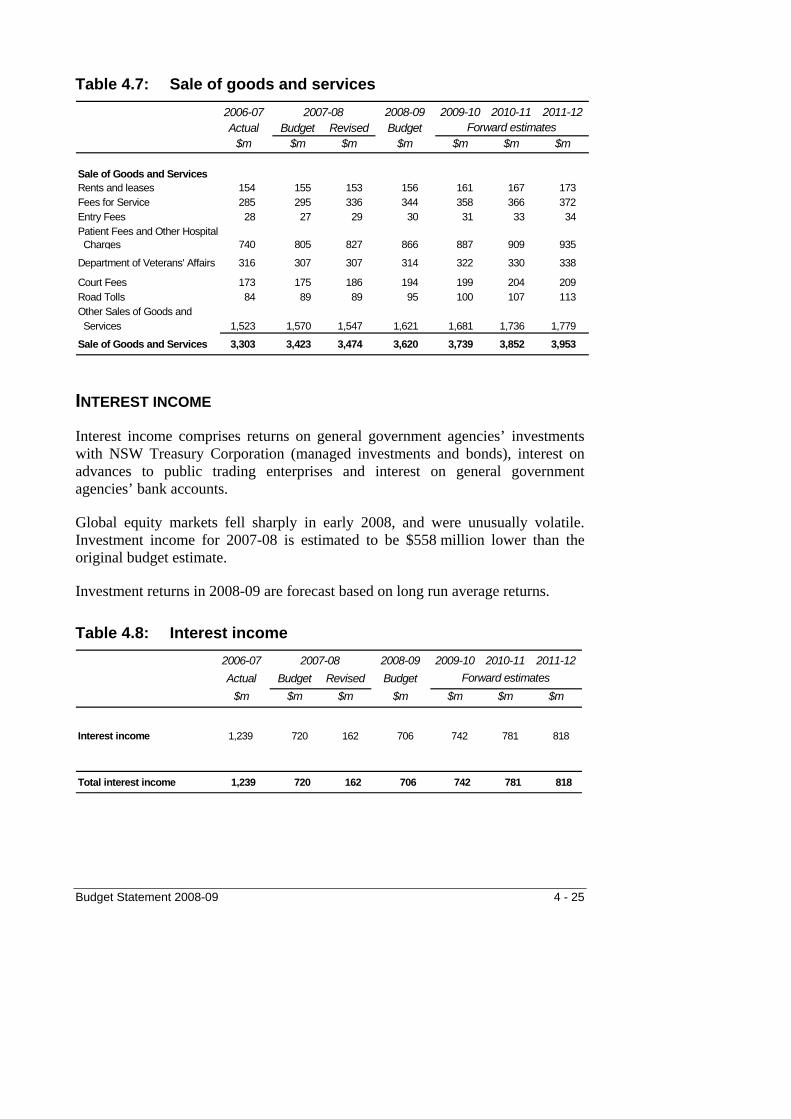
Table 4.7: Sale of goods and services 2006-07 2008-09 2009-10 2010-11 2011-12Actual Budget Revised Budget
$m $m $m $m $m $m $m
Sale of Goods and Services Rents and leases 154 155 153 156 161 167 173 Fees for Service 285 295 336 344 358 366 372 Entry Fees 28 27 29 30 31 33 34 Patient Fees and Other Hospital Charges 740 805 827 866 887 909 935
Department of Veterans' Affairs 316 307 307 314 322 330 338
Court Fees 173 175 186 194 199 204 209 Road Tolls 84 89 89 95 100 107 113 Other Sales of Goods and Services 1,523 1,570 1,547 1,621 1,681 1,736 1,779
Sale of Goods and Services 3,303 3,423 3,474 3,620 3,739 3,852 3,953
2007-08Forward estimates
INTEREST INCOME
Interest income comprises returns on general government agencies’ investments with NSW Treasury Corporation (managed investments and bonds), interest on advances to public trading enterprises and interest on general government agencies’ bank accounts.
Global equity markets fell sharply in early 2008, and were unusually volatile. Investment income for 2007-08 is estimated to be $558 million lower than the original budget estimate.
Investment returns in 2008-09 are forecast based on long run average returns.
Table 4.8: Interest income 2006-07 2008-09 2009-10 2010-11 2011-12Actual Budget Revised Budget
$m $m $m $m $m $m $m
Interest income 1,239 720 162 706 742 781 818
Total interest income 1,239 720 162 706 742 781 818
2007-08Forward estimates
Budget Statement 2008-09 4 - 25
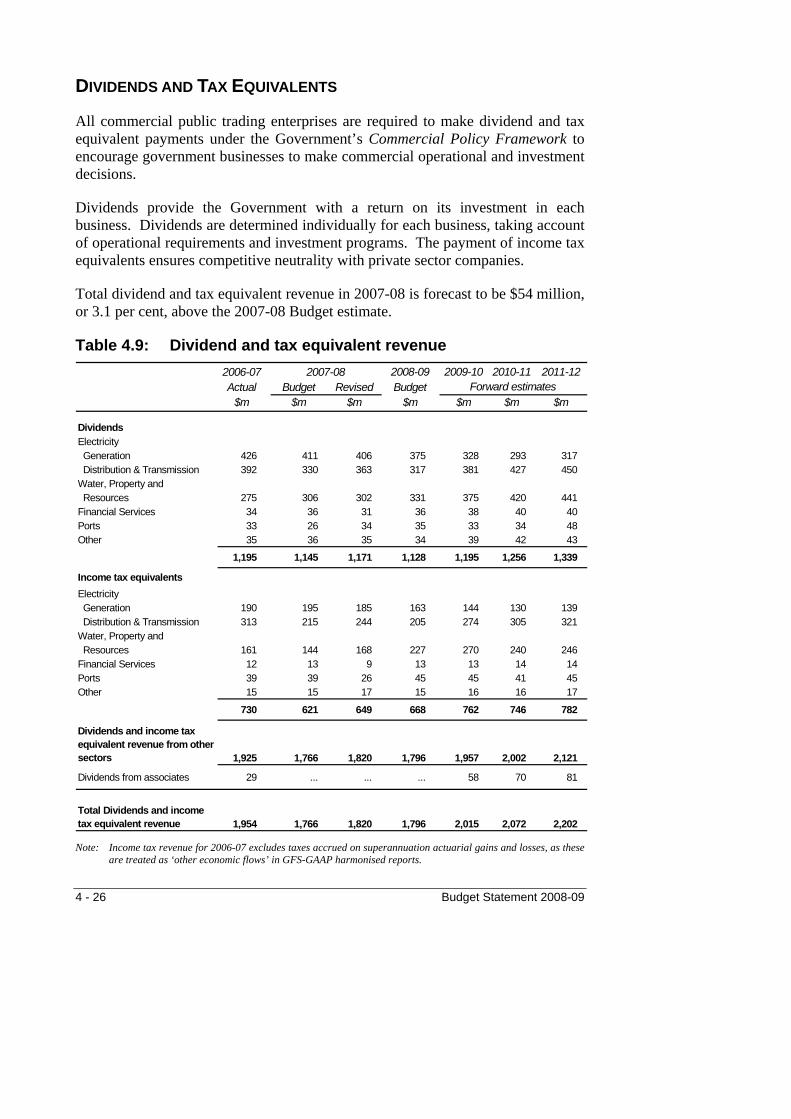
DIVIDENDS AND TAX EQUIVALENTS
All commercial public trading enterprises are required to make dividend and tax equivalent payments under the Government’s Commercial Policy Framework to encourage government businesses to make commercial operational and investment decisions.
Dividends provide the Government with a return on its investment in each business. Dividends are determined individually for each business, taking account of operational requirements and investment programs. The payment of income tax equivalents ensures competitive neutrality with private sector companies.
Total dividend and tax equivalent revenue in 2007-08 is forecast to be $54 million, or 3.1 per cent, above the 2007-08 Budget estimate.
Table 4.9: Dividend and tax equivalent revenue 2006-07 2008-09 2009-10 2010-11 2011-12Actual Budget Revised Budget
$m $m $m $m $m $m $m
Dividends Electricity Generation 426 411 406 375 328 293 317 Distribution & Transmission 392 330 363 317 381 427 450 Water, Property and Resources 275 306 302 331 375 420 441 Financial Services 34 36 31 36 38 40 40 Ports 33 26 34 35 33 34 48 Other 35 36 35 34 39 42 43
1,195 1,145 1,171 1,128 1,195 1,256 1,339
Income tax equivalentsElectricity Generation 190 195 185 163 144 130 139 Distribution & Transmission 313 215 244 205 274 305 321 Water, Property and Resources 161 144 168 227 270 240 246 Financial Services 12 13 9 13 13 14 14 Ports 39 39 26 45 45 41 45 Other 15 15 17 15 16 16 17
730 621 649 668 762 746 782
Dividends and income tax equivalent revenue from other sectors 1,925 1,766 1,820 1,796 1,957 2,002 2,121
Dividends from associates 29 ... ... ... 58 70 81
Total Dividends and income tax equivalent revenue 1,954 1,766 1,820 1,796 2,015 2,072 2,202
2007-08Forward estimates
Note: Income tax revenue for 2006-07 excludes taxes accrued on superannuation actuarial gains and losses, as these
are treated as ‘other economic flows’ in GFS-GAAP harmonised reports.
4 - 26 Budget Statement 2008-09
For 2008-09, higher dividends and tax equivalents are forecast from the water sector, due to an easing of water restrictions and higher regulated water prices from July 2008. Tax equivalents will also increase in the port sector, driven by growing trade volumes. Dividends from the ports sector in 2008-09 will not increase as much because a greater proportion of profits will be retained by these businesses to fund major capital expenditure.
Despite these increases, overall dividend and tax revenue for 2008-09 is expected to decrease by about 1.3 per cent from 2007-08. This is because the higher payments from the ports and water sector will largely be offset by lower payments from the electricity sector. Dividend and tax equivalent payments are made by both generators and network businesses. Recent increases in interest rates are likely to significantly increase borrowing costs and reduce profits in the electricity network sector.
Over the forward estimates period, dividend and tax equivalent revenue is expected to rise significantly in 2009-10, and then grow at an average rate of 4.5 per cent a year. These forecasts do not include an estimate of the fiscal impact of proceeding with the government’s electricity plans. Sufficient funds realised from the reforms will be invested in the Community Infrastructure (Intergenerational) Fund to provide an income stream equal to the budgeted long-run returns (dividends and tax equivalents) forgone from the retail and generation sectors. Dividends and tax equivalents will continue to be received from the network sector as these will continue to be operated by government.
Contributing factors to the growth in dividends include an increase in earnings growth in the electricity sector resulting from an expected increase in the regulated price for electricity network businesses, increased profits on the sale of land developments and increased port activity.
FINES, REGULATORY FEES AND OTHER REVENUE
Fines The largest share of fine revenue – over 90 per cent – comes from motor traffic fines.
The State Debt Recovery Office improved its business processes to recover an additional $36 million above forecast in outstanding fines in 2007-08. Increased road surveillance from speed cameras also increased revenue by $20 million in 2007-08.
Budget Statement 2008-09 4 - 27
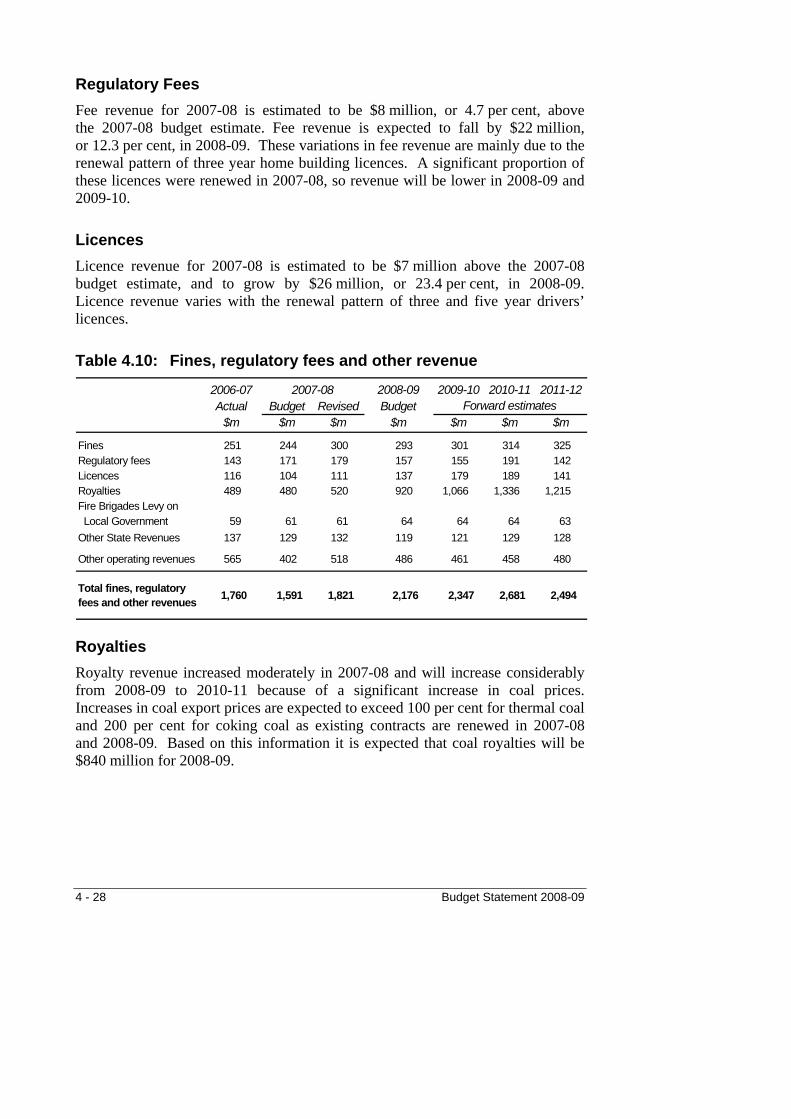
Regulatory Fees Fee revenue for 2007-08 is estimated to be $8 million, or 4.7 per cent, above the 2007-08 budget estimate. Fee revenue is expected to fall by $22 million, or 12.3 per cent, in 2008-09. These variations in fee revenue are mainly due to the renewal pattern of three year home building licences. A significant proportion of these licences were renewed in 2007-08, so revenue will be lower in 2008-09 and 2009-10.
Licences Licence revenue for 2007-08 is estimated to be $7 million above the 2007-08 budget estimate, and to grow by $26 million, or 23.4 per cent, in 2008-09. Licence revenue varies with the renewal pattern of three and five year drivers’ licences.
Table 4.10: Fines, regulatory fees and other revenue
2006-07 2008-09 2009-10 2010-11 2011-12Actual Budget Revised Budget
$m $m $m $m $m $m $m
Fines 251 244 300 293 301 314 325 Regulatory fees 143 171 179 157 155 191 142 Licences 116 104 111 137 179 189 141 Royalties 489 480 520 920 1,066 1,336 1,215 Fire Brigades Levy on Local Government 59 61 61 64 64 64 63 Other State Revenues 137 129 132 119 121 129 128
Other operating revenues 565 402 518 486 461 458 480
Total fines, regulatory fees and other revenues 1,760 1,591 1,821 2,176 2,347 2,681 2,494
Forward estimates2007-08
Royalties Royalty revenue increased moderately in 2007-08 and will increase considerably from 2008-09 to 2010-11 because of a significant increase in coal prices. Increases in coal export prices are expected to exceed 100 per cent for thermal coal and 200 per cent for coking coal as existing contracts are renewed in 2007-08 and 2008-09. Based on this information it is expected that coal royalties will be $840 million for 2008-09.
4 - 28 Budget Statement 2008-09

In April 2007, the NSW Government approved plans for a new coal export terminal and expansion of the Kooragang coal terminal. These facilities are expected to increase port capacity for coal export by almost 40 per cent during 2009 to 2011. In addition, considerable work is being undertaken to reduce rail bottlenecks between mines and the ports.
The forward estimates for 2009-10 to 2011-12 are based on a volume increase of almost 40 per cent, coupled with average exchange rate and coal price assumptions. An improving exchange rate and lower coal prices would result in a lower forecast, while the combination of lower exchange rate and higher coal prices would increase royalty revenue.
Budget Statement 2008-09 4 - 29

CHAPTER 5: TAX EXPENDITURES AND CONCESSIONS
Tax expenditures in 2008-09 are estimated at $4 billion. ♦
Concessions in 2008-09 are estimated at $1.4 billion. ♦
♦ By value, tax expenditures in 2008-09 are highest in payroll tax, purchaser transfer duty and general and life insurance. Together they represent about 60 per cent of total measurable tax expenditures.
5.1 INTRODUCTION
Direct government spending and budget allocations are subject to scrutiny through the annual budget process. Tax expenditures and concessional charges have the same budgetary and welfare effects as direct outlays. However, they are less visible than direct outlays because their cost is in revenue forgone rather than dollars spent.
This chapter estimates revenue forgone from tax expenditures and concessions.
Tax concessions are termed tax expenditures because they have a similar policy and fiscal impact as expenditures. Tax expenditures involve granting certain taxpayers, activities or assets more favourable tax treatment than applies to taxpayers in general. One example is the transfer duty exemption provided to eligible first home buyers.
Concessional charges involve the sale of goods and services to certain users at a lower charge or fee than applies to the wider community. One example is lower public transport fares for pensioners and senior citizens.
Appendix E provides a comprehensive listing and, where possible, costing of each major tax expenditure and concession reflecting all announced policies up to and including this Budget.
Budget Statement 2008-09 5 - 1
5.2 CONCEPTS AND METHODS
Tax expenditures can take the form of:
exempting certain taxpayers from a tax ♦
♦
♦
♦
♦
applying a lower rate of tax, a rebate or deduction, to certain taxpayers or
deferring the time for payment by certain taxpayers of a tax liability.
Concessions on user charges and fees can take the form of:
exempting certain users from a charge generally applied to the community for government goods and services or exempting certain sections from a fee generally applied to the community or
imposing on certain sections of the community a charge lower than that applied to the general community for government goods and services, or imposing fees lower than the general fee.
There is an element of judgement in deciding what constitutes a tax expenditure or concession and what constitutes a structural feature of the underlying taxation or service delivery system. For example, stamp duty on property transfers is charged at different marginal rates according to the value of the property involved. This could be construed as providing a concessional rate of taxation for lower valued properties. However, those lower marginal rates are not classified here as tax expenditures. Rather, the different rates are regarded as a design feature of the duty arrangements.
Similarly, the provision of a good or service at varying rates to certain members of the community depending on say, income, is not classed as providing a concession for those charged at the lower rate. Rather, the different rates are regarded as a design feature of the pricing arrangements. For instance, public transport is generally provided at different rates to adults and children. However, the children’s rate is not classified here as a concession, but a design feature of the pricing arrangements. (However, where some children receive an exemption from the normal children’s fare, that is regarded as a concession.)
There is also judgement involved in deciding what concessions funded by explicit budget payments are included in this Chapter and in Appendix E.
5 - 2 Budget Statement 2008-09
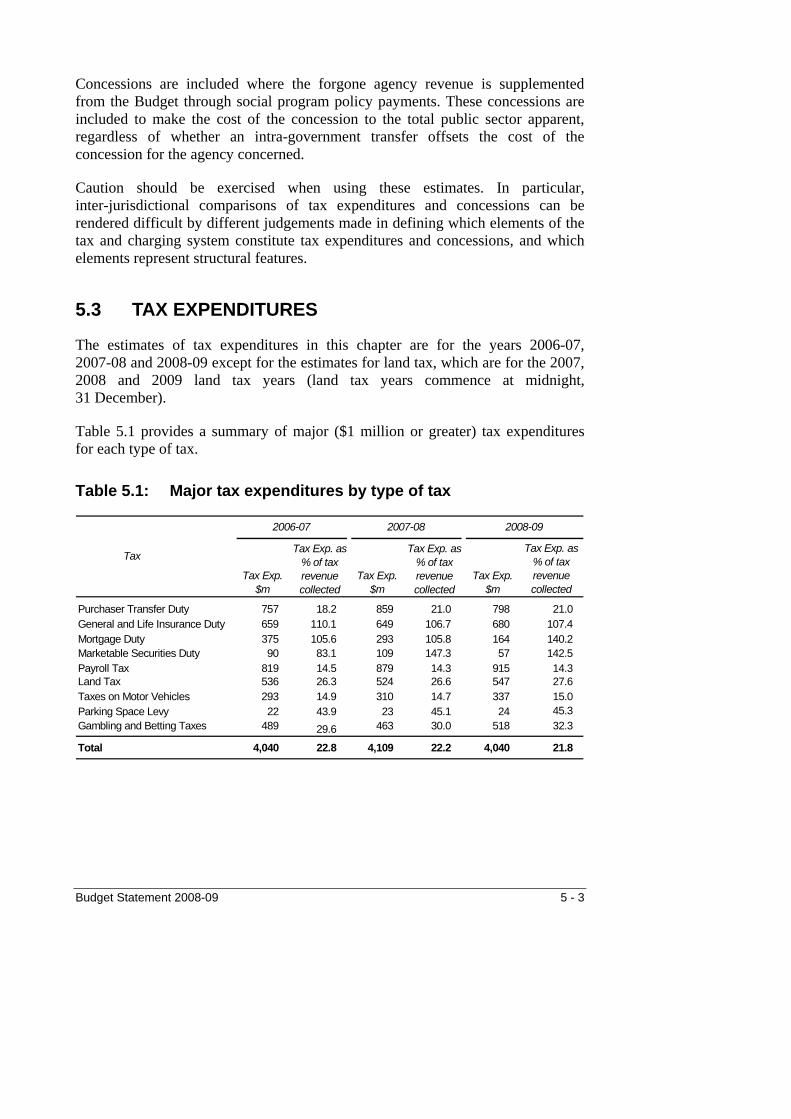
Concessions are included where the forgone agency revenue is supplemented from the Budget through social program policy payments. These concessions are included to make the cost of the concession to the total public sector apparent, regardless of whether an intra-government transfer offsets the cost of the concession for the agency concerned.
Caution should be exercised when using these estimates. In particular, inter-jurisdictional comparisons of tax expenditures and concessions can be rendered difficult by different judgements made in defining which elements of the tax and charging system constitute tax expenditures and concessions, and which elements represent structural features.
5.3 TAX EXPENDITURES
The estimates of tax expenditures in this chapter are for the years 2006-07, 2007-08 and 2008-09 except for the estimates for land tax, which are for the 2007, 2008 and 2009 land tax years (land tax years commence at midnight, 31 December).
Table 5.1 provides a summary of major ($1 million or greater) tax expenditures for each type of tax.
Table 5.1: Major tax expenditures by type of tax
Tax Exp.$m
Tax Exp.$m
Tax Exp.$m
Tax Exp. as% of taxrevenuecollected
Purchaser Transfer Duty 757 18.2 859 21.0 798 21.0 General and Life Insurance Duty 659 110.1 649 106.7 680 107.4 Mortgage Duty 375 105.6 293 105.8 164 140.2 Marketable Securities Duty 90 83.1 109 147.3 57 142.5 Payroll Tax 819 14.5 879 14.3 915 14.3 Land Tax 536 26.3 524 26.6 547 27.6 Taxes on Motor Vehicles 293 14.9 310 14.7 337 15.0 Parking Space Levy 22 43.9 23 45.1 24 45.3 Gambling and Betting Taxes 489 29.6 463 30.0 518 32.3
Total 4,040 22.8 4,109 22.2 4,040 21.8
2008-09
Tax
2006-07
Tax Exp. as% of taxrevenuecollected
Tax Exp. as% of taxrevenuecollected
2007-08
Budget Statement 2008-09 5 - 3

Quantifiable tax expenditures (valued at more than $1 million) are estimated at $4.1 billion in 2007-08, representing 22 per cent of total tax revenue. Tax expenditures are estimated to decrease by $69 million, to $4 billion in 2008-09 due to the abolition of marketable securities duty and the abolition of mortgage duty on non-owner occupied residential property, both from 1 July 2008.
It is worth noting that several taxes show the value of measurable tax expenditures exceeding revenue raised. This is due to the large number of exemptions provided for those particular taxes and the considerable cost they represent.
Tax expenditures for payroll tax are the largest category of measurable tax expenditures, estimated at around 23 per cent of total tax expenditures in 2008-09. The value of tax expenditures for payroll tax is expected to increase in 2008-09 by $36 million because of taxation policy changes included in this budget.
The gambling and betting tax expenditures relate to the lower taxation of gaming machines in registered clubs compared to those in hotels.
Table 5.2 provides a functional classification of tax expenditures.
Table 5.2: Tax expenditures by function
2006-07 2007-08 2008-09$m $m $m
General Public Services 202 220 226 Defence ... ... ... Public Order and Safety 5 5 5 Education 116 126 132 Health 467 495 513 Social Security and Welfare 440 469 502 Housing and Community 543 517 499 AmenitiesRecreation and Culture 496 470 526 Fuel and Energy ... ... ... Agriculture, Forestry, Fishing 379 370 386
and HuntingMining, Manufacturing and
Construction ... ... ... Transport and Communications 36 38 39 Other Economic Affairs 1,351 1,385 1,204 Other Purposes 5 14 8
Total 4,040 4,109 4,040
Function
5 - 4 Budget Statement 2008-09

In terms of revenue forgone, the largest categories of tax expenditures are Other Economic Affairs (which includes assistance to industry generally rather than a particular type of economic activity), Recreation and Culture (which includes the club gaming expenditures for registered clubs) and Health (which includes expenditures for public hospitals and area health services).
Tax expenditures in the Other Economic Affairs function are estimated to decrease in 2008-09. This is mostly driven by a reduction in the tax expenditure for refinanced loans due to the abolition of mortgage duty on non-owner occupied residential property.
5.4 CONCESSIONS
Table 5.3 classifies the major concessions provided by the NSW Government by function. The total value of major concessions is estimated at $1.4 billion in 2008-09, an increase of $82 million from 2007-08.
Table 5.3: Concessions by function
2006-07 2007-08 2008-09$m $m $m
General Public Services ... ... ... Defence ... ... ... Public Order and Safety ... ... ... Education 495 512 534 Health 118 136 156 Social Security and Welfare 395 408 433 Housing and Community
Amenities 272 290 305 Recreation and Culture 7 8 8 Fuel and Energy ... ... ... Agriculture, Forestry, Fishing 4 4 4 and HuntingMining, Manufacturing and
Construction ... ... ... Transport and Communications ... ... ... Other Economic Activities ... ... ... Other Purposes ... ... ...
Total 1,292 1,357 1,440
Function
Most concessions are concentrated in the Education and Social Security and Welfare functions. They mainly comprise concessional charges to pensioner concession card holders for transport, water and energy, and the School Student Transport Scheme.
Budget Statement 2008-09 5 - 5

CHAPTER 6: BALANCE SHEET MANAGEMENT
♦ The State’s net worth, which comprises all assets and liabilities, is expected to increase by $15.6 billion over the four year period ending June 2012.
♦ The value of assets in the general government and public trading enterprise (PTE) sectors will continue to rise from 2008 to 2012, reflecting $57.6 billion in capital expenditure.
♦ The majority of capital expenditure will be financed by cash operating surpluses with the balance largely financed by debt and asset sales.
Net debt will remain at prudent levels with low interest expense to revenue ratios. ♦
♦ As a percentage of gross state product, net debt remains at relatively low historical levels, particularly in the general government sector. Higher borrowings in the PTE sector will fund capital works, mainly in the commercial PTE sector.
♦ Net financial liabilities are forecast to grow, mainly reflecting increased borrowings and unfunded superannuation liabilities. Growth in insurance and other financial liabilities is expected to remain moderate.
♦ Higher superannuation liabilities in 2008 follow negative investment returns due to the global credit crisis and sub-prime loan failures in the United States. In 2010, superannuation liabilities will increase sharply reflecting a decrease in the discount rate used to estimate liabilities from 6.35 per cent to 5.85 per cent.
♦ The use of AASB 119 as a valuation methodology underpinning the State’s superannuation funding plan is not considered appropriate as it generally overstates liability obligations.
♦ Full funding of general government superannuation liabilities by 2030 remains on track.
Budget Statement 2008-09 6 - 1

6.1 INTRODUCTION
The combination of assets and liabilities determines the net worth of the general government sector, the public trading enterprise (PTE) sector, the public financial enterprise (PFE) sector and the net worth of the State as a whole.
Asset holdings are made up of non-financial assets (such as property and infrastructure) and financial assets (such as cash, investments and receivables). Liabilities include borrowings, obligations to employees, payables and other provisions.
Net debt is a measure of accumulated borrowings that allows for the offsetting value of cash and investments. The level of net debt differs in each sector and reflects the extent to which assets generate cash returns, enabling debt to be repaid.
Net financial liabilities are a measure of the financial obligations of the Government, after allowing for the value of financial assets. Equity investments in the PTE and PFE sectors are excluded from the net financial liability measure for general government.
A key non-debt liability of the general government sector is unfunded superannuation. Cash employer contributions are being made to ensure full funding by 2030. As outlined on page 6-18, NSW Treasury has concerns with the methodology used to value superannuation liabilities.
Insurance obligations in the general government sector are also a substantial liability. Funding arrangements are in place for a number of insurance schemes.
Financial asset and risk management arrangements help to ensure that financial obligations are met at a minimum cost and risk to Government.
6.2 NET DEBT
GENERAL GOVERNMENT NET DEBT The general government sector provides core services such as schools, hospitals and policing. Operating expenditure in this sector is financed mainly from State taxation and Commonwealth grants. Debt is used to part finance capital expenditure.
6 - 2 Budget Statement 2008-09
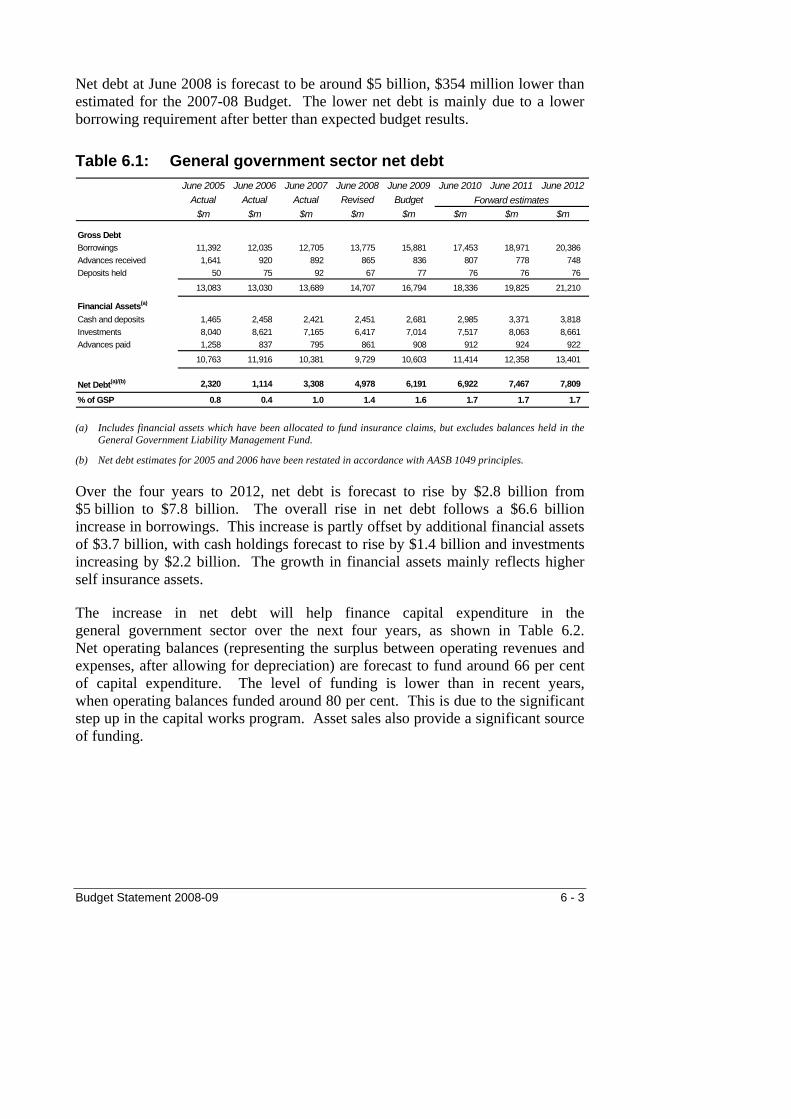
Net debt at June 2008 is forecast to be around $5 billion, $354 million lower than estimated for the 2007-08 Budget. The lower net debt is mainly due to a lower borrowing requirement after better than expected budget results.
Table 6.1: General government sector net debt June 2005 June 2006 June 2007 June 2008 June 2009 June 2010 June 2011 June 2012
Actual Actual Actual Revised Budget$m $m $m $m $m $m $m $m
Gross DebtBorrowings 11,392 12,035 12,705 13,775 15,881 17,453 18,971 20,386 Advances received 1,641 920 892 865 836 807 778 748 Deposits held 50 75 92 67 77 76 76 76
13,083 13,030 13,689 14,707 16,794 18,336 19,825 21,210
Financial Assets(a)
Cash and deposits 1,465 2,458 2,421 2,451 2,681 2,985 3,371 3,818 Investments 8,040 8,621 7,165 6,417 7,014 7,517 8,063 8,661 Advances paid 1,258 837 795 861 908 912 924 922
10,763 11,916 10,381 9,729 10,603 11,414 12,358 13,401
Net Debt(a)/(b) 2,320 1,114 3,308 4,978 6,191 6,922 7,467 7,809
% of GSP 0.8 0.4 1.0 1.4 1.6 1.7 1.7 1.7
Forward estimates
(a) Includes financial assets which have been allocated to fund insurance claims, but excludes balances held in the General Government Liability Management Fund.
(b) Net debt estimates for 2005 and 2006 have been restated in accordance with AASB 1049 principles.
Over the four years to 2012, net debt is forecast to rise by $2.8 billion from $5 billion to $7.8 billion. The overall rise in net debt follows a $6.6 billion increase in borrowings. This increase is partly offset by additional financial assets of $3.7 billion, with cash holdings forecast to rise by $1.4 billion and investments increasing by $2.2 billion. The growth in financial assets mainly reflects higher self insurance assets.
The increase in net debt will help finance capital expenditure in the general government sector over the next four years, as shown in Table 6.2. Net operating balances (representing the surplus between operating revenues and expenses, after allowing for depreciation) are forecast to fund around 66 per cent of capital expenditure. The level of funding is lower than in recent years, when operating balances funded around 80 per cent. This is due to the significant step up in the capital works program. Asset sales also provide a significant source of funding.
Budget Statement 2008-09 6 - 3
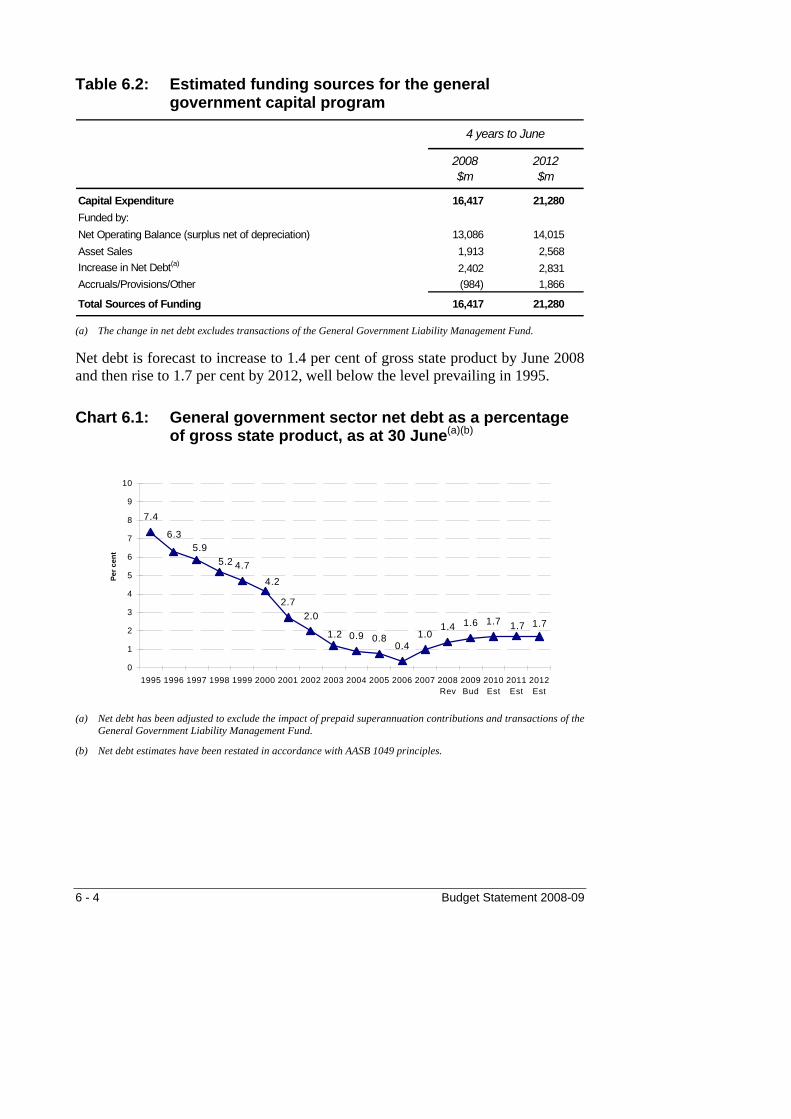
Table 6.2: Estimated funding sources for the general government capital program
2008$m
2012$m
Capital Expenditure 16,417 21,280 Funded by:Net Operating Balance (surplus net of depreciation) 13,086 14,015 Asset Sales 1,913 2,568 Increase in Net Debt(a) 2,402 2,831 Accruals/Provisions/Other (984) 1,866
Total Sources of Funding 16,417 21,280
4 years to June
(a) The change in net debt excludes transactions of the General Government Liability Management Fund.
Net debt is forecast to increase to 1.4 per cent of gross state product by June 2008 and then rise to 1.7 per cent by 2012, well below the level prevailing in 1995.
Chart 6.1: General government sector net debt as a percentage of gross state product, as at 30 June(a)(b)
7.4
4.7
2.7
0.9 0.80.4
1.01.4 1.6 1.7
5.2
4.2
1.2
6.35.9
2.01.7 1.7
0
1
2
3
4
5
6
7
8
9
10
1995 1996 1997 1998 1999 2000 2001 2002 2003 2004 2005 2006 2007 2008Rev
2009Bud
2010Est
2011Est
2012Est
Per c
ent
(a) Net debt has been adjusted to exclude the impact of prepaid superannuation contributions and transactions of the
General Government Liability Management Fund.
(b) Net debt estimates have been restated in accordance with AASB 1049 principles.
6 - 4 Budget Statement 2008-09

The interest expense1 on gross borrowing is expected to rise from $930 million to $1.3 billion between 2007-08 and 2011-12, following additional borrowing and interest rate increases. As a per cent of general government revenue, interest expense remains comfortably within manageable levels, being only 2.4 per cent of general government revenue in 2011-12 compared with 2 per cent in 2007-08 and 4.8 per cent in 1998-99.
Chart 6.2: General government sector interest expense on borrowings as a percentage of budget revenue(a)
0
1
2
3
4
5
6
1997-98 1998-99 1999-00 2000-01 2001-02 2002-03 2003-04 2004-05 2005-06 2006-07 2007-08Rev
2008-09Bud
2009-10Est
2010-11Est
2011-12Est
Per c
ent
(a) Interest expense excludes the cost of unwinding of discounts on provisions.
PUBLIC TRADING ENTERPRISE NET DEBT The public trading enterprise (PTE) sector can be split into commercial PTEs (businesses which generate commercial returns – primarily electricity, water and ports) and non-commercial PTEs (housing and transport businesses).
The PTE sector is mainly funded by user charges and operates under commercial disciplines described in the Government’s Commercial Policy Framework.
Total net debt for the PTE sector is forecast to reach $18.6 billion in June 2008, rising to $37 billion in June 2012.
1 Excluding the cost of unwinding of discounts of provisions for SICorp, Workers Compensation
(Dust Diseases) Board, and other agencies.
Budget Statement 2008-09 6 - 5
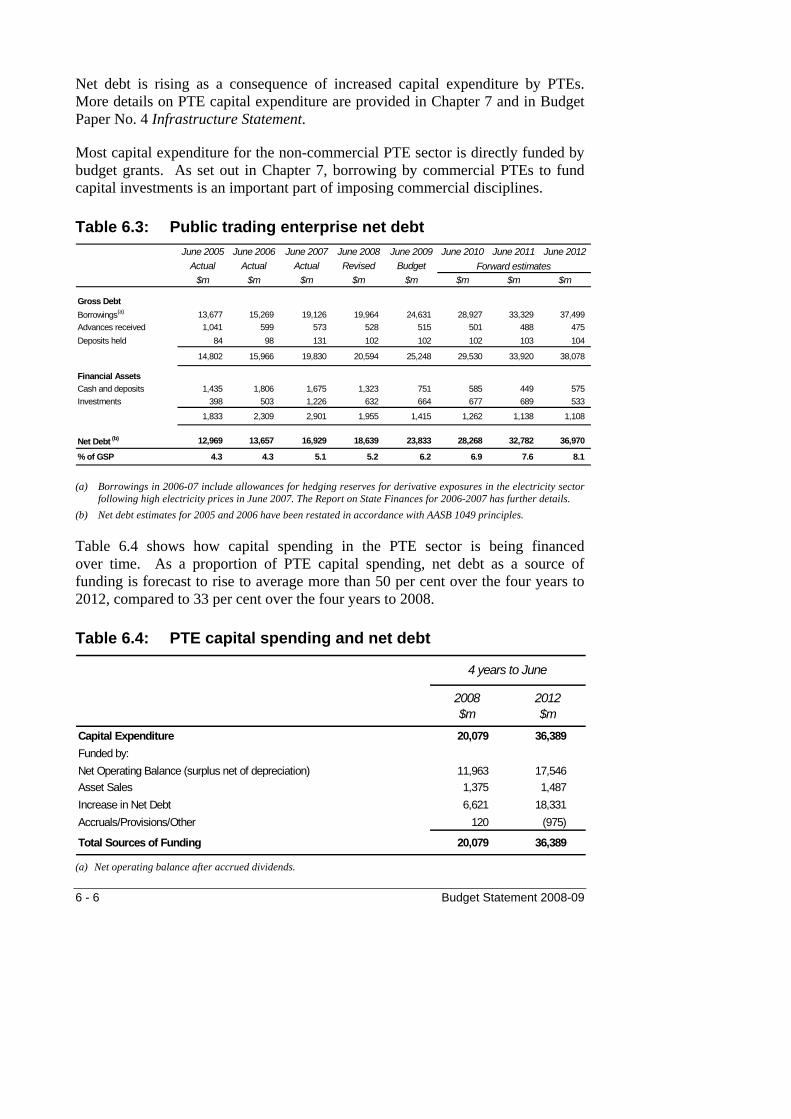
Net debt is rising as a consequence of increased capital expenditure by PTEs. More details on PTE capital expenditure are provided in Chapter 7 and in Budget Paper No. 4 Infrastructure Statement.
Most capital expenditure for the non-commercial PTE sector is directly funded by budget grants. As set out in Chapter 7, borrowing by commercial PTEs to fund capital investments is an important part of imposing commercial disciplines.
Table 6.3: Public trading enterprise net debt June 2005 June 2006 June 2007 June 2008 June 2009 June 2010 June 2011 June 2012
Actual Actual Actual Revised Budget$m $m $m $m $m $m $m $m
Gross DebtBorrowings(a) 13,677 15,269 19,126 19,964 24,631 28,927 33,329 37,499 Advances received 1,041 599 573 528 515 501 488 475 Deposits held 84 98 131 102 102 102 103 104
14,802 15,966 19,830 20,594 25,248 29,530 33,920 38,078
Financial AssetsCash and deposits 1,435 1,806 1,675 1,323 751 585 449 575 Investments 398 503 1,226 632 664 677 689 533
1,833 2,309 2,901 1,955 1,415 1,262 1,138 1,108
Net Debt (b) 12,969 13,657 16,929 18,639 23,833 28,268 32,782 36,970
% of GSP 4.3 4.3 5.1 5.2 6.2 6.9 7.6 8.1
Forward estimates
(a) Borrowings in 2006-07 include allowances for hedging reserves for derivative exposures in the electricity sector
following high electricity prices in June 2007. The Report on State Finances for 2006-2007 has further details. (b) Net debt estimates for 2005 and 2006 have been restated in accordance with AASB 1049 principles.
Table 6.4 shows how capital spending in the PTE sector is being financed over time. As a proportion of PTE capital spending, net debt as a source of funding is forecast to rise to average more than 50 per cent over the four years to 2012, compared to 33 per cent over the four years to 2008.
Table 6.4: PTE capital spending and net debt
2008$m
2012$m
Capital Expenditure 20,079 36,389 Funded by:Net Operating Balance (surplus net of depreciation) 11,963 17,546 Asset Sales 1,375 1,487 Increase in Net Debt 6,621 18,331 Accruals/Provisions/Other 120 (975)
Total Sources of Funding 20,079 36,389
4 years to June
(a) Net operating balance after accrued dividends.
6 - 6 Budget Statement 2008-09

Chart 6.3 demonstrates the relative proportion of debt for the commercial and non-commercial PTE sectors.
Chart 6.3: PTE sector net debt as at 30 June
0
5,000
10,000
15,000
20,000
25,000
30,000
35,000
40,000
2002 2003 2004 2005 2006 2007 2008Rev
2009Bud
2010Est
2011Est
2012Est
$ m
illio
n
Net Debt - Commercial PTE Sector Net Debt - Non-Commercial PTE Sector
As a percentage of gross state product, net debt in the PTE sector is forecast to reach 5.2 per cent by June 2008, rising to 8.1 per cent by 2012.
Chart 6.4: Public trading enterprise net debt as a percentage of gross state product as at 30 June(a)(b)
4.54.2
3.7 3.5 3.3
7.6
6.2
5.1 5.24.8
8.1
4.24.3 4.3 4.3
6.9
4.24.5
0
1
2
3
4
5
6
7
8
9
1995 1996 1997 1998 1999 2000 2001 2002 2003 2004 2005 2006 2007 2008Rev
2009Bud
2010Est
2011Est
2012Est
Per c
ent
(a) Net debt estimates have been restated in accordance with AASB 1049 principles.
(b) Estimates prior to 1998 include a small amount of PFE net debt.
Budget Statement 2008-09 6 - 7

TOTAL STATE SECTOR NET DEBT Total state sector debt combines general government and PTE debt and includes the PFE sector. The NSW Government’s fiscal strategy differs for each sector and is based on the use to which funds are applied. (See Chapter 2 for further details on fiscal strategy). In the commercial PTE sector, debt is used to finance capital expenditure which generates a commercial return.
Total state sector debt is measured on a market value basis, leading to a slightly lower net debt estimate than the sum of fair value estimates used for specific sectors. Table 6.5 shows the movement of net debt for the total state sector.
Table 6.5: Total state sector net debt June 2005 June 2006 June 2007 June 2008 June 2009 June 2010 June 2011 June 2012
Actual Actual Actual Revised Budget$m $m $m $m $m $m $m $m
Gross DebtBorrowings(a) 29,012 28,969 34,658 36,503 43,226 49,026 54,868 60,391 Advances received 1,641 923 892 865 836 807 778 748 Deposits held 861 430 483 262 269 263 291 287
31,514 30,322 36,033 37,629 44,331 50,096 55,936 61,426
Financial Assets(b)
Cash and deposits 3,217 4,319 4,303 4,334 4,016 4,360 4,821 5,630 Investments 12,496 11,020 12,321 10,765 11,679 12,321 13,053 13,650 Advances paid 245 242 223 333 393 410 436 448
15,958 15,581 16,847 15,432 16,088 17,091 18,310 19,728
Net Debt(c) 15,555 14,741 19,186 22,198 28,243 33,005 37,626 41,698
% of GSP 5.2 4.7 5.7 6.2 7.3 8.1 8.7 9.1
Forward estimates
(a) Borrowings for the total state sector are estimated on a market value basis from 2006 onwards. This basis of valuation reduces estimated debt by around $300 million in 2006 and $950 million per annum in later years.
(b) Includes financial assets which have been allocated to fund insurance claims, but excludes balances held in the General Government Liability Management Fund.
(c) Net debt estimates for 2005 and 2006 have been restated in accordance with AASB 1049 principles.
Total state sector net debt is forecast to rise by $19.5 billion over the next four years, with borrowings rising by nearly $24 billion. Debt will help fund capital expenditure of $57.6 billion over the same period. Budget Paper No. 4 Infrastructure Statement provides details of projects that make up the State capital program.
6 - 8 Budget Statement 2008-09

Chart 6.5 shows the history of net debt for the total state sector as a percentage of GSP. The forecast rise in net debt from 6.2 per cent to 9.1 per cent is mainly due to an increase in net debt in the PTE sector. As a percentage of gross state product, net debt in the general government sector remains at relatively low levels.
Chart 6.5: Total state sector net debt as a percentage of gross state product as at 30 June
11.911.1
10.09.4
8.77.9
7.4
4.7
6.2
7.38.1
5.7
6.3
8.7
9.1
5.25.6 5.2
0
2
4
6
8
10
12
14
1995 1996 1997 1998 1999 2000 2001 2002 2003 2004 2005 2006 2007 2008Rev
2009Bud
2010Est
2011Est
2012Est
Per c
ent
Higher interest rates and the increased borrowing program have resulted in a steadily rising proportion of revenue spent on interest as shown in Chart 6.6. The level of forecast interest expense on gross borrowings2 will rise to 5.8 per cent of total revenue in 2011-12 but remains well below levels of the mid 1990s.
2 Excluding the cost of unwinding of discounts of provisions for SICorp, Workers Compensation
(Dust Diseases) Board, State owned energy corporations and other agencies.
Budget Statement 2008-09 6 - 9

Chart 6.6: Total state sector interest expense on borrowings as a percentage of total revenue(a)(b)(c)
0
2
4
6
8
10
12
1994-95 1995-96 1996-97 1997-98 1998-99 1999-00 2000-01 2001-02 2002-03 2003-04 2004-05 2005-06 2006-07 2007-08Rev
2008-09Bud
2009-10Est
2010-11Est
2011-12Est
Per
cen
t
(a) Interest rate estimates are based on market valuations from 2005-06 onwards.
(b) Interest expense from 2004-05 onwards excludes the cost of unwinding of discounts of provisions.
(c) Estimates from 1994-95 to 1996-97 are based on State financial reports and may not be strictly comparable with estimates for 1997-98 and subsequent years.
6.3 NET FINANCIAL LIABILITIES
NET FINANCIAL LIABILITY TRENDS AND FORECASTS Net financial liabilities include most financial assets and all financial liabilities. For the general government sector, equity investments in the PTE and PFE sector are excluded from net financial liability measures.
Chart 6.7 shows financial liabilities for each sector measured as a percentage of gross state product. Total state sector net financial liabilities are forecast to rise from 16 per cent to 18.3 per cent of gross state product from 2008 to 2012.
The majority of this growth is due to increased borrowings in the PTE sector and their use to finance capital works. Net financial liabilities in the general government sector are forecast to rise from 8.2 per cent to 8.5 per cent of gross state product by 2010 and then decline to 8 per cent by 2012.
6 - 10 Budget Statement 2008-09

Chart 6.7: Net financial liabilities as a percentage of gross state product as at 30 June(a)(b)(c)
0
5
10
15
20
25
30
1995 1996 1997 1998 1999 2000 2001 2002 2003 2004 2005 2006 2007 2008Rev
2009Bud
2010Est
2011Est
2012Est
Per c
ent
Total State General Government Public trading enterprises
(a) Series break in 2005-06 is due to the adoption of Australian Equivalents to International Financial Reporting Standards, which has increased the reported level of net financial liabilities.
(b) Net financial liability estimates have been restated in accordance with AASB 1049 principles.
(c) Estimates prior to 1998 include PFE liabilities.
Estimates of general government sector net financial liabilities include a provision of $1 billion for liabilities associated with land claims granted to local Aboriginal Land Councils where the land has not yet transferred.
Since 2006, unfunded liabilities for superannuation have been valued using a conservative accounting standard (AASB 119). The standard requires that the discount rate used to value long-term liabilities be based on the government bond rate rather than the long-term earning rate for superannuation assets, which was the case under the previous accounting standard (AAS 25).
In 2007, the valuation methodology mandated under AASB 119 reduced the growth in superannuation liabilities by increasing the discount rate from 5.9 per cent to 6.4 per cent. In both 2008 and 2009 unfunded superannuation has been valued using a discount rate of 6.35 per cent. Over the forward estimates period, it is assumed that the long-term bond rate will return to trend, resulting in a lower discount rate being used and a sharp rise in the reported value of unfunded superannuation liabilities in 2010.
As discussed in Section 6.5, adoption of the revised accounting standard will not impact on the funding plan in place to fully fund superannuation liabilities by 2030.
Budget Statement 2008-09 6 - 11
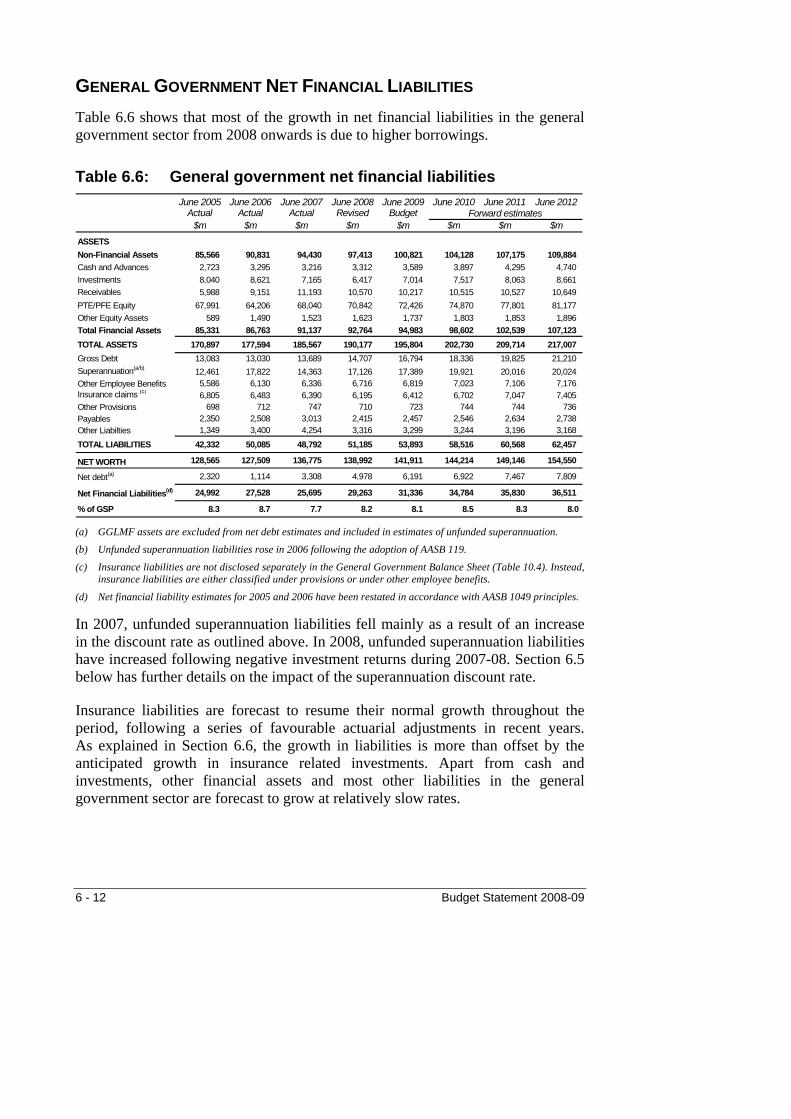
GENERAL GOVERNMENT NET FINANCIAL LIABILITIES Table 6.6 shows that most of the growth in net financial liabilities in the general government sector from 2008 onwards is due to higher borrowings.
Table 6.6: General government net financial liabilities June 2005 June 2006 June 2007 June 2008 June 2009 June 2010 June 2011 June 2012
Actual Actual Actual Revised Budget$m $m $m $m $m $m $m $m
ASSETSNon-Financial Assets 85,566 90,831 94,430 97,413 100,821 104,128 107,175 109,884 Cash and Advances 2,723 3,295 3,216 3,312 3,589 3,897 4,295 4,740 Investments 8,040 8,621 7,165 6,417 7,014 7,517 8,063 8,661 Receivables 5,988 9,151 11,193 10,570 10,217 10,515 10,527 10,649 PTE/PFE Equity 67,991 64,206 68,040 70,842 72,426 74,870 77,801 81,177 Other Equity Assets 589 1,490 1,523 1,623 1,737 1,803 1,853 1,896 Total Financial Assets 85,331 86,763 91,137 92,764 94,983 98,602 102,539 107,123 TOTAL ASSETS 170,897 177,594 185,567 190,177 195,804 202,730 209,714 217,007 Gross Debt 13,083 13,030 13,689 14,707 16,794 18,336 19,825 21,210 Superannuation(a/b) 12,461 17,822 14,363 17,126 17,389 19,921 20,016 20,024 Other Employee Benefits 5,586 6,130 6,336 6,716 6,819 7,023 7,106 7,176 Insurance claims (c) 6,805 6,483 6,390 6,195 6,412 6,702 7,047 7,405 Other Provisions 698 712 747 710 723 744 744 736 Payables 2,350 2,508 3,013 2,415 2,457 2,546 2,634 2,738 Other Liabilties 1,349 3,400 4,254 3,316 3,299 3,244 3,196 3,168 TOTAL LIABILITIES 42,332 50,085 48,792 51,185 53,893 58,516 60,568 62,457
NET WORTH 128,565 127,509 136,775 138,992 141,911 144,214 149,146 154,550
Net debt(a) 2,320 1,114 3,308 4,978 6,191 6,922 7,467 7,809
Net Financial Liabilities(d) 24,992 27,528 25,695 29,263 31,336 34,784 35,830 36,511
% of GSP 8.3 8.7 7.7 8.2 8.1 8.5 8.3 8.0
Forward estimates
(a) GGLMF assets are excluded from net debt estimates and included in estimates of unfunded superannuation.
(b) Unfunded superannuation liabilities rose in 2006 following the adoption of AASB 119.
(c) Insurance liabilities are not disclosed separately in the General Government Balance Sheet (Table 10.4). Instead, insurance liabilities are either classified under provisions or under other employee benefits.
(d) Net financial liability estimates for 2005 and 2006 have been restated in accordance with AASB 1049 principles.
In 2007, unfunded superannuation liabilities fell mainly as a result of an increase in the discount rate as outlined above. In 2008, unfunded superannuation liabilities have increased following negative investment returns during 2007-08. Section 6.5 below has further details on the impact of the superannuation discount rate.
Insurance liabilities are forecast to resume their normal growth throughout the period, following a series of favourable actuarial adjustments in recent years. As explained in Section 6.6, the growth in liabilities is more than offset by the anticipated growth in insurance related investments. Apart from cash and investments, other financial assets and most other liabilities in the general government sector are forecast to grow at relatively slow rates.
6 - 12 Budget Statement 2008-09

PUBLIC TRADING ENTERPRISE NET FINANCIAL LIABILITIES Trends for the PTE sector are similar to the general government sector for gross debt but not for other financial liabilities and assets. As Table 6.7 shows, rising debt is causing most of the growth in PTE sector net financial liabilities from 2008 to 2012. Growth in gross borrowings is forecast at $17.5 billion while growth in net financial liabilities is forecast at $19.3 billion over this period.
Table 6.7: Public trading enterprise net financial liabilities June 2005 June 2006 June 2007 June 2008 June 2009 June 2010 June 2011 June 2012
Actual Actual Actual Revised Budget$m $m $m $m $m $m $m $m
ASSETSCash and Advances 1,435 1,806 1,675 1,323 751 585 449 575 Investments 398 503 1,226 632 664 677 689 533 Receivables 2,003 2,085 2,886 2,230 2,313 2,629 2,862 3,063 Equity Investments 5 16 ... 3 18 23 47 37 Total Financial Assets 3,841 4,410 5,787 4,188 3,746 3,914 4,047 4,208 Non-Financial Assets 87,111 87,968 94,991 99,593 106,424 113,895 121,224 129,210 TOTAL ASSETS 90,952 92,378 100,778 103,781 110,170 117,809 125,271 133,418 Gross Debt 14,802 15,966 19,830 20,594 25,248 29,530 33,920 38,078 Superannuation 29 427 (294) 404 444 784 808 826 Other Employee Benefits 1,830 2,078 1,917 1,924 1,894 1,946 2,006 2,068 Payables 2,229 1,517 2,973 2,412 2,474 2,722 2,777 2,805 Other Provisions 1,245 2,389 1,519 1,543 1,485 1,485 1,500 1,579 Other Liabilities 2,458 5,857 7,509 6,848 6,981 7,252 7,240 7,674 TOTAL LIABILITIES 22,593 28,234 33,454 33,725 38,526 43,719 48,251 53,030 NET WORTH 68,359 64,144 67,324 70,056 71,644 74,090 77,020 80,388 Net Debt 12,969 13,657 16,929 18,639 23,833 28,268 32,782 36,970
Net Financial Liabilities(a) 18,752 23,824 27,667 29,537 34,780 39,805 44,204 48,822
% of GSP 6.2 7.5 8.3 8.3 9.0 9.7 10.2 10.7
Forward estimates
(a) Net financial liability estimates for 2005 and 2006 have been restated in accordance with AASB 1049 principles.
Unfunded superannuation and insurance liabilities are much smaller in the PTE sector. Employee benefits are mostly made up of annual and long service leave liabilities. Provisions are largely for distributions from the PTE sector.
PUBLIC FINANCE ENTERPRISE NET FINANCIAL LIABILITIES The Public Finance Enterprise (PFE) sector is made up of investment and financial agencies such as TCorp and the Lifetime Care and Support Authority. These authorities have substantial liabilities and financial asset holdings, consistent with their functions. However the net value of assets over liabilities is relatively low. Over the period to 2012, the average value of net financial assets is forecast to exceed net financial liabilities by around $800 million.
Budget Statement 2008-09 6 - 13

6.4 NET WORTH
The combination of financial assets and liabilities and non-financial assets establishes each sector’s net worth. Adding the sectors together establishes the net worth of the total state sector. Table 6.8 shows the net worth of the State.
Table 6.8: Total state sector net worth June 2005 June 2006 June 2007 June 2008 June 2009 June 2010 June 2011 June 2012
Actual Actual Actual Revised Budget$m $m $m $m $m $m $m $m
ASSETSNon-Financial AssetsPhysical assets(a) 168,623 171,813 180,848 189,057 198,906 209,180 219,088 228,769 Investment property ... 1,513 1,474 1,552 1,590 1,615 1,789 2,588 Assets held for sale 278 326 298 220 172 219 192 131 Biological assets 1,595 1,559 1,409 1,435 1,470 1,512 1,555 1,599 Intangible and other assets 1,774 2,964 3,639 3,892 4,339 4,733 4,992 5,212
Total Non-Financial Assets 172,270 178,175 187,668 196,156 206,477 217,259 227,616 238,299
Financial AssetsCash and Deposits 3,217 4,319 4,303 4,334 4,016 4,360 4,821 5,630 Advances paid 246 242 223 333 394 410 436 448 Investments(b) 12,496 11,020 12,321 10,765 11,679 12,321 13,053 13,650 Receivables 4,699 5,200 6,328 5,847 5,413 5,612 5,723 5,792 Equity Assets 595 1,506 1,523 1,626 1,754 1,826 1,900 1,933
Total Financial Assets 21,253 22,287 24,698 22,905 23,256 24,529 25,933 27,453
TOTAL ASSETS 193,523 200,462 212,366 219,061 229,733 241,788 253,549 265,752
LIABILITIESDeposits Held 861 430 483 262 269 263 291 287 Advances Received 1,641 923 892 865 836 807 778 748 Borrowing 29,012 28,969 34,658 36,503 43,226 49,026 54,868 60,391 Superannuation(b) 12,490 18,249 14,068 17,530 17,833 20,705 20,824 20,850 Other Employee Entitlements 9,350 10,172 10,268 10,695 10,845 11,202 11,465 11,719 Payables 5,895 5,565 5,971 5,240 5,337 5,644 5,758 5,869 Other Provisions and Liabilities 5,708 8,645 9,251 8,975 9,476 9,927 10,419 11,338
TOTAL LIABILITIES 64,957 72,953 75,591 80,069 87,822 97,574 104,403 111,202
NET WORTH 128,565 127,509 136,775 138,992 141,911 144,214 149,146 154,550 Gross debt 31,514 30,322 36,033 37,629 44,331 50,096 55,936 61,426 Assets(b) 15,959 15,581 16,847 15,432 16,089 17,091 18,310 19,728
Net Debt 15,555 14,741 19,186 22,198 28,243 33,005 37,626 41,698
% of GSP 5.2 4.7 5.7 6.2 7.3 8.1 8.7 9.1 Total Liabilities 64,957 72,953 75,591 80,069 87,822 97,574 104,403 111,202 Financial Assets(b) 21,253 22,287 24,698 22,905 23,256 24,529 25,933 27,453
Net Financial Liabilities(c) 43,705 50,664 50,893 57,164 64,567 73,045 78,471 83,749
% of GSP 14.5 16.0 15.2 16.0 16.7 17.9 18.2 18.3
Forward estimates
(a) Excludes RTA land under roads. (b) GGLMF assets are excluded from net debt estimates and included in estimates of unfunded superannuation. (c) Net financial liability estimates for 2005 and 2006 have been restated in accordance with AASB 1049 principles.
6 - 14 Budget Statement 2008-09

Total state sector net worth is expected to increase by $2.2 billion in 2007-08 and by $15.6 billion between June 2008 and June 2012. The value of non-financial assets is expected to increase by more than $42 billion over this time, from $196.2 billion in 2008 to $238.3 billion in 2012. Net debt is forecast to rise by $19.5 billion in this period from $22.2 billion in 2008 to $41.7 billion in 2012, a rise of 2.9 per cent as a percentage of gross state product.
Chart 6.8: Total state sector net worth, as at 30 June
100
110
120
130
140
150
160
2005 2006 2007 2008Rev
2009Bud
2010Est
2011Est
2012Est
$ bi
llion
s
The ongoing increase in the net worth of the state reflects the funding of a significant component for the $57.6 billion infrastructure investment program from cash operating surpluses.
As shown in Tables 6.2 and 6.4, operating surpluses (net of depreciation) are forecast to fund around 66 per cent of capital expenditure in the general government sector and nearly 50 per cent in the PTE sector.
Net debt has risen, mostly in the PTE sector. As a percentage of gross state product, net debt levels in the general government sector remain low.
Apart from net debt, growth in superannuation and other net financial liabilities is expected to be restrained, rising from $35 billion in 2008 to $42 billion in 2012. As a percentage of gross state product, the value of non-debt related net financial liabilities is forecast to fall from 9.8 per cent in 2008 to 9.2 per cent in 2012.
Budget Statement 2008-09 6 - 15

6.5 UNFUNDED SUPERANNUATION
GENERAL GOVERNMENT SUPERANNUATION LIABILITIES Approximately 73 per cent of the NSW public sector workforce are members of accumulation schemes, primarily First State Super (FSS), where employers contribute the 9 per cent Superannuation Guarantee Charge (SGC).
The balance of the NSW public sector workforce are members of closed defined benefit schemes: the pension based State Superannuation Scheme (SSS) and Police Superannuation Scheme (PSS); and the lump sum based State Authorities Superannuation Scheme (SASS) and State Authorities Non-Contributory Superannuation Scheme (SANCS). The administration and investment functions for the schemes are the responsibility of the State Authorities Superannuation Trustee Corporation (STC).
As shown in Chart 6.9, there will be a pronounced decline in active STC scheme members and an increasing number of pensioners over the next twenty years. Pensioner numbers are expected to peak at approximately 58,000 in 2017 and then decline slowly over the following thirty years.
STC scheme membership projection to 2050(a) Chart 6.9:
-
10,000
20,000
30,000
40,000
50,000
60,000
70,000
80,000
2010 2020 2030 2040 2050
Fund
Mem
bers
hip
Active membership Deferred membership Pensioners
(a) Graph provided by the STC.
6 - 16 Budget Statement 2008-09

Other public sector schemes are dedicated to specific activities, being the Electricity Industry Superannuation Scheme (EISS), the Judges Pension Scheme (JPS) and the Parliamentary Contributory Superannuation Fund (PCSF). Apart from the Judges Pension Scheme, these schemes have also been closed to new members for some time. The PCSF has currently been granted an employer contribution funding holiday due to the level of funding being within the Scheme’s actuarial target range.
Superannuation scheme liabilities are funded by financial assets, invested and managed by the superannuation trustees of the respective schemes. The margin between liabilities and assets is defined as the unfunded liability. Specifically, the unfunded liability is the difference between the present value of future benefits that have accrued during past service (the gross liability) and the market value of superannuation fund assets.
The unfunded liabilities of the NSW Government sector are actuarially calculated by actuaries Mercer Human Resource Consulting. The estimates of liabilities, assets, earnings and unfunded liabilities are based on numerous economic and demographic assumptions, including salary growth rates, consumer price index forecasts, liability discount rates, investment earning rates, scheme exit rates and the type of benefit taken (pension or lump sum). These assumptions can vary significantly over time, leading to ongoing revision to the level of unfunded liabilities.
Table 6.9: General government sector unfunded superannuation liabilities
June 2005 June 2006 June 2007 June 2008 June 2009 June 2010 June 2011 June 2012Actual Actual Actual Revised Budget
$m $m $m $m $m $m $m $m
Liabilities(a) 34,959 44,065 43,847 44,999 46,138 49,188 49,667 49,938
Less:
Assets 18,497 20,936 29,484 27,872 28,749 29,267 29,651 29,913Reserves held in General Government Liability Management Fund(b) 4,001 5,307 ... ... ... ... ... ...
Net Unfunded Liabilities(c) 12,461 17,822 14,363 17,126 17,389 19,921 20,016 20,024
Forward estimates
(a) The large increase in liabilities in June 2006 is due to the adoption of AASB 119. (b) The General Government Liability Management Fund paid $7.175 billion to the State Super Fund in June 2007. (c) Includes assets and liabilities of employers and employees. Includes STC Pooled Fund schemes, Parliamentary
Contributory Superannuation Scheme and Judges’ Pension Scheme.
Budget Statement 2008-09 6 - 17
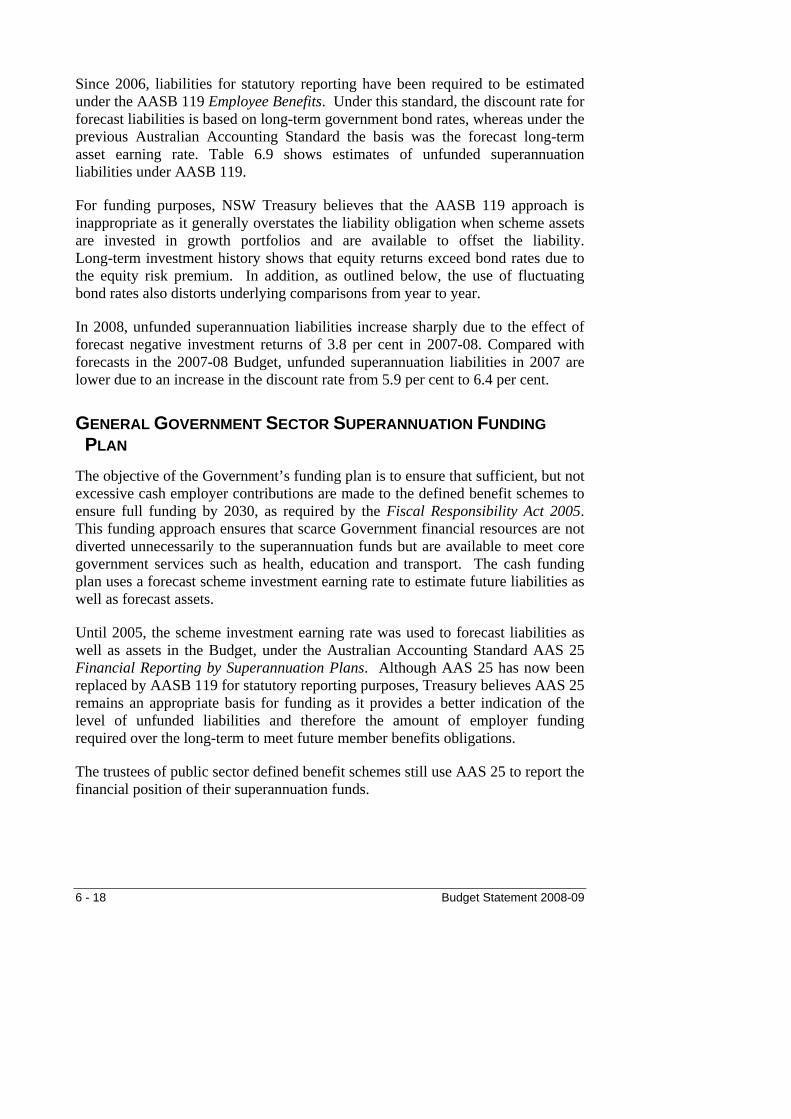
Since 2006, liabilities for statutory reporting have been required to be estimated under the AASB 119 Employee Benefits. Under this standard, the discount rate for forecast liabilities is based on long-term government bond rates, whereas under the previous Australian Accounting Standard the basis was the forecast long-term asset earning rate. Table 6.9 shows estimates of unfunded superannuation liabilities under AASB 119.
For funding purposes, NSW Treasury believes that the AASB 119 approach is inappropriate as it generally overstates the liability obligation when scheme assets are invested in growth portfolios and are available to offset the liability. Long-term investment history shows that equity returns exceed bond rates due to the equity risk premium. In addition, as outlined below, the use of fluctuating bond rates also distorts underlying comparisons from year to year.
In 2008, unfunded superannuation liabilities increase sharply due to the effect of forecast negative investment returns of 3.8 per cent in 2007-08. Compared with forecasts in the 2007-08 Budget, unfunded superannuation liabilities in 2007 are lower due to an increase in the discount rate from 5.9 per cent to 6.4 per cent.
GENERAL GOVERNMENT SECTOR SUPERANNUATION FUNDING PLAN
The objective of the Government’s funding plan is to ensure that sufficient, but not excessive cash employer contributions are made to the defined benefit schemes to ensure full funding by 2030, as required by the Fiscal Responsibility Act 2005. This funding approach ensures that scarce Government financial resources are not diverted unnecessarily to the superannuation funds but are available to meet core government services such as health, education and transport. The cash funding plan uses a forecast scheme investment earning rate to estimate future liabilities as well as forecast assets.
Until 2005, the scheme investment earning rate was used to forecast liabilities as well as assets in the Budget, under the Australian Accounting Standard AAS 25 Financial Reporting by Superannuation Plans. Although AAS 25 has now been replaced by AASB 119 for statutory reporting purposes, Treasury believes AAS 25 remains an appropriate basis for funding as it provides a better indication of the level of unfunded liabilities and therefore the amount of employer funding required over the long-term to meet future member benefits obligations.
The trustees of public sector defined benefit schemes still use AAS 25 to report the financial position of their superannuation funds.
6 - 18 Budget Statement 2008-09
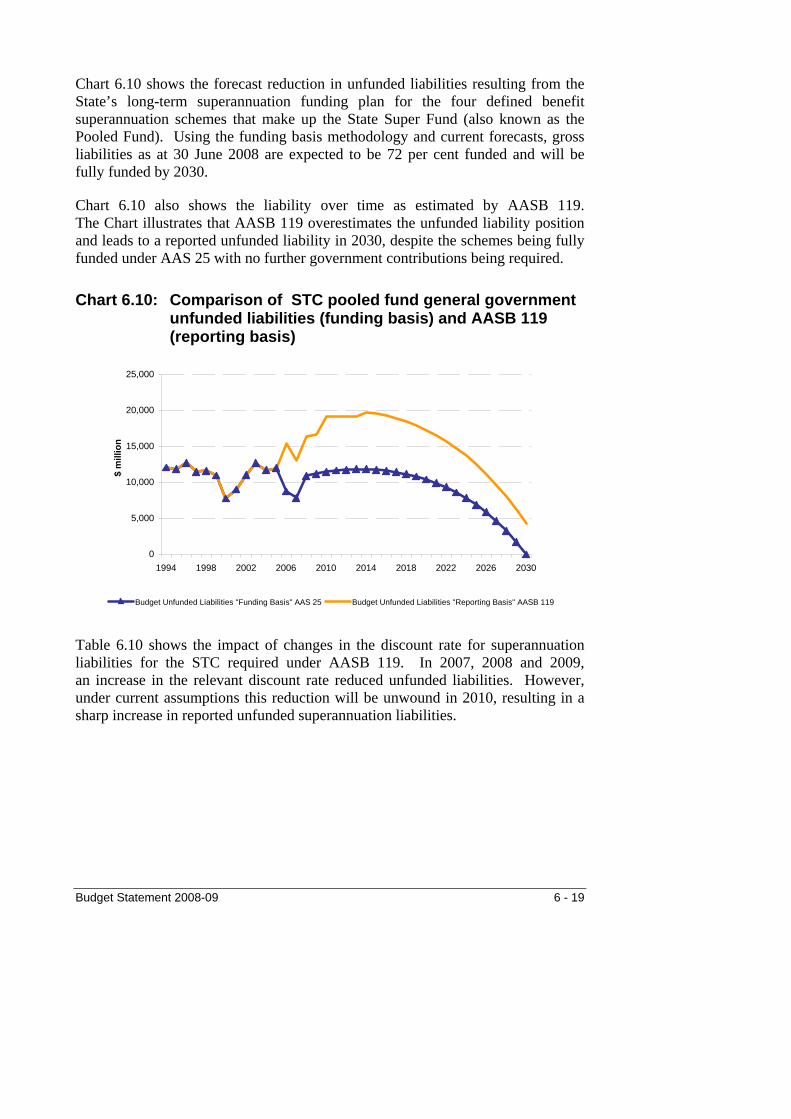
Chart 6.10 shows the forecast reduction in unfunded liabilities resulting from the State’s long-term superannuation funding plan for the four defined benefit superannuation schemes that make up the State Super Fund (also known as the Pooled Fund). Using the funding basis methodology and current forecasts, gross liabilities as at 30 June 2008 are expected to be 72 per cent funded and will be fully funded by 2030.
Chart 6.10 also shows the liability over time as estimated by AASB 119. The Chart illustrates that AASB 119 overestimates the unfunded liability position and leads to a reported unfunded liability in 2030, despite the schemes being fully funded under AAS 25 with no further government contributions being required.
Chart 6.10: Comparison of STC pooled fund general government unfunded liabilities (funding basis) and AASB 119 (reporting basis)
0
5,000
10,000
15,000
20,000
25,000
1994 1998 2002 2006 2010 2014 2018 2022 2026 2030
$ m
illio
n
Budget Unfunded Liabilities "Funding Basis" AAS 25 Budget Unfunded Liabilities "Reporting Basis" AASB 119
Table 6.10 shows the impact of changes in the discount rate for superannuation liabilities for the STC required under AASB 119. In 2007, 2008 and 2009, an increase in the relevant discount rate reduced unfunded liabilities. However, under current assumptions this reduction will be unwound in 2010, resulting in a sharp increase in reported unfunded superannuation liabilities.
Budget Statement 2008-09 6 - 19
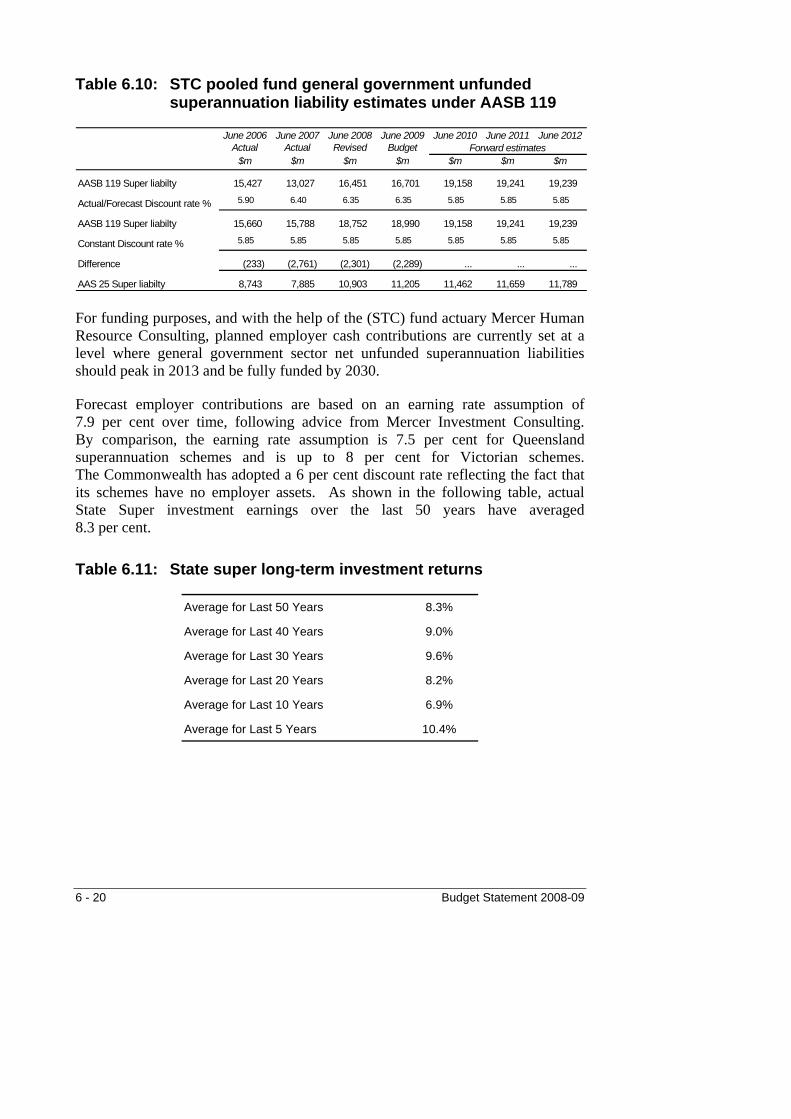
Table 6.10: STC pooled fund general government unfunded superannuation liability estimates under AASB 119
June 2006 June 2007 June 2008 June 2009 June 2010 June 2011 June 2012Actual Actual Revised Budget
$m $m $m $m $m $m $m
AASB 119 Super liabilty 15,427 13,027 16,451 16,701 19,158 19,241 19,239
Actual/Forecast Discount rate % 5.90 6.40 6.35 6.35 5.85 5.85 5.85
AASB 119 Super liabilty 15,660 15,788 18,752 18,990 19,158 19,241 19,239
Constant Discount rate % 5.85 5.85 5.85 5.85 5.85 5.85 5.85
Difference (233) (2,761) (2,301) (2,289) ... ... ...
AAS 25 Super liabilty 8,743 7,885 10,903 11,205 11,462 11,659 11,789
Forward estimates
For funding purposes, and with the help of the (STC) fund actuary Mercer Human Resource Consulting, planned employer cash contributions are currently set at a level where general government sector net unfunded superannuation liabilities should peak in 2013 and be fully funded by 2030.
Forecast employer contributions are based on an earning rate assumption of 7.9 per cent over time, following advice from Mercer Investment Consulting. By comparison, the earning rate assumption is 7.5 per cent for Queensland superannuation schemes and is up to 8 per cent for Victorian schemes. The Commonwealth has adopted a 6 per cent discount rate reflecting the fact that its schemes have no employer assets. As shown in the following table, actual State Super investment earnings over the last 50 years have averaged 8.3 per cent.
Table 6.11: State super long-term investment returns
Average for Last 50 Years 8.3%
Average for Last 40 Years 9.0%
Average for Last 30 Years 9.6%
Average for Last 20 Years 8.2%
Average for Last 10 Years 6.9%
Average for Last 5 Years 10.4%
6 - 20 Budget Statement 2008-09

The funding plan also makes allowance for certain tax concessions available to public sector superannuation funds, in particular, that asset earnings available to meet pension liabilities are tax free. The availability of Australian share franking credits ensures that STC schemes are generally eligible for a tax refund in most tax years.
Forecast assets from ongoing funding, plus future expected investment returns, should ensure no further Crown employer contributions will be required past 2030.
Table 6.12 demonstrates the financial benefits of the Government policy of fully funding superannuation liabilities. If the Government had adopted a pay-as-you-go approach, contributions would have had to equal benefits paid. With higher rates of funding of liabilities as they accrue over time, cash contributions to the State Super Fund are significantly below actual benefits paid to members.
Table 6.12: State superannuation fund total state sector June 2008 June 2008 June 2009 June 2010 June 2011 June 2012 4 year to
Budget Revised Budget 2012 Total $m $m $m $m $m $m $m
Total Benefit Payments 2,995 3,022 3,176 3,659 3,865 4,052 14,752 Employer Contributions 967 1,039 1,138 1,168 1,200 1,233 4,739
Cash Saving 2,028 1,983 2,038 2,491 2,665 2,819 10,013
Forward estimates
For most of the period prior to 1995, superannuation was largely funded on a pay-as-you-go basis.
6.6 INSURANCE
SELF INSURANCE Insurance estimates in the general government sector reflect a number of self insurance schemes, closed insurance schemes and other specific insurance based arrangements, including the Treasury Managed Fund (TMF), the Workers Compensation (Dust Diseases) Board, HIH, various WorkCover administered schemes such as the Emergency Rescue Workers’ and Bush Fire Fighters’ Compensation Funds, as well as other arrangements. Self insurance liabilities arise primarily from the TMF and WorkCover administered schemes.
The total insurance liabilities for the general government sector are shown in Table 6.13.
Budget Statement 2008-09 6 - 21
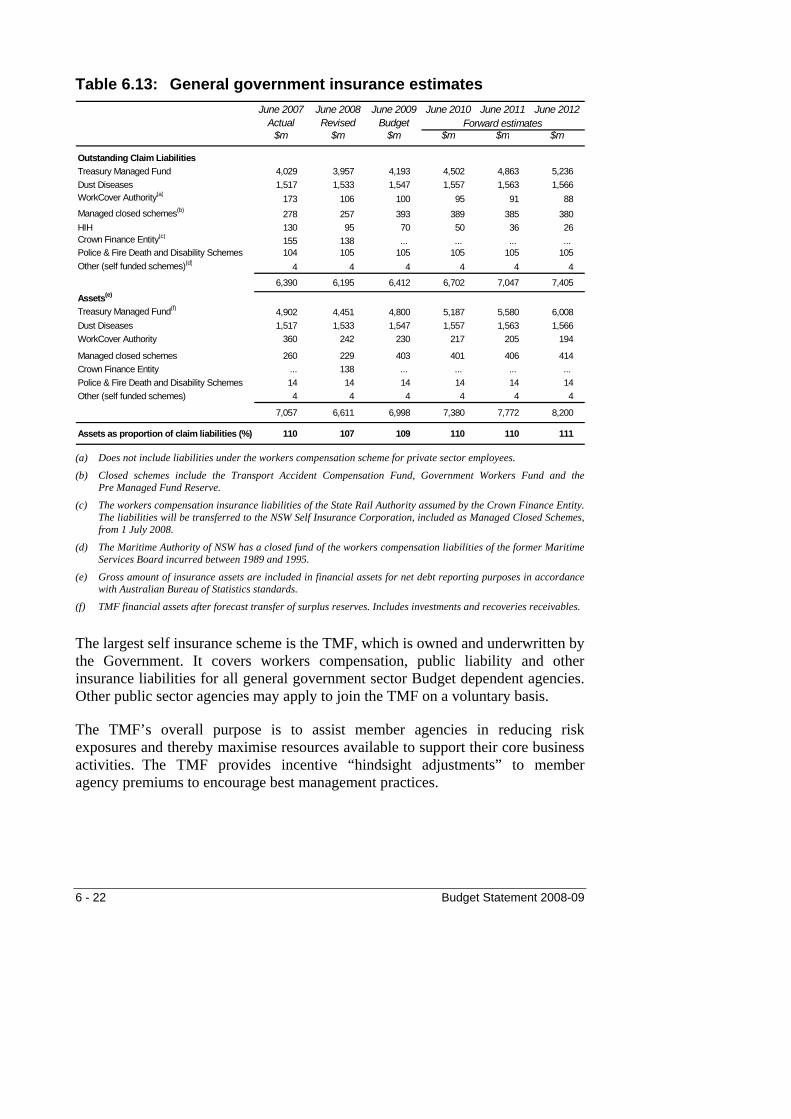
Table 6.13: General government insurance estimates June 2007 June 2008 June 2009 June 2010 June 2011 June 2012
Actual Revised Budget$m $m $m $m $m $m
Outstanding Claim LiabilitiesTreasury Managed Fund 4,029 3,957 4,193 4,502 4,863 5,236 Dust Diseases 1,517 1,533 1,547 1,557 1,563 1,566 WorkCover Authority(a) 173 106 100 95 91 88 Managed closed schemes(b) 278 257 393 389 385 380 HIH 130 95 70 50 36 26 Crown Finance Entity(c) 155 138 ... ... ... ... Police & Fire Death and Disability Schemes 104 105 105 105 105 105 Other (self funded schemes)(d) 4 4 4 4 4 4
6,390 6,195 6,412 6,702 7,047 7,405
Assets(e)
Treasury Managed Fund(f) 4,902 4,451 4,800 5,187 5,580 6,008 Dust Diseases 1,517 1,533 1,547 1,557 1,563 1,566 WorkCover Authority 360 242 230 217 205 194
Managed closed schemes 260 229 403 401 406 414 Crown Finance Entity ... 138 ... ... ... ... Police & Fire Death and Disability Schemes 14 14 14 14 14 14 Other (self funded schemes) 4 4 4 4 4 4
7,057 6,611 6,998 7,380 7,772 8,200
Assets as proportion of claim liabilities (%) 110 107 109 110 110 111
Forward estimates
(a) Does not include liabilities under the workers compensation scheme for private sector employees.
(b) Closed schemes include the Transport Accident Compensation Fund, Government Workers Fund and the Pre Managed Fund Reserve.
(c) The workers compensation insurance liabilities of the State Rail Authority assumed by the Crown Finance Entity. The liabilities will be transferred to the NSW Self Insurance Corporation, included as Managed Closed Schemes, from 1 July 2008.
(d) The Maritime Authority of NSW has a closed fund of the workers compensation liabilities of the former Maritime Services Board incurred between 1989 and 1995.
(e) Gross amount of insurance assets are included in financial assets for net debt reporting purposes in accordance with Australian Bureau of Statistics standards.
(f) TMF financial assets after forecast transfer of surplus reserves. Includes investments and recoveries receivables.
The largest self insurance scheme is the TMF, which is owned and underwritten by the Government. It covers workers compensation, public liability and other insurance liabilities for all general government sector Budget dependent agencies. Other public sector agencies may apply to join the TMF on a voluntary basis.
The TMF’s overall purpose is to assist member agencies in reducing risk exposures and thereby maximise resources available to support their core business activities. The TMF provides incentive “hindsight adjustments” to member agency premiums to encourage best management practices.
6 - 22 Budget Statement 2008-09

TMF workers compensation claims management is distributed between three claims managers, Employers Mutual Limited, Allianz Insurance Limited and GIO General Limited. GIO provides all other general insurance claims management. There are also separate long-term contracts for risk management (Suncorp), reinsurance (Benfield) and actuarial services (PricewaterhouseCoopers and Taylor Fry). This claims management model allows for more active in-house management and effectively reduces the systemic risk associated with a single provider. This model provides a more competitive environment, contributing to lower overall costs of insurance to the Government.
Chart 6.11 shows a general trend of stability or decline in outstanding claims liabilities in recent years for both workers compensation and public liability. This situation is a result of continued favourable impact of the workers compensation and tort reform legislative changes, the new claims management model, and improved internal risk and claims management practice of public sector agencies.
Chart 6.11: TMF outstanding claims liabilities
Workers Compensation
0
500
1000
1500
2000
2500
2000-01 2001-02 2002-03 2003-04 2004-05 2005-06 2006-07 2007-08Rev
2008-09Bud
$ m
illio
n
Public Liability
0
500
1000
1500
2000
2500
2000-01 2001-02 2002-03 2003-04 2004-05 2005-06 2006-07 2007-08Rev
2008-09Bud
$ m
illio
n
In 2008-09, the TMF actuary has allowed for some growth in claims. The projected growth in liabilities is not an indication of any adverse claims experience.
Budget Statement 2008-09 6 - 23

TMF claim cash payments(a) Chart 6.12:
500
520
540
560
580
600
620
640
660
680
700
2000-01 2001-02 2002-03 2003-04 2004-05 2005-06 2006-07 2007-08Rev
2008-09Bud
$ m
illio
n
(a) The increase in 2007-08 follows a number of large existing claim settlements for significant amounts as well as
payments for natural disasters.
The TMF target premium for 2008-09 has been reduced by 1.9 per cent from 2007-08 levels. Compared to 2007-08, workers compensation premiums have fallen by 3.3 per cent ($14.7 million) and public liability premiums have fallen by 3.5 per cent ($10.2 million).
Reduced workers compensation premiums follow reduced ongoing claims and payment experience plus prospective changes in rehabilitation management practices. Reduced public liability premiums reflect significant reductions in Visiting Medical Officer premiums, after some years of good claims experience.
Chart 6.13: Total TMF premiums by line of business
0
100
200
300
400
500
600
700
800
900
1000
1999-00 2000-01 2001-02 2002-03 2003-04 2004-05 2005-06 2006-07 2007-08Rev
2008-09Bud
$ m
illio
n
Workers' Compensation Public Liability Other
6 - 24 Budget Statement 2008-09

For public liability, this is the fifth year that premiums have been reduced. The 3.5 per cent fall in 2008-09 follows a 3.4 per cent fall in 2007-08, a 4.2 per cent fall in 2006-07, a 12.6 per cent fall in 2005-06 and a 0.2 per cent in 2004-05. Chart 6.13 shows the trend in premiums by the major lines of business.
Liabilities under the Dust Diseases Scheme are expected to grow moderately over the forward estimates period. These liabilities are fully offset by an asset receivable which recognises the Dust Diseases Board’s legislative power to adjust employer premiums in order to fund future claims. Other insurance liabilities are expected to fall, reflecting the closed nature of these schemes.
NET ASSETS HOLDING LEVEL POLICY In March 2006, Treasury established the Net Assets Holding Level Policy (previously referred to as the Insurance Reserve Policy) that dictates an appropriate level of surplus assets held for the TMF. This policy sets TMF’s surplus assets at 10 per cent above outstanding claims liabilities, plus the amount of reinsurance retention that the Fund would incur for a single loss. The surplus is reviewed based on the financial results as at 31 December each year.
Consistent with the superannuation funding plan, the Net Assets Holding Level Policy uses a forecast Treasury Managed Fund investment earning rate to estimate future liabilities as well as forecast assets.
Following the review of the fund as at 31 December 2007, a surplus above the requirement level was identified and $300 million will be transferred to the Consolidated Fund before 30 June 2008. This follows previous surplus payments to the Consolidated Fund of $910 million in 2007 and $1 billion to the General Government Liability Management Fund in 2006. These contributions reflect reductions in claims incurred and overall higher than expected investment returns during the period.
HIH LIQUIDATION In order to maintain the community’s confidence in the insurance industry after the collapse of the HIH/FAI Insurance Group in 2001, the NSW Government assumed in excess of $700 million in claims liabilities. These liabilities are for outstanding compulsory third party motor vehicle policies in force with HIH prior to 31 December 2000, plus home warranty insurance policies in force with HIH prior to 15 March 2001.
The assumption of HIH liabilities by the Government has ensured that persons injured in a motor vehicle accident and persons with home warranty claims against HIH can seek recourse for compensation in respect of their injuries and losses.
Budget Statement 2008-09 6 - 25
Outstanding HIH liabilities are expected to reduce to $95 million by 30 June 2008, with payments to policyholders and for third party compensation estimated at approximately $48 million for 2007-08. During 2007-08, HIH liquidators paid the Government $67 million. A further $10 million payment is expected in 2008-09.
The HIH collapse also had an adverse impact on a number of local councils insured with HIH. The NSW Government negotiated with the Commonwealth to provide financial assistance to local councils which had judgements against them that would have been met by HIH policies.
The NSW Government has provided assistance to Evans Shire Council, Balranald Shire Council, Ballina Shire Council, Berrigan Shire Council, Clarence Valley Council and Nundle Shire Council since the commencement of the scheme. By June 2008, the NSW Government will have paid $15 million to local councils which experienced financial difficulty meeting HIH debts.
6.7 FINANCIAL ASSET MANAGEMENT
THE ROLE OF ASSETS IN FINANCIAL MANAGEMENT The State accumulates financial assets in order to meet employee superannuation benefit payments and the Government’s insurance liability costs as they fall due rather than place an undue burden on future generations.
There are two major asset portfolios, the State Superannuation Fund (State Super) and the Treasury Managed Fund (TMF).
INVESTMENT INCOME Despite the recent falls in Australian and overseas equity markets due to the global credit crisis, following the impact of the United States sub-prime loan failures, forecast State Super and TMF returns over the medium term have been positive as shown in Table 6.14.
Forward budget estimates assume investment earnings will return to long-term trend levels of 7.9 per cent for State Super and 7.2 per cent for the TMF. The higher return for State Super reflects a greater weighting in growth assets in line with the longer term nature of its liabilities.
6 - 26 Budget Statement 2008-09
Table 6.14: Forecast average investment returns
to 30 June 2008 State Super%
TMF%
One Year (estimate) -3.8 -2.5 Average 2 Years 5.1 3.3 Average 3 Years 8.6 5.8 Average 5 Years 10.4 7.3
The value of forecast investment income from the portfolio financial assets is shown in Table 6.15. Income is influenced by the volume of funds (including transfer of funds) and the rate of earnings on funds. In 2007-08, forecast earnings on State Super and TMF investments are lower than budgeted reflecting the negative return on equities expected this financial year.
Table 6.15: General government forecast investment income for superannuation and TMF
June 2006 June 2007 June 2009 June 2010 June 2011 June 2012Actual Actual Budget Revised Budget
$m $m $m $m $m $m $m $m
SuperannuationAASB 119 Investment Income 1,289 1,690 1,927 2,227 2,095 2,147 2,183 2,211 Actual Investment income 4,023 4,184 n.a. (1,108) n.a. n.a. n.a. n.a.
InsuranceTMF 601 539 355 (138) 339 364 388 414
Forward estimatesJune 2008
In accordance with AASB 119, State Super investment income, based on a constant investment return rate (currently 7.9 per cent) is offset against superannuation expenses in the budget estimates. The difference between the AASB 119 and actual investment income is recorded as an actuarial gain or loss which, in accordance with AASB 1049 reporting standards, is not incorporated in the budget result. Accordingly, variations in budgeted investment returns on superannuation assets only influence the budget results through a variation in asset opening balances during the forward estimates period.
PORTFOLIO MANAGEMENT As a result of significantly lower insurance expenses and strong investment returns in prior years, the TMF remains fully funded. The TMF financial asset portfolio is expected to approximate $4.3 billion at 30 June 2008 after allowing for the NSW Self Insurance Corporation (SICorp) surplus under the Net Assets Holding Level Policy, and the consequent transfer of $300 million to the Consolidated Fund.
Budget Statement 2008-09 6 - 27

Growth assets, equities and property currently represent about 48 per cent of investments in TMF on average, with the remainder in bonds and a small cash allocation. The investments are held by TCorp in its HourGlass facilities or directly in a managed bond portfolio.
A memorandum of understanding (MOU) between TCorp and NSW Treasury details investment policies and procedures and sets benchmarks for each asset class. Investment performance is monitored by the Crown Entity Asset Management Committee, which co-ordinates the management of funds held centrally by the State. The Committee has Treasury and TCorp representatives.
State Super assets are managed by an independent trustee, the State Authorities Superannuation Trustee Corporation (STC). Given the long-term nature of the liabilities, a growth strategy has been adopted. The strategic asset allocation of TMF and State Super is shown in Chart 6.14.
Chart 6.14: Strategic asset allocation
TMF
Australian Shares
20%
International Shares
25%
Property5%
Australian Bonds35%
International Bonds10%
Cash5%
STC
Infrastructure6.5%
Private Equity1.5%
Cash6%Other
1.5%International Bonds
7%
Property11.5%
Australian Bonds
7%
International Shares27%
Australian Shares
32%
6.8 FINANCIAL RISK MANAGEMENT
The major net financial liabilities of the State also represent the major financial risks, and are centrally managed and monitored.
DEBT MANAGEMENT Debt management has two long-term objectives: first to minimise the market value of debt within specified risk constraints, and second to minimise the cost of debt.
6 - 28 Budget Statement 2008-09

To minimise debt, the Crown debt portfolio comprises core, strategic and tactical portfolios. TCorp, as debt manager, adopts a passive approach except for the tactical portfolio where an active management style aims to add value relative to a benchmark portfolio.
The management of these portfolios is governed by a memorandum MOU between NSW Treasury and TCorp. The MOU includes a requirement to adhere to finance expense budget allocations, which are agreed at the beginning of each financial year. The General Government Debt Management Committee, consisting of representatives of TCorp, Treasury and the Roads and Traffic Authority, meets quarterly to monitor debt strategy.
As part of the debt management process, TCorp has now started to issue longer term inflation indexed bonds, following a review of debt benchmarks and debt management processes. Use of these bonds will help reduce debt volatility and help to minimise the cost of debt over time.
SUPERANNUATION MANAGEMENT Mercer Human Resource Consulting undertakes an annual review of liabilities using data maintained by Pillar Administration (the contracted scheme administrator) for the SAS Trustee Corporation, and the most recent Triennial Review actuarial economic assumptions.
INSURANCE MANAGEMENT TMF agencies have no exposure to reinsurance failure and are not affected by exclusions to reinsurance or gaps in the cover reinsurers provide (e.g. terrorism). The TMF purchases a comprehensive reinsurance program to protect its exposure to catastrophic events.
The TMF, in consultation with risk manager provider Suncorp, is able to analyse the TMF data warehouse and identify areas of risk and design risk management strategies that target risk areas.
The Treasury Managed Fund Advisory Board also assists in assessing agency responsiveness to the risk management philosophy of the fund. The Board is representative of the broad spectrum of agencies in the fund and includes representatives from seven agencies as well as representatives of the Public Sector Risk Management Association and NSW Treasury. Members are generally from the finance area or occupational health and safety area of their agencies.
Budget Statement 2008-09 6 - 29
The Board’s role includes recommending the allocation of TMF risk management resources, monitoring the performance of sponsored projects and assisting with the monitoring of fund managers’ performance in accordance with contract undertakings and service level agreements.
PUBLIC AUTHORITIES (FINANCIAL ARRANGEMENTS) ACT 1987 The Public Authorities (Financial Arrangements) Act 1987 (the Act) contains controls to manage risks resulting from government agencies’ financial arrangements. It regulates government agencies’ powers to borrow, use derivatives, invest, use funds managers and enter into joint ventures or joint financing arrangements. The Act also provides for government guarantees of financial arrangements entered into under the Act.
Treasury and its PAFA risk management advisor, Deloitte, review the risk management policies and procedures of selected agencies based on an assessment of their risk levels. High risk agencies are reviewed annually and medium risk agencies every two years, whilst for low risk agencies reliance is placed on Audit Office annual audits.
The number of PAFA risk reviews expected to be undertaken by Deloitte and Treasury, in 2008-09, are shown in the following table.
Table 6.16: PAFA risk review program: number of reviews
Reviewed by 2007-08 2008-09
Deloitte: Mainly public trading enterprises and public financial corporations 17 20
Treasury: Mostly general government agencies 19 21
The Act has been updated on an incremental basis since 1987 to reflect particular changes in financial risk management.
Amendments to the Act to update, simplify and strengthen the regulatory framework are currently being prepared. The objective of the proposed amendments is to enhance the prudential measures of the NSW public sector and to provide an updated and more flexible legislative framework.
6 - 30 Budget Statement 2008-09
CHAPTER 7: PUBLIC TRADING ENTERPRISES
♦ The public trading enterprise (PTE) sector includes commercial businesses that are profitable and provide a return to government on the assets invested (e.g. electricity, water, waste services and ports).
♦ The sector also includes non-commercial businesses that address important social policy objectives (e.g. public transport and social housing).
♦ The commercial PTE sector is forecast to experience strong earnings growth over the Budget and forward estimates period, almost entirely due to expected earnings growth in the water and electricity distribution and transmission sectors.
♦ Reflecting this increased profitability, contributions to the Budget from commercial PTEs in the form of dividends and tax equivalent payments are estimated to increase from $1.8 billion in 2008-09 to $2.2 billion in 2011-12.
♦ The PTE sector is currently in a period of record capital investment with $36.4 billion expected to be spent over the Budget and forward estimates period.
♦ This capital expenditure is projected to be $2.7 billion higher between 2008-09 and 2010-11 than estimated in last year’s Budget, reflecting increased expenditure by the electricity distribution and transmission businesses to address ageing assets and new transport projects announced since last year’s Budget.
♦ To fund this record capital expenditure, net debt in the PTE sector is forecast to grow from $18.6 billion in June 2008 to $37 billion in June 2012.
♦ The gearing level of commercial PTEs will increase to 54.4 per cent by June 2012. This remains well within commercially prudent levels.
7.1 INTRODUCTION
The public trading enterprise (PTE) sector includes commercial businesses which provide a return to government on the assets invested on behalf of the community (e.g. electricity, water, waste services and ports). Dividend and tax equivalent payments from commercial PTEs will contribute an estimated $1.8 billion to the Budget in 2008-09, and will be applied towards the cost of providing high quality public services, such as health, education, and law and order.
Budget Statement 2008-09 7 - 1

The sector also includes non-commercial businesses that address important social policy objectives (e.g. public transport and social housing). Non-commercial PTEs receive a significant portion of their funding from the budget through grants and subsidies. However, they differ from general government budget dependent agencies in that they also derive substantial revenue from independent sources, such as user charges.
In response to the recommendations of the Inquiry into Electricity Supply in New South Wales (the Owen Inquiry) 1, the Government has announced that the future energy needs of the State will be secured at no cost to taxpayers. To provide for new energy generation by the private sector, the Government will lease existing electricity generators to private operators and transfer the retail operations of Country Energy, EnergyAustralia and Integral Energy to the private sector. The electricity networks (distribution and transmission) will remain publicly owned.
This transaction will have no future budget impact, as sufficient funds realised from the reforms will be invested in the Community Infrastructure (Intergenerational) Fund to provide an income stream equal to the budgeted long-run returns (dividends and tax equivalents) foregone from the retail and generation sectors. Dividends and tax equivalents will continue to be received from the network businesses as these will continue to be operated by the Government.
Following normal budget practice, estimates of the proceeds of the transfer of generation and retail activities to the private sector have not been included in the 2008-09 Budget or the forward estimates.
7.2 COMMERCIAL POLICY FRAMEWORK
PTEs are not subject to debt and equity market scrutiny in the same way as private sector businesses. To ensure government businesses operate efficiently, the NSW Government introduced the Commercial Policy Framework in the early 1990s. The framework aims to replicate within government businesses the private sector disciplines and incentives that promote efficient commercial practice. The framework applies to all PTEs, including State owned corporations, which are governed by the State Owned Corporations Act 1989.
1 NSW Government, Inquiry into Electricity Supply in NSW (Professor Anthony D. Owen), September 2007.
7 - 2 Budget Statement 2008-09

Since its introduction, the Commercial Policy Framework has contributed to improved financial performance in the PTE sector. The book value of the Government’s equity investment in the PTE sector has grown from $48 billion in June 2002 to an estimated $71.6 billion in June 2009. Over the same period, the return on assets achieved by the electricity and water businesses has increased from 6 per cent to an estimated 6.4 per cent.2
7.3 OPERATING PERFORMANCE
A good measure of PTE sector financial performance is the net operating surplus before interest, tax, depreciation, and amortisation (referred to as the adjusted net operating surplus). This measure is equivalent to earnings before interest, tax, depreciation and amortisation (EBITDA) which is commonly used in the private sector as a measure of a business’s cash profits independent of its capital structure.3 Chart 7.1 shows the adjusted net operating surplus for the PTE sector over the period 2001-02 to 2011-12.
Adjusted net operating surplus(a) Chart 7.1:
0
2,000
4,000
6,000
8,000
10,000
12,000
2001-02 Actual
2002-03 Actual
2003-04 Actual
2004-05Actual
2005-06Actual
2006-07 Actual
2007-08 Revised
2008-09 Budget
2009-10 Estimate
2010-11 Estimate
2011-12Estimate
$ m
illio
n
Commercial Non-Commercial
(a) In 2006-07, the adjusted net operating surplus was inflated by a payment of $960 million to the rail sector to retire debt.
2 Return on assets is defined as the net operating surplus before interest and taxes (EBIT) divided by total
assets.
3 EBITDA provides an effective measure to compare the performance of businesses within and across industries, in cases where businesses have a large amount of fixed and intangible assets and a significant amount of debt financing.
Budget Statement 2008-09 7 - 3

The adjusted net operating surplus in the PTE sector is projected to grow strongly at an average of 14.8 per cent per annum over the Budget and forward years, reaching $10.3 billion by 2011-12. This growth largely reflects expected earnings arising from the recovery of capital and debt servicing costs, as well as a return on the asset investment, in future pricing determinations by the Australian Energy Regulator (AER) and the Independent Pricing and Regulatory Tribunal (IPART). Growth in the adjusted net operating surplus also reflects higher cash grants from the State budget to retire debt in the rail sector in 2009-10, and to fund major capital works in this sector over the Budget and forward estimates period.
COMMERCIAL PTE SECTOR PERFORMANCE The commercial PTE sector is forecast to experience strong earnings growth, moving from a forecast adjusted net operating surplus of $4.9 billion in 2008-09 to $6.8 billion in 2011-12.4 This improved performance is almost entirely due to forecast earnings growth in the water and electricity network sectors.
The adjusted net operating surplus of the water sector is expected to increase from $1.2 billion in 2008-09 to $1.7 billion in 2011-12, growing at an average rate of 16 per cent per annum over the Budget and forward estimates period. This primarily reflects stronger earnings growth for Sydney Water Corporation resulting from an increase in its regulated water price from 1 July 2008 (based on the current IPART draft determination released in March 2008).
The adjusted net operating surplus of the electricity sector is expected to increase by 9 per cent per annum over the Budget and forward estimates period, growing from $3.3 billion in 2008-09 to $4.6 billion in 2011-12. This represents over 65 per cent of the expected increase in the adjusted net operating surplus of commercial PTEs, and is largely attributed to:
♦
♦
expected earnings growth in the regulated electricity distribution and transmission sectors, based on the expectation that the AER will make allowance for the recovery of increased capital expenditure requirements in the new regulatory pricing determinations due to commence in July 2009 and
forecast growth in electricity demand.
4 The commercial PTE sector covers PTE businesses in all sectors, except the housing and transport
(excluding ports) sectors.
7 - 4 Budget Statement 2008-09
Stronger commercial PTE sector earnings growth is reflected in:
♦
♦
return on total assets5 improving from 5.6 per cent in 2008-09 to 6.4 per cent in 2011-12 and
dividend and tax equivalent payments increasing from $1.8 billion in 2008-09 to $2.1 billion in 2011-12.6
NON-COMMERCIAL PTE SECTOR PERFORMANCE Non-commercial PTEs receive support through budget grants to provide important services below commercial prices. The adjusted net operating surplus for the non-commercial PTE sector is expected to increase from $1.3 billion in 2008-09 to $3.5 billion in 2011-12. This improved result is almost entirely due to increased grants to the rail sector.
The adjusted net operating surplus of the transport sector is forecast to increase from $924 million in 2008-09 to $3.1 billion in 2011-12. This result reflects increased budget grants to the rail sector over the Budget and forward estimates period to fund major new capital works, including the North West Metro and South West Rail Link.7 The result also reflects a cash payment of $530 million to the rail sector in 2009-10 to retire debt incurred in prior years on major capital projects, including the Epping to Chatswood Rail Line and the Rail Clearways projects.8
Excluding capital grants and payments to retire debt, the transport sector is operating at a deficit of $223.2 million in 2008-09. The underlying trend (i.e. excluding capital grant revenues and debt repayments) shows expenses growing faster than fare revenue. CityRail’s fare revenue as a proportion of operating expenses (excluding depreciation) has fallen from 30 per cent in 2001-02 to an estimated 24.6 per cent in 2008-09.
5 Return on assets is defined as the net operating surplus before interest and taxes (EBIT) divided by total
assets. 6 A further $81 million in dividend payments is expected to be received from Snowy Hydro Limited in
2011-12.
7 Capital grants are recorded as revenues to PTEs.
8 Payments to reduce the build up of debt within the rail sector were announced in the NSW Government’s 2007-08 Half-Yearly Budget Review. The improved Budget position for 2007-08 enabled the Government to bring forward into 2007-08 the debt repayment foreshadowed for 2008-09.
Budget Statement 2008-09 7 - 5
The adjusted net operating surplus of the housing sector is forecast to increase from $373 million in 2008-09 to $412 million in 2011-12. Excluding capital grants, the housing sector is forecasting a slight operating surplus of $23.5 million in 2008-09 which is expected to increase to $101 million in 2011-12. This improved result largely reflects lower operating expenses in this sector.
7.4 CAPITAL EXPENDITURE
One of the commitments in the NSW State Plan is for the Government to maintain and invest in infrastructure (Priority P2). The Government has committed to undertake record infrastructure spending over the 10 year period until 2015-16 and has set a target in the State Plan to maintain an average annual growth in infrastructure expenditure of 4.6 per cent (nominal) over that period. This target is consistent with a total 10 year capital program of $110 billion, as detailed in the initial State Infrastructure Strategy (SIS) published in 2006. This record investment will ensure that enhanced government services can continue to be delivered to the community and that important economic infrastructure is available for private sector growth.
The Government is currently well on track to meet this 10 year State Plan target, with record capital investment in the PTE sector. Over the Budget and forward estimates period, the PTE sector will play a major role in providing State infrastructure in New South Wales, with expenditure rising from over 60 per cent of total State capital expenditure in 2008-09 to around 67 per cent in 2011-12. Investment in electricity, transport and water infrastructure are the key contributors to the significant ramping up in PTE capital expenditure in the forward years.
Chart 7.2 shows PTE capital expenditure from 2001-02 through to the forward estimates period.
7 - 6 Budget Statement 2008-09

Chart 7.2: PTE sector capital expenditure
0
1,000
2,000
3,000
4,000
5,000
6,000
7,000
8,000
9,000
10,000
11,000
2001-02Actual
2002-03Actual
2003-04Actual
2004-05Actual
2005-06Actual
2006-07Actual
2007-08Revised
2008-09Budget
2009-10Estimate
2010-11Estimate
2011-12Estimate
$ m
illio
ns
Total Commercial Total Non-Commercial
In nominal terms, PTE capital expenditure is forecast to grow by 30.6 per cent in 2008-09 to $8.5 billion, up from $6.5 billion in 2007-08. Expenditure will continue to increase over the forward estimates period, at an average rate of 5.9 per cent per annum, reaching $10 billion by 2011-12. Over the Budget and forward estimates period, total PTE capital expenditure is expected to be $36.4 billion.
Capital expenditure in the PTE sector is projected to grow significantly over the Budget and forward estimates period, driven by periodic requirements for major capacity expansions and the replacement of assets that are reaching the end of their economic life. Over the longer term, it is expected that PTE capital expenditure will average 4.6 per cent (nominal) consistent with the SIS.
Table 7.1 provides details of PTE capital expenditure by sector for 2007-08, the Budget year and the forward estimates period.
Budget Statement 2008-09 7 - 7

Table 7.1: PTE capital expenditure by sector
2007-08 2008-09 2009-10 2010-11 2011-12 Total Budget Revised Budget Estimates
$m $m $m $m $m $m
Commercial PTEsElectricity 2,709 3,533 3,897 3,920 4,370 15,720 Water 1,732 2,192 1,719 1,395 1,214 6,520 Ports 128 397 422 192 107 1,118 Property 158 179 111 63 199 552 Other 93 77 95 79 63 315
Total Commercial PTEs 4,821 6,377 6,244 5,650 5,953 24,224
Non Commercial PTEsTransport 1,156 1,515 1,917 2,905 3,549 9,886 Housing 502 568 605 564 542 2,278
Total Non-Commercial PTEs 1,658 2,083 2,522 3,469 4,091 12,165
Total 6,479 8,460 8,766 9,119 10,044 36,388
Forward estimatesSector (a)
(a) Further detail on PTE capital expenditure is outlined in Budget Paper No. 4 Infrastructure Statement. PTEs have been classified according to their predominant activity. This differs from the classifications used in Budget Paper No. 4 where capital expenditures by PTEs are classified according to policy areas, based on the Australian Bureau of Statistics categories. For example, Sydney Water Corporation’s sewerage related capital expenditure is classified as part of Environment Protection expenditure in Budget Paper No. 4, rather than Water expenditure.
COMMERCIAL PTE SECTOR CAPITAL EXPENDITURE Commercial PTE capital expenditure is expected to grow by 32.3 per cent in 2008-09 to $6.4 billion, compared to $4.8 billion in 2007-08, largely driven by increased capital expenditure in the electricity network and water sectors. After peaking in 2008-09, total capital expenditure by commercial PTEs is expected to remain relatively constant in 2009-10 before declining in 2010-11, following the completion of major water and port infrastructure projects.
Capital expenditure in the electricity sector is forecast to grow by 30.4 per cent in 2008-09 from $2.7 billion to $3.5 billion. Expenditure is expected to remain strong over the forward years, growing at an average rate of 7.3 per cent per annum. The major driver is the levels of expenditure by NSW electricity network businesses (transmission and distribution) necessary to meet significant asset replacement and renewal, growth in demand and regulatory requirements to enhance system reliability. Over the forward estimates, total capital expenditure by the distribution and transmission businesses is expected to total $14.4 billion, or around 91 per cent of total infrastructure expenditure in the electricity sector.
7 - 8 Budget Statement 2008-09
The Owen Inquiry signalled the need for further significant capital expenditure over the next decade should the Government retain ownership of retail and generation assets. The Inquiry indicated that the majority of this expenditure, including new investment for baseload generation and the retrofit of existing plant, will be required from 2013 onwards. Given the Government’s response to the Owen Inquiry, and indicative time line for new baseload investment, no provision has been made in this Budget for new baseload investment by NSW generators.
Investment in the water sector is expected to rise by 26.5 per cent in 2008-09 from $1.7 billion to $2.2 billion, before declining in the following three years. Increased expenditure in 2008-09 is largely driven by Sydney Water’s capital program, including the Sydney Desalination Plant, recycling schemes and infrastructure needed for housing growth in the north west and south west growth areas of Sydney.
Increased capital expenditure in the water sector in 2008-09 can also be attributed to an increase in Hunter Water’s capital program, which includes ongoing planning and construction of the Tillegra Dam to improve water security of the Hunter and Central Coast.
NON-COMMERCIAL PTE CAPITAL EXPENDITURE Capital expenditure in the non-commercial PTE sector is forecast to grow by 25.6 per cent in 2008-09 from $1.7 billion to $2.1 billion. Expenditure is expected to increase significantly over the forward years, growing at an average rate of 25.2 per cent per annum over this period. This increase is largely driven by increased expenditure in the rail sector.
Significant expenditure on the Rail Clearways Program, new rollingstock purchases and the commencement of the North West Metro and South West Rail Link will boost capital spending over the forward estimates period. Capital expenditure in the transport sector is expected to more than double from $1.5 billion in 2008-09 to $3.5 billion by 2011-12.
Capital expenditure in the housing sector will increase by 13.2 per cent in 2008-09 to $568 million, peaking at $605 million in 2009-10. The increase reflects the Department of Housing’s State-wide, long-term plan to reconfigure public housing assets to address changing demographics and smaller sized family units.
Budget Statement 2008-09 7 - 9
CHANGES IN CAPITAL EXPENDITURE Between 2008-09 and 2010-11 (the period for which the 2007-08 Budget projections can be contrasted), total PTE capital expenditure is forecast to be $2.7 billion higher than estimated last year.
This variation reflects a significant upward revision in proposed capital expenditure by the electricity network businesses over the forward estimates period, as well as the announcement of a number of new capital expenditure projects in the transport sector since last year’s Budget.
Increased expenditure in the electricity sector accounts for $2.1 billion of the $2.7 billion increase over the three year period from 2008-09 to 2010-11. This variation, which will be subject to a determination by the AER, is largely due to an increase in expected expenditure by electricity network businesses of $1.3 billion to replace assets that are reaching the end of their economic life. Upgrades to network infrastructure to accommodate increased growth and expected cost escalations will also contribute approximately $635 million to the increase in capital expenditure of network businesses over this period.
The transport sector accounts for $675 million of the $2.7 billion increase in expenditure over the three years period from 2008-09 to 2010-11. This primarily reflects the Government’s announcement in March 2008 of major rail expansions in the north west and south west regions of Sydney. In addition, expenditure between 2008-09 to 2010-11 in the ports sector is forecast to be around $100 million higher than estimated at last year's Budget, primarily due to costs associated with the relocation of the Passenger Terminal ($33 million) and the increased scope of the Port Botany expansion.
Capital expenditure in the water sector between 2008-09 and 2010-11 will remain largely unchanged from last year’s Budget. Expenditure on the Sydney Desalination Plant will be higher than anticipated in 2008-09 and 2009-10, due to a revision in the timing of the project. Increased expenditure in these two years, however, will be offset by a reduction in the expected cost of growth and recycling works over this period. This reflects revised urban growth forecasts, as well as an expected reduction in the cost of the Replacement Flows project, resulting from tendered costs being lower than pre-tender estimates.
7 - 10 Budget Statement 2008-09

FINANCING OF CAPITAL EXPENDITURE Consistent with best practice financial principles, commercial PTEs such as electricity, water and ports are financed by a prudent mix of debt and equity. An appropriate level of gearing for the commercial PTE sector encourages the boards of these businesses to make efficient investment decisions. Also, the requirement to finance capital investments through a prudent level of borrowings provides an important discipline on commercial PTEs by requiring businesses to make regular interest payments.
Non-commercial PTEs are not subject to commercial capital structures. As a result, non-commercial PTEs tend to carry less debt, as capital grants from the State budget are the primary source of finance for their capital expenditure.
As detailed in Chapter 6, PTE sector net debt is forecast to increase by $18.3 billion over the Budget and forward estimates from $18.6 billion in June 2008 to $37 billion in June 2012. Commercial PTE net debt is expected to account for $15.6 billion of the increase over this period, rising from $17.9 billion in June 2008 to an expected $33.5 billion in June 2012. This mainly reflects a significant increase in borrowings by the electricity network businesses (of $8.1 billion), as well as an increase in borrowing by the water sector (of $2.7 billion) to fund more than $22 billion in capital expenditure in these sectors.
Consistent with this increase in net debt, gearing levels for the commercial PTEs are projected to increase from 41.1 per cent in June 2008 to 54.4 per cent in June 2012.9 Although this increase is significant, it remains well within commercially prudent levels. In setting prices for electricity network and water businesses, regulators allow for a commercial rate of return on efficient capital expenditures. This means that the revenues of these businesses, which account for over 86 per cent of capital expenditure by commercial PTEs over the forward estimates period, are expected to support the sector’s increased debt levels and yield a return on the Government’s equity investments.
9 Gearing is defined as the ratio of net debt to net debt plus equity (total capitalisation).
Budget Statement 2008-09 7 - 11
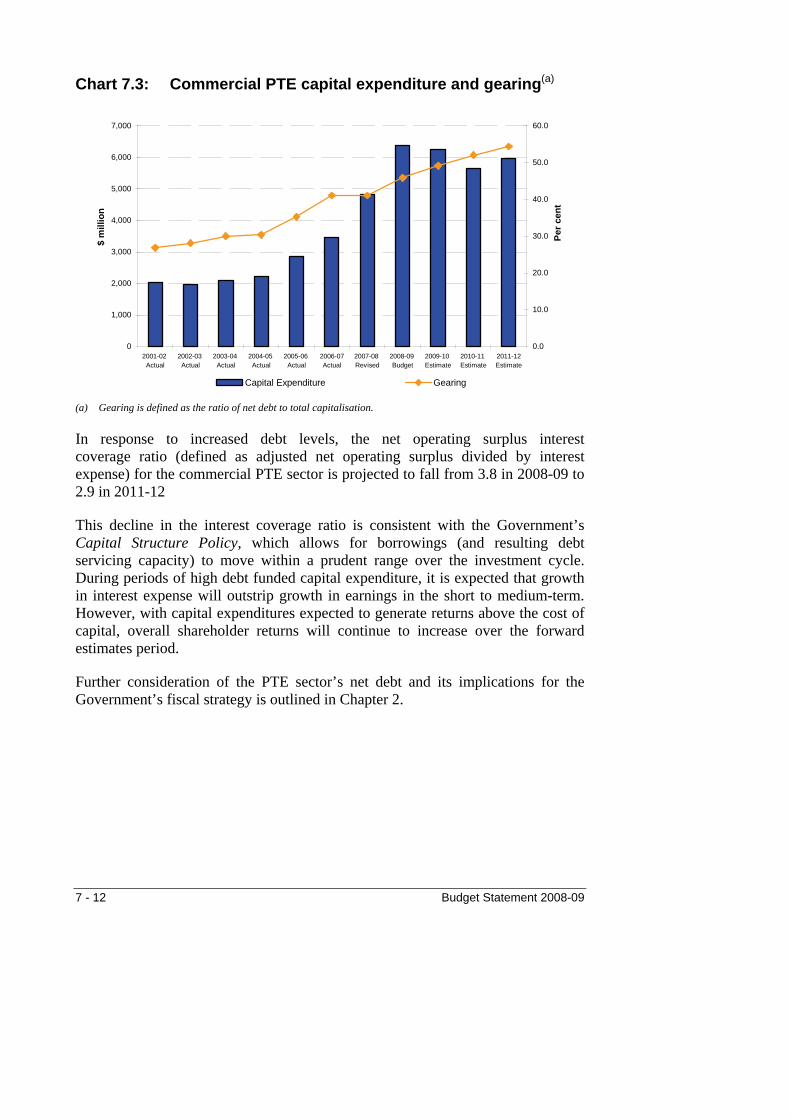
Commercial PTE capital expenditure and gearing(a) Chart 7.3:
0
1,000
2,000
3,000
4,000
5,000
6,000
7,000
2001-02 Actual
2002-03 Actual
2003-04 Actual
2004-05 Actual
2005-06 Actual
2006-07Actual
2007-08 Revised
2008-09 Budget
2009-10 Estimate
2010-11 Estimate
2011-12Estimate
$ m
illio
n
0.0
10.0
20.0
30.0
40.0
50.0
60.0
Per c
ent
Capital Expenditure Gearing
(a) Gearing is defined as the ratio of net debt to total capitalisation.
In response to increased debt levels, the net operating surplus interest coverage ratio (defined as adjusted net operating surplus divided by interest expense) for the commercial PTE sector is projected to fall from 3.8 in 2008-09 to 2.9 in 2011-12
This decline in the interest coverage ratio is consistent with the Government’s Capital Structure Policy, which allows for borrowings (and resulting debt servicing capacity) to move within a prudent range over the investment cycle. During periods of high debt funded capital expenditure, it is expected that growth in interest expense will outstrip growth in earnings in the short to medium-term. However, with capital expenditures expected to generate returns above the cost of capital, overall shareholder returns will continue to increase over the forward estimates period.
Further consideration of the PTE sector’s net debt and its implications for the Government’s fiscal strategy is outlined in Chapter 2.
7 - 12 Budget Statement 2008-09
7.5 MAJOR SECTORS
This section presents a broad overview of the key PTE sectors, including an outline of strategic directions and expected capital expenditure programs for each sector over the Budget and forward years.
ELECTRICITY The State owns the major NSW electricity utilities, including:
three generators – Delta Electricity, Eraring Energy and Macquarie Generation
♦
♦
♦
the high voltage transmission business – TransGrid and
three distribution and retail businesses – Country Energy, Integral Energy and EnergyAustralia.
In total, State owned generators have approximately 12,000 megawatts of installed capacity, generating around 68,000 gigawatt hours per year. NSW distributors have approximately 3.1 million network customers. The State also owns a 58 per cent share in the hydro electricity generator, Snowy Hydro Limited, which has a capacity of 3,700 megawatts and generates around 4,000 gigawatt hours per year.
Strategies and objectives Demand for electricity in New South Wales continues to grow, driven by population growth, which results in more households being connected to the network. This growth in electricity consumption, however, is occurring at a declining rate. Over the next decade, growth is projected to average 1.8 per cent per annum, compared with 2.5 per cent per annum over the last decade. This is largely due to the impact of energy efficiency improvements and the public’s growing awareness of environmental impacts.
The Inquiry into Electricity Supply in New South Wales (the Owen Inquiry) found that despite expected lower rates of growth in future electricity demand, New South Wales needs to be in a position where new baseload generation can be operational by 2013-14 in order to avoid potential energy shortfalls.
Budget Statement 2008-09 7 - 13
The Owen Inquiry found that should the NSW Government choose to continue to own most of the State’s electricity industry, the State will almost certainly have to both fund the next tranche of baseload generation and invest further in the State owned electricity corporations. The potential impact on the State could be a requirement for investment of up to $15 billion over the next 10 to 15 years comprising new investment in generation capacity in the vicinity of $7 billion to $8 billion, $2 billion to $3 billion to maintain the viability of Government-owned retail businesses viable and $3 billion to $4 billion to retro-fit some existing power stations with carbon reduction technologies.
The Owen Inquiry recommended that the State divest the retail arms of EnergyAustralia, Integral Energy and Country Energy. The Inquiry also recommended that the State divest the generation businesses of Macquarie Generation, Delta Electricity and Eraring Energy. In the event that the Government did not wish to sell its generation businesses, the report recommended that the State should implement an appropriately structured long-term lease of current generation assets. The State would retain ownership of the assets, with operational and commercial control by the private sector.
The Government’s response to the Owen Inquiry is a decision to:
lease the generation assets to the private sector ♦
♦
♦
transfer the retail operations of Country Energy, EnergyAustralia and Integral Energy to the private sector and
retain ownership of electricity transmission and distribution assets.
The private sector can manage the commercial risks of retail and generation operations and of developing new generating capacity. In leasing/transferring generation and retail operations to the private sector, the Government will quarantine risk to the State’s fiscal position and the Triple A credit rating, realise proceeds not otherwise available and likely to be eroded over time, and reduce the future demand on the State budget.
The Government proposes to invest a significant proportion of the proceeds from the proposed transactions into a Community Infrastructure (Intergenerational) Fund. Income earned from the Fund will substitute for the dividend and tax equivalents currently earned from the retail and generation activities of the State owned electricity corporations. The revenue stream would be maintained under this arrangement, ensuring that there is no budget impact. Dividends and tax equivalents will continue to be received from the network businesses as these will remain in Government ownership and operation.
7 - 14 Budget Statement 2008-09
Phasing out of the Electricity Tariff Equalisation Fund In 2005, the Government announced that the Electricity Tariff Equalisation Fund (ETEF), which enabled retail electricity prices to be regulated without exposing retailers or the Government to unacceptable financial risk, will be gradually phased out. From September 2008, the percentage of regulated retail load supported by the ETEF will decrease from 100 per cent to 80 per cent and in March 2009, the level of support will be further reduced to 60 per cent. The level of ETEF support will reduce to 40 per cent in September 2009 and 20 per cent in March 2010 and will be fully phased out by June 2010.
ETEF is no longer required, as ordinary hedge contracts enable retailers to manage financial risks and protect the profitability of their retail businesses.
Capital expenditure The NSW electricity network businesses (transmission and distribution) are driving high capital expenditure levels in the electricity sector across the forward estimates period.
Capital expenditure in distribution and transmission businesses is forecast to increase from $2.8 billion in 2008-09 to $4.2 billion in 2011-12, totalling $14.4 billion over the four years. This reflects customer growth, with high numbers of new connections, increasing summer peak demand and renewal of the ageing asset base. This capital expenditure is consistent with Priority E2 in the NSW State Plan which sets a target for average electricity reliability for New South Wales of at least 99.98 per cent by 2016.
The capital expenditure programs of TransGrid and the electricity distributors are funded approximately 30 per cent through operating surpluses (net of depreciation) and 70 per cent through debt. This gearing is sustainable because the networks have a regulated revenue stream and the assets typically have long lives.
Significant capital expenditure is also expected in the generation sector, totalling $1.3 billion over the next four years. This expenditure will peak at $690 million in 2008-09, before declining to $124 million in 2011-12.
The peak in generation expenditure in 2008-09 is being driven by the deferred commencement of Eraring Energy’s cooling water attemperating reservoir, Delta Electricity’s Mt Piper power station upgrade and improvements by Macquarie Generation in the performance of Bayswater and Liddell power stations. Other key projects over the forward estimates period include the construction by Delta Electricity of its 667 megawatt Colongra gas fired power station on the Central Coast to increase generating capacity, and generator, transformer and boiler works at Delta’s Vales Point and Wallerawang facilities.
Budget Statement 2008-09 7 - 15
TRANSPORT The transport sector incorporates:
Rail services – Rail Corporation New South Wales (RailCorp), responsible for passenger rail operations (CityRail and CountryLink services), Rail Infrastructure Corporation, which manages the country regional network, and the Transport Infrastructure Development Corporation (TIDC), which is a construction authority managing major rail infrastructure projects
♦
♦
♦
♦
Bus services – State Transit Authority (STA), providing passenger bus services in metropolitan Sydney and bus and ferry services in Newcastle
Ferry services – Sydney Ferries, providing passenger services on Sydney Harbour and the Parramatta River and
Port facilities – three Port Corporations (Sydney, Newcastle and Port Kembla) which manage the State’s major ports, including navigation and on-shore facilities.
The Public Transport Ticketing Corporation (PTTC), responsible for delivering an integrated public transport ticketing system for Sydney, is also within the transport sector.
Strategies and objectives New South Wales has the largest public transport system in Australia. The share of journeys to work undertaken on public transport in Sydney is double that of any other State capital. Reliability of the CityRail network has increased in recent years, reflecting more robust timetables, new rollingstock and track improvements. More bus services operate on priority lanes on more routes which are being re-aligned to better meet commuter needs. These factors, combined with sustained increases in petrol prices, have seen actual and projected increases in public transport patronage of nearly 5 per cent since 2005-06.
Capital expenditure – rail The capital program for rail services is expected to total $9.7 billion over the forward estimates period, increasing from $1.4 billion in 2008-09 to $3.5 billion in 2011-12. This is higher than the rail infrastructure expenditure projected in last year’s Budget, driven primarily by major new projects announced since the 2007-08 Budget.
7 - 16 Budget Statement 2008-09

Highlights over the forward estimates period include:
the planned expansion of the rail network into the north west and south west growth areas of Sydney ($4.1 billion allocated over four years). In March 2008, the Government announced a new generation public transport network for Sydney. Some $170 million will be available in 2008-09 for the first stages of SydneyLink for spending on the North West Metro and the South West Rail Link
♦
♦
♦
♦
♦
further work on the $1.8 billion Rail Clearways Program, to reduce congestion and improve network capacity and reliability. A new station platform at Hornsby is due for completion during 2008-09, with works continuing on the duplication of the Cronulla line, duplication of the Richmond line and the quadruplication of the line between Kingsgrove and Revesby
completion of the contracts for 122 new Outer Suburban carriages. Commuters in the Central Coast and Illawarra are already benefiting from the first stage of 41 carriages. The second stage of 81 carriages will be completed during 2008-09. Over $106 million will be available in 2008-09 to progress ancillary works for the contract for new rollingstock for the suburban network. The first carriages under the $3.6 billion acquisition and maintenance program for 626 new air conditioned carriages are due for delivery in early 2010
completion of the Epping to Chatswood Rail Line, with three new underground stations, to provide services and new connections for commuters and
upgrades to safety and network management systems to improve passenger safety and amenity.
Rail Infrastructure Corporation is undertaking signalling and train control improvements for the country regional network to improve system safety and meet operational needs.
Capital expenditure – bus services The State Transit Authority (STA) of New South Wales is the government owned authority responsible for the operations of buses in Sydney and Newcastle. The Authority has the largest fleet of buses in Australia comprising more than 1,900 buses which service more than 200 million passengers every year. The Authority also operates ferry services in Newcastle.
Budget Statement 2008-09 7 - 17
Over the Budget and forward estimates period, the Authority’s capital program is estimated at $130.8 million, with the majority of this expenditure ($75.4 million) expected to occur in 2008-09. Passenger growth, bus safety and the emerging focus on environmentally friendly public transport are the key drivers of STA’s capital investment strategy.
The forward capital program largely provides for the acquisition of bus servicing equipment, depot redevelopments and upgrades, and the installation of on-board surveillance cameras and driver security screens.
The STA will also acquire new and replacement buses to meet anticipated growth in passenger demand. This includes:
♦ 122 replacement buses for the Sydney and Newcastle networks (at a cost of $60.8 million) and five new buses for a super metro bus system trial (at a cost of $4.6 million) in 2008-09 and
♦ placing orders for a further 150 new articulated buses (at a cost of $111.7 million) for delivery commencing in 2009.
Capital expenditure related to the purchase of bus fleet, however, is not included in the STA’s capital program. Acquisition costs associated with STA’s bus fleet are funded through bus contracts with the Ministry of Transport.
Capital expenditure – ports Port reforms are focused around the implementation of the Ports Growth Plan. The Plan includes Sydney Ports Corporation expanding Port Botany to meet the rapid growth of container movements. Contracts were awarded in December 2007 and construction of five new berths has commenced. In 2008-09, over $287 million will be spent on the expansion.
The major redevelopment program to transform Port Kembla into Australia’s leading car import centre is nearing completion. The new cargo facility and third berth will enable Port Kembla to handle nearly 240,000 vehicles a year, along with increased containers and general cargo. Car imports have already commenced at the port and the complete transfer from Port Jackson will occur in September/October 2008. This will provide a significant economic boost to the region.
The Plan also includes nominating Newcastle as the site of a future major container terminal once Port Botany reaches its capacity. A smaller multi-purpose terminal at Mayfield will be completed in late 2008, to accommodate increased demand for general cargo.
7 - 18 Budget Statement 2008-09
Newcastle remains the largest coal port in the world with the privately operated loader having a capacity in excess of 100 million tonnes per annum. Ongoing development at the existing private terminals and the construction of a newly approved private terminal will significantly expand coal loading facilities. This planned expansion will not require any major changes to the existing infrastructure (including channels) maintained by the Newcastle Port Corporation. Further, the augmentation of supporting rail infrastructure will be undertaken by the Australian Rail Track Corporation (ARTC), the lessee of the Hunter Valley Rail Network. ARTC is a trading corporation owned and controlled by the Commonwealth Government.
Funding and financing the transport sector The transport sector relies heavily on budget support to finance operating and capital expenditures. Unlike other public trading enterprises, which receive the majority of their income from user charges, fares by rail, bus and ferry commuters are insufficient to meet operating expenses and cannot therefore fund capital expenditure on new infrastructure.
Table 7.2 presents a summary of budget support to transport PTEs. The table also shows the proportion of fare revenue, relative to operating expenditures, recovered from commuters. For rail services in particular, the level of cost recovery is low and has remained stable, notwithstanding increases in the absolute level of fare income.
Budget Statement 2008-09 7 - 19
Table 7.2: Budget Support for the PTE transport sector
2004-05Actual
$m
2005-06Actual
$m
2006-07Actual
$m
2007-08Revised
$m
2008-09 Budget
$m
Rail Services
Operating grants 1,518 1,683 1,692 1,722 1,835
Capital grants (plus asset sales) 530 673 674 437 656
Debt reduction payment ... ... 960 390 …
Sub-total – Rail Services 2,048 2,356 3,326 2,549 2,491
Bus and Ferry Services
Operating grants 282 290 337 344 360
Capital grants 5 ... ... ... …
Private Operators/Community Groups 455 521 572 596 645
Sub-total – Bus and Ferry Services 742 811 909 940 1,005
Total Net Budget Funding: Transport (a) 2,790 3,167 4,235 3,489 3,496
Fare revenue/operating costs%(b)
Rail services 24.4 23.4 24.7 23.9 n.a.(c)
Bus services 49.9 51.3 54.0 53.9 n.a.(c)
Ferry services 58.3 52.9 51.0 43.3 n.a.(c)
(a) The Budget also supports borrowings by transport agencies to fund capital works. Operating grants also include fare concessions for pensioners and students. From 2007-08, grants for acquisition of new buses by the STA are reflected through the Ministry of Transport capital program.
(b) Independent Pricing and Regulatory Tribunal, Fare Revenue Reports. See www.ipart.nsw.gov.au and advice from Rail Corporation.
(c) Dependent on future price determinations by IPART.
WATER The State owns four commercial water businesses:
Sydney Water Corporation – providing water, sewerage and some stormwater drainage services in Sydney, the Illawarra and the Blue Mountains
♦
♦
♦
♦
Sydney Catchment Authority – responsible for Sydney’s drinking water catchment and its infrastructure and bulk water supply to Sydney Water and some councils in the Sydney catchment area
Hunter Water Corporation – a vertically integrated bulk and retail water and wastewater business in the Hunter region and
State Water Corporation – a bulk water business in rural New South Wales whose main customers are irrigators and country towns.
7 - 20 Budget Statement 2008-09
Country Energy’s main business is energy distribution and retailing but it also provides water and wastewater services in Broken Hill. Urban water and wastewater services in the rest of regional New South Wales (including the Central Coast) are the responsibility of local councils.
Strategies and objectives State Plan Priority E1 commits the NSW Government to strategically and effectively manage the limited and vital water resources of New South Wales to ensure a secure and sustainable water supply for all users.
The capital programs of the State’s water businesses support this priority by focusing on measures to:
meet reliability performance standards for water continuity and quality ♦
♦
♦
increase water recycling and
improve the efficiency of water use.
NSW water businesses face the challenges of managing the needs of a growing population, ageing infrastructure and securing the water supply in the face of future drought.
The overriding objective of the water sector is to balance supply and demand for water by increasing recycling, reducing demand and increasing supply. The Metropolitan Water Plan 2006, together with the 2007 Progress Report, shows that, through a mixture of these measures, there is sufficient water to meet Sydney’s needs to 2015 and Sydney Water is well placed to deal with growth after 2015.
Securing water supplies The most significant project being undertaken by Sydney Water to secure water supplies is the Sydney Desalination Plant, which will provide up to 250 million litres a day from early 2010. The project will cost approximately $1.9 billion and, as a non-rainfall dependent source of water, will significantly improve Sydney’s water security.
Sydney Water is also expanding Australia’s largest residential recycling scheme at Rouse Hill and is building similar systems of dedicated recycled water pipes to supply Ropes Crossing and Hoxton Park. A further 8,500 new homes in other new suburbs in Sydney’s north west and south west will be supplied with recycled water through separate, dedicated recycled water pipes by 2012.
Budget Statement 2008-09 7 - 21
In addition, Sydney Water is building a $250 million advanced water treatment plant and pipes to supply a further 18 billion litres a year of recycled water to substitute for current releases from Warragamba Dam. This is part of the Western Sydney Recycled Water Initiative. The Liverpool to Ashfield pipeline, which will be the backbone of the Sydney Recycled Water Grid, is expected to be commissioned in 2010. The Grid is forecast to supply 30 billion litres of recycled water per year by 2030.
To secure water supplies for the Lower Hunter and Central Coast over the next 60 years, Hunter Water is building the $379 million, 450 billion litre Tillegra Dam. Hunter Water expects the first water from Tillegra Dam will be available in around 2013. It will provide much needed drought security for the Lower Hunter community and cater for the predicted 160,000 additional people who are expected to join over half a million people currently living in the region over the next 25 years.
The Government will continue to maintain dam integrity and security of rural water supply, including major upgrades at Keepit and Blowering Dams. Later years will see major upgrades to Copeton, Burrendong and Wyangala Dams.
Increasing competition The Sydney and Hunter regions are being opened to water and wastewater competition. The Water Industry Competition Act 2006 is Australia’s first legislation expressly designed to facilitate and encourage competitive entry by the private sector into the water industry, allowing third parties to access water and wastewater infrastructure. Increased competition is expected to encourage new investment and innovation in the metropolitan water industry, while continuing to protect public health, the environment and consumers. Access arrangements will be regulated by IPART.
Capital expenditure and funding of the capital program Capital expenditure for the water sector is expected to total $6.5 billion over the forward estimates period. Expenditure is expected to rise by 26.6 per cent in 2008-09 to $2.2 billion from $1.7 billion in 2007-08. After peaking in 2008-09, expenditure is expected to decrease to $1.2 billion in 2011-12.
Sydney Water’s capital program of $5 billion accounts for 77 per cent of the total capital program of the water sector. Capital spending will peak at $1.9 billion in 2008-09 before declining to $884 million in 2011-12. The peak in 2008-09 is driven primarily by expenditure on the Sydney Desalination Plant and recycling schemes in that year.
7 - 22 Budget Statement 2008-09
Hunter Water’s capital program over the forward estimates period totals $948 million or 14.5 per cent of total capital expenditure in the sector. This expenditure is primarily attributed to the construction of Tillegra Dam at a cost of $379 million, projects to improve the water supply in the Hunter of $425 million and wastewater treatment and transport upgrades at a cost of over $380 million.
Capital expenditure by the Sydney Catchment Authority over the forward estimate years totals $293 million. This is a decrease compared to last year’s Budget due to an amending of the scope of the borefield development program.
State Water’s capital program over the forward estimates period totals $255 million. Expenditure to upgrade State Water’s dams accounts for over 75 per cent of the total program over the forward years.
A significant proportion of the capital program in the water sector will be financed from borrowings, while 33 per cent of the program will be financed from operating surpluses. Gearing for the water sector will increase from 36.1 per cent in June 2008 to a sustainable level of 48.2 per cent in June 2012.
Regulatory outcomes are expected to ensure the businesses receive a commercial rate of return on capital investments. This expectation has been supported by the recent draft determination on Sydney Water prices by IPART.
SOCIAL HOUSING The Department of Housing manages the State’s social housing portfolio and develops broader housing strategies. It provides tenancy and property management for around 125,000 public housing dwellings. Total recurrent expenditure for the Department in 2008-09 is estimated at $1.32 billion, with a further $553.9 million for capital works. The Department will receive a grant of $543.1 million from the 2008-09 Budget.
The Department of Housing sets market rents for its properties. However, around 89 per cent of current tenants cannot afford market rents and are eligible for a subsidy. These tenants pay a subsidised rent based on a percentage of the total income of the household. The value of the Department’s rental subsidies in 2008-09 is estimated at $738.1 million.
Strategies and objectives The Department of Housing is helping build stronger communities through providing housing solutions for those most in need. This covers the spectrum of housing needs, including homeless people, people with mental illness, and people with a disability that have complex needs.
Budget Statement 2008-09 7 - 23
The Department continues to implement the Reshaping Public Housing reforms announced in 2005. The reforms are designed to ensure a fair, more efficient and effective public housing system capable of meeting current and future demands. Changes implemented include revisions to the eligibility and length of tenure for public housing to better reflect tenant circumstances.
The Department of Housing is responsible for implementing Planning for the Future - New Directions for Community Housing in NSW 2007-2012, launched in November 2007. This strategy sets a new vision for an expanded community housing sector in New South Wales that offers responsive housing services to more people in need and takes advantage of new opportunities to deliver more affordable housing. Growth is central to this vision and the plan proposes to increase the supply of community housing from 13,000 to 30,000 dwellings over 10 years.
The Department also administers the Care Call Program to contact frail and aged tenants living in public housing and connect them to necessary services.
Capital expenditure The Department of Housing’s total capital expenditure in the four years to 2011-12 is forecast at $2.2 billion.10 This expenditure will be largely driven by the Department’s commitment to upgrade and reconfigure social housing stock to ensure it meets future demand.
Specific key drivers of the capital program in 2008-09 and the forward years include:
♦
♦
♦
the NSW Planning for the Future: New Directions for Community Housing in NSW 2007-2012 which aims to expand the community housing sector in New South Wales by increasing the of community housing from 13,000 to 30,000 dwellings over 10 years
the Social Housing for Older People strategy which includes a significant investment in the 2008-09 capital budget for new homes for the elderly
the provision of 228 new homes in the Sydney’s inner west under the Inner West Redevelopment Strategy
10 This section focuses on the capital program of the Department of Housing. Total capital expenditure
reported for the housing sector in Table 7.1 also includes expenditure provided by City West Housing Pty Ltd and the Teacher Housing Authority.
7 - 24 Budget Statement 2008-09
continued implementation of major strategic redevelopments currently underway including the West Dubbo Transformation, the Living Communities Program at Bonnyrigg and Minto and the Building Stronger Communities 2007-2010 Program
♦
♦
♦
♦
continued implementation of long-term asset planning to realign the Department’s asset portfolio to better meet the needs of clients. (This overarching strategy to realign dwelling encompasses some of the above listed strategies)
implementation of the Commonwealth Government’s A Place to Call Home strategy through the provision of additional homes for homeless families and individuals and
reducing backlog maintenance over the next 8-9 years.
Budget Statement 2008-09 7 - 25

CHAPTER 8: COMMONWEALTH-STATE FINANCIAL ARRANGEMENTS
♦ Commonwealth-State financial relations are being modernised following the election of a new Commonwealth Government in November 2007.
♦ The tax review announced by the Commonwealth presents an opportunity to reconfigure the interaction between the Commonwealth and state tax systems.
♦ States will have greater funding certainty and greater flexibility in the use of Commonwealth funds.
♦ The States and the Commonwealth are developing wide-ranging reforms to improve productivity and the efficiency of markets.
♦ Commonwealth grants will account for 42.3 per cent of total NSW revenue in 2008-09. GST revenue grants are the largest single source of total revenue, accounting for 27.2 per cent in 2008-09.
♦ Economic activity in New South Wales is estimated to generate $15 billion in GST revenue in 2008-09, compared to the $13 billion in GST revenue grants received. This is a cross subsidy from New South Wales to the other jurisdictions of $2 billion, or $291 per capita.
8.1 INTRODUCTION
Financial grants from the Commonwealth Government are an important source of revenue to the States and Territories (the States). Commonwealth grants are expected to account for 42.3 per cent of total NSW revenue in 2008-09.
The major factor behind the need for these grants is vertical fiscal imbalance (VFI), or the mismatch between the revenue-raising capacities and spending responsibilities of the States and the Commonwealth. In Australia, the States have limited revenue-raising capacity but large spending responsibilities and the Commonwealth collects much more revenue than it needs for its own purposes.
Another feature of Australia’s intergovernmental financial arrangements is the extent to which horizontal fiscal equalisation (HFE) is used to distribute Commonwealth grants to the States. HFE attempts to ensure that all States have the fiscal capacity to supply services of an average standard to their citizens, provided they make average efforts to raise their own revenue and operate at average levels of efficiency.
Budget Statement 2008-09 8 - 1

VFI and HFE inevitably produce conflict between levels of government and confuse community perceptions of governmental accountability.
Commonwealth-State financial relations are being modernised following the election of a new Commonwealth Government in November 2007.
The focus of the new arrangements is to:
rationalise the number of specific purpose payments without reducing funding to each State
♦
♦
♦
♦
♦
improve the States’ flexibility in the use of Commonwealth funds
clarify the roles and responsibilities of the Commonwealth and States
move to an outcomes-based accountability framework and
promote wide-ranging reforms, that can be supported by new National Partnership payments, to improve productivity and the efficiency of markets.
The Prime Minister announced on 21 April 2008 that the Commonwealth would consider ‘root-and-branch’ reform of the Australian taxation system. He indicated the review would be a top-down approach encompassing Commonwealth and State taxes. A review of this nature could address the persistent problems of the states’ revenue base including vertical fiscal imbalance and the States’ narrow tax bases.
New South Wales welcomes a broad inquiry into the interaction between Commonwealth and state tax systems. New South Wales will participate in any substantial review of the total Australian tax system.
8.2 NEW COAG REFORM AGENDA
The Council of Australian Governments (COAG) met on 20 December 2007 and 26 March 2008 to agree on an ambitious, new national reform program which includes the competition, regulation and human capital reforms previously agreed under the National Reform Agenda (NRA). COAG also agreed to fundamental changes to Commonwealth-State financial arrangements to ensure more efficient delivery of core government services, improve public accountability and sharpen the financial incentives for reform.
The new COAG reform agenda seeks to enhance Australia’s productivity, workforce participation and geographical mobility, and to support wider objectives of more efficient service delivery.
8 - 2 Budget Statement 2008-09
The COAG reform agenda is underpinned by a common commitment to clear reform objectives and outcomes. It seeks to provide greater clarity around roles and responsibilities of governments, and to strengthen governance and funding arrangements. Commonwealth-State Working Groups, chaired by the relevant Commonwealth Minister, have been established to deliver reforms in seven national priority reform areas.
New South Wales is highly supportive of COAG’s reform agenda.
At its meeting in March 2008, COAG agreed to focus on developing a broader micro-economic reform agenda. This will include further work to progress the reforms previously agreed under the National Reform Agenda (NRA). These covered energy, transport, infrastructure, government regulation and human capital.
COAG also agreed to a new expanded role for the COAG Reform Council (CRC). In particular, when requested by COAG, the CRC will report to the Prime Minister on:
the publication of nationally comparable performance information for all jurisdictions in relation to individual national SPPs
♦
♦
♦
♦
♦
♦
♦
the independent assessment of predetermined milestones and performance benchmarks under the proposed National Partnership (NP) incentive payments and
monitoring of the aggregate pace of activity in progressing COAG’s agreed reform agenda.
The CRC’s new responsibilities will enhance accountability for outcomes under the COAG reform agenda and promote change as part of the Commonwealth-state financial arrangements.
COAG WORKING GROUPS The Agenda includes seven national priority reform areas:
health and ageing
productivity agenda – education, skills, training and early childhood
climate change and water
infrastructure
Budget Statement 2008-09 8 - 3

business regulation and competition ♦
♦
♦
housing and
indigenous reform.
The Health and Ageing Working Group mandate extends across the full range of preventative, primary, acute and aged care in both the public and private sectors.
The Productivity Agenda Working Group aims to deliver significant improvements in human capital outcomes for all Australians through reforms in the areas of education, skills, training and early childhood development.
The Climate Change and Water Working Group is focussed on ensuring sustainable water use across Australia and an effective national climate change policy response. This will encompass: a single national Emissions Trading Scheme (ETS) incorporating State schemes; a nationally-consistent set of measures to support the ETS; and a national cooperative approach to a long-term climate change policy response.
The Infrastructure Working Group will focus on better coordination of infrastructure planning and investment across the nation, and identifying and removing blockages to productive investment in infrastructure.
The Business Regulation and Competition Working Group is accelerating and broadening the regulation reduction agenda. This includes delivery of the previously agreed COAG regulatory hot spots agenda, and delivering on the existing competition work stream, for example previously agreed transport pricing reforms.
The Housing Working Group is focussed on improving housing affordability for home buyers and easing rental stress, particularly for low to moderate income households.
The Indigenous Reform Working Group is aimed at closing the gap on indigenous disadvantage in a partnership between all levels of government and with Indigenous communities.
8 - 4 Budget Statement 2008-09
FUNDING THE COAG REFORM AGENDA Significant Commonwealth funding will be required to undertake the COAG reforms. The nature of reforms under the COAG Agenda involves significant up-front expenditure, although the full benefits may take many years to be realised. New South Wales, like the other States and Territories, has limited fiscal capacity to meet the costs of the proposed reforms.
Funding the Commonwealth’s Election Commitments
To date, the COAG Working Groups have primarily focussed on developing detailed implementation plans for the major Commonwealth election commitments, such as the Digital Education Revolution and the National Rental Affordability Scheme. At its March 2008 meeting, COAG:
. . . acknowledged that the Commonwealth should be responsible for its election commitments . . . Commonwealth election commitments have legitimate and additional financial implications for the States and Territories. Consideration of these costs will be included as an addition to the work of Treasurers in the final determination of the new generation SPPs at year’s end.1
This acknowledgment recognises that the Commonwealth election commitments and the policy objectives and programs underpinning them reflect the Commonwealth’s priorities and preferences for service delivery. Whilst some of these election commitments relate to NSW broad policy objectives, they do not necessarily reflect the core commitments and priorities of the NSW State Plan.
The NSW Budget therefore has been prepared on the basis that the Commonwealth fully pays for all “legitimate and additional” State costs in implementing the Commonwealth Government’s election commitments.
1 COAG Meeting, Melbourne, 26 March 2008, Communique, page 4.
Budget Statement 2008-09 8 - 5
8.3 SPECIFIC PURPOSE PAYMENTS REFORM
Specific purpose grants are payments from the Commonwealth to the states contingent on the states’ compliance with certain conditions. Unlike general purpose grants, specific purpose grants cannot be spent as the state chooses, but must be spent on the purposes for which the grants were provided.
As currently provided, SPPs often include ‘input controls’ stipulating a certain level or rate of annual increase of funding to be provided by the State. Non-financial conditions also can be applied. Such input controls can restrict States’ budgetary flexibility and discourage innovation.
The focus of SPP reforms is to replace the current input controls with outcomes-based public accountability.
The objectives of the revised funding arrangements are:
♦ increased flexibility for resources to be allocated to areas where they will produce the best overall outcomes for the community
♦ genuinely collaborative working arrangements, including clearly defined roles and responsibilities and fair and sustainable financial arrangements to facilitate a long-term policy focus and reduce blame shifting
♦ increased incentives for wide-ranging reforms in areas of joint responsibility
♦ increased accountability to the community and
♦ reduced administration and compliance overheads.
Consistent with these objectives, the key elements of the reforms to SPPs are:
♦ rationalising the number of SPPs from around 90 to five or six
♦ moving away from restrictive input controls to greater emphasis on achieving specified outcomes
♦ determining base level funding and negotiating appropriate growth factors and
♦ introducing National Partnership agreements for the delivery of specific outcomes or outputs and to provide incentives or rewards for undertaking reforms.
8 - 6 Budget Statement 2008-09
Rationalising the number of SPPs Many of the existing SPPs will be combined into a small number of new national SPP agreements. These will cover broad issues such as health, early childhood, schooling, vocational education and training, housing and disability. Other current SPPs will be cashed out, terminated, or transferred to Commonwealth own purpose expenses.
Reducing the number of SPPs into a small number of broader delivery areas will allow better linkages between similar areas and will provide greater flexibility in funding arrangements.
Emphasis on outcomes Each new SPP will have a mutually agreed statement of objectives and outcomes. These statements will take into account the funding provided by both levels of government in the relevant shared funding sector.
Each new national SPP will contain simpler, standardised and more transparent publicly-available performance measures and reporting, with a focus on achieving outcomes and value for money.
Funding Commonwealth and State Treasurers will negotiate base funding levels and growth factors for SPPs through the Ministerial Council for Commonwealth-State Financial Relations.
The Commonwealth has guaranteed that rationalisation of the number of SPPs will occur “without a reduction in total Commonwealth funding for these activities”.2
In establishing the revised SPP arrangements, it will be important to ensure that base level funding and growth factors adequately reflect the true cost of providing goods and services. This will contrast with the current situation where actual costs can exceed SPP funding allocations, leaving States to make up the difference. Such a situation has occurred in the area of public hospitals. Over the period from 1995-96 to 2005-06, the Commonwealth share of total funding to public hospitals nationally has fallen from 45.2 per cent to 41.4 per cent.3
2 COAG Meeting, Melbourne, 26 March 2008, Communique, page 3.
3 Australian Institute of Health and Welfare, Health Expenditure Australia 2005-06, Health and Welfare Expenditure Series Number 30, October 2007, p. 55.
Budget Statement 2008-09 8 - 7

Under the new arrangements, SPPs will be ongoing, rather than set for a limited period of time, with funding arrangements to be reviewed every four to five years.
Commonwealth and State Treasurers will have an ongoing role in monitoring outcomes to identify issues that might trigger an earlier consideration of funding adequacy and related outcomes.
National Partnership Agreements A separate category of National Partnership (NP) Agreements will be created. Under these agreements, payments from the Commonwealth will be available for a limited period of time to support the delivery of specified outputs or projects, facilitate the implementation of national reforms, or reward the delivery of national reforms. Some pre-existing SPPs will be converted to NPs, if they meet these conditions. For example, given its focus on specific outputs, the current Auslink SPP will be converted to a NP.
Performance benchmarks for reform-based NPs will be independently assessed by the COAG Reform Council, with funding dependent upon achieving benchmarks.
Proposed timelines Revised Commonwealth-State funding arrangements are due to commence from 1 January 2009. SPPs that expire before that date will be rolled over until the new arrangements commence.
Preliminary statements of objectives and outcomes for new national SPP agreements and performance indicators are expected to be presented to the 3 July 2008 COAG meeting. At that meeting, Treasurers will also present their proposal for a new performance reporting framework.
At the 2 October 2008 COAG meeting, Treasurers are due to present their funding framework proposal and principles for the COAG Intergovernmental Agreement. Working Groups will present statements of objectives and outcomes for each new SPP and broader reform proposals which could be supported by National Partnerships incentive payments will also be considered.
It is expected that the new Intergovernmental Agreement on Commonwealth-State financial arrangements will be signed at the 18 December 2008 meeting of COAG.
8 - 8 Budget Statement 2008-09
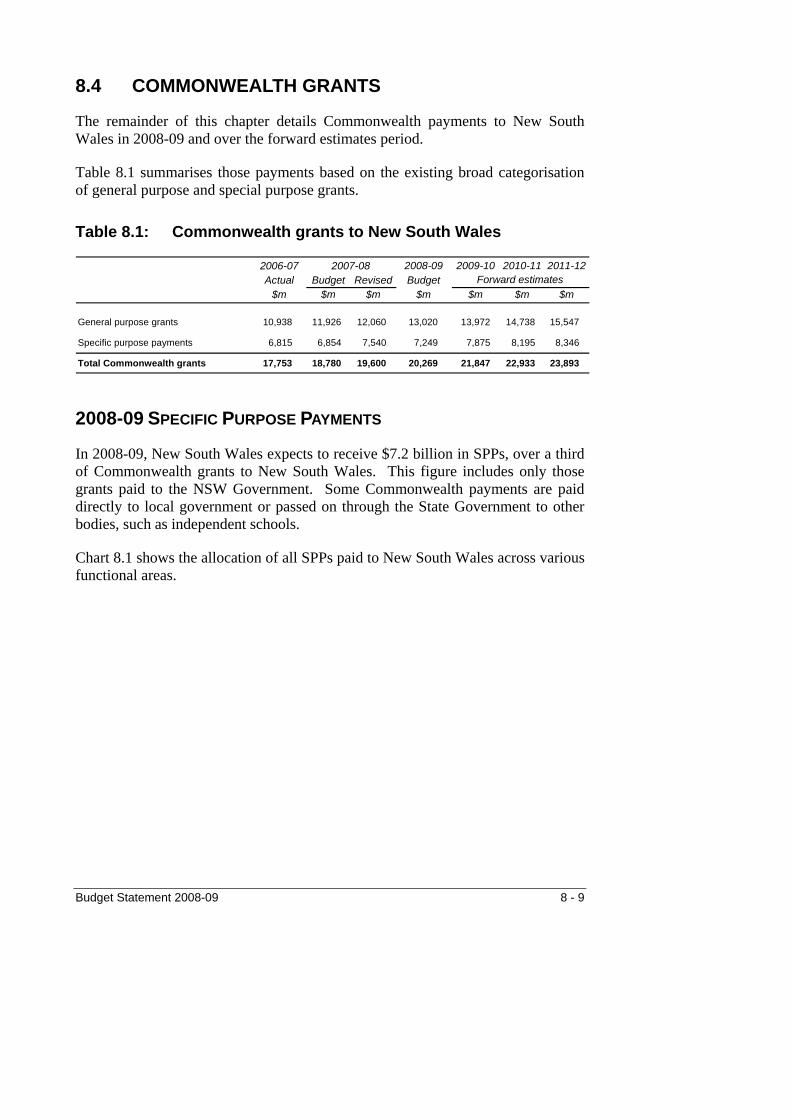
8.4 COMMONWEALTH GRANTS
The remainder of this chapter details Commonwealth payments to New South Wales in 2008-09 and over the forward estimates period.
Table 8.1 summarises those payments based on the existing broad categorisation of general purpose and special purpose grants.
Table 8.1: Commonwealth grants to New South Wales
2006-07 2008-09 2009-10 2010-11 2011-12Actual Budget Revised Budget
$m $m $m $m $m $m $m
General purpose grants 10,938 11,926 12,060 13,020 13,972 14,738 15,547
Specific purpose payments 6,815 6,854 7,540 7,249 7,875 8,195 8,346
Total Commonwealth grants 17,753 18,780 19,600 20,269 21,847 22,933 23,893
Forward estimates2007-08
2008-09 SPECIFIC PURPOSE PAYMENTS
In 2008-09, New South Wales expects to receive $7.2 billion in SPPs, over a third of Commonwealth grants to New South Wales. This figure includes only those grants paid to the NSW Government. Some Commonwealth payments are paid directly to local government or passed on through the State Government to other bodies, such as independent schools.
Chart 8.1 shows the allocation of all SPPs paid to New South Wales across various functional areas.
Budget Statement 2008-09 8 - 9
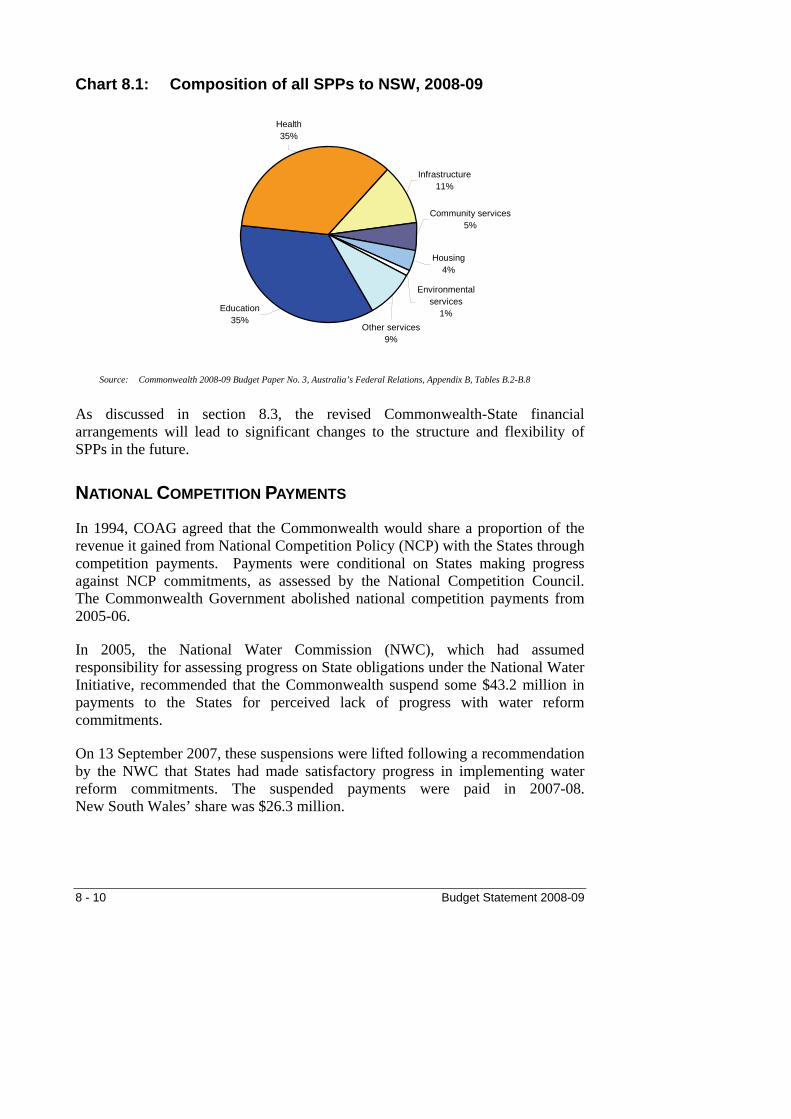
Chart 8.1: Composition of all SPPs to NSW, 2008-09
Environmental services
1%Other services
9%
Housing 4%
Community services 5%
Infrastructure 11%
Health 35%
Education 35%
Source: Commonwealth 2008-09 Budget Paper No. 3, Australia’s Federal Relations, Appendix B, Tables B.2-B.8
As discussed in section 8.3, the revised Commonwealth-State financial arrangements will lead to significant changes to the structure and flexibility of SPPs in the future.
NATIONAL COMPETITION PAYMENTS
In 1994, COAG agreed that the Commonwealth would share a proportion of the revenue it gained from National Competition Policy (NCP) with the States through competition payments. Payments were conditional on States making progress against NCP commitments, as assessed by the National Competition Council. The Commonwealth Government abolished national competition payments from 2005-06.
In 2005, the National Water Commission (NWC), which had assumed responsibility for assessing progress on State obligations under the National Water Initiative, recommended that the Commonwealth suspend some $43.2 million in payments to the States for perceived lack of progress with water reform commitments.
On 13 September 2007, these suspensions were lifted following a recommendation by the NWC that States had made satisfactory progress in implementing water reform commitments. The suspended payments were paid in 2007-08. New South Wales’ share was $26.3 million.
8 - 10 Budget Statement 2008-09
These are the final payments under the National Competition Policy arrangements. However, as noted above, under the new framework for Commonwealth-State financial relations, the Commonwealth envisages National Partnership payments to facilitate or reward State efforts in undertaking reforms of national importance.
GST REVENUE GRANTS GST revenue grants are the largest single source of revenue in New South Wales, accounting for 27.2 per cent in 2008-09. They are provided under the Intergovernmental Agreement on the Reform of Commonwealth-State Financial Relations agreed in June 1999 between the Commonwealth and the States.
GST revenue grants are allocated among the States on the recommendation of the Commonwealth Grants Commission (CGC) according to the principle of HFE. HFE is currently defined by the Commission as:
State governments should receive funding from the pool of Goods and Services Tax revenue and health care grants such that, if each made the same effort to raise revenue from its own sources and operated at the same level of efficiency, each would have the capacity to provide services at the same standard.4
To implement HFE, the Commission assesses “both the economic and social conditions in the States as they affect relative costs States incur in providing services and the relative capacity of States to raise their own revenue.”5
The CGC’s assessments and resulting State relativities are updated annually based on the latest available five years of data. The CGC’s underlying methodology is reviewed every five or six years: the last review reported in February 2004, the next is due to report in February 2010. The distribution of GST revenue has significant implications for States’ abilities to fund services.
4 Commonwealth Grants Commission, Report on State Revenue Sharing Relativities 2008 Update, p. 25.
5 CGC, 2008 Update, p. 2. The CGC’s cost and revenue assessments are combined into a single measure for each State: the relativity. The base for the relativity is one. A relativity above one means a State is assessed as having a below average capacity to raise revenue and/or faces above average costs to provide services, and therefore requires more than average per capita amounts from the GST pool to provide services at an Australian average standard. A relativity below one indicates the opposite.
Budget Statement 2008-09 8 - 11

CGC 2008 Update Estimated GST revenue grants to New South Wales of $13 billion in 2008-09 are $1 billion higher than in 2007-08. This increase predominantly reflects growth in the total GST pool available for distribution (up $2.6 billion), as well as an increase in New South Wales’ relativity, offset by a slight decline in New South Wales’ relative population share.
New South Wales gained $342 million from the change in relativities following the CGC’s 2008 Update (see Table 8.2).
Table 8.2: Effect of 2008 Update relativity changes in 2008-09 NSW VIC QLD WA SA TAS ACT NT
Effect on 2008-09 GST revenue grants, $m 342 317 (409) (327) 6 (16) 8 80
% of each State's GST grants 2.6 3.1 (4.7) (8.3) 0.1 (0.9) 0.9 3.3
Source: CGC, 2008 Update, p. 4.
Chart 8.2 shows the movements in the larger States’ relativities used for distributing the GST pool since 2000-01. Among the larger States, New South Wales’s and Victoria’s relativities have increased since the middle of the decade as the decline in their relative fiscal capacities has become progressively reflected in the five year rolling average data. By contrast, Queensland’s and Western Australia’s relativities have fallen, reflecting the increased fiscal capacity which has accompanied the resources boom. Western Australia returned to being a donor State in 2007-08, while Queensland will become a donor State for the first time in 2008-09.
8 - 12 Budget Statement 2008-09
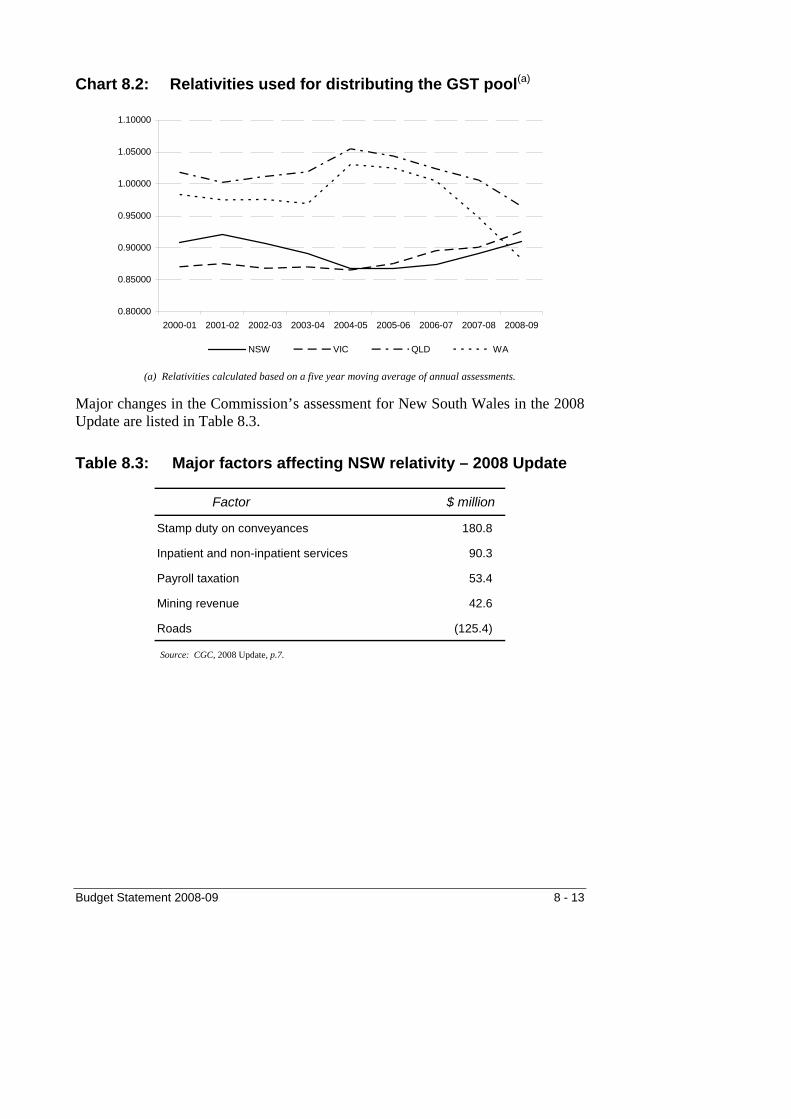
Relativities used for distributing the GST pool(a) Chart 8.2:
0.80000
0.85000
0.90000
0.95000
1.00000
1.05000
1.10000
2000-01 2001-02 2002-03 2003-04 2004-05 2005-06 2006-07 2007-08 2008-09
NSW VIC QLD WA
(a) Relativities calculated based on a five year moving average of annual assessments.
Major changes in the Commission’s assessment for New South Wales in the 2008 Update are listed in Table 8.3.
Table 8.3: Major factors affecting NSW relativity – 2008 Update
Factor $ million
Stamp duty on conveyances 180.8
Inpatient and non-inpatient services 90.3
Payroll taxation 53.4
Mining revenue 42.6
Roads (125.4) Source: CGC, 2008 Update, p.7.
Budget Statement 2008-09 8 - 13
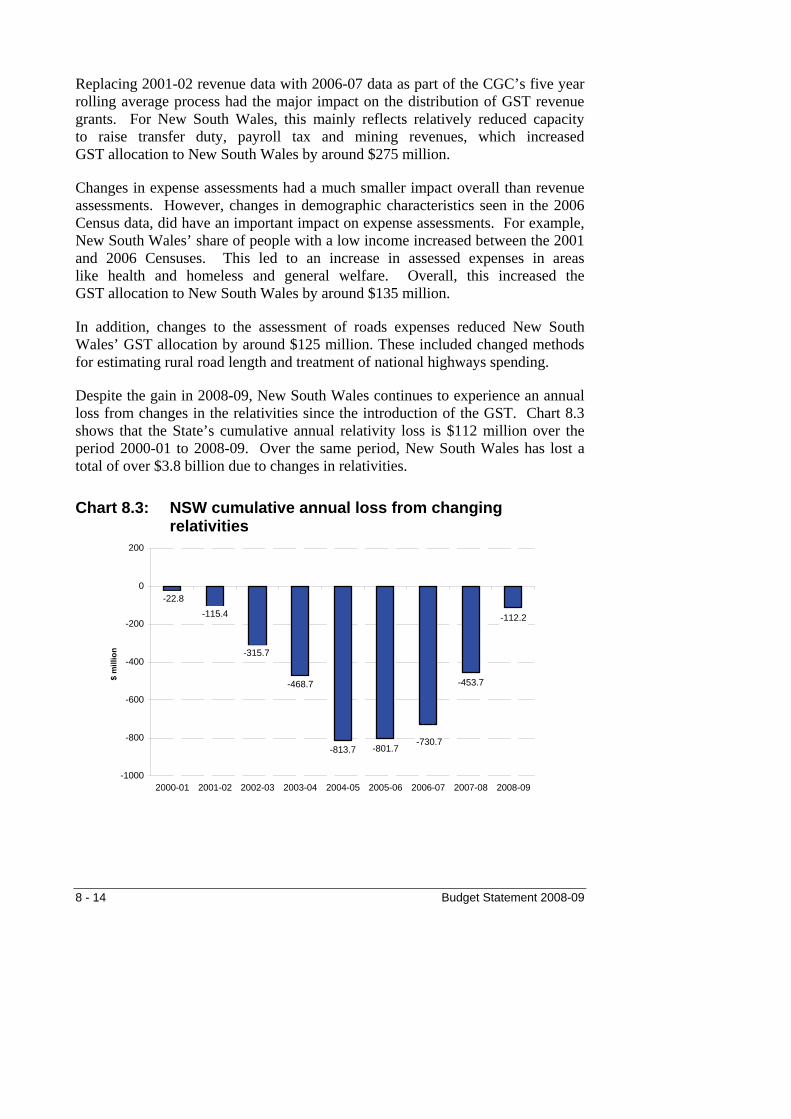
Replacing 2001-02 revenue data with 2006-07 data as part of the CGC’s five year rolling average process had the major impact on the distribution of GST revenue grants. For New South Wales, this mainly reflects relatively reduced capacity to raise transfer duty, payroll tax and mining revenues, which increased GST allocation to New South Wales by around $275 million.
Changes in expense assessments had a much smaller impact overall than revenue assessments. However, changes in demographic characteristics seen in the 2006 Census data, did have an important impact on expense assessments. For example, New South Wales’ share of people with a low income increased between the 2001 and 2006 Censuses. This led to an increase in assessed expenses in areas like health and homeless and general welfare. Overall, this increased the GST allocation to New South Wales by around $135 million.
In addition, changes to the assessment of roads expenses reduced New South Wales’ GST allocation by around $125 million. These included changed methods for estimating rural road length and treatment of national highways spending.
Despite the gain in 2008-09, New South Wales continues to experience an annual loss from changes in the relativities since the introduction of the GST. Chart 8.3 shows that the State’s cumulative annual relativity loss is $112 million over the period 2000-01 to 2008-09. Over the same period, New South Wales has lost a total of over $3.8 billion due to changes in relativities.
Chart 8.3: NSW cumulative annual loss from changing relativities
-453.7
-112.2
-801.7
-22.8
-813.7
-468.7
-115.4
-315.7
-730.7
-1000
-800
-600
-400
-200
0
200
2000-01 2001-02 2002-03 2003-04 2004-05 2005-06 2006-07 2007-08 2008-09
$ m
illio
n
8 - 14 Budget Statement 2008-09
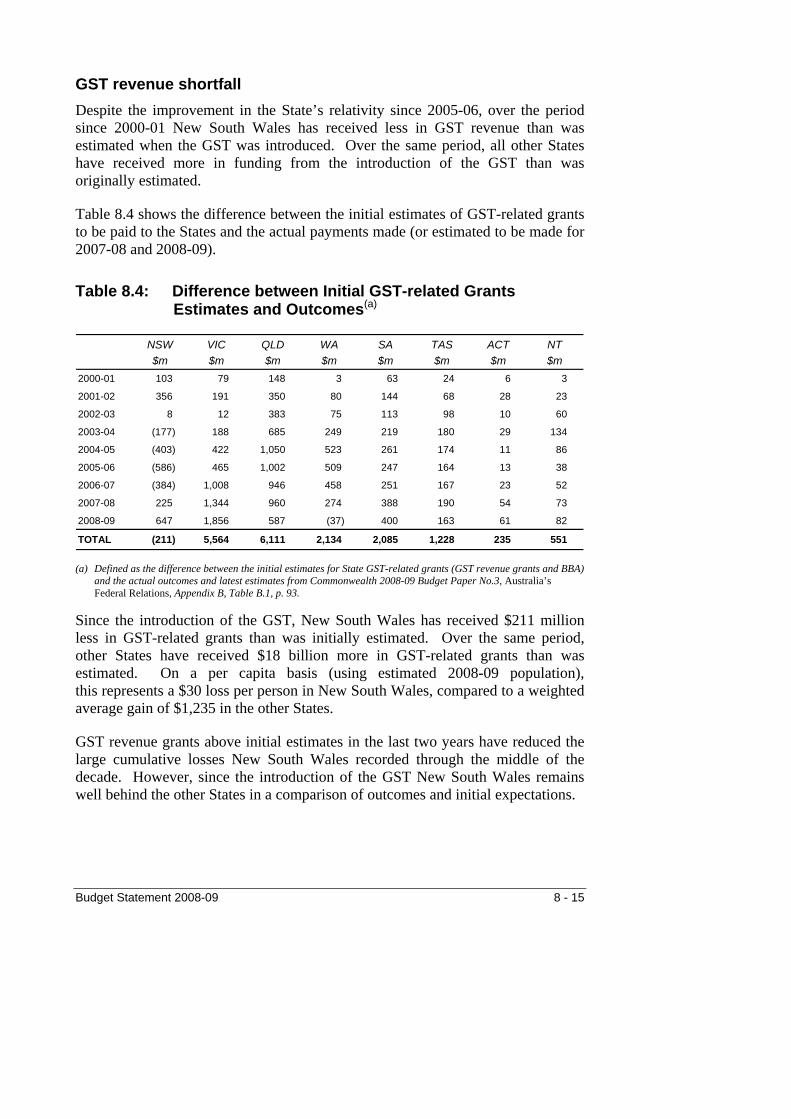
GST revenue shortfall Despite the improvement in the State’s relativity since 2005-06, over the period since 2000-01 New South Wales has received less in GST revenue than was estimated when the GST was introduced. Over the same period, all other States have received more in funding from the introduction of the GST than was originally estimated.
Table 8.4 shows the difference between the initial estimates of GST-related grants to be paid to the States and the actual payments made (or estimated to be made for 2007-08 and 2008-09).
Table 8.4: Difference between Initial GST-related Grants Estimates and Outcomes(a)
NSW VIC QLD WA SA TAS ACT NT$m $m $m $m $m $m $m $m
2000-01 103 79 148 3 63 24 6 3
2001-02 356 191 350 80 144 68 28 23
2002-03 8 12 383 75 113 98 10 60
2003-04 (177) 188 685 249 219 180 29 134
2004-05 (403) 422 1,050 523 261 174 11 86
2005-06 (586) 465 1,002 509 247 164 13 38
2006-07 (384) 1,008 946 458 251 167 23 52
2007-08 225 1,344 960 274 388 190 54 73
2008-09 647 1,856 587 (37) 400 163 61 82
TOTAL (211) 5,564 6,111 2,134 2,085 1,228 235 551
(a) Defined as the difference between the initial estimates for State GST-related grants (GST revenue grants and BBA) and the actual outcomes and latest estimates from Commonwealth 2008-09 Budget Paper No.3, Australia’s Federal Relations, Appendix B, Table B.1, p. 93.
Since the introduction of the GST, New South Wales has received $211 million less in GST-related grants than was initially estimated. Over the same period, other States have received $18 billion more in GST-related grants than was estimated. On a per capita basis (using estimated 2008-09 population), this represents a $30 loss per person in New South Wales, compared to a weighted average gain of $1,235 in the other States.
GST revenue grants above initial estimates in the last two years have reduced the large cumulative losses New South Wales recorded through the middle of the decade. However, since the introduction of the GST New South Wales remains well behind the other States in a comparison of outcomes and initial expectations.
Budget Statement 2008-09 8 - 15
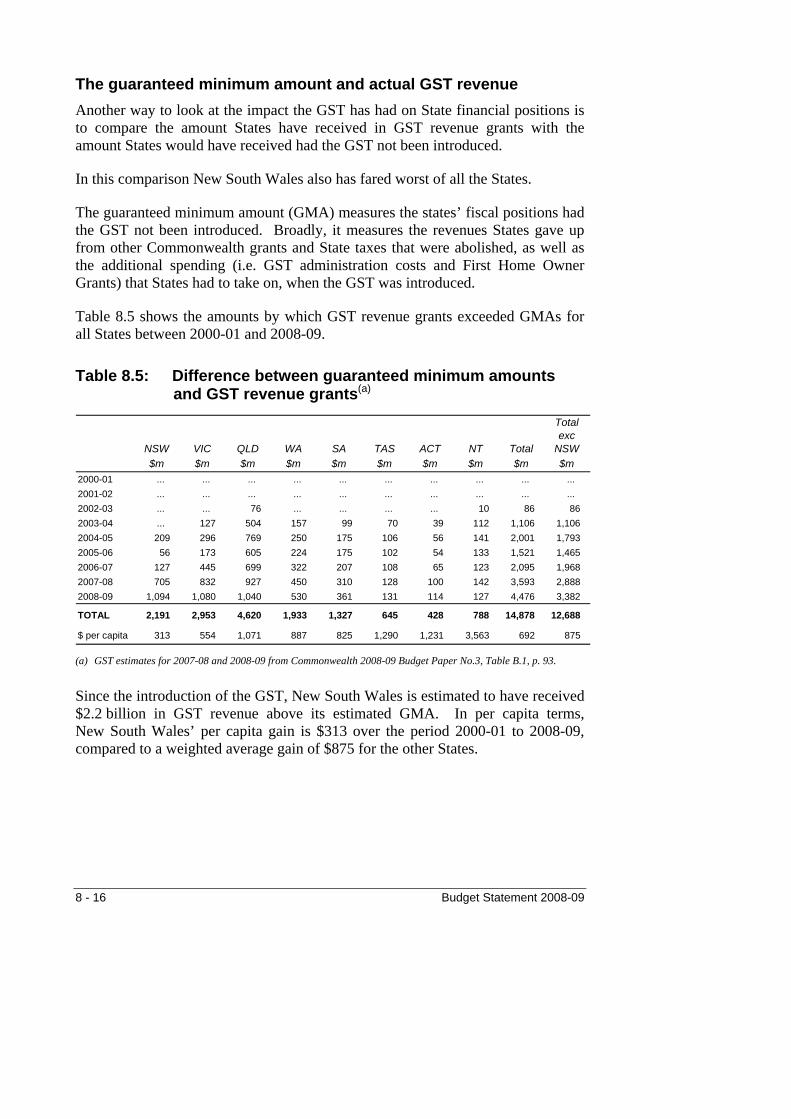
The guaranteed minimum amount and actual GST revenue Another way to look at the impact the GST has had on State financial positions is to compare the amount States have received in GST revenue grants with the amount States would have received had the GST not been introduced.
In this comparison New South Wales also has fared worst of all the States.
The guaranteed minimum amount (GMA) measures the states’ fiscal positions had the GST not been introduced. Broadly, it measures the revenues States gave up from other Commonwealth grants and State taxes that were abolished, as well as the additional spending (i.e. GST administration costs and First Home Owner Grants) that States had to take on, when the GST was introduced.
Table 8.5 shows the amounts by which GST revenue grants exceeded GMAs for all States between 2000-01 and 2008-09.
Table 8.5: Difference between guaranteed minimum amounts and GST revenue grants(a)
NSW VIC QLD WA SA TAS ACT NT Total
Total exc
NSW $m $m $m $m $m $m $m $m $m $m2000-01 ... ... ... ... ... ... ... ... ... ... 2001-02 ... ... ... ... ... ... ... ... ... ... 2002-03 ... ... 76 ... ... ... ... 10 86 86 2003-04 ... 127 504 157 99 70 39 112 1,106 1,106 2004-05 209 296 769 250 175 106 56 141 2,001 1,793 2005-06 56 173 605 224 175 102 54 133 1,521 1,465 2006-07 127 445 699 322 207 108 65 123 2,095 1,968 2007-08 705 832 927 450 310 128 100 142 3,593 2,888 2008-09 1,094 1,080 1,040 530 361 131 114 127 4,476 3,382
TOTAL 2,191 2,953 4,620 1,933 1,327 645 428 788 14,878 12,688
$ per capita 313 554 1,071 887 825 1,290 1,231 3,563 692 875
(a) GST estimates for 2007-08 and 2008-09 from Commonwealth 2008-09 Budget Paper No.3, Table B.1, p. 93.
Since the introduction of the GST, New South Wales is estimated to have received $2.2 billion in GST revenue above its estimated GMA. In per capita terms, New South Wales’ per capita gain is $313 over the period 2000-01 to 2008-09, compared to a weighted average gain of $875 for the other States.
8 - 16 Budget Statement 2008-09

GST cross subsidies The current system for distributing GST revenue between States gives rise to a large cross subsidy from New South Wales to the other States (except for Victoria, Western Australia and Queensland). This cross subsidy is evident when GST grants to the States are compared to an equal per capita distribution, or to the amount of GST generated in each State.
Table 8.6 shows the average per capita GST revenue grant for the donor States – New South Wales, Victoria, Western Australia and Queensland – in 2008-09 will be $1,913. In comparison, the remaining States’ average per capita grant will be 81 per cent higher, at $3,455. The average per capita GST revenue grant for New South Wales in 2008-09 is estimated at $1,868.
Table 8.6: GST revenue grants per capita, 2008-09(a) State/Territory GST Revenue Grants
($ per capita)New South Wales 1,868
Victoria 1,924
Queensland 2,027
Western Australia 1,809
South Australia 2,591
Tasmania 3,483
Australian Capital Territory 2,630
Northern Territory 10,976
Average, 4 donor States 1,913
Average, 4 recipient States 3,455
AUSTRALIAN AVERAGE 2,105
(a) Based on GST estimates for 2008-09 from Commonwealth 2008-09 Budget Paper No.3, Table B.1, p. 93.
In 2008-09, the four donor States will subsidise the four recipient States by $3.6 billion compared with an equal per capita basis. Of this, New South Wales will donate $1.6 billion, or $237 per capita, to the recipient States. These cross subsidies are shown in Table 8.7.
Budget Statement 2008-09 8 - 17
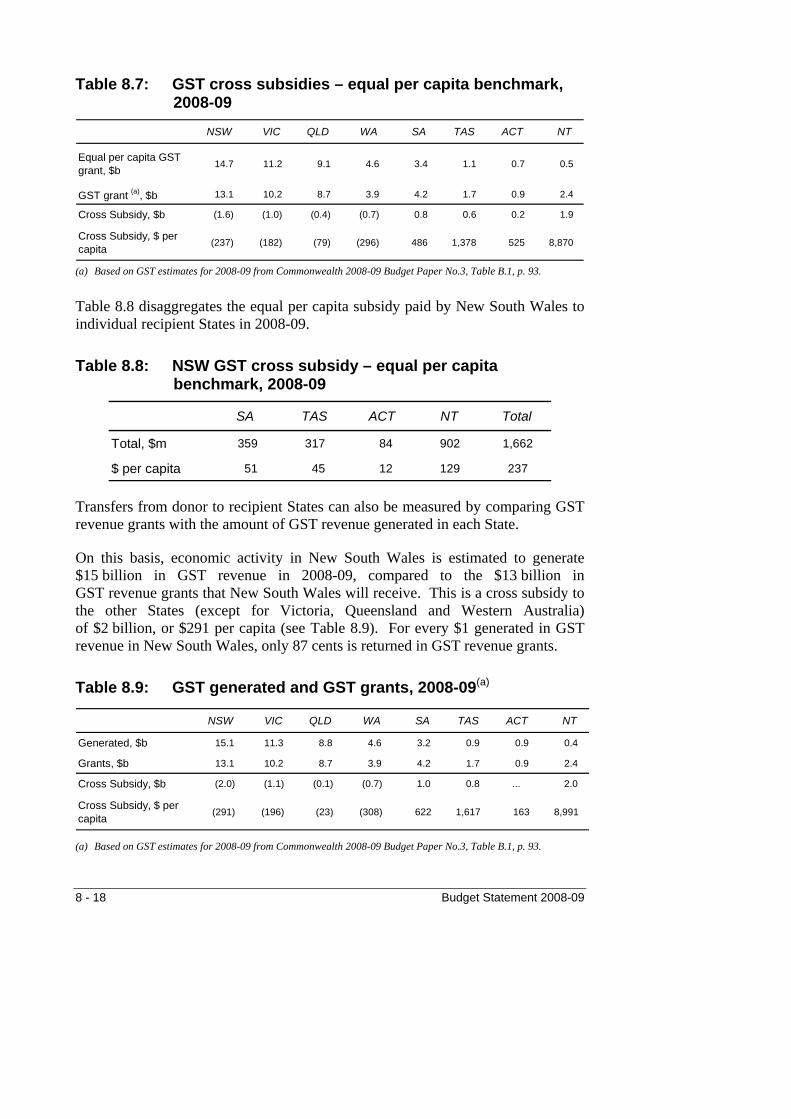
Table 8.7: GST cross subsidies – equal per capita benchmark, 2008-09
NSW VIC QLD WA SA TAS ACT NT
Equal per capita GST grant, $b 14.7 11.2 9.1 4.6 3.4 1.1 0.7 0.5
GST grant (a), $b 13.1 10.2 8.7 3.9 4.2 1.7 0.9 2.4
Cross Subsidy, $b (1.6) (1.0) (0.4) (0.7) 0.8 0.6 0.2 1.9
Cross Subsidy, $ per capita (237) (182) (79) (296) 486 1,378 525 8,870
(a) Based on GST estimates for 2008-09 from Commonwealth 2008-09 Budget Paper No.3, Table B.1, p. 93.
Table 8.8 disaggregates the equal per capita subsidy paid by New South Wales to individual recipient States in 2008-09.
Table 8.8: NSW GST cross subsidy – equal per capita benchmark, 2008-09
SA TAS ACT NT Total
Total, $m 359 317 84 902 1,662
$ per capita 51 45 12 129 237
Transfers from donor to recipient States can also be measured by comparing GST revenue grants with the amount of GST revenue generated in each State.
On this basis, economic activity in New South Wales is estimated to generate $15 billion in GST revenue in 2008-09, compared to the $13 billion in GST revenue grants that New South Wales will receive. This is a cross subsidy to the other States (except for Victoria, Queensland and Western Australia) of $2 billion, or $291 per capita (see Table 8.9). For every $1 generated in GST revenue in New South Wales, only 87 cents is returned in GST revenue grants.
Table 8.9: GST generated and GST grants, 2008-09(a)
NSW VIC QLD WA SA TAS ACT NT
Generated, $b 15.1 11.3 8.8 4.6 3.2 0.9 0.9 0.4
Grants, $b 13.1 10.2 8.7 3.9 4.2 1.7 0.9 2.4
Cross Subsidy, $b (2.0) (1.1) (0.1) (0.7) 1.0 0.8 ... 2.0
Cross Subsidy, $ per capita (291) (196) (23) (308) 622 1,617 163 8,991
(a) Based on GST estimates for 2008-09 from Commonwealth 2008-09 Budget Paper No.3, Table B.1, p. 93.
8 - 18 Budget Statement 2008-09

Table 8.10 provides a disaggregation of the estimated NSW subsidy calculated on a GST generated basis paid to individual recipient States.
Table 8.10: NSW GST cross subsidy – GST generated benchmark, 2008-09
SA TAS ACT NT Total
Total, $m 529 427 30 1,051 2,037
$ per capita 76 61 4 150 291
Chart 8.4 shows how this cross subsidy has changed over time. The cross subsidy generally has been increasing over time, though is expected to decline in 2008-09, owing to New South Wales’ larger expected share of GST revenue grants. On a GST generated basis also, Queensland is expected to become a small donor State for the first time in 2008-09.
Chart 8.4: NSW GST cross subsidy – GST generated benchmark
0
500
1,000
1,500
2,000
2,500
2000-01 2001-02 2002-03 2003-04 2004-05 2005-06 2006-07 2007-08 2008-09
$ m
illio
n
NT SA TAS WA QLD ACT
Budget Statement 2008-09 8 - 19
2010 Review of Revenue Sharing Relativities The next CGC Review of State Revenue Sharing Relativities is due to report by 26 February 2010.
The terms of reference for the 2010 Review direct the Commission to:
aggregate and otherwise simplify its assessments ♦
♦
♦
♦
♦
apply a materiality threshold to assessments
eliminate unreliable assessments
address data quality and quality assurance issues and
undertake a program of continuous improvement of assessments (data and methods).
The Commission’s report to the 2007 Treasurers’ Conference outlined progress in 2006 on the review. Through 2007 and into 2008, the Commission has produced a number of staff discussion papers on proposed assessments for States’ comment.
As part of the 2010 Review, the Commission is visiting all States to discuss directly with agency officials the costs of service delivery. New South Wales hosted a State visit by the Commission in the week 31 March-4 April 2008.
The main themes put before the Commission during the NSW State Visit were the costs of urban density and congestion; the extra costs of providing services to a culturally and linguistically diverse population; the demands placed on Sydney as Australia’s ‘global’ city and major international business, tourist and trade centre; and the particular needs of the large Aboriginal population in urban and regional centres of New South Wales.
Urban density and congestion affects the costs of providing public transport, roads and traffic management; the costs of providing infrastructure generally; and the costs of providing services that are delivered in the home or community rather than in dedicated service locations.
The need to provide culturally appropriate services and invest additional time to ensure that people whose first language is not English fully understand their interactions with government agencies, must also be considered.
8 - 20 Budget Statement 2008-09

As Australia’s only international city, Sydney has a large flowthrough of goods and people. This international focus to Sydney has costly ramifications. Large tourist populations can increase the cost of providing key services and the presence of world-renowned landmarks heighten the attraction of Sydney as a target for terrorism and increase associated security costs. Opportunities for cross border crime, such as drug trafficking, are also higher in an international city, increasing associated justice, health and community service expenses.
New South Wales has Australia’s largest indigenous population, and a more urbanised indigenous population than other States. New South Wales argued that the needs of major city and regional-centre based indigenous populations are no less than those of remote indigenous populations.
Budget Statement 2008-09 8 - 21

CHAPTER 9: THE ECONOMY
♦ The New South Wales economy performed strongly in 2007-08 with state final demand growing by 4¼ per cent, employment increasing by 2½ per cent and the unemployment rate declining to a generational low of 4½ per cent.
♦ Growth in the economy is projected to slow in 2008-09 under the weight of restrictive monetary policy and weaker global conditions, though Asian demand for resources will be a buffer.
♦ Interest-sensitive sectors such as housing will face particularly challenging conditions.
♦ Inflation is expected to begin easing during 2008-09, allowing monetary policy to remain on hold.
♦ Sources of risk to the outlook include prospects for global growth, credit markets and oil prices; domestic pressures on demand and inflation; and rainfall prospects for agriculture.
9.1 INTRODUCTION
Budget estimates reflect forecasts for the economy. Economic performance is cyclical, and state governments do not control the policy levers that influence the cycle. Other things being equal, an economic upswing improves State tax growth and the size of the GST revenue pool. Because State taxes also rely on the property cycle, however, the relationship between the economy and the budget is not straightforward.
Setting aside cyclical factors, economic performance in the medium term is likely to reflect trend growth in population, participation and productivity.
This chapter reviews recent economic performance and outlines the economic forecasts underpinning the 2008-09 Budget estimates. It then assesses the risks to the economic outlook, and the sensitivity of the Budget to variations in economic parameters.
Budget Statement 2008-09 9 - 1
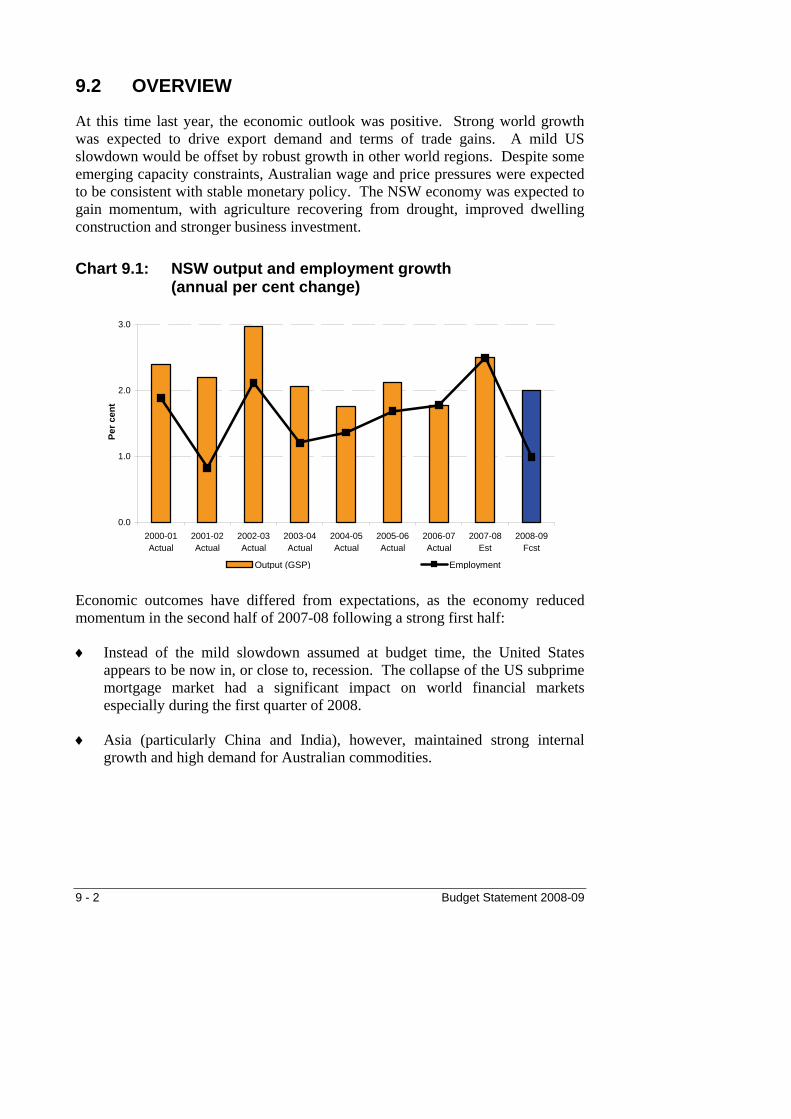
9.2 OVERVIEW
At this time last year, the economic outlook was positive. Strong world growth was expected to drive export demand and terms of trade gains. A mild US slowdown would be offset by robust growth in other world regions. Despite some emerging capacity constraints, Australian wage and price pressures were expected to be consistent with stable monetary policy. The NSW economy was expected to gain momentum, with agriculture recovering from drought, improved dwelling construction and stronger business investment.
Chart 9.1: NSW output and employment growth (annual per cent change)
0.0
1.0
2.0
3.0
2000-01Actual
2001-02Actual
2002-03Actual
2003-04Actual
2004-05Actual
2005-06Actual
2006-07Actual
2007-08Est
2008-09Fcst
Per c
ent
Output (GSP) Employment
Economic outcomes have differed from expectations, as the economy reduced momentum in the second half of 2007-08 following a strong first half:
Instead of the mild slowdown assumed at budget time, the United States appears to be now in, or close to, recession. The collapse of the US subprime mortgage market had a significant impact on world financial markets especially during the first quarter of 2008.
♦
♦ Asia (particularly China and India), however, maintained strong internal growth and high demand for Australian commodities.
9 - 2 Budget Statement 2008-09
♦
♦
Rising terms of trade, high resource sector investment, and the stimulus from tax cuts tightened capacity constraints in the Australian economy during the first half. Inflation edged higher, leading to four rate rises by the RBA between August 2007 and March 2008. Consumer sentiment declined sharply in the second half, and the housing recovery came to a halt.
In New South Wales, the drought did not break for the 2007-08 winter crops, and interest rate rises delayed further recovery in the dwelling sector. But aggregate State growth was sustained by strong employment and consumption through mid-year, and by solid growth in public infrastructure investment.
Performance in 2008-09 will be constrained by a weaker world economy, although resilient Asian demand for Australian resources will be a buffer. Output and employment growth nationally and in New South Wales are likely to slow. Tight global credit markets and domestic monetary policy may weigh against investment, while a softer job market and high mortgage costs will constrain consumption. Offsets will include income tax cuts, further strong public sector investment and improved farm conditions. Inflation will slow through the year – which may allow monetary policy to remain on hold. There are significant risks to this outlook for growth and inflation.
9.3 RECENT PERFORMANCE1
Economic performance in 2007-08 proceeded in two distinct halves. In the first six months, demand strengthened supported by stronger terms of trade, reduced income taxes and increased Commonwealth spending. As a result, inflationary pressures increased and monetary policy was tightened. In the second half, world financial markets and global economic prospects turned sharply downward. In response to tighter monetary policy and tighter credit markets, domestic demand appears to have slowed.
NSW economic trends differed somewhat from the national pattern. At the year’s outset NSW performance was modest relative to the rest of Australia with low direct exposure to the resources sector and protracted drought. By mid-year, however, State performance had begun to lift on the back of solid corporate sector performance, rising household disposable income and spending, and evidence the drought was finally nearing an end. This improvement was not sustained in the final six months.
1 Unless otherwise indicated, the sources for statistical information in this chapter are ABS (Australian
Bureau of Statistics) data releases and NSW Treasury estimates. Economic estimates are based on data available as at May 2008, which included: results to June 2007 for gross state product; to September 2007 for population; to December 2007 for state final demand; to March 2008 for consumer prices and the wage price index; and to April 2008 for employment.
Budget Statement 2008-09 9 - 3
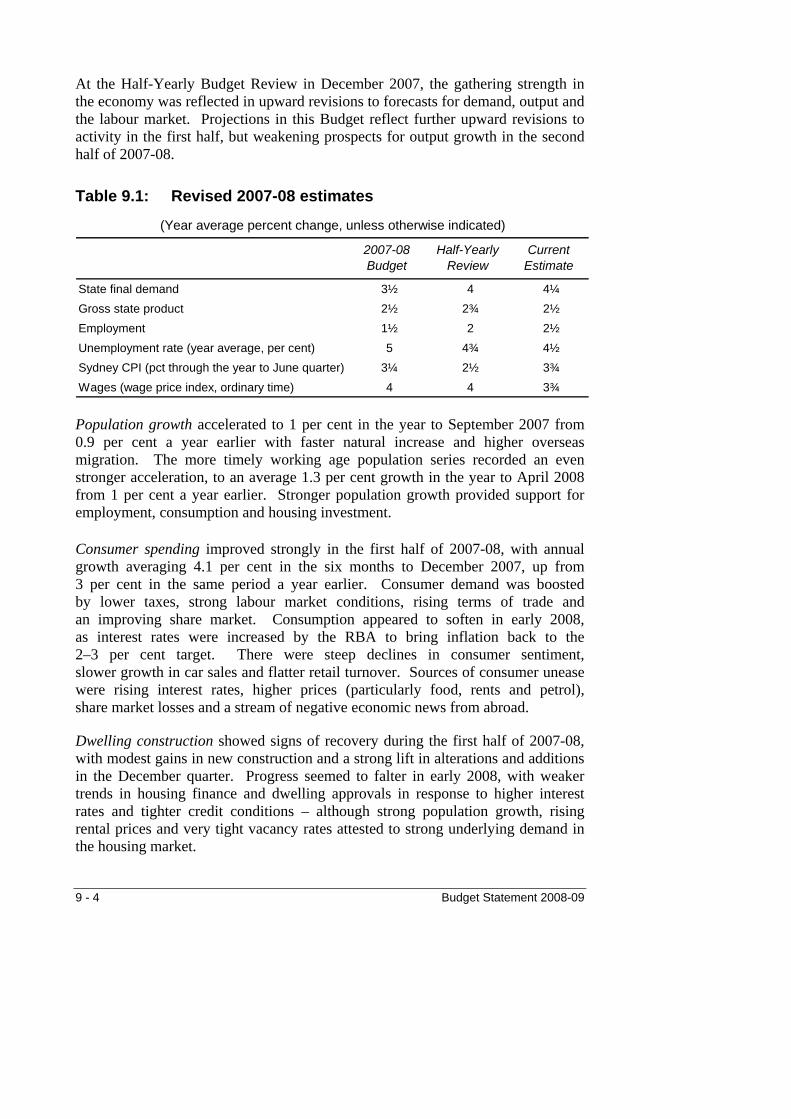
At the Half-Yearly Budget Review in December 2007, the gathering strength in the economy was reflected in upward revisions to forecasts for demand, output and the labour market. Projections in this Budget reflect further upward revisions to activity in the first half, but weakening prospects for output growth in the second half of 2007-08.
Table 9.1: Revised 2007-08 estimates
2007-08Budget
Half-Yearly Review
Current Estimate
State final demand 3½ 4 4¼Gross state product 2½ 2¾ 2½Employment 1½ 2 2½Unemployment rate (year average, per cent) 5 4¾ 4½Sydney CPI (pct through the year to June quarter) 3¼ 2½ 3¾Wages (wage price index, ordinary time) 4 4 3¾
(Year average percent change, unless otherwise indicated)
Population growth accelerated to 1 per cent in the year to September 2007 from 0.9 per cent a year earlier with faster natural increase and higher overseas migration. The more timely working age population series recorded an even stronger acceleration, to an average 1.3 per cent growth in the year to April 2008 from 1 per cent a year earlier. Stronger population growth provided support for employment, consumption and housing investment.
Consumer spending improved strongly in the first half of 2007-08, with annual growth averaging 4.1 per cent in the six months to December 2007, up from 3 per cent in the same period a year earlier. Consumer demand was boosted by lower taxes, strong labour market conditions, rising terms of trade and an improving share market. Consumption appeared to soften in early 2008, as interest rates were increased by the RBA to bring inflation back to the 2–3 per cent target. There were steep declines in consumer sentiment, slower growth in car sales and flatter retail turnover. Sources of consumer unease were rising interest rates, higher prices (particularly food, rents and petrol), share market losses and a stream of negative economic news from abroad.
Dwelling construction showed signs of recovery during the first half of 2007-08, with modest gains in new construction and a strong lift in alterations and additions in the December quarter. Progress seemed to falter in early 2008, with weaker trends in housing finance and dwelling approvals in response to higher interest rates and tighter credit conditions – although strong population growth, rising rental prices and very tight vacancy rates attested to strong underlying demand in the housing market.
9 - 4 Budget Statement 2008-09
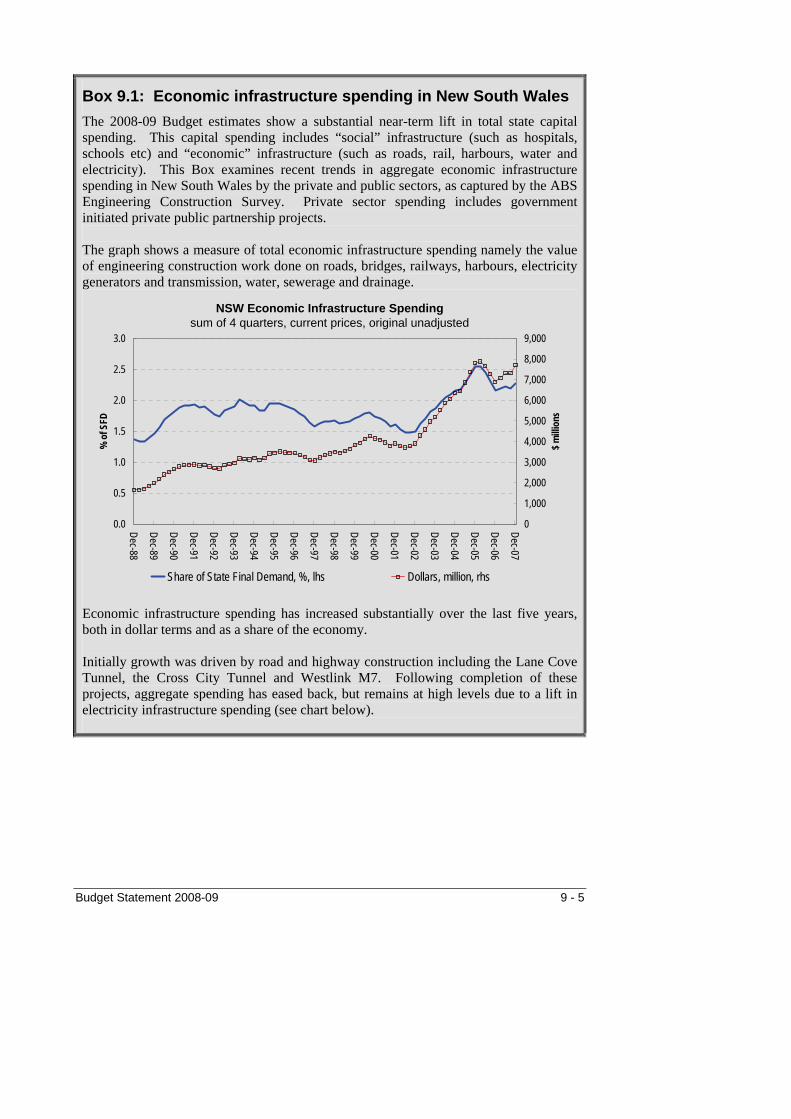
Box 9.1: Economic infrastructure spending in New South Wales The 2008-09 Budget estimates show a substantial near-term lift in total state capital spending. This capital spending includes “social” infrastructure (such as hospitals, schools etc) and “economic” infrastructure (such as roads, rail, harbours, water and electricity). This Box examines recent trends in aggregate economic infrastructure spending in New South Wales by the private and public sectors, as captured by the ABS Engineering Construction Survey. Private sector spending includes government initiated private public partnership projects. The graph shows a measure of total economic infrastructure spending namely the value of engineering construction work done on roads, bridges, railways, harbours, electricity generators and transmission, water, sewerage and drainage.
NSW Economic Infrastructure Spendingsum of 4 quarters, current prices, original unadjusted
0.0
0.5
1.0
1.5
2.0
2.5
3.0
Dec-88
Dec-89
Dec-90
Dec-91
Dec-92
Dec-93
Dec-94
Dec-95
Dec-96
Dec-97
Dec-98
Dec-99
Dec-00
Dec-01
Dec-02
Dec-03
Dec-04
Dec-05
Dec-06
Dec-07
% o
f SFD
0
1,000
2,000
3,000
4,000
5,000
6,000
7,000
8,000
9,000
$ milli
ons
Share of State Final Demand, %, lhs Dollars, million, rhs Economic infrastructure spending has increased substantially over the last five years, both in dollar terms and as a share of the economy. Initially growth was driven by road and highway construction including the Lane Cove Tunnel, the Cross City Tunnel and Westlink M7. Following completion of these projects, aggregate spending has eased back, but remains at high levels due to a lift in electricity infrastructure spending (see chart below).
Budget Statement 2008-09 9 - 5
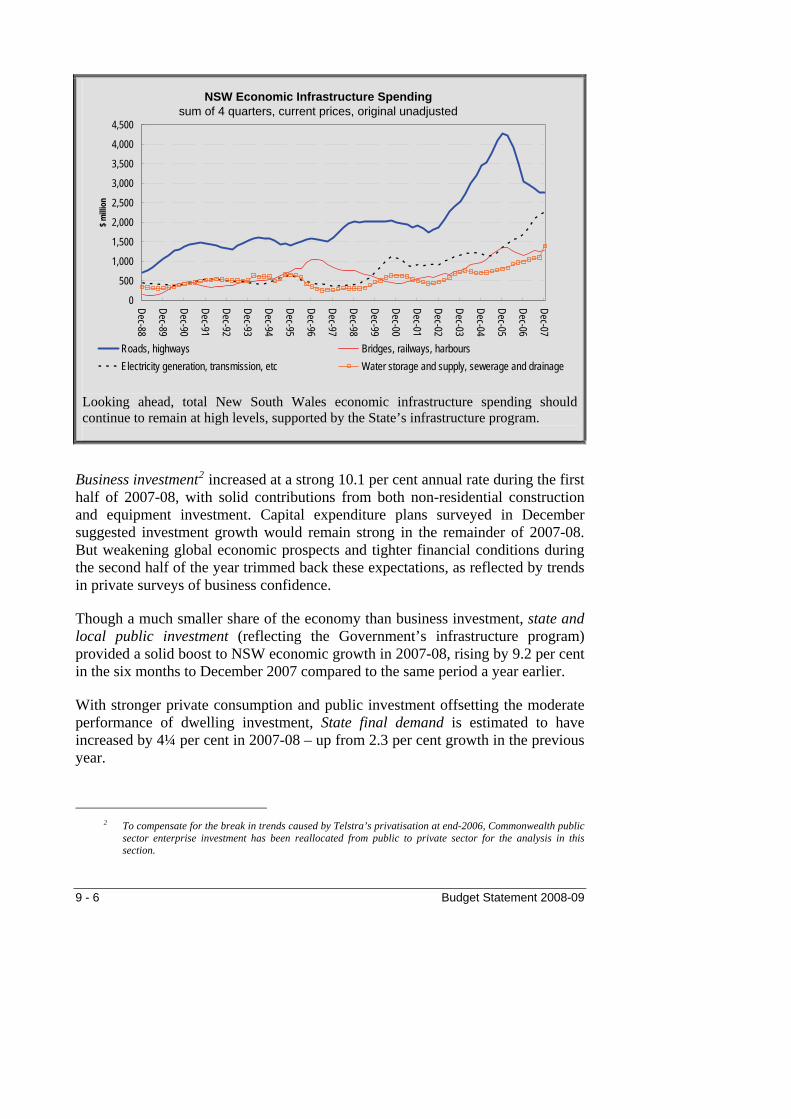
NSW Economic Infrastructure Spending sum of 4 quarters, current prices, original unadjusted
0
500
1,000
1,500
2,000
2,500
3,000
3,500
4,000
4,500
Dec-88
Dec-89
Dec-90
Dec-91
Dec-92
Dec-93
Dec-94
Dec-95
Dec-96
Dec-97
Dec-98
Dec-99
Dec-00
Dec-01
Dec-02
Dec-03
Dec-04
Dec-05
Dec-06
Dec-07
$ milli
on
Roads, highways Bridges, railways, harboursElectricity generation, transmission, etc Water storage and supply, sewerage and drainage
Looking ahead, total New South Wales economic infrastructure spending should continue to remain at high levels, supported by the State’s infrastructure program.
Business investment2 increased at a strong 10.1 per cent annual rate during the first half of 2007-08, with solid contributions from both non-residential construction and equipment investment. Capital expenditure plans surveyed in December suggested investment growth would remain strong in the remainder of 2007-08. But weakening global economic prospects and tighter financial conditions during the second half of the year trimmed back these expectations, as reflected by trends in private surveys of business confidence.
Though a much smaller share of the economy than business investment, state and local public investment (reflecting the Government’s infrastructure program) provided a solid boost to NSW economic growth in 2007-08, rising by 9.2 per cent in the six months to December 2007 compared to the same period a year earlier.
With stronger private consumption and public investment offsetting the moderate performance of dwelling investment, State final demand is estimated to have increased by 4¼ per cent in 2007-08 – up from 2.3 per cent growth in the previous year.
2 To compensate for the break in trends caused by Telstra’s privatisation at end-2006, Commonwealth public
sector enterprise investment has been reallocated from public to private sector for the analysis in this section.
9 - 6 Budget Statement 2008-09

The recovery from drought projected by the Australian Bureau of Agricultural and Resource Economics (ABARE) and the Bureau of Meteorology (BOM) in early 2007 did not eventuate. The absence of follow-up rains reduced winter crop production to the lowest since 1994-95. It also forced the suspension of irrigation water allocations and the abandonment of most summer rice production. Instead of the expected ½ percentage point contribution to GSP growth, weak rural production is likely to have detracted again from State exports and output in 2007-08.
As a major gateway for national imports, but a comparatively modest supplier of national exports, New South Wales usually records a net deficit on overseas trade. In 2007-08, NSW manufactured and service exports remained constrained by the rising exchange rate, while rural exports were severely affected by the drought. Annual average growth in merchandise export volumes slowed from 4.6 per cent in 2006 to 1.6 per cent in 2007. Annual growth in merchandise import volumes, by contrast, increased from 9.5 per cent in 2006 to 11.3 per cent in 2007.
Overseas trade, along with balancing items (interstate trade, inventory and statistical discrepancy), may have detracted around 1¾ percentage points from gross state product, which is estimated to have increased by 2½ per cent in 2007-08.
The labour market made stronger than expected gains, with NSW employment increasing by an estimated 2½ per cent and the unemployment rate declining to an estimated average 4½ per cent in 2007-08 from 5 per cent in 2006-07. In year average terms, employment growth to the March quarter 2008 was strongest in transport and storage, health and community services and manufacturing.
Wage pressures remained moderate during 2007-08 despite a further decline in unemployment and skilled labour shortages in some sectors. Wage pressures in the resources and infrastructure sectors did not flow on to the broader economy. Growth in the NSW Wage Price Index was 3.7 per cent through the year to March 2008 – marginally less than the 3.8 per cent increase through the year to March 2007.
Inflation, as measured by through-the-year growth in the Sydney CPI, increased from 1.7 per cent in June 2007 to 3.9 per cent in March 2008. Accelerating economic activity, particularly in the resources sector, bid up demand for labour and tightened capacity constraints in the national economy, lifting through-the-year underlying inflation3 from 2.8 in June 2007 to 4.3 per cent in March 2008.
3 Underlying inflation as measured by the average of the RBA’s weighted median and the trimmed mean
analytical CPI indexes.
Budget Statement 2008-09 9 - 7

Reflecting the accelerating demand from industrialising Asian economies and some global supply constraints, world prices of tradeable goods (particularly food and energy) contributed to domestic inflation. Rising petrol prices, for example, contributed 0.7 of a percentage point to Sydney CPI inflation in the year to March 2008.
Price pressures became increasingly broad-based during the year, with 57 per cent of items in the national CPI recording more than 3 per cent growth in the year to March 2008, up from 49 per cent a year earlier. Inflation was slightly lower in Sydney than nationally, reflecting the more moderate rate of domestic demand expansion in New South Wales than in the resource states in 2007-08.
The Reserve Bank of Australia (RBA), in its May 2008 Statement on Monetary Policy, expects underlying inflation to peak in the first half of 2008, reflecting a projected sharp slowing in non-farm GDP growth over calendar year 2008.
In response to rising inflation, the RBA tightened monetary policy four times between August 2007 and March 2008, lifting the cash rate to its highest level since June 1996. The impact of monetary policy was augmented by the severe tightening in global credit conditions resulting from the US subprime mortgage crisis. The average bank standard variable mortgage rate increased from 7.3 per cent in April 2006 to 8.1 per cent in April 2007 and 9.5 per cent in April 2008. Australian long bond yields were comparatively stable, trading within a range of 5.8 to 6.5 per cent between April 2007 and April 2008.
Chart 9.2: Share price index growth (annualised six-monthly average rate of change)(a)
-40
-30
-20
-10
0
10
20
30
40
97-9
8 H
2
98-9
9 H
1
98-9
9 H
2
99-0
0 H
1
99-0
0 H
2
00-0
1 H
1
00-0
1 H
2
01-0
2 H
1
01-0
2 H
2
02-0
3 H
1
02-0
3 H
2
03-0
4 H
1
03-0
4 H
2
04-0
5 H
1
04-0
5 H
2
05-0
6 H
1
05-0
6 H
2
06-0
7 H
1
06-0
7 H
2
07-0
8 H
1
07-0
8 H
2
Per c
ent
Australia All-Ords Index United States S&P 500 Index (a) Data refers to half-yearly (H1/H2) averages except for the second half of 2007-08 which is based on January
through to mid-May 2008.
9 - 8 Budget Statement 2008-09

Share prices, though volatile, improved on average in the first half of 2007-08. They declined during the second half, although there were signs of recovery in the final months of the financial year.
9.4 OUTLOOK FOR 2008-09
The economy will start 2008-09 with high inflation and tight monetary policy, offset by stimulus from tax cuts and rising terms of trade. Over the year ahead, the Australian economy will face risks and challenges. Potentially tight world financial markets and lower growth in industrialised economies will contrast with continued robust conditions in the major Asian industrialising economies. The outcome will determine whether inflationary pressures ease sufficiently to keep monetary policy on hold and whether domestic growth moderates gently or slows sharply.
With less direct exposure to buoyant Asia than the major resource States, the NSW economy is relatively more dependent upon a successful “soft landing” in North America and Europe, restoration of liquid credit markets and benign domestic monetary policy.
On balance, tight domestic monetary policy settings are unlikely to change, and economic growth is likely to slow to below trend.
WORLD ECONOMY Global growth is expected to slow in 2008-09, although the step down will be less severe for Australia’s Asian trading partners. In its April 2008 World Economic Outlook, the International Monetary Fund projects world growth at 3¾ per cent in both 2008 and 2009, down from 4.9 per cent in 2007. In 2008, growth is expected to be near zero in the United States and slowing markedly in Japan and Europe. But growth will remain strong (though below the previous year) in China, India and Korea.
Budget Statement 2008-09 9 - 9

Table 9.2: World Economic Prospects
2007Actual
2008Projected
2009Projected
World Output 4.9 3.7 3.8
United States 2.2 0.5 0.6
Euro Area 2.6 1.4 1.2
Japan 2.1 1.4 1.5
Korea 5.0 4.2 4.4
China 11.4 9.3 9.5
India 9.2 7.9 8.0
(Per cent change in real GDP, by calendar year)
Source: IMF, World Economic Outlook , April 2008
AUSTRALIAN ECONOMY Several factors will stimulate national economic demand, complicating the task for monetary policy:
♦
♦
♦
the momentum in developing Asian economies will maintain commodity prices at high levels. Contracts agreed in the first half of 2008 for principal Australian mineral exports imply further large increases in export prices, partially offset by higher import prices. For example, thermal coal producers using the Port of Newcastle won a 125 per cent increase in annual contract prices in the year that started April 1 to $125 a ton4. Rising terms of trade will continue to encourage production and investment in the resource sector, while adding to real household income across the economy
past and prospective income tax reductions will boost household spending capacity and
favourable weather conditions and strong world grain prices, if outcomes are in line with ABARE projections, should substantially lift rural production and farm income.
4 Bloomberg - 12-May-08
9 - 10 Budget Statement 2008-09

Weighing against growth, and providing grounds for monetary policy moderation, are:
the severe and potentially protracted slowdown in the United States, given the close historical relationship between economic trends in the United States and Australia. Financial market contagion, rather than trade, is the principal channel through which cyclical shocks are now transmitted from the United States to Australia
♦
♦
♦
♦
continued uncertainty in global credit markets may remain an impediment to capital raising for investment and a source of additional operating cost to business and finance
the high and rising world price of petroleum (affecting production costs and consumer budgets) and
the significant tightening in monetary policy in the last two years, amplified by the global credit market crisis, is already restricting demand and dampening business and consumer confidence, although the full lagged effect is yet to flow through the economy.
On balance, the Australian economy is expected to slow in 2008-09. If so, inflationary pressures are likely to ease, removing the need for further monetary policy intervention.
NEW SOUTH WALES ECONOMY Challenges for the NSW economy in the year ahead are likely to be greater than for some other states. This reflects the State’s relative exposure to interest rates due to higher house prices and household gearing. It also reflects the State’s industry structure with more reliance on property and financial services industries than on resource industries, and greater exposure via services and manufacturing to competitiveness losses from exchange rate appreciation.
NSW economic output (GSP) growth is expected to slow from 2½ per cent in 2007-08 to 2 per cent in 2008-09. State final demand growth is expected to slow more significantly from 4¼ to 2½ per cent. Household consumption and business investment growth will be more subdued, but public sector investment will remain strong, and net exports will improve.
Budget Statement 2008-09 9 - 11
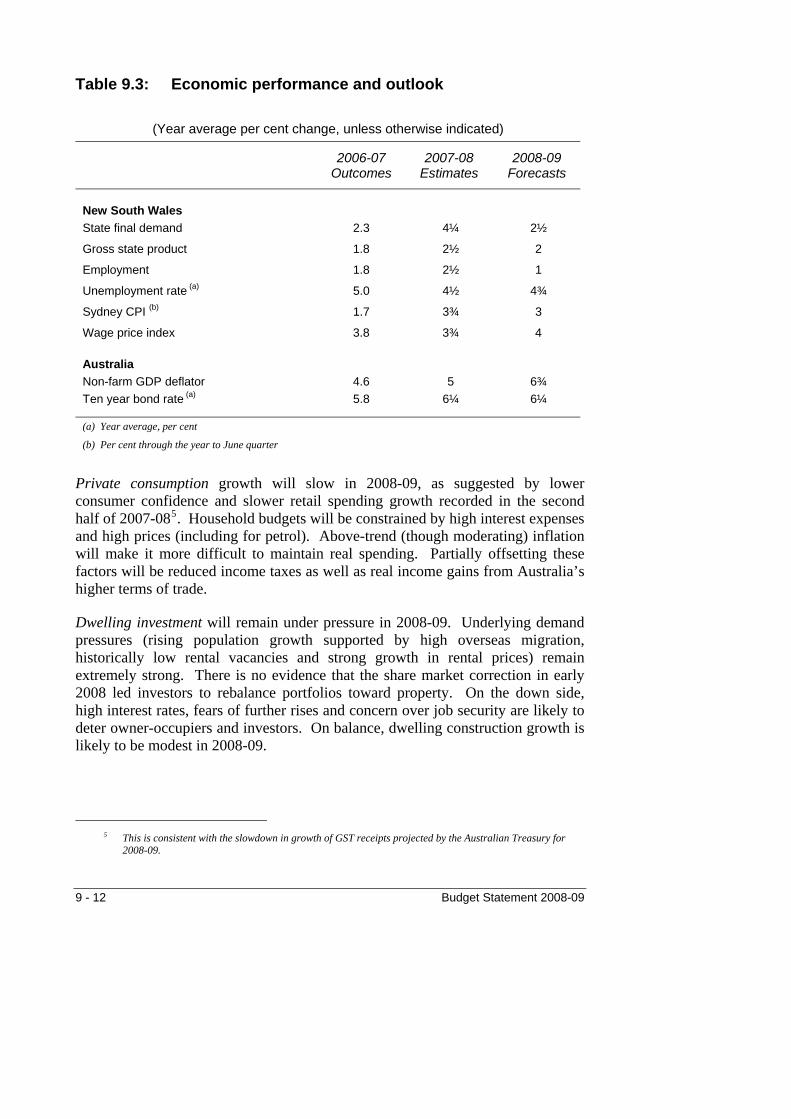
Table 9.3: Economic performance and outlook
(Year average per cent change, unless otherwise indicated) 2006-07
Outcomes 2007-08
Estimates 2008-09
Forecasts
New South Wales
State final demand 2.3 4¼ 2½
Gross state product 1.8 2½ 2
Employment 1.8 2½ 1
Unemployment rate (a) 5.0 4½ 4¾
Sydney CPI (b) 1.7 3¾ 3
Wage price index 3.8 3¾ 4
Australia
Non-farm GDP deflator 4.6 5 6¾ Ten year bond rate (a) 5.8 6¼ 6¼
(a) Year average, per cent (b) Per cent through the year to June quarter
Private consumption growth will slow in 2008-09, as suggested by lower consumer confidence and slower retail spending growth recorded in the second half of 2007-085. Household budgets will be constrained by high interest expenses and high prices (including for petrol). Above-trend (though moderating) inflation will make it more difficult to maintain real spending. Partially offsetting these factors will be reduced income taxes as well as real income gains from Australia’s higher terms of trade.
Dwelling investment will remain under pressure in 2008-09. Underlying demand pressures (rising population growth supported by high overseas migration, historically low rental vacancies and strong growth in rental prices) remain extremely strong. There is no evidence that the share market correction in early 2008 led investors to rebalance portfolios toward property. On the down side, high interest rates, fears of further rises and concern over job security are likely to deter owner-occupiers and investors. On balance, dwelling construction growth is likely to be modest in 2008-09.
5 This is consistent with the slowdown in growth of GST receipts projected by the Australian Treasury for
2008-09.
9 - 12 Budget Statement 2008-09

Box 9.2: The NSW economy: changing structure and challenges New South Wales has the most diversified economy of the Australian states. The relative importance of various industries to the NSW economy means that the recent commodity price boom and financial market instability pose greater challenges relative to other states. The tables below show, respectively, industry shares of real GSP and employment over the last 15 years. In New South Wales the mining sector’s output share has been fairly stable, averaging about 2.4 per cent. This compares to an average of 8.2 per cent for Queensland, 29.3 per cent for Western Australia and 7.3 per cent nationally.
5 Year Average
Agriculture Mining Manufacturing Finance & Insurance
Property & Business
Other
1993-97 2.1% 2.5% 13.2% 8.9% 11.4% 62.0%1998-02 2.1% 2.4% 11.5% 9.6% 12.7% 61.8%2003-07 1.6% 2.3% 10.5% 9.9% 14.0% 61.7%
Source: Australian National Accounts: State Accounts, ABS Cat No 5220.0
Share of NSW GSP (Gross Value Added Basis, cvm)
In contrast, the finance & insurance sector’s output share has been increasing in New South Wales, now rivalling that of manufacturing and considerably exceeding the national share average of 6.9 per cent. The same holds for the property & business sector, whose output share has been increasing and is higher in New South Wales than nationally.
5 Year Average
Agriculture Mining Manufacturing Finance & Insurance
Property & Business
Other
1993-97 4.3% 0.9% 13.9% 4.7% 9.3% 66.8%1998-02 4.3% 0.6% 12.1% 4.7% 11.9% 66.4%2003-07 3.0% 0.6% 10.4% 4.9% 12.7% 68.3%Source: Labour Force, Australia, Detailed, Quarterly, ABS Cat No 6291.0.55.003
Industry Share of NSW Total Employment
The structure of the NSW economy means that it faces different challenges from global shocks. For example, the direct impact of the commodity price boom is likely to be more muted in New South Wales than in the resource states and nationally. Tighter financial market conditions and less availability of credit will have a more negative effect in New South Wales given the larger finance & insurance sector, with possible flow-on to the larger property & business services sector.
Budget Statement 2008-09 9 - 13

Business investment is expected to grow more moderately in 2008-09 after a strong performance in 2007-08. Initially, the December quarter 2007 Private New Capital Expenditure Survey pointed to another strong year of growth in 2008-09, and this was corroborated by the large pipelines of work yet to be done that were reported in building and engineering surveys. Prospects for business investment moderated subsequently as global credit conditions tightened and the outlook for global growth deteriorated. Business surveys in the final quarter of 2007-08 reported sharp falls in new orders and business confidence. While some investment (particularly in infrastructure and resources) remains “locked in” to large multi-year projects, elsewhere companies are likely to trim back investment plans, delay start-ups and slow implementation to adjust to weaker demand and higher financing costs. Therefore, the rate of business investment growth is projected to slow by about half in 2008-09.
Public sector investment will continue to expand strongly, supported by increased State infrastructure spending, as discussed in Budget Paper No. 4 Infrastructure Statement. The share of state and local public investment in total state final demand (3.1 per cent) was less than one-quarter that of private business investment (12.9 per cent) in calendar year 2007. Thus, even with the strong further increase expected in 2008-09, the State’s infrastructure program will not be a significant contributor to inflationary pressures.
Net exports performance should improve in 2008-09. Exports growth will be assisted by an assumed farm sector recovery from the drought, high world grain prices and by continued strong North Asian demand for thermal coal – which has seen NSW export prices more than double (in US$ terms) in recent contracts. The strong Australian dollar, however, will continue to restrain growth in non-resource exports. Slower growth in consumer spending and business investment will moderate the growth of imports.
The rural recovery is expected to help New South Wales maintain GSP growth at a reasonable rate in 2008-09 despite a near halving of the growth rate of state final demand. The contribution of improved agricultural production to jobs growth is unlikely to be as strong as its contribution to GSP. Therefore, NSW employment growth is likely to slow from 2½ per cent in 2007-08 to a below-trend rate of around 1 per cent in 2008-09. The unemployment rate at 4¾ per cent will remain well below the 5¾ per cent average of the previous decade.
Wage growth, as measured by the Wage Price Index, is expected to remain around 4 per cent in 2008-09. Slowing employment growth should trim wage competition for skilled labour and tax reductions should moderate calls to compensate for recent cost of living rises.
9 - 14 Budget Statement 2008-09
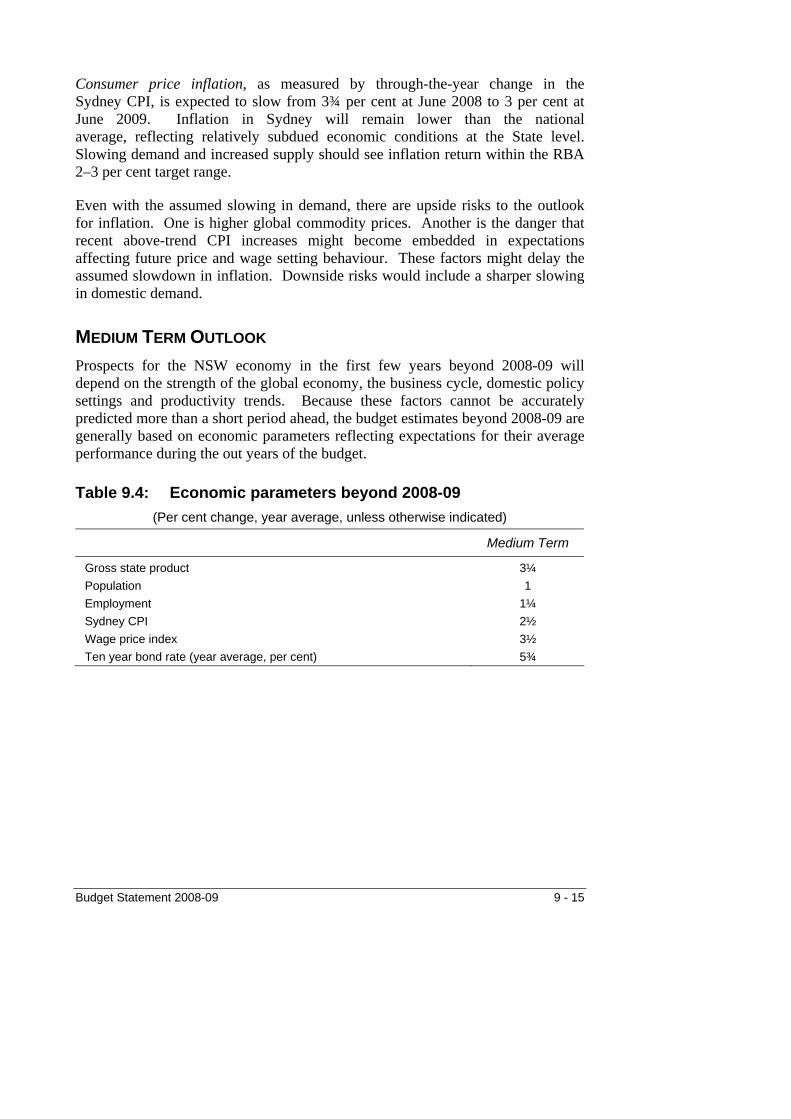
Consumer price inflation, as measured by through-the-year change in the Sydney CPI, is expected to slow from 3¾ per cent at June 2008 to 3 per cent at June 2009. Inflation in Sydney will remain lower than the national average, reflecting relatively subdued economic conditions at the State level. Slowing demand and increased supply should see inflation return within the RBA 2–3 per cent target range.
Even with the assumed slowing in demand, there are upside risks to the outlook for inflation. One is higher global commodity prices. Another is the danger that recent above-trend CPI increases might become embedded in expectations affecting future price and wage setting behaviour. These factors might delay the assumed slowdown in inflation. Downside risks would include a sharper slowing in domestic demand.
MEDIUM TERM OUTLOOK Prospects for the NSW economy in the first few years beyond 2008-09 will depend on the strength of the global economy, the business cycle, domestic policy settings and productivity trends. Because these factors cannot be accurately predicted more than a short period ahead, the budget estimates beyond 2008-09 are generally based on economic parameters reflecting expectations for their average performance during the out years of the budget.
Table 9.4: Economic parameters beyond 2008-09 (Per cent change, year average, unless otherwise indicated)
Medium Term
Gross state product 3¼ Population 1 Employment 1¼ Sydney CPI 2½ Wage price index 3½ Ten year bond rate (year average, per cent) 5¾
Budget Statement 2008-09 9 - 15
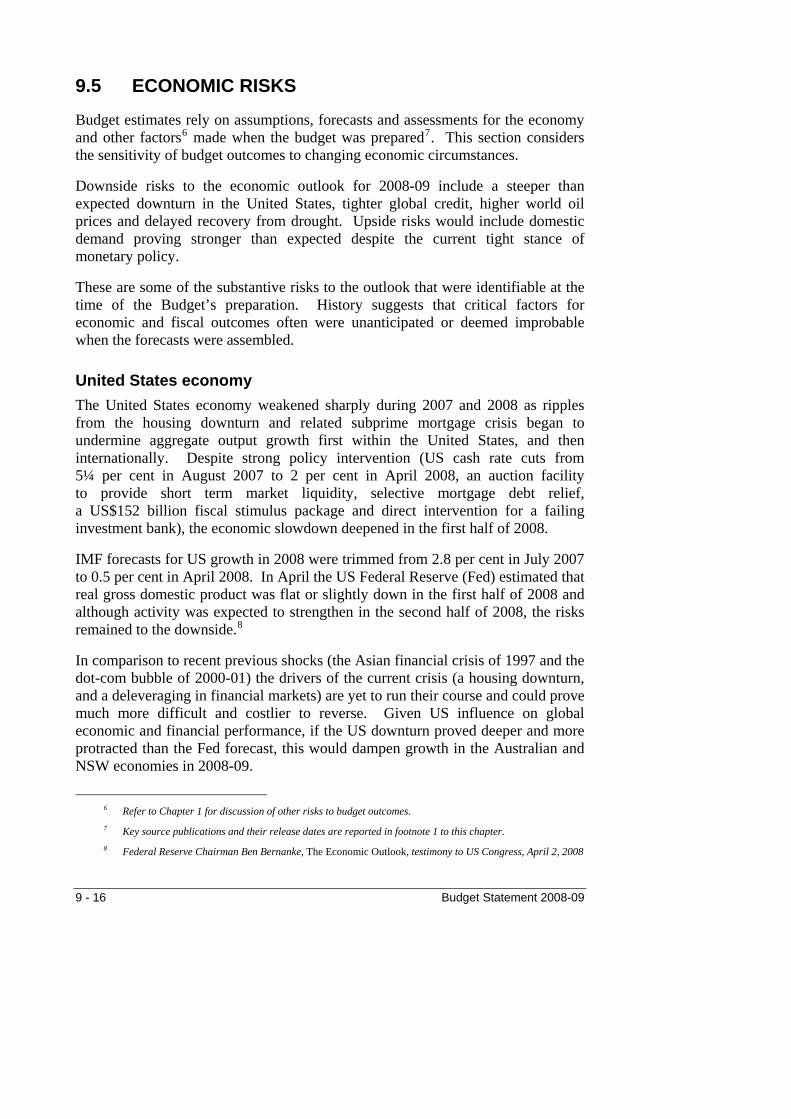
9.5 ECONOMIC RISKS
Budget estimates rely on assumptions, forecasts and assessments for the economy and other factors6 made when the budget was prepared7. This section considers the sensitivity of budget outcomes to changing economic circumstances.
Downside risks to the economic outlook for 2008-09 include a steeper than expected downturn in the United States, tighter global credit, higher world oil prices and delayed recovery from drought. Upside risks would include domestic demand proving stronger than expected despite the current tight stance of monetary policy.
These are some of the substantive risks to the outlook that were identifiable at the time of the Budget’s preparation. History suggests that critical factors for economic and fiscal outcomes often were unanticipated or deemed improbable when the forecasts were assembled.
United States economy The United States economy weakened sharply during 2007 and 2008 as ripples from the housing downturn and related subprime mortgage crisis began to undermine aggregate output growth first within the United States, and then internationally. Despite strong policy intervention (US cash rate cuts from 5¼ per cent in August 2007 to 2 per cent in April 2008, an auction facility to provide short term market liquidity, selective mortgage debt relief, a US$152 billion fiscal stimulus package and direct intervention for a failing investment bank), the economic slowdown deepened in the first half of 2008.
IMF forecasts for US growth in 2008 were trimmed from 2.8 per cent in July 2007 to 0.5 per cent in April 2008. In April the US Federal Reserve (Fed) estimated that real gross domestic product was flat or slightly down in the first half of 2008 and although activity was expected to strengthen in the second half of 2008, the risks remained to the downside.8
In comparison to recent previous shocks (the Asian financial crisis of 1997 and the dot-com bubble of 2000-01) the drivers of the current crisis (a housing downturn, and a deleveraging in financial markets) are yet to run their course and could prove much more difficult and costlier to reverse. Given US influence on global economic and financial performance, if the US downturn proved deeper and more protracted than the Fed forecast, this would dampen growth in the Australian and NSW economies in 2008-09.
6 Refer to Chapter 1 for discussion of other risks to budget outcomes. 7 Key source publications and their release dates are reported in footnote 1 to this chapter. 8 Federal Reserve Chairman Ben Bernanke, The Economic Outlook, testimony to US Congress, April 2, 2008
9 - 16 Budget Statement 2008-09

Credit Markets In the aftermath of the US subprime mortgage crisis, credit around the world has become harder to secure and much more costly to finance. While financial markets have stabilised somewhat after the first quarter 2008, conditions still remain difficult and uncertain. As Australia’s financial capital, New South Wales has special sensitivity to conditions in this sector (refer Box 9.3).
World oil prices World oil prices climbed by over 80 per cent during 2007-08 from US$71 per barrel of West Texas Intermediate at end June 2007 to over US$130 per barrel in May 2008. Factors behind this rise were the depreciation of the US dollar, strong demand (particularly the rapid growth in vehicle usage in industrialising Asian economies) and supply constraints (both political and economic). A speculative run-up in commodity prices in response to rising global inflation may be a further factor. The International Energy Agency (IEA) forecasts that petroleum demand growth will slow in 2008 due to the global downturn, but this has not yet been reflected in prices. Oil futures markets in May 2008 indicate that traders expect the price of crude to remain above US$120 per barrel through June 2009.
While a stronger A$ partly buffered Australian consumers, the average Sydney price of unleaded petrol increased from 126 cents per litre in April 2007 to 144 cents per litre in April 20089, and automotive fuel contributed 0.7 points of the total 3.9 percentage points increase in the Sydney CPI through the year to March 2008. As an important input to production and distribution systems, petroleum prices have a pervasive effect on costs across the economy.
The risk of further oil price increases and volatility remains high.
9 Source: Australian Automobile Association.
Budget Statement 2008-09 9 - 17

Box 9.3: Global credit markets The global financial system came under strain following the US housing downturn and subprime mortgage collapse, which had a domino effect on other financial instruments and institutions. Liquidity problems, announced write-downs and fear of undeclared exposures caused a broad based repricing of risk and unwinding of leverage. Credit conditions tightened, interest rate spreads widened, and key segments of credit markets virtually closed.
The Australian financial system has coped better with the recent strains than have the financial systems of many other countries, although many private and some public entities have reported significant losses. The banking system generally remains profitable and well capitalised, with minimal direct exposure to US subprime problems, and with higher quality and less risky assets. The major banks have remained able to access wholesale funding, albeit at higher spreads and shortened maturities. Rising credit risk and default rates, however, have led to increased bad debt provisioning.
Banks have passed on some of their increased costs to clients, keeping credit available but at a higher price. The effective cost to borrowers has risen by more, as non-bank lenders (reliant on securitisation funding) have been forced to leave the market, narrowing competition and reducing discounts.
Corporate bond issuance has become almost non-existent. Short-end investors have been reluctant to rollover asset-backed commercial paper, while longer term asset-backed market issuance is extremely low and at elevated spreads. Initially businesses were able to turn back to banks for funding (re-intermediation) and total corporate debt growth remained strong. Business credit expansion appears to have slowed in the second half of 2007-08, however, in response to higher funding costs, tighter borrowing conditions and weaker earnings prospects.
Costs to households have been affected by tighter monetary policy, higher global market costs, and loss of discounting. NSW households are highly geared (interest payments consumed 13.6 per cent of gross household disposable income in 2006-07) and exposed to financial conditions (the NSW housing loan arrears ratio at end-2007 was more than triple the average of other States, and it was up sevenfold from end-2003). This implies relatively greater pressure on NSW consumption and dwelling investment.
Tight credit will remain a constraint on OECD economic growth in 2008-09, and a risk for global recession. The most likely risk to Australia is a prolonged phase of tighter and costlier credit which slows, but does not reverse, economic expansion. Since Sydney is the financial centre of Australia and NSW households are the most highly geared, the domestic impact of tighter global credit will continue to fall disproportionately on New South Wales.
9 - 18 Budget Statement 2008-09
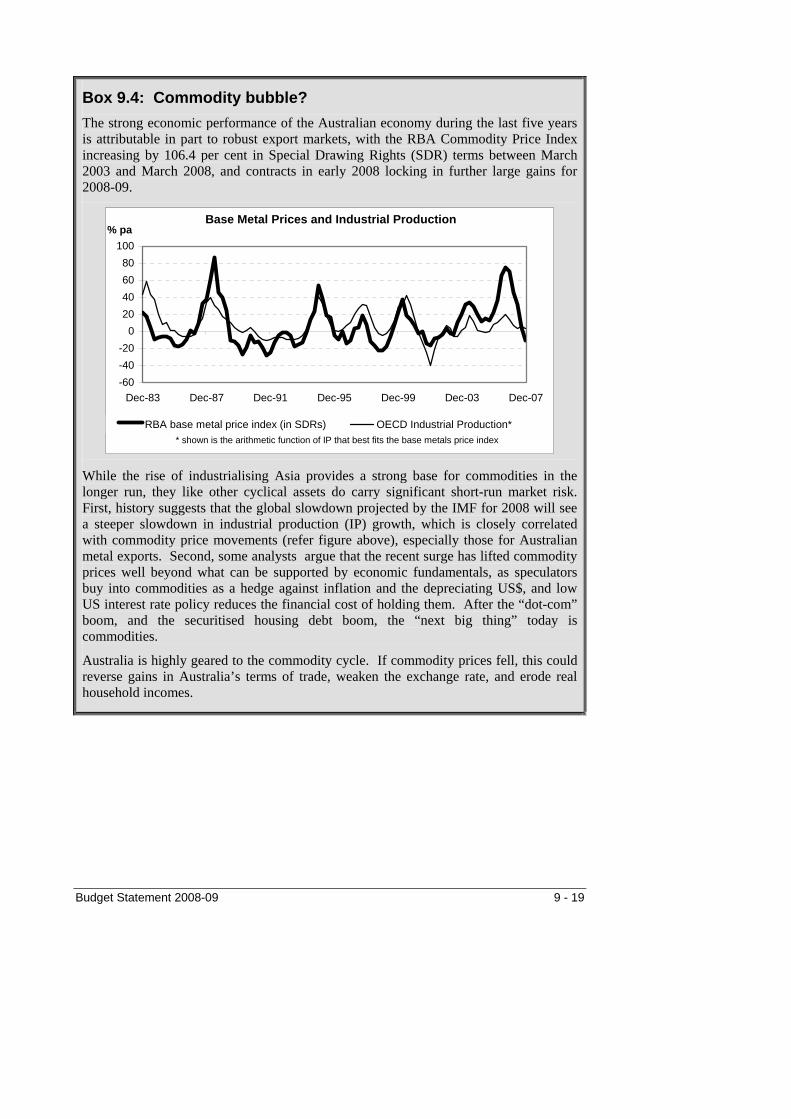
Box 9.4: Commodity bubble? The strong economic performance of the Australian economy during the last five years is attributable in part to robust export markets, with the RBA Commodity Price Index increasing by 106.4 per cent in Special Drawing Rights (SDR) terms between March 2003 and March 2008, and contracts in early 2008 locking in further large gains for 2008-09.
Base Metal Prices and Industrial Production
-60-40-20
020406080
100
Dec-83 Dec-87 Dec-91 Dec-95 Dec-99 Dec-03 Dec-07
* shown is the arithmetic function of IP that best fits the base metals price index
% pa
RBA base metal price index (in SDRs) OECD Industrial Production*
While the rise of industrialising Asia provides a strong base for commodities in the longer run, they like other cyclical assets do carry significant short-run market risk. First, history suggests that the global slowdown projected by the IMF for 2008 will see a steeper slowdown in industrial production (IP) growth, which is closely correlated with commodity price movements (refer figure above), especially those for Australian metal exports. Second, some analysts argue that the recent surge has lifted commodity prices well beyond what can be supported by economic fundamentals, as speculators buy into commodities as a hedge against inflation and the depreciating US$, and low US interest rate policy reduces the financial cost of holding them. After the “dot-com” boom, and the securitised housing debt boom, the “next big thing” today is commodities.
Australia is highly geared to the commodity cycle. If commodity prices fell, this could reverse gains in Australia’s terms of trade, weaken the exchange rate, and erode real household incomes.
Budget Statement 2008-09 9 - 19

Strong domestic demand After 16 years of continuous expansion, and now boosted by the resources boom, capacity constraints in the Australian economy have begun to tighten and inflation has begun to lift. Inflation moved well above the top of the 2–3 per cent RBA target range in the March quarter 2008. In its May 2008 Statement on Monetary Policy the RBA projected inflation will remain above the target band for the next two years.
This Budget forecasts a substantial slowdown in national domestic demand and employment and no increase in wage pressures in 2008-09. On that basis, inflation is projected to ease back to the top of the RBA target band by the end of the financial year, allowing monetary policy to remain on hold. Moderation in interest rates is crucial to the resumption of housing investment growth in NSW, and to the maintenance of NSW consumer spending.
Strong domestic demand and tight capacity constraints (and tight global markets for food and energy) contributed to a sharp rise in inflationary pressures during 2007-08, and a response from monetary policy. To date these pressures have mainly been contained within the rapidly expanding resources and infrastructure sectors. These pressures could gain momentum, however, if changed inflationary expectations began to influence general wage settlements. There is a risk that national domestic demand might again exceed expectations due to a faster than anticipated recovery in world growth, further terms of trade gains or a step-up in wage pressures. In that case, a further monetary policy response would be almost inevitable.
Two risks are operating in tandem. On one side, excess demand could strain against available capacity, particularly during the first half of 2008-09 before the full weight of previous monetary policy tightening takes effect. This could trigger an early monetary response, possibly in the first six months of the financial year. On the other side, recent large CPI increases could gradually become entrenched in expectations of labour and business decision-makers. Evidence might be slow to emerge, leading to gradually rising pressure on wages and prices. This could trigger a delayed monetary response, possibly in the second half of 2008-09.
9 - 20 Budget Statement 2008-09
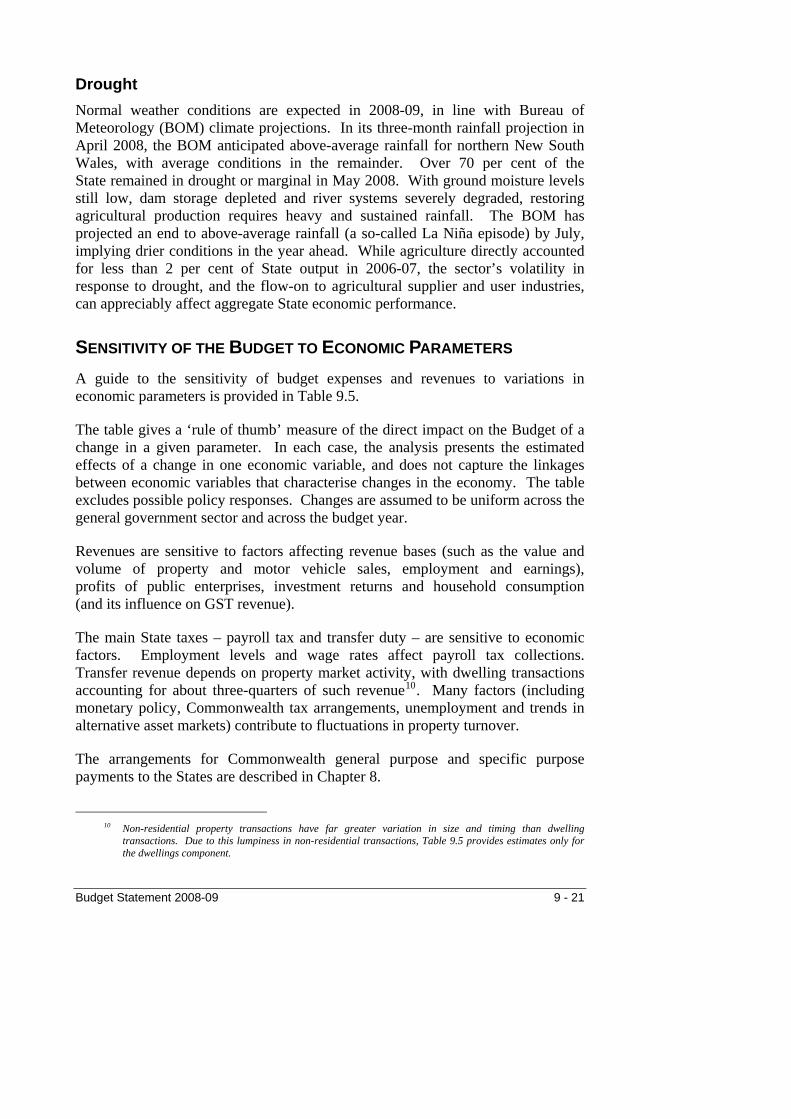
Drought Normal weather conditions are expected in 2008-09, in line with Bureau of Meteorology (BOM) climate projections. In its three-month rainfall projection in April 2008, the BOM anticipated above-average rainfall for northern New South Wales, with average conditions in the remainder. Over 70 per cent of the State remained in drought or marginal in May 2008. With ground moisture levels still low, dam storage depleted and river systems severely degraded, restoring agricultural production requires heavy and sustained rainfall. The BOM has projected an end to above-average rainfall (a so-called La Niña episode) by July, implying drier conditions in the year ahead. While agriculture directly accounted for less than 2 per cent of State output in 2006-07, the sector’s volatility in response to drought, and the flow-on to agricultural supplier and user industries, can appreciably affect aggregate State economic performance.
SENSITIVITY OF THE BUDGET TO ECONOMIC PARAMETERS A guide to the sensitivity of budget expenses and revenues to variations in economic parameters is provided in Table 9.5.
The table gives a ‘rule of thumb’ measure of the direct impact on the Budget of a change in a given parameter. In each case, the analysis presents the estimated effects of a change in one economic variable, and does not capture the linkages between economic variables that characterise changes in the economy. The table excludes possible policy responses. Changes are assumed to be uniform across the general government sector and across the budget year.
Revenues are sensitive to factors affecting revenue bases (such as the value and volume of property and motor vehicle sales, employment and earnings), profits of public enterprises, investment returns and household consumption (and its influence on GST revenue).
The main State taxes – payroll tax and transfer duty – are sensitive to economic factors. Employment levels and wage rates affect payroll tax collections. Transfer revenue depends on property market activity, with dwelling transactions accounting for about three-quarters of such revenue10. Many factors (including monetary policy, Commonwealth tax arrangements, unemployment and trends in alternative asset markets) contribute to fluctuations in property turnover.
The arrangements for Commonwealth general purpose and specific purpose payments to the States are described in Chapter 8.
10 Non-residential property transactions have far greater variation in size and timing than dwelling
transactions. Due to this lumpiness in non-residential transactions, Table 9.5 provides estimates only for the dwellings component.
Budget Statement 2008-09 9 - 21
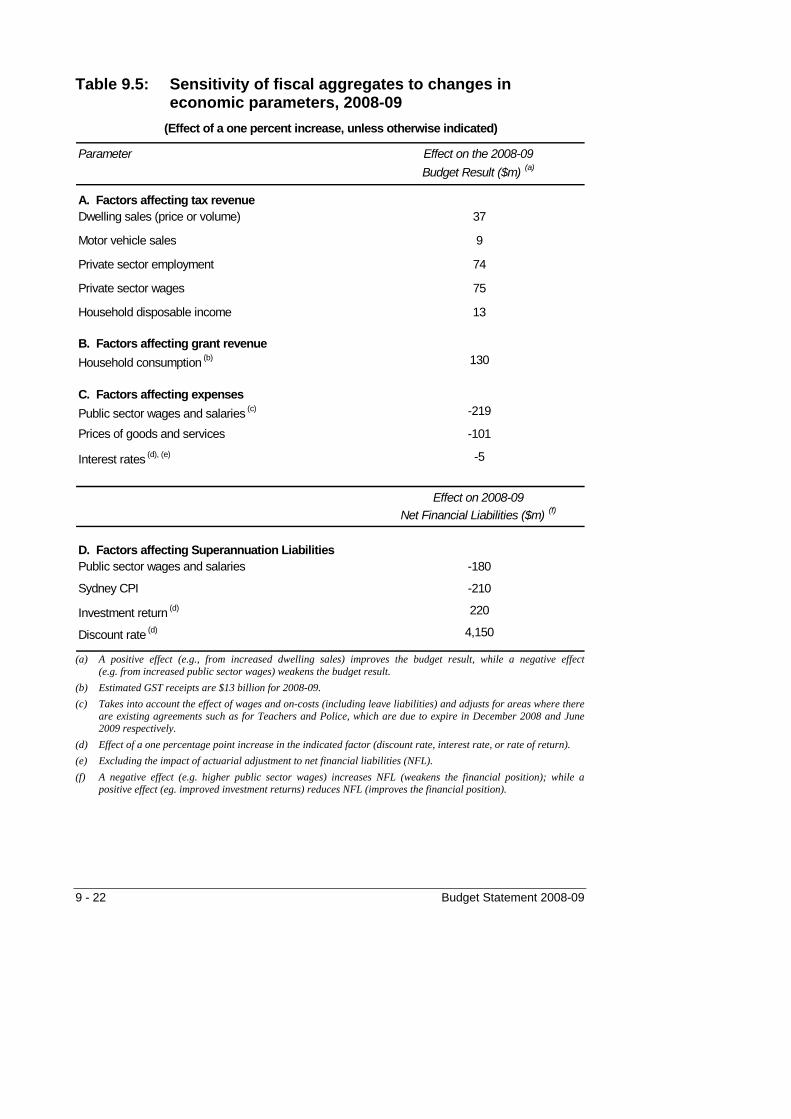
Table 9.5: Sensitivity of fiscal aggregates to changes in economic parameters, 2008-09
Effect on the 2008-09Budget Result ($m) (a)
A. Factors affecting tax revenueDwelling sales (price or volume) 37
Motor vehicle sales 9
Private sector employment 74
Private sector wages 75
Household disposable income 13
B. Factors affecting grant revenueHousehold consumption (b) 130
C. Factors affecting expensesPublic sector wages and salaries (c) -219
Prices of goods and services -101
Interest rates (d), (e) -5
Effect on 2008-09Net Financial Liabilities ($m) (f)
D. Factors affecting Superannuation Liabilities Public sector wages and salaries -180
Sydney CPI -210
Investment return (d) 220
Discount rate (d) 4,150
(Effect of a one percent increase, unless otherwise indicated)
Parameter
(a) A positive effect (e.g., from increased dwelling sales) improves the budget result, while a negative effect (e.g. from increased public sector wages) weakens the budget result.
(b) Estimated GST receipts are $13 billion for 2008-09. (c) Takes into account the effect of wages and on-costs (including leave liabilities) and adjusts for areas where there
are existing agreements such as for Teachers and Police, which are due to expire in December 2008 and June 2009 respectively.
(d) Effect of a one percentage point increase in the indicated factor (discount rate, interest rate, or rate of return). (e) Excluding the impact of actuarial adjustment to net financial liabilities (NFL). (f) A negative effect (e.g. higher public sector wages) increases NFL (weakens the financial position); while a
positive effect (eg. improved investment returns) reduces NFL (improves the financial position).
9 - 22 Budget Statement 2008-09
Expenses are less sensitive than revenues to economic parameters. Expenses are significantly affected by public sector wage outcomes and to a lesser extent by changes in the prices of goods and services purchased by government. Lower levels of general government net debt have greatly reduced the budget’s exposure to interest rate fluctuations. The maturity profile of the State’s debt portfolio, moreover, limits the immediate impact of interest rate rises.
Net financial liabilities can be affected by accounting adjustments as well as operating results. With the introduction of the new Australian Equivalents to International Financial Reporting Standards (AEIFRS) accounting standard AASB119, superannuation liabilities must be recalculated at the end of each year using a market-determined discount rate. This can lead to significant fluctuations in the general government sector’s unfunded liability position.
Budget Statement 2008-09 9 - 23
CHAPTER 10: UNIFORM FINANCIAL REPORTING
♦ Financial aggregates are prepared on an accrual basis in accordance with a revised Uniform Presentation Framework (UPF) endorsed by the Australian Loan Council.
♦ The UPF tables are no longer on a pure Government Finance Statistics (GFS) basis.
♦ The UPF tables have been prepared for the first time in accordance with Australian Accounting Standard AASB 1049 Whole of Government and General Government Sector Financial Reporting. This standard adopts a harmonised GFS-GAAP reporting basis.
♦ A time series is provided from 2002-03 to 2011-12 for the general government, public trading enterprise and consolidated sectors.
10.1 INTRODUCTION
This chapter presents financial aggregates for the general government and public trading enterprise (PTE) sectors according to the revised Uniform Presentation Framework (UPF) agreed by the Australian Loan Council in March 2008.
The Australian Loan Council includes each state and territory Treasurer and the Commonwealth Treasurer. It monitors state finances, particularly the forecast cash surplus/(deficit) of Governments and their future financing/investing requirements. Accordingly, the objective of the UPF is to “facilitate a better understanding of individual Government’s budget papers and provide for more meaningful comparisons of each Government’s financial results and projections”1.
The Australian Loan Council has amended the UPF to adopt a harmonised GFS-GAAP reporting basis. The new framework is effective from the 2008-09 Budget. As such, the format of the aggregates is based on reporting standards set out by the Australian Accounting Standards Board – AASB1049 Whole of Government and General Government Financial Reporting.
1 Uniform Presentation Framework: For the Presentation of Uniform Financial Information by
Commonwealth, State and Territory Governments, Australian Loan Council, April 2008, p. 1.
Budget Statement 2008-09 10 - 1

Previously the UPF was presented on a Government Finance Statistics (GFS) basis. The main differences in reporting on a AASB1049 basis compared with a GFS basis are outlined in this chapter within the section headed Primary Financial Statements.
The UPF financial aggregates serve a number of purposes including:
♦
♦
♦
♦
♦
♦
allowing comparisons between the financial position of Australian Governments on a consistent basis
facilitating time series comparisons since they are relatively unaffected by changes in public sector administrative structures and
permitting an assessment of the impact of NSW public sector transactions on the economy by providing data classified by economic type.
The general government tables in this chapter are consistent with those reported in Chapter 1 but are repeated here for completeness.
10.2 UNIFORM PRESENTATION FRAMEWORK
The chapter provides the financial reports for the NSW Government to meet Loan Council obligations under the UPF2. Additional information is also provided to explain matters specific to New South Wales.
KEY CHANGES The UPF Tables are no longer prepared on a pure GFS basis but presented in accordance with AASB1049. In developing the standard, the Australian Accounting Standards Board:
adopted generally accepted accounting principles (GAAP) definitions, including recognition and measurement principles in almost all cases
amended presentation requirements to encompass a comprehensive result that retains the GAAP classification system but overlays it with a transactions and other economic flows classification system based on GFS and
expanded the disclosure requirements to incorporate key fiscal aggregates required by GFS.
2 The complete UPF manual is available on the Australian Treasury website www.treasury.gov.au.
Extracts from the manual are included in this chapter to explain key concepts while the glossary to this budget paper also includes key UPF terms.
10 - 2 Budget Statement 2008-09
There remain some convergence differences between GFS and GAAP financial aggregates. For this reason, GFS publications released by the Australian Bureau of Statistics for 2008-09, and in future, will differ from UPF aggregates. The differences are not generally material in size for New South Wales, aside from the impact on the timing of the recognition of a $960 million road grant made to New South Wales in June 2006 under the Australian Road Transport grants program. Further information on other convergence differences is outlined in this chapter under the narrative for each of the primary statements. Details and amounts for the key convergence differences will be published in notes to the 2008-09 Outcomes Report.
In aligning the UPF with AASB 1049, there have been a number of key reporting changes.
Net worth Net worth for the public non-financial corporations (PNFC) and public financial corporations (PFC) sectors is now defined to be assets less liabilities3. Under the previous UPF, net worth for these sectors was defined as assets less both liabilities and shares and other contributed capital. In addition, recognition and measurement of assets and liabilities now follow GAAP and include items not previously recognised under the UPF, such as provisions for doubtful debts.
Cash surplus/(deficit) The cash surplus/(deficit) calculation for all sectors is now defined to exclude assets acquired under finance leases, although a new table is included to reconcile to the ABS GFS cash surplus by including the finance leases as part of asset acquisitions.
Operating Statement The operating statement combines the net result from transactions (net operating balance) and the impact of other economic flows to calculate the comprehensive result (total change in net worth). Neither other economic flows nor the comprehensive result were reported under the previous GFS based UPF.
3 The ABS also refers to public trading enterprises (PTEs) as the public non-financial corporation or
PNFC sector. Other chapters of this budget paper use the term “PTE”.
Budget Statement 2008-09 10 - 3
Historical series The shift from GFS to GAAP basis of reporting has resulted in a change in the recognition and measurement of fiscal aggregates. To ensure a consistent historical series of fiscal aggregates, all jurisdictions have agreed to back-cast these recognition and measurement differences for any published historical data on a best endeavours basis. The budget column has also been restated consistent with AASB 1049 principles.
In addition, there is a break in the UPF time series. From 2005-06, the underlying information has been recognised in accordance with Australian Equivalents to International Financial Reporting Standards (AEIFRS). The area significantly affected by the introduction of AEIFRS was the value of defined benefits superannuation liabilities. These liabilities grew as a result of a change in the liability discount rate from the long-term earnings rate, to a 30 June long-term government bond rate.
This break in the UPF series between 2004-05 and 2005-06 resulting from AEIFRS is denoted by a vertical dotted line in all relevant tables in this chapter.
New disclosures The Loan Council has agreed that jurisdictions must also provide the following additional information as part of UPF:
Tables detailing grant revenue and expenses (Table 10.14). ♦
♦
♦
Estimates of net financial liabilities. Net financial liabilities comprise total liabilities less financial assets, excluding equity investments in the other sectors of the government. For the general government sector, this excludes the Government’s investments in the PNFC/PFC sectors. For the PNFC and PFC sectors, net financial liabilities is equal to negative net financial worth.
A table detailing dividends and income tax equivalents paid to the general government sector (Table 10.15). The table separately records dividend and income tax equivalent income of the general government sector from the PNFC and PFC sectors along with other dividends. Other dividends for New South Wales are mainly from the State’s share in Snowy Hydro Limited.
10 - 4 Budget Statement 2008-09

FISCAL MEASURES UPF reporting provides a number of measures for evaluating the soundness of a Government’s fiscal position and the effect of fiscal policy on economic conditions. The fiscal measures in the UPF framework are:
net operating balance ♦
♦
♦
♦
♦
♦
♦
♦
♦
net lending/borrowing (fiscal balance)
change in net worth (comprehensive result)
net worth
net debt
net financial worth
net financial liabilities
cash surplus/(deficit) and
ABS GFS cash surplus/(deficit).
Definitions of these measures are contained in the glossary to this budget paper.
Flow measures (net operating balance, net lending/borrowing and change in net worth) show changes in the fiscal position during the reporting period, reflecting the impact of government decisions and actions, and re-measurement impacts during that time. Flows represent the creation, transformation, exchange, transfer or extinction of economic value.
Stock measures (net worth, net debt, net financial worth and net financial liabilities) highlight the fiscal position of a government at a point in time, providing information on the results of past decisions.
New South Wales reports in its balance sheets and cash flow statements underlying net debt and underlying cash results respectively, to remove the distortionary impact of the operations of the General Government Liability Management Fund. These adjustments occur across the period 2002-03 to 2006-07.
Budget Statement 2008-09 10 - 5
PRIMARY FINANCIAL STATEMENTS
UPF presentation Details of public sector estimates and outcomes are presented on an accrual basis within three primary statements: the operating statement, including other economic flows; the balance sheet; and the cash flow statement. Appendix B presents the underlying accounting principles and policies adopted by New South Wales. The following statements, along with the Loan Council Allocation statement, form the core reporting requirements of the UPF.
Operating Statement The operating statement presents information on transactions (revenue and expenses) and other economic flows (revaluations and adjustments). This statement is designed to capture the composition of revenues and expenses and the net cost of government activities within a fiscal year. It shows the full cost of resources consumed by the Government in achieving its objectives, and how these costs are met from various revenue sources.
The operating statement reports three major fiscal measures — the net operating balance, net lending/borrowing (also known as fiscal balance) and the total change in net worth (comprehensive result). The net operating balance is calculated as revenue minus expenses, while net lending (fiscal balance) includes net capital expenditure but excludes depreciation, thereby giving a better measure of a jurisdiction’s call on financial markets. New South Wales recognises its headline budget result as the net operating balance for the general government sector.
Under the previous UPF, differences arose between the GFS and GAAP operating statement. However, AASB 1049 combines the operating statement and statement of changes in equity into a single format separating transactions and other economic flows according to GFS principles.
The main convergence differences in treatment between the GFS operating statement and the harmonised AASB 1049 operating statement presented in this revised UPF are:
The harmonised aggregates exclude selected transfer payment revenues and expenses that pass through the State’s bank accounts. The ABS requires such payments to be grossed up in GFS reports. However, they are excluded from the AASB 1049 UPF reports as the NSW Government has no control over them. (However, information on the gross value of these grants has been footnoted in the grants revenue and expense table to assist users).
♦
10 - 6 Budget Statement 2008-09

Grants are recognised when the State gains control over the assets. Control is normally obtained when the cash is received. A grant of $960 million was received from the Commonwealth Government in late June 2006 dedicated for road works to be carried out over several years. This revenue is recognised in 2005-06 when the cash was received. However, in previous budget papers this revenue was recognised to match the timing of expenditure. This treatment was in accordance with a direction issued by the ABS.
♦
♦
♦
♦
Dividends from the PNFC and PFC sectors are recognised as an expense in GFS (in the PNFC and PFC sector operating statements), whereas they are treated as an equity transaction for AASB 1049.
Balance Sheet The balance sheet records the value of financial and non-financial assets and liabilities of governments, as at the end of each financial year. It provides the user with information on the resources at the government’s disposal and the type and valuation of its liabilities.
The balance sheet also includes information on the make-up of a government’s financial assets, on its holdings of fixed assets, and on the extent of liabilities such as borrowing and unfunded superannuation. This allows for intertemporal and interjurisdictional comparisons of asset and liability levels.
The fiscal aggregates in the balance sheet include net worth, net financial worth and net debt. A new fiscal aggregate, net financial liabilities is also required by the UPF. This aggregate was not required by the previous UPF.
The main convergence differences in treatment between the GFS balance sheet and the harmonised AASB 1049 balance sheet presented in this revised UPF are:
Allowance for doubtful debts is recognised and reported in the UPF balance sheet, but is excluded from the GFS balance sheet, as GFS does not recognise that an economic event has occurred.
The GFS balance sheets for June 2006 through to June 2009 include a liability for deferred income in relation to a direction from the ABS to accrue a specific Australian road transport grant of $960 million for GFS reporting purposes. No liability is recognised in the harmonised balance sheet as the revenue was recognised fully upon receipt in 2005-06, in accordance with accounting standards.
Budget Statement 2008-09 10 - 7
GFS balance sheets exclude deferred tax assets and deferred tax liabilities, whereas they are reported in accounting balance sheets. The convergence difference only affects GGS, PNFC and PFC sector balance sheets, as the assets and liabilities are eliminated for the consolidated NFPS and Total Public Sector balance sheets.
♦
♦
♦
♦
The net financial worth and net financial liabilities aggregates are affected by the differing treatments for prepayments. Prepayments are treated in GFS as a receivable (financial asset), whereas in the UPF they are classified as a non-financial asset as required by AASB 1049. However, as this is merely a classification difference, it does not impact net debt and net worth aggregates.
GFS net debt for the general government sector will always be lower than (AASB 1049) net debt, as the ABS require that certain equity investments (in multi-jurisdictional agencies) be reclassified for GFS purposes from equity investments to advances, thereby reducing the value of GFS net debt. However, as this is merely a classification difference, it does not impact net financial liabilities and net worth aggregates.
By definition, GFS net worth, for the PNFC and PFC sectors will always be zero as owner’s equity is classified as equivalent to a liability. However, under the UPF, liabilities exclude owner’s equity.
Cash Flow Statement The cash flow statement records a government’s cash inflows and outflows, allocated between various activities, and their net impact on cash held. The cash flow statement reveals how a government obtains and expends cash.
This statement requires cash flows to be categorised into operating, investing and financing activities. Operating activities are those which relate to the collection of taxes, the distribution of grants, and the provision of goods and services. Investing activities are those which relate to the acquisition and disposal of financial and non-financial assets. Financing activities are those which relate to changing the size and composition of a government’s financial structure.
The signing convention within the cash flow statement is that all inflows carry a positive sign and all outflows carry a negative sign (regardless of whether they are gross or net cash flows).
The cash flow statement reports two fiscal measures, net increase in cash held and cash surplus/(deficit). Net increase in cash held is the sum of net cash flows from all operating, investing and financing activities. The cash surplus/(deficit) comprises only net cash from operating activities, plus sales and less purchases of non-financial assets (less dividends paid for the PNFC and PFC sectors).
10 - 8 Budget Statement 2008-09

Under the previous UPF, the cash flow statement included the ABS GFS cash surplus/(deficit). This fiscal aggregate is still required by the UPF in a separate table following the cash flow statement. The ABS GFS cash surplus/(deficit) is obtained by deducting finance leases from the AASB 1049 cash surplus/(deficit) for all sectors.
The exclusion of non-cash finance leases is the only difference between the GFS cash result and the AASB 1049 result.
New South Wales uses the new AASB 1049 cash result (excluding the impact of finance leases) as its headline cash result.
Institutional sectors Appendix C lists the New South Wales controlled entities, and the institutional sectors to which they have been classified. The controlled entities have been classified according to their government sector, which are defined in the ABS GFS manual.
Budget Statement 2008-09 10 - 9

10 - 10 Budget Statement 2008-09
10.3 UNIFORM PRESENTATION TABLES
The following UPF tables are presented in the sequence of operating statements, balance sheets and cash flow statements which are dissected by economic type.
In addition to the UPF minimum disclosure requirements, these reports also include a historical and forward year time series.
This is followed by tables of general government:
♦
♦
♦
♦
♦
tax revenues by type
grants revenues and expense
dividend and income tax equivalent income
total expenses by function and
purchases of non-financial assets by function.
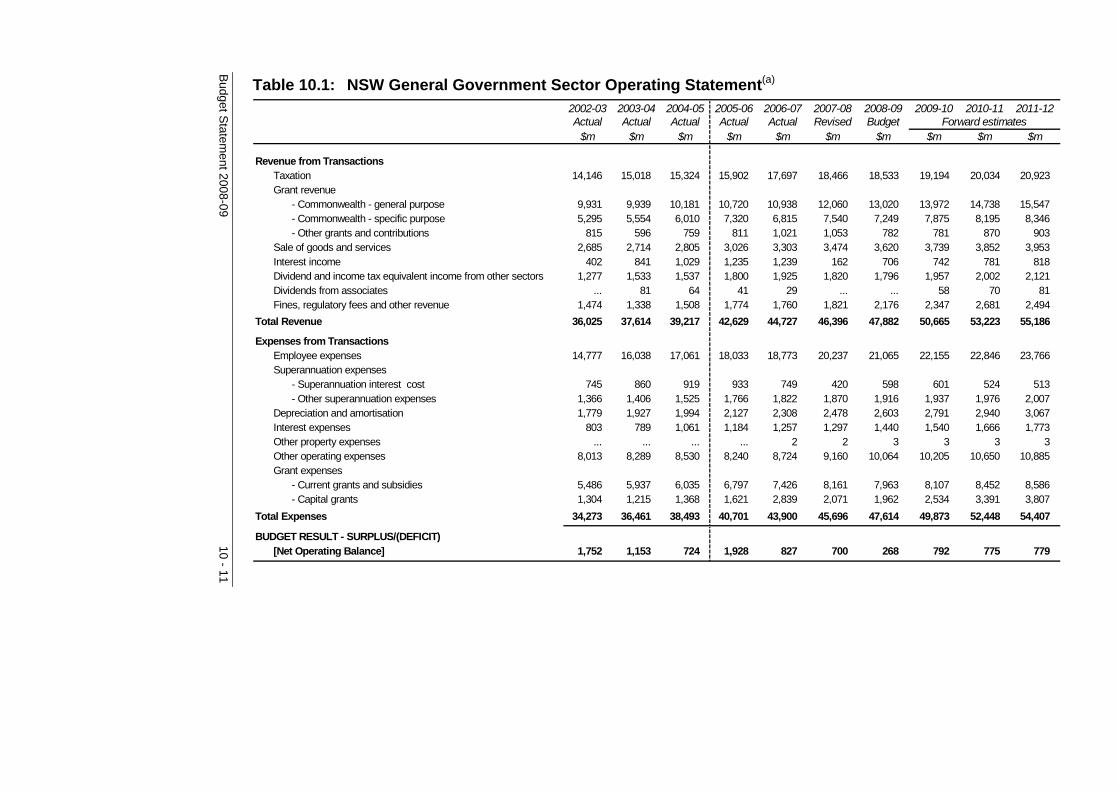
Budg
et Statem
ent 2008-09 10 - 11
Table 10.1: NSW General Government Sector Operating Statement(a) 2002-03 2003-04 2004-05 2005-06 2006-07 2007-08 2008-09 2009-10 2010-11 2011-12Actual Actual Actual Actual Actual Revised Budget
$m $m $m $m $m $m $m $m $m $m
Revenue from TransactionsTaxation 14,146 15,018 15,324 15,902 17,697 18,466 18,533 19,194 20,034 20,923 Grant revenue
- Commonwealth - general purpose 9,931 9,939 10,181 10,720 10,938 12,060 13,020 13,972 14,738 15,547 - Commonwealth - specific purpose 5,295 5,554 6,010 7,320 6,815 7,540 7,249 7,875 8,195 8,346 - Other grants and contributions 815 596 759 811 1,021 1,053 782 781 870 903
Sale of goods and services 2,685 2,714 2,805 3,026 3,303 3,474 3,620 3,739 3,852 3,953 Interest income 402 841 1,029 1,235 1,239 162 706 742 781 818 Dividend and income tax equivalent income from other sectors 1,277 1,533 1,537 1,800 1,925 1,820 1,796 1,957 2,002 2,121 Dividends from associates ... 81 64 41 29 ... ... 58 70 81 Fines, regulatory fees and other revenue 1,474 1,338 1,508 1,774 1,760 1,821 2,176 2,347 2,681 2,494
Total Revenue 36,025 37,614 39,217 42,629 44,727 46,396 47,882 50,665 53,223 55,186
Expenses from TransactionsEmployee expenses 14,777 16,038 17,061 18,033 18,773 20,237 21,065 22,155 22,846 23,766 Superannuation expenses
- Superannuation interest cost 745 860 919 933 749 420 598 601 524 513 - Other superannuation expenses 1,366 1,406 1,525 1,766 1,822 1,870 1,916 1,937 1,976 2,007
Depreciation and amortisation 1,779 1,927 1,994 2,127 2,308 2,478 2,603 2,791 2,940 3,067 Interest expenses 803 789 1,061 1,184 1,257 1,297 1,440 1,540 1,666 1,773 Other property expenses ... ... ... ... 2 2 3 3 3 3 Other operating expenses 8,013 8,289 8,530 8,240 8,724 9,160 10,064 10,205 10,650 10,885 Grant expenses
- Current grants and subsidies 5,486 5,937 6,035 6,797 7,426 8,161 7,963 8,107 8,452 8,586 - Capital grants 1,304 1,215 1,368 1,621 2,839 2,071 1,962 2,534 3,391 3,807
Total Expenses 34,273 36,461 38,493 40,701 43,900 45,696 47,614 49,873 52,448 54,407
BUDGET RESULT - SURPLUS/(DEFICIT)[Net Operating Balance] 1,752 1,153 724 1,928 827 700 268 792 775 779
Forward estimates
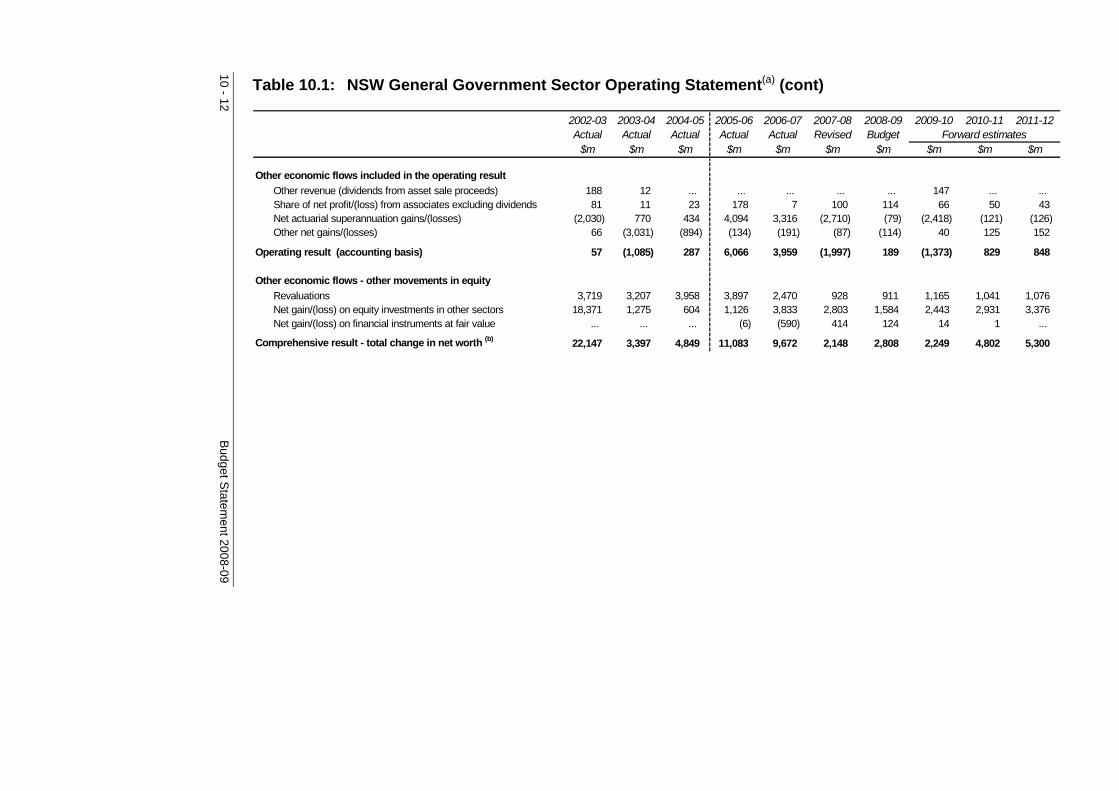
10 - 12
B
udget Statem
ent 2008-09
Table 10.1: NSW General Government Sector Operating Statement(a) (cont)
2002-03 2003-04 2004-05 2005-06 2006-07 2007-08 2008-09 2009-10 2010-11 2011-12Actual Actual Actual Actual Actual Revised Budget
$m $m $m $m $m $m $m $m $m $m
Other economic flows included in the operating resultOther revenue (dividends from asset sale proceeds) 188 12 ... ... ... ... ... 147 ... ... Share of net profit/(loss) from associates excluding dividends 81 11 23 178 7 100 114 66 50 43 Net actuarial superannuation gains/(losses) (2,030) 770 434 4,094 3,316 (2,710) (79) (2,418) (121) (126) Other net gains/(losses) 66 (3,031) (894) (134) (191) (87) (114) 40 125 152
Operating result (accounting basis) 57 (1,085) 287 6,066 3,959 (1,997) 189 (1,373) 829 848
Other economic flows - other movements in equityRevaluations 3,719 3,207 3,958 3,897 2,470 928 911 1,165 1,041 1,076 Net gain/(loss) on equity investments in other sectors 18,371 1,275 604 1,126 3,833 2,803 1,584 2,443 2,931 3,376 Net gain/(loss) on financial instruments at fair value ... ... ... (6) (590) 414 124 14 1 ...
Comprehensive result - total change in net worth (b) 22,147 3,397 4,849 11,083 9,672 2,148 2,808 2,249 4,802 5,300
Forward estimates

Budg
et Statem
ent 2008-09 10 - 13
Table 10.1: NSW General Government Sector Operating Statement(a) (cont)
2002-03 2003-04 2004-05 2005-06 2006-07 2007-08 2008-09 2009-10 2010-11 2011-12Actual Actual Actual Actual Actual Revised Budget
$m $m $m $m $m $m $m $m $m $m
KEY FISCAL AGGREGATESComprehensive result - total change in net worth (b) 22,147 3,397 4,849 11,083 9,672 2,148 2,808 2,249 4,802 5,300
Less: Net other economic flows 20,395 2,244 4,125 9,155 8,845 1,448 2,540 1,457 4,027 4,521 equals: Budget Result - net operating balance 1,752 1,153 724 1,928 827 700 268 792 775 779 less Net acquisition of non-financial assets
Purchase of non-financial assets 3,004 3,019 3,144 3,869 4,140 4,541 5,158 5,227 5,182 4,847 Sales of non-financial assets (366) (406) (491) (396) (499) (527) (594) (632) (685) (657) less Depreciation (1,779) (1,927) (1,994) (2,127) (2,308) (2,478) (2,603) (2,791) (2,940) (3,067) plus Change in inventories 4 21 (26) 6 36 4 (2) 12 2 (2) plus Other movements in non-financial assets
- assets acquired utilising finance leases 345 312 187 80 132 324 319 125 293 129 - other 83 93 82 65 346 246 15 141 (111) 140
equals Total Net acquisition of non-financial assets 1,291 1,112 902 1,497 1,847 2,110 2,293 2,082 1,741 1,390
equals Net Lending/(Borrowing) [Fiscal Balance] 461 41 (178) 431 (1,020) (1,410) (2,025) (1,290) (966) (611)
OTHER AGGREGATESCapital Expenditure (c) 3,349 3,331 3,331 3,949 4,272 4,865 5,477 5,352 5,475 4,976
Forward estimates
Notes:
(a) AASB 1049 has been adopted for the first time for the 2008-09 Budget. Amounts prior to 2008-09 have been classified according to the new standard, where practicable. However, where some historic dissections have not been available, and particularly for the pre-AEIFRS period prior to 2005-06, the financial information has been reported on a best endeavours basis. Data for 2005-06 and forward years has been recognised and measured in accordance with Australian Equivalents to International Financial Reporting Standards (AEIFRS). Prior to 2005-06, transactions were recorded in accordance with pre-AEIFRS Australian Accounting Standards.
(b) ‘Total change in net worth’ is before transactions with owners as owners and before revisions to accounting policies. The actual movement in balance sheet net worth may therefore differ.
(c) Capital expenditure comprises purchases of non-financial assets plus assets acquired utilising finance leases.
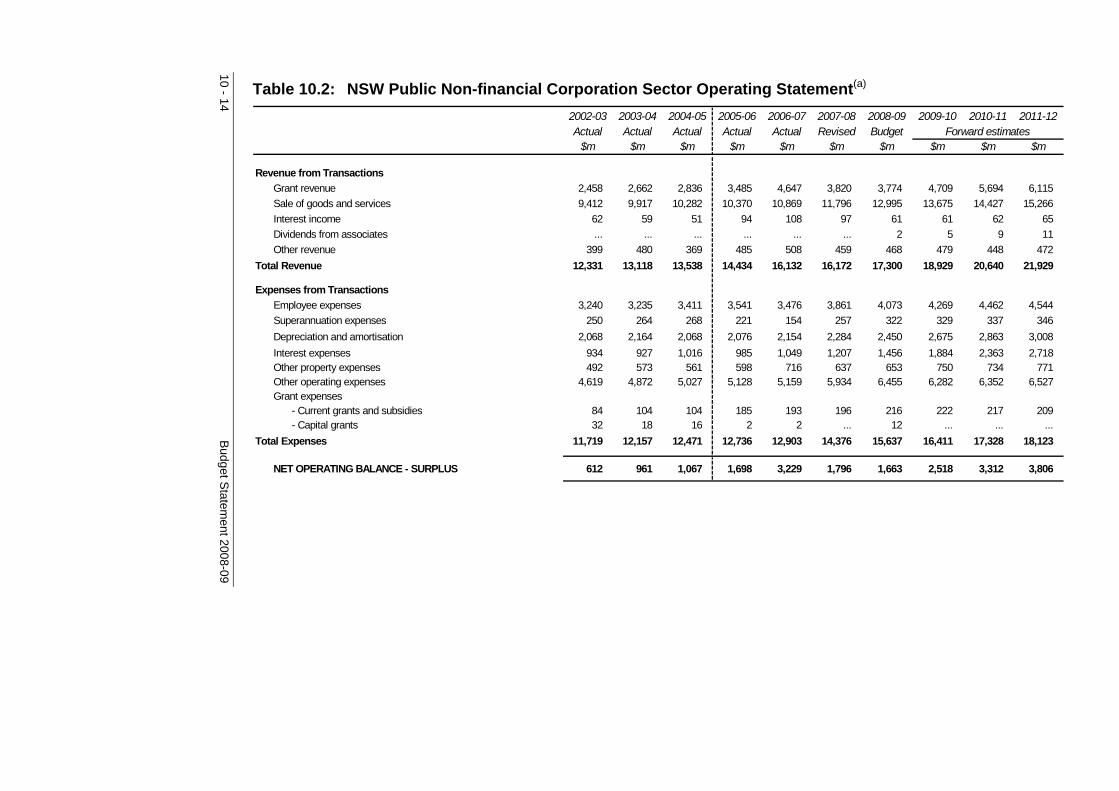
10 - 14
B
udget Statem
ent 2008-09
Table 10.2: NSW Public Non-financial Corporation Sector Operating Statement(a) 2002-03 2003-04 2004-05 2005-06 2006-07 2007-08 2008-09 2009-10 2010-11 2011-12Actual Actual Actual Actual Actual Revised Budget
$m $m $m $m $m $m $m $m $m $m
Revenue from TransactionsGrant revenue 2,458 2,662 2,836 3,485 4,647 3,820 3,774 4,709 5,694 6,115 Sale of goods and services 9,412 9,917 10,282 10,370 10,869 11,796 12,995 13,675 14,427 15,266 Interest income 62 59 51 94 108 97 61 61 62 65 Dividends from associates ... ... ... ... ... ... 2 5 9 11 Other revenue 399 480 369 485 508 459 468 479 448 472
Total Revenue 12,331 13,118 13,538 14,434 16,132 16,172 17,300 18,929 20,640 21,929
Expenses from TransactionsEmployee expenses 3,240 3,235 3,411 3,541 3,476 3,861 4,073 4,269 4,462 4,544 Superannuation expenses 250 264 268 221 154 257 322 329 337 346 Depreciation and amortisation 2,068 2,164 2,068 2,076 2,154 2,284 2,450 2,675 2,863 3,008 Interest expenses 934 927 1,016 985 1,049 1,207 1,456 1,884 2,363 2,718 Other property expenses 492 573 561 598 716 637 653 750 734 771 Other operating expenses 4,619 4,872 5,027 5,128 5,159 5,934 6,455 6,282 6,352 6,527 Grant expenses
- Current grants and subsidies 84 104 104 185 193 196 216 222 217 209 - Capital grants 32 18 16 2 2 ... 12 ... ... ...
Total Expenses 11,719 12,157 12,471 12,736 12,903 14,376 15,637 16,411 17,328 18,123
NET OPERATING BALANCE - SURPLUS 612 961 1,067 1,698 3,229 1,796 1,663 2,518 3,312 3,806
Forward estimates
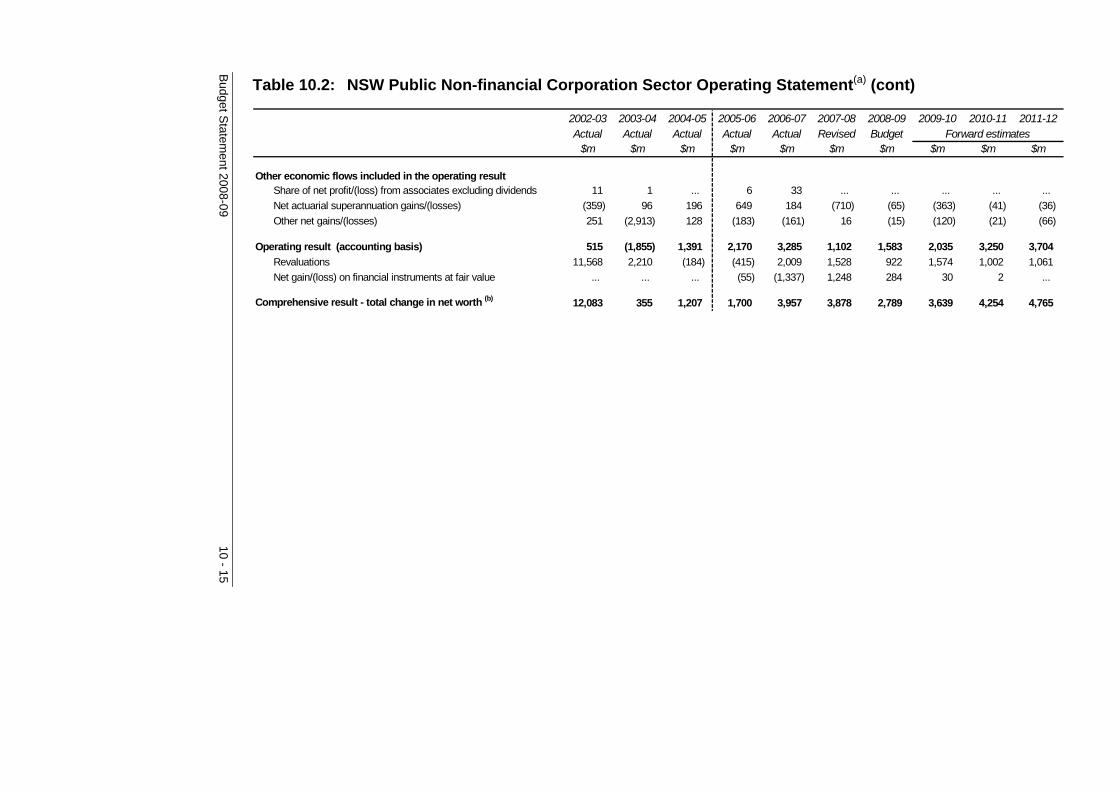
Budg
et Statem
ent 2008-09 10 - 15
Table 10.2: NSW Public Non-financial Corporation Sector Operating Statement(a) (cont)
2002-03 2003-04 2004-05 2005-06 2006-07 2007-08 2008-09 2009-10 2010-11 2011-12Actual Actual Actual Actual Actual Revised Budget
$m $m $m $m $m $m $m $m $m $m
Other economic flows included in the operating resultShare of net profit/(loss) from associates excluding dividends 11 1 ... 6 33 ... ... ... ... ... Net actuarial superannuation gains/(losses) (359) 96 196 649 184 (710) (65) (363) (41) (36) Other net gains/(losses) 251 (2,913) 128 (183) (161) 16 (15) (120) (21) (66)
Operating result (accounting basis) 515 (1,855) 1,391 2,170 3,285 1,102 1,583 2,035 3,250 3,704 Revaluations 11,568 2,210 (184) (415) 2,009 1,528 922 1,574 1,002 1,061 Net gain/(loss) on financial instruments at fair value ... ... ... (55) (1,337) 1,248 284 30 2 ...
Comprehensive result - total change in net worth (b) 12,083 355 1,207 1,700 3,957 3,878 2,789 3,639 4,254 4,765
Forward estimates

10 - 16
B
udget Statem
ent 2008-09
Table 10.2: NSW Public Non-financial Corporation Sector Operating Statement(a) (cont) 2002-03 2003-04 2004-05 2005-06 2006-07 2007-08 2008-09 2009-10 2010-11 2011-12Actual Actual Actual Actual Actual Revised Budget
$m $m $m $m $m $m $m $m $m $m
KEY FISCAL AGGREGATESComprehensive result - total change in net worth (b) 12,083 355 1,207 1,700 3,957 3,878 2,789 3,639 4,254 4,765
Less: Net other economic flows 11,471 (606) 140 2 728 2,082 1,126 1,121 942 959
equals: Net operating balance 612 961 1,067 1,698 3,229 1,796 1,663 2,518 3,312 3,806 less Net acquisition of non-financial assets
Purchase of non-financial assets 3,352 3,378 3,655 4,435 5,510 6,479 8,460 8,459 8,629 9,544 Sales of non-financial assets (332) (201) (196) (264) (426) (489) (287) (617) (305) (278) less Depreciation (2,068) (2,165) (2,087) (2,076) (2,155) (2,284) (2,450) (2,675) (2,863) (3,008) plus Change in inventories 47 47 95 (3) 63 70 152 85 (6) (23) plus Other movements in non-financial assets
- assets acquired utilising finance leases ... ... ... ... ... ... ... 307 490 500 - other 119 78 130 148 240 239 260 244 494 258
equals Total Net acquisition of non-financial assets 1,118 1,137 1,597 2,240 3,232 4,015 6,135 5,803 6,439 6,993 equals Net Lending/(Borrowing) [Fiscal Balance] (506) (176) (530) (542) (3) (2,219) (4,472) (3,285) (3,127) (3,187)
OTHER AGGREGATESCapital Expenditure (c) 3,352 3,378 3,655 4,435 5,510 6,479 8,460 8,766 9,119 10,044 Dividends Accrued (d) 752 914 934 1,173 1,162 1,140 1,092 1,153 1,211 1,293
Forward estimates
Notes: (a) AASB 1049 has been adopted for the first time for the 2008-09 Budget. Amounts prior to 2008-09 have been classified according to the new standard, where practicable.
However, where some historic dissections have not been available, and particularly for the pre-AEIFRS period prior to 2005-06, the financial information has been reported on a best endeavours basis. Data for 2005-06 and forward years has been recognised and measured in accordance with Australian Equivalents to International Financial Reporting Standards (AEIFRS). Prior to 2005-06, transactions were recorded in accordance with pre-AEIFRS Australian Accounting Standards.
(b) ‘Total change in net worth’ is before transactions with owners as owners and before revisions to accounting policies. The actual movement in balance sheet net worth may therefore differ.
(c) Capital expenditure comprises purchases of non-financial assets plus assets acquired utilising finance leases. (d) Net borrowing for the PNFC sector excludes the impact of dividends accrued, and so may not fully reflect the sector’s call on the financial markets.
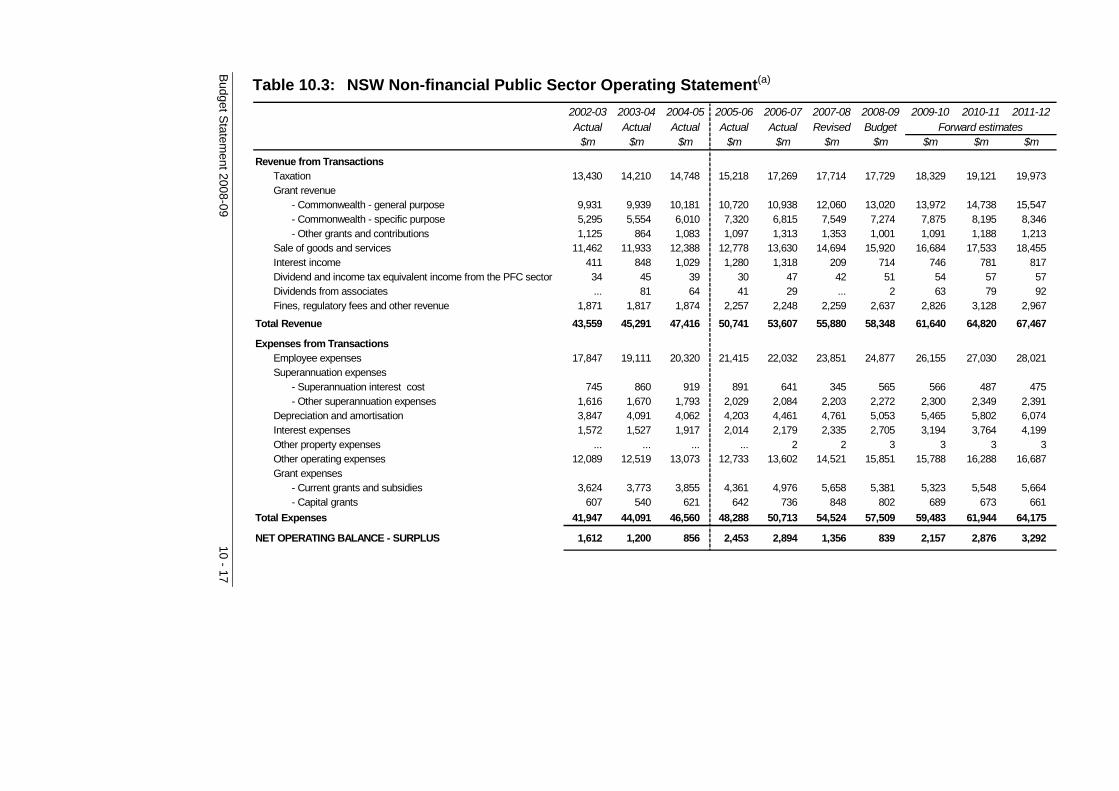
Budg
et Statem
ent 2008-09 10 - 17
Table 10.3: NSW Non-financial Public Sector Operating Statement(a) 2002-03 2003-04 2004-05 2005-06 2006-07 2007-08 2008-09 2009-10 2010-11 2011-12Actual Actual Actual Actual Actual Revised Budget
$m $m $m $m $m $m $m $m $m $m
Revenue from TransactionsTaxation 13,430 14,210 14,748 15,218 17,269 17,714 17,729 18,329 19,121 19,973 Grant revenue
- Commonwealth - general purpose 9,931 9,939 10,181 10,720 10,938 12,060 13,020 13,972 14,738 15,547 - Commonwealth - specific purpose 5,295 5,554 6,010 7,320 6,815 7,549 7,274 7,875 8,195 8,346 - Other grants and contributions 1,125 864 1,083 1,097 1,313 1,353 1,001 1,091 1,188 1,213
Sale of goods and services 11,462 11,933 12,388 12,778 13,630 14,694 15,920 16,684 17,533 18,455 Interest income 411 848 1,029 1,280 1,318 209 714 746 781 817 Dividend and income tax equivalent income from the PFC sector 34 45 39 30 47 42 51 54 57 57 Dividends from associates ... 81 64 41 29 ... 2 63 79 92 Fines, regulatory fees and other revenue 1,871 1,817 1,874 2,257 2,248 2,259 2,637 2,826 3,128 2,967
Total Revenue 43,559 45,291 47,416 50,741 53,607 55,880 58,348 61,640 64,820 67,467
Expenses from TransactionsEmployee expenses 17,847 19,111 20,320 21,415 22,032 23,851 24,877 26,155 27,030 28,021 Superannuation expenses
- Superannuation interest cost 745 860 919 891 641 345 565 566 487 475 - Other superannuation expenses 1,616 1,670 1,793 2,029 2,084 2,203 2,272 2,300 2,349 2,391
Depreciation and amortisation 3,847 4,091 4,062 4,203 4,461 4,761 5,053 5,465 5,802 6,074 Interest expenses 1,572 1,527 1,917 2,014 2,179 2,335 2,705 3,194 3,764 4,199 Other property expenses ... ... ... ... 2 2 3 3 3 3 Other operating expenses 12,089 12,519 13,073 12,733 13,602 14,521 15,851 15,788 16,288 16,687 Grant expenses
- Current grants and subsidies 3,624 3,773 3,855 4,361 4,976 5,658 5,381 5,323 5,548 5,664 - Capital grants 607 540 621 642 736 848 802 689 673 661
Total Expenses 41,947 44,091 46,560 48,288 50,713 54,524 57,509 59,483 61,944 64,175
NET OPERATING BALANCE - SURPLUS 1,612 1,200 856 2,453 2,894 1,356 839 2,157 2,876 3,292
Forward estimates

10 - 18
B
udget Statem
ent 2008-09
Table 10.3: NSW Non-financial Public Sector Operating Statement(a) (cont)
2002-03 2003-04 2004-05 2005-06 2006-07 2007-08 2008-09 2009-10 2010-11 2011-12Actual Actual Actual Actual Actual Revised Budget
$m $m $m $m $m $m $m $m $m $m
Other economic flows included in the operating resultShare of net profit/(loss) from associates excluding dividends 92 12 23 184 41 100 114 66 50 43 Net actuarial superannuation gains/(losses) (2,389) 866 630 4,743 3,500 (3,420) (144) (2,782) (162) (162) Other net gains/(losses) 322 (5,932) (761) (308) (352) (71) (129) 69 104 85
Operating result (accounting basis) (363) (3,854) 748 7,072 6,083 (2,035) 680 (490) 2,868 3,258
Other economic flows - other movements in equityRevaluations 15,286 5,419 3,775 3,482 4,478 2,455 1,834 2,739 2,043 2,138 Net gain/(loss) on equity investments in other sectors (128) (328) (6) 430 653 71 (3) (3) 1 8 Net gain/(loss) on financial instruments at fair value ... ... ... (61) (1,926) 1,663 407 42 2 ...
Comprehensive result - total change in net worth (b) 14,795 1,237 4,517 10,923 9,288 2,154 2,918 2,288 4,914 5,404
Forward estimates

Budg
et Statem
ent 2008-09 10 - 19
Table 10.3: NSW Non-financial Public Sector Operating Statement(a) (cont)
2002-03 2003-04 2004-05 2005-06 2006-07 2007-08 2008-09 2009-10 2010-11 2011-12Actual Actual Actual Actual Actual Revised Budget
$m $m $m $m $m $m $m $m $m $m
KEY FISCAL AGGREGATES
Comprehensive result - total change in net worth (b) 14,795 1,237 4,517 10,923 9,288 2,154 2,918 2,288 4,914 5,404 Less: Net other economic flows 13,183 37 3,661 8,470 6,394 798 2,079 131 2,038 2,112
equals: Net operating balance 1,612 1,200 856 2,453 2,894 1,356 839 2,157 2,876 3,292 less Net acquisition of non-financial assets
Purchase of non-financial assets 6,352 6,394 6,795 8,298 9,644 11,014 13,611 13,679 13,804 14,384 Sales of non-financial assets (698) (607) (686) (660) (926) (1,016) (881) (1,249) (989) (935) less Depreciation (3,847) (4,092) (4,081) (4,203) (4,463) (4,761) (5,053) (5,465) (5,802) (6,074) plus Change in inventories 51 67 70 3 98 74 150 96 (4) (25) plus Other movements in non-financial assets
- assets acquired utilising finance leases 345 311 187 81 132 324 319 432 783 629 - other 203 172 209 212 589 484 275 386 382 398
equals Total Net acquisition of non-financial assets 2,406 2,245 2,494 3,731 5,074 6,119 8,421 7,879 8,174 8,377 equals Net Lending/(Borrowing) [Fiscal Balance] (794) (1,045) (1,638) (1,278) (2,180) (4,763) (7,582) (5,722) (5,298) (5,085)
OTHER AGGREGATESCapital Expenditure (c) 6,697 6,705 6,982 8,379 9,776 11,338 13,930 14,111 14,587 15,013
Forward estimates
Notes: (a) AASB 1049 has been adopted for the first time for the 2008-09 Budget. Amounts prior to 2008-09 have been classified according to the new standard, where practicable.
However, where some historic dissections have not been available, and particularly for the pre-AEIFRS period prior to 2005-06, the financial information has been reported on a best endeavours basis.
Data for 2005-06 and forward years has been recognised and measured in accordance with Australian Equivalents to International Financial Reporting Standards (AEIFRS). Prior to 2005-06, transactions were recorded in accordance with pre-AEIFRS Australian Accounting Standards.
(b) ‘Total change in net worth’ is before transactions with owners as owners and before revisions to accounting policies. The actual movement in balance sheet net worth may therefore differ.
(c) Capital expenditure comprises purchases of non-financial assets plus assets acquired utilising finance leases.

10 - 20
B
udget Statem
ent 2008-09
Table 10.4: NSW General Government Sector Balance Sheet(a) June 2003 June 2004 June 2005 June 2006 June 2007(a) June 2008(a) June 2009(a) June 2010(a) June 2011(a) June 2012(a)
Actual Actual Actual Actual Actual Revised Budget$m $m $m $m $m $m $m $m $m $m
AssetsFinancial assets
Cash and deposits 1,091 1,869 1,465 2,458 2,421 2,451 2,681 2,985 3,371 3,818 Advances paid 1,381 1,337 1,258 837 795 861 908 912 924 922 Investments, loans and placements 7,939 9,573 12,041 13,928 7,165 6,417 7,014 7,517 8,063 8,661 Receivables 5,125 5,589 5,988 9,151 11,193 10,570 10,217 10,515 10,527 10,649 Equity - in other public sector entities 66,112 67,386 67,991 64,206 68,040 70,842 72,426 74,870 77,801 81,177 - accounted for using the equity meth 550 561 583 1,486 1,519 1,619 1,733 1,799 1,849 1,892 - other equity investments 14 11 6 4 4 4 4 4 4 4
Total Financial Assets 82,212 86,326 89,332 92,070 91,137 92,764 94,983 98,602 102,539 107,123
Non-financial assetsLand and fixed assets - Inventories 154 174 149 157 173 177 176 187 189 188 - Property, plant and equipment 78,598 80,015 83,770 88,258 91,599 94,247 97,306 100,215 103,095 105,724 - Investment property (b) (b) (b) 351 312 356 356 356 356 356 - Assets held for sale 177 204 278 231 208 170 133 179 153 106 - Biological assets ... ... ... ... 6 6 6 6 6 6 - Intangibles (produced) (b) (b) (b) 521 545 723 960 1,145 1,193 1,167 Other non-financial assets - Intangibles (non-produced) 7 9 11 12 ... ... ... ... ... ... - Other 1,139 1,278 1,358 1,301 1,587 1,734 1,884 2,040 2,183 2,337
Total Non-financial Assets 80,075 81,680 85,566 90,831 94,430 97,413 100,821 104,128 107,175 109,884
Total Assets 162,287 168,006 174,898 182,901 185,567 190,177 195,804 202,730 209,714 217,007
Forward estimates

Budg
et Statem
ent 2008-09 10 - 21
Table 10.4: NSW General Government Sector Balance Sheet(a) (cont)
June 2003 June 2004 June 2005 June 2006 June 2007(a) June 2008(a) June 2009(a) June 2010(a) June 2011(a) June 2012(a)
Actual Actual Actual Actual Actual Revised Budget$m $m $m $m $m $m $m $m $m $m
LiabilitiesDeposits held 21 28 50 75 92 67 77 76 76 76 Advances received 1,808 1,681 1,641 920 892 865 836 807 778 748 Borrowing 10,163 10,795 11,392 12,035 12,705 13,775 15,881 17,453 18,971 20,386 Superannuation liability (c) 14,720 15,460 16,462 23,129 14,363 17,126 17,389 19,921 20,016 20,024 Other employee benefits 6,440 7,041 7,550 8,116 8,402 8,814 8,995 9,301 9,506 9,699 Payables 2,143 2,346 2,350 2,508 3,013 2,415 2,457 2,546 2,634 2,738 Other provisions 4,707 5,077 5,539 5,209 5,071 4,807 4,959 5,168 5,391 5,618 Other liabilities 1,516 1,584 1,349 3,400 4,254 3,316 3,299 3,244 3,196 3,168
Total Liabilities 41,518 44,012 46,333 55,392 48,792 51,185 53,893 58,516 60,568 62,457
NET ASSETS 120,769 123,994 128,565 127,509 136,775 138,992 141,911 144,214 149,146 154,550
Forward estimates
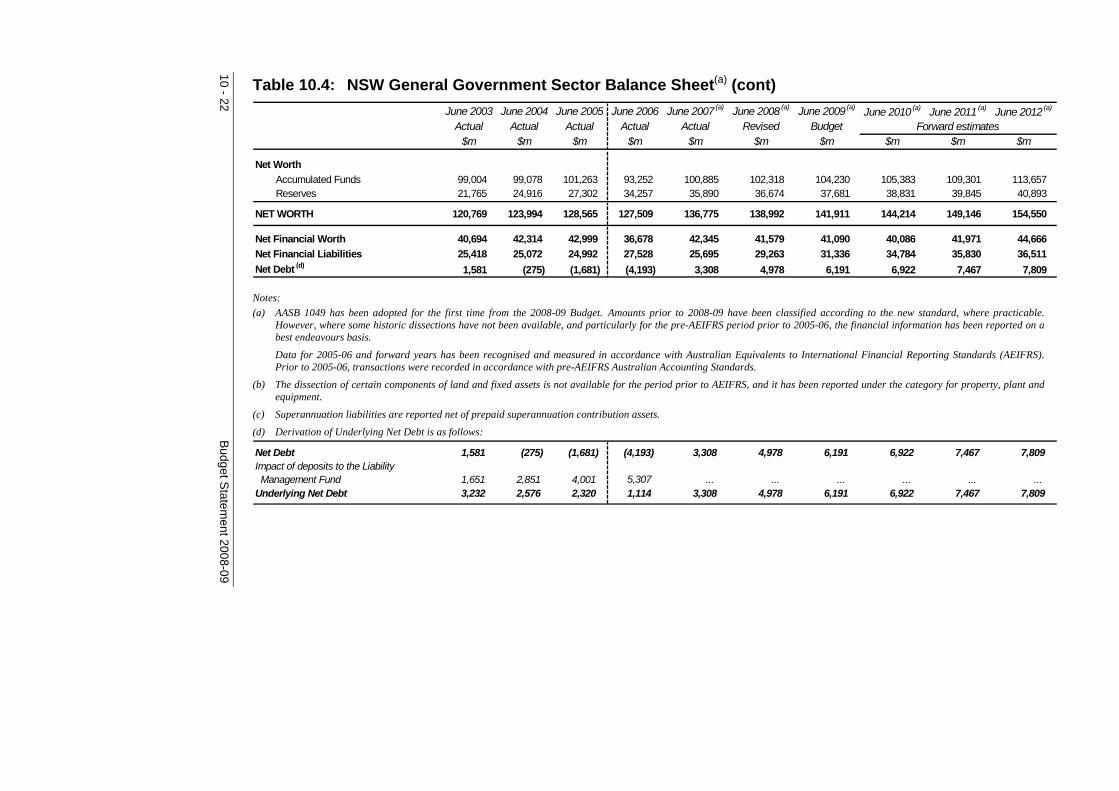
10 - 22
B
udget Statem
ent 2008-09
Table 10.4: NSW General Government Sector Balance Sheet(a) (cont) June 2003 June 2004 June 2005 June 2006 June 2007(a) June 2008(a) June 2009(a) June 2010(a) June 2011(a) June 2012(a)
Actual Actual Actual Actual Actual Revised Budget$m $m $m $m $m $m $m $m $m $m
Net WorthAccumulated Funds 99,004 99,078 101,263 93,252 100,885 102,318 104,230 105,383 109,301 113,657 Reserves 21,765 24,916 27,302 34,257 35,890 36,674 37,681 38,831 39,845 40,893
NET WORTH 120,769 123,994 128,565 127,509 136,775 138,992 141,911 144,214 149,146 154,550
Net Financial Worth 40,694 42,314 42,999 36,678 42,345 41,579 41,090 40,086 41,971 44,666 Net Financial Liabilities 25,418 25,072 24,992 27,528 25,695 29,263 31,336 34,784 35,830 36,511 Net Debt (d) 1,581 (275) (1,681) (4,193) 3,308 4,978 6,191 6,922 7,467 7,809
Forward estimates
Notes: (a) AASB 1049 has been adopted for the first time from the 2008-09 Budget. Amounts prior to 2008-09 have been classified according to the new standard, where practicable.
However, where some historic dissections have not been available, and particularly for the pre-AEIFRS period prior to 2005-06, the financial information has been reported on a best endeavours basis.
Data for 2005-06 and forward years has been recognised and measured in accordance with Australian Equivalents to International Financial Reporting Standards (AEIFRS). Prior to 2005-06, transactions were recorded in accordance with pre-AEIFRS Australian Accounting Standards.
(b) The dissection of certain components of land and fixed assets is not available for the period prior to AEIFRS, and it has been reported under the category for property, plant and equipment.
(c) Superannuation liabilities are reported net of prepaid superannuation contribution assets.
(d) Derivation of Underlying Net Debt is as follows:
Net Debt 1,581 (275) (1,681) (4,193) 3,308 4,978 6,191 6,922 7,467 7,809 Impact of deposits to the Liability Management Fund 1,651 2,851 4,001 5,307 ... ... ... ... ... ... Underlying Net Debt 3,232 2,576 2,320 1,114 3,308 4,978 6,191 6,922 7,467 7,809
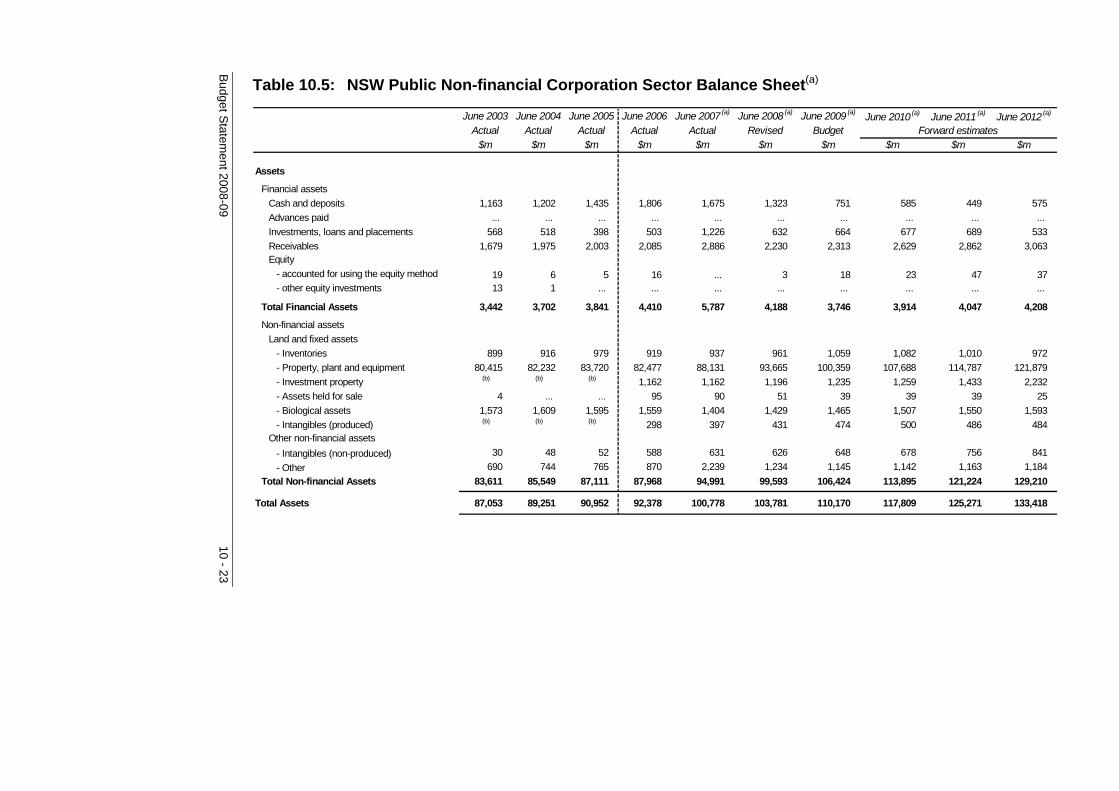
Budg
et Statem
ent 2008-09 10 - 23
Table 10.5: NSW Public Non-financial Corporation Sector Balance Sheet(a)
June 2003 June 2004 June 2005 June 2006 June 2007 (a) June 2008(a) June 2009 (a) June 2010(a) June 2011 (a) June 2012(a)
Actual Actual Actual Actual Actual Revised Budget$m $m $m $m $m $m $m $m $m $m
Assets
Financial assetsCash and deposits 1,163 1,202 1,435 1,806 1,675 1,323 751 585 449 575 Advances paid ... ... ... ... ... ... ... ... ... ... Investments, loans and placements 568 518 398 503 1,226 632 664 677 689 533 Receivables 1,679 1,975 2,003 2,085 2,886 2,230 2,313 2,629 2,862 3,063 Equity - accounted for using the equity method 19 6 5 16 ... 3 18 23 47 37 - other equity investments 13 1 ... ... ... ... ... ... ... ...
Total Financial Assets 3,442 3,702 3,841 4,410 5,787 4,188 3,746 3,914 4,047 4,208
Non-financial assetsLand and fixed assets - Inventories 899 916 979 919 937 961 1,059 1,082 1,010 972 - Property, plant and equipment 80,415 82,232 83,720 82,477 88,131 93,665 100,359 107,688 114,787 121,879 - Investment property (b) (b) (b) 1,162 1,162 1,196 1,235 1,259 1,433 2,232 - Assets held for sale 4 ... ... 95 90 51 39 39 39 25 - Biological assets 1,573 1,609 1,595 1,559 1,404 1,429 1,465 1,507 1,550 1,593 - Intangibles (produced) (b) (b) (b) 298 397 431 474 500 486 484 Other non-financial assets - Intangibles (non-produced) 30 48 52 588 631 626 648 678 756 841 - Other 690 744 765 870 2,239 1,234 1,145 1,142 1,163 1,184
Total Non-financial Assets 83,611 85,549 87,111 87,968 94,991 99,593 106,424 113,895 121,224 129,210
Total Assets 87,053 89,251 90,952 92,378 100,778 103,781 110,170 117,809 125,271 133,418
Forward estimates
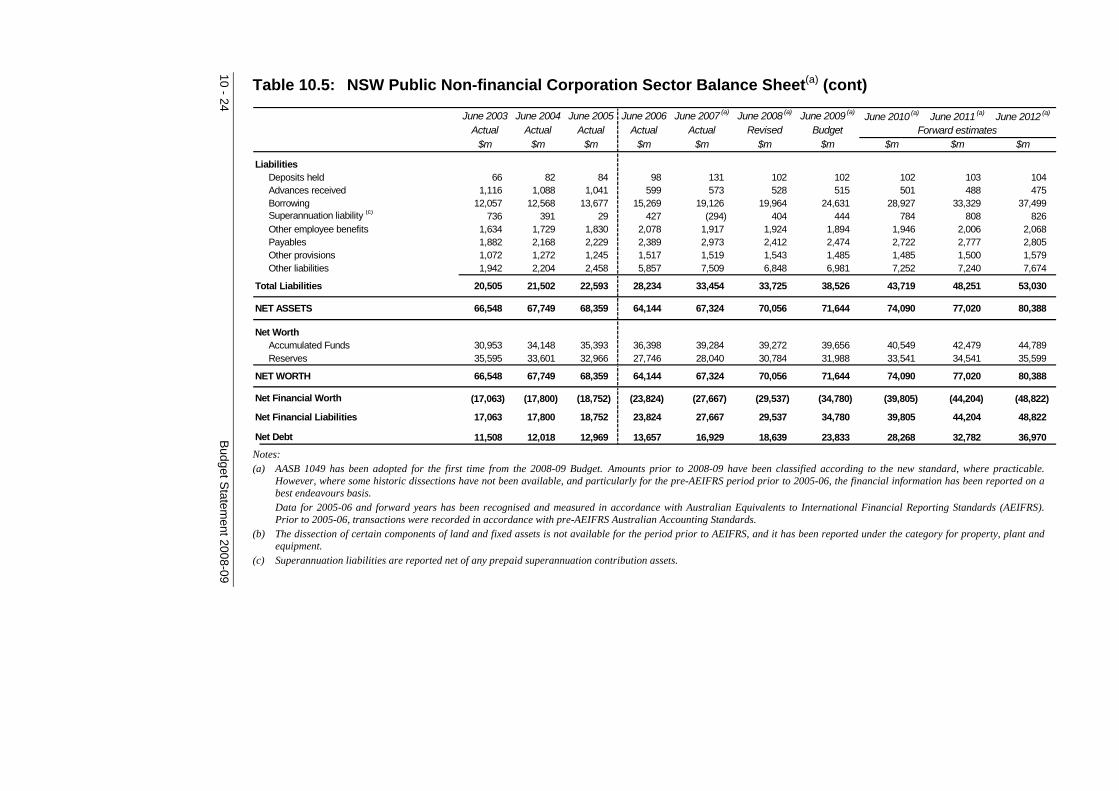
Table 10.5: NSW Public Non-financial Corporation Sector Balance Sheet(a) (cont)
10 - 24 B
udget Statem
ent 2008-09
June 2003 June 2004 June 2005 June 2006 June 2007 (a) June 2008 (a) June 2009 (a) June 2010 (a) June 2011 (a) June 2012 (a)
Actual Actual Actual Actual Actual Revised Budget$m $m $m $m $m $m $m $m $m $m
LiabilitiesDeposits held 66 82 84 98 131 102 102 102 103 104 Advances received 1,116 1,088 1,041 599 573 528 515 501 488 475 Borrowing 12,057 12,568 13,677 15,269 19,126 19,964 24,631 28,927 33,329 37,499 Superannuation liability (c) 736 391 29 427 (294) 404 444 784 808 826 Other employee benefits 1,634 1,729 1,830 2,078 1,917 1,924 1,894 1,946 2,006 2,068 Payables 1,882 2,168 2,229 2,389 2,973 2,412 2,474 2,722 2,777 2,805 Other provisions 1,072 1,272 1,245 1,517 1,519 1,543 1,485 1,485 1,500 1,579 Other liabilities 1,942 2,204 2,458 5,857 7,509 6,848 6,981 7,252 7,240 7,674
Total Liabilities 20,505 21,502 22,593 28,234 33,454 33,725 38,526 43,719 48,251 53,030
NET ASSETS 66,548 67,749 68,359 64,144 67,324 70,056 71,644 74,090 77,020 80,388
Net WorthAccumulated Funds 30,953 34,148 35,393 36,398 39,284 39,272 39,656 40,549 42,479 44,789 Reserves 35,595 33,601 32,966 27,746 28,040 30,784 31,988 33,541 34,541 35,599
NET WORTH 66,548 67,749 68,359 64,144 67,324 70,056 71,644 74,090 77,020 80,388
Net Financial Worth (17,063) (17,800) (18,752) (23,824) (27,667) (29,537) (34,780) (39,805) (44,204) (48,822)
Net Financial Liabilities 17,063 17,800 18,752 23,824 27,667 29,537 34,780 39,805 44,204 48,822
Net Debt 11,508 12,018 12,969 13,657 16,929 18,639 23,833 28,268 32,782 36,970
Forward estimates
Notes: (a) AASB 1049 has been adopted for the first time from the 2008-09 Budget. Amounts prior to 2008-09 have been classified according to the new standard, where practicable.
However, where some historic dissections have not been available, and particularly for the pre-AEIFRS period prior to 2005-06, the financial information has been reported on a best endeavours basis. Data for 2005-06 and forward years has been recognised and measured in accordance with Australian Equivalents to International Financial Reporting Standards (AEIFRS). Prior to 2005-06, transactions were recorded in accordance with pre-AEIFRS Australian Accounting Standards.
(b) The dissection of certain components of land and fixed assets is not available for the period prior to AEIFRS, and it has been reported under the category for property, plant and equipment.
(c) Superannuation liabilities are reported net of any prepaid superannuation contribution assets.

Budg
et Statem
ent 2008-09 10 - 25
Table 10.6: NSW Non-financial Public Sector Balance Sheet(a)
June 2003 June 2004 June 2005 June 2006 June 2007 (a) June 2008(a) June 2009(a) June 2010(a) June 2011(a) June 2012(a)
Actual Actual Actual Actual Actual Revised Budget$m $m $m $m $m $m $m $m $m $m
AssetsFinancial assets
Cash and deposits 2,254 3,070 2,900 4,265 4,095 3,774 3,431 3,570 3,821 4,393 Advances paid 265 249 216 242 223 333 394 410 436 448 Investments, loans and placements 8,507 10,091 12,439 14,462 8,391 7,049 7,678 8,196 8,759 9,208 Receivables 4,199 4,452 4,702 4,752 5,901 5,423 4,993 5,192 5,303 5,369 Equity - in other public sector entities (436) (362) (368) 62 715 787 783 780 782 789 - accounted for using the equity method 569 567 589 1,501 1,519 1,622 1,750 1,822 1,896 1,929 - other equity investments 26 12 6 5 4 4 4 4 4 4
Total Financial Assets 15,384 18,079 20,484 25,289 20,848 18,992 19,033 19,974 21,001 22,140 Non-financial assets
Land and fixed assets - Inventories 1,053 1,090 1,129 1,076 1,111 1,139 1,235 1,270 1,199 1,160 - Property, plant and equipment 159,013 162,248 167,491 170,735 179,730 187,912 197,665 207,904 217,883 227,603 - Investment property (b) (b) (b) 1,513 1,474 1,552 1,590 1,615 1,789 2,588 - Assets held for sale 182 204 278 326 298 220 172 219 192 131 - Biological assets 1,573 1,609 1,595 1,559 1,409 1,435 1,470 1,512 1,555 1,599 - Intangibles (produced) (b) (b) (b) 819 942 1,153 1,434 1,645 1,679 1,651 Other non-financial assets - Intangibles (non-produced) 37 57 64 601 631 626 648 678 756 841 - Other 1,469 1,673 1,709 1,544 2,065 2,110 2,255 2,406 2,553 2,716
Total Non-financial Assets 163,327 166,881 172,266 178,173 187,660 196,147 206,469 217,249 227,606 238,289
Total Assets 178,711 184,960 192,750 203,462 208,508 215,139 225,502 237,223 248,607 260,429
Forward estimates

10 - 26
B
udget Statem
ent 2008-09
Table 10.6: NSW Non-financial Public Sector Balance Sheet(a) (cont)
June 2003 June 2004 June 2005 June 2006 June 2007(a) June 2008(a) June 2009(a) June 2010(a) June 2011(a) June 2012(a)
Actual Actual Actual Actual Actual Revised Budget$m $m $m $m $m $m $m $m $m $m
LiabilitiesDeposits held 87 110 134 173 222 170 178 179 179 180 Advances received 1,808 1,681 1,641 923 892 865 836 807 778 748 Borrowing 22,219 23,362 25,068 27,305 31,756 33,602 40,324 46,116 51,961 57,479 Superannuation liability (c) 15,456 15,851 16,491 23,556 14,068 17,531 17,833 20,705 20,824 20,850 Other employee benefits 8,047 8,744 9,347 10,169 10,265 10,691 10,842 11,199 11,462 11,716 Payables 3,837 4,269 4,394 4,706 5,340 4,615 4,711 5,017 5,130 5,240 Other provisions 5,119 5,435 5,857 5,533 5,405 5,196 5,335 5,536 5,754 5,978 Other liabilities 1,369 1,514 1,253 3,588 3,785 3,477 3,532 3,450 3,373 3,688
Total Liabilities 57,942 60,966 64,185 75,953 71,733 76,147 83,591 93,009 99,461 105,879
NET ASSETS 120,769 123,994 128,565 127,509 136,775 138,992 141,911 144,214 149,146 154,550
Forward estimates
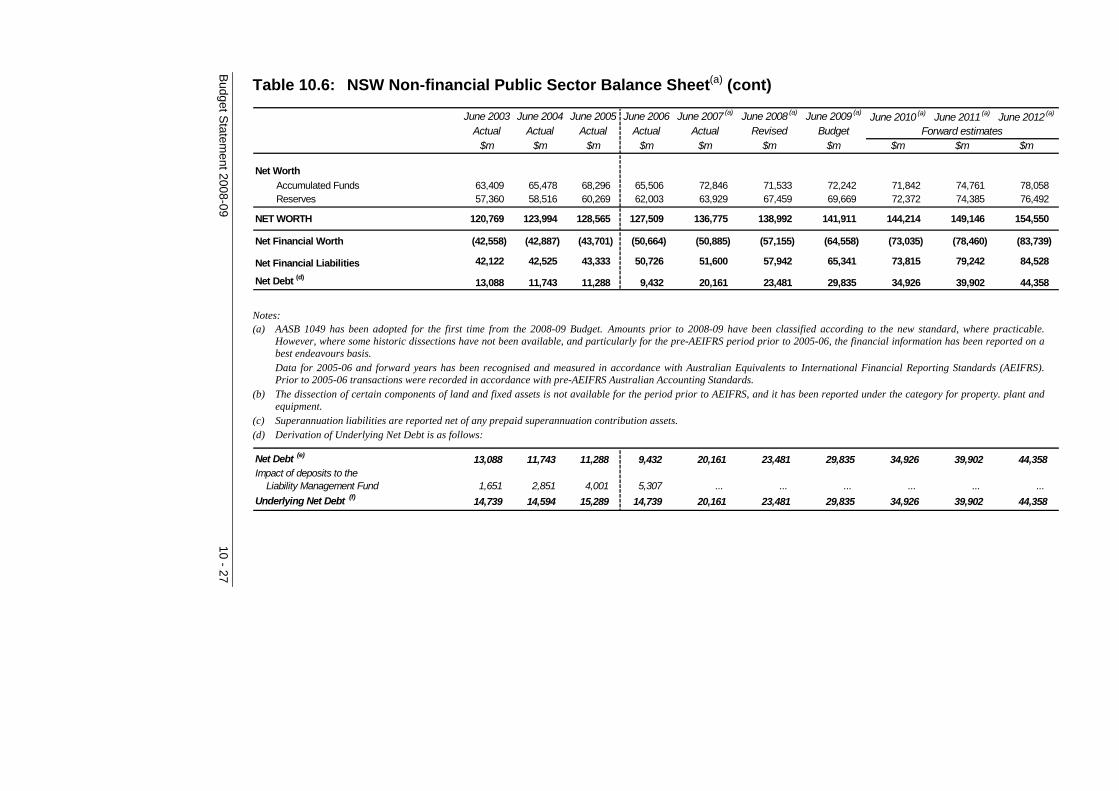
Budg
et Statem
ent 2008-09 10 - 27
Table 10.6: NSW Non-financial Public Sector Balance Sheet(a) (cont)
June 2003 June 2004 June 2005 June 2006 June 2007 (a) June 2008 (a) June 2009(a) June 2010(a) June 2011(a) June 2012(a)
Actual Actual Actual Actual Actual Revised Budget$m $m $m $m $m $m $m $m $m $m
Net WorthAccumulated Funds 63,409 65,478 68,296 65,506 72,846 71,533 72,242 71,842 74,761 78,058 Reserves 57,360 58,516 60,269 62,003 63,929 67,459 69,669 72,372 74,385 76,492
NET WORTH 120,769 123,994 128,565 127,509 136,775 138,992 141,911 144,214 149,146 154,550
Net Financial Worth (42,558) (42,887) (43,701) (50,664) (50,885) (57,155) (64,558) (73,035) (78,460) (83,739)
Net Financial Liabilities 42,122 42,525 43,333 50,726 51,600 57,942 65,341 73,815 79,242 84,528
Net Debt (d) 13,088 11,743 11,288 9,432 20,161 23,481 29,835 34,926 39,902 44,358
Forward estimates
Notes: (a) AASB 1049 has been adopted for the first time from the 2008-09 Budget. Amounts prior to 2008-09 have been classified according to the new standard, where practicable.
However, where some historic dissections have not been available, and particularly for the pre-AEIFRS period prior to 2005-06, the financial information has been reported on a best endeavours basis. Data for 2005-06 and forward years has been recognised and measured in accordance with Australian Equivalents to International Financial Reporting Standards (AEIFRS). Prior to 2005-06 transactions were recorded in accordance with pre-AEIFRS Australian Accounting Standards.
(b) The dissection of certain components of land and fixed assets is not available for the period prior to AEIFRS, and it has been reported under the category for property. plant and equipment.
(c) Superannuation liabilities are reported net of any prepaid superannuation contribution assets. (d) Derivation of Underlying Net Debt is as follows:
Net Debt (e) 13,088 11,743 11,288 9,432 20,161 23,481 29,835 34,926 39,902 44,358 Impact of deposits to the Liability Management Fund 1,651 2,851 4,001 5,307 ... ... ... ... ... ... Underlying Net Debt (f) 14,739 14,594 15,289 14,739 20,161 23,481 29,835 34,926 39,902 44,358
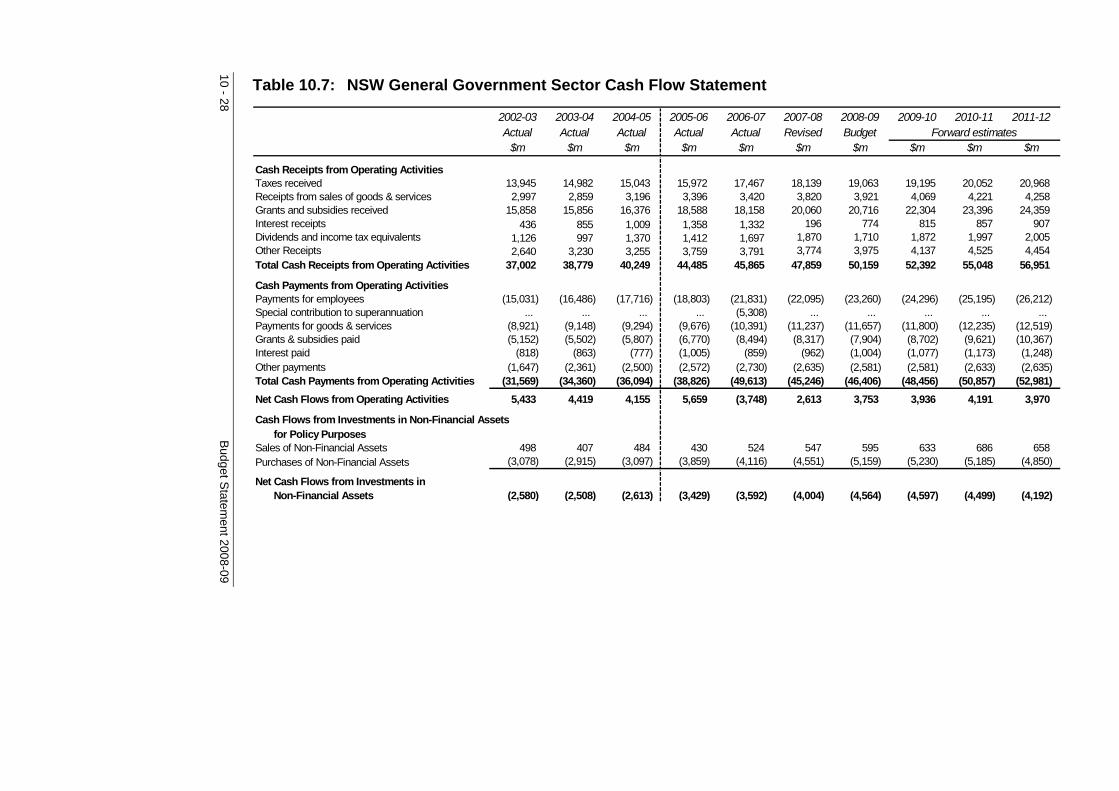
10 - 28
B
udget Statem
ent 2008-09
Table 10.7: NSW General Government Sector Cash Flow Statement
2002-03 2003-04 2004-05 2005-06 2006-07 2007-08 2008-09 2009-10 2010-11 2011-12Actual Actual Actual Actual Actual Revised Budget
$m $m $m $m $m $m $m $m $m $m
Cash Receipts from Operating ActivitiesTaxes received 13,945 14,982 15,043 15,972 17,467 18,139 19,063 19,195 20,052 20,968 Receipts from sales of goods & services 2,997 2,859 3,196 3,396 3,420 3,820 3,921 4,069 4,221 4,258 Grants and subsidies received 15,858 15,856 16,376 18,588 18,158 20,060 20,716 22,304 23,396 24,359 Interest receipts 436 855 1,009 1,358 1,332 196 774 815 857 907 Dividends and income tax equivalents 1,126 997 1,370 1,412 1,697 1,870 1,710 1,872 1,997 2,005 Other Receipts 2,640 3,230 3,255 3,759 3,791 3,774 3,975 4,137 4,525 4,454 Total Cash Receipts from Operating Activities 37,002 38,779 40,249 44,485 45,865 47,859 50,159 52,392 55,048 56,951
Cash Payments from Operating ActivitiesPayments for employees (15,031) (16,486) (17,716) (18,803) (21,831) (22,095) (23,260) (24,296) (25,195) (26,212) Special contribution to superannuation ... ... ... ... (5,308) ... ... ... ... ... Payments for goods & services (8,921) (9,148) (9,294) (9,676) (10,391) (11,237) (11,657) (11,800) (12,235) (12,519) Grants & subsidies paid (5,152) (5,502) (5,807) (6,770) (8,494) (8,317) (7,904) (8,702) (9,621) (10,367) Interest paid (818) (863) (777) (1,005) (859) (962) (1,004) (1,077) (1,173) (1,248) Other payments (1,647) (2,361) (2,500) (2,572) (2,730) (2,635) (2,581) (2,581) (2,633) (2,635) Total Cash Payments from Operating Activities (31,569) (34,360) (36,094) (38,826) (49,613) (45,246) (46,406) (48,456) (50,857) (52,981) Net Cash Flows from Operating Activities 5,433 4,419 4,155 5,659 (3,748) 2,613 3,753 3,936 4,191 3,970
Cash Flows from Investments in Non-Financial Assetsfor Policy Purposes
Sales of Non-Financial Assets 498 407 484 430 524 547 595 633 686 658 Purchases of Non-Financial Assets (3,078) (2,915) (3,097) (3,859) (4,116) (4,551) (5,159) (5,230) (5,185) (4,850)
Net Cash Flows from Investments in Non-Financial Assets (2,580) (2,508) (2,613) (3,429) (3,592) (4,004) (4,564) (4,597) (4,499) (4,192)
Forward estimates

Budg
et Statem
ent 2008-09 10 - 29
Table 10.7: NSW General Government Sector Cash Flow Statement (cont)
2002-03 2003-04 2004-05 2005-06 2006-07 2007-08 2008-09 2009-10 2010-11 2011-12Actual Actual Actual Actual Actual Revised Budget
$m $m $m $m $m $m $m $m $m $m
Cash Flows from Investments in Financial Assetsfor Policy Purposes
Receipts 871 227 161 104 290 123 195 294 197 181 Payments (33) (41) (31) (48) (51) (111) (251) (156) (64) (62) Total Cash Flows from Investments in
Financial Assets for Policy Purposes 838 186 130 56 239 12 (56) 138 133 119
Net Flows from Investments in Financial Assetsfor Liquidity Purposes
Receipts 504 2,592 393 2,102 8,431 802 121 146 185 162 Payments (4,023) (4,114) (2,805) (3,956) (1,690) (136) (738) (674) (729) (760) Net Cash Flows from Investments in
Financial Assets for Liquidity Purposes (3,519) (1,522) (2,412) (1,854) 6,741 666 (617) (528) (544) (598)
Cash Flows from Financing ActivitiesAdvances received 23 3 19 5 ... ... ... ... ... ... Advances repaid (54) (143) (47) (140) (46) (49) (51) (51) (56) (55) Proceeds from borrowings 12 988 1,148 1,516 537 1,540 2,237 1,866 1,707 1,766 Repayments of borrowings (1,029) (621) (731) (869) (153) (798) (482) (457) (544) (562) Deposits received (net) (8) 6 20 32 16 (26) 9 (2) (1) (1) Other financing (net) (1) ... (18) ... ... ... ... ... ... ... Net Cash Flows from
Financing Activities (1,057) 233 391 544 354 667 1,713 1,356 1,106 1,148
Forward estimates

10 - 30
B
udget Statem
ent 2008-09
Table 10.7: NSW General Government Sector Cash Flow Statement (cont)
2002-03 2003-04 2004-05 2005-06 2006-07 2007-08 2008-09 2009-10 2010-11 2011-12Actual Actual Actual Actual Actual Revised Budget
$m $m $m $m $m $m $m $m $m $m(885) 808 (349) 976 (6) (46) 229 305 387 447
Cash and Cash Equivalents at beginning of year 1,946 1,061 1,810 1,441 2,449 2,421 2,451 2,681 2,985 3,371 reclassifications of cash and cash equivalents ... (59) (20) 32 (22) 76 1 (1) (1) ...
Cash and Cash Equivalents at end of year 1,061 1,810 1,441 2,449 2,421 2,451 2,681 2,985 3,371 3,818
Derivation of the Cash ResultNet cash flows from operating activities 5,433 4,419 4,155 5,659 (3,748) 2,613 3,753 3,936 4,191 3,970 Net Cash Flows from Investments in
Non-Financial Assets (2,580) (2,508) (2,613) (3,429) (3,592) (4,004) (4,564) (4,597) (4,499) (4,192)
Cash Surplus/(Deficit) 2,853 1,911 1,542 2,230 (7,340) (1,391) (811) (661) (308) (222)
Derivation of Underlying Cash Surplus/(Deficit)Cash Surplus/(Deficit) 2,853 1,911 1,542 2,230 (7,340) (1,391) (811) (661) (308) (222) Impact of deposits to the
Liability Management Fund (1,651) (1,200) (1,150) (1,307) 5,308 ... ... ... ... ...
Underlying Cash Surplus/(Deficit) 1,202 711 392 923 (2,032) (1,391) (811) (661) (308) (222)
Forward estimates
Net Increase/(Decrease) in Cash Held
Table 10.8: Derivation of ABS GFS General Government Sector Cash Surplus/(Deficit) Cash Surplus/(Deficit) 2,853 1,911 1,542 2,230 (7,340) (1,391) (811) (661) (308) (222) Assets acquired under finance leases (345) (311) (187) (81) (132) (324) (319) (125) (293) (129)
ABS GFS Surplus/(Deficit) 2,508 1,600 1,355 2,149 (7,472) (1,715) (1,130) (786) (601) (351)

Budg
et Statem
ent 2008-09 10 - 31
Table 10.9: NSW Public Non-financial Corporation Sector Cash Flow Statement 2002-03 2003-04 2004-05 2005-06 2006-07 2007-08 2008-09 2009-10 2010-11 2011-12Actual Actual Actual Actual Actual Revised Budget
$m $m $m $m $m $m $m $m $m $m
Cash Receipts from Operating ActivitiesReceipts from sales of goods & services 9,648 10,051 10,632 10,643 10,325 12,922 13,459 13,912 14,777 15,672 Grants and subsidies received 2,124 2,404 2,511 3,108 4,402 3,442 3,374 4,300 5,027 5,684 Interest receipts 86 82 73 113 125 113 80 78 77 78 Dividends and income tax equivalents ... ... ... ... ... ... ... ... ... ... Other Receipts 2,063 2,212 2,193 2,170 2,156 2,187 2,029 2,244 2,300 2,824 Total Cash Receipts from Operating Activities 13,921 14,749 15,409 16,034 17,008 18,664 18,942 20,534 22,181 24,258
Cash Payments from Operating ActivitiesPayments for employees (3,400) (3,425) (3,488) (3,558) (3,787) (4,130) (4,446) (4,573) (4,772) (4,844) Payments for goods & services (4,575) (5,053) (5,409) (5,410) (5,122) (6,780) (6,986) (6,631) (6,736) (7,042) Grants & subsidies paid (99) (120) (103) (185) (193) (196) (216) (222) (217) (209) Interest payments (809) (814) (888) (873) (966) (1,080) (1,287) (1,676) (2,115) (2,439) Income tax equivalents (398) (371) (408) (421) (657) (718) (578) (736) (819) (806) Other payments (1,401) (1,527) (1,739) (1,578) (1,402) (1,987) (1,571) (1,756) (1,808) (1,906) Total Cash Payments from Operating Activities (10,682) (11,310) (12,035) (12,025) (12,127) (14,891) (15,084) (15,594) (16,467) (17,246)
Net Cash Flows from Operating Activities 3,239 3,439 3,374 4,009 4,881 3,773 3,858 4,940 5,714 7,012
Cash Flows from Investments in Non-Financial Assetsfor Policy Purposes
Sales of Non-Financial Assets 281 206 151 308 449 485 287 617 310 278 Purchases of Non-Financial Assets (3,343) (3,376) (3,556) (4,313) (5,396) (6,508) (8,427) (8,394) (8,676) (9,595) Net Cash Flows from Investments in
Non-Financial Assets (3,062) (3,170) (3,405) (4,005) (4,947) (6,023) (8,140) (7,777) (8,366) (9,317)
Forward estimates
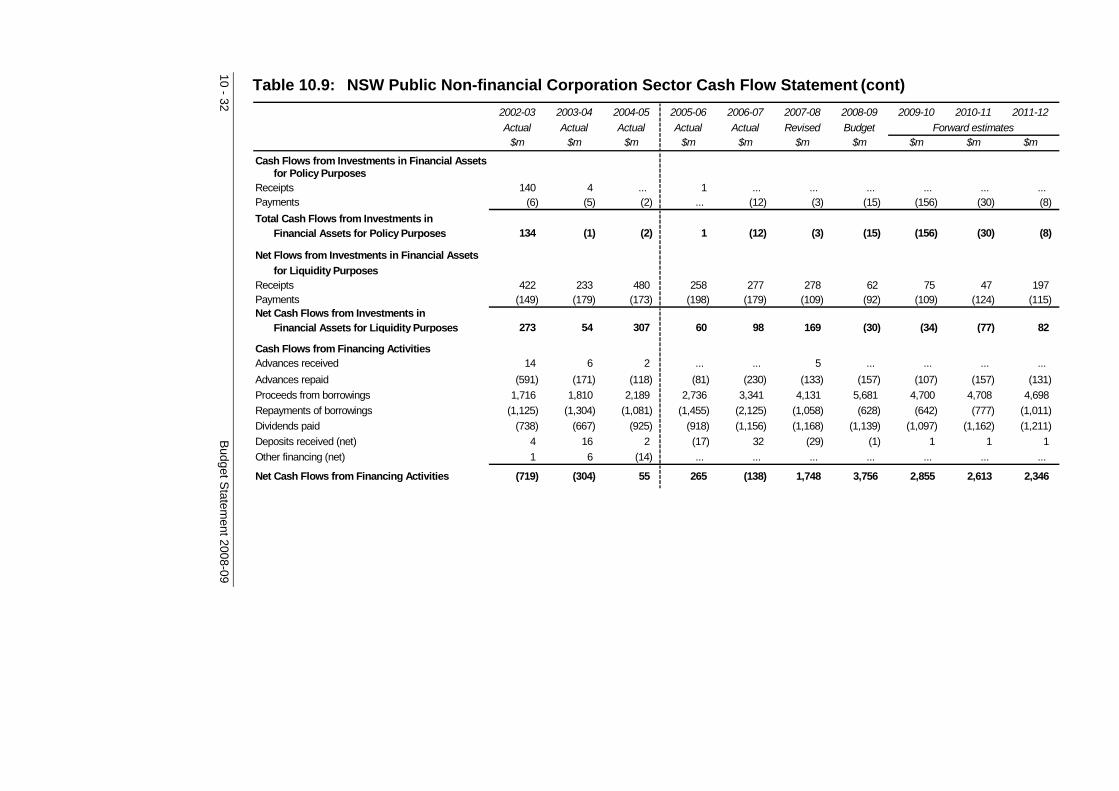
10 - 32
B
udget Statem
ent 2008-09
Table 10.9: NSW Public Non-financial Corporation Sector Cash Flow Statement (cont) 2002-03 2003-04 2004-05 2005-06 2006-07 2007-08 2008-09 2009-10 2010-11 2011-12Actual Actual Actual Actual Actual Revised Budget
$m $m $m $m $m $m $m $m $m $m
Cash Flows from Investments in Financial Assetsfor Policy Purposes
Receipts 140 4 ... 1 ... ... ... ... ... ... Payments (6) (5) (2) ... (12) (3) (15) (156) (30) (8) Total Cash Flows from Investments in
Financial Assets for Policy Purposes 134 (1) (2) 1 (12) (3) (15) (156) (30) (8)
Net Flows from Investments in Financial Assetsfor Liquidity Purposes
Receipts 422 233 480 258 277 278 62 75 47 197 Payments (149) (179) (173) (198) (179) (109) (92) (109) (124) (115) Net Cash Flows from Investments in
Financial Assets for Liquidity Purposes 273 54 307 60 98 169 (30) (34) (77) 82
Cash Flows from Financing ActivitiesAdvances received 14 6 2 ... ... 5 ... ... ... ... Advances repaid (591) (171) (118) (81) (230) (133) (157) (107) (157) (131) Proceeds from borrowings 1,716 1,810 2,189 2,736 3,341 4,131 5,681 4,700 4,708 4,698 Repayments of borrowings (1,125) (1,304) (1,081) (1,455) (2,125) (1,058) (628) (642) (777) (1,011) Dividends paid (738) (667) (925) (918) (1,156) (1,168) (1,139) (1,097) (1,162) (1,211) Deposits received (net) 4 16 2 (17) 32 (29) (1) 1 1 1 Other financing (net) 1 6 (14) ... ... ... ... ... ... ...
Net Cash Flows from Financing Activities (719) (304) 55 265 (138) 1,748 3,756 2,855 2,613 2,346
Forward estimates

Budg
et Statem
ent 2008-09 10 - 33
Table 10.9: NSW Public Non-financial Corporation Sector Cash Flow Statement (cont) 2002-03 2003-04 2004-05 2005-06 2006-07 2007-08 2008-09 2009-10 2010-11 2011-12Actual Actual Actual Actual Actual Revised Budget
$m $m $m $m $m $m $m $m $m $m
(135) 18 329 330 (118) (336) (571) (172) (146) 115
Cash and Cash Equivalents at beginning of year 1,228 1,143 1,170 1,401 1,801 1,651 1,316 745 574 429 reclassifications of cash and cash equivalents 50 9 (98) 70 (32) 1 ... 1 1 1
Cash and Cash Equivalents at end of year 1,143 1,170 1,401 1,801 1,651 1,316 745 574 429 545
Derivation of the Cash ResultNet cash flows from operating activities 3,239 3,439 3,374 4,009 4,881 3,773 3,858 4,940 5,714 7,012 Net Cash Flows from Investments in
Non-Financial Assets (3,062) (3,170) (3,405) (4,005) (4,947) (6,023) (8,140) (7,777) (8,366) (9,317) Dividends paid (738) (667) (925) (918) (1,156) (1,168) (1,139) (1,097) (1,162) (1,211)
Cash Surplus/(Deficit) (561) (398) (956) (914) (1,222) (3,418) (5,421) (3,934) (3,814) (3,516)
Net Increase/(Decrease) in Cash Held
Forward estimates
Table 10.10: NSW Derivation of ABS GFS Public Non-financial Corporation Sector Cash Surplus/(Deficit) Cash Surplus/(Deficit) (561) (398) (956) (914) (1,222) (3,418) (5,421) (3,934) (3,814) (3,516) Assets acquired under finance leases ... ... ... ... ... ... ... (307) (490) (500)
ABS GFS Surplus/(Deficit) (561) (398) (956) (914) (1,222) (3,418) (5,421) (4,241) (4,304) (4,016)

10 - 34
B
udget Statem
ent 2008-09
Table 10.11: NSW Non-financial Public Sector Cash Flow Statement 2002-03 2003-04 2004-05 2005-06 2006-07 2007-08 2008-09 2009-10 2010-11 2011-12Actual Actual Actual Actual Actual Revised Budget
$m $m $m $m $m $m $m $m $m $m
Cash Receipts from Operating ActivitiesTaxes received 13,390 14,293 14,458 15,277 16,718 17,705 18,272 18,360 19,165 20,036 Receipts from sales of goods & services 12,489 12,720 13,655 13,805 14,036 16,241 17,085 17,687 18,712 19,636 Grants and subsidies received 15,828 15,780 16,337 18,495 18,000 19,928 20,613 22,175 23,269 24,237 Interest receipts 469 886 1,033 1,423 1,429 259 800 836 873 919 Dividends and income tax equivalents (22) 35 49 101 24 42 44 49 52 54 Other Receipts 4,723 5,526 5,472 5,935 5,979 5,997 6,027 6,417 6,848 7,284 Total Cash Receipts from Operating Activities 46,877 49,240 51,004 55,036 56,186 60,172 62,841 65,524 68,919 72,166
Cash Payments from Operating ActivitiesPayments for employees (18,283) (19,728) (21,055) (22,215) (25,424) (25,979) (27,457) (28,612) (29,701) (30,780) Special contribution to superannuation ... ... ... ... (5,308) ... ... ... ... ... Payments for goods & services (12,974) (13,563) (14,152) (14,381) (15,211) (17,385) (17,886) (17,643) (18,150) (18,698) Grants & subsidies paid (3,138) (3,226) (3,404) (3,757) (4,339) (4,994) (4,687) (4,538) (4,711) (4,777) Interest paid (1,575) (1,626) (1,615) (1,830) (1,796) (1,991) (2,237) (2,696) (3,226) (3,621) Other payments (3,015) (3,924) (4,176) (4,524) (4,076) (4,611) (4,109) (4,262) (4,394) (4,526) Total Cash Payments from Operating Activities (38,985) (42,067) (44,402) (46,707) (56,154) (54,960) (56,376) (57,751) (60,182) (62,402)
Net Cash Flows from Operating Activities 7,892 7,173 6,602 8,329 32 5,212 6,465 7,773 8,737 9,764
Cash Flows from Investments in Non-Financial Assetsfor Policy Purposes
Sales of Non-Financial Assets 778 614 635 738 974 1,032 883 1,250 996 936 Purchases of Non-Financial Assets (6,416) (6,288) (6,648) (8,167) (9,507) (11,053) (13,580) (13,618) (13,855) (14,438) Net Cash Flows from Investments in
Non-Financial Assets (5,638) (5,674) (6,013) (7,429) (8,533) (10,021) (12,697) (12,368) (12,859) (13,502)
Forward estimates
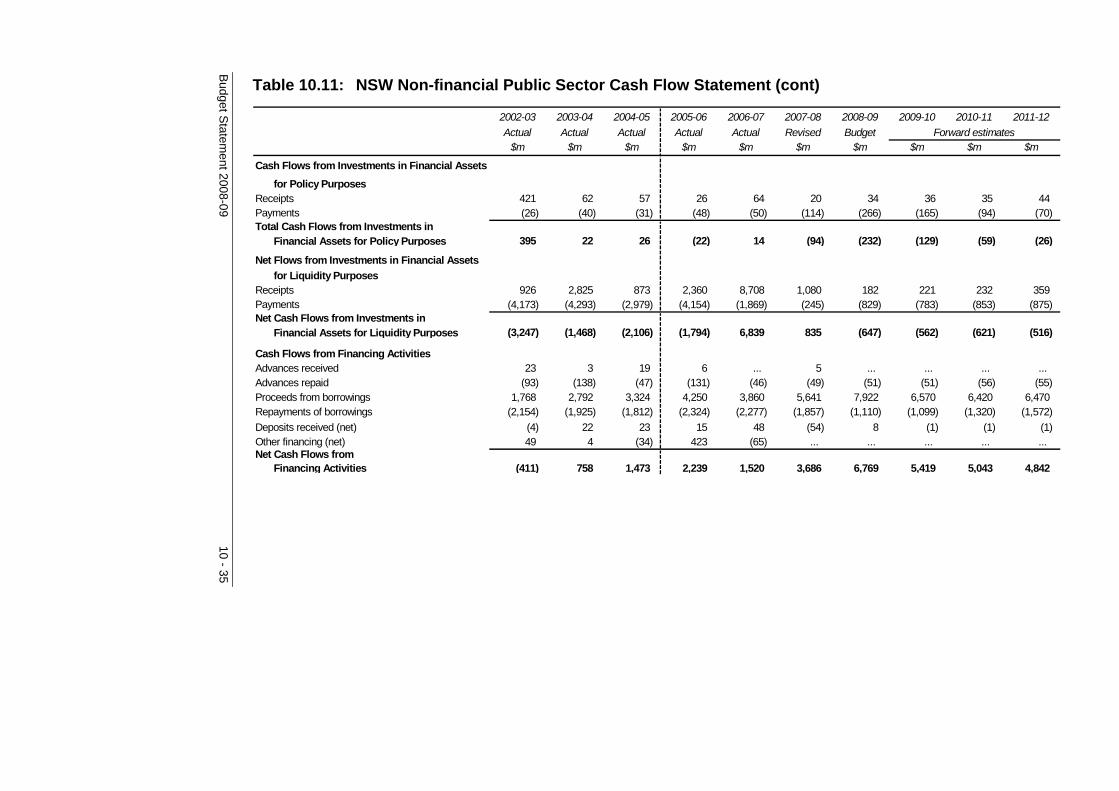
Budg
et Statem
ent 2008-09 10 - 35
Table 10.11: NSW Non-financial Public Sector Cash Flow Statement (cont)
2002-03 2003-04 2004-05 2005-06 2006-07 2007-08 2008-09 2009-10 2010-11 2011-12Actual Actual Actual Actual Actual Revised Budget
$m $m $m $m $m $m $m $m $m $m
Cash Flows from Investments in Financial Assetsfor Policy Purposes
Receipts 421 62 57 26 64 20 34 36 35 44 Payments (26) (40) (31) (48) (50) (114) (266) (165) (94) (70) Total Cash Flows from Investments in
Financial Assets for Policy Purposes 395 22 26 (22) 14 (94) (232) (129) (59) (26)
Net Flows from Investments in Financial Assetsfor Liquidity Purposes
Receipts 926 2,825 873 2,360 8,708 1,080 182 221 232 359 Payments (4,173) (4,293) (2,979) (4,154) (1,869) (245) (829) (783) (853) (875) Net Cash Flows from Investments in
Financial Assets for Liquidity Purposes (3,247) (1,468) (2,106) (1,794) 6,839 835 (647) (562) (621) (516)
Cash Flows from Financing ActivitiesAdvances received 23 3 19 6 ... 5 ... ... ... ... Advances repaid (93) (138) (47) (131) (46) (49) (51) (51) (56) (55) Proceeds from borrowings 1,768 2,792 3,324 4,250 3,860 5,641 7,922 6,570 6,420 6,470 Repayments of borrowings (2,154) (1,925) (1,812) (2,324) (2,277) (1,857) (1,110) (1,099) (1,320) (1,572) Deposits received (net) (4) 22 23 15 48 (54) 8 (1) (1) (1) Other financing (net) 49 4 (34) 423 (65) ... ... ... ... ... Net Cash Flows from
Financing Activities (411) 758 1,473 2,239 1,520 3,686 6,769 5,419 5,043 4,842
Forward estimates
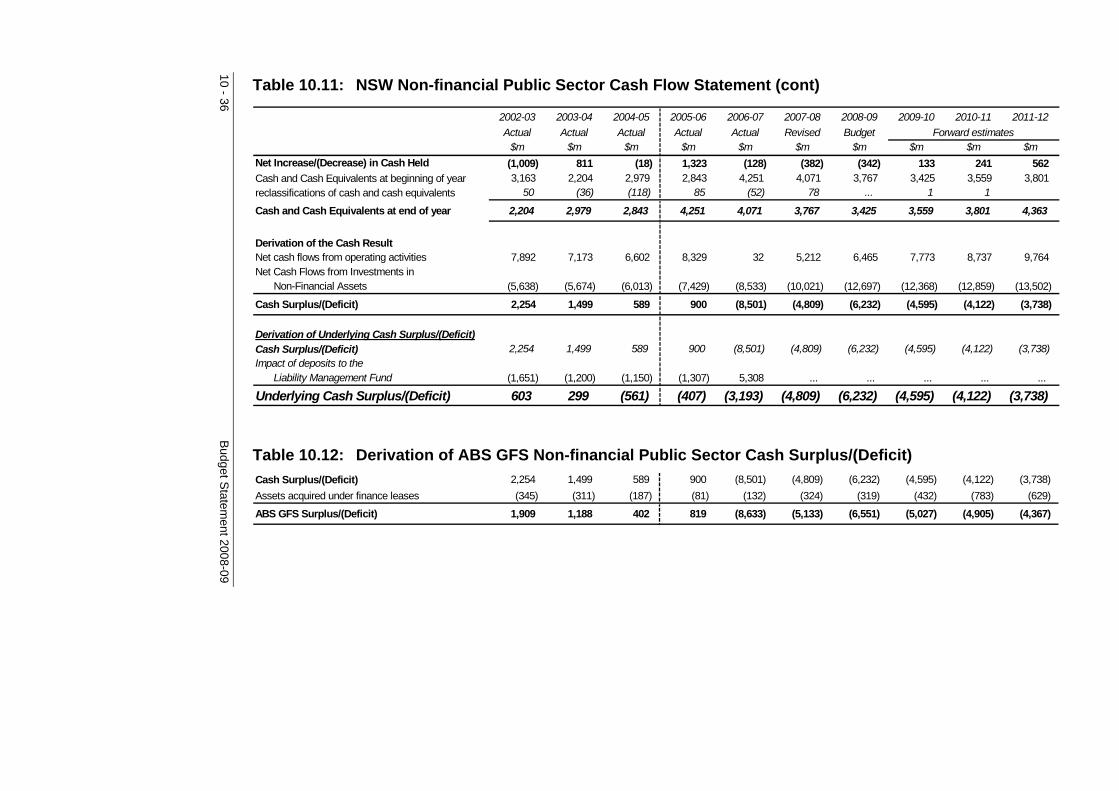
10 - 36 B
udget Statem
ent 2008-09
Table 10.11: NSW Non-financial Public Sector Cash Flow Statement (cont)
2002-03 2003-04 2004-05 2005-06 2006-07 2007-08 2008-09 2009-10 2010-11 2011-12Actual Actual Actual Actual Actual Revised Budget
$m $m $m $m $m $m $m $m $m $m(1,009) 811 (18) 1,323 (128) (382) (342) 133 241 562
Cash and Cash Equivalents at beginning of year 3,163 2,204 2,979 2,843 4,251 4,071 3,767 3,425 3,559 3,801 reclassifications of cash and cash equivalents 50 (36) (118) 85 (52) 78 ... 1 1
Cash and Cash Equivalents at end of year 2,204 2,979 2,843 4,251 4,071 3,767 3,425 3,559 3,801 4,363
Derivation of the Cash ResultNet cash flows from operating activities 7,892 7,173 6,602 8,329 32 5,212 6,465 7,773 8,737 9,764 Net Cash Flows from Investments in
Non-Financial Assets (5,638) (5,674) (6,013) (7,429) (8,533) (10,021) (12,697) (12,368) (12,859) (13,502)
Cash Surplus/(Deficit) 2,254 1,499 589 900 (8,501) (4,809) (6,232) (4,595) (4,122) (3,738)
Derivation of Underlying Cash Surplus/(Deficit)
Cash Surplus/(Deficit) 2,254 1,499 589 900 (8,501) (4,809) (6,232) (4,595) (4,122) (3,738)Impact of deposits to the
Liability Management Fund (1,651) (1,200) (1,150) (1,307) 5,308 ... ... ... ... ...
Underlying Cash Surplus/(Deficit) 603 299 (561) (407) (3,193) (4,809) (6,232) (4,595) (4,122) (3,738)
Net Increase/(Decrease) in Cash Held
Forward estimates
Cash Surplus/(Deficit) 2,254 1,499 589 900 (8,501) (4,809) (6,232) (4,595) (4,122) (3,738)Assets acquired under finance leases (345) (311) (187) (81) (132) (324) (319) (432) (783) (629)
ABS GFS Surplus/(Deficit) 1,909 1,188 402 819 (8,633) (5,133) (6,551) (5,027) (4,905) (4,367)
Table 10.12: Derivation of ABS GFS Non-financial Public Sector Cash Surplus/(Deficit)

Table 10.13: NSW general government sector taxes 2007-08Revised
$m
2008-09Budget
$m
Taxes on employers’ payroll and labour force 6,150 6,410 Taxes on property
Land taxes 1,968 1,983 Stamp duties on financial and capital transactions 4,612 4,095 Financial institutions’ transaction taxes ... ... Other 66 69
Total taxes on property 6,646 6,147 Taxes on the provision of goods and services
Excises and levies ... ... Taxes on gambling 1,542 1,602 Taxes on insurance 1,628 1,703
Total taxes on the provision of goods and services 3,170 3,305 Taxes on use of goods and performance of activities
Motor vehicle taxes 2,128 2,255 Franchise taxes 5 4 Other 367 412
Total taxes on use of goods and performance of activities 2,500 2,671
Total GFS Taxation Revenue 18,466 18,533
Table 10.14: NSW general government sector grant revenue
and expense 2007-08Revised
$m
2008-09Budget
$mCurrent grant revenue
Current grants from the CommonwealthGeneral purpose grants 12,060 13,020 Specific purpose grants (a) 6,449 6,158
Total 18,509 19,178 Other contributions and grants 787 751
Total current grant revenue 19,296 19,929
Capital grant revenueGeneral purpose grants ... ... Specific purpose grants (a) 1,091 1,091
Total 1,091 1,091 Other contributions and grants 266 31
Total capital grant revenue 1,357 1,122
Total grant revenue 20,653 21,051
Budget Statement 2008-09 10 - 37
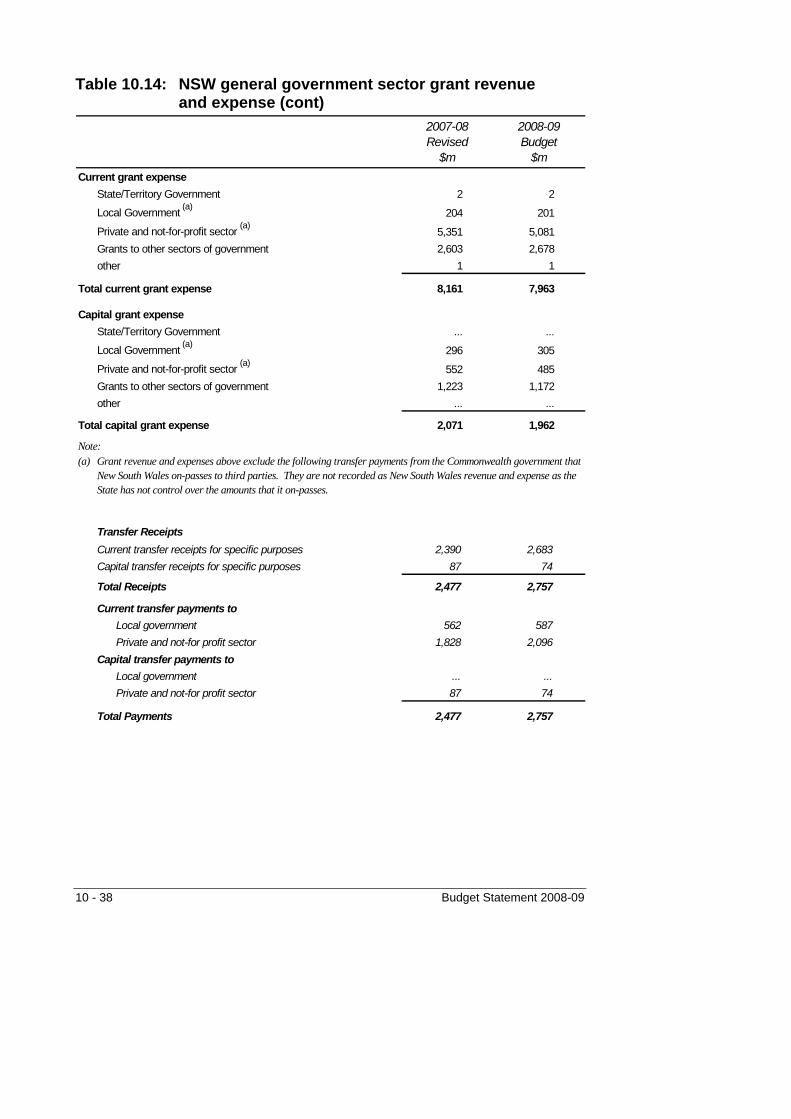
Table 10.14: NSW general government sector grant revenue and expense (cont)
2007-08Revised
$m
2008-09Budget
$mCurrent grant expense
State/Territory Government 2 2
Local Government (a) 204 201
Private and not-for-profit sector (a) 5,351 5,081 Grants to other sectors of government 2,603 2,678 other 1 1
Total current grant expense 8,161 7,963
Capital grant expenseState/Territory Government ... ...
Local Government (a) 296 305
Private and not-for-profit sector (a) 552 485 Grants to other sectors of government 1,223 1,172 other ... ...
Total capital grant expense 2,071 1,962
Note:(a)
Transfer ReceiptsCurrent transfer receipts for specific purposes 2,390 2,683 Capital transfer receipts for specific purposes 87 74
Total Receipts 2,477 2,757
Current transfer payments toLocal government 562 587 Private and not-for profit sector 1,828 2,096
Capital transfer payments to Local government ... ... Private and not-for profit sector 87 74
Total Payments 2,477 2,757
Grant revenue and expenses above exclude the following transfer payments from the Commonwealth government that New South Wales on-passes to third parties. They are not recorded as New South Wales revenue and expense as the State has not control over the amounts that it on-passes.
10 - 38 Budget Statement 2008-09
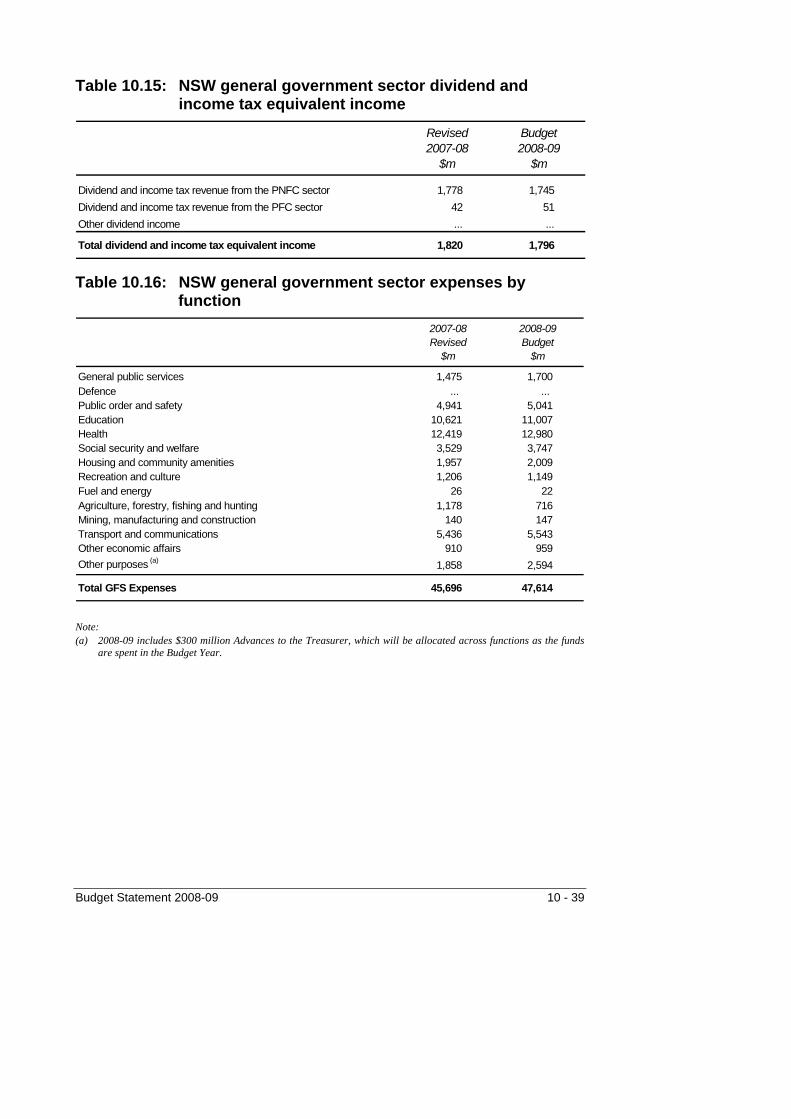
Table 10.15: NSW general government sector dividend and income tax equivalent income
Revised2007-08
$m
Budget2008-09
$m
Dividend and income tax revenue from the PNFC sector 1,778 1,745 Dividend and income tax revenue from the PFC sector 42 51 Other dividend income ... ...
Total dividend and income tax equivalent income 1,820 1,796
Table 10.16: NSW general government sector expenses by function
2007-08Revised
$m
2008-09Budget
$m
General public services 1,475 1,700 Defence ... ... Public order and safety 4,941 5,041 Education 10,621 11,007 Health 12,419 12,980 Social security and welfare 3,529 3,747 Housing and community amenities 1,957 2,009 Recreation and culture 1,206 1,149 Fuel and energy 26 22 Agriculture, forestry, fishing and hunting 1,178 716 Mining, manufacturing and construction 140 147 Transport and communications 5,436 5,543 Other economic affairs 910 959 Other purposes (a) 1,858 2,594
Total GFS Expenses 45,696 47,614
Note: (a) 2008-09 includes $300 million Advances to the Treasurer, which will be allocated across functions as the funds
are spent in the Budget Year.
Budget Statement 2008-09 10 - 39

Table 10.17: NSW general government sector purchases of non-financial assets (a)
2007-08Revised
$m
2008-09Budget
$m
General public services 347 317 Defence ... ... Public order and safety 404 410 Education 525 698 Health 580 613 Social security and welfare 103 149 Housing and community amenities 179 194 Recreation and culture 225 152 Fuel and energy ... ... Agriculture, forestry, fishing and hunting 27 32 Mining, manufacturing and construction 8 10 Transport and communications 2,032 2,422 Other economic affairs 33 42
Other purposes (b) 78 119
Total GFS Purchases of Non-Financial Assets 4,541 5,158
Notes: (a) Non-financial assets include land and second hand assets, however exclude assets acquired under finance leases. (b) 2008-09 includes $100 million Advances to the Treasurer, which will be allocated across functions as the funds
are spent in the Budget Year.
10 - 40 Budget Statement 2008-09
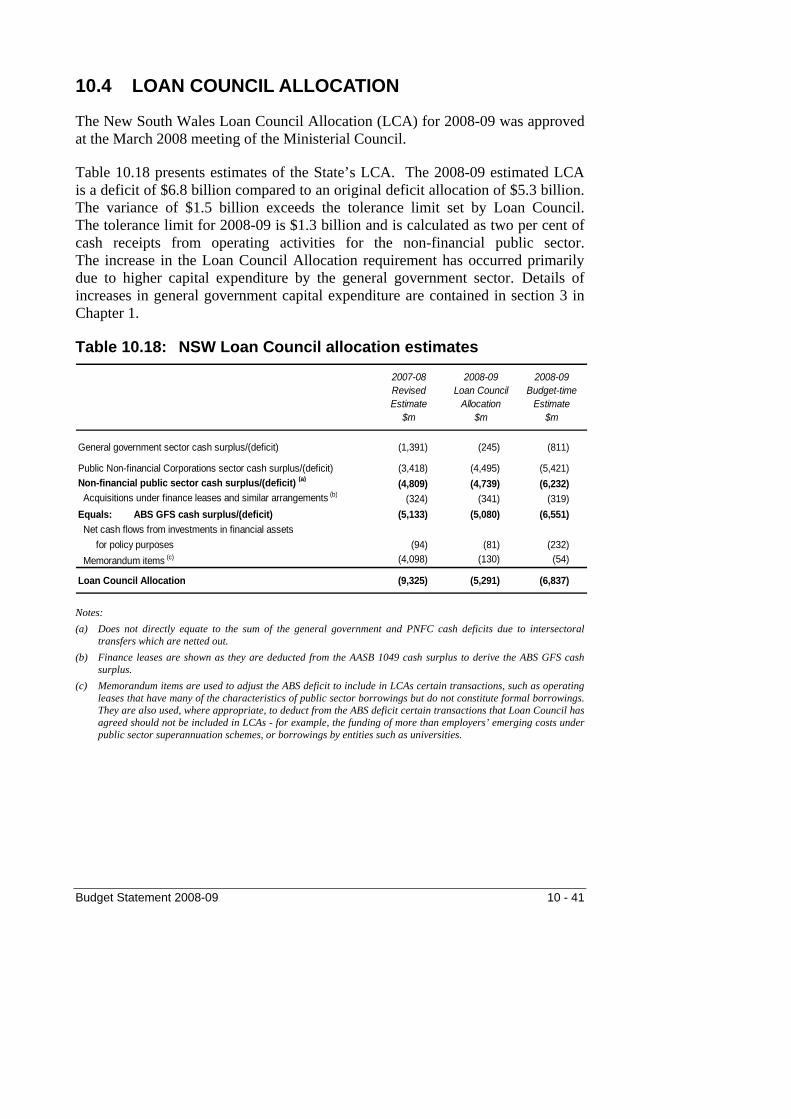
10.4 LOAN COUNCIL ALLOCATION
The New South Wales Loan Council Allocation (LCA) for 2008-09 was approved at the March 2008 meeting of the Ministerial Council.
Table 10.18 presents estimates of the State’s LCA. The 2008-09 estimated LCA is a deficit of $6.8 billion compared to an original deficit allocation of $5.3 billion. The variance of $1.5 billion exceeds the tolerance limit set by Loan Council. The tolerance limit for 2008-09 is $1.3 billion and is calculated as two per cent of cash receipts from operating activities for the non-financial public sector. The increase in the Loan Council Allocation requirement has occurred primarily due to higher capital expenditure by the general government sector. Details of increases in general government capital expenditure are contained in section 3 in Chapter 1.
Table 10.18: NSW Loan Council allocation estimates
2007-08Revised Estimate
$m
2008-09Loan Council
Allocation$m
2008-09Budget-time
Estimate$m
General government sector cash surplus/(deficit) (1,391) (245) (811)
Public Non-financial Corporations sector cash surplus/(deficit) (3,418) (4,495) (5,421) Non-financial public sector cash surplus/(deficit) (a) (4,809) (4,739) (6,232) Acquisitions under finance leases and similar arrangements (b) (324) (341) (319) Equals: ABS GFS cash surplus/(deficit) (5,133) (5,080) (6,551) Net cash flows from investments in financial assets
for policy purposes (94) (81) (232) Memorandum items (c) (4,098) (130) (54)
Loan Council Allocation (9,325) (5,291) (6,837)
Notes: (a) Does not directly equate to the sum of the general government and PNFC cash deficits due to intersectoral
transfers which are netted out. (b) Finance leases are shown as they are deducted from the AASB 1049 cash surplus to derive the ABS GFS cash
surplus. (c) Memorandum items are used to adjust the ABS deficit to include in LCAs certain transactions, such as operating
leases that have many of the characteristics of public sector borrowings but do not constitute formal borrowings. They are also used, where appropriate, to deduct from the ABS deficit certain transactions that Loan Council has agreed should not be included in LCAs - for example, the funding of more than employers’ emerging costs under public sector superannuation schemes, or borrowings by entities such as universities.
Budget Statement 2008-09 10 - 41
PRIVATELY FINANCED PROJECTS As confirmed at the 1997 Loan Council meeting, States are to report their full contingent exposure to Privately Financed Projects. Exposure is to be measured by the Government’s termination liabilities in a case of private sector default and disclosed as a footnote to, rather than a component of, Loan Council Allocations.
2007-08 Contracts None to be reported.
2008-09 Contracts None to be reported.
10 - 42 Budget Statement 2008-09

APPENDIX A: PROGRESS AGAINST FISCAL RESPONSIBILITY ACT 2005 TARGETS AND PRINCIPLES
Fiscal Target
Progress Indicator
Legislative Target Status
Fiscal target:
- Medium term General government sector net financial liabilities
At or below 7.5 per cent GSP by June 2010
General government net financial liabilities estimated to be 8.5 per cent of GSP at 30 June 2010, but falling to 8 per cent by 2012.
General government sector net debt
Maintain as share of GSP at or below level at June 2005 (0.8 per cent of GSP; originally 1 per cent)
Due to the increased capital program general government net debt is estimated to be 1.7 per cent of GSP at 30 June 2012.
- Long term General government sector net financial liabilities
At or below 6 per cent of GSP by June 2015
General government net financial liabilities are estimated to be 8 per cent of GSP at 30 June 2012 and trending down towards the 2015 target.
General government sector net debt
Maintain as share of GSP at or below level at June 2005
General government net debt estimated to be stable at 1.7 per cent of GSP at 30 June 2012.
Total state sector unfunded super-annuation liabilities
Eliminated by 30 June 2030
On target. Employer contributions being assessed periodically to ensure full funding by 2030. Long-term funding plan recognises that gross liabilities will continue to increase, peaking in 2013, and then decline subsequently and be fully funded by 2030. Total state underlying net unfunded superannuation liabilities are estimated to be $17.8 billion in June 2009 (4.6 per cent of GSP), and $20.9 billion in June 2012 (4.6 per cent of GSP).
Budget Statement 2008-09 A - 1
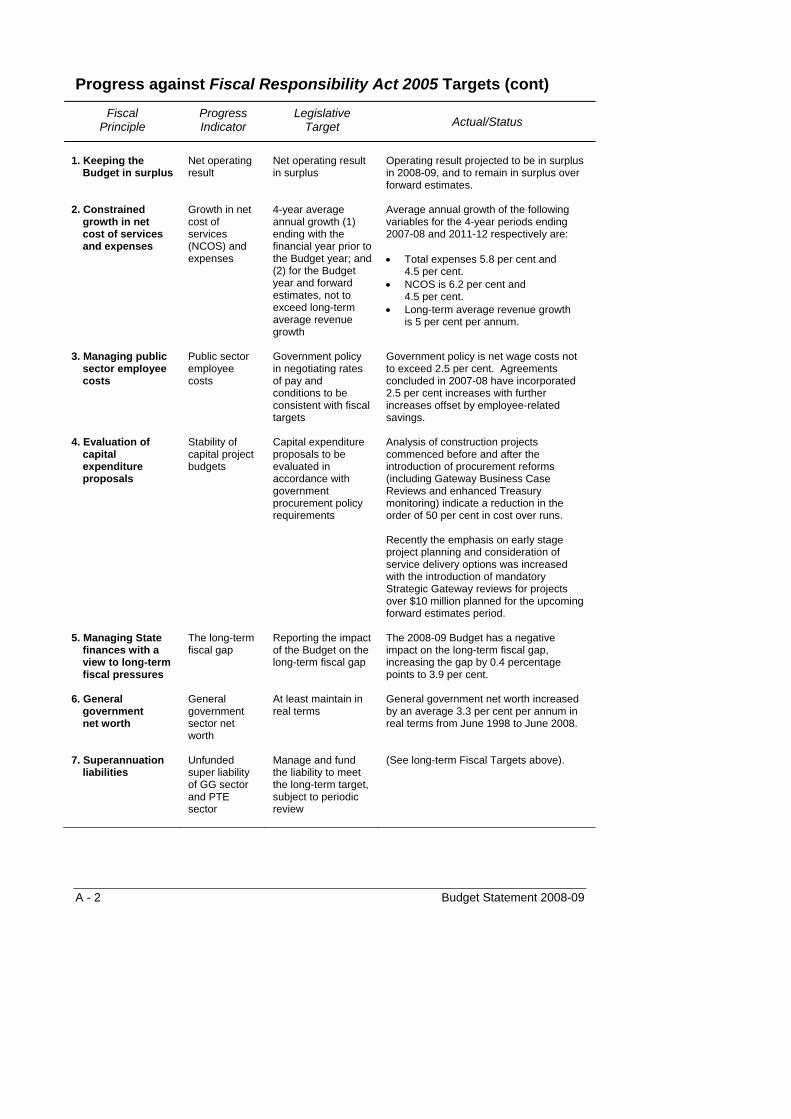
Progress against Fiscal Responsibility Act 2005 Targets (cont)
Fiscal Principle
Progress Indicator
Legislative Target Actual/Status
1. Keeping the
Budget in surplus
Net operating result
Net operating result in surplus
Operating result projected to be in surplus in 2008-09, and to remain in surplus over forward estimates.
2. Constrained growth in net cost of services and expenses
Growth in net cost of services (NCOS) and expenses
4-year average annual growth (1) ending with the financial year prior to the Budget year; and (2) for the Budget year and forward estimates, not to exceed long-term average revenue growth
Average annual growth of the following variables for the 4-year periods ending 2007-08 and 2011-12 respectively are: • Total expenses 5.8 per cent and
4.5 per cent. • NCOS is 6.2 per cent and
4.5 per cent. • Long-term average revenue growth
is 5 per cent per annum.
3. Managing public sector employee costs
Public sector employee costs
Government policy in negotiating rates of pay and conditions to be consistent with fiscal targets
Government policy is net wage costs not to exceed 2.5 per cent. Agreements concluded in 2007-08 have incorporated 2.5 per cent increases with further increases offset by employee-related savings.
4. Evaluation of capital expenditure proposals
Stability of capital project budgets
Capital expenditure proposals to be evaluated in accordance with government procurement policy requirements
Analysis of construction projects commenced before and after the introduction of procurement reforms (including Gateway Business Case Reviews and enhanced Treasury monitoring) indicate a reduction in the order of 50 per cent in cost over runs. Recently the emphasis on early stage project planning and consideration of service delivery options was increased with the introduction of mandatory Strategic Gateway reviews for projects over $10 million planned for the upcoming forward estimates period.
5. Managing State finances with a view to long-term fiscal pressures
The long-term fiscal gap
Reporting the impact of the Budget on the long-term fiscal gap
The 2008-09 Budget has a negative impact on the long-term fiscal gap, increasing the gap by 0.4 percentage points to 3.9 per cent.
6. General government net worth
General government sector net worth
At least maintain in real terms
General government net worth increased by an average 3.3 per cent per annum in real terms from June 1998 to June 2008.
7. Superannuation liabilities
Unfunded super liability of GG sector and PTE sector
Manage and fund the liability to meet the long-term target, subject to periodic review
(See long-term Fiscal Targets above).
A - 2 Budget Statement 2008-09

Progress against Fiscal Responsibility Act 2005 Targets (cont)
Fiscal Principle
Progress Indicator
Legislative Target Actual/Status
8. Total asset
management Best practice asset maintenance or management policies
Progress reporting in budget papers on measures to implement this principle
Treasury receives Total Asset Management (TAM) strategies from agencies that manage 98.5 per cent of general government holdings. TAM strategies are an essential part of the capital budget process. Government uses TAM strategies to prioritise investments and forecast infrastructure requirements.
9. Prudent risk management
Financial risk management comprising total state sector net financial liabilities; contingent liabilities; and total state debt and financial assets
Progress reporting in budget papers on measures to implement this principle
Aggregate risk is managed by Treasury, TCorp and the NSW Self Insurance Corporation. Includes ongoing review of asset allocation and risk management policies and procedures of authorities subject to the Public Authorities (Financial Arrangements) Act 1987. Agency and project level risk identification procedures and strategies are in place or being developed through the Financial Management Framework; the Commercial Policy Framework; and Total Asset Management guidelines. The latter incorporates Working with Government: Policy and Guidelines for Privately Financed Projects (as updated in 2006) dealing with private sector participation in the provision of public infrastructure.
10. Tax restraint Impact of tax policy measures
Adjustments to legislated tax rates, thresholds and bases to be made with maximum possible restraint; policies should enable predictability and stability of tax regime
Net effect of all tax policy changes since August 2005 is to reduce the NSW tax burden in 2008-09 by around $1.5 billion.
Budget Statement 2008-09 A - 3
APPENDIX B: STATEMENT OF ACCOUNTING PRINCIPLES AND POLICIES
FINANCIAL STATEMENTS In recent years the budget papers have included financial reports prepared using two different reporting frameworks – Government Finance Statistics (GFS) and Australian Accounting Standards incorporating generally accepted accounting principles (GAAP).
The budget aggregates have been amended for the 2008-09 Budget to adopt a single harmonised GFS-GAAP approach. The format of the harmonised financial statements and aggregates is based on the reporting standard AASB 1049 Whole of Government and General Government Financial Reporting. The Uniform Presentation Framework (UPF) (endorsed by the Australian Loan Council) was also revised to be consistent with AASB 1049, effective from this Budget.
Budget Paper No. 2 Budget Statement presents three budget financial statements that are consistent with AASB 1049:
Operating Statement ♦
♦
♦
Balance Sheet
Cash Flow Statement.
Consolidated budget financial statements
All consolidated sector reports in this budget paper have been prepared for the first time based on AASB 1049, which adopts a harmonised GFS-GAAP framework. This particularly affects the sector reports published in Chapter 1 and the UPF statements in Chapter 10, which were prepared in previous years on a pure GFS basis.
Budget Statement 2008-09 B - 1

The general rules for adopting AASB 1049 are:
Consolidated sector financial reports are prepared in accordance with recognition, measurement and disclosure requirements as per GAAP.
♦
♦
♦
Where options exist in accounting standards, the option that is consistent with GFS must be chosen to minimise convergence differences. However, where there is any conflict between GAAP and GFS, GAAP prevails.
Amended presentation requirements exist including a harmonised operating statement. The statement dissects revenues and expenses into transactions and other economic flows, as defined by the ABS GFS Manual.
Full convergence on GFS and GAAP has not been achieved. This means that there are some differences between AASB 1049 harmonised aggregates in the budget papers and the pure GFS information that the ABS reports. For example, the timing of the ABS’s accrual treatment for Australian road transport grants differs to the cash recognition treatment adopted under accounting standards. Details of the other main convergence differences can be found in Chapter 10 under the heading Primary Financial Statements, where the convergence differences have been reported for each of the primary statements.
AASB 1049 is applicable for consolidated sector reporting. It does not apply for individual agency reporting.
Agency accounting based reports
Agency statements in Budget Paper No. 3 Budget Estimates have been prepared in accordance with Australian Accounting Standards and generally accepted accounting principles (GAAP). However as AASB 1049 is applicable for consolidated sector reporting only, the agency statements are not prepared on a GFS-GAAP harmonised basis.
Agency operating statements include all accrued expenses and revenues and reflect the operating result for the individual general government agencies. This differs from the budget result (net operating balance) in Chapter 1 which is prepared on a AASB 1049 harmonised basis. The harmonised budget result has an economic focus and for this reason excludes from the net operating balance any revenues and expenses related to the revaluation of assets or liabilities. These types of revenues and expenses are largely outside the control of governments.
B - 2 Budget Statement 2008-09

Examples of these revenues or expenses included in the agency accounting operating result but excluded from the budget result are:
superannuation actuarial assessments ♦
♦
♦
♦
gains or losses on the sale of assets and
gains or losses associated with debt management activities.
The harmonised AASB 1049 operating statement discloses details of the above valuation adjustments as other economic flows, reporting them below the consolidated net operating balance (i.e. the Budget result for the general government sector). The AASB 1049 harmonised financial reports also reflect the accounting operating result which is the same concept as the agency operating result. However the difference is that for the harmonised AASB 1049 financial reports, the focus is on the budget result (net operating balance), above the accounting operating result, and the net operating balance is not disclosed in the agency operating statements.
The presentation of agency operating statements in Budget Paper No. 3 Budget Estimates is less than that required under accounting standards. This is because budget paper presentation has been prepared to focus on agency operations and their net cost of services. Therefore, operating statements exclude government contributions that are normally required under accounting standards. In addition there is no disclosure of agency non-operating equity movements, as most agencies have minimal equity changes, aside from their operating results.
DEPARTURES FROM AUSTRALIAN ACCOUNTING STANDARDS Under the Public Finance and Audit Act 1983, the Treasurer is required to present a statement that discusses the nature of and the reasons for any departure from AAS principles in relation to general government financial statements.
The budget preparation departs from Australian Accounting Standards as follows:
Certain reserve trusts created under the Crown Lands Act 1989 have been excluded. There are approximately 33,000 Crown reserves in New South Wales. Some of these reserves are managed by the NSW Government and others by local governments and trusts. A project has commenced to identify and value Crown reserves controlled by the NSW Government.
Budget Statement 2008-09 B - 3
The likely value of the reserves controlled by the NSW Government cannot be estimated with any certainty. First estimates based on preliminary data are that the total value of these reserves may be between $1 billion and $7 billion. However, the total value may be outside this range. The NSW Government will recognise the value of Crown reserves it controls in future Total State Sector Accounts, once this project is complete and the value can be reliably estimated.
The Auditor-General has qualified his opinion on the 2006-07 Total State Sector Accounts. In his opinion:
As disclosed in Note 1 Statement of Significant Accounting Policies, under the heading Principle of Consolidation, the State is undertaking a project to identify and value the Crown reserves it controls under the Crown Lands Act 1989. Until the project is completed, I am unable to obtain all the information I require to form an opinion on the value of those Crown reserves that should be recognised as land in the financial report.
♦
•
•
♦
Since the adoption of AEIFRS in 2005-06, accounting standards require that comparative financial information be restated in accordance with changes in accounting treatments and new standards. Throughout the 2008-09 Budget papers, information for the 2004-05 and previous financial years has not been restated on an AEIFRS basis. In particular,
for 2004-05, the information presented is on a pre-AEIFRS basis to be consistent with the presentation in the 2004-05 Budget papers and audited financial reports and
for 2003-04 and earlier years, financial information is not available on an AEIFRS basis.
It is impracticable to analyse all historic transactions to ensure that they were measured and reported consistent with AASB 1049. The consolidated results published in this budget paper have been back cast on a harmonised GFS-GAAP basis on a best endeavours basis. For example, historic information in the consolidated operating statements has been recast on the basis of available dissections between GFS transactions and other economic flows. Further, land and fixed assets prior to 2005-06 cannot be dissected into its component classes, to match the assets classes that have been reported since 2005-06.
Details of the main convergence differences between GFS and GAAP are explained in Chapter 10. Convergence differences are not departures from accounting standards. In accordance with AASB 1049 requirements, full details of convergence differences will be disclosed in the 2008-09 Outcomes Report.
B - 4 Budget Statement 2008-09
BUDGET SCOPE The Budget incorporates all general government sector agencies as defined by the Australian Bureau of Statistics, subject to a materiality threshold. A list of NSW public sector agencies (classified according to sector) appears in Appendix C.
The general government sector covers all agencies that receive parliamentary appropriations or are regulatory in nature.
Defining the budget sector as equal to the general government sector improves transparency and accountability by providing a comprehensive picture of the non-commercial operations of the Government, and an independent definition of the budget’s scope.
The financial transactions of public financial enterprise (PFE) sector and public trading enterprise (PTE) sector agencies are not generally reflected in the budget aggregates.
However, there are exceptions to the above which the budget aggregates do include. These are:
explicit payments for social programs, which are non-commercial functions required of PTEs by the Government
♦
♦
♦
dividends, tax equivalent payments and guarantee fees payable by the PTEs and PFEs which are shown as revenues in the general government sector and
general government sector investment in the PTE and PFE sectors entities.
Another important measure of the Government’s performance is how they are managing the total state sector balance sheet. Chapter 6 includes commentary on the management of total state sector financial assets and liabilities, including net debt and superannuation liabilities.
Similarly, Chapter 10 includes financial information presented in accordance with AASB 1049 for the general government sector, the public trading enterprise sector and the non-financial public sector. This fulfils uniform presentation framework requirements agreed between the Commonwealth and State governments.
Budget Statement 2008-09 B - 5
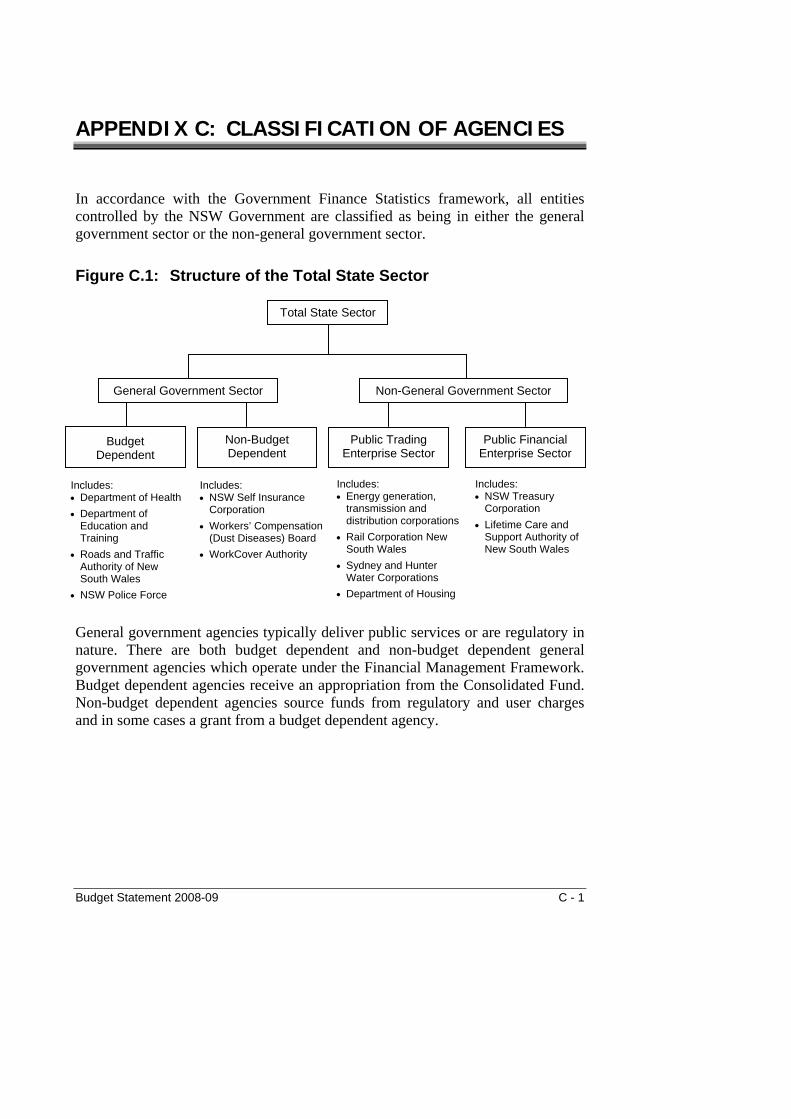
APPENDIX C: CLASSIFICATION OF AGENCIES
In accordance with the Government Finance Statistics framework, all entities controlled by the NSW Government are classified as being in either the general government sector or the non-general government sector.
Figure C.1:
Includes: • Energy generation,
transmission and distribution corporations
• Rail Corporation New South Wales
• Sydney and Hunter Water Corporations
• Department of Housing
Structure of the Total State Sector
Total State Sector
General government agencies typically deliver public services or are regulatory in nature. There are both budget dependent and non-budget dependent general government agencies which operate under the Financial Management Framework. Budget dependent agencies receive an appropriation from the Consolidated Fund. Non-budget dependent agencies source funds from regulatory and user charges and in some cases a grant from a budget dependent agency.
General Government Sector Non-General Government Sector
Budget Dependent
Non-Budget Dependent
Public Financial Enterprise Sector
Public Trading Enterprise Sector
Includes: • Department of Health • Department of
Education and Training
• Roads and Traffic Authority of New South Wales
• NSW Police Force
Includes: • NSW Treasury
Corporation • Lifetime Care and
Support Authority of New South Wales
Includes: • NSW Self Insurance
Corporation • Workers’ Compensation
(Dust Diseases) Board • WorkCover Authority
Budget Statement 2008-09 C - 1
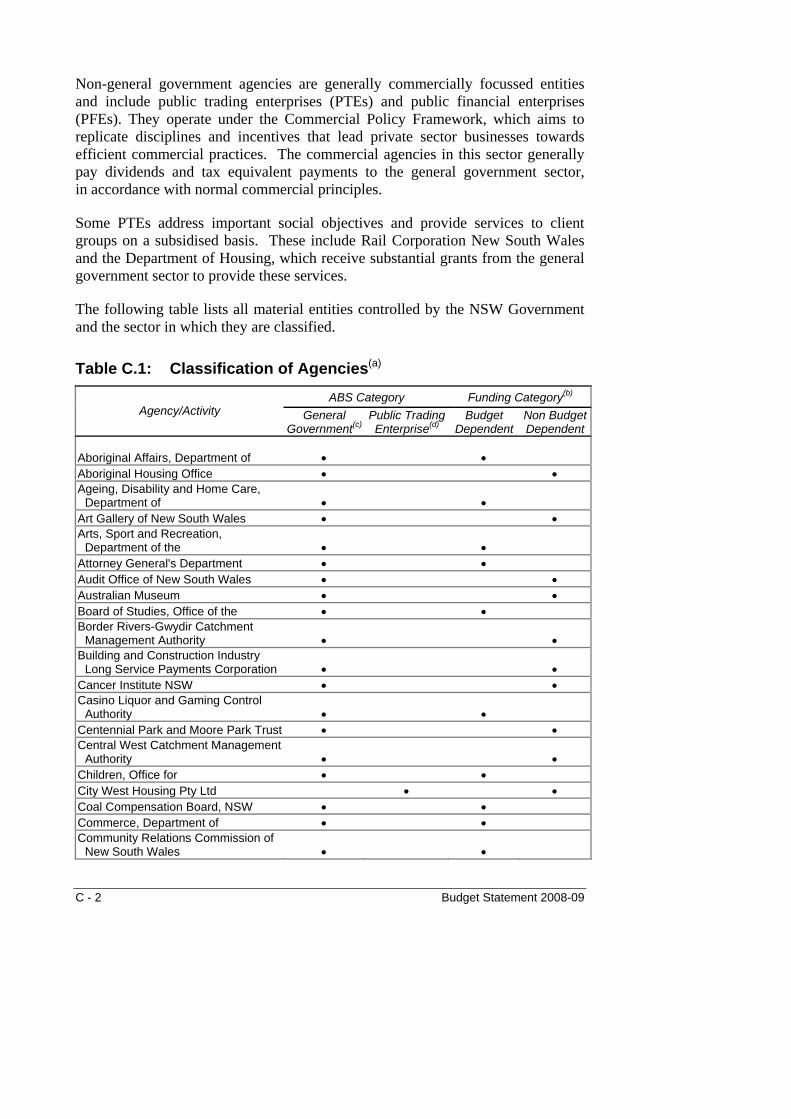
Non-general government agencies are generally commercially focussed entities and include public trading enterprises (PTEs) and public financial enterprises (PFEs). They operate under the Commercial Policy Framework, which aims to replicate disciplines and incentives that lead private sector businesses towards efficient commercial practices. The commercial agencies in this sector generally pay dividends and tax equivalent payments to the general government sector, in accordance with normal commercial principles.
Some PTEs address important social objectives and provide services to client groups on a subsidised basis. These include Rail Corporation New South Wales and the Department of Housing, which receive substantial grants from the general government sector to provide these services.
The following table lists all material entities controlled by the NSW Government and the sector in which they are classified.
Table C.1: Classification of Agencies(a) ABS Category Funding Category(b)
Agency/Activity General Government(c)
Public Trading Enterprise(d)
Budget Dependent
Non Budget Dependent
Aboriginal Affairs, Department of • • Aboriginal Housing Office • • Ageing, Disability and Home Care,
Department of • • Art Gallery of New South Wales • • Arts, Sport and Recreation,
Department of the • • Attorney General's Department • • Audit Office of New South Wales • • Australian Museum • • Board of Studies, Office of the • • Border Rivers-Gwydir Catchment
Management Authority • • Building and Construction Industry
Long Service Payments Corporation • • Cancer Institute NSW • • Casino Liquor and Gaming Control
Authority • • Centennial Park and Moore Park Trust • • Central West Catchment Management
Authority • • Children, Office for • • City West Housing Pty Ltd • • Coal Compensation Board, NSW • • Commerce, Department of • • Community Relations Commission of
New South Wales • •
C - 2 Budget Statement 2008-09

ABS Category Funding Category(b)
Agency/Activity General Government(c)
Public Trading Enterprise(d)
Budget Dependent
Non Budget Dependent
Community Services, Department of • • Corrective Services, Department of • • Country Energy • • Crime Commission, New South Wales • • Crown Finance Entity • • Crown Land Homesites • • Crown Leaseholds Entity • • Delta Electricity • • Education and Training, Department
of • • Electoral Commission, NSW • • Electricity Tariff Equalisation
Ministerial Corporation • • EnergyAustralia • • Environment and Climate Change,
Department of • • Environmental Trust • • Eraring Energy • • Events New South Wales Pty Limited • • Film and Television Office, New South
Wales • • Fire Brigades, New South Wales • • Food Authority, NSW • • Forests NSW • • Growth Centres Commission • • Hawkesbury-Nepean Catchment
Management Authority • • Health Care Complaints Commission • • Health, Department of (including Area
Health Services, Ambulance Service of NSW, Justice Health Service and Westmead Children’s Hospital) • •
Historic Houses Trust of New South Wales • •
Home Care Service of New South Wales • •
Home Purchase Assistance Fund • • Housing, Department of • • Hunter Development Corporation • • Hunter Water Corporation • • Hunter-Central Rivers Catchment
Management Authority • • Independent Commission Against
Corruption • • Independent Pricing and Regulatory
Tribunal • • Independent Transport Safety and
Reliability Regulator • • Integral Energy • •
Budget Statement 2008-09 C - 3
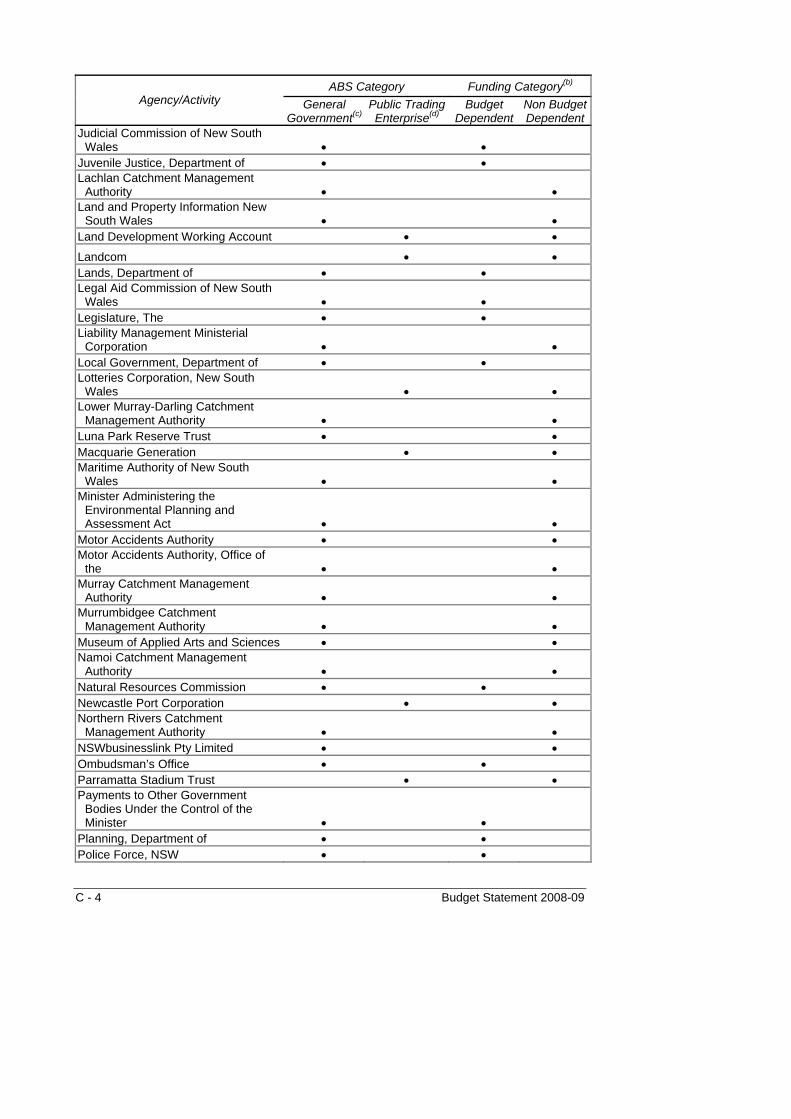
ABS Category Funding Category(b)
Agency/Activity General Government(c)
Public Trading Enterprise(d)
Budget Dependent
Non Budget Dependent
Judicial Commission of New South Wales • •
Juvenile Justice, Department of • • Lachlan Catchment Management
Authority • • Land and Property Information New
South Wales • • Land Development Working Account • •
Landcom • • Lands, Department of • • Legal Aid Commission of New South
Wales • • Legislature, The • • Liability Management Ministerial
Corporation • • Local Government, Department of • • Lotteries Corporation, New South
Wales • • Lower Murray-Darling Catchment
Management Authority • • Luna Park Reserve Trust • • Macquarie Generation • • Maritime Authority of New South
Wales • • Minister Administering the
Environmental Planning and Assessment Act • •
Motor Accidents Authority • • Motor Accidents Authority, Office of
the • • Murray Catchment Management
Authority • • Murrumbidgee Catchment
Management Authority • • Museum of Applied Arts and Sciences • • Namoi Catchment Management
Authority • • Natural Resources Commission • • Newcastle Port Corporation • • Northern Rivers Catchment
Management Authority • • NSWbusinesslink Pty Limited • • Ombudsman’s Office • • Parramatta Stadium Trust • • Payments to Other Government
Bodies Under the Control of the Minister • •
Planning, Department of • • Police Force, NSW • •
C - 4 Budget Statement 2008-09

ABS Category Funding Category(b)
Agency/Activity General Government(c)
Public Trading Enterprise(d)
Budget Dependent
Non Budget Dependent
Police Integrity Commission • • Police, Ministry for • • Port Kembla Port Corporation • • Premier and Cabinet, Department of • • Primary Industries, Department of • • Public Prosecutions, Office of the
Director of • • Public Transport Ticketing Corporation • • Public Trustee NSW • • Rail Corporation New South Wales • • Rail Infrastructure Corporation • • Redfern-Waterloo Authority • • Rental Bond Board • • Residual Business Management
Corporation • • Roads and Traffic Authority of New
South Wales • • Royal Botanic Gardens and Domain
Trust • • Rural Assistance Authority, NSW • • Rural Fire Service, Department of • • Self Insurance Corporation, NSW • • Southern Rivers Catchment
Management Authority • • State and Regional Development,
Department of • • State Emergency Service • • State Library of New South Wales • • State Property Authority • • State Records Authority • • State Sports Centre Trust • • State Transit Authority • • State Water Corporation • • Superannuation Administration
Corporation • • Sydney 2009 World Masters Games
Organising Committee • • Sydney Catchment Authority • • Sydney Cricket and Sports Ground
Trust • • Sydney Ferries • • Sydney Harbour Foreshore Authority • • Sydney Metropolitan Catchment
Management Authority • • Sydney Olympic Park Authority • • Sydney Opera House • • Sydney Ports Corporation • • Sydney Water Corporation • •
Budget Statement 2008-09 C - 5

ABS Category Funding Category(b)
Agency/Activity General Government(c)
Public Trading Enterprise(d)
Budget Dependent
Non Budget Dependent
Teacher Housing Authority of New South Wales • •
TransGrid • • Transport Infrastructure Development
Corporation • • Transport Safety Investigations, Office
of • • Transport, Ministry of • • Treasury • • Water and Energy, Department of • • Western Catchment Management
Authority • • Western Sydney Parklands Trust • • Wollongong Sports Ground Trust • • WorkCover Authority • • WorkCover Authority, Office of the • • Workers’ Compensation (Dust
Diseases) Board • • World Youth Day Co-ordination
Authority • • WSN Environmental Solutions • • Zoological Parks Board of New South
Wales • • (a) While not listed here all public financial enterprises – NSW Treasury Corporation, Lifetime Care and Support
Authority of New South Wales, Fair Trading Administration Corporation and the controlled FANMAC Trusts – also provide data that is included in these Budget Papers.
(b) Based on the extent of the agency reliance on Consolidated Fund allocations. (c) Equates to the scope of the Budget in New South Wales. (d) The public trading enterprise (PTE) sector is also referred to by the ABS as the public non-financial corporations
(PNFC) sector.
C - 6 Budget Statement 2008-09

Budg
et Statem
ent 2008-09 D
- 1
APPENDIX D: 2007-08 BUDGET - SUMMARY OF VARIATIONS
Category/Agency Budget Revised Variation Comment on major variations $m $m $m
TaxationStamp Duty: Transfer Duty 3,670 4,064 394 Stronger than expected sales of residential and small and large commercial
properties. Mortgage Duty 243 277 34 Higher than expected investor and commercial transactions.Land Tax 1,752 1,970 218 Faster than expected land value growth, particularly for high value properties and
higher than expected number of assessments from the 2007 land tax year processed.
Payroll Tax 5,992 6,182 190 Stronger than expected wage and employment growth.CTP Levy 37 70 33 Higher CTP premium revenue following increase in CTP levy.Workers Compensation (Dust Diseases) Board 26 61 35 Increase in premium revenue to offset lower investment returns. Club and Gaming Device Duties 1,061 1,005 (56) Lower than expected club and hotel gaming duty following the introduction of the
smoking ban.Other Duties and Taxes 4,772 4,837 65 Aggregated net minor variations.
Total Taxation 17,553 18,466 913
Commonwealth GrantsGeneral Purpose: GST Revenue Grants 11,926 12,060 134 Revisions reflecting higher pool estimates.Specific Purpose: Department of Health 3,576 3,796 220 Mainly additional funding under the Australian Health Care Agreement. Rural Assistance Authority 175 380 205 Funding of drought assistance under the Exceptional Circumstances Scheme. Department of Environment and Climate Change 4 67 63 Additional funding for the purchase of water licenses.

D - 2
Budget S
tatement 2008-09
Category/Agency Budget Revised Variation Comment on major variations $m $m $m
Department of Water and Energy 3 66 63 Mainly contribution to the Achieving Sustainable Groundwater Entitlements program. Department of Education and Training 1,404 1,453 49 Incorporation of the COAG Programs: Digital Education Revolution, Trade Training
Centres and Additional Training Places for Existing Workers. Department of Primary Industries 4 53 49 Funding for the response to equine influenza under a national cost-sharing scheme. Ministry of Transport ... 20 20 Western Metro feasibility study - unbudgeted grant from the Commonwealth. Other 1,688 1,705 17 Aggregated net minor variations.
Total Commonwealth Grants 18,780 19,600 820
Other Grants and ContributionsRoads and Traffic Authority of New South Wales ... 144 144 Recognition of a non-cash capital grant from Queensland following the completion of
the Tugun Bypass and its transfer from Queensland to New South Wales.Crown Leaseholds Entity 1 60 59 Land held by Crown Reserve Trusts returned to Crown Lands at notional value. Other 811 849 38 Aggregated net minor variations.
Total Other Grants and Contributions 812 1,053 241
Sales of Goods and ServicesRoads and Traffic Authority of New South Wales 282 319 37 Various revenue increases including plate fees and external services.Department of Education and Training 346 379 33 Course fee and VET revenue offset by expenditures below. Other 2,795 2,776 (19) Aggregated net minor variances.
Total Sales of Goods and Services 3,423 3,474 51
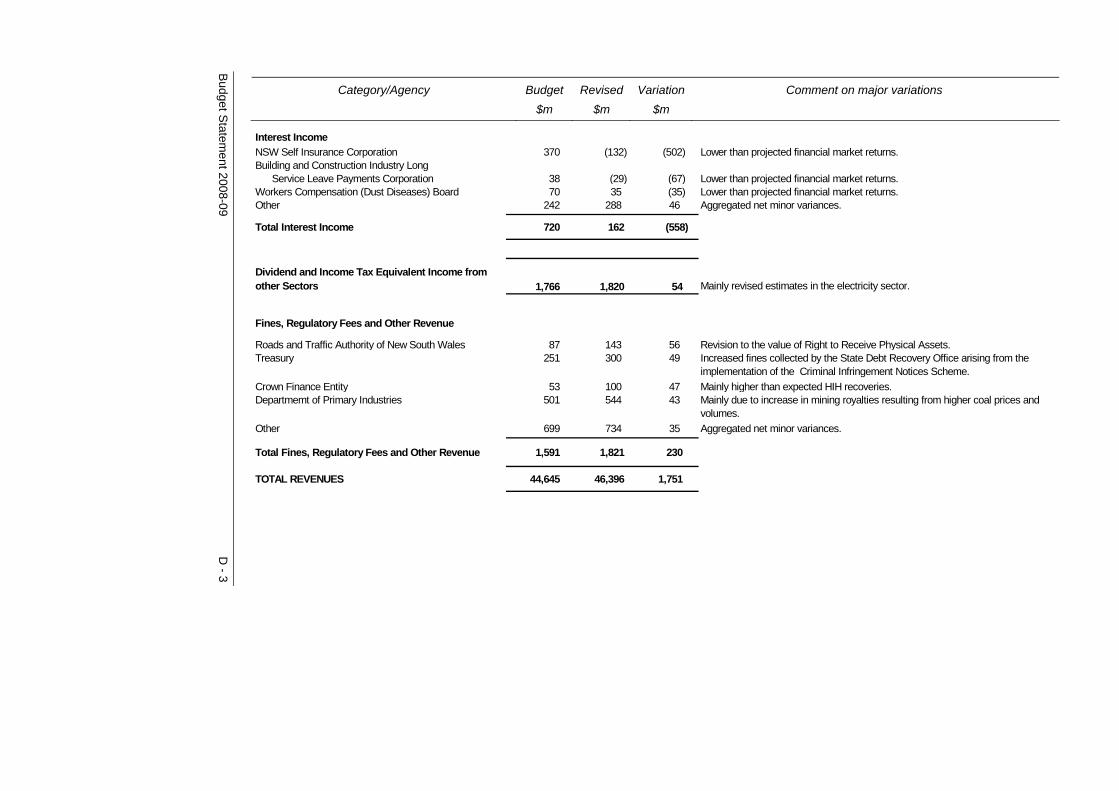
Budg
et Statem
ent 2008-09 D
- 3
Category/Agency Budget Revised Variation Comment on major variations $m $m $m
Interest IncomeNSW Self Insurance Corporation 370 (132) (502) Lower than projected financial market returns.Building and Construction Industry Long Service Leave Payments Corporation 38 (29) (67) Lower than projected financial market returns.Workers Compensation (Dust Diseases) Board 70 35 (35) Lower than projected financial market returns.Other 242 288 46 Aggregated net minor variances.
Total Interest Income 720 162 (558)
Dividend and Income Tax Equivalent Income from other Sectors 1,766 1,820 54 Mainly revised estimates in the electricity sector.
Fines, Regulatory Fees and Other Revenue
Roads and Traffic Authority of New South Wales 87 143 56 Revision to the value of Right to Receive Physical Assets.Treasury 251 300 49 Increased fines collected by the State Debt Recovery Office arising from the
implementation of the Criminal Infringement Notices Scheme.Crown Finance Entity 53 100 47 Mainly higher than expected HIH recoveries.Departmemt of Primary Industries 501 544 43 Mainly due to increase in mining royalties resulting from higher coal prices and
volumes.Other 699 734 35 Aggregated net minor variances.
Total Fines, Regulatory Fees and Other Revenue 1,591 1,821 230
TOTAL REVENUES 44,645 46,396 1,751
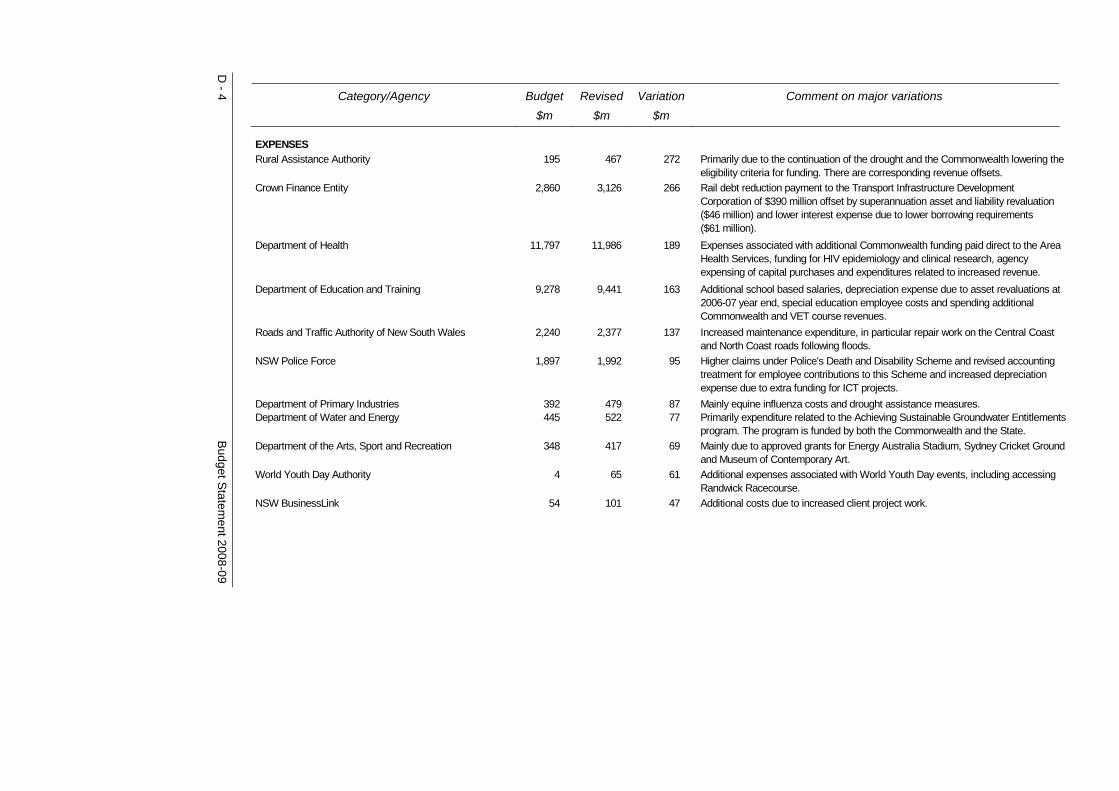
D - 4
Budget S
tatement 2008-09
Category/Agency Budget Revised Variation Comment on major variations $m $m $m
EXPENSESRural Assistance Authority 195 467 272 Primarily due to the continuation of the drought and the Commonwealth lowering the
eligibility criteria for funding. There are corresponding revenue offsets.Crown Finance Entity 2,860 3,126 266 Rail debt reduction payment to the Transport Infrastructure Development
Corporation of $390 million offset by superannuation asset and liability revaluation ($46 million) and lower interest expense due to lower borrowing requirements ($61 million).
Department of Health 11,797 11,986 189 Expenses associated with additional Commonwealth funding paid direct to the Area Health Services, funding for HIV epidemiology and clinical research, agency expensing of capital purchases and expenditures related to increased revenue.
Department of Education and Training 9,278 9,441 163 Additional school based salaries, depreciation expense due to asset revaluations at 2006-07 year end, special education employee costs and spending additional Commonwealth and VET course revenues.
Roads and Traffic Authority of New South Wales 2,240 2,377 137 Increased maintenance expenditure, in particular repair work on the Central Coast and North Coast roads following floods.
NSW Police Force 1,897 1,992 95 Higher claims under Police's Death and Disability Scheme and revised accounting treatment for employee contributions to this Scheme and increased depreciation expense due to extra funding for ICT projects.
Department of Primary Industries 392 479 87 Mainly equine influenza costs and drought assistance measures.Department of Water and Energy 445 522 77 Primarily expenditure related to the Achieving Sustainable Groundwater Entitlements
program. The program is funded by both the Commonwealth and the State.Department of the Arts, Sport and Recreation 348 417 69 Mainly due to approved grants for Energy Australia Stadium, Sydney Cricket Ground
and Museum of Contemporary Art. World Youth Day Authority 4 65 61 Additional expenses associated with World Youth Day events, including accessing
Randwick Racecourse.NSW BusinessLink 54 101 47 Additional costs due to increased client project work.

Budg
et Statem
ent 2008-09 D
- 5
Category/Agency Budget Revised Variation Comment on major variations $m $m $m
EXPENSES (cont) Department of Community Services 1,162 1,196 34 Increase in the number of children in Out of Home Care services. Treasury 482 512 30 Higher number of applicants for First Home Owners Grant than anticipated.Crown Leaseholds Entity 23 50 27 Grants of land to Local Councils and Crown Reserve Trusts.Department of Premier and Cabinet 136 159 23 Primarily expenses related to conducting three Special Commission of Inquiries
and transition to the new Ministry, including improved IT capability for the Minister's offices.
Department of Corrective Services 768 790 22 Variations in the department's program of workplace reforms.Events NSW Pty Ltd ... 21 21 Creation and funding of the new entity.Ministry of Transport 3,327 3,347 20 Western Metro feasibility study - onpassing of a Commonwealth grant of
$20 million plus a State Government contribution of $10 million to the Transport Infrastructure Development Corporation. Increased expenditure partly offset by lower than anticipated expenditure for the former State Rail Authority.
Motor Accidents Authority 11 26 15 Increase in grants for road safety initiatives and rehabilitation for motor vehicle accident victims.
NSW Self Insurance Corporation 1,126 757 (369) Reduction in the claims costs, particularly in relation to medical indemnity public liability and lower weekly benefit payments in worker's compensation.
Department of Commerce 760 734 (26) Mainly reflects amendment to Defined Benefit Super Scheme estimate consistent with the State Super final accounts for 2006-07.
Building and Industry Long Service Leave Coporation 100 84 (16) Mainly reduction in provision for long service leave arising from actuarial assessment.
Treasurer's Advance 215 ... (215) Increased expenses included in agency data.Other 6,985 7,047 62 Aggregated net minor variations.
TOTAL EXPENSES 44,605 45,696 1,091
BUDGET RESULT - SURPLUS/(DEFICIT) 40 700 660
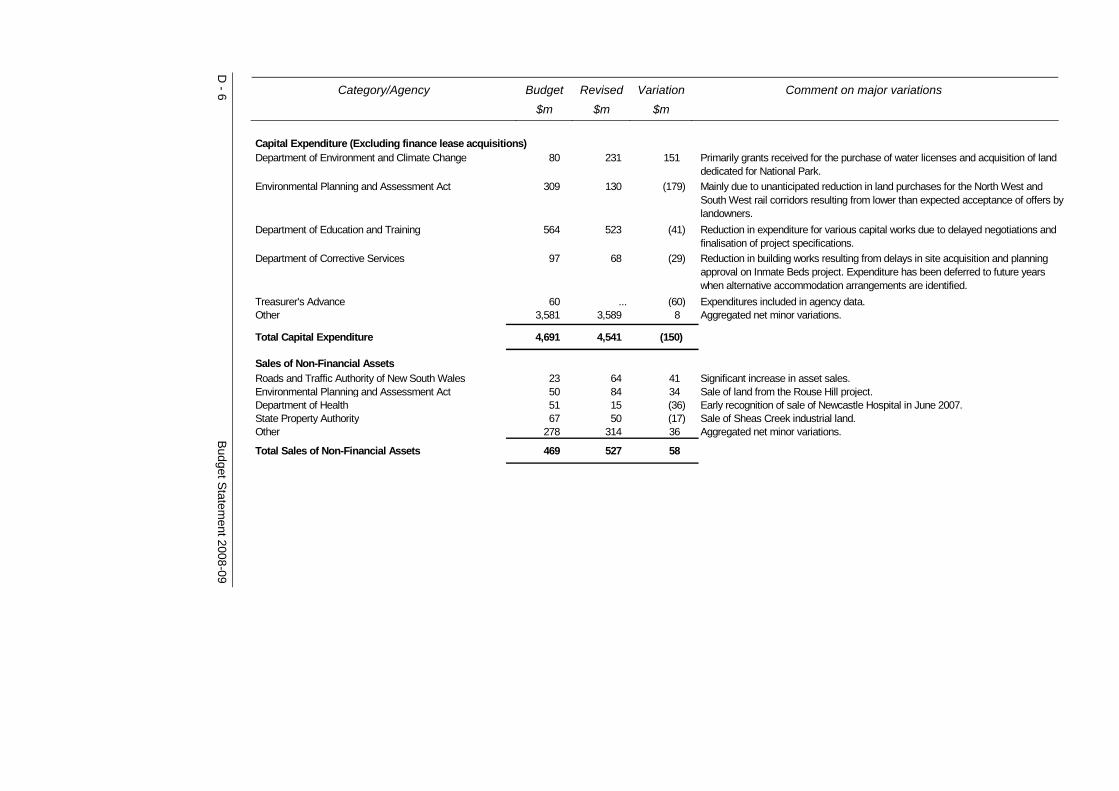
D - 6
Budget S
tatement 2008-09
Category/Agency Budget Revised Variation Comment on major variations $m $m $m
Department of Environment and Climate Change 80 231 151 Primarily grants received for the purchase of water licenses and acquisition of land dedicated for National Park.
Environmental Planning and Assessment Act 309 130 (179) Mainly due to unanticipated reduction in land purchases for the North West and South West rail corridors resulting from lower than expected acceptance of offers by landowners.
Department of Education and Training 564 523 (41) Reduction in expenditure for various capital works due to delayed negotiations and finalisation of project specifications.
Department of Corrective Services 97 68 (29) Reduction in building works resulting from delays in site acquisition and planning approval on Inmate Beds project. Expenditure has been deferred to future years when alternative accommodation arrangements are identified.
Treasurer's Advance 60 ... (60) Expenditures included in agency data. Other 3,581 3,589 8 Aggregated net minor variations.
Total Capital Expenditure 4,691 4,541 (150)
Sales of Non-Financial AssetsRoads and Traffic Authority of New South Wales 23 64 41 Significant increase in asset sales.Environmental Planning and Assessment Act 50 84 34 Sale of land from the Rouse Hill project. Department of Health 51 15 (36) Early recognition of sale of Newcastle Hospital in June 2007.State Property Authority 67 50 (17) Sale of Sheas Creek industrial land.Other 278 314 36 Aggregated net minor variations.
Total Sales of Non-Financial Assets 469 527 58
Capital Expenditure (Excluding finance lease acquisitions)
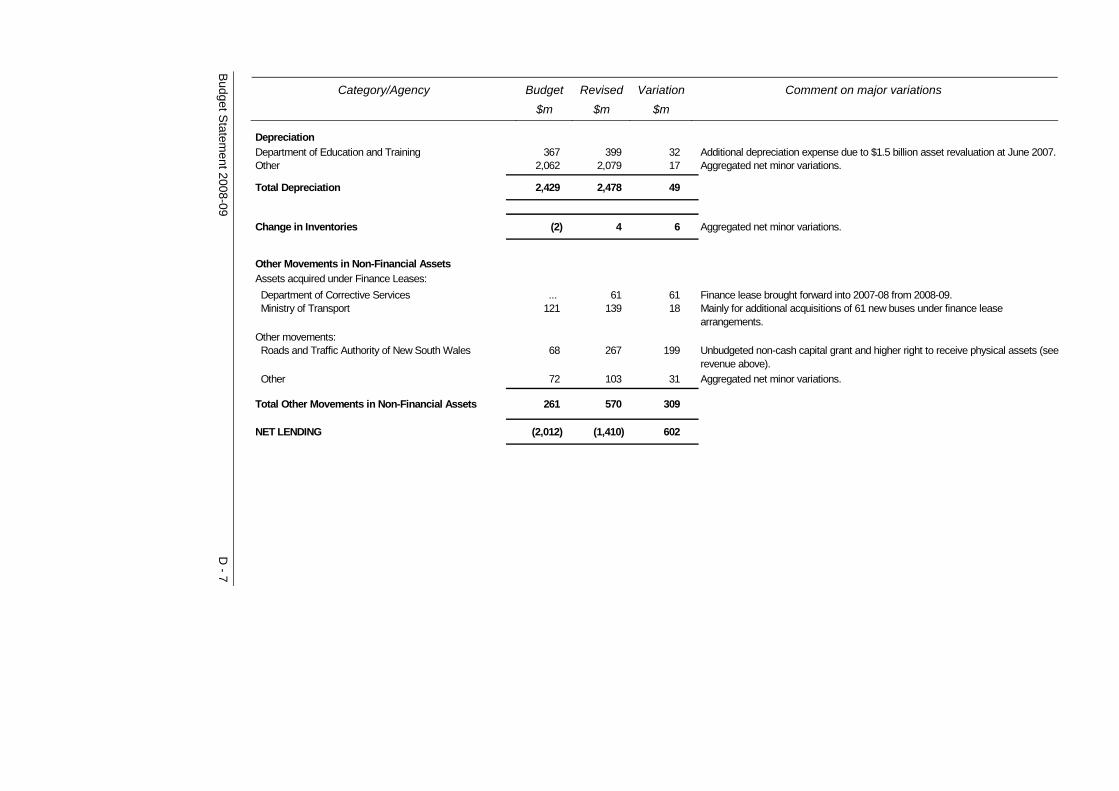
Budg
et Statem
ent 2008-09 D
- 7
Category/Agency Budget Revised Variation Comment on major variations $m $m $m
DepreciationDepartment of Education and Training 367 399 32 Additional depreciation expense due to $1.5 billion asset revaluation at June 2007. Other 2,062 2,079 17 Aggregated net minor variations.
Total Depreciation 2,429 2,478 49
Change in Inventories (2) 4 6 Aggregated net minor variations.
Other Movements in Non-Financial AssetsAssets acquired under Finance Leases: Department of Corrective Services ... 61 61 Finance lease brought forward into 2007-08 from 2008-09. Ministry of Transport 121 139 18 Mainly for additional acquisitions of 61 new buses under finance lease
arrangements.Other movements: Roads and Traffic Authority of New South Wales 68 267 199 Unbudgeted non-cash capital grant and higher right to receive physical assets (see
revenue above). Other 72 103 31 Aggregated net minor variations.
Total Other Movements in Non-Financial Assets 261 570 309
NET LENDING (2,012) (1,410) 602
APPENDIX E: TAX EXPENDITURE AND CONCESSIONAL CHARGES STATEMENT
E1: DETAILED ESTIMATES OF TAX EXPENDITURES
TRANSFER DUTY (INCLUDING “LAND RICH” DUTY) The benchmark tax rates for Purchaser Transfer Duty (other than for the Crown in right of New South Wales or the Commonwealth) are as follows:
for transfers relating to the purchase of non-residential property, the benchmark tax rate is defined against marginal tax rates varying from 1.25 to 5.5 per cent; and
♦
♦ for transfers relating to the purchase of residential property, the benchmark tax rate is defined against marginal rates varying from 1.25 to 7 per cent.
From 10 November 2004, duty applied to the disposal of indirect interests in land.
Budget Statement 2008-09 E - 1
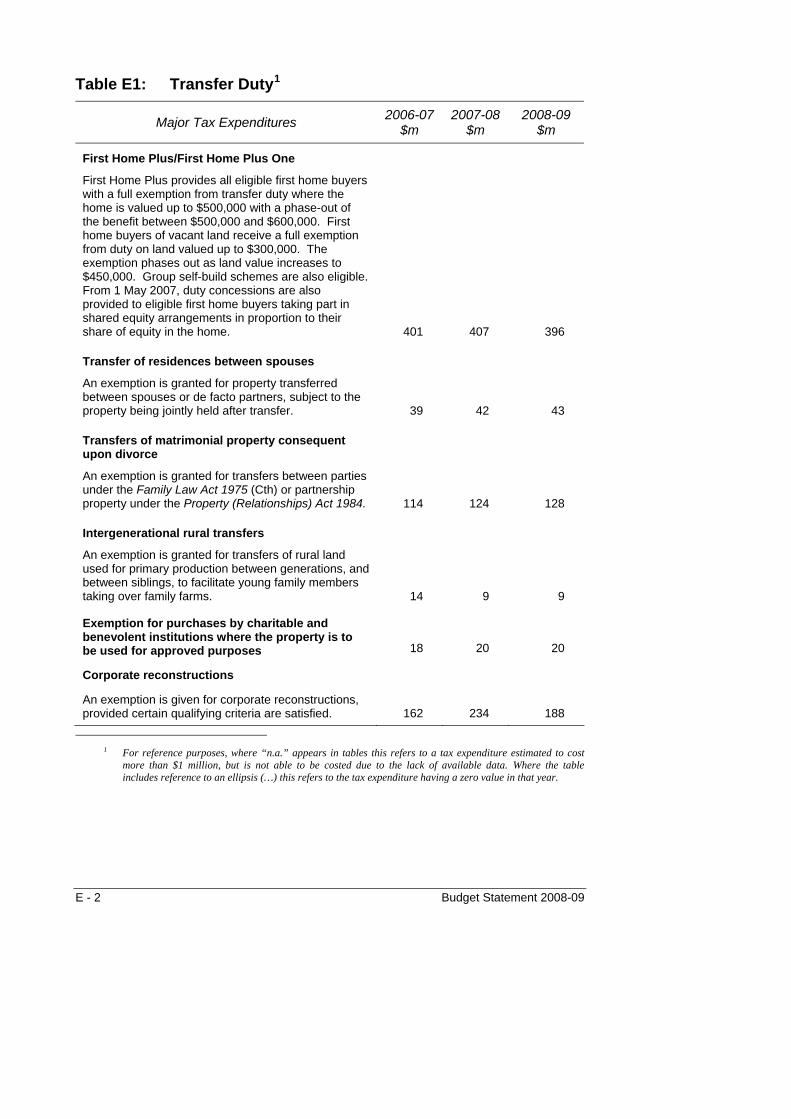
Table E1: Transfer Duty1
Major Tax Expenditures 2006-07$m
2007-08$m
2008-09 $m
First Home Plus/First Home Plus One
First Home Plus provides all eligible first home buyers with a full exemption from transfer duty where the home is valued up to $500,000 with a phase-out of the benefit between $500,000 and $600,000. First home buyers of vacant land receive a full exemption from duty on land valued up to $300,000. The exemption phases out as land value increases to $450,000. Group self-build schemes are also eligible. From 1 May 2007, duty concessions are also provided to eligible first home buyers taking part in shared equity arrangements in proportion to their share of equity in the home. 401 407 396
Transfer of residences between spouses
An exemption is granted for property transferred between spouses or de facto partners, subject to the property being jointly held after transfer. 39 42 43
Transfers of matrimonial property consequent upon divorce
An exemption is granted for transfers between parties under the Family Law Act 1975 (Cth) or partnership property under the Property (Relationships) Act 1984. 114 124 128
Intergenerational rural transfers
An exemption is granted for transfers of rural land used for primary production between generations, and between siblings, to facilitate young family members taking over family farms. 14 9 9
Exemption for purchases by charitable and benevolent institutions where the property is to be used for approved purposes 18 20 20
Corporate reconstructions
An exemption is given for corporate reconstructions, provided certain qualifying criteria are satisfied. 162 234 188
1 For reference purposes, where “n.a.” appears in tables this refers to a tax expenditure estimated to cost
more than $1 million, but is not able to be costed due to the lack of available data. Where the table includes reference to an ellipsis (…) this refers to the tax expenditure having a zero value in that year.
E - 2 Budget Statement 2008-09
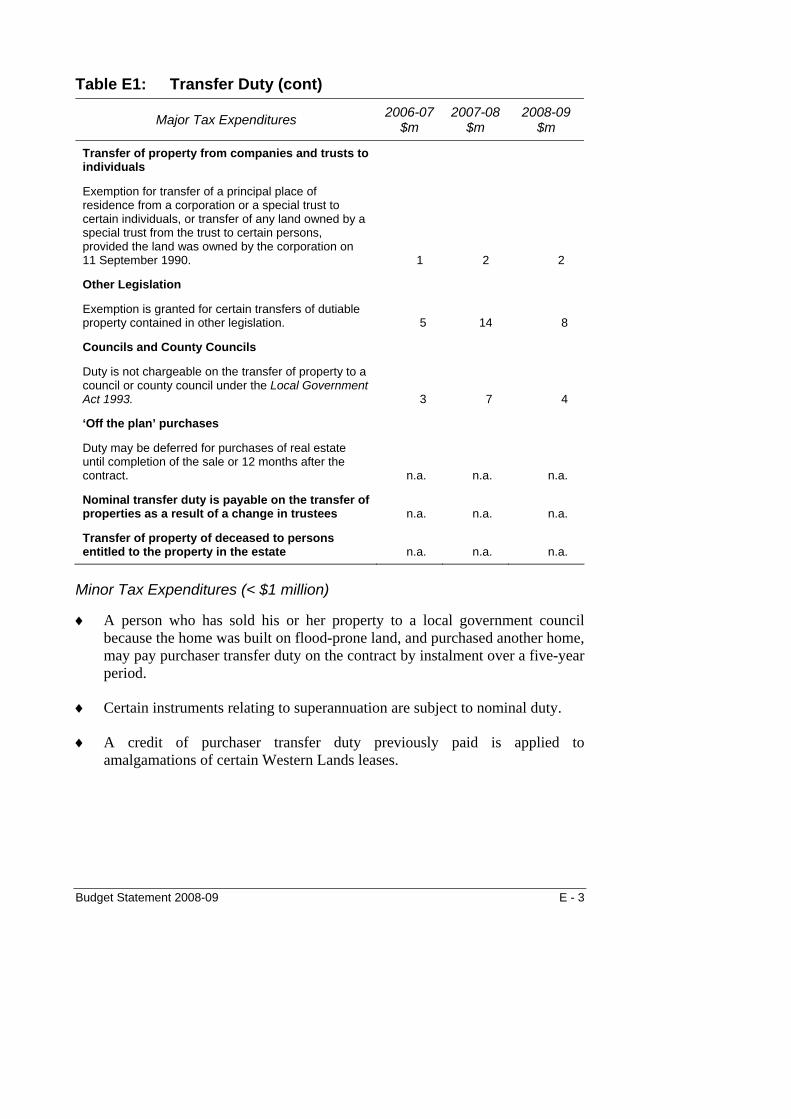
Table E1: Transfer Duty (cont)
Major Tax Expenditures 2006-07$m
2007-08$m
2008-09 $m
Transfer of property from companies and trusts to individuals
Exemption for transfer of a principal place of residence from a corporation or a special trust to certain individuals, or transfer of any land owned by a special trust from the trust to certain persons, provided the land was owned by the corporation on 11 September 1990. 1 2 2
Other Legislation
Exemption is granted for certain transfers of dutiable property contained in other legislation. 5 14 8
Councils and County Councils
Duty is not chargeable on the transfer of property to a council or county council under the Local Government Act 1993. 3 7 4
‘Off the plan’ purchases
Duty may be deferred for purchases of real estate until completion of the sale or 12 months after the contract. n.a. n.a. n.a.
Nominal transfer duty is payable on the transfer of properties as a result of a change in trustees n.a. n.a. n.a.
Transfer of property of deceased to persons entitled to the property in the estate n.a. n.a. n.a.
Minor Tax Expenditures (< $1 million)
A person who has sold his or her property to a local government council because the home was built on flood-prone land, and purchased another home, may pay purchaser transfer duty on the contract by instalment over a five-year period.
♦
♦
♦
Certain instruments relating to superannuation are subject to nominal duty.
A credit of purchaser transfer duty previously paid is applied to amalgamations of certain Western Lands leases.
Budget Statement 2008-09 E - 3
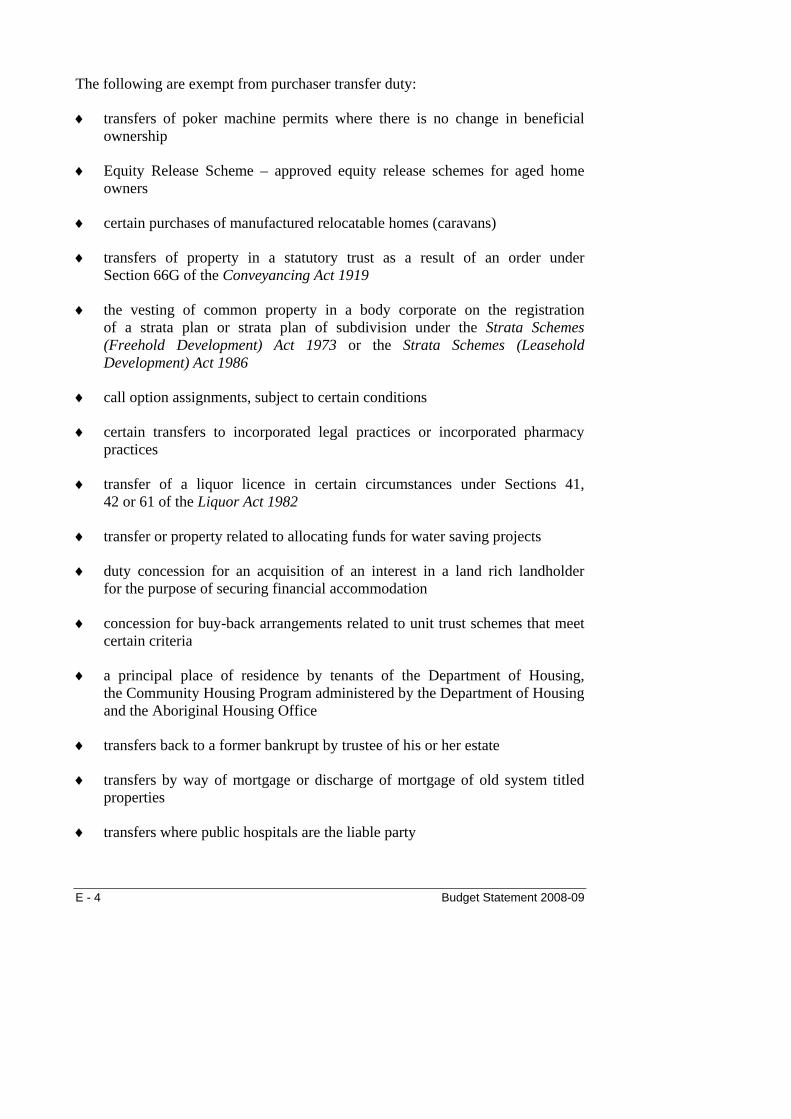
The following are exempt from purchaser transfer duty:
transfers of poker machine permits where there is no change in beneficial ownership
♦
♦
♦
♦
♦
♦
♦
♦
♦
♦
♦
♦
♦
♦
♦
Equity Release Scheme – approved equity release schemes for aged home owners
certain purchases of manufactured relocatable homes (caravans)
transfers of property in a statutory trust as a result of an order under Section 66G of the Conveyancing Act 1919
the vesting of common property in a body corporate on the registration of a strata plan or strata plan of subdivision under the Strata Schemes (Freehold Development) Act 1973 or the Strata Schemes (Leasehold Development) Act 1986
call option assignments, subject to certain conditions
certain transfers to incorporated legal practices or incorporated pharmacy practices
transfer of a liquor licence in certain circumstances under Sections 41, 42 or 61 of the Liquor Act 1982
transfer or property related to allocating funds for water saving projects
duty concession for an acquisition of an interest in a land rich landholder for the purpose of securing financial accommodation
concession for buy-back arrangements related to unit trust schemes that meet certain criteria
a principal place of residence by tenants of the Department of Housing, the Community Housing Program administered by the Department of Housing and the Aboriginal Housing Office
transfers back to a former bankrupt by trustee of his or her estate
transfers by way of mortgage or discharge of mortgage of old system titled properties
transfers where public hospitals are the liable party
E - 4 Budget Statement 2008-09

instruments executed by or on behalf of a council or county council under the Local Government Act 1993, not connected with a trading undertaking
♦
♦
♦
♦
♦
♦
transfers executed for the purpose of amalgamation or dissolution of clubs or the formation of a new club under Section 17A of the Registered Clubs Act 1976
instruments executed by or on behalf of agencies within the meaning of the Convention on the Privileges and Immunities of the Specialised Agencies approved by the General Assembly of the United Nations in 1947
transfers between associations of employees or employers registered under the Workplace Relations Act 1996 (Cth) for the purpose of amalgamation
transfer of property to the NSW Aboriginal Land Council, Regional Aboriginal Land Council, or Local Aboriginal Land Council and
transfers of property between licensed insurers, and between the WorkCover Authority and licensed insurers, under the Workers Compensation Acts of 1926 and 1987 (NSW).
GENERAL INSURANCE DUTY The benchmark is defined as all premiums for general insurance policies, except insurance covering only property of the Crown in right of New South Wales. The benchmark tax rate is 9 per cent of premium paid for contracts or renewals that take effect after 1 September 2005.
Table E2: General Insurance Duty
Major Tax Expenditures 2006-07 $m
2007-08 $m
2008-09 $m
Concessional rates for motor vehicle, aviation, disability income, occupational indemnity, crop and livestock
From 1 September 2005, a concessional rate of 5 per cent applies to certain categories of insurance including motor vehicle (excluding compulsory third party [the green slip]), aviation, disability income and occupational indemnity. Crop and livestock insurance is taxed at 2.5 per cent. Until 31 January 2010, insurance under the Debtor Insurance Scheme of the Stock and Station Agents Association is also taxed at 2.5 per cent. 200 200 208
Budget Statement 2008-09 E - 5
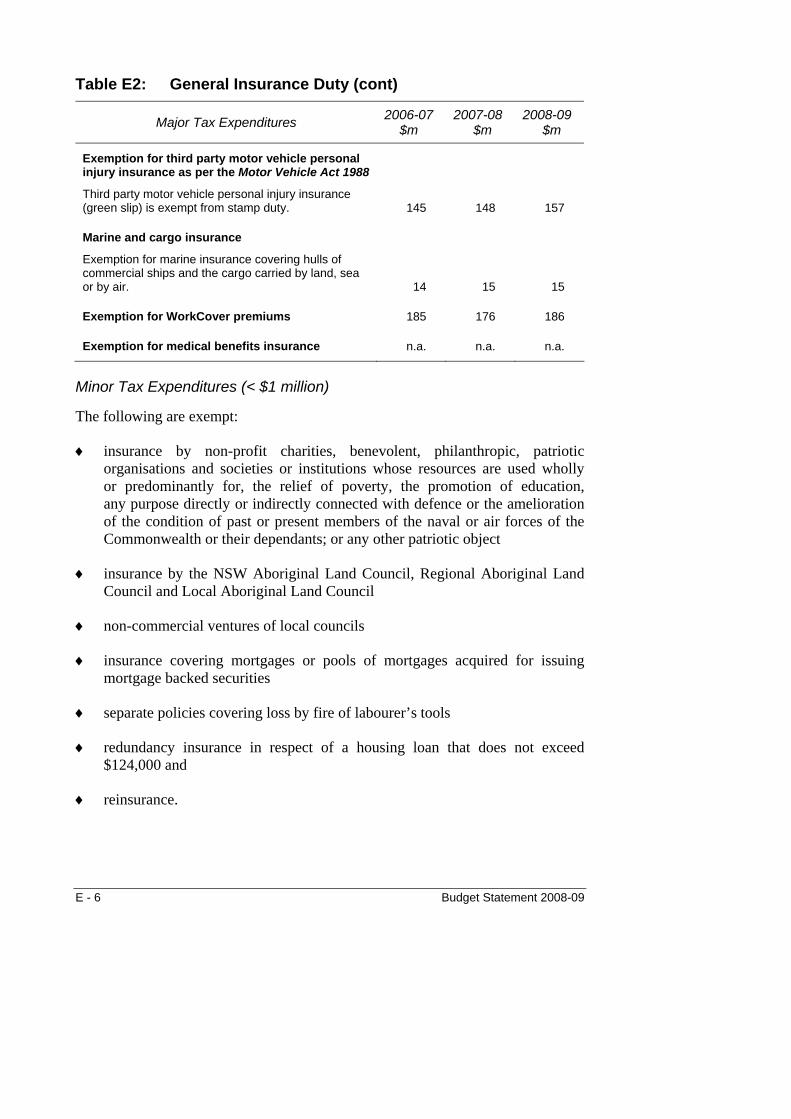
Table E2: General Insurance Duty (cont)
Major Tax Expenditures 2006-07 $m
2007-08 $m
2008-09 $m
Exemption for third party motor vehicle personal injury insurance as per the Motor Vehicle Act 1988
Third party motor vehicle personal injury insurance (green slip) is exempt from stamp duty. 145 148 157
Marine and cargo insurance
Exemption for marine insurance covering hulls of commercial ships and the cargo carried by land, sea or by air. 14 15 15
Exemption for WorkCover premiums 185 176 186
Exemption for medical benefits insurance n.a. n.a. n.a.
Minor Tax Expenditures (< $1 million)
The following are exempt:
insurance by non-profit charities, benevolent, philanthropic, patriotic organisations and societies or institutions whose resources are used wholly or predominantly for, the relief of poverty, the promotion of education, any purpose directly or indirectly connected with defence or the amelioration of the condition of past or present members of the naval or air forces of the Commonwealth or their dependants; or any other patriotic object
♦
♦
♦
♦
♦
♦
♦
insurance by the NSW Aboriginal Land Council, Regional Aboriginal Land Council and Local Aboriginal Land Council
non-commercial ventures of local councils
insurance covering mortgages or pools of mortgages acquired for issuing mortgage backed securities
separate policies covering loss by fire of labourer’s tools
redundancy insurance in respect of a housing loan that does not exceed $124,000 and
reinsurance.
E - 6 Budget Statement 2008-09

LIFE INSURANCE DUTY The benchmark is defined as all products (or part thereof) where the sum assured offered by life insurance companies provides for a payment in the event of death or injury from natural causes of the person insured or upon survival to a specified age. The benchmark tax rate is 10 cents per $200 where the sum assured is less than $2,000 and $1 plus 20 cents per $200 or part thereof where the sum assured is greater than $2,000.
Table E3: Life Insurance Duty
Major Tax Expenditures 2006-07 $m
2007-08$m
2008-09 $m
Superannuation
An exemption is granted to all group superannuation investment policies that are for the benefit of more than one member. 98 92 96
Annuities
An exemption is provided to annuities. 17 18 18
MORTGAGE DUTY Up to 1 September 2007, the benchmark is defined as all secured loans that affect property in New South Wales, except mortgages given by the Commonwealth or NSW Government, or any public statutory body constituted under a law of this State. The benchmark tax rate is $5 up to $16,000 plus $4 per $1,000 or part thereof on the excess.
From 1 September 2007, the benchmark is defined as all secured loans that affect property in New South Wales, with the exception of mortgages for owner-occupied residences, mortgages given by the Commonwealth or NSW Government or any public statutory body constituted under a law of this State. The benchmark tax rate is $5 up to $16,000 plus $4 per $1,000 or part thereof on the excess.
From 1 July 2008, the benchmark is defined as all secured loans that affect property in New South Wales, with the exception of mortgages for new housing finance commitments to individuals for the purpose of residential property investment, mortgages for owner-occupied residences, mortgages given by the Commonwealth or NSW Government or any public statutory body constituted under a law of this State. The benchmark tax rate is $5 up to $16,000 plus $4 per $1,000 or part thereof on the excess.
Budget Statement 2008-09 E - 7
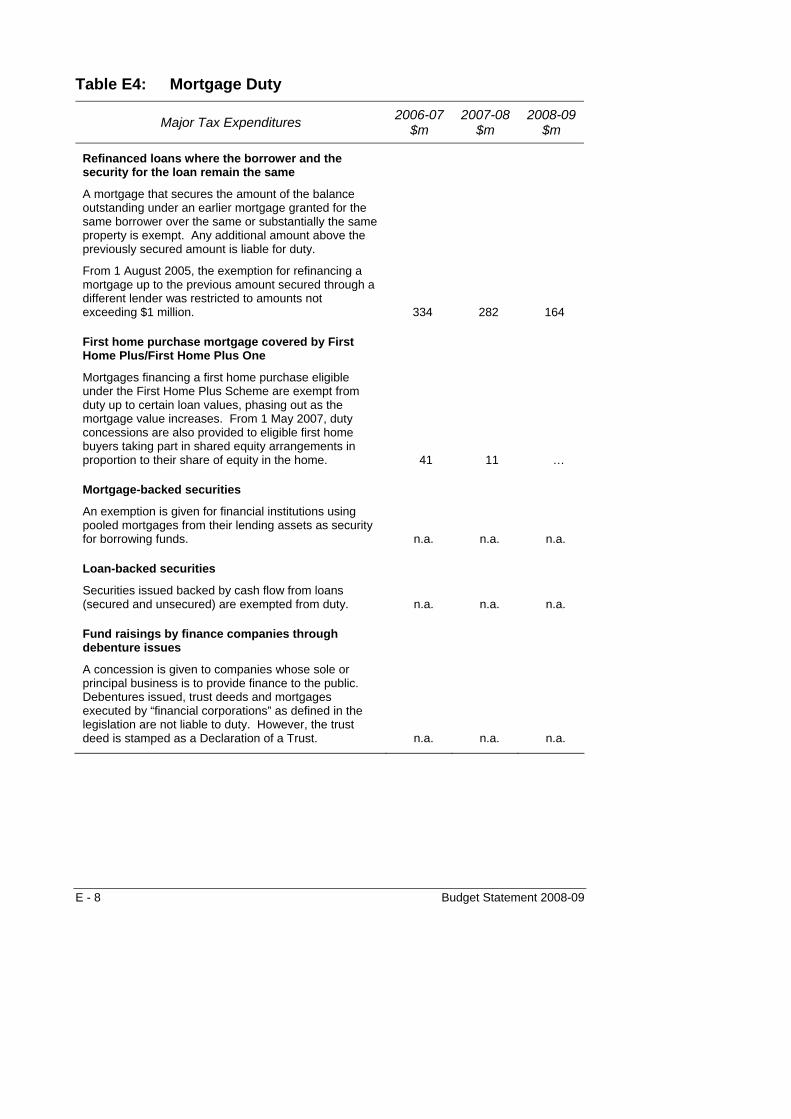
Table E4: Mortgage Duty
Major Tax Expenditures 2006-07$m
2007-08$m
2008-09 $m
Refinanced loans where the borrower and the security for the loan remain the same
A mortgage that secures the amount of the balance outstanding under an earlier mortgage granted for the same borrower over the same or substantially the same property is exempt. Any additional amount above the previously secured amount is liable for duty.
From 1 August 2005, the exemption for refinancing a mortgage up to the previous amount secured through a different lender was restricted to amounts not exceeding $1 million. 334 282 164
First home purchase mortgage covered by First Home Plus/First Home Plus One
Mortgages financing a first home purchase eligible under the First Home Plus Scheme are exempt from duty up to certain loan values, phasing out as the mortgage value increases. From 1 May 2007, duty concessions are also provided to eligible first home buyers taking part in shared equity arrangements in proportion to their share of equity in the home. 41 11 …
Mortgage-backed securities
An exemption is given for financial institutions using pooled mortgages from their lending assets as security for borrowing funds. n.a. n.a. n.a.
Loan-backed securities
Securities issued backed by cash flow from loans (secured and unsecured) are exempted from duty. n.a. n.a. n.a.
Fund raisings by finance companies through debenture issues
A concession is given to companies whose sole or principal business is to provide finance to the public. Debentures issued, trust deeds and mortgages executed by “financial corporations” as defined in the legislation are not liable to duty. However, the trust deed is stamped as a Declaration of a Trust. n.a. n.a. n.a.
E - 8 Budget Statement 2008-09

Table E4: Mortgage Duty (cont)
Major Tax Expenditures 2006-07$m
2007-08$m
2008-09 $m
Consumer credit contract
Mortgages securing amounts under a consumer credit contract, where the amount financed is $35,000 or less are exempt from duty. n.a. n.a. n.a.
Instruments creating mortgage-backed securities
An instrument executed for the purpose of creating, issuing or marketing mortgage-backed securities is exempt from duty. n.a. n.a. n.a.
Minor Tax Expenditures (< $1 million)
The following are exempt:
duty is not charged on additional loans secured under a mortgage if the additional loans do not exceed $10,000 in any 12 month period, not being the 12 month period following the making of the initial loan
♦
♦
♦
♦
♦
♦
♦
♦
♦
mortgages created solely for the purpose of providing security in accordance with a condition imposed on the grant of bail in criminal proceedings
a mortgage of any ship or vessel, or of any part, interest, share or property of or in any ship or vessel
the refinancing of a loan following divorce or the break up of a de facto relationship
any mortgage made or given to the WorkCover Authority
mortgages given by a council or county council under the Local Government Act 1993
mortgages given by institutions for the relief of poverty and promotion of education
mortgages given by institutions of charitable or benevolent nature, or for the promotion of the interests of Aborigines
mortgages given by the NSW Aboriginal Land Council, Regional Aboriginal Land Council and Local Aboriginal Land Council
Budget Statement 2008-09 E - 9
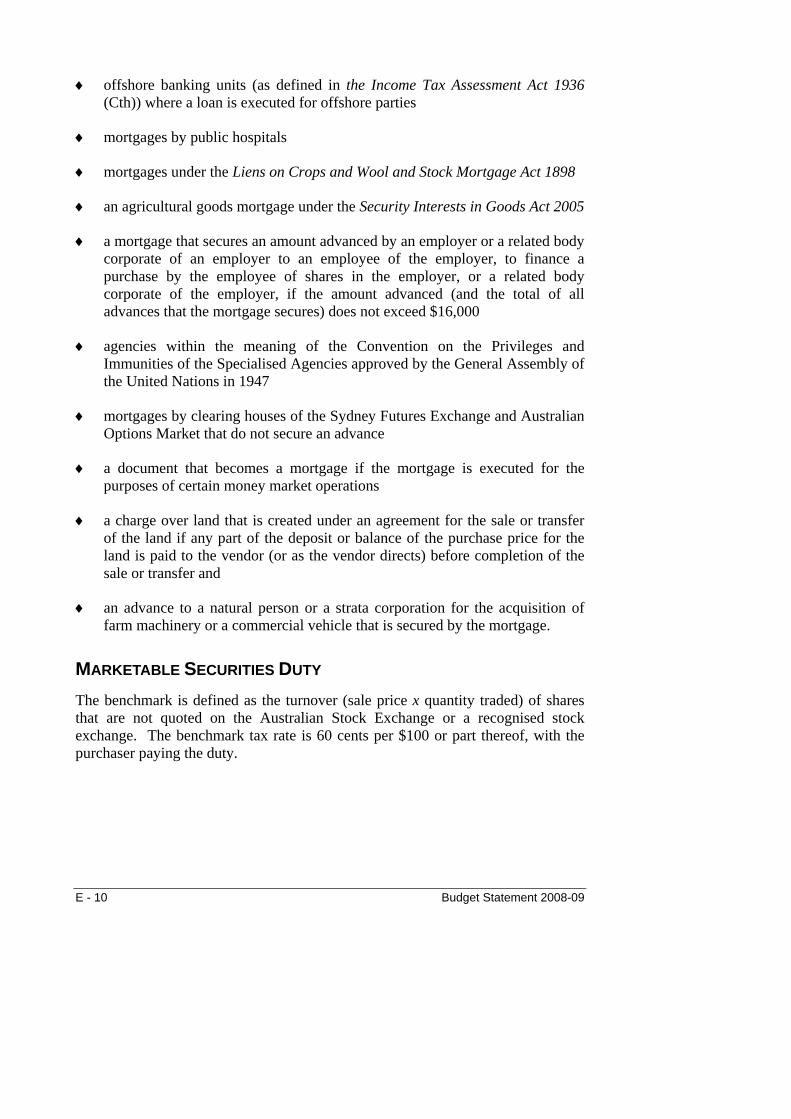
offshore banking units (as defined in the Income Tax Assessment Act 1936 (Cth)) where a loan is executed for offshore parties
♦
♦
♦
♦
♦
♦
♦
♦
♦
♦
mortgages by public hospitals
mortgages under the Liens on Crops and Wool and Stock Mortgage Act 1898
an agricultural goods mortgage under the Security Interests in Goods Act 2005
a mortgage that secures an amount advanced by an employer or a related body corporate of an employer to an employee of the employer, to finance a purchase by the employee of shares in the employer, or a related body corporate of the employer, if the amount advanced (and the total of all advances that the mortgage secures) does not exceed $16,000
agencies within the meaning of the Convention on the Privileges and Immunities of the Specialised Agencies approved by the General Assembly of the United Nations in 1947
mortgages by clearing houses of the Sydney Futures Exchange and Australian Options Market that do not secure an advance
a document that becomes a mortgage if the mortgage is executed for the purposes of certain money market operations
a charge over land that is created under an agreement for the sale or transfer of the land if any part of the deposit or balance of the purchase price for the land is paid to the vendor (or as the vendor directs) before completion of the sale or transfer and
an advance to a natural person or a strata corporation for the acquisition of farm machinery or a commercial vehicle that is secured by the mortgage.
MARKETABLE SECURITIES DUTY The benchmark is defined as the turnover (sale price x quantity traded) of shares that are not quoted on the Australian Stock Exchange or a recognised stock exchange. The benchmark tax rate is 60 cents per $100 or part thereof, with the purchaser paying the duty.
E - 10 Budget Statement 2008-09
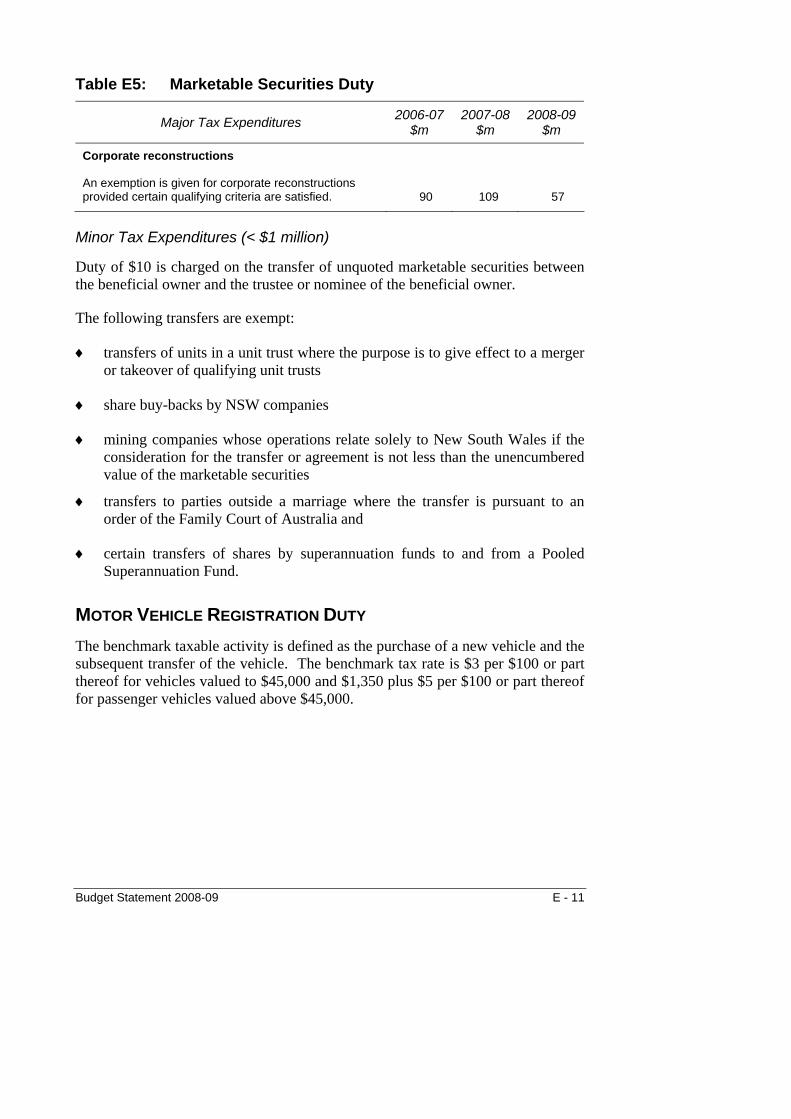
Table E5: Marketable Securities Duty
Major Tax Expenditures 2006-07$m
2007-08$m
2008-09 $m
Corporate reconstructions
An exemption is given for corporate reconstructions provided certain qualifying criteria are satisfied. 90 109 57
Minor Tax Expenditures (< $1 million)
Duty of $10 is charged on the transfer of unquoted marketable securities between the beneficial owner and the trustee or nominee of the beneficial owner.
The following transfers are exempt:
transfers of units in a unit trust where the purpose is to give effect to a merger or takeover of qualifying unit trusts
♦
♦
♦
♦
♦
share buy-backs by NSW companies
mining companies whose operations relate solely to New South Wales if the consideration for the transfer or agreement is not less than the unencumbered value of the marketable securities
transfers to parties outside a marriage where the transfer is pursuant to an order of the Family Court of Australia and
certain transfers of shares by superannuation funds to and from a Pooled Superannuation Fund.
MOTOR VEHICLE REGISTRATION DUTY The benchmark taxable activity is defined as the purchase of a new vehicle and the subsequent transfer of the vehicle. The benchmark tax rate is $3 per $100 or part thereof for vehicles valued to $45,000 and $1,350 plus $5 per $100 or part thereof for passenger vehicles valued above $45,000.
Budget Statement 2008-09 E - 11
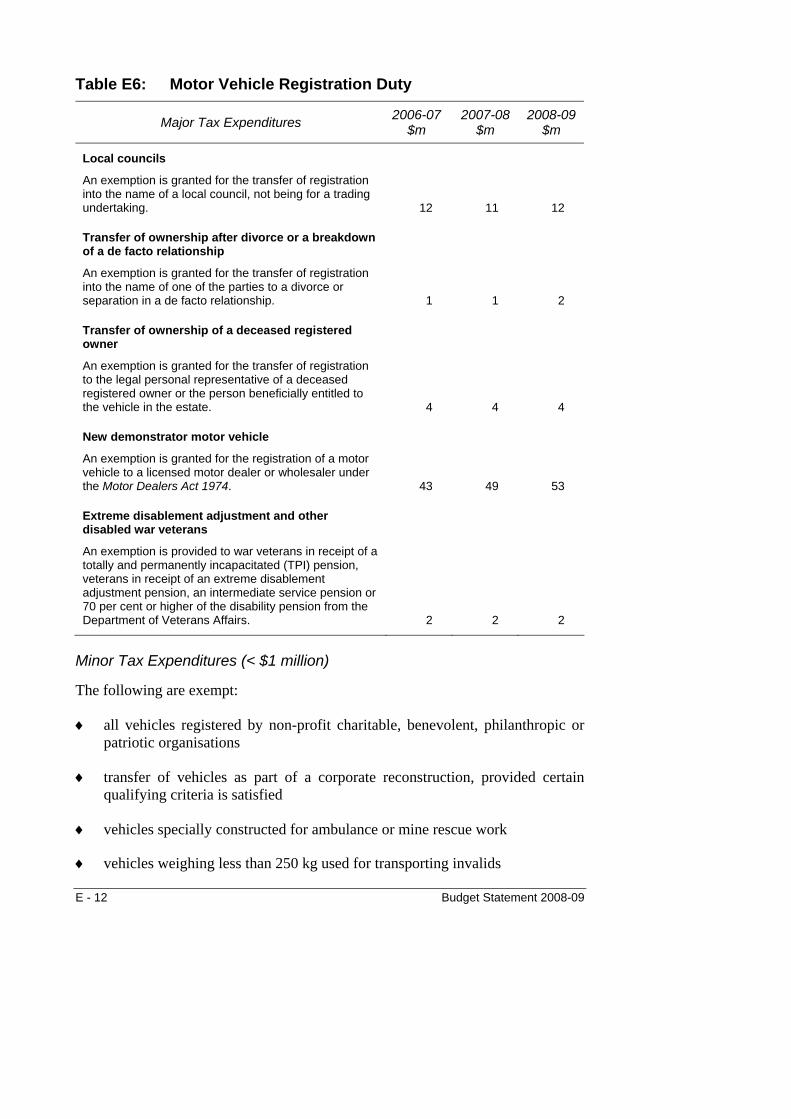
Table E6: Motor Vehicle Registration Duty
Major Tax Expenditures 2006-07$m
2007-08$m
2008-09 $m
Local councils
An exemption is granted for the transfer of registration into the name of a local council, not being for a trading undertaking. 12 11 12
Transfer of ownership after divorce or a breakdown of a de facto relationship
An exemption is granted for the transfer of registration into the name of one of the parties to a divorce or separation in a de facto relationship. 1 1 2
Transfer of ownership of a deceased registered owner
An exemption is granted for the transfer of registration to the legal personal representative of a deceased registered owner or the person beneficially entitled to the vehicle in the estate. 4 4 4
New demonstrator motor vehicle
An exemption is granted for the registration of a motor vehicle to a licensed motor dealer or wholesaler under the Motor Dealers Act 1974. 43 49 53
Extreme disablement adjustment and other disabled war veterans
An exemption is provided to war veterans in receipt of a totally and permanently incapacitated (TPI) pension, veterans in receipt of an extreme disablement adjustment pension, an intermediate service pension or 70 per cent or higher of the disability pension from the Department of Veterans Affairs. 2 2 2
Minor Tax Expenditures (< $1 million)
The following are exempt:
all vehicles registered by non-profit charitable, benevolent, philanthropic or patriotic organisations
♦
♦
♦
♦
transfer of vehicles as part of a corporate reconstruction, provided certain qualifying criteria is satisfied
vehicles specially constructed for ambulance or mine rescue work
vehicles weighing less than 250 kg used for transporting invalids
E - 12 Budget Statement 2008-09
Rural Lands Protection Boards (established under the Rural Lands Protection Act 1998)
♦
♦
♦
♦
♦
♦
♦
♦
♦
♦
♦
♦
♦
vehicles registered by NSW Aboriginal Land Council, Regional Aboriginal Land Council and Local Aboriginal Land Council and
a duty concession applies to vehicles modified for use by disabled persons.
HIRE OF GOODS DUTY Hire of goods duty was abolished from 1 July 2007. Prior to that date, the benchmark was defined as all short-term consumer hiring and other non-finance rentals greater than $14,000 per month, and equipment financing arrangements, including hire purchase arrangements. The benchmark tax rate was 0.75 per cent for equipment financing arrangements, and 1.5 per cent for other hires, with a maximum of $10,000 tax payable for any single arrangement.
There are no major tax expenditures.
Minor Tax Expenditures (< $1 million)
The following are exempt:
prosthetic items and invalid aids, or any similar aid, device or appliance for the use by a person who is partially or totally incapacitated
“wet hires” (where equipment is hired with an operator)
motor vehicles subleased by an employee to an employer
gas, water and electricity meters
arrangements between related bodies corporate
certain arrangements in relation to aircraft, ships and vessels or the hire of an engine or other component of an aircraft, ship or vessel
arrangements for the use of goods by a public hospital
a credit contract within the meaning of the Consumer Credit (New South Wales) Code
books
on-site caravans
Budget Statement 2008-09 E - 13

arrangements with traders for displaying or demonstrating goods pending their sale or hire to a third party
♦
♦
♦
hire of goods as part of a lease or franchise arrangement and
where the use of goods is incidental and ancillary to the provision of a service.
LEASE DUTY Lease duty was abolished from 1 January 2008.
Prior to that date, the benchmark was defined as any lease of real property with a total rental cost greater than $20,000 per year in New South Wales. The benchmark tax rate was 35 cents per $100 (or part thereof) of the total cost of the lease.
Table E7: Lease Duty
Major Tax Expenditures 2006-07$m
2007-08$m
2008-09 $m
Exemption for residential leases
A residential lease under which a person has a right to occupy premises as a place of residence for a term not exceeding five years is exempt. n.a. n.a. …
Minor Tax Expenditures (< $1 million)
The following are exempt:
leases on a movable dwelling site (mainly sites in caravan parks and relocatable home parks) used or intended to be used as a place of residence for a term of not more than five years
♦
♦
♦
♦
♦
leases executed in accordance with Part V of the National Health Act 1953 (Cth)
leases executed by the NSW Aboriginal Land Council, Regional Aboriginal Land Council or Local Aboriginal Land Council
leases of premises to the Home Care Service of New South Wales and
leases (granted by or on behalf of a corporation, society or institution) of residential accommodation for retired and disabled persons.
E - 14 Budget Statement 2008-09

PAYROLL TAX The tax benchmark is defined as aggregate annual gross remuneration paid by a single or group taxpayer in excess of a threshold of $600,000. The benchmark tax rate is 6 per cent.
From 1 January 2009, the benchmark tax rate will reduce to 5.75 per cent.
Table E8: Payroll Tax
Major Tax Expenditures 2006-07$m
2007-08$m
2008-09 $m
Public hospitals and Area Health Services
An exemption is granted for remuneration paid by a public hospital or an area health service to a person while engaged in work of a kind ordinarily performed in connection with the conduct of these organisations. From 1 July 2007, the person must be engaged exclusively in work of a kind ordinarily performed in connection with the conduct of these organisations. 439 465 483
Schools and colleges
An exemption is granted for remuneration paid by a school or college (other than a technical school or a technical college), that is not carried on by or on behalf of the State of New South Wales, is not for profit and which provides education at or below, but not above, the secondary level of education. 112 122 128
Religious institutions
An exemption is granted for remuneration paid by a religious institution to a person while exclusively engaged in work of a kind ordinarily performed in connection with these institutions. 10 10 11
Charitable institutions
An exemption is granted for remuneration paid by a non-profit organisation having wholly charitable, benevolent, philanthropic or patriotic purpose/s (other than an instrumentality of the State) to a person while engaged exclusively in work of a kind ordinarily performed in connection with a charitable, benevolent, philanthropic or patriotic nature. 36 39 41
Budget Statement 2008-09 E - 15

Table E8: Payroll Tax (cont)
Major Tax Expenditures 2006-07$m
2007-08$m
2008-09 $m
Local councils
Up to 1 July 2007, an exemption is granted for remuneration paid by a council or county council, except where wages are paid in connection with a number of trading undertakings, such as supply of electricity or gas, water, sewerage services, LPG, hydraulic power and the supply and installation of associated fittings and appliances and of pipes and apparatus, the operation of an abattoir or public food market, parking station, cemetery or crematorium, hostel, coal mine, the supply and distribution of coal, the supply of building materials, operation of a transport service, a prescribed activity or the construction of any building or work or the installation of plant, machinery or equipment for use in or in connection with any of the activities listed.
From 1 July 2007, the exemption will include wages paid by a wholly owned subsidiary of a council and public markets. 168 180 187
Private hospitals and nursing homes
An exemption is granted for remuneration paid by a non-profit hospital to a person engaged exclusively in work of a kind ordinarily performed in connection with the conduct of hospitals. 12 14 14
Home Care Service
Salaries paid to employees of the Home Care Service are exempt. 8 8 9
Apprentices
Up to 1 July 2008, all wages paid to an apprentice are exempt from payroll tax. From 1 July 2008, all not-for-profit group training apprentices schemes will continue to be fully exempt. All other employers employing apprentices will be eligible for a full rebate. 18 19 19
Trainees
Up to 1 July 2008, all wages paid to trainees are exempt from payroll tax. From 1 July 2008, all not-for-profit group training traineeship schemes will continue to be fully exempt. All other employers employing trainees will be eligible for a full rebate. 10 11 11
E - 16 Budget Statement 2008-09

Table E8: Payroll Tax (cont)
Major Tax Expenditures 2006-07$m
2007-08$m
2008-09 $m
Redundancy payments
Bona fide redundancy or approved early retirement scheme payments are exempt. 6 6 7
Maternity Leave
From 1 July 2007, an exemption is provided for maternity leave payments for a period of up to 14 weeks. … 5 5
Minor Tax Expenditures (< $1 million)
The following are exempt:
wages paid to an employee who is on leave from employment by reason of service in the Defence Forces
♦
♦
♦
♦
♦
♦
♦
♦
♦
wages paid to persons employed under the Community Development Employment Project administered by the Aboriginal and Torres Strait Islander Commission
wages paid by the Australian-American Fulbright Commission
wages paid by the Commonwealth War Graves Commission
wages paid to members of the official staff by a consular or other non-diplomatic representative of another country or by a Trade Chief Commissioner representing in Australia any other part of the Commonwealth of Nations
wages paid for a joint government enterprise that has the function of allocating funds for water saving projects
wages paid by the Governor of a State
wages paid to employees while the employees are providing volunteer assistance to the State Emergency Services or Rural Fire Brigades (but not in respect of wages paid or payable as recreation leave, annual leave, long service leave or sick leave)
from 1 July 2007, an exemption is provided for adoption leave payments for a period of up to 14 weeks
Budget Statement 2008-09 E - 17

up to 1 July 2007, financial planners who are authorised representatives of an Australian Financial Services (AFS) licence holder are exempt from payroll tax. From 1 July 2007, this exemption was abolished and
♦
♦ up to 1 July 2007, an exemption applies for employment agents that on-hire staff where the recipient of the services is not liable for payroll tax because the employer’s annual wages are less than the threshold. From 1 July 2007, this exemption was abolished.
LAND TAX The benchmark tax base is defined as the average of the last three years unimproved land value of all land owned (as defined in the Land Tax Management Act 1956), with the exception of land used for owner-occupied residences, as at 31 December of the preceeding year by a person or organisation other than the Commonwealth or NSW Governments.
The benchmark tax rate for the 2007 land tax year is 1.7 per cent. The benchmark tax rate for the 2008 land tax year and beyond is 1.6 per cent.
Table E9: Land Tax
Major Tax Expenditures 2006-07$m
2007-08$m
2008-09 $m
Boarding houses for low-income persons
An exemption is granted for land used by boarding houses which meet approved guidelines, principally that the rent charged is less than the amount prescribed by the guidelines. 6 6 6
E - 18 Budget Statement 2008-09
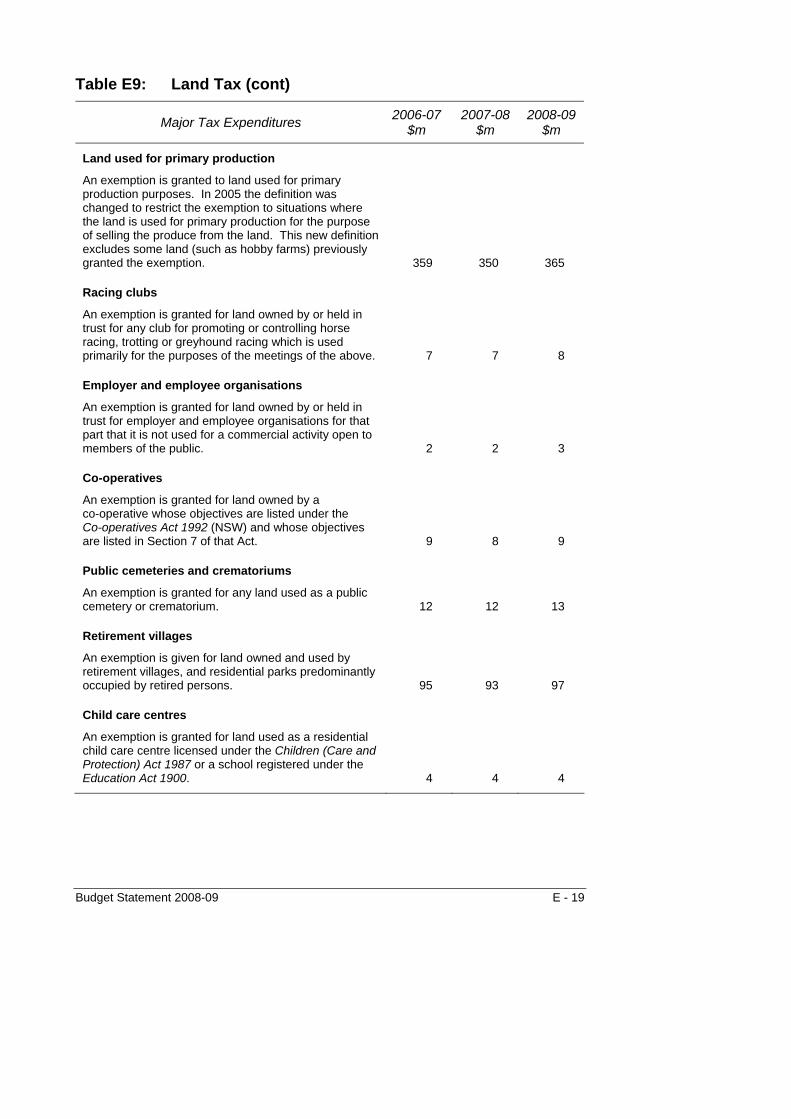
Table E9: Land Tax (cont)
Major Tax Expenditures 2006-07$m
2007-08$m
2008-09 $m
Land used for primary production
An exemption is granted to land used for primary production purposes. In 2005 the definition was changed to restrict the exemption to situations where the land is used for primary production for the purpose of selling the produce from the land. This new definition excludes some land (such as hobby farms) previously granted the exemption. 359 350 365
Racing clubs
An exemption is granted for land owned by or held in trust for any club for promoting or controlling horse racing, trotting or greyhound racing which is used primarily for the purposes of the meetings of the above. 7 7 8
Employer and employee organisations
An exemption is granted for land owned by or held in trust for employer and employee organisations for that part that it is not used for a commercial activity open to members of the public. 2 2 3
Co-operatives
An exemption is granted for land owned by a co-operative whose objectives are listed under the Co-operatives Act 1992 (NSW) and whose objectives are listed in Section 7 of that Act. 9 8 9
Public cemeteries and crematoriums
An exemption is granted for any land used as a public cemetery or crematorium. 12 12 13
Retirement villages
An exemption is given for land owned and used by retirement villages, and residential parks predominantly occupied by retired persons. 95 93 97
Child care centres
An exemption is granted for land used as a residential child care centre licensed under the Children (Care and Protection) Act 1987 or a school registered under the Education Act 1900. 4 4 4
Budget Statement 2008-09 E - 19

Table E9: Land Tax (cont)
Major Tax Expenditures 2006-07$m
2007-08$m
2008-09 $m
Public and private hospitals and Area Health Services
An exemption is granted for land used by a public hospital (including nursing homes) or Area Health Service. 16 16 16
Early payment discount
A discount of 1.5 per cent on land tax payable is available where the taxpayer pays the whole amount within 30 days after issue of the notice of assessment. 15 15 15
Religious societies
An exemption is provided for land owned by or in trust for a religious society if the society is carried on solely for religious, charitable or educational purposes. 11 11 11
Place of worship or residence
An exemption is provided for a place of worship for a religious society, or a place of residence for any clergy or ministers or order of a religious society. n.a. n.a. n.a.
Agricultural showgrounds
An exemption is granted for land used and occupied for the purpose of holding agricultural shows, or shows of a like nature and owned by, or held in trust for, a society which is established for the purpose of holding such shows not for the pecuniary profit of its members and primarily uses its funds for the holding of such shows. n.a. n.a. n.a.
Friendly societies
An exemption is granted for any society registered under the Friendly Societies (NSW) Code. n.a. n.a. n.a.
Non-profit societies, clubs and associations
An exemption is provided where a building (or part thereof) is occupied by a society, club or association not carried on for pecuniary profit. n.a. n.a. n.a.
Charitable and educational institutions
An exemption is provided for land owned by or in a trust for a charitable or educational institution if the institution is carried on solely for charitable or educational purposes and not for pecuniary profit. n.a. n.a. n.a.
E - 20 Budget Statement 2008-09
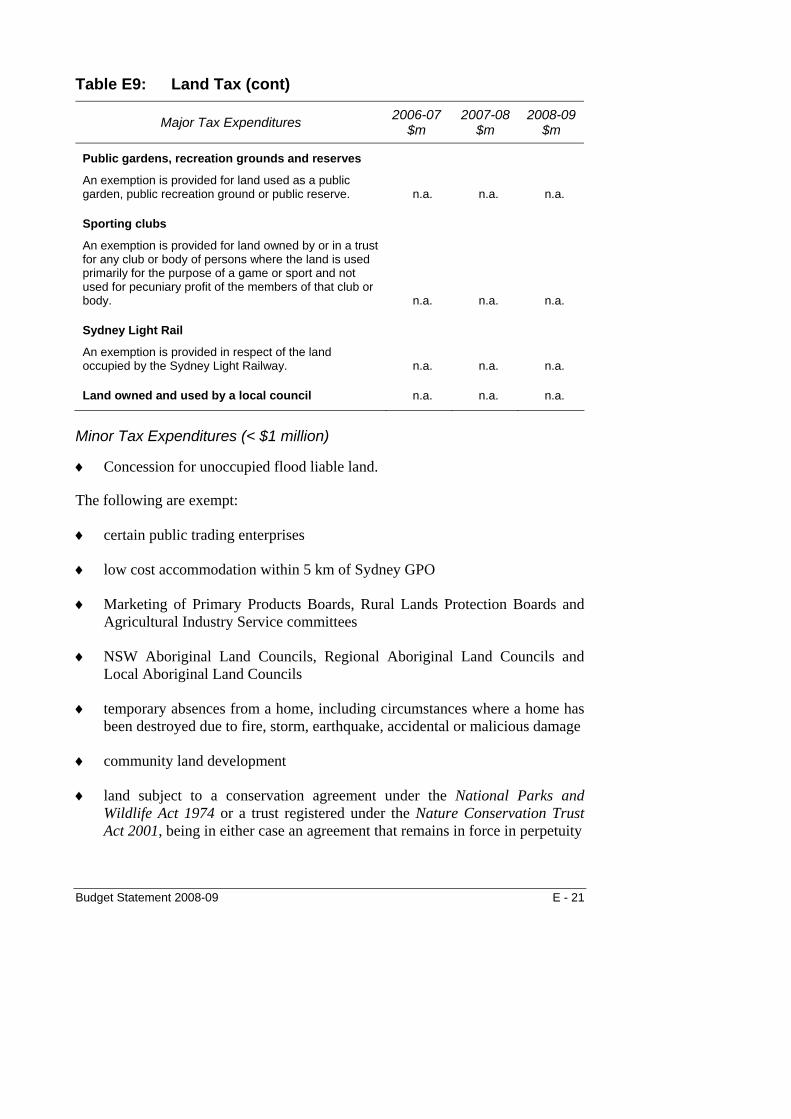
Table E9: Land Tax (cont)
Major Tax Expenditures 2006-07$m
2007-08$m
2008-09 $m
Public gardens, recreation grounds and reserves
An exemption is provided for land used as a public garden, public recreation ground or public reserve. n.a. n.a. n.a.
Sporting clubs
An exemption is provided for land owned by or in a trust for any club or body of persons where the land is used primarily for the purpose of a game or sport and not used for pecuniary profit of the members of that club or body. n.a. n.a. n.a.
Sydney Light Rail
An exemption is provided in respect of the land occupied by the Sydney Light Railway. n.a. n.a. n.a.
Land owned and used by a local council n.a. n.a. n.a.
Minor Tax Expenditures (< $1 million)
Concession for unoccupied flood liable land. ♦
♦
♦
♦
♦
♦
♦
♦
The following are exempt:
certain public trading enterprises
low cost accommodation within 5 km of Sydney GPO
Marketing of Primary Products Boards, Rural Lands Protection Boards and Agricultural Industry Service committees
NSW Aboriginal Land Councils, Regional Aboriginal Land Councils and Local Aboriginal Land Councils
temporary absences from a home, including circumstances where a home has been destroyed due to fire, storm, earthquake, accidental or malicious damage
community land development
land subject to a conservation agreement under the National Parks and Wildlife Act 1974 or a trust registered under the Nature Conservation Trust Act 2001, being in either case an agreement that remains in force in perpetuity
Budget Statement 2008-09 E - 21
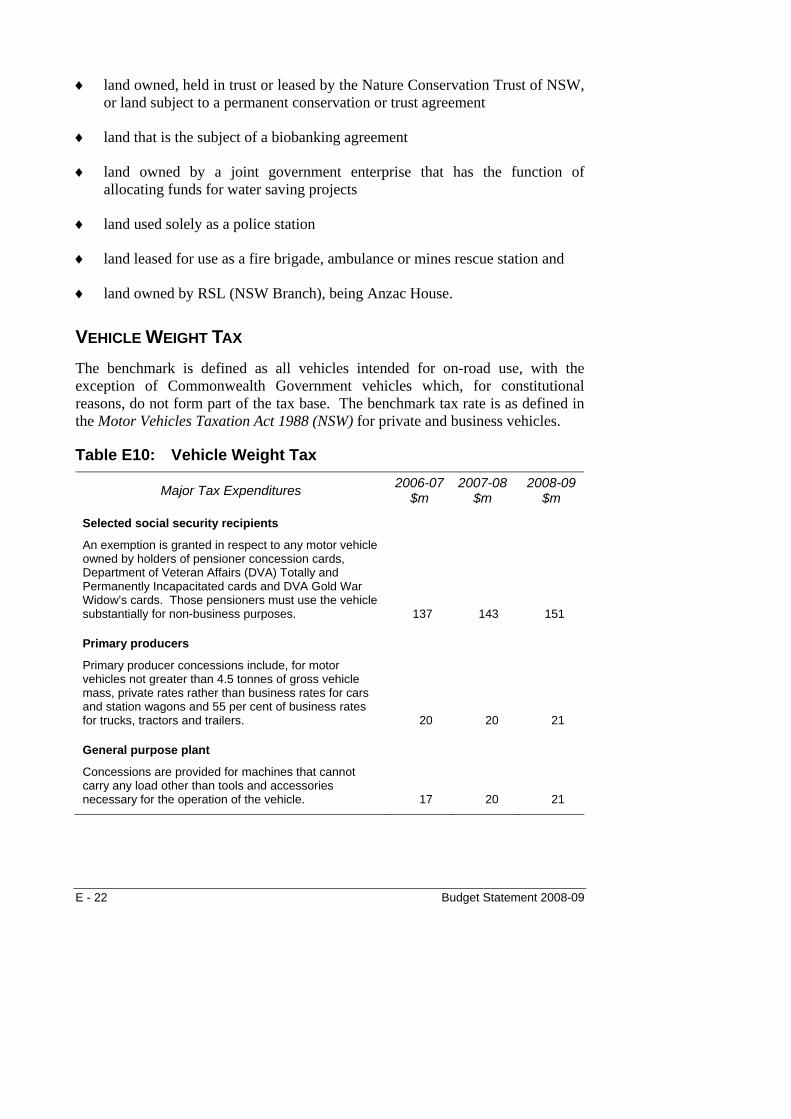
land owned, held in trust or leased by the Nature Conservation Trust of NSW, or land subject to a permanent conservation or trust agreement
♦
♦
♦
♦
♦
♦
land that is the subject of a biobanking agreement
land owned by a joint government enterprise that has the function of allocating funds for water saving projects
land used solely as a police station
land leased for use as a fire brigade, ambulance or mines rescue station and
land owned by RSL (NSW Branch), being Anzac House.
VEHICLE WEIGHT TAX The benchmark is defined as all vehicles intended for on-road use, with the exception of Commonwealth Government vehicles which, for constitutional reasons, do not form part of the tax base. The benchmark tax rate is as defined in the Motor Vehicles Taxation Act 1988 (NSW) for private and business vehicles.
Table E10: Vehicle Weight Tax
Major Tax Expenditures 2006-07$m
2007-08$m
2008-09 $m
Selected social security recipients
An exemption is granted in respect to any motor vehicle owned by holders of pensioner concession cards, Department of Veteran Affairs (DVA) Totally and Permanently Incapacitated cards and DVA Gold War Widow’s cards. Those pensioners must use the vehicle substantially for non-business purposes. 137 143 151
Primary producers
Primary producer concessions include, for motor vehicles not greater than 4.5 tonnes of gross vehicle mass, private rates rather than business rates for cars and station wagons and 55 per cent of business rates for trucks, tractors and trailers. 20 20 21
General purpose plant
Concessions are provided for machines that cannot carry any load other than tools and accessories necessary for the operation of the vehicle. 17 20 21
E - 22 Budget Statement 2008-09
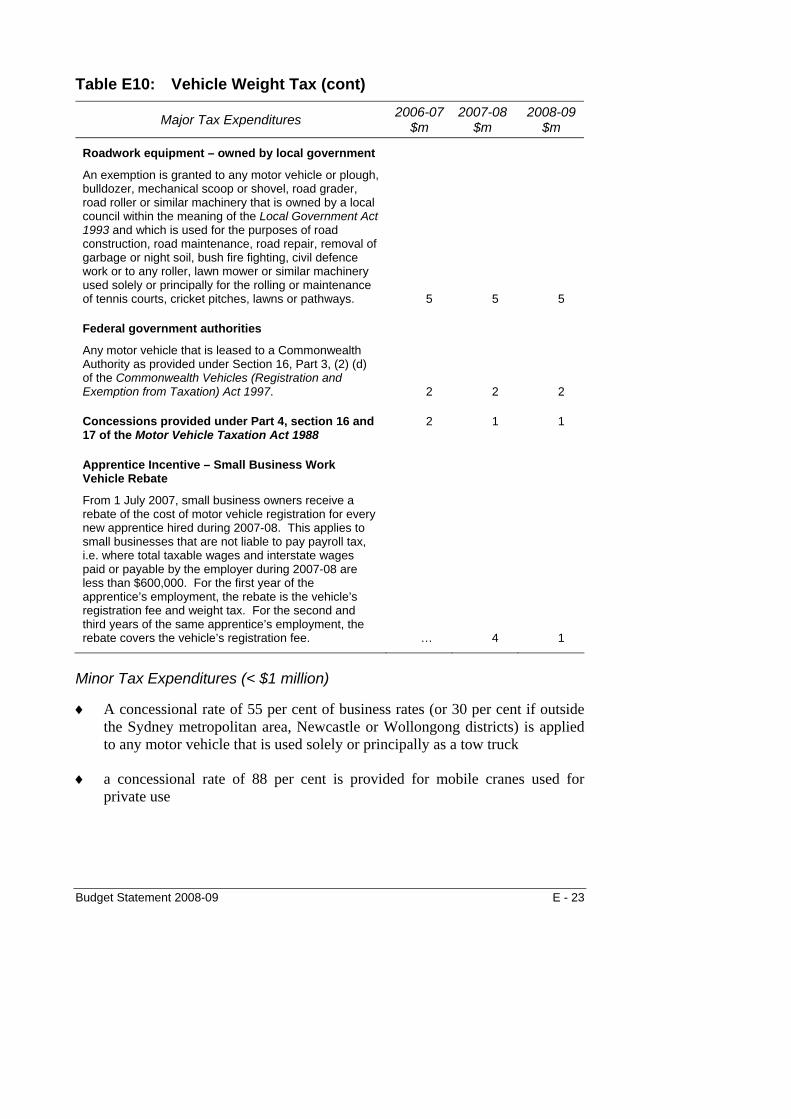
Table E10: Vehicle Weight Tax (cont)
Major Tax Expenditures 2006-07$m
2007-08$m
2008-09 $m
Roadwork equipment – owned by local government
An exemption is granted to any motor vehicle or plough, bulldozer, mechanical scoop or shovel, road grader, road roller or similar machinery that is owned by a local council within the meaning of the Local Government Act 1993 and which is used for the purposes of road construction, road maintenance, road repair, removal of garbage or night soil, bush fire fighting, civil defence work or to any roller, lawn mower or similar machinery used solely or principally for the rolling or maintenance of tennis courts, cricket pitches, lawns or pathways. 5 5 5
Federal government authorities
Any motor vehicle that is leased to a Commonwealth Authority as provided under Section 16, Part 3, (2) (d) of the Commonwealth Vehicles (Registration and Exemption from Taxation) Act 1997. 2 2 2
Concessions provided under Part 4, section 16 and 17 of the Motor Vehicle Taxation Act 1988
2 1 1
Apprentice Incentive – Small Business Work Vehicle Rebate
From 1 July 2007, small business owners receive a rebate of the cost of motor vehicle registration for every new apprentice hired during 2007-08. This applies to small businesses that are not liable to pay payroll tax, i.e. where total taxable wages and interstate wages paid or payable by the employer during 2007-08 are less than $600,000. For the first year of the apprentice’s employment, the rebate is the vehicle’s registration fee and weight tax. For the second and third years of the same apprentice’s employment, the rebate covers the vehicle’s registration fee. … 4 1
Minor Tax Expenditures (< $1 million)
A concessional rate of 55 per cent of business rates (or 30 per cent if outside the Sydney metropolitan area, Newcastle or Wollongong districts) is applied to any motor vehicle that is used solely or principally as a tow truck
♦
♦ a concessional rate of 88 per cent is provided for mobile cranes used for private use
Budget Statement 2008-09 E - 23

a concessional rate of tax is applied to any motor vehicle that is owned by a Rural Land Protection Board and is used solely for carrying out the functions of the board and
♦
♦
♦
♦
♦
♦
♦
♦
a rebate of $100 is provided to first and second year apprentices on the cost of car registration.
The following are exempt:
all vehicles registered by non-profit charitable, benevolent, philanthropic or patriotic organisations authorised under the Charitable Fundraising Act 1991
any motor vehicle that is used principally as an ambulance except government owned
motor vehicles used by the State Emergency Service except government owned
any motor vehicle on which a trader’s plate is being used in accordance with the Road Transport (Vehicle Registration) Act 1997 (NSW) or the regulations under that Act
any motor vehicle that is owned by the NSW Aboriginal Land Council, Regional Aboriginal Land Council and Local Aboriginal Land Council and
motor vehicles in the name of Consular Employees and Trade Missions.
DRIVERS’ LICENCES The benchmark is considered to be the licensing of all persons to drive a vehicle in New South Wales on public roads. The benchmark tax rates in 2007-08 were $45 for a one-year licence, $106 for a three-year licence and $142 for a five-year licence. The cost of concession expenditures trend reflects the renewal cycle of five-year licences.
E - 24 Budget Statement 2008-09
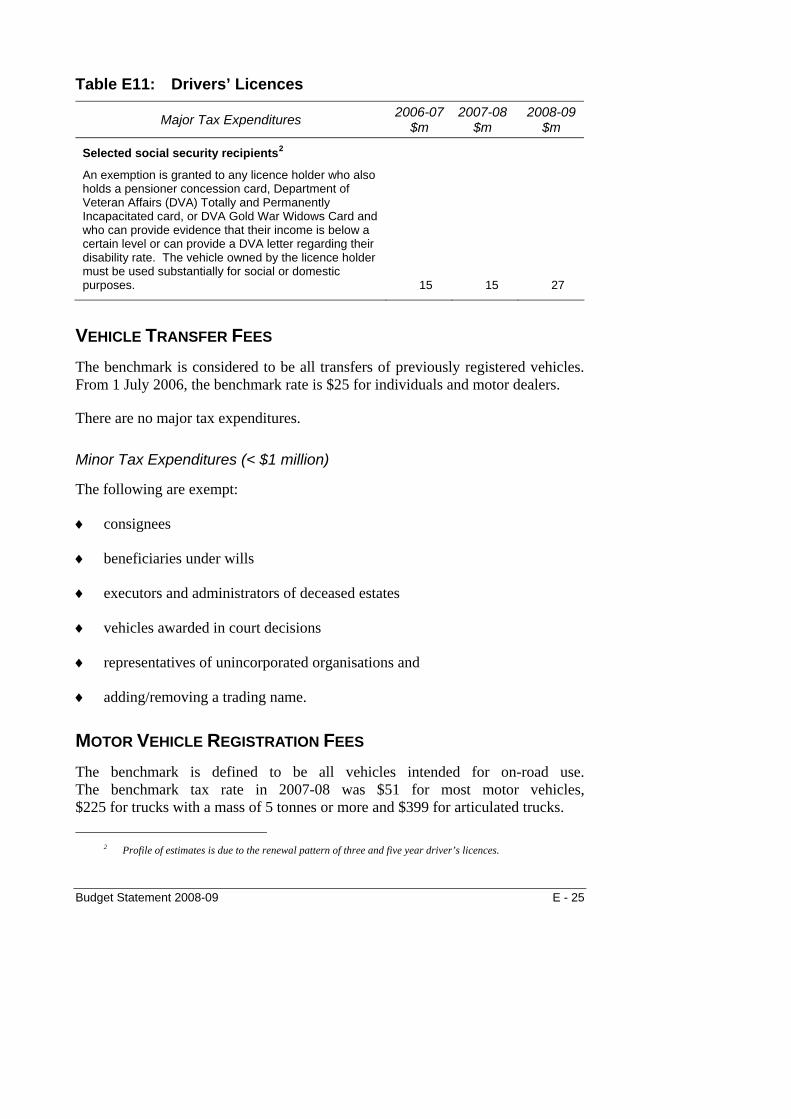
Table E11: Drivers’ Licences
Major Tax Expenditures 2006-07$m
2007-08$m
2008-09 $m
Selected social security recipients2
An exemption is granted to any licence holder who also holds a pensioner concession card, Department of Veteran Affairs (DVA) Totally and Permanently Incapacitated card, or DVA Gold War Widows Card and who can provide evidence that their income is below a certain level or can provide a DVA letter regarding their disability rate. The vehicle owned by the licence holder must be used substantially for social or domestic purposes. 15 15 27
VEHICLE TRANSFER FEES The benchmark is considered to be all transfers of previously registered vehicles. From 1 July 2006, the benchmark rate is $25 for individuals and motor dealers.
There are no major tax expenditures.
Minor Tax Expenditures (< $1 million)
The following are exempt:
♦
♦
♦
♦
♦
♦
consignees
beneficiaries under wills
executors and administrators of deceased estates
vehicles awarded in court decisions
representatives of unincorporated organisations and
adding/removing a trading name.
MOTOR VEHICLE REGISTRATION FEES The benchmark is defined to be all vehicles intended for on-road use. The benchmark tax rate in 2007-08 was $51 for most motor vehicles, $225 for trucks with a mass of 5 tonnes or more and $399 for articulated trucks.
2 Profile of estimates is due to the renewal pattern of three and five year driver’s licences.
Budget Statement 2008-09 E - 25
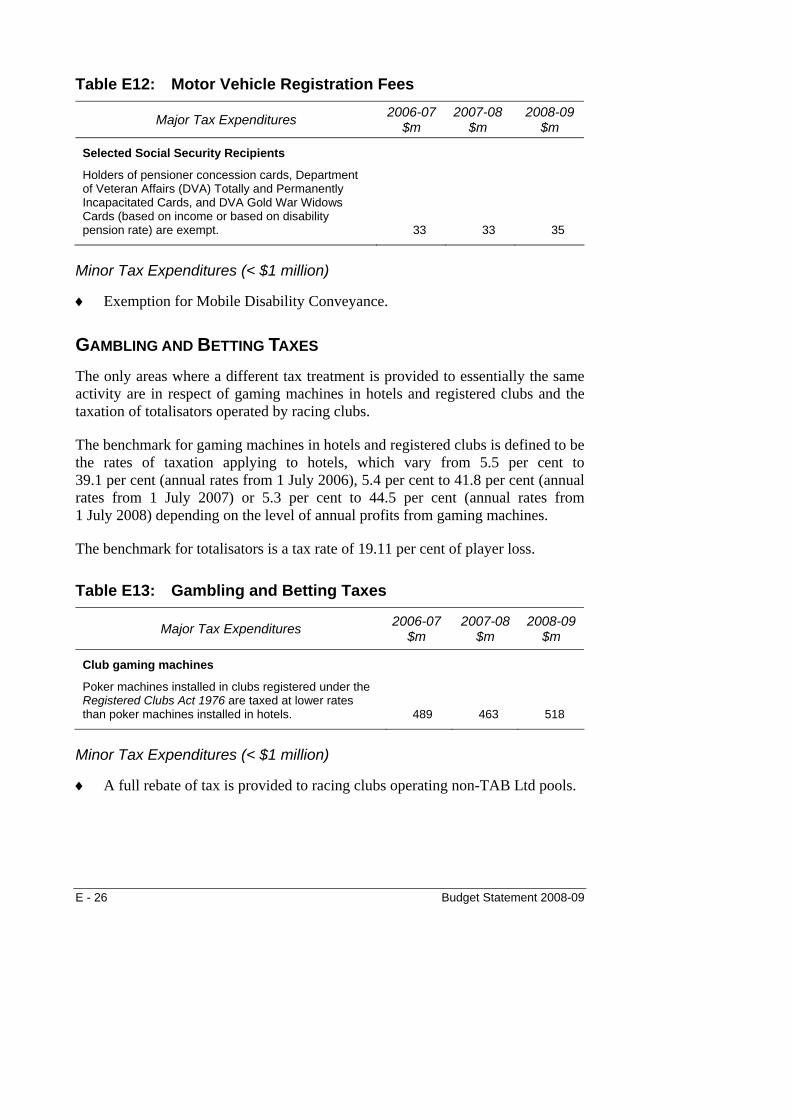
Table E12: Motor Vehicle Registration Fees
Major Tax Expenditures 2006-07$m
2007-08 $m
2008-09 $m
Selected Social Security Recipients
Holders of pensioner concession cards, Department of Veteran Affairs (DVA) Totally and Permanently Incapacitated Cards, and DVA Gold War Widows Cards (based on income or based on disability pension rate) are exempt. 33 33 35
Minor Tax Expenditures (< $1 million)
Exemption for Mobile Disability Conveyance. ♦
GAMBLING AND BETTING TAXES The only areas where a different tax treatment is provided to essentially the same activity are in respect of gaming machines in hotels and registered clubs and the taxation of totalisators operated by racing clubs.
The benchmark for gaming machines in hotels and registered clubs is defined to be the rates of taxation applying to hotels, which vary from 5.5 per cent to 39.1 per cent (annual rates from 1 July 2006), 5.4 per cent to 41.8 per cent (annual rates from 1 July 2007) or 5.3 per cent to 44.5 per cent (annual rates from 1 July 2008) depending on the level of annual profits from gaming machines.
The benchmark for totalisators is a tax rate of 19.11 per cent of player loss.
Table E13: Gambling and Betting Taxes
Major Tax Expenditures 2006-07$m
2007-08$m
2008-09 $m
Club gaming machines
Poker machines installed in clubs registered under the Registered Clubs Act 1976 are taxed at lower rates than poker machines installed in hotels. 489 463 518
Minor Tax Expenditures (< $1 million)
A full rebate of tax is provided to racing clubs operating non-TAB Ltd pools. ♦
E - 26 Budget Statement 2008-09

PARKING SPACE LEVY The benchmark is defined as off-street parking spaces in either Category one areas (City of Sydney, North Sydney and Milsons Point business districts) or Category two areas (Chatswood, Parramatta, St Leonards and Bondi Junction business areas).
The benchmark levy is indexed annually to movements in the Sydney CPI over the year to the previous March quarter. For 2007-08, the benchmark levy was $930 per space in Category one areas and $460 per space in Category two areas.
Table E14: Parking Space Levy
Major Tax Expenditures 2006-07$m
2007-08$m
2008-09 $m
General exemptions and concessions in all regions An exemption from the levy is granted to parking spaces for bicycles or motor cycles, parking of a motor vehicle by a person resident on the same premises, parking of a motor vehicle for the purpose of loading or unloading goods or passengers, parking of a vehicle by a person who is providing services on a casual basis, parking of a vehicle while a disabled person’s parking authority is displayed, parking without charge of a motor vehicle on premises owned or occupied by the council of the local government area, parking without charge of a motor vehicle on premises owned or occupied by a religious body or religious organisation, parking without charge of a motor vehicle on premises owned or occupied by a public charity or public benevolent institution, ambulance, fire brigade motor vehicle or police motor vehicle but only if used for garaging the vehicle overnight, parking without charge of a mobile crane, a forklift truck, a tractor or a front end loader, and parking without charge of a vehicle used only for carrying out deliveries or only for the provision of services, if the space is used for garaging the vehicle overnight on premises occupied by the owner of the vehicle. Concessions are also granted in all areas for certain unlet casual parking spaces and unlet tenant parking spaces. 14 15 15
Exempt parking spaces in Chatswood, Parramatta, St Leonards and Bondi Junction Parking spaces for customers attached to retail outlets, hotels, motels, clubs, restaurants, medical centres, car hire and sales, repair and wash establishments and funeral parlours are exempt from the levy. 8 8 9
Budget Statement 2008-09 E - 27

E2: DETAILED ESTIMATES OF CONCESSIONS
Details of concessions by function are shown below. Each concession is classified by type and a distinction is drawn between major concessions ($1 million or more) and minor concessions (less than $1 million).
Table E15: Education
Major Concessions 2006-07$m
2007-08$m
2008-09 $m
TAFE fee concession
Fee exemptions are available to ATSI students and for students enrolling in Special Access courses. Students with a disability (or in receipt of a disability pension) are exempted from one course fee and pay a concession fee per subsequent course enrolment in the same year. Students in receipt of a Commonwealth benefit or allowance pay a concession fee per course per year. Fees for apprentices and trainees are capped according to eligibility for a Commonwealth rebate. 62 66 69
School Student Transport Scheme
The School Student Transport Scheme provides subsidised travel to and from school for eligible students on government and private bus, rail, and ferry services, long distance coaches and in private vehicles where no public transport services exist. 433 446 465
Minor Concessions (< $1 million)
The Department of Primary Industries sells certain publications to schools and libraries at a lower than retail value.
♦
Table E16: Health
Major Concessions 2006-07$m
2007-08$m
2008-09 $m
Ambulance service for pensioners
Free transport by ambulance is provided for holders of pensioner health benefit cards. 113 130 150
Outpatient Pharmaceutical Scheme for pensioners
Free pharmaceuticals are provided for holders of pensioner health benefit cards. 2 3 3
Life Support Energy Rebates Scheme
The Department of Water and Energy funds a rebate for energy costs associated with certain life support systems. 3 3 3
E - 28 Budget Statement 2008-09
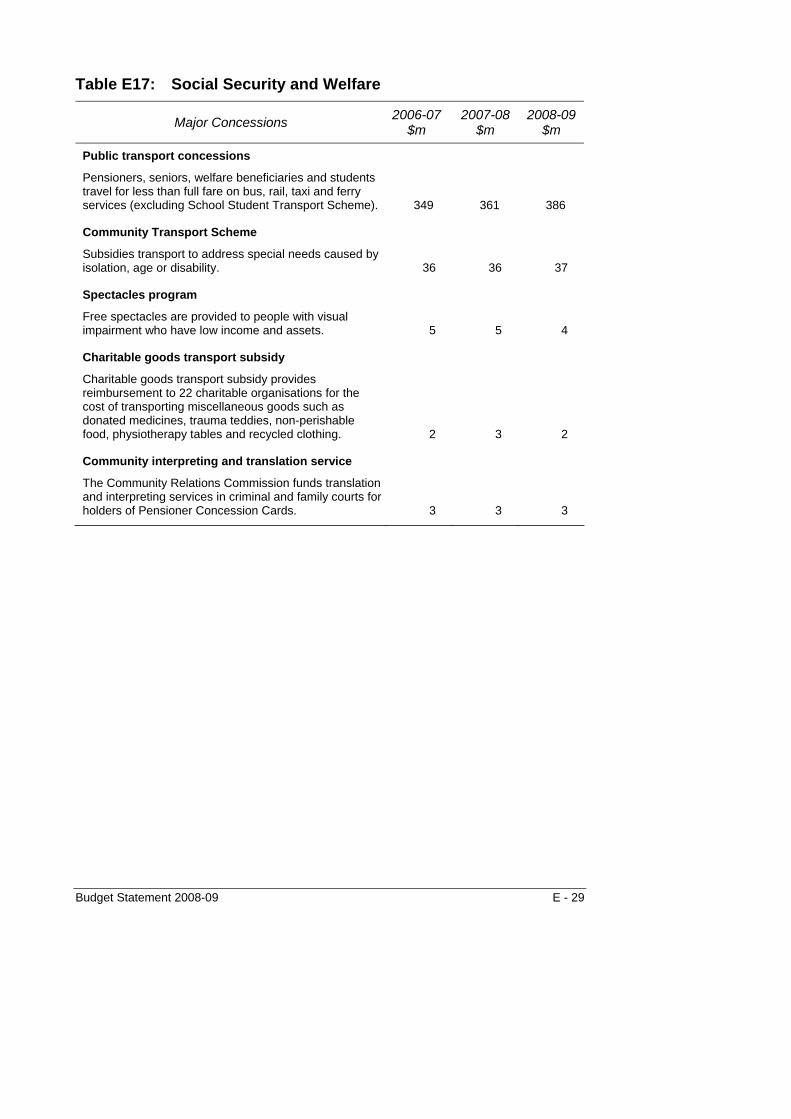
Table E17: Social Security and Welfare
Major Concessions 2006-07$m
2007-08$m
2008-09 $m
Public transport concessions
Pensioners, seniors, welfare beneficiaries and students travel for less than full fare on bus, rail, taxi and ferry services (excluding School Student Transport Scheme). 349 361 386
Community Transport Scheme
Subsidies transport to address special needs caused by isolation, age or disability. 36 36 37
Spectacles program
Free spectacles are provided to people with visual impairment who have low income and assets. 5 5 4
Charitable goods transport subsidy
Charitable goods transport subsidy provides reimbursement to 22 charitable organisations for the cost of transporting miscellaneous goods such as donated medicines, trauma teddies, non-perishable food, physiotherapy tables and recycled clothing. 2 3 2
Community interpreting and translation service
The Community Relations Commission funds translation and interpreting services in criminal and family courts for holders of Pensioner Concession Cards. 3 3 3
Budget Statement 2008-09 E - 29
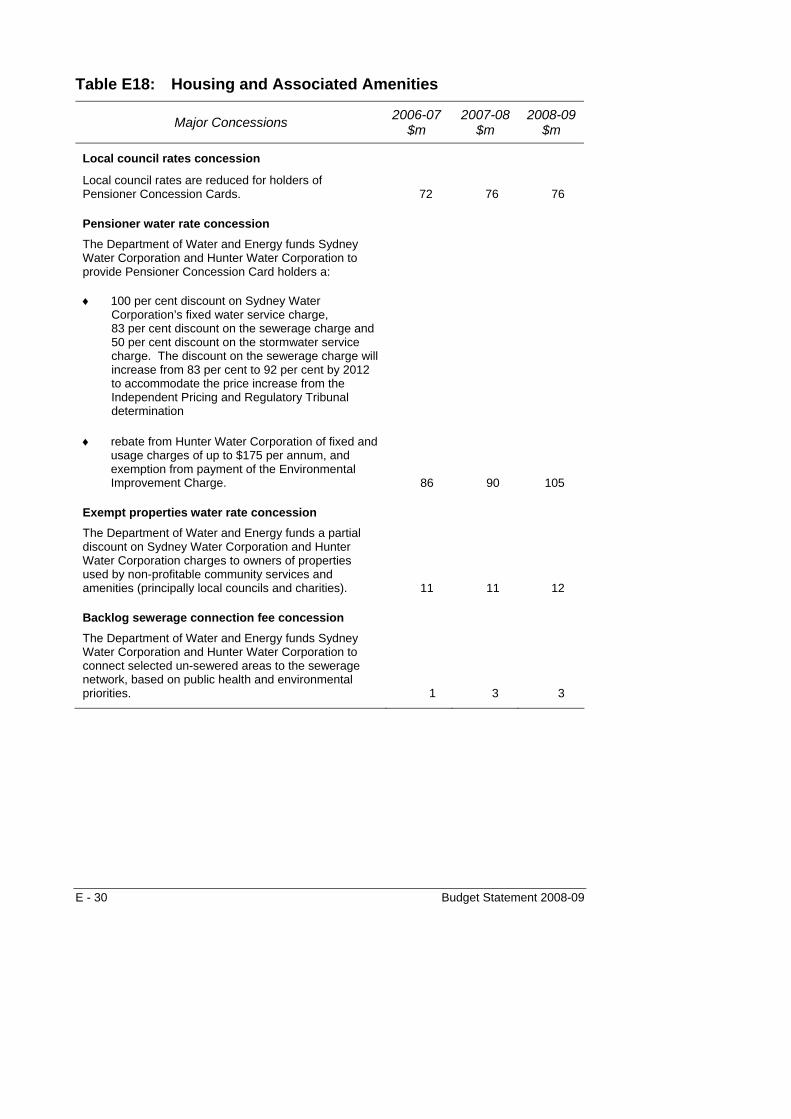
Table E18: Housing and Associated Amenities
Major Concessions 2006-07$m
2007-08$m
2008-09 $m
Local council rates concession
Local council rates are reduced for holders of Pensioner Concession Cards. 72 76 76
Pensioner water rate concession The Department of Water and Energy funds Sydney Water Corporation and Hunter Water Corporation to provide Pensioner Concession Card holders a:
♦
♦
100 per cent discount on Sydney Water Corporation’s fixed water service charge, 83 per cent discount on the sewerage charge and 50 per cent discount on the stormwater service charge. The discount on the sewerage charge will increase from 83 per cent to 92 per cent by 2012 to accommodate the price increase from the Independent Pricing and Regulatory Tribunal determination
rebate from Hunter Water Corporation of fixed and usage charges of up to $175 per annum, and exemption from payment of the Environmental Improvement Charge. 86 90 105
Exempt properties water rate concession The Department of Water and Energy funds a partial discount on Sydney Water Corporation and Hunter Water Corporation charges to owners of properties used by non-profitable community services and amenities (principally local councils and charities). 11 11 12
Backlog sewerage connection fee concession The Department of Water and Energy funds Sydney Water Corporation and Hunter Water Corporation to connect selected un-sewered areas to the sewerage network, based on public health and environmental priorities. 1 3 3
E - 30 Budget Statement 2008-09

Table E18: Housing and Associated Amenities (cont)
Major Concessions 2006-07$m
2007-08$m
2008-09 $m
Large family and financial hardship water concession
The Department of Water and Energy funds Sydney Water Corporation to undertake a range of social programs including the Payment Assistance Scheme for customers in financial hardship and measures to offset recent price rises. The price rise offset measures include free retrofits for large families, a $40 per annum discount on their water bill for large families with a health care card, and no interest loans for efficient appliances for customers in financial hardship. <1 1 1
Septic pump-out fee concession
The Department of Water and Energy funds a discount on Sydney Water Corporation’s septic pump-out fees to residences in the Blue Mountains that are residential-zoned and not connected to the sewerage network. 1 1 1
Energy Accounts Payment Assistance Scheme
The Department of Water and Energy funds an energy rebate (including gas and electricity) for consumers in financial hardship. 7 9 9
Pensioner Energy Subsidy Scheme
The Department of Water and Energy funds an energy rebate for holders of Pensioner Concession Cards. Under the Scheme, eligible pensioners receive a rebate of $112 per annum on their energy bills. 75 82 82
Crown Land rent concessions
Rebates from market rent may be granted in certain circumstances where tenure holders are eligible for concessions (eg eligible pensioners, charitable or non-profit community service, sporting or recreational organizations). 20 16 16
Minor Concessions (< $1 million)
Payment Assistance Scheme funded by Hunter Water Corporation for customers in financial hardship.
♦
Budget Statement 2008-09 E - 31
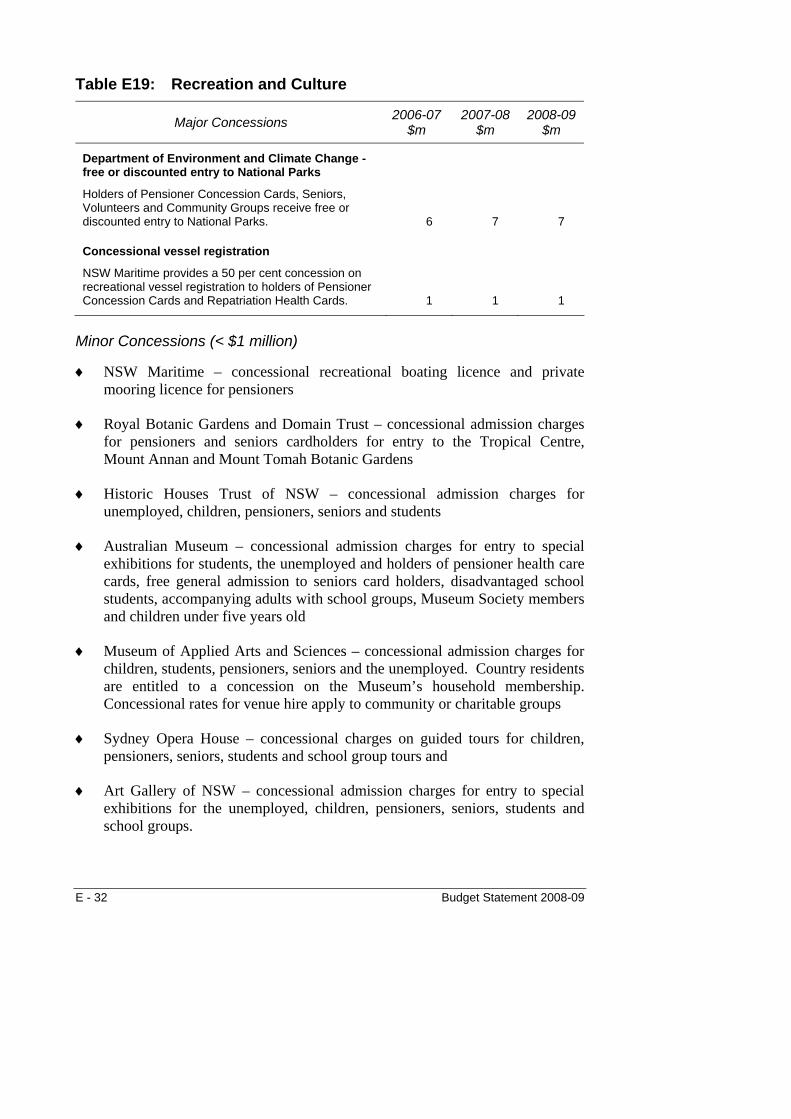
Table E19: Recreation and Culture
Major Concessions 2006-07$m
2007-08$m
2008-09 $m
Department of Environment and Climate Change - free or discounted entry to National Parks
Holders of Pensioner Concession Cards, Seniors, Volunteers and Community Groups receive free or discounted entry to National Parks. 6 7 7
Concessional vessel registration
NSW Maritime provides a 50 per cent concession on recreational vessel registration to holders of Pensioner Concession Cards and Repatriation Health Cards. 1 1 1
Minor Concessions (< $1 million)
NSW Maritime – concessional recreational boating licence and private mooring licence for pensioners
♦
♦
♦
♦
♦
♦
♦
Royal Botanic Gardens and Domain Trust – concessional admission charges for pensioners and seniors cardholders for entry to the Tropical Centre, Mount Annan and Mount Tomah Botanic Gardens
Historic Houses Trust of NSW – concessional admission charges for unemployed, children, pensioners, seniors and students
Australian Museum – concessional admission charges for entry to special exhibitions for students, the unemployed and holders of pensioner health care cards, free general admission to seniors card holders, disadvantaged school students, accompanying adults with school groups, Museum Society members and children under five years old
Museum of Applied Arts and Sciences – concessional admission charges for children, students, pensioners, seniors and the unemployed. Country residents are entitled to a concession on the Museum’s household membership. Concessional rates for venue hire apply to community or charitable groups
Sydney Opera House – concessional charges on guided tours for children, pensioners, seniors, students and school group tours and
Art Gallery of NSW – concessional admission charges for entry to special exhibitions for the unemployed, children, pensioners, seniors, students and school groups.
E - 32 Budget Statement 2008-09
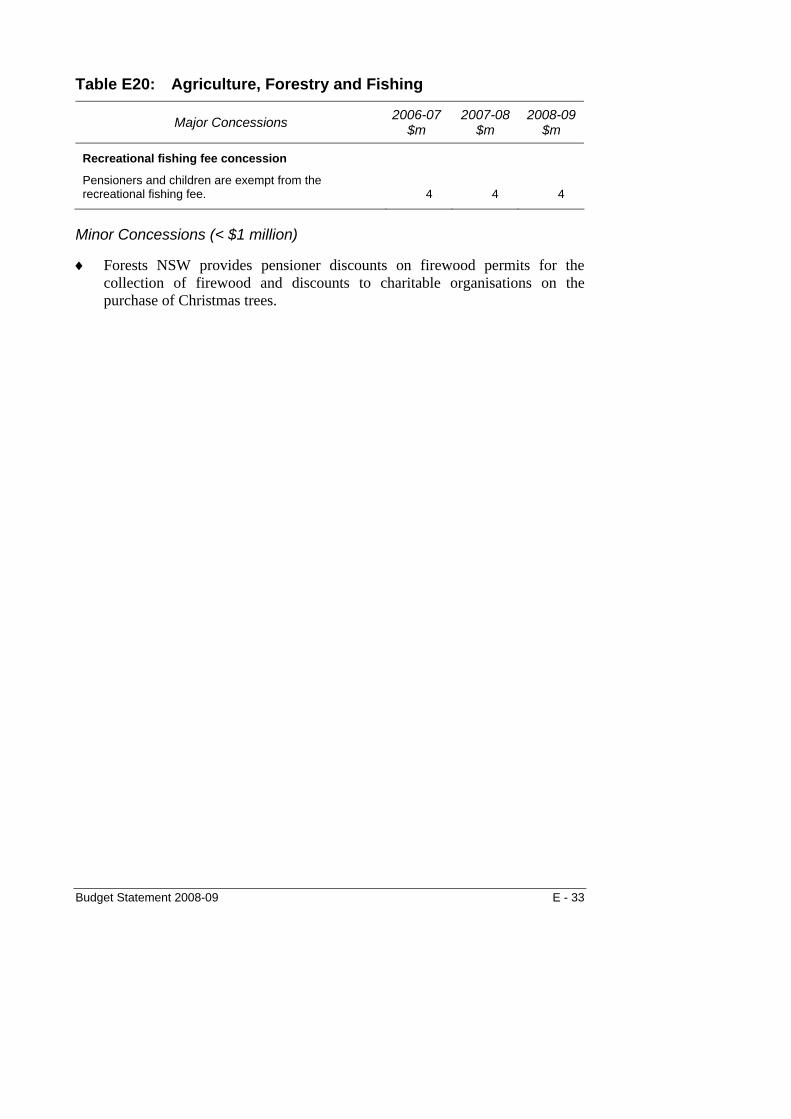
Table E20: Agriculture, Forestry and Fishing
Major Concessions 2006-07$m
2007-08$m
2008-09 $m
Recreational fishing fee concession
Pensioners and children are exempt from the recreational fishing fee. 4 4 4
Minor Concessions (< $1 million)
Forests NSW provides pensioner discounts on firewood permits for the collection of firewood and discounts to charitable organisations on the purchase of Christmas trees.
♦
Budget Statement 2008-09 E - 33
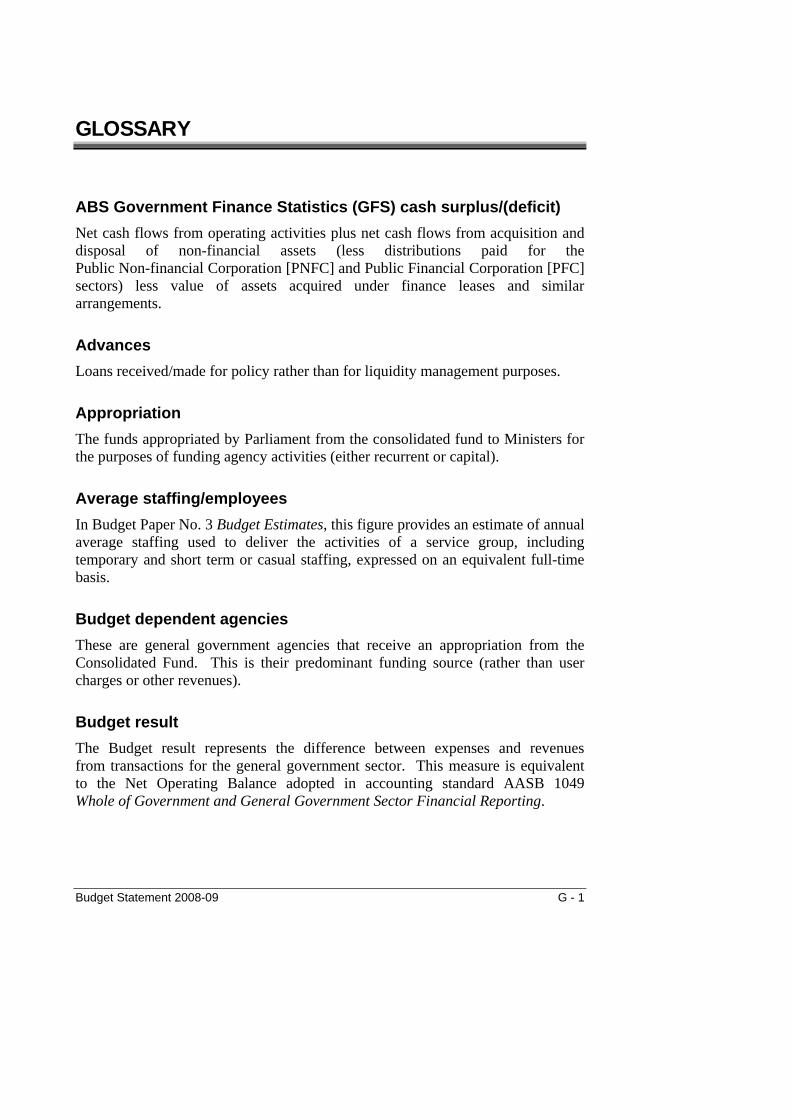
GLOSSARY
ABS Government Finance Statistics (GFS) cash surplus/(deficit) Net cash flows from operating activities plus net cash flows from acquisition and disposal of non-financial assets (less distributions paid for the Public Non-financial Corporation [PNFC] and Public Financial Corporation [PFC] sectors) less value of assets acquired under finance leases and similar arrangements.
Advances Loans received/made for policy rather than for liquidity management purposes.
Appropriation The funds appropriated by Parliament from the consolidated fund to Ministers for the purposes of funding agency activities (either recurrent or capital).
Average staffing/employees In Budget Paper No. 3 Budget Estimates, this figure provides an estimate of annual average staffing used to deliver the activities of a service group, including temporary and short term or casual staffing, expressed on an equivalent full-time basis.
Budget dependent agencies These are general government agencies that receive an appropriation from the Consolidated Fund. This is their predominant funding source (rather than user charges or other revenues).
Budget result The Budget result represents the difference between expenses and revenues from transactions for the general government sector. This measure is equivalent to the Net Operating Balance adopted in accounting standard AASB 1049 Whole of Government and General Government Sector Financial Reporting.
Budget Statement 2008-09 G - 1
Capital grants Amounts paid or received for capital purposes for which no economic benefits of equal value are receivable or payable in return. It includes cash, and physical assets donated such as developer contributions.
Cash surplus/(deficit) Net cash flows from operating activities plus net cash flows from acquisition and disposal of non-financial assets (less dividends paid for the PNFC and PFC sectors).
Change in net worth (comprehensive result) Change in net worth (comprehensive result) is revenue from transactions less expenses from transactions plus other economic flows, and measures the variation in a government’s accumulated assets and liabilities.
Consolidated Fund The fund is established under s39 of the Constitution Act 1902. Public monies collected on behalf of the State form this fund. This includes:
taxes, fines, fees collected ♦
♦
♦
♦
Commonwealth grants
dividends and tax equivalent payments from public trading and public financial enterprises and
recurrent and capital appropriations to agencies.
Current grants Amounts paid or received for current purposes for which no economic benefits of equal value are receivable or payable in return.
Equivalent Full-Time (EFT) This is a standard measure of staffing in terms of an equivalent number of full-time positions.
G - 2 Budget Statement 2008-09

Fiscal aggregates These are analytical balances that are useful for macroeconomic purposes, including assessing the impact of a government and its sectors on the economy. AASB 1049 prescribes net operating balance, net lending/borrowing (fiscal balance), change in net worth (comprehensive result), net worth, and cash surplus/(deficit). The Uniform Presentation Framework prescribes additional fiscal aggregates not included in AASB 1049. These are net debt, net financial worth, net financial liabilities and ABS GFS cash surplus/deficit.
Fiscal Responsibility Act 2005 The act sets out both medium-term and long-term fiscal targets and principles providing a framework for budgeting in New South Wales.
General government sector This is an ABS classification of agencies that provide public services (such as health, education and police) and funded in the main by taxation (directly or indirectly). Within this sector there are budget dependent and non-budget dependent agencies.
Government finance statistics (GFS) A system of financial reporting (normally referred to as GFS) developed by the International Monetary Fund and used by the Australian Bureau of Statistics to classify the financial transactions of governments and measure their impact on the rest of the economy.
Grants for on-passing All grants paid to one institutional sector (for example, a state government) to be passed on to another institutional sector (for example, local government or a non-profit institution).
Gross State Product The total market value of final goods and services produced within a state.
Budget Statement 2008-09 G - 3
Interest expense Costs incurred in connection with the borrowing of funds. It includes interest on advances, loans, overdrafts, bonds and bills, deposits, interest components of finance lease repayments, and amortisation of discounts or premiums in relation to borrowings. Where discounting is used, the carrying amount of a liability increases in each period to reflect the passage of time. This increase is also recognised as an interest expense.
Memorandum items – Loan Council Memorandum items are used to adjust the cash surplus/(deficit) to include in the Loan Council Allocation certain transactions that may have the characteristics of public sector borrowings/investments but do not constitute formal borrowings/investments. Examples include operating leases and the movement in government defined benefit superannuation fund assets.
Net acquisition of non-financial assets This is purchases (or acquisitions) of non-financial assets less sales (or disposals) of non-financial assets less depreciation plus changes in inventories and other movements in non-financial assets. Purchases and sales (or net acquisitions) of non-financial assets generally include accrued expenses and payables for capital items. Other movement in non-financial assets include non-cash capital grant revenue/expenses such as developer contribution assets.
Net cost of services In agency operating statements this measures the net cost of providing government services. It equals operating expenses less operating revenues, and excludes government contributions.
Net debt Net debt equals the sum of deposits held, advances received, loans and other borrowings less the sum of cash and deposits, advances paid and investments, loans and placements.
G - 4 Budget Statement 2008-09

Net financial liabilities This is the total liabilities less financial assets, other than equity in PNFCs and PFCs. It is a more accurate indicator than net debt of a jurisdiction’s fiscal position. This is because it is a broader measure than net debt in that it includes significant liabilities other than borrowings (for example, accrued employee liabilities such as superannuation and long service leave entitlements). For the PNFC and PFC sectors, it is equal to negative net financial worth. For the general government sector NFL, excluding the net worth of other sectors results in a purer measure than net financial worth as, in general, the net worth of other sectors of government is backed up by physical assets.
Net financial worth Net financial worth measures a government’s net holdings of financial assets. It is calculated from the balance sheet as financial assets less liabilities. It is a broader measure than net debt, in that it incorporates provisions made (such as superannuation) as well as holdings of equity. It includes all classes of financial assets and liabilities, only some of which are included in net debt.
Net lending/(borrowing) The financing requirement of government, calculated as the net operating balance less the net acquisition of non-financial assets. It also equals transactions in financial assets less transactions in liabilities. A positive result reflects a net lending position and a negative result reflects a net borrowing position.
Net operating balance This is calculated as revenue from transactions less expenses from transactions.
Net worth It is an economic measure of wealth and is equal to total assets less liabilities.
Nominal dollars/prices It shows the dollars of the relevant period. No adjustment is made each time period for inflation.
Budget Statement 2008-09 G - 5

Non-budget dependent general government agencies These are general government agencies that do not rely on the Consolidated Fund for direct financial support. They predominately source funds from regulatory and user charges (but may receive budget funding in the form of grants from other general government agencies for certain activities or services).
Non-financial public sector (NFPS) The NFPS is a subsector formed by the consolidation of the general government sector (GGS) and public non-financial corporations (PNFC) sector.
Other economic flows This is the changes in the volume or value of an asset or liability that do not result from transactions (that is, revaluations and other changes in the volume of assets).
Payables A liability that includes short and long term trade creditors, accounts payable and interest accrued.
Performance Management and Budgeting System (PMBS) An integrated performance management system that aligns Government priorities and performance targets with agency funding and service delivery plans. The PMBS is a key element of the accountability structures established by the State Plan to improve service delivery performance.
Priority Delivery Plan (PDP) The State Plan allocates priorities and targets to Lead and Partner Ministers and Agencies. A PDP is an action plan to coordinate Lead and Partner agencies’ service delivery strategies. The plan is prepared by a Lead Minister to support decision making by the Cabinet Standing Committee on State Plan Performance.
Privately Financed Projects (PFP) This is a specific form of Private Public Partnerships which involves the creation of an infrastructure asset through private sector financing and private ownership for a concession period (usually long term). The Government may contribute to the project by providing land or capital works, through risk sharing, revenue diversion or purchase of the agreed services.
G - 6 Budget Statement 2008-09
Public Private Partnerships (PPP) Any contracted relationship between the public and private sectors to produce an infrastructure asset or deliver a service.
Public Financial Enterprise (PFE) An ABS classification of agencies that have one, or more, of the following functions:
that of a central bank ♦
♦
♦
the acceptance of demand, time or savings deposits or
the authority to incur liabilities and acquire financial assets in the market on their own account.
For GFS purposes these are referred to as public financial corporations (PFC).
Public trading enterprise (PTE) An ABS classification of agencies where user charges represent a significant proportion of revenue and the agency operates with a broadly commercial orientation. For GFS purposes, the ABS refers to these as Public Non-Financial Corporations (PNFC).
Receivables An asset that includes short and long term trade debtors, accounts receivable and interest accrued.
Results These describe the desirable impact of services on the community, the environment or the economy or changes in public perceptions. They are consistent with Government priorities.
Results and Services Plan (RSP) A service delivery and funding plan prepared by an agency to support decision making by the Cabinet Standing Committee on the Budget. The RSP provides a clear “line of sight” for performance management by setting out the linkages between State Plan priorities, the results that an agency is working towards, the services it delivers to contribute to those results, and the costs of delivering those services as reflected in the agency’s budget.
Budget Statement 2008-09 G - 7

Services These are the ‘end products’ or direct services that are delivered to clients or recipients, the broader community or another government agency. They are expected to contribute to Government priorities.
Service groups Services that are grouped together on the basis of the results they contribute to, the client group that they serve, common cost drivers or other service measures. There should be a clear ‘line of sight’ between the service groups and the services and activities that are costed and managed as part of internal business planning.
Service Group Statement Service group is now the basis for reporting financial and non-financial estimates. Each service group statement in Budget Paper No. 3 Budget Estimates includes narrative material – service description and linkage to results – as well as service measures, expense, net cost of service and capital information.
Social programs These are non-commercial activities of PTEs that have social objectives. Where the objectives are a high priority to the government these programs are funded from the Budget as community service obligations (CSO).
State owned corporation (SOC) Government agencies (mostly PTEs) which have been established with a governance structure mirroring as far as possible that of a publicly listed company. NSW state owned corporations are scheduled under the State Owned Corporations Act 1989 (Schedule 5).
Superannuation interest cost The expense is the net of interest cost on defined benefit superannuation obligations less the long term expected return on plan assets as determined by the accounting standards.
Interest cost is the increase during a period in the present value of a defined benefit obligation which arises because the benefits are one period closer to settlement, as per the relevant accounting standard.
G - 8 Budget Statement 2008-09

Other superannuation expense It includes all superannuation expenses from transactions except superannuation interest cost. It generally includes all employer contributions to accumulation schemes and the current service cost, which is the increase in defined benefit entitlements associated with the employment services provided by employees in the current period. However, superannuation actuarial gains/losses are excluded as they are considered ‘other economic flows’.
Surplus/(deficit) In Budget Paper No.3 this is the accounting result which corresponds to profit or loss in private sector reports. It equals the net cost of services adjusted for government contributions. This is not the same as the budget result or the GFS Cash Surplus/(Deficit).
Total Asset Management (TAM) A set of plans setting out the management of an agency’s physical assets (land, buildings, infrastructure, plant and equipment) ensuring they align with the services to be provided, and achieve required performance levels. Management of assets involves acquisition, maintenance, operations and disposals.
Total expenses The total amount of expenses incurred in the provision of goods and services, regardless of whether a cash payment is made to meet the expense in the same year. It does not include expenditure on the purchase of assets. It also excludes losses, which are classified as other economic flows.
Total revenues The total amount of revenue due by way of taxation, Commonwealth grants and from other sources (excluding asset sales) regardless of whether a cash payment is received. It excludes gains, which are classified as other economic flows.
Total state sector Represents all agencies and corporations owned and controlled by the NSW Government. It comprises the general government, public trading (also referred to as the public non-financial corporations) and public financial enterprises.
Budget Statement 2008-09 G - 9
I N D E X
Budget Statement 2008-09 i - 1
A Agency classifications C-1
Australian Accounting Standards – departures from
B-3
B
Balance Sheet
General government sector 1-18, 10-19
Public non-financial corporation sector
10-22
Non-financial public sector 10-24
Budget process
Planning 3-3
Budgeting 3-3
Monitoring 3-4
Budget result
2007-08 1-11, 10-10
2008-09 1-4, 10-10
2009-10 to 2011-12 1-7, 10-10
Budget risks 1-23, 9-5
Budget trends 2-7
Budget scope B-5, C1
Bus services 3-17, 7-16
C
Capital expenditure
General government sector 1-15, 2-14
PTE sector 7-4
Capital structure (PTE) 7-11
Cash Flow Statement
General government sector 1-20, 10-27
Public non-financial corporation sector
10-30
Non-financial public sector 10-11
Cash results
General government sector 1-22 10-29
Public non-financial corporation sector
10-32
Non-financial public sector 10-35
Casino taxation agreement 4-5
Classification of agencies C-1
Commercial Policy Framework 7-2
Commonwealth Grants 4-23, 8-9
Commonwealth Grants Commission’s 2008 Update
8-12
Commonwealth Grants Commission’s 2010 Review
8-20
Commonwealth-State relations 8-1
Community and Disability Services 3-22
Community Infrastructure (Intergenerational) Fund
2-19, 7-2
Comprehensive results 1-14
Concessions 5-5
By function 5-5
Detailed estimates E-28
Concepts and methods 5-2
Consumer Price Index (CPI) 9-5, 9-14
Contingencies 1-24

I N D E X
i - 2 Budget Statement 2008-09
COAG
Reform agenda 8-2
Working groups 8-3
Credit markets 9-17
D
Debt management 6-28
Demographic change 2-9
Departures from Australian Accounting Standards
B-3
Dividends 4-26
Drought 9-21
Dwelling investment 9-12
E
Economic situation and outlook 9-1
Medium term outlook 9-15
Overview 9-2, 9-23
Recent performance 9-3
Risks to Budget Outcomes 9-16
Economy 9-1
Australian CPI 9-7, 9-14
Credit markets 9-16
Employment 9-7, 9-14
Gross state product 9-7, 9-11
Interest rates 9-8, 9-11
Infrastructure 9-5
New South Wales 9-6, 9-14
State final demand 9-6, 9-11
Structure 9-12
Wages 9-7, 9-14
World 9-9
Education and Training 3-15, 3-16
Efficiency dividends 1-24, 3-4
Electricity reforms 7-2
Electricity sector 7-13
Employee costs 3-7
Environment and Natural Resources 3-25
Expenditure trends and composition 3-5
Expenses
Budget estimates 2008-09 1-5
Budget estimates 2009-10 to 2011-12
1-9
By function (Uniform Presentation Framework)
10-38
By major policy areas 3-26
By service delivery 3-26
Forward estimates 1-19
General government 3-5
Revised estimates 2007-08 1-10, D-1
F
Financial asset management 4-26
Financial risk management 4-28
Fines 4-27
Fiscal principles 2-2, A-1
Fiscal Responsibility Act 2005 2-2, A-1
Fiscal Strategy 2-2
Targets and principles 2-18, A-1
Impact of 2008-09 Budget on the long-term fiscal gap
2-20
I N D E X
Budget Statement 2008-09 i - 3
G
Gambling and betting taxes 4-22
General Government
Agencies - see also Budget Paper No. 3
C-1
Balance Sheet 1-18, 10-19
Budget result 1-4
Capital expenditure 1-15
Cash Flow Statement 1-20, 10-36
Expenses 1-5
Net debt 1-28, 6-2
Net financial liabilities 1-28, 6-12
Net worth 1-28
Operating statement 1-28, 10-10
Revenues 4-1
Scope C-1
Service delivery 3-9
Global credit markets 9-18
Goods and services tax (GST)
Cross subsidies 8-17
Expected GST revenue 4-12
Guaranteed minimum amount 8-16
Revenue grants 8-11
Government Finance Statistics 3-9
Grants revenue 4-23
Gross state product 9-4, 9-12
H
Health 3-12, 4-13
HIH Insurance Group 6-25
Horizontal fiscal equalisation 8-11
Housing 7-23
I
IPART review of taxation 4-14
Infrastructure – see capital expenditure
2-14
Insurance 6-29
Intergenerational fund 2-19, 7-2
Interest expense – see net debt
Interest income (revenue) 4-25
Intergovernmental financial relations 8-1
Investment income 6-26
K
Keno extension to hotels 4-6
L
Labour market 9-7
Land tax 4-20
Law and Order – see Police and Justice
3-2, 3-21
I N D E X
i - 4 Budget Statement 2008-09
Liabilities
Insurance liabilities 6-12
Net financial liabilities 6-10
Superannuation liabilities 6-11
Licences (Revenue) 4-28
Loan Council Reporting Requirements
10-40
Long-term fiscal gap 2-20
M
Marketable securities duty 4-3
Mortgage Duty 4-2
Motor Vehicle Tax 4-21
N
National Competition Policy Payments
8-10
National Partnership Agreements 8-8
Net debt
General government sector 1-11, 6-2
PTE sector 6-5
Total state sector 6-8
Net financial liabilities
General government sector 1-12, 6-12
PTE sector 6-13
Net lending/borrowing
General government sector 1-14, 10-12
Public non-financial corporation sector
10-15
Non-financial public sector 10-18
Net operating balance – see Budget result
Net worth 6-14
NSW Economy 9-11
Non-financial public sector statements
10-16, 10-24, 10-33
O
Operating results
General government sector 1-14
Public trading enterprises 7-2
Operating Statement
General Government Sector 1-7, 10-10
Public non-financial corporation sector
10-13
Non-financial public sector 10-16
Owen Inquiry 2-16, 7-2
P
Payroll tax 4-19
Payroll tax rate 4-4
Payroll tax threshold 4-4
Revenue 4-19
Performance Budgeting 3-2
Performance Management and Budgeting System
3-2
Police and Justice 3-21
Population 9-4, 9-15
Portfolio management 6-27
Ports 7-18

I N D E X
Budget Statement 2008-09 i - 5
Property trust reconstructions 4-5
Public Authorities (Financial Arrangements) Act 1987
6-30
Public liability insurance 6-22
Public non-financial corporation sector – see public trading enterprises (PTE)
Public trading enterprises (PTE) 7-1
Capital expenditure 7-6
Capital structure 7-11
Commercial Policy Framework 7-2
Dividends 4-26
Net debt 6-5
Operating performance 7-3
Uniform Presentation Framework Financial Statements
10-13, 10-22, 10-30
Public Transport and Roads 3-17
R
Rail 7-16
Revenue
Budget estimates 2008-09 1-4
Budget estimates 2009-10 to 2011-12
1-7
Budget measures 4-4
Commonwealth grants 4-23
Dividends 4-24
Fines 4-26
Forecasting 4-22
GST 4-12
Grants and contributions 4-24
Interest income 4-25
Licences 4-28
Regulatory Fees 4-28
Revised estimates 2007-08 1-11, D-1
Royalties 4-28
Sale of goods and services 4-24
Taxation policy measures 4-2
Tax equivalents 4-26
Trends and composition 4-7
Risks to budget outcomes 1-23, 9-16
Royalties 4-28
S
Sale of goods and services (Revenue) 4-24
Self insurance 6-21
Service delivery 3-9
Social Housing 7-23
Specific Purpose Payments (SPPs)
Revenue 4-23, 8-9
Reform 8-5
Stamp duties 4-20
State final demand 9-6, 9-11
State Plan 2-2, 3-2
Superannuation
Funding plan 6-18
Unfunded liabilities 6-16
I N D E X
i - 6 Budget Statement 2008-09
T
Taxation revenue 4-17
Gambling and betting taxes 4-22
Land tax 4-20
Motor vehicle taxation 4-21
Payroll tax 4-19
Tax effort 4-13
Tax equivalents 4-26
Tax expenditures
By function 5-4
By type of tax 5-3
Concepts and methods 5-2
Detailed estimates E-1
Taxation policy measures 4-2
Tax restraint 4-15
Total revenue 4-7
Transfer duty 4-20
Non-land business assets 4-5
Transport 3-17, 7-16
Treasurer’s Advance 1-24, D-5
Treasury Managed Fund (TMF) 6-21
U
Unfunded superannuation liabilities 6-11
Uniform Financial Reporting 10-1
Uniform Presentation Framework 10-2
Classification of agencies C-1
Departures from Australian Accounting Standards
B-3
General Government Balance Sheet
10-19
General Government Cash Flow Statement
10-27
General Government Operating Statement
10-10
General government purchases of non-financial assets
10-39
General government sector expenses by function
10-38
General government sector grants
10-36
General government sector taxes
10-36
Harmonised GFS-GAAP reporting 10-1
Loan Council reporting requirements
10-40
Uniform Presentation Tables 10-9
V
Variations summary 2007-08 D-1
Vertical fiscal imbalance 8-1
W
Wages
Expenses 1-6, 3-7
Growth 1-23, 2-11
Policy 2-10, 3-8
Water 7-20
Weight tax 4-21
Workers compensation insurance 6-21
World oil prices 9-17