budget paper no. 2
TRANSCRIPT

Outcomes Statement
2020-21
Budget Paper No. 2
Circulated by The Hon. Dominic Perrottet MP, Treasurer


Outcomes Statement 2020-21
TABLE OF CONTENTS
About this Budget Paper ....................................................................................... i
1. Customer Service ........................................................................................... 1 - 1
2. Education Cluster ........................................................................................... 2 - 1
3. Health Cluster .................................................................................................. 3 - 1
4. Planning, Industry & Environment Cluster .................................................. 4 - 1
5. Premier and Cabinet Cluster .......................................................................... 5 - 1
6. Regional NSW Cluster .................................................................................... 6 - 1
7. Stronger Communities Cluster ...................................................................... 7 - 1
8. Transport Cluster ............................................................................................ 8 - 1
9. Treasury Cluster ............................................................................................. 9 - 1
10. The Legislature ............................................................................................... 10 – 1
Outcomes Statement 2020-21 i
ABOUT THIS BUDGET PAPER
Purpose and scope
Budget Paper No. 2 Outcomes Statement supports transparency and accountability by reporting how resources have been allocated across Clusters and State Outcomes and how New South Wales is performing against these State Outcomes. Further details on the scope and purpose of this Budget paper is outlined in How to Read the Budget Papers.
Agency financial statements and agency expense summaries, which were previously included in Budget Paper 3, are now presented in Budget Paper 4: Agency Financial Statements.
Outcome Budgeting
The fiscal pressures resulting from COVID-19 increase the importance of a strong framework for scrutinising and prioritising the use of every dollar spent by the State.
Outcome Budgeting is a multi-year reform program that continues to put the needs of people at the centre of investment decision-making across the sector. It improves oversight of total expenditure, as well as providing greater evidence to support and prioritise resource allocation. Sustained over time, Outcome Budgeting improves the way that Government plans and manages resources to deliver outcomes for the people of New South Wales.
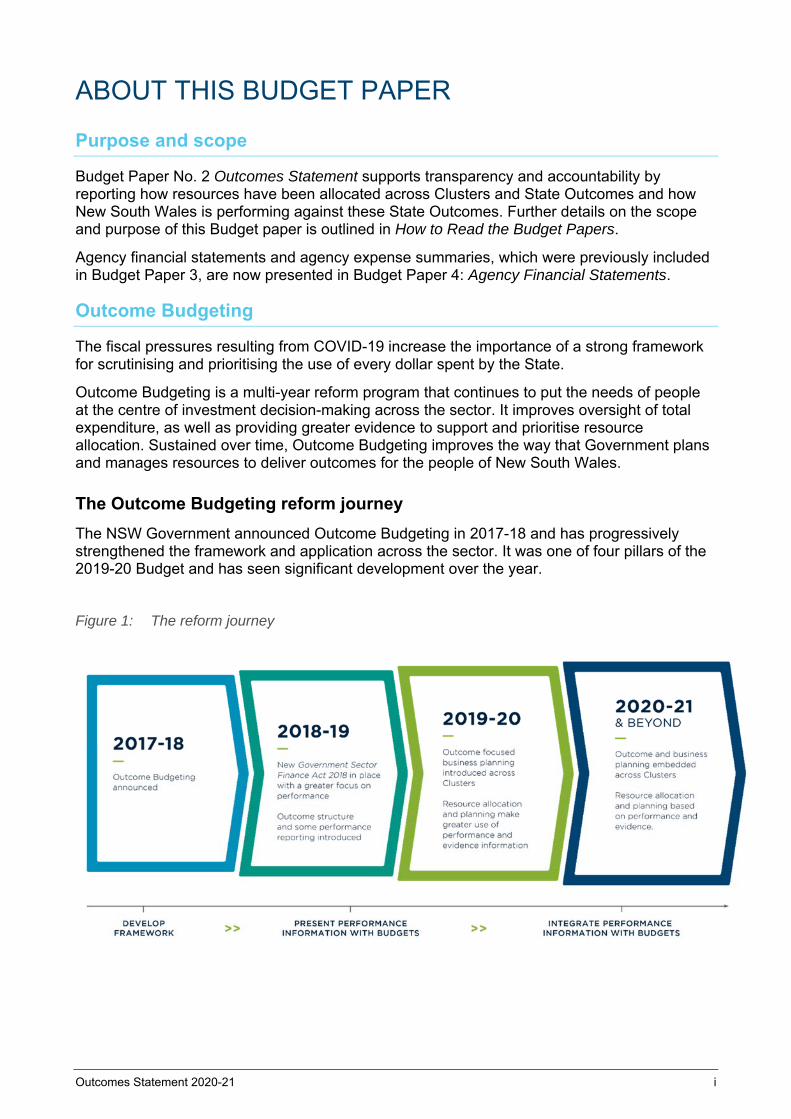
The Outcome Budgeting reform journey
The NSW Government announced Outcome Budgeting in 2017-18 and has progressively strengthened the framework and application across the sector. It was one of four pillars of the 2019-20 Budget and has seen significant development over the year.
Figure 1: The reform journey
About this Budget Paper
ii Outcomes Statement 2020-21
The Outcome and Performance Framework
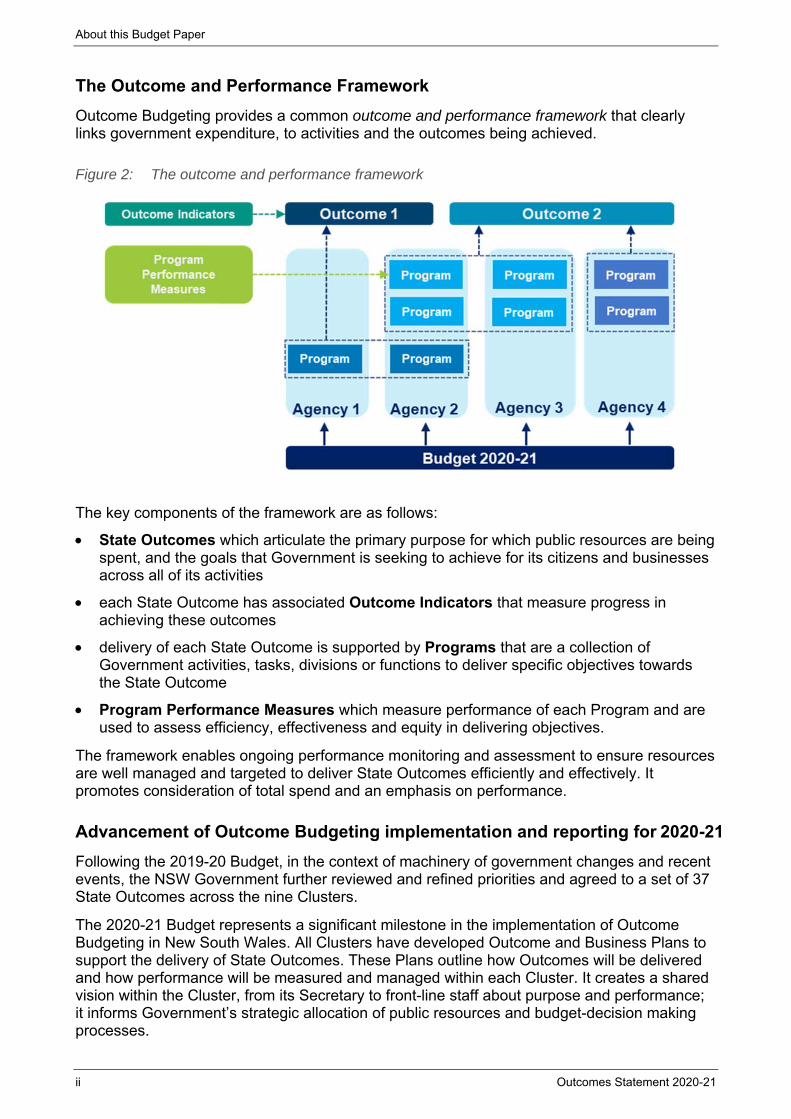
Outcome Budgeting provides a common outcome and performance framework that clearly links government expenditure, to activities and the outcomes being achieved.
Figure 2: The outcome and performance framework
The key components of the framework are as follows:
State Outcomes which articulate the primary purpose for which public resources are being spent, and the goals that Government is seeking to achieve for its citizens and businesses across all of its activities
each State Outcome has associated Outcome Indicators that measure progress in achieving these outcomes
delivery of each State Outcome is supported by Programs that are a collection of Government activities, tasks, divisions or functions to deliver specific objectives towards the State Outcome
Program Performance Measures which measure performance of each Program and are used to assess efficiency, effectiveness and equity in delivering objectives.
The framework enables ongoing performance monitoring and assessment to ensure resources are well managed and targeted to deliver State Outcomes efficiently and effectively. It promotes consideration of total spend and an emphasis on performance.
Advancement of Outcome Budgeting implementation and reporting for 2020-21
Following the 2019-20 Budget, in the context of machinery of government changes and recent events, the NSW Government further reviewed and refined priorities and agreed to a set of 37 State Outcomes across the nine Clusters.
The 2020-21 Budget represents a significant milestone in the implementation of Outcome Budgeting in New South Wales. All Clusters have developed Outcome and Business Plans to support the delivery of State Outcomes. These Plans outline how Outcomes will be delivered and how performance will be measured and managed within each Cluster. It creates a shared vision within the Cluster, from its Secretary to front-line staff about purpose and performance; it informs Government’s strategic allocation of public resources and budget-decision making processes.
About this Budget Paper
Outcomes Statement 2020-21 iii
Outcome and Business Plans will be regularly updated and reviewed to inform ongoing planning and management across the suite of State Outcomes. This includes a continued focus on improving performance measurement, ensuring all Outcome Indicators have performance targets and reviewing and refining Programs and Program Performance Measures.
Additional performance information on Clusters and agencies continues to be reported across a range of other sources such as agency website, annual reports and the Productivity Commission’s Report on Government Services.
Delivery of State Outcomes
The 37 agreed State Outcomes are aligned with, and complement, the Premier’s 14 Priorities (each Priority metric is included as an Outcome Indicator under the relevant State Outcome).
Clusters are reporting a high level of delivery against these State Outcomes relative to the significant challenges to service demand and service delivery as a result of recent natural disasters and current pandemic.
These challenges, including drought, bushfires and COVID-19, have had far-reaching impacts across the suite of State Outcomes and have required significant ongoing management and resources to address.
While there have been adverse impacts to several performance indicators for State Outcomes as a result, there have also been significant opportunities to implement innovation and reform. These have been demonstrated through a step change in service delivery across the public sector including implementation of digital innovation in areas such as customer service, health and transport.
Cluster arrangements
Clusters are groups of entities with shared or related policy goals. The Cluster arrangement aims to improve government services and outcomes for the community by:
pursuing common objectives across agencies
better integrating services
helping to allocate resources between areas.
A Cluster is not a legal or reporting entity.
Changes to Cluster arrangements
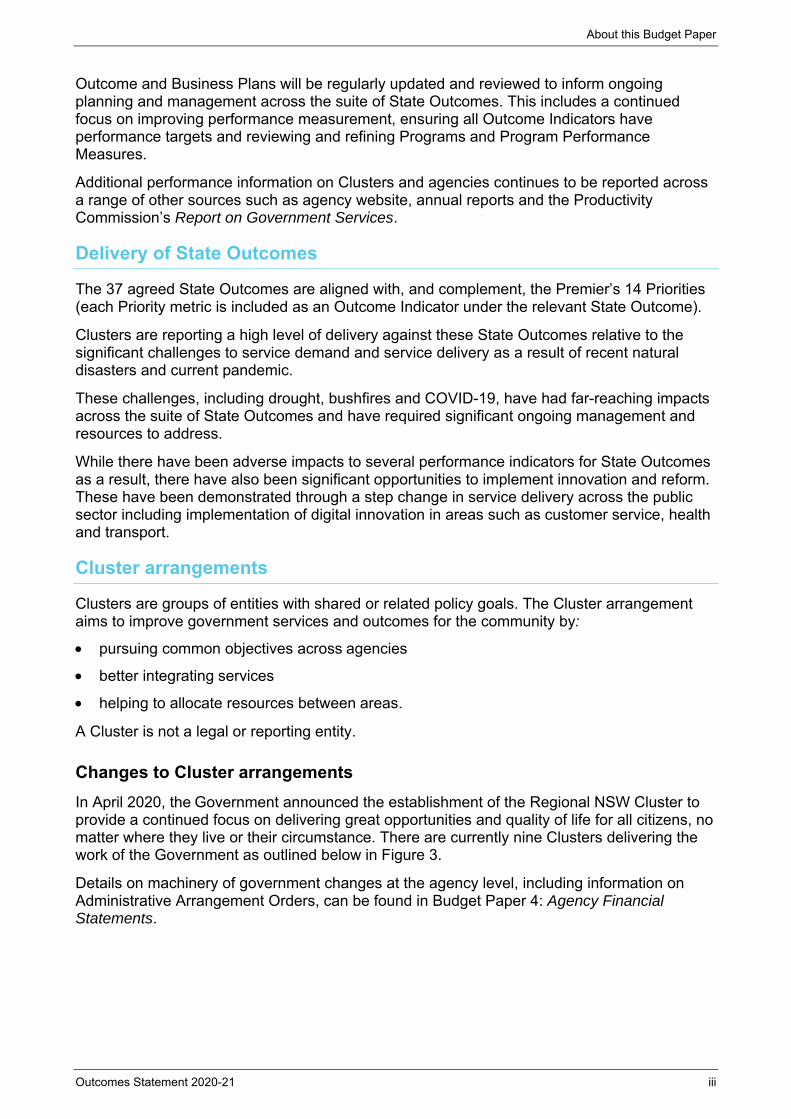
In April 2020, the Government announced the establishment of the Regional NSW Cluster to provide a continued focus on delivering great opportunities and quality of life for all citizens, no matter where they live or their circumstance. There are currently nine Clusters delivering the work of the Government as outlined below in Figure 3.
Details on machinery of government changes at the agency level, including information on Administrative Arrangement Orders, can be found in Budget Paper 4: Agency Financial Statements.
About this Budget Paper
iv Outcomes Statement 2020-21
Figure 3: The Government Clusters and the 37 State Outcomes
Customer Service Education Health
Plans, prioritises, funds and drives digital transformation
and customer service across every Cluster in the
NSW Government.
Drives early childhood, primary, secondary and all
tertiary education – vocational, university, skills and lifelong
learning.
Focuses on its priorities of providing quality healthcare
and continuing with its unprecedented hospital
expansion and renewal of capital works
State Outcomes State Outcomes State Outcomes
Digital leadership and innovation in government
services
Best start in life for young
children
Keeping people healthy through prevention and health
promotion
Excellence in Customer Service
Educational foundations for
success
People receive timely emergency care
Fair, secure and efficient markets
High-quality standards for schooling in NSW
People receive high-quality,
safe care in our hospitals
Skilled and employable
workforce
People can access care in out of hospital settings to manage
their health and wellbeing
Our people and systems are continuously improving to
deliver the best health outcomes and experiences
Planning, Industry and
Environment Premier and Cabinet Regional NSW
Focuses on improving the liveability, prosperity and
sustainability of every community in NSW.
Leads the NSW public sector to deliver on the NSW
Government’s commitments and priorities.
Builds strong, cohesive communities and economies,
grow primary industries, create jobs and employment, and
steward the use of our natural endowments.
State Outcomes State Outcomes State Outcomes Connecting communities to
resilient and sustainable energy and local
environments
Accountable and responsible
Government
Mineral and petroleum industries generating
prosperity, safely
Create a strong and liveable NSW
Effective and coordinated
Government
Productive and sustainable land use
Maximise community benefit from Government
land and property
Empowering Aboriginal communities
Stronger and cohesive
regional communities and economies
Sustainable, secure and healthy water resources
and services
Excellence in arts, culture and heritage
Stronger primary industries

About this Budget Paper
Outcomes Statement 2020-21 v
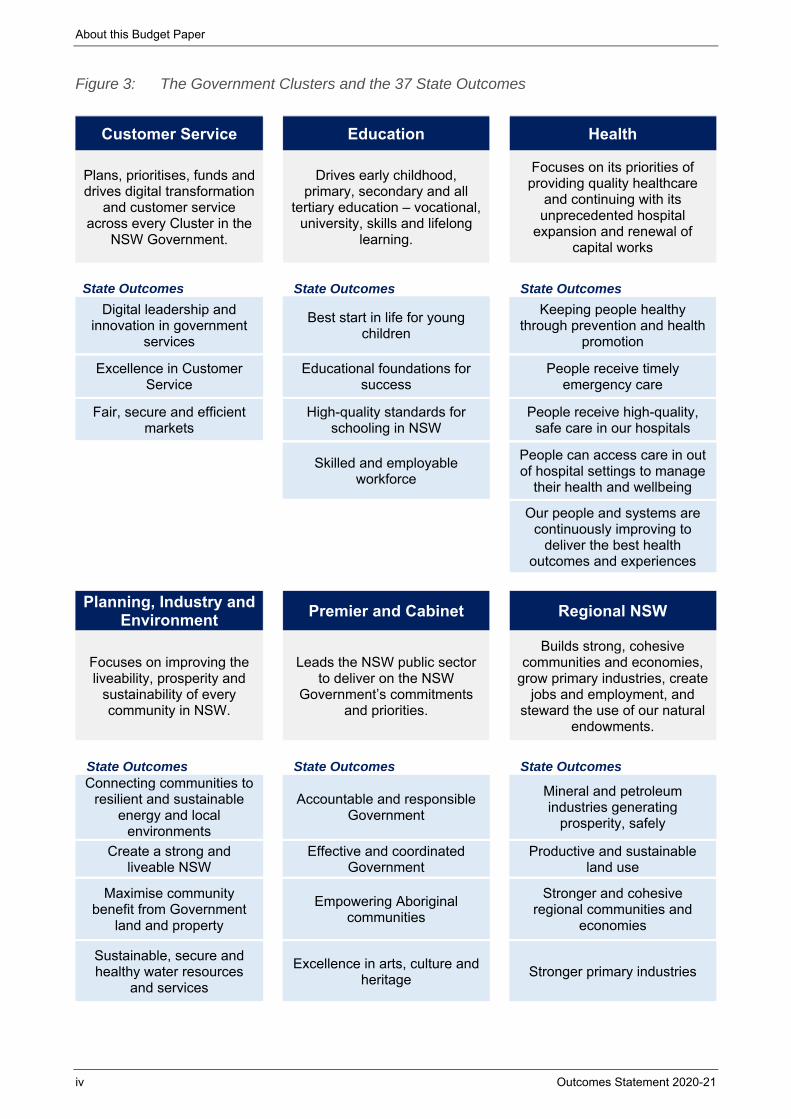
Stronger Communities
Transport Treasury
Drives the delivery of programs that support public safety, social
wellbeing and justice in New South Wales.
Provides an integrated focus on all modes of transport
including a continued focus on regional transport.
Supports a strong fiscal
operating position and balance sheet and leads the promotion of a strong economy, creating
quality jobs and securing investments for the State.
State Outcomes State Outcomes State Outcomes
Active and inclusive communities
Sustainable transport Systems
and solutions supporting economic activity
A strong, resilient and diverse
economy
Children and families thrive Connecting our customers’
whole lives
A sustainable fiscal environment enabling delivery
of outcomes
Efficient and effective legal system
Successful places for
communities
Stewardship of the public sector performance and
financial system
People have a safe and affordable place to live
Prepared for disasters and emergencies
Reduce reoffending
Safer communities
About this Budget Paper
vi Outcomes Statement 2020-21
Structure of this budget paper
This Budget paper includes an Outcome Statement related to the State Outcomes for each of the nine Clusters, as well as a separate chapter for the Legislature covering its strategic priorities and objectives.
Cluster Introduction
Section Description
Introduction This describes the role, main activities and responsibilities of the Cluster.
2020-21 Investment This graphic depicts the amount of recurrent expenses and capital expenditure for the Cluster.
State Outcomes to be delivered by the cluster
A short description of the State Outcomes the Cluster is working towards and examples of programs underway to support delivery of these Outcomes.
Overview of Cluster expenses by State Outcome
This section graphical presents the amount and percentage of recurrent expenses and capital expenditure across each of the State Outcomes delivered by the Cluster.
Cluster State Outcome Statements
Section Description
State Outcome Overview A description of the State Outcome.
2020-21 Investment This graphic depicts the amount of recurrent expenses and capital expenditure for the Outcome.
2020-21 Budget highlights Description of the significant new and ongoing initiatives the Cluster listed under the Outcome
Key performance insights A short description and chart providing analysis and insights on performance of selected Outcome Indicators.
Performance indicators for this Outcome
Information on the performance of Outcome Indicators for the Outcome.
Outcomes Statement 2020-21 1 - 1
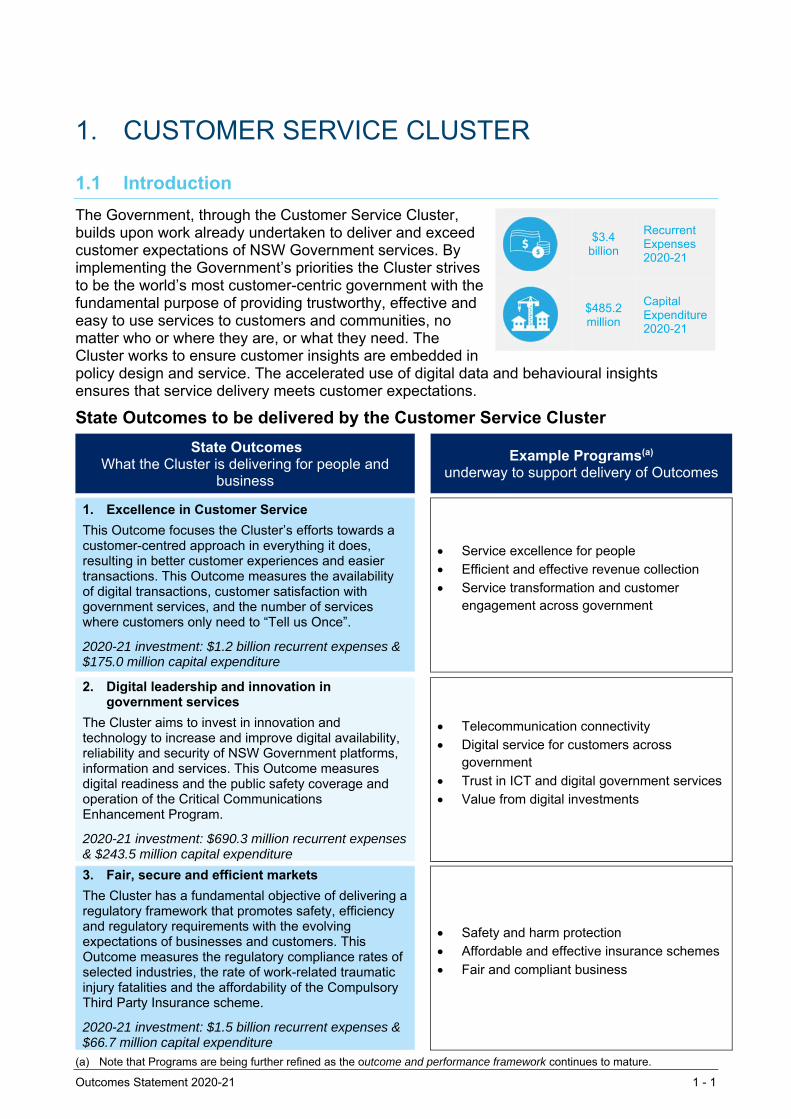
1. CUSTOMER SERVICE CLUSTER
1.1 Introduction
The Government, through the Customer Service Cluster, builds upon work already undertaken to deliver and exceed customer expectations of NSW Government services. By implementing the Government’s priorities the Cluster strives to be the world’s most customer-centric government with the fundamental purpose of providing trustworthy, effective and easy to use services to customers and communities, no matter who or where they are, or what they need. The Cluster works to ensure customer insights are embedded in policy design and service. The accelerated use of digital data and behavioural insights ensures that service delivery meets customer expectations.
State Outcomes to be delivered by the Customer Service Cluster
State Outcomes What the Cluster is delivering for people and
business
Example Programs(a) underway to support delivery of Outcomes
1. Excellence in Customer Service
This Outcome focuses the Cluster’s efforts towards a customer-centred approach in everything it does, resulting in better customer experiences and easier transactions. This Outcome measures the availability of digital transactions, customer satisfaction with government services, and the number of services where customers only need to “Tell us Once”.
2020-21 investment: $1.2 billion recurrent expenses & $175.0 million capital expenditure
Service excellence for people Efficient and effective revenue collection Service transformation and customer
engagement across government
2. Digital leadership and innovation in government services
The Cluster aims to invest in innovation and technology to increase and improve digital availability, reliability and security of NSW Government platforms, information and services. This Outcome measures digital readiness and the public safety coverage and operation of the Critical Communications Enhancement Program.
2020-21 investment: $690.3 million recurrent expenses & $243.5 million capital expenditure
Telecommunication connectivity Digital service for customers across
government
Trust in ICT and digital government services Value from digital investments
3. Fair, secure and efficient markets
The Cluster has a fundamental objective of delivering a regulatory framework that promotes safety, efficiency and regulatory requirements with the evolving expectations of businesses and customers. This Outcome measures the regulatory compliance rates of selected industries, the rate of work-related traumatic injury fatalities and the affordability of the Compulsory Third Party Insurance scheme.
2020-21 investment: $1.5 billion recurrent expenses & $66.7 million capital expenditure
Safety and harm protection Affordable and effective insurance schemes Fair and compliant business
(a) Note that Programs are being further refined as the outcome and performance framework continues to mature.
$3.4 billion
Recurrent Expenses 2020-21
$485.2 million
Capital Expenditure2020-21
Customer Service Cluster
1 - 2 Outcomes Statement 2020-21
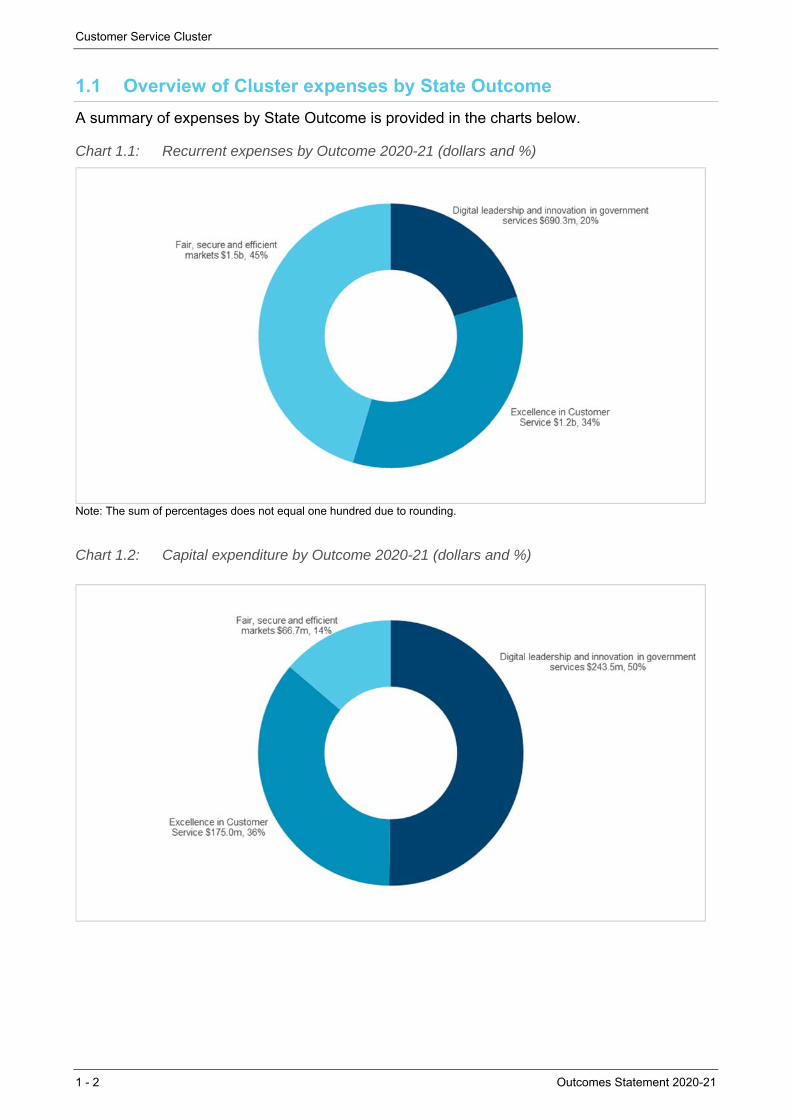
1.1 Overview of Cluster expenses by State Outcome
A summary of expenses by State Outcome is provided in the charts below.
Chart 1.1: Recurrent expenses by Outcome 2020-21 (dollars and %)
Note: The sum of percentages does not equal one hundred due to rounding.
Chart 1.2: Capital expenditure by Outcome 2020-21 (dollars and %)
Customer Service Cluster
Outcomes Statement 2020-21 1 - 3
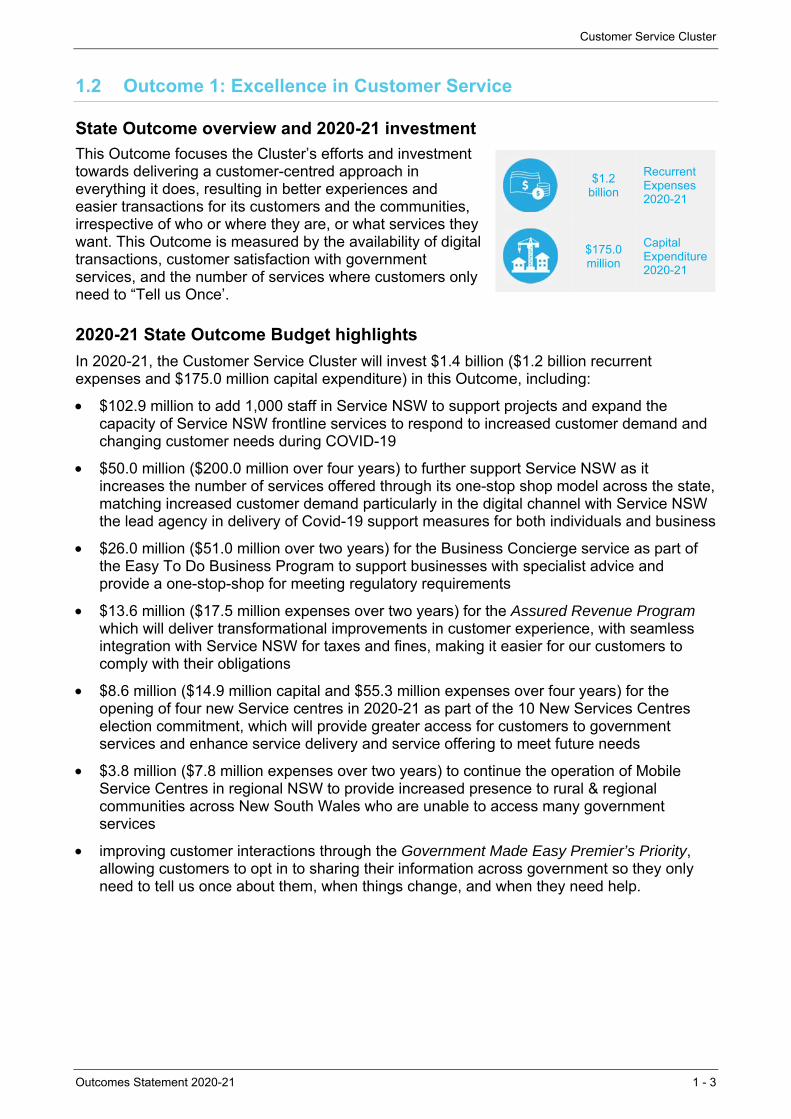
1.2 Outcome 1: Excellence in Customer Service
State Outcome overview and 2020-21 investment
This Outcome focuses the Cluster’s efforts and investment towards delivering a customer-centred approach in everything it does, resulting in better experiences and easier transactions for its customers and the communities, irrespective of who or where they are, or what services they want. This Outcome is measured by the availability of digital transactions, customer satisfaction with government services, and the number of services where customers only need to “Tell us Once’.
2020-21 State Outcome Budget highlights
In 2020-21, the Customer Service Cluster will invest $1.4 billion ($1.2 billion recurrent expenses and $175.0 million capital expenditure) in this Outcome, including:
$102.9 million to add 1,000 staff in Service NSW to support projects and expand the capacity of Service NSW frontline services to respond to increased customer demand and changing customer needs during COVID-19
$50.0 million ($200.0 million over four years) to further support Service NSW as it increases the number of services offered through its one-stop shop model across the state, matching increased customer demand particularly in the digital channel with Service NSW the lead agency in delivery of Covid-19 support measures for both individuals and business
$26.0 million ($51.0 million over two years) for the Business Concierge service as part of the Easy To Do Business Program to support businesses with specialist advice and provide a one-stop-shop for meeting regulatory requirements
$13.6 million ($17.5 million expenses over two years) for the Assured Revenue Program which will deliver transformational improvements in customer experience, with seamless integration with Service NSW for taxes and fines, making it easier for our customers to comply with their obligations
$8.6 million ($14.9 million capital and $55.3 million expenses over four years) for the opening of four new Service centres in 2020-21 as part of the 10 New Services Centres election commitment, which will provide greater access for customers to government services and enhance service delivery and service offering to meet future needs
$3.8 million ($7.8 million expenses over two years) to continue the operation of Mobile Service Centres in regional NSW to provide increased presence to rural & regional communities across New South Wales who are unable to access many government services
improving customer interactions through the Government Made Easy Premier’s Priority, allowing customers to opt in to sharing their information across government so they only need to tell us once about them, when things change, and when they need help.
$1.2 billion
Recurrent Expenses 2020-21
$175.0 million
Capital Expenditure2020-21

Customer Service Cluster
1 - 4 Outcomes Statement 2020-21
Key performance insights
This section provides analysis and insights on key Outcome Indicators for this State Outcome.
Increase the number of government services where customers only have to "Tell government once"
Government Made Easy means customers can choose to reuse their personal details to reduce customer time and effort in accessing services and to improve customer outcomes:
for everyday transactional services, customer details can be pre-filled in forms, for example applying for Active Kids and Creative Kids vouchers using a MyServiceNSW account
when things change in customers’ lives, multiple agencies can be notified in one step, for example a single notification on the death of a loved one through the Australian Death Notification Service
in more complex situations, sensitive information can be shared with customer consent between agencies, for example the bushfire customer care model.
Performance against this indicator is well on track to significantly exceed the target of 60 services by June 2023, with 25 services delivered as at 30 June 2020.
Chart 1.3: Number of government services where customers only have to "Tell government once"
Percentage of transactions available digitally through Service NSW
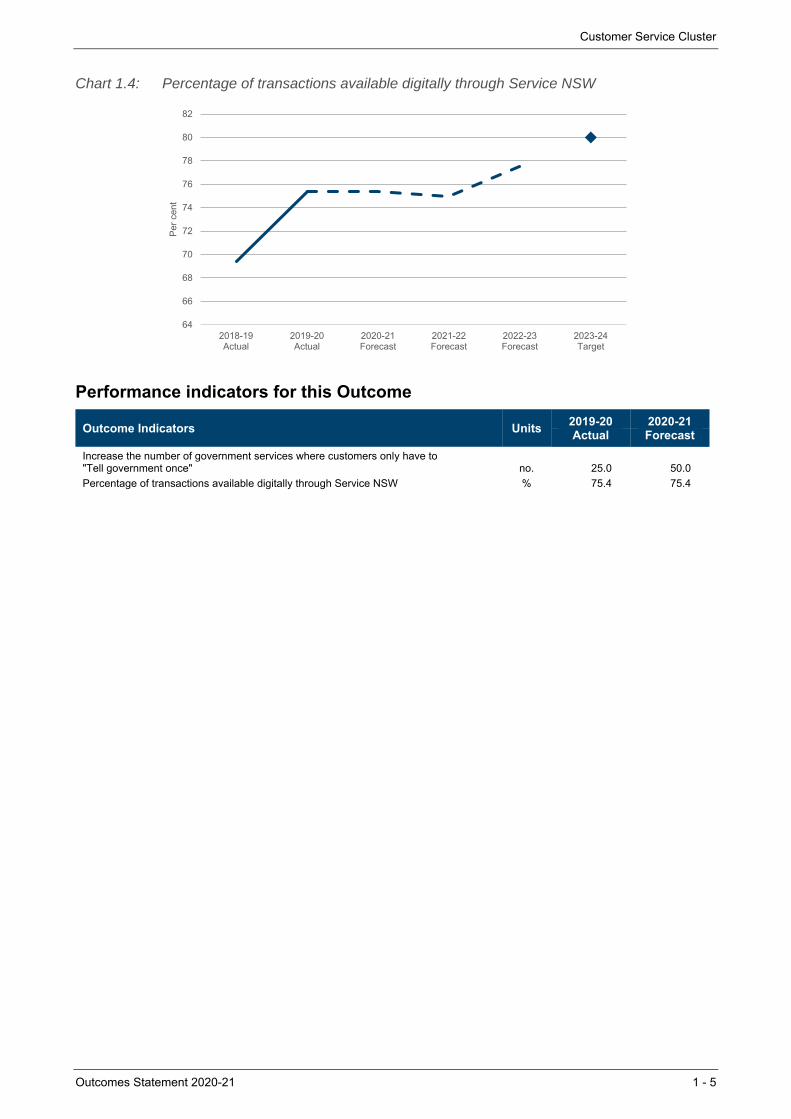
Service NSW is committed to excellence in customer service and continues to improve access to government services by making more services available online. Performance against this indicator is increasing and is expected to achieve the ambitious target of making 80 per cent of services available digitally by 2023-24. The data underpinning this Outcome Indicator currently relates to Roads and Maritime Services transactions only. Customers without access to digital services by phone or from home, or who would like support accessing digital services can visit one of 109 Service Centres around the State, or our four Mobile Service Centres that bring services to communities across the State. All Service Centres have digital kiosks and specially trained team members who can help customers to understand and access digital services.
0
10
20
30
40
50
60
70
80
90
2019-20Actual
2020-21Forecast
2021-22Forecast
2022-23Target
Num
ber
Customer Service Cluster
Outcomes Statement 2020-21 1 - 5
Chart 1.4: Percentage of transactions available digitally through Service NSW
Performance indicators for this Outcome
Outcome Indicators Units 2019-20 2020-21Actual Forecast
Increase the number of government services where customers only have to "Tell government once" no. 25.0 50.0
Percentage of transactions available digitally through Service NSW % 75.4 75.4
64
66
68
70
72
74
76
78
80
82
2018-19Actual
2019-20Actual
2020-21Forecast
2021-22Forecast
2022-23Forecast
2023-24Target
Per
cen
t
Customer Service Cluster
1 - 6 Outcomes Statement 2020-21
1.3 Outcome 2: Digital leadership and innovation in government services
State Outcome overview and 2020-21 investment
The Cluster aims to invest in innovation and technology to increase and improve digital availability, reliability and security of NSW Government platforms, information and services. This Outcome measures digital readiness, and the public safety coverage and operation of the Critical Communications Enhancement Program – a critical enabling asset for many government service providers, including emergency services.
2020-21 State Outcome Budget highlights
In 2020-21, the Customer Service Cluster will invest $933.8 million ($690.3 million recurrent expenses and $243.5 million capital expenditure) in this Outcome, including:
$500.0 million ($1.6 billion for projects over three years) for the Digital Restart Fund. The purpose of the Fund is to support digital and information and communications technology initiatives across the government sector
$240.0 million under the Digital Restart Fund over three years has been allocated to Cyber Security Investments across the sector. The first initiative to be approved under this fund is a $20.0 million ($60.0 million expenses over three years) investment in Cyber Security Maturity, a program under the control of the NSW Chief Cyber Security officer in the Department of Customer Service
$63.1 million ($217.0 million capital over four years) for the Critical Communications Enhancement Project, which will deliver greater access to public safety standard radio communications for the State’s first responders and essential service agencies
$10.0 million ($30.6 million expenses over four years) to deliver a one front door corporate shared services model that is secure, innovative, efficient and scalable to support a seamless customer experience for our consumers and better value for money for the citizens of New South Wales.
Key performance insights
This section provides analysis and insights on key Outcome Indicators for this State Outcome.
Public safety coverage and operations of the CCEP
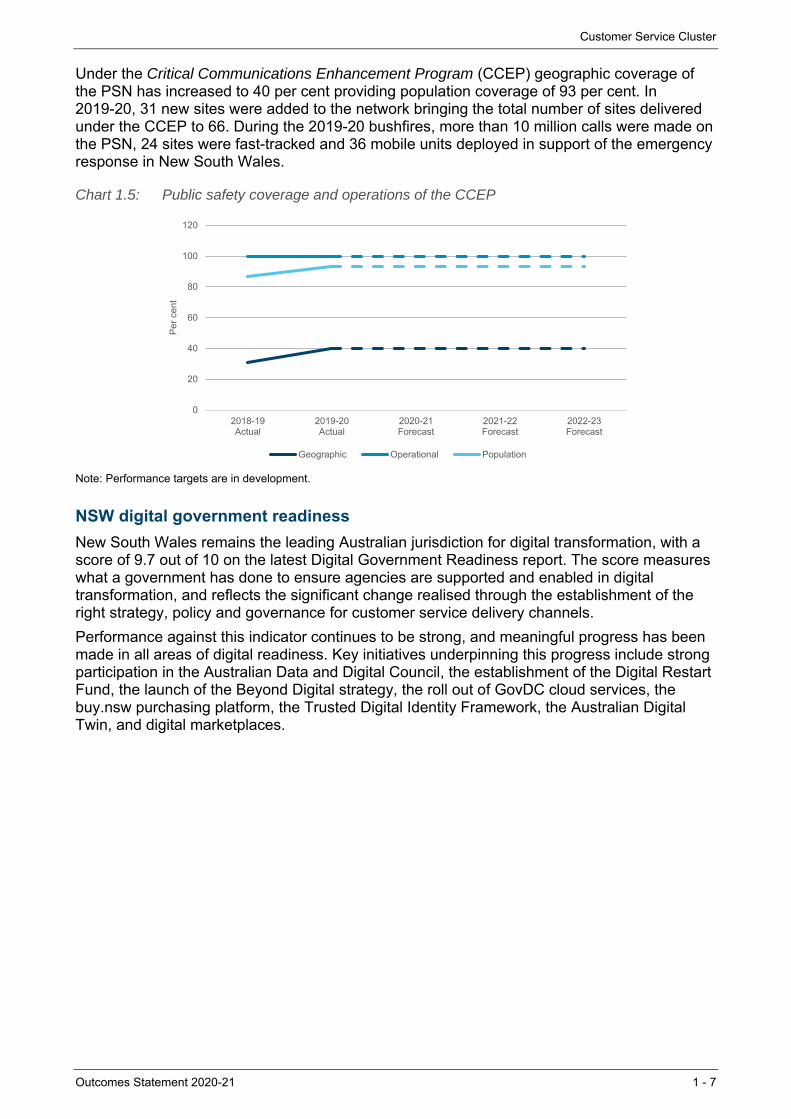
The Public Safety Network (PSN), also referred to as the Government Radio Network, is one of the world's largest trunked radio networks, shared by more than 50 agencies and serving approximately 42,000 registered terminals.
This indicator measures the coverage of the PSN. Performance against this indictor has been improving and continues to track to the network availability target of 99.95 per cent.
$690.3 million
Recurrent Expenses 2020-21
$243.5 million
Capital Expenditure2020-21
Customer Service Cluster
Outcomes Statement 2020-21 1 - 7
Under the Critical Communications Enhancement Program (CCEP) geographic coverage of the PSN has increased to 40 per cent providing population coverage of 93 per cent. In 2019-20, 31 new sites were added to the network bringing the total number of sites delivered under the CCEP to 66. During the 2019-20 bushfires, more than 10 million calls were made on the PSN, 24 sites were fast-tracked and 36 mobile units deployed in support of the emergency response in New South Wales.
Chart 1.5: Public safety coverage and operations of the CCEP
Note: Performance targets are in development.
NSW digital government readiness
New South Wales remains the leading Australian jurisdiction for digital transformation, with a score of 9.7 out of 10 on the latest Digital Government Readiness report. The score measures what a government has done to ensure agencies are supported and enabled in digital transformation, and reflects the significant change realised through the establishment of the right strategy, policy and governance for customer service delivery channels.
Performance against this indicator continues to be strong, and meaningful progress has been made in all areas of digital readiness. Key initiatives underpinning this progress include strong participation in the Australian Data and Digital Council, the establishment of the Digital Restart Fund, the launch of the Beyond Digital strategy, the roll out of GovDC cloud services, the buy.nsw purchasing platform, the Trusted Digital Identity Framework, the Australian Digital Twin, and digital marketplaces.
0
20
40
60
80
100
120
2018-19Actual
2019-20Actual
2020-21Forecast
2021-22Forecast
2022-23Forecast
Per
cen
t
Geographic Operational Population

Customer Service Cluster
1 - 8 Outcomes Statement 2020-21
Chart 1.6: NSW digital government readiness score
Note: A forecast is not available as the values are sourced from the Digital Government Readiness Report prepared by Intermedium. The next results are expected to be released in early 2021. Note: Performance targets are in development.
Performance indicators for this Outcome
Outcome Indicators Units 2019-20 2020-21
Actual Forecast NSW digital government readiness no.
New South Wales 9.7 n.a.(a)
Australian Government 9.2 n.a.(a)
Victoria 8.8 n.a.(a)
Queensland 8.7 n.a.(a)
South Australia 8.5 n.a.(a)
Northern Territory 8.0 n.a.(a)
Australian Capital Territory 7.9 n.a.(a)
Western Australia 7.4 n.a.(a)
Tasmania 7.0 n.a.(a)
Public safety coverage and operations of the CCEP %
Geographic 40 40
Operational 99.95 99.95
Population 93 93
Note (a) A 2020-21 forecast is not available as the values are sourced from the Digital Government Readiness Report prepared by
Intermedium. The next results are expected to be released in early 2021.
0
2
4
6
8
10
12
2016-17Actual
2017-18Actual
2018-19Actual
2019-20Actual
Sco
re
New South Wales Australian Capital Territory Australian GovernmentNorthern Territory Queensland South AustraliaTasmania Victoria Western Australia
Customer Service Cluster
Outcomes Statement 2020-21 1 - 9
1.4 Outcome 3: Fair, secure and efficient markets
State Outcome overview and 2020-21 investment
The Cluster has a fundamental objective of delivering a regulatory framework that promotes safety, efficiency and regulatory requirements with the evolving expectations of businesses and customers. This Outcome is measured by the regulatory compliance rates of selected industries, the rate of work-related traumatic injury fatalities and the affordability of the Compulsory Third Party Insurance scheme.
2020-21 State Outcome Budget highlights
In 2020-21, the Customer Service Cluster will invest $1.6 billion ($1.5 billion recurrent expenses and $66.7 million capital expenditure) in this Outcome, including:
$41.2 million ($152.0 million expenses over four years) for Responsible Gambling to support responsible gambling and reduce gambling harm in the community
$23 million ($139 million over 3 years) for an assurance program to project manage the remediation process for removal of high-risk cladding in residential apartment buildings across the State
$15.9 million ($22.9 million expenses over two years) for the Office of Racing to assist Greyhound Racing NSW and its clubs to improve animal welfare, including track upgrades to reduce injury rates for racing dogs
$6.7 million ($27.3 million expenses over four years) for the Construct NSW Transformation program to support the Building Commissioner to implement a comprehensive strategy that will restore public confidence in the NSW building and construction industry, particularly for multi-storey residential apartments.
Key performance insights
This section provides analysis and insights on key Outcome Indicators for this State Outcome.
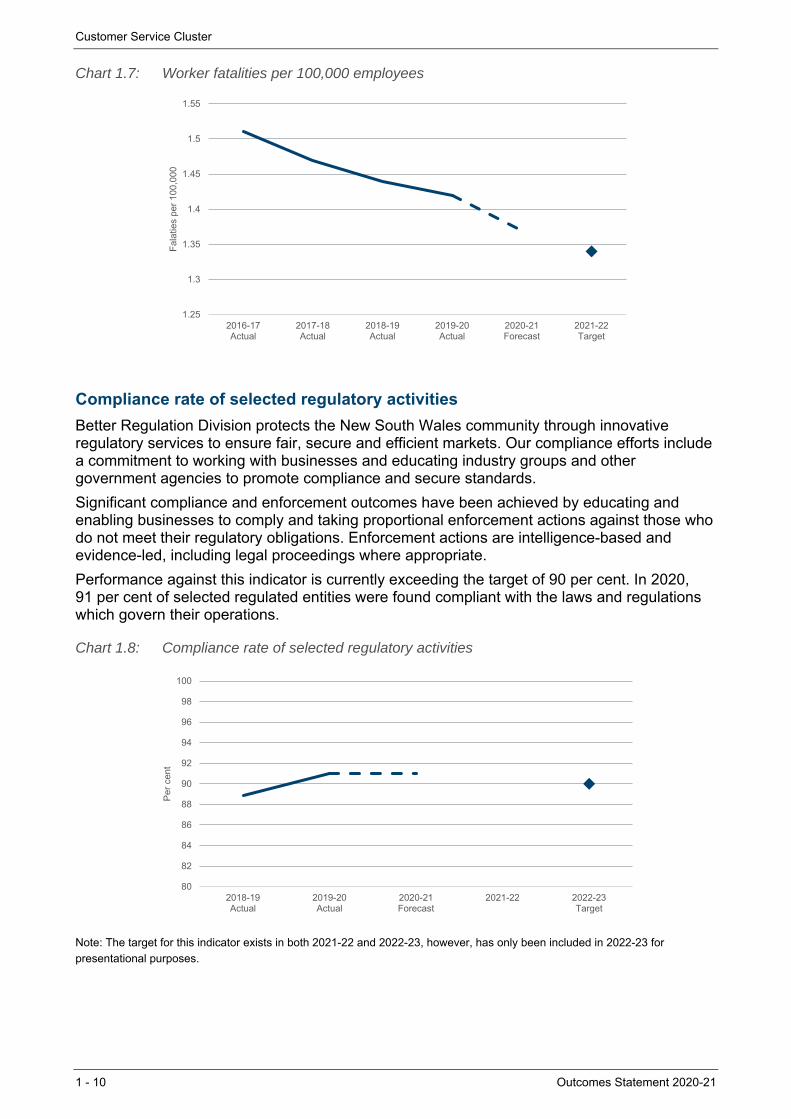
Reduced rate of work-related traumatic injury fatalities (worker fatalities per 100,000 employees)
The Work Health and Safety Roadmap for NSW 2022 outlines a strategic approach to reducing workplace fatalities and injuries by focusing on priority high risk sectors, workplaces and workers.
SafeWork NSW works proactively and responsively to support worker safety. When a fatality or serious injury occurs, SafeWork NSW responds quickly with significant resources to ensure the workplace is made safe and the investigation commences immediately. In 2016, SafeWork NSW adopted the national target of a 20 per cent reduction in workplace fatalities and a 30 per cent reduction in workplace injuries and illnesses by 2022.
Performance against this indicator continues to improve and is on track to meet the national target of 1.34 by 2022.
$1.5 billion
Recurrent Expenses 2020-21
$66.7 million
Capital Expenditure2020-21
Customer Service Cluster
1 - 10 Outcomes Statement 2020-21
Chart 1.7: Worker fatalities per 100,000 employees
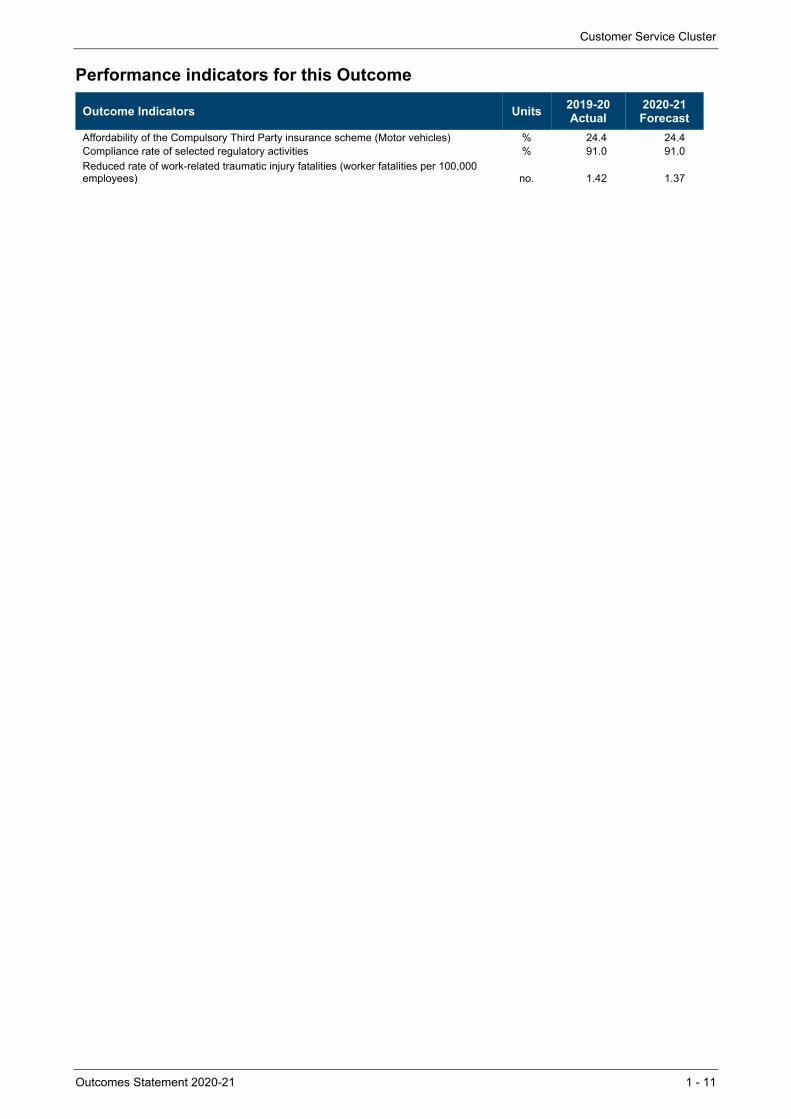
Compliance rate of selected regulatory activities
Better Regulation Division protects the New South Wales community through innovative regulatory services to ensure fair, secure and efficient markets. Our compliance efforts include a commitment to working with businesses and educating industry groups and other government agencies to promote compliance and secure standards.
Significant compliance and enforcement outcomes have been achieved by educating and enabling businesses to comply and taking proportional enforcement actions against those who do not meet their regulatory obligations. Enforcement actions are intelligence-based and evidence-led, including legal proceedings where appropriate.
Performance against this indicator is currently exceeding the target of 90 per cent. In 2020, 91 per cent of selected regulated entities were found compliant with the laws and regulations which govern their operations.
Chart 1.8: Compliance rate of selected regulatory activities
Note: The target for this indicator exists in both 2021-22 and 2022-23, however, has only been included in 2022-23 for
presentational purposes.
1.25
1.3
1.35
1.4
1.45
1.5
1.55
2016-17Actual
2017-18Actual
2018-19Actual
2019-20Actual
2020-21Forecast
2021-22Target
Fal
atie
s pe
r 10
0,00
0
80
82
84
86
88
90
92
94
96
98
100
2018-19Actual
2019-20Actual
2020-21Forecast
2021-22 2022-23Target
Per
cen
t
Customer Service Cluster
Outcomes Statement 2020-21 1 - 11
Performance indicators for this Outcome
Outcome Indicators Units 2019-20 2020-21Actual Forecast
Affordability of the Compulsory Third Party insurance scheme (Motor vehicles) % 24.4 24.4 Compliance rate of selected regulatory activities % 91.0 91.0
Reduced rate of work-related traumatic injury fatalities (worker fatalities per 100,000 employees) no. 1.42 1.37
Outcomes Statement 2020-21 2 - 1
2. EDUCATION CLUSTER
2.1 Introduction
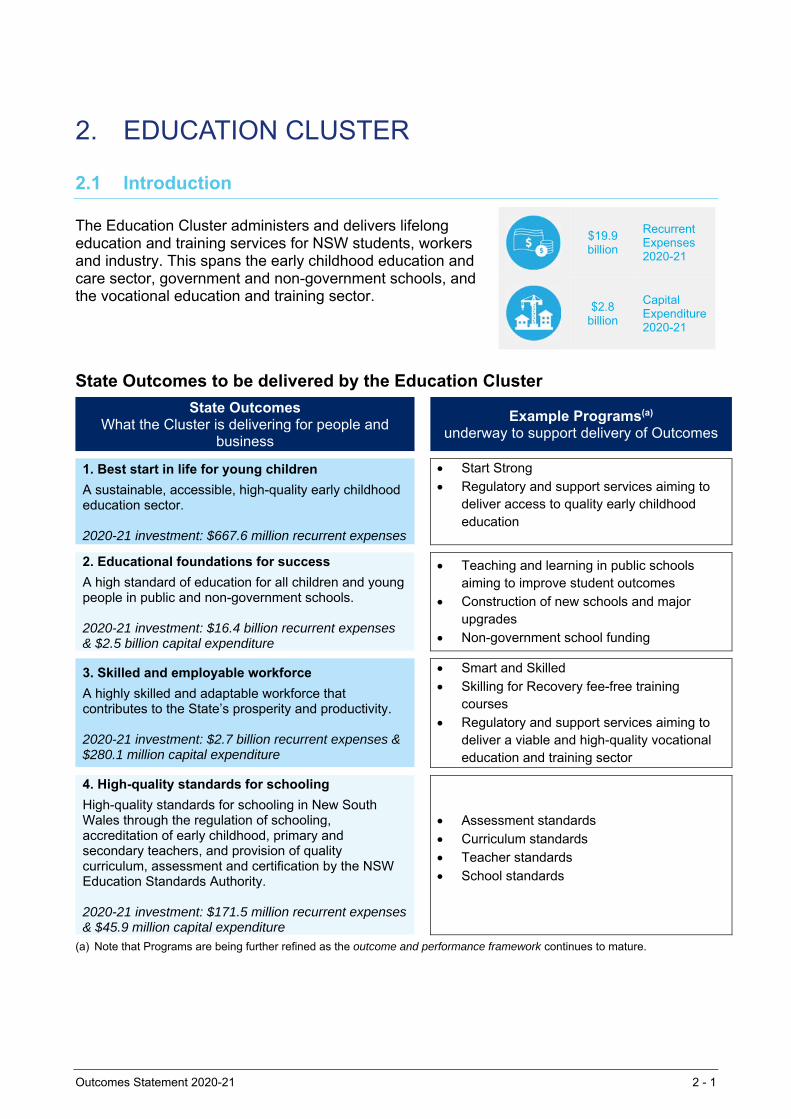
The Education Cluster administers and delivers lifelong education and training services for NSW students, workers and industry. This spans the early childhood education and care sector, government and non-government schools, and the vocational education and training sector.
State Outcomes to be delivered by the Education Cluster
State Outcomes What the Cluster is delivering for people and
business
Example Programs(a)
underway to support delivery of Outcomes
1. Best start in life for young children
A sustainable, accessible, high-quality early childhood education sector. 2020-21 investment: $667.6 million recurrent expenses
Start Strong Regulatory and support services aiming to
deliver access to quality early childhood education
2. Educational foundations for success
A high standard of education for all children and young people in public and non-government schools. 2020-21 investment: $16.4 billion recurrent expenses & $2.5 billion capital expenditure
Teaching and learning in public schools aiming to improve student outcomes
Construction of new schools and major upgrades
Non-government school funding
3. Skilled and employable workforce
A highly skilled and adaptable workforce that contributes to the State’s prosperity and productivity. 2020-21 investment: $2.7 billion recurrent expenses & $280.1 million capital expenditure
Smart and Skilled Skilling for Recovery fee-free training
courses
Regulatory and support services aiming to deliver a viable and high-quality vocational education and training sector
4. High-quality standards for schooling
High-quality standards for schooling in New South Wales through the regulation of schooling, accreditation of early childhood, primary and secondary teachers, and provision of quality curriculum, assessment and certification by the NSW Education Standards Authority. 2020-21 investment: $171.5 million recurrent expenses & $45.9 million capital expenditure
Assessment standards Curriculum standards Teacher standards School standards
(a) Note that Programs are being further refined as the outcome and performance framework continues to mature.
$19.9 billion
Recurrent Expenses 2020-21
$2.8 billion
Capital Expenditure 2020-21
Education Cluster
2 - 2 Outcomes Statement 2020-21
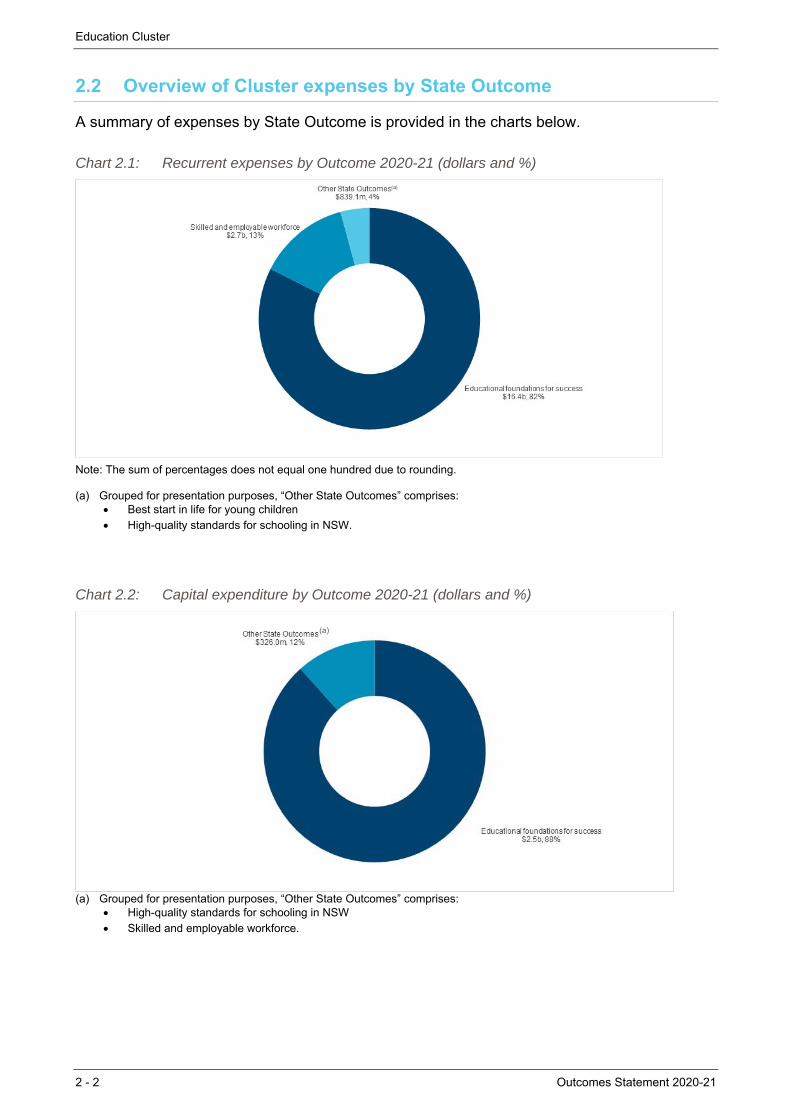
2.2 Overview of Cluster expenses by State Outcome
A summary of expenses by State Outcome is provided in the charts below.
Chart 2.1: Recurrent expenses by Outcome 2020-21 (dollars and %)
Note: The sum of percentages does not equal one hundred due to rounding. (a) Grouped for presentation purposes, “Other State Outcomes” comprises:
Best start in life for young children High-quality standards for schooling in NSW.
Chart 2.2: Capital expenditure by Outcome 2020-21 (dollars and %)
(a) Grouped for presentation purposes, “Other State Outcomes” comprises:
High-quality standards for schooling in NSW Skilled and employable workforce.
(a)
Education Cluster
Outcomes Statement 2020-21 2 - 3
2.3 Outcome 1: Best start in life for young children
State Outcome overview and 2020-21 investment
Investments under this State Outcome support a sustainable, accessible, high-quality early childhood education sector.
Children who participate in a quality early childhood education program are more likely to arrive at school equipped with the social, cognitive and emotional skills they need to engage in learning. The NSW Department of Education monitors, supports and regulates early childhood education services in New South Wales, and works to ensure the delivery of quality early childhood education services for children in the years before school.
2020-21 State Outcome Budget highlights
In 2020-21, the Education Cluster will invest $667.6 million in this Outcome, including:
the Start Strong program to support preschool education across New South Wales, in both community preschools and long day care centres. Funding support is delivered for all three and four-year-olds in community preschools to provide universal access to two years of early childhood education, and continuing a commitment made in the 2018-19 Budget
continued funding to support the COVID-19 free preschool program for community and mobile preschools in Terms 3 and 4 in 2020, and up to $120.0 million for the extension of the COVID-19 free preschool program for community and mobile preschools through to the end of 2021, providing fee relief for families and certainty for the NSW preschool sector to respond to the impact of the COVID-19 pandemic
$6.0 million over two years to deliver the Working Towards Quality Support Program in conjunction with the Australian Children’s Education and Care Quality Authority
continuation of capital works funding to support the creation of additional community preschool places.
Key performance insights
This section provides analysis and insights on key Outcome Indicators for this State Outcome.
Children enrolled in an early childhood education program in the year before school
This Outcome Indicator is consistent with benchmarks under the National Partnership Agreement on Universal Access to Early Childhood Education, with an enrolment target of 95 per cent by 2022.
Performance against this indicator has improved and is on track to meet the target. Participation in early childhood education for 600 hours in the year before school increased to 94.5 per cent in 2019. This is the State’s highest-ever result against this indicator and is the largest increase since 2016 compared to other jurisdictions.
The NSW Government’s Start Strong program is a needs-based funding investment aimed at making 600 hours of preschool participation more affordable in the year before full-time school. Support is also available for three-year-olds, with a focus on children from Aboriginal and low-income families and children with a disability.
$667.6 million
Recurrent Expenses 2020-21

Education Cluster
2 - 4 Outcomes Statement 2020-21
Chart 2.3: Proportion of children who are enrolled in an early childhood education program for at least 600 hours in the year before school
Note: Data sourced from Australian Bureau of Statistics (ABS), Preschool Education, Australia.
Early childhood education services rated as meeting or exceeding the National Quality Standard
The NSW Department of Education monitors compliance with legislative requirements, investigates complaints and responds to incidents.
Performance against this indicator is on track to meet the target. Since the introduction of the National Quality Standard (NQS) in 2012, there has been an overall quality improvement in the sector in New South Wales. In June 2020, the proportion of services meeting or exceeding the NQS increased to 77.2 per cent.
To support ongoing service quality improvement, the Department is delivering a number of programs including the Working Towards Quality Support Program and the Quality Ratings Initiative, which will improve family awareness of service quality through a visual ratings display.
Chart 2.4: Proportion of early childhood education services rated as meeting or exceeding the National Quality Standard
Note: Data sourced from the Australian Children’s Education and Care Quality Authority (ACECQA).
0
10
20
30
40
50
60
70
80
90
100
2016Actual
2017Actual
2018Actual
2019Actual
2020Forecast
2021Forecast
2022Target
Per
cen
t
0
10
20
30
40
50
60
70
80
90
100
2018Actual
2019Actual
2020Forecast
2021Forecast
2022Target
Per
cen
t

Education Cluster
Outcomes Statement 2020-21 2 - 5
Performance indicators for this Outcome
Outcome Indicators Units 2019-20 2020-21Actual Forecast
Proportion of children who are enrolled in an early childhood education program for at least 600 hours in the year before school(a) % 94.5 94.6
Proportion of enrolled Aboriginal children who are enrolled in an early childhood education program for at least 600 hours in the year before school(a) % 93.8 93.9
Proportion of enrolled vulnerable and disadvantaged children who are enrolled in an early childhood education program for at least 600 hours in the year before school(a) % 91.4 92.5
Proportion of early childhood education services rated as meeting or exceeding the National Quality Standard(b) % 74.3 77.4
Notes (a) 2019-20 actuals and 2020-21 forecasts refer to the 2019 and 2020 school years, respectively. Data sourced from
Australian Bureau of Statistics (ABS), Preschool Education, Australia. (b) Data sourced from the Australian Children’s Education and Care Quality Authority (ACECQA). 2019-20 actual as at
December 2019.
Education Cluster
2 - 6 Outcomes Statement 2020-21
2.4 Outcome 2: Educational foundations for success
State Outcome overview and 2020-21 investment
Investments under this State Outcome support a high standard of education for all children and young people in public and non-government schools.
The NSW Department of Education is the largest provider of education in Australia. It delivers high-quality public education through its network of 2,215 public schools and ensures that school infrastructure continues to meet the needs of the State’s growing population. The Department also works closely with the non-government school sector to ensure the delivery of a high-quality and equitable education for all students.
2020-21 State Outcome Budget highlights
In 2020-21, the Education Cluster will invest $18.9 billion ($16.4 billion recurrent expenses and $2.5 billion capital expenditure) in this Outcome, including:
$14.9 billion recurrent funding to support the delivery of primary and secondary education in government schools in 2020-21, in line with the State’s commitment under the National School Reform Agreement (NSRA)
$1.5 billion to support non-government schools in 2020-21, including funding for non-government school essential capital works under the Building Grants Assistance Scheme
$544.6 million over two years for shovel-ready new and accelerated capital works across schools to create jobs and stimulate local economies
$365.8 million capital funding over two years for the Rural Access Gap Direct Intervention program to deliver improved access to digital teaching, learning aids and collaboration tools to rural and remote schools
$337.0 million over the 2021 school year for intensive tutoring in all NSW government and some non-government schools to support students in making up lost learning time as a result of COVID-19 impacts and shutdowns in early 2020
$240.0 million over two years of government co-contributions to both regional and metropolitan schools to support the accelerated delivery of community funded projects and initiatives across government schools
funding to pilot deployment of solar PV systems, batteries, demand response initiatives and electric vehicle charge points in NSW Government schools
an ongoing commitment under the NSRA for 2019 to 2023 to deliver needs-based funding to government and non-government schools. Under the NSRA, New South Wales has committed to implement national policy initiatives, and a series of state-based reforms to improve student learning, teaching and school improvement across government and non-government schools.
$16.4 billion
Recurrent Expenses 2020-21
$2.5 billion
Capital Expenditure2020-21

Education Cluster
Outcomes Statement 2020-21 2 - 7
Key performance insights
This section provides analysis and insights on key Outcome Indicators for this State Outcome.
NSW Department of Education’s is developing an outcomes-based improvement framework, to replace the existing performance frameworks. The improved framework will be underpinned by ambitious targets for all schools, providing more support to the schools that need it the most, and develops processes for sharing best practice.
Public school students in the top two NAPLAN bands for reading and numeracy
The NSW Premier’s Priority is to increase the proportion of public school students in the top two NAPLAN bands for literacy and numeracy by 15 per cent by 2023. This would be equivalent to increasing the proportion of students in the top two bands to an average of 36.4 per cent.
Performance against this Premier’s Priority is on track to meet the target. In 2019, average results were 32.2 per cent, which is 0.6 percentage points higher than the baseline.
The NSW Department of Education Bump It Up program is being expanded state-wide, setting tailored targets in every public school. The Department is releasing additional assessments to help teachers determine students’ learning progression and expanding professional learning to build teacher knowledge of literacy and numeracy development, the effective use of data and the implementation of evidence-based classroom practices.
Chart 2.5: Proportion of public school students in the top two NAPLAN bands for reading and numeracy
Note: Data sourced from NSW Department of Education, annual NAPLAN results. Note that Education Ministers made the decision to cancel NAPLAN in 2020 due to the impact of the COVID-19 pandemic. This means that comparative data may not be available for 2020.
Aboriginal students attaining Year 12
The Premier’s Priority is to increase the proportion of Aboriginal students attaining Year 12 by 50 per cent by 2023, while maintaining their cultural identity. This will be equivalent to increasing the proportion of Aboriginal students attaining the HSC to 69 per cent.
0
5
10
15
20
25
30
35
40
2016Actual
2017Actual
2018Actual
2019Actual
2020Forecast
2021Forecast
2022Target
Per
cen
t

Education Cluster
2 - 8 Outcomes Statement 2020-21
Performance against this Premier’s Priority is on track to meet the target. Interim results for 2019 indicate that 45 per cent of Aboriginal students in New South Wales have achieved the HSC.
This will be further improved through additional focus on performance with all public secondary schools now having targets in support of the Premier’s Priority. The Department has also developed five initiatives in collaboration with the NSW Coalition of Aboriginal Peak Organisations to support Aboriginal students through their final years of school.
Chart 2.6: Proportion of Aboriginal students attaining Year 12, while maintaining their cultural identity
Note: Data sourced from NESA and NSW Department of Education. This Indicator refers to all Aboriginal students in NSW (i.e. both government and non-government schools). See footnote (c) in Outcome Indicator table below for further information about the calculation of attainment rates.
Performance indicators for this Outcome
Outcome Indicators(a) Units 2019-20 2020-21Actual Forecast
Academic Achievement Proportion of public school students in the top two NAPLAN bands for reading and numeracy (b) % 32.2 33.5
Proportion of public school students above the national minimum standard for reading and numeracy % 79.5 83.5
Proportion of NSW public school students achieving expected growth in reading and numeracy(b) % 56.4 64.4
Student Wellbeing Proportion of public school students reporting a sense of belonging, expectations for success and advocacy at school(g) %
% of public school primary students 85.7 85.0 % of public school secondary students 64.8 67.3
Proportion of public school students attending school at least 90% of the time(e) % % of public school primary students 78.5 80.7 % of public school secondary students 64.0 67.3
Student Equity (Aboriginal Students) Proportion of Aboriginal students attaining Year 12, while maintaining their cultural identity(c) % 45 46
Proportion of Aboriginal students in public schools in the top two NAPLAN bands for reading and numeracy(b) % 10.3 12.5
Proportion of Aboriginal students in public schools above the national minimum standard for reading and numeracy % 56.1 60.6
0
10
20
30
40
50
60
70
80
2016Actual
2017Actual
2018Actual
2019Actual
2020Forecast
2021Forecast
2022Forecast
2023Target
Per
cen
t
Education Cluster
Outcomes Statement 2020-21 2 - 9
Outcome Indicators(a) Units 2019-20 2020-21Actual Forecast
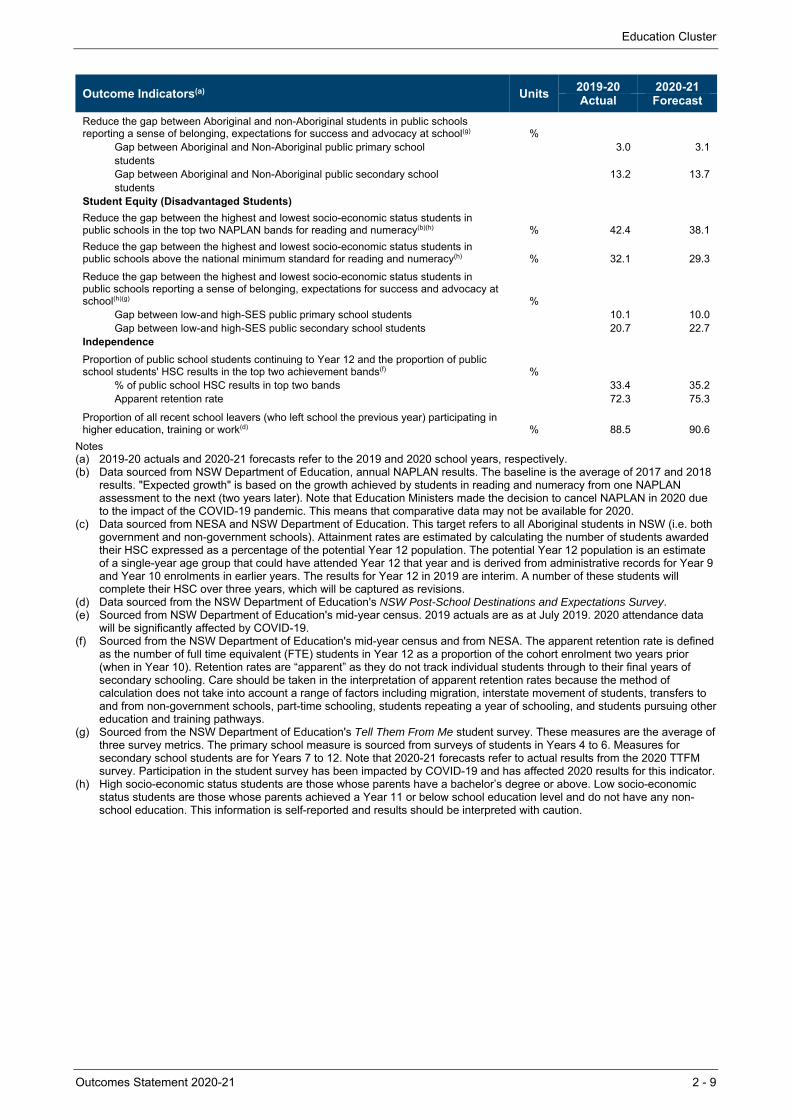
Reduce the gap between Aboriginal and non-Aboriginal students in public schools reporting a sense of belonging, expectations for success and advocacy at school(g) %
Gap between Aboriginal and Non-Aboriginal public primary school 3.0 3.1 students Gap between Aboriginal and Non-Aboriginal public secondary school 13.2 13.7 students
Student Equity (Disadvantaged Students) Reduce the gap between the highest and lowest socio-economic status students in public schools in the top two NAPLAN bands for reading and numeracy(b)(h) % 42.4 38.1
Reduce the gap between the highest and lowest socio-economic status students in public schools above the national minimum standard for reading and numeracy(h) % 32.1 29.3
Reduce the gap between the highest and lowest socio-economic status students in public schools reporting a sense of belonging, expectations for success and advocacy at school(h)(g) %
Gap between low-and high-SES public primary school students 10.1 10.0 Gap between low-and high-SES public secondary school students 20.7 22.7
Independence Proportion of public school students continuing to Year 12 and the proportion of public school students' HSC results in the top two achievement bands(f) %
% of public school HSC results in top two bands 33.4 35.2 Apparent retention rate 72.3 75.3
Proportion of all recent school leavers (who left school the previous year) participating in higher education, training or work(d) % 88.5 90.6
Notes (a) 2019-20 actuals and 2020-21 forecasts refer to the 2019 and 2020 school years, respectively. (b) Data sourced from NSW Department of Education, annual NAPLAN results. The baseline is the average of 2017 and 2018
results. "Expected growth" is based on the growth achieved by students in reading and numeracy from one NAPLAN assessment to the next (two years later). Note that Education Ministers made the decision to cancel NAPLAN in 2020 due to the impact of the COVID-19 pandemic. This means that comparative data may not be available for 2020.
(c) Data sourced from NESA and NSW Department of Education. This target refers to all Aboriginal students in NSW (i.e. both government and non-government schools). Attainment rates are estimated by calculating the number of students awarded their HSC expressed as a percentage of the potential Year 12 population. The potential Year 12 population is an estimate of a single-year age group that could have attended Year 12 that year and is derived from administrative records for Year 9 and Year 10 enrolments in earlier years. The results for Year 12 in 2019 are interim. A number of these students will complete their HSC over three years, which will be captured as revisions.
(d) Data sourced from the NSW Department of Education's NSW Post-School Destinations and Expectations Survey. (e) Sourced from NSW Department of Education's mid-year census. 2019 actuals are as at July 2019. 2020 attendance data
will be significantly affected by COVID-19. (f) Sourced from the NSW Department of Education's mid-year census and from NESA. The apparent retention rate is defined
as the number of full time equivalent (FTE) students in Year 12 as a proportion of the cohort enrolment two years prior (when in Year 10). Retention rates are “apparent” as they do not track individual students through to their final years of secondary schooling. Care should be taken in the interpretation of apparent retention rates because the method of calculation does not take into account a range of factors including migration, interstate movement of students, transfers to and from non-government schools, part-time schooling, students repeating a year of schooling, and students pursuing other education and training pathways.
(g) Sourced from the NSW Department of Education's Tell Them From Me student survey. These measures are the average of three survey metrics. The primary school measure is sourced from surveys of students in Years 4 to 6. Measures for secondary school students are for Years 7 to 12. Note that 2020-21 forecasts refer to actual results from the 2020 TTFM survey. Participation in the student survey has been impacted by COVID-19 and has affected 2020 results for this indicator.
(h) High socio-economic status students are those whose parents have a bachelor’s degree or above. Low socio-economic status students are those whose parents achieved a Year 11 or below school education level and do not have any non-school education. This information is self-reported and results should be interpreted with caution.
Education Cluster
2 - 10 Outcomes Statement 2020-21
2.5 Outcome 3: Skilled and employable workforce
State Outcome overview and 2020-21 investment
Investments under this State Outcome support a highly skilled and adaptable workforce that contributes to the prosperity and productivity of New South Wales.
The NSW Department of Education drives participation and retention in quality VET by managing the Smart and Skilled contestable training market, including the apprenticeship and traineeship system in New South Wales. The Department also provides direct funding to TAFE NSW, the State’s comprehensive public provider of VET.
2020-21 State Outcome Budget highlights
In 2020-21, the Education Cluster will invest $3.0 billion ($2.7 billion recurrent expenses and $280.1 million capital expenditure) in this Outcome, including:
$318.6 million over two years for Skilling for Recovery, a key component of the State’s COVID-19 Recovery Plan to help job seekers retrain or upskill, and support school leavers to enter the workforce for the first time. The NSW Government has committed almost $160.0 million to match Commonwealth JobTrainer funding and offer more than 100,000 training places
$100.0 million ($20.7 million recurrent and $79.3 million capital) for asset replacement and maintenance, and new teaching plant and equipment for TAFE NSW to deliver quality training
$57.4 million over four years for a Trades Skills Pathways Centre to address skills shortages in the NSW economy, by recognising trades skills, establishing new trades pathways and improving skilled employment opportunities for women
$20.0 million for the Australian Government Revitalising TAFE Campuses across Australia Program ($10.0 million from the NSW Government and $10.0 million from the Commonwealth Government). The program will deliver new connected learning teaching spaces and upgrade specialist teaching facilities for at least 26 TAFE NSW campuses
providing up to 20,000 training places to skill people working in aged care to support the growing needs of the sector and $2.5 million to develop a strategic business case for a dedicated TAFE Aged Care Centre of Excellence training facility.
$2.7 billion
Recurrent Expenses 2020-21
$280.1 million
Capital Expenditure2020-21
Education Cluster
Outcomes Statement 2020-21 2 - 11
Key performance insights
This section provides analysis and insights on key Outcome Indicators for this State Outcome.
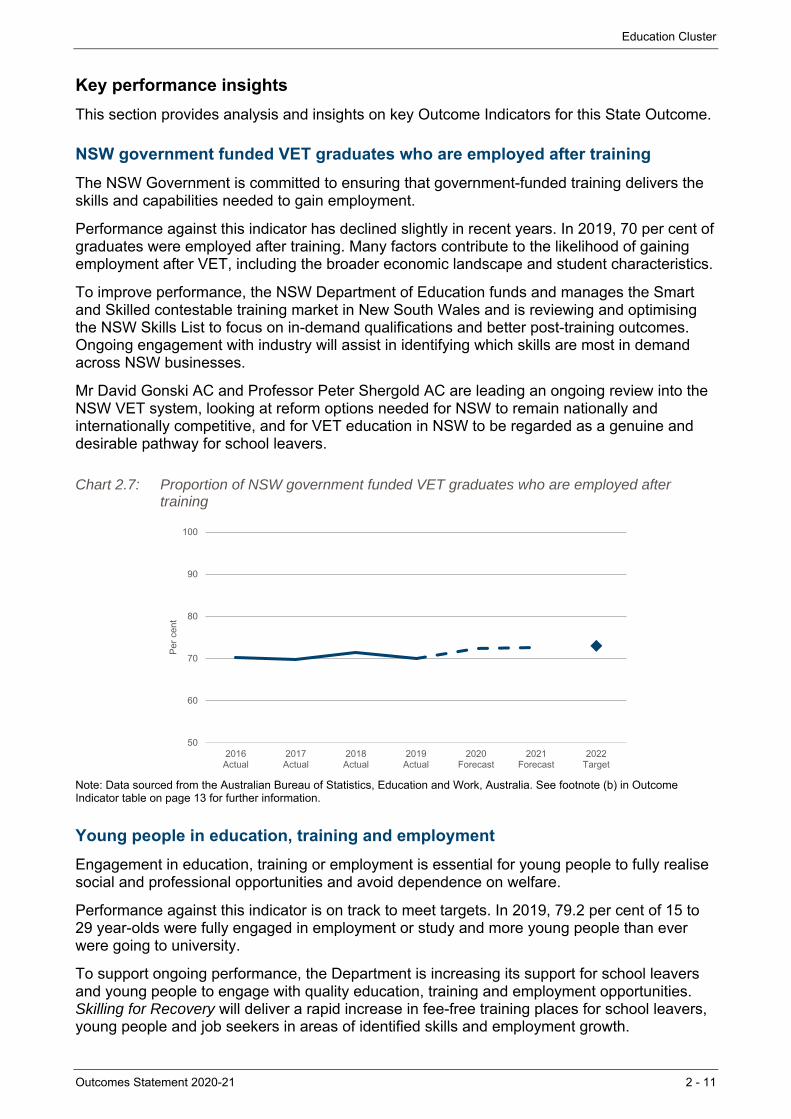
NSW government funded VET graduates who are employed after training
The NSW Government is committed to ensuring that government-funded training delivers the skills and capabilities needed to gain employment.
Performance against this indicator has declined slightly in recent years. In 2019, 70 per cent of graduates were employed after training. Many factors contribute to the likelihood of gaining employment after VET, including the broader economic landscape and student characteristics.
To improve performance, the NSW Department of Education funds and manages the Smart and Skilled contestable training market in New South Wales and is reviewing and optimising the NSW Skills List to focus on in-demand qualifications and better post-training outcomes. Ongoing engagement with industry will assist in identifying which skills are most in demand across NSW businesses.
Mr David Gonski AC and Professor Peter Shergold AC are leading an ongoing review into the NSW VET system, looking at reform options needed for NSW to remain nationally and internationally competitive, and for VET education in NSW to be regarded as a genuine and desirable pathway for school leavers.
Chart 2.7: Proportion of NSW government funded VET graduates who are employed after training
Note: Data sourced from the Australian Bureau of Statistics, Education and Work, Australia. See footnote (b) in Outcome Indicator table on page 13 for further information.
Young people in education, training and employment
Engagement in education, training or employment is essential for young people to fully realise social and professional opportunities and avoid dependence on welfare.
Performance against this indicator is on track to meet targets. In 2019, 79.2 per cent of 15 to 29 year-olds were fully engaged in employment or study and more young people than ever were going to university.
To support ongoing performance, the Department is increasing its support for school leavers and young people to engage with quality education, training and employment opportunities. Skilling for Recovery will deliver a rapid increase in fee-free training places for school leavers, young people and job seekers in areas of identified skills and employment growth.
50
60
70
80
90
100
2016Actual
2017Actual
2018Actual
2019Actual
2020Forecast
2021Forecast
2022Target
Per
cen
t
Education Cluster
2 - 12 Outcomes Statement 2020-21
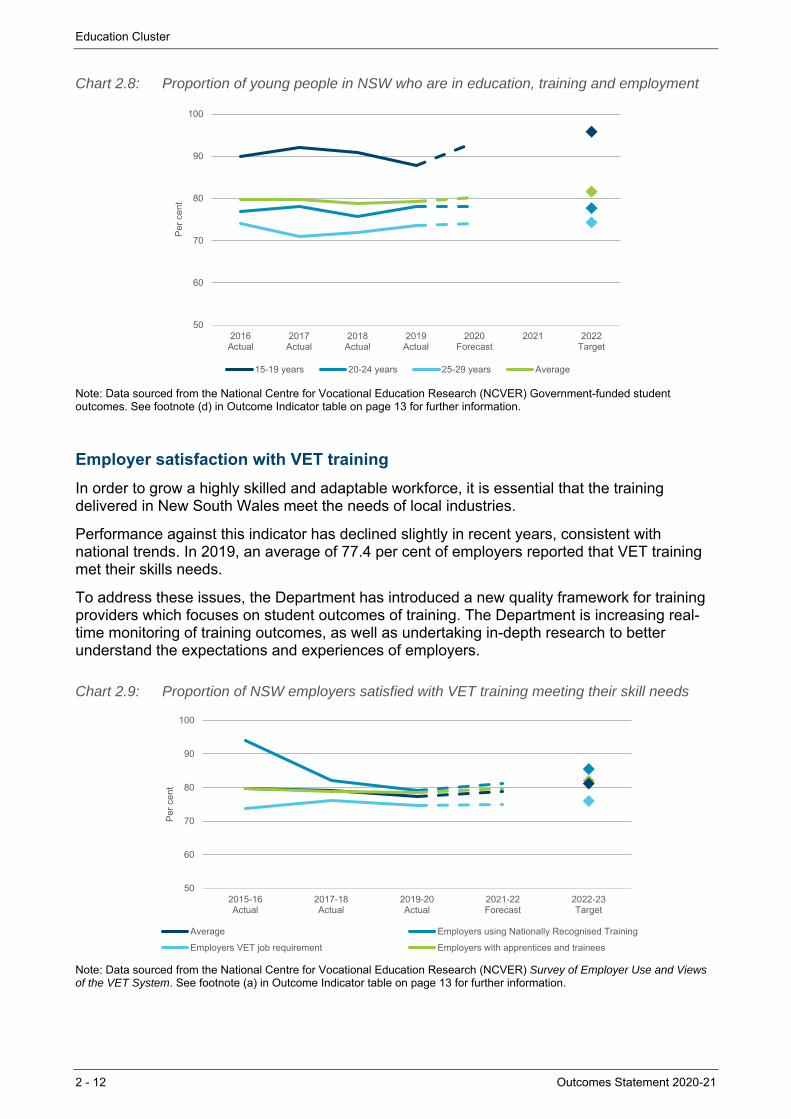
Chart 2.8: Proportion of young people in NSW who are in education, training and employment
Note: Data sourced from the National Centre for Vocational Education Research (NCVER) Government-funded student outcomes. See footnote (d) in Outcome Indicator table on page 13 for further information.
Employer satisfaction with VET training
In order to grow a highly skilled and adaptable workforce, it is essential that the training delivered in New South Wales meet the needs of local industries.
Performance against this indicator has declined slightly in recent years, consistent with national trends. In 2019, an average of 77.4 per cent of employers reported that VET training met their skills needs.
To address these issues, the Department has introduced a new quality framework for training providers which focuses on student outcomes of training. The Department is increasing real-time monitoring of training outcomes, as well as undertaking in-depth research to better understand the expectations and experiences of employers.
Chart 2.9: Proportion of NSW employers satisfied with VET training meeting their skill needs
Note: Data sourced from the National Centre for Vocational Education Research (NCVER) Survey of Employer Use and Views of the VET System. See footnote (a) in Outcome Indicator table on page 13 for further information.
50
60
70
80
90
100
2016Actual
2017Actual
2018Actual
2019Actual
2020Forecast
2021 2022Target
Per
cen
t
15-19 years 20-24 years 25-29 years Average
50
60
70
80
90
100
2015-16Actual
2017-18Actual
2019-20Actual
2021-22Forecast
2022-23Target
Per
cen
t
Average Employers using Nationally Recognised Training
Employers VET job requirement Employers with apprentices and trainees
Education Cluster
Outcomes Statement 2020-21 2 - 13
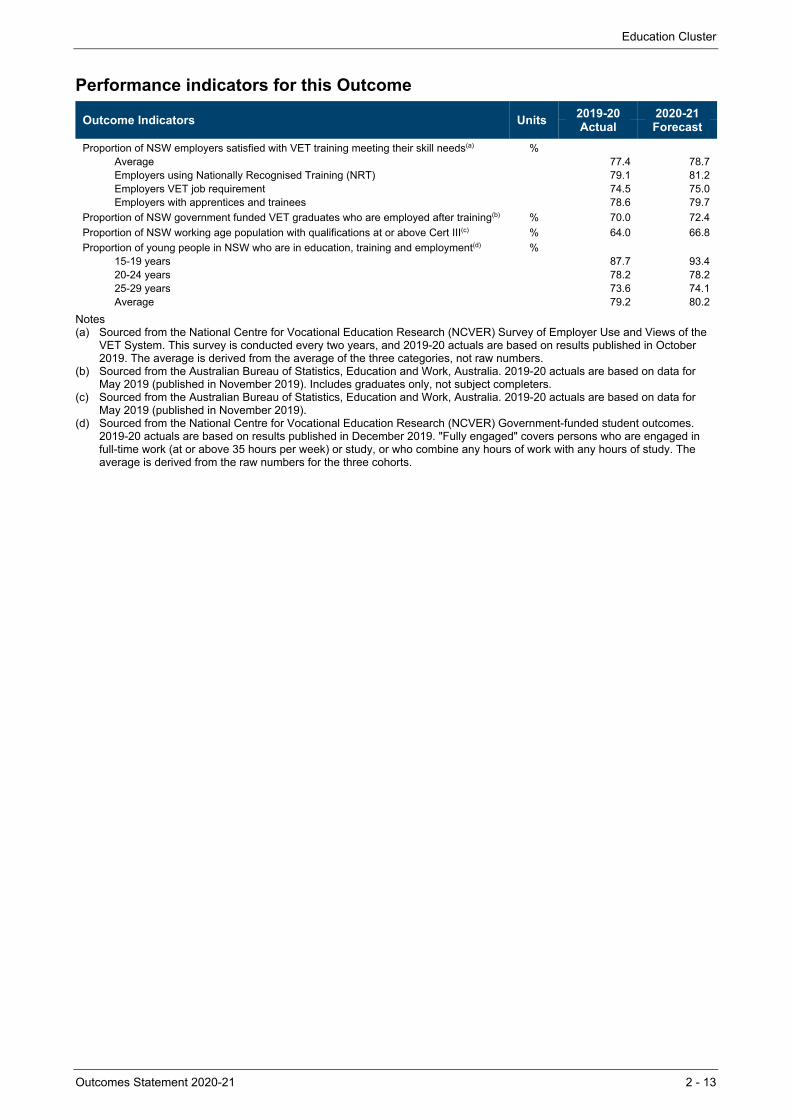
Performance indicators for this Outcome
Outcome Indicators Units 2019-20 2020-21Actual Forecast
Proportion of NSW employers satisfied with VET training meeting their skill needs(a) % Average 77.4 78.7 Employers using Nationally Recognised Training (NRT) 79.1 81.2 Employers VET job requirement 74.5 75.0 Employers with apprentices and trainees 78.6 79.7
Proportion of NSW government funded VET graduates who are employed after training(b) % 70.0 72.4
Proportion of NSW working age population with qualifications at or above Cert III(c) % 64.0 66.8
Proportion of young people in NSW who are in education, training and employment(d) % 15-19 years 87.7 93.4 20-24 years 78.2 78.225-29 years 73.6 74.1 Average 79.2 80.2
Notes (a) Sourced from the National Centre for Vocational Education Research (NCVER) Survey of Employer Use and Views of the
VET System. This survey is conducted every two years, and 2019-20 actuals are based on results published in October 2019. The average is derived from the average of the three categories, not raw numbers.
(b) Sourced from the Australian Bureau of Statistics, Education and Work, Australia. 2019-20 actuals are based on data for May 2019 (published in November 2019). Includes graduates only, not subject completers.
(c) Sourced from the Australian Bureau of Statistics, Education and Work, Australia. 2019-20 actuals are based on data for May 2019 (published in November 2019).
(d) Sourced from the National Centre for Vocational Education Research (NCVER) Government-funded student outcomes. 2019-20 actuals are based on results published in December 2019. "Fully engaged" covers persons who are engaged in full-time work (at or above 35 hours per week) or study, or who combine any hours of work with any hours of study. The average is derived from the raw numbers for the three cohorts.
Education Cluster
2 - 14 Outcomes Statement 2020-21
2.6 Outcome 4: High quality standards for schooling
State Outcome overview and 2020-21 investment
Investments under this State Outcome support high quality standards for schooling in New South Wales through the regulation of schooling, accreditation of early childhood, primary and secondary teachers, and provision of quality curriculum, assessment and certification by the NSW Education Standards Authority (NESA).
2020-21 State Outcome Budget highlights
In 2020-21, the Education Cluster will invest $217.4 million ($171.5 million recurrent expenses and $45.9 million capital expenditure) in this Outcome, including:
$8.8 million to undertake an ambitious curriculum reform program, streamlining and strengthening what is taught in NSW schools over the next four years
$2.5 million for teacher accreditation authorities to ensure that professional teaching standards are applied fairly and consistently
$2.3 million towards providers of initial teacher education and professional learning courses to better meet the needs of the profession
$1.9 million towards teachers seeking to progress to the Highly Accomplished and Lead Teacher accreditation levels.
Key performance insights
NESA has developed two Outcome Indicators in line with the agency’s major reform initiatives.
Proportion of teachers with a clear understanding of curriculum requirements
NESA is leading a major program of curriculum reform, and this new Outcome Indicator will demonstrate that NESA is effectively supporting teachers as the reform program progresses.
An increasing proportion of teachers with a clear understanding of curriculum requirements will demonstrate that NESA is providing teachers with the support required to teach syllabus content effectively. Understanding the degree to which teachers are clear about NSW curriculum requirements is an important measure that will guide NESA in how it goes about developing syllabus content, communicating syllabus requirements to teachers, and developing curriculum support resources.
Proportion of teachers and schools with a clear understanding of school regulation and teacher accreditation requirements
This new Outcome Indicator will demonstrate NESA’s performance in responding to customer needs. An increasing proportion of teachers reporting a clear understanding of school regulation and teacher accreditation requirements will reflect that NESA is continuously streamlining regulatory requirements and communicating clearly to teachers and school leaders about what teachers need to do to meet the requirements.
It will also reflect that NESA is reducing the administrative burden on schools, through simpler and clearer processes and reducing the time required for teachers and school leaders to engage with NESA change initiatives.
$171.5 million
Recurrent Expenses 2020-21
$45.9 million
Capital Expenditure2020-21
Education Cluster
Outcomes Statement 2020-21 2 - 15
NESA is developing surveys to establish baseline performance and targets for each indicator as part of the implementation of NSW curriculum reform, school regulation and teacher accreditation programs. Preliminary data will be available in 2021, from which baseline and target performance will be set.
Outcomes Statement 2020-21 3 - 1
3. HEALTH CLUSTER
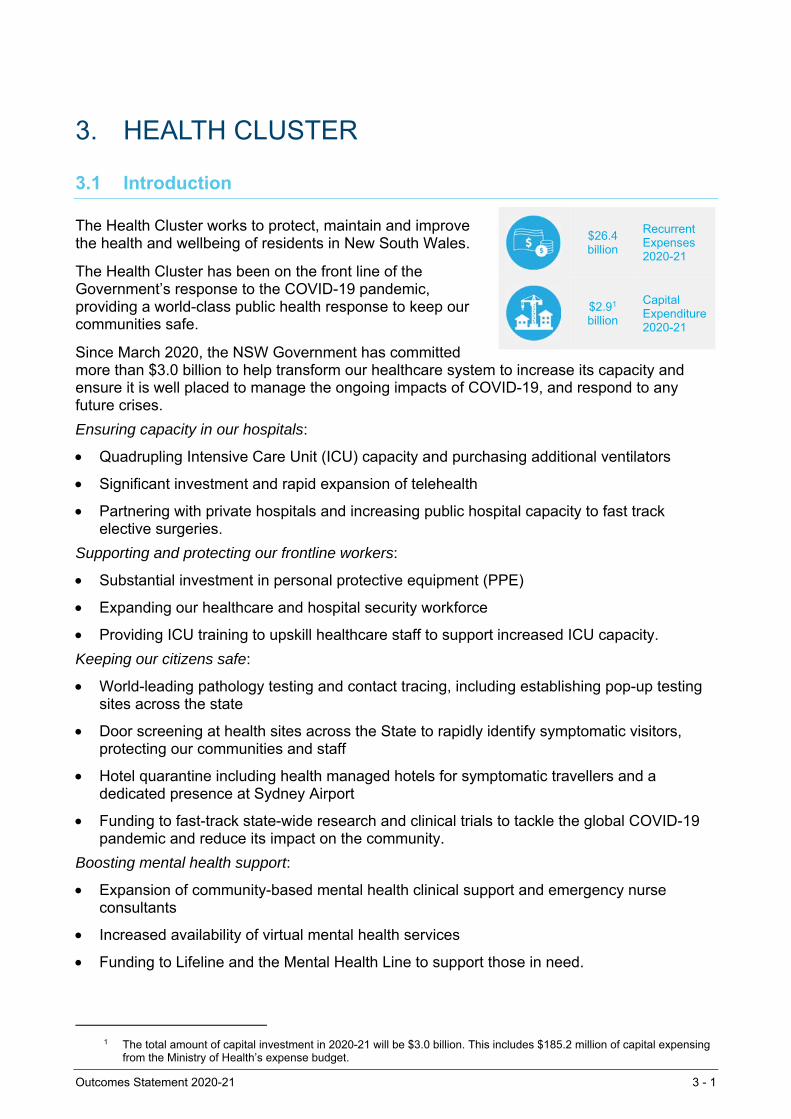
3.1 Introduction
The Health Cluster works to protect, maintain and improve the health and wellbeing of residents in New South Wales.
The Health Cluster has been on the front line of the Government’s response to the COVID-19 pandemic, providing a world-class public health response to keep our communities safe.
Since March 2020, the NSW Government has committed more than $3.0 billion to help transform our healthcare system to increase its capacity and ensure it is well placed to manage the ongoing impacts of COVID-19, and respond to any future crises.
Ensuring capacity in our hospitals:
Quadrupling Intensive Care Unit (ICU) capacity and purchasing additional ventilators
Significant investment and rapid expansion of telehealth
Partnering with private hospitals and increasing public hospital capacity to fast track elective surgeries.
Supporting and protecting our frontline workers:
Substantial investment in personal protective equipment (PPE)
Expanding our healthcare and hospital security workforce
Providing ICU training to upskill healthcare staff to support increased ICU capacity.
Keeping our citizens safe:
World-leading pathology testing and contact tracing, including establishing pop-up testing sites across the state
Door screening at health sites across the State to rapidly identify symptomatic visitors, protecting our communities and staff
Hotel quarantine including health managed hotels for symptomatic travellers and a dedicated presence at Sydney Airport
Funding to fast-track state-wide research and clinical trials to tackle the global COVID-19 pandemic and reduce its impact on the community.
Boosting mental health support:
Expansion of community-based mental health clinical support and emergency nurse consultants
Increased availability of virtual mental health services
Funding to Lifeline and the Mental Health Line to support those in need.
1 The total amount of capital investment in 2020-21 will be $3.0 billion. This includes $185.2 million of capital expensing
from the Ministry of Health’s expense budget.
$26.4 billion
Recurrent Expenses 2020-21
$2.91 billion
Capital Expenditure 2020-21
Health Cluster
3 - 2 Outcomes Statement 2020-21
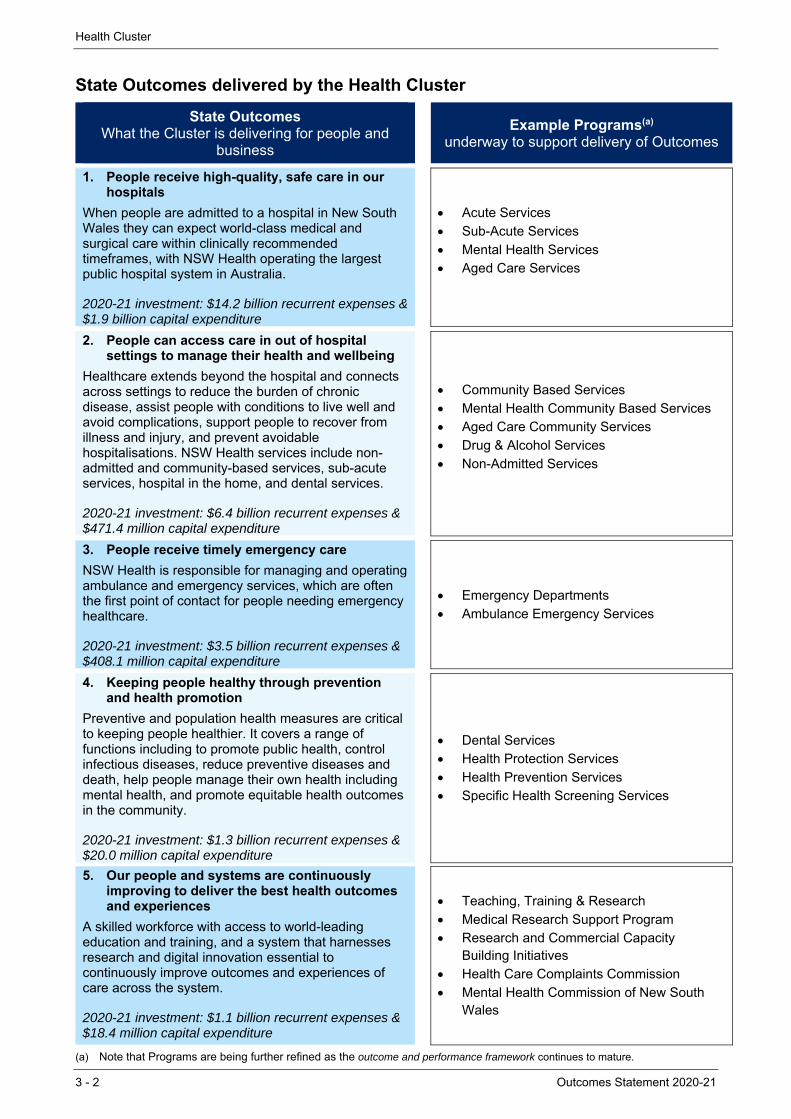
State Outcomes delivered by the Health Cluster
State Outcomes What the Cluster is delivering for people and
business
Example Programs(a) underway to support delivery of Outcomes
1. People receive high-quality, safe care in our hospitals
When people are admitted to a hospital in New South Wales they can expect world-class medical and surgical care within clinically recommended timeframes, with NSW Health operating the largest public hospital system in Australia.
2020-21 investment: $14.2 billion recurrent expenses & $1.9 billion capital expenditure
Acute Services Sub-Acute Services Mental Health Services Aged Care Services
2. People can access care in out of hospital settings to manage their health and wellbeing
Healthcare extends beyond the hospital and connects across settings to reduce the burden of chronic disease, assist people with conditions to live well and avoid complications, support people to recover from illness and injury, and prevent avoidable hospitalisations. NSW Health services include non-admitted and community-based services, sub-acute services, hospital in the home, and dental services.
2020-21 investment: $6.4 billion recurrent expenses & $471.4 million capital expenditure
Community Based Services Mental Health Community Based Services Aged Care Community Services Drug & Alcohol Services Non-Admitted Services
3. People receive timely emergency care
NSW Health is responsible for managing and operating ambulance and emergency services, which are often the first point of contact for people needing emergency healthcare.
2020-21 investment: $3.5 billion recurrent expenses & $408.1 million capital expenditure
Emergency Departments Ambulance Emergency Services
4. Keeping people healthy through prevention and health promotion
Preventive and population health measures are critical to keeping people healthier. It covers a range of functions including to promote public health, control infectious diseases, reduce preventive diseases and death, help people manage their own health including mental health, and promote equitable health outcomes in the community.
2020-21 investment: $1.3 billion recurrent expenses & $20.0 million capital expenditure
Dental Services Health Protection Services Health Prevention Services Specific Health Screening Services
5. Our people and systems are continuously improving to deliver the best health outcomes and experiences
A skilled workforce with access to world-leading education and training, and a system that harnesses research and digital innovation essential to continuously improve outcomes and experiences of care across the system.
2020-21 investment: $1.1 billion recurrent expenses & $18.4 million capital expenditure
Teaching, Training & Research Medical Research Support Program Research and Commercial Capacity
Building Initiatives Health Care Complaints Commission Mental Health Commission of New South
Wales
(a) Note that Programs are being further refined as the outcome and performance framework continues to mature.
Health Cluster
Outcomes Statement 2020-21 3 - 3
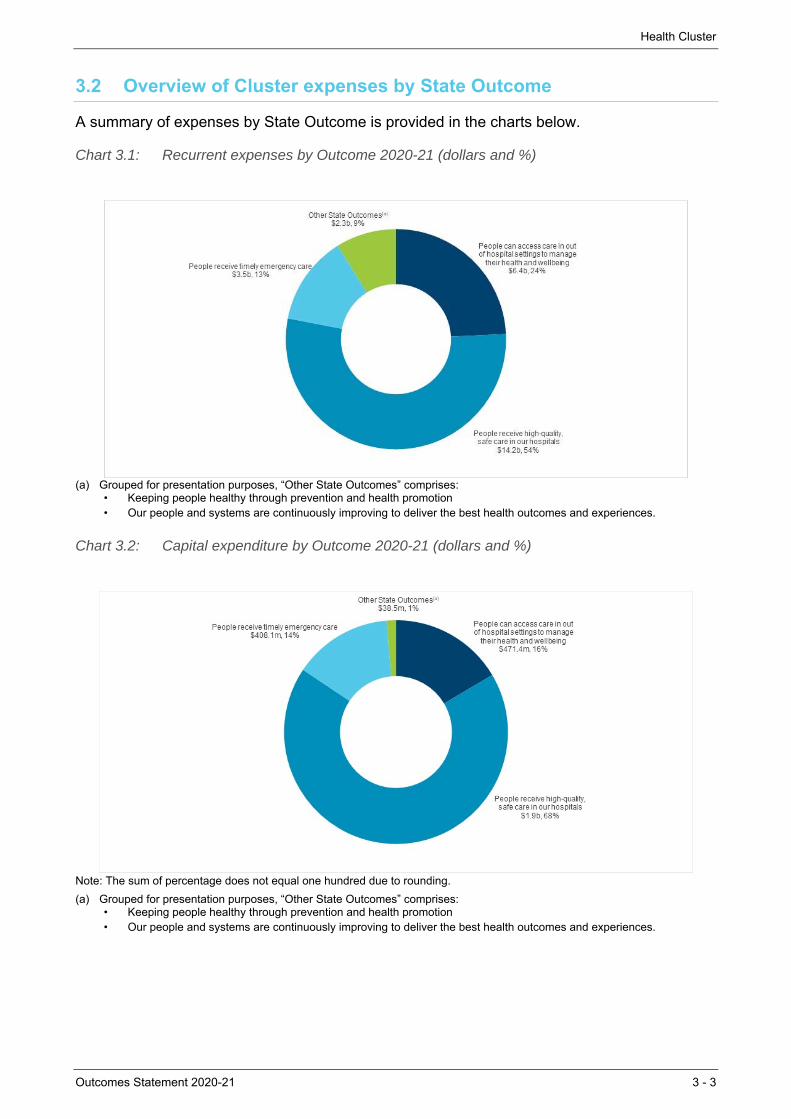
3.2 Overview of Cluster expenses by State Outcome
A summary of expenses by State Outcome is provided in the charts below.
Chart 3.1: Recurrent expenses by Outcome 2020-21 (dollars and %)
(a) Grouped for presentation purposes, “Other State Outcomes” comprises:
• Keeping people healthy through prevention and health promotion • Our people and systems are continuously improving to deliver the best health outcomes and experiences.
Chart 3.2: Capital expenditure by Outcome 2020-21 (dollars and %)
Note: The sum of percentage does not equal one hundred due to rounding.
(a) Grouped for presentation purposes, “Other State Outcomes” comprises: • Keeping people healthy through prevention and health promotion • Our people and systems are continuously improving to deliver the best health outcomes and experiences.
Health Cluster
3 - 4 Outcomes Statement 2020-21
3.3 Outcome 1: People receive high-quality, safe care in our hospitals
State Outcome overview and 2020-21 investment
When people are admitted to a hospital in New South Wales, they can expect world-class medical and surgical care within clinically recommended timeframes, with NSW Health operating the largest public hospital system in Australia.
2020-21 State Outcome Budget highlights
In 2020-21, the Health Cluster will invest $16.1 billion ($14.2 billion recurrent expenses and $1.9 billion capital expenditure) in this Outcome, including:
$458.5 million in 2020-21 in response to the COVID-19 pandemic to fast track elective surgeries, focusing on surgery delayed by COVID-19
$72.1 million in 2020-21 (part of a $673.3 million investment) for the Tweed Hospital and Integrated Ambulatory Services Redevelopment
$55.9 million over four years to enhance palliative care, including 5,000 additional non-clinical End of Life Support Packages, specialist allied health professionals, education and training as well as improved bereavement and psychosocial support services
$49.6 million in 2020-21 to give patients access to innovative new CAR-T cell therapies that provide world leading, lifesaving treatments
$35.0 million in 2020-21 (part of a $142.4 million investment) to commence four new hospital car parks at Concord, Dubbo, Maitland and Tweed Hospitals
$21.5 million in 2020-21 (part of a $385.0 million investment) to commence work on the St George Hospital Integrated Ambulatory Care Precinct
$16.3 million in 2020-21 (part of a $750.0 million investment) to accelerate the redevelopment of the Royal Prince Alfred Hospital
$15.0 million in 2020-21 (part of a $608.0 million investment) to commence work at the Sydney Children’s Hospital Network, Randwick Stage 1 Comprehensive Children’s Cancer Centre
$15.0 million in 2020-21 (part of a $450.0 million investment) to commence Stage 2 of the Nepean Hospital Redevelopment
$10.1 million in 2020-21 (part of a $698.6 million investment) for the new Shellharbour Hospital to be built on a greenfield site with an expanded scope
$10.0 million in 2020-21 (part of a $200.0 million investment) to commence the Eurobodalla Health Service Redevelopment
Implementation of a Real Time Prescription Monitoring system to track prescribed medicines associated with a high risk of causing harm, dependence or misuse
Implementation of an integrated state-wide Laboratory Information Management System for NSW Pathology to provide seamless ordering, processing and reporting of over 70 million tests per year across NSW Health
Acceleration of work at Cowra, Glen Innes, Manning (stage 2) and Shoalhaven
Progress planning for health infrastructure commitments at Forster-Tuncurry, Grafton, Gunnedah, Ryde and Moree.
$14.2 billion
Recurrent Expenses 2020-21
$1.9 billion
Capital Expenditure2020-21
Health Cluster
Outcomes Statement 2020-21 3 - 5
Key performance insights
This section provides analysis and insights on key Outcome Indicators for this State Outcome.
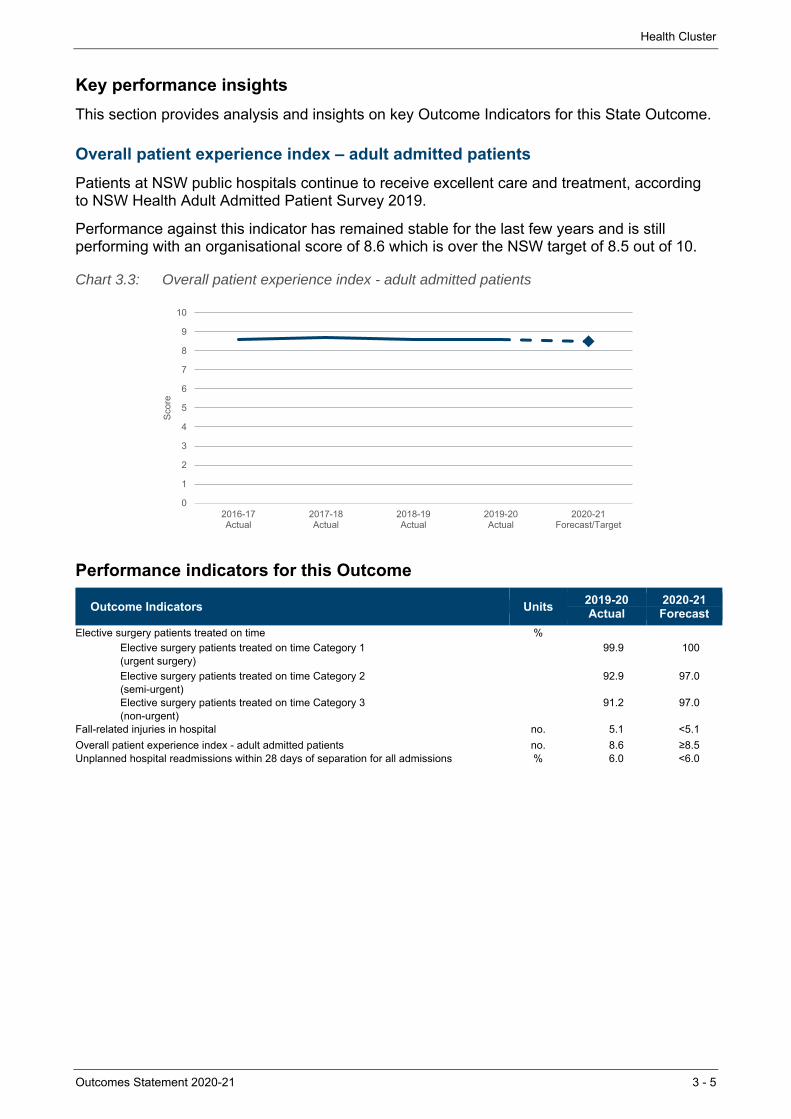
Overall patient experience index – adult admitted patients
Patients at NSW public hospitals continue to receive excellent care and treatment, according to NSW Health Adult Admitted Patient Survey 2019.
Performance against this indicator has remained stable for the last few years and is still performing with an organisational score of 8.6 which is over the NSW target of 8.5 out of 10.
Chart 3.3: Overall patient experience index - adult admitted patients
Performance indicators for this Outcome
Outcome Indicators Units 2019-20 2020-21Actual Forecast
Elective surgery patients treated on time %
Elective surgery patients treated on time Category 1 99.9 100(urgent surgery) Elective surgery patients treated on time Category 2 92.9 97.0(semi-urgent) Elective surgery patients treated on time Category 3 91.2 97.0(non-urgent)
Fall-related injuries in hospital no. 5.1 <5.1
Overall patient experience index - adult admitted patients no. 8.6 ≥8.5Unplanned hospital readmissions within 28 days of separation for all admissions % 6.0 <6.0
0
1
2
3
4
5
6
7
8
9
10
2016-17Actual
2017-18Actual
2018-19Actual
2019-20Actual
2020-21Forecast/Target
Sco
re

Health Cluster
3 - 6 Outcomes Statement 2020-21
3.4 Outcome 2: People can access care in out of hospital settings to manage their health and wellbeing
State Outcome overview and 2020-21 investment
Healthcare extends beyond the hospital and connects across settings to reduce the burden of chronic disease, assist people with conditions to live well and avoid complications, support people to recover from illness and injury, and prevent avoidable hospitalisations. NSW Health services include non-admitted and community-based services, sub-acute services, hospital in the home, and dental services.
2020-21 State Outcome Budget highlights
In 2020-21, the Health Cluster will invest $6.9 billion ($6.4 billion recurrent expenses and $471.4 million capital expenditure) in this Outcome, including:
$66.5 million in 2020-21 ($63.0 million expenses and $3.5 million capital expenditure) to support mental health and wellbeing during the COVID-19 pandemic, including:
– providing additional mental health clinicians and peer workers to enhance community mental health services and support vulnerable populations
– expanding the Police Ambulance and Clinical Early Response model to 10 Police Area Commands and two Police Districts
– enhancing therapeutic activities in acute inpatient units
– increasing capacity and responsiveness of the Mental Health Line and expanding virtual mental health services to improve access to care
$66.2 million over three years from 2021-22 to continue the additional specialist mental health clinicians to significantly enhance the capacity of community mental health services to appropriately manage mental health clients in the community. This will include specific expansion of youth mental health services, with a particular focus on urgent assessment and suicide prevention
$50.4 million over three years from 2021-22 to provide technology-enabled workforce support options, including remote video conferencing and expanding telehealth services and related infrastructure, to enable more access to mental health support for people in immediate crisis
$46.8 million over four years to support student wellbeing by recruiting an additional 100 wellbeing and in-reach nurses in vulnerable regions to provide wellbeing and health checks and referrals in schools
$45.0 million in 2020-21 to expand programs in the community as part of the response to the COVID-19 pandemic, including those that provide non-clinical care and services and support to patients out of hospital
$17.0 million over two years to pilot a package for in-home care for pregnant women suffering from hyperemesis gravidarum (severe morning sickness) to better understand and treat the condition
$10.2 million over four years to fund Tresillian and Karitane to extend access to virtual residential parenting services and evaluate service delivery outcomes and experience
$6.4 billion
Recurrent Expenses 2020-21
$471.4 million
Capital Expenditure2020-21
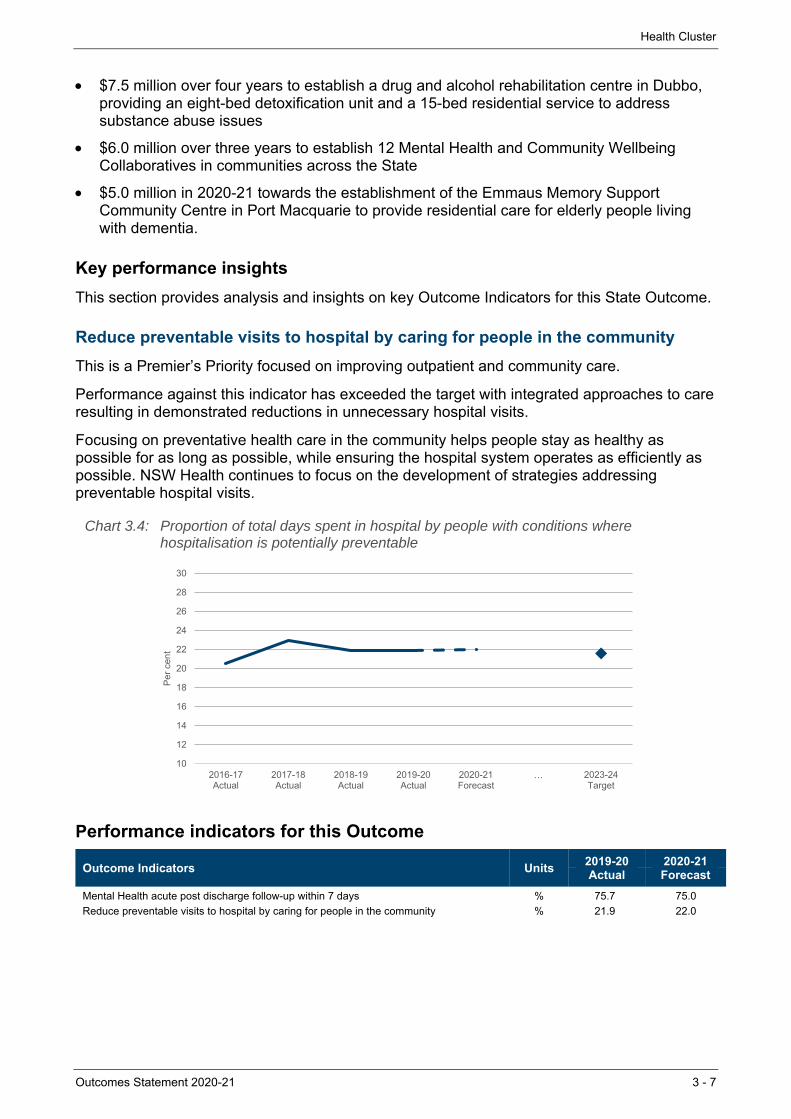
Health Cluster
Outcomes Statement 2020-21 3 - 7
$7.5 million over four years to establish a drug and alcohol rehabilitation centre in Dubbo, providing an eight-bed detoxification unit and a 15-bed residential service to address substance abuse issues
$6.0 million over three years to establish 12 Mental Health and Community Wellbeing Collaboratives in communities across the State
$5.0 million in 2020-21 towards the establishment of the Emmaus Memory Support Community Centre in Port Macquarie to provide residential care for elderly people living with dementia.
Key performance insights
This section provides analysis and insights on key Outcome Indicators for this State Outcome.
Reduce preventable visits to hospital by caring for people in the community
This is a Premier’s Priority focused on improving outpatient and community care.
Performance against this indicator has exceeded the target with integrated approaches to care resulting in demonstrated reductions in unnecessary hospital visits.
Focusing on preventative health care in the community helps people stay as healthy as possible for as long as possible, while ensuring the hospital system operates as efficiently as possible. NSW Health continues to focus on the development of strategies addressing preventable hospital visits.
Chart 3.4: Proportion of total days spent in hospital by people with conditions where hospitalisation is potentially preventable
Performance indicators for this Outcome
Outcome Indicators Units 2019-20 2020-21Actual Forecast
Mental Health acute post discharge follow-up within 7 days % 75.7 75.0
Reduce preventable visits to hospital by caring for people in the community % 21.9 22.0
10
12
14
16
18
20
22
24
26
28
30
2016-17Actual
2017-18Actual
2018-19Actual
2019-20Actual
2020-21Forecast
… 2023-24Target
Per
cen
t
Health Cluster
3 - 8 Outcomes Statement 2020-21
3.5 Outcome 3: People receive timely emergency care
State Outcome overview and 2020-21 investment
NSW Health is responsible for managing and operating ambulance and emergency services, which are often the first point of contact for people needing emergency healthcare.
2020-21 State Outcome Budget highlights
In 2020-21, the Health Cluster will invest $3.9 billion ($3.5 billion recurrent expenses and $408.1 million capital expenditure) in this Outcome, including:
$100.0 million over four years to accelerate the implementation of Stage 2 of the Rural Ambulance Infrastructure Reconfiguration, improving access to emergency health services for communities across regional NSW and improve workplace conditions for a significant proportion of NSW Ambulance employees
$30.0 million in 2020-21 for additional emergency department attendances and ambulance calls in response to the COVID-19 pandemic
$20.9 million in 2020-21 towards Ambulance emergency telecommunications
$14.5 million in 2020-21 to recruit more temporary security staff and more patient experience officers to improve patients’ hospital experience at hospitals where there are COVID-19 clinics
$10.0 million over four years to plan and undertake a NSW stroke ambulance pilot project, to support the rapid diagnosis of strokes and facilitate early access to appropriate treatment pathways. The stroke ambulance will be a mobile referring site of the NSW Telestroke Service.
Key performance insights
This section provides analysis and insights on key Outcome Indicators for this State Outcome.
Triage category 1, 2 and 3 patients commence treatment on time in the emergency department
This is a Premier’s Priority and NSW Health has a strong focus on ensuring people receive timely emergency care.
Performance against this indicator is on track to meet targets, with New South Wales remaining the top performing state in Australia in terms of timeliness of emergency care. In 2019-20, performance in triage category 1 remained on target at 100 per cent while category 2 and 3 performance improved compared to the previous year (1.2 percentage points and 2.2 percentage points respectively).
Performance in 2019-20 has been affected by a temporary reduction in emergency department presentations during and immediately following the peak of the COVID-19 pandemic. It is anticipated that as volumes return to normal levels in 2020-21 and beyond performance on this indicator will reflect pre-COVID-19 trends.
$3.5 billion
Recurrent Expenses 2020-21
$408.1 million
Capital Expenditure2020-21
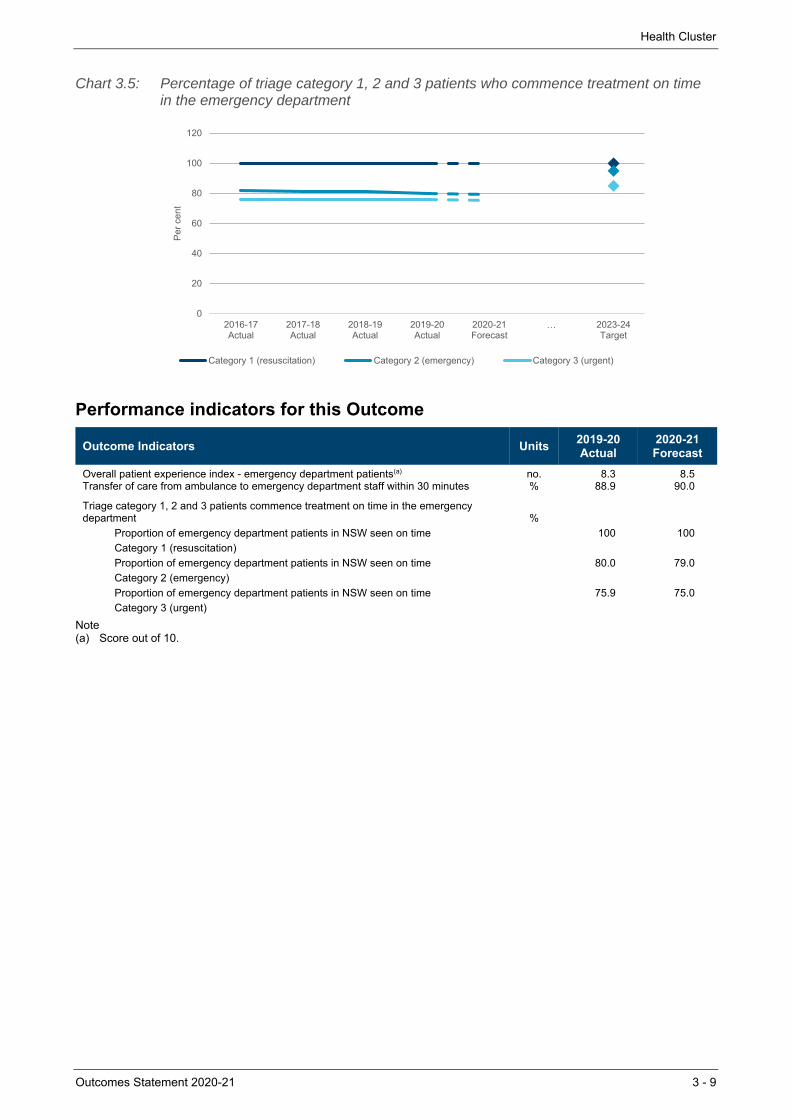
Health Cluster
Outcomes Statement 2020-21 3 - 9
Chart 3.5: Percentage of triage category 1, 2 and 3 patients who commence treatment on time in the emergency department
Performance indicators for this Outcome
Outcome Indicators Units 2019-20 2020-21Actual Forecast
Overall patient experience index - emergency department patients(a) no. 8.3 8.5Transfer of care from ambulance to emergency department staff within 30 minutes % 88.9 90.0
Triage category 1, 2 and 3 patients commence treatment on time in the emergency department %
Proportion of emergency department patients in NSW seen on time 100 100
Category 1 (resuscitation) Proportion of emergency department patients in NSW seen on time 80.0 79.0
Category 2 (emergency) Proportion of emergency department patients in NSW seen on time 75.9 75.0
Category 3 (urgent)
Note (a) Score out of 10.
0
20
40
60
80
100
120
2016-17Actual
2017-18Actual
2018-19Actual
2019-20Actual
2020-21Forecast
… 2023-24Target
Per
cen
t
Category 1 (resuscitation) Category 2 (emergency) Category 3 (urgent)

Health Cluster
3 - 10 Outcomes Statement 2020-21
3.6 Outcome 4: Keeping people healthy through prevention and health promotion
State Outcome overview and 2020-21 investment
Preventive and population health measures are critical to keeping people healthier. It covers a range of functions including to promote public health, control infectious diseases, reduce preventive diseases and death, help people manage their own health including mental health, and promote equitable health outcomes in the community.
State Outcome Budget highlights
In 2020-21, the Health Cluster will invest $1.3 billion ($1.3 billion recurrent expenses and $20.0 million capital expenditure) in this Outcome, including:
$500.0 million to assist with the response to COVID-19 including:
– support for COVID-19 clinics
– quarantine arrangements, including NSW Health deployment at Sydney Airport
– increased pathology testing and contact tracing
$385.0 million in 2020-21 to provide additional personal protective equipment (PPE) to keep our frontline healthcare workers safe. This is in addition to the substantial investment in PPE the Government has made to date in responding to COVID-19.
Key performance insights
This section provides analysis and insights on key Outcome Indicators for this State Outcome.
Towards zero suicides
This is a Premier’s Priority to reduce the rate of suicide deaths in New South Wales by 20 per cent by 2023.
Performance against this indicator has remained stable however the COVID-19 pandemic is likely to have impacts on population mental health due to social and economic impacts.
Reducing the rate of suicide requires a collaborative approach across the health system and government. New South Wales is providing a range of mental health initiatives to enhance support during the COVID-19 pandemic. It has implemented new methods to improve detection and reporting of self-harm in emergency departments, and has partnered with the Department of Communities and Justice and NSW Police to establish a suicide monitoring and data management system in New South Wales.
$1.3 billion
Recurrent Expenses 2020-21
$20.0 million
Capital Expenditure2020-21
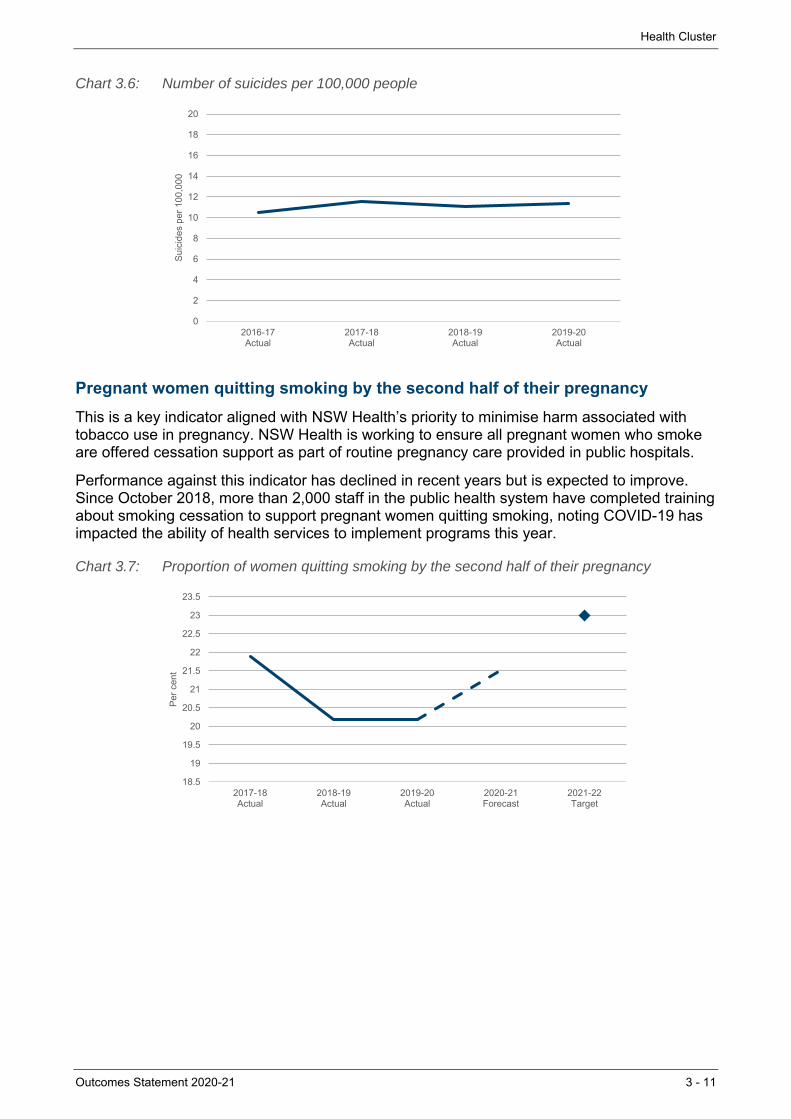
Health Cluster
Outcomes Statement 2020-21 3 - 11
Chart 3.6: Number of suicides per 100,000 people
Pregnant women quitting smoking by the second half of their pregnancy
This is a key indicator aligned with NSW Health’s priority to minimise harm associated with tobacco use in pregnancy. NSW Health is working to ensure all pregnant women who smoke are offered cessation support as part of routine pregnancy care provided in public hospitals.
Performance against this indicator has declined in recent years but is expected to improve. Since October 2018, more than 2,000 staff in the public health system have completed training about smoking cessation to support pregnant women quitting smoking, noting COVID-19 has impacted the ability of health services to implement programs this year.
Chart 3.7: Proportion of women quitting smoking by the second half of their pregnancy
0
2
4
6
8
10
12
14
16
18
20
2016-17Actual
2017-18Actual
2018-19Actual
2019-20Actual
Sui
cide
s pe
r 10
0,00
0
18.5
19
19.5
20
20.5
21
21.5
22
22.5
23
23.5
2017-18Actual
2018-19Actual
2019-20Actual
2020-21Forecast
2021-22Target
Per
cen
t
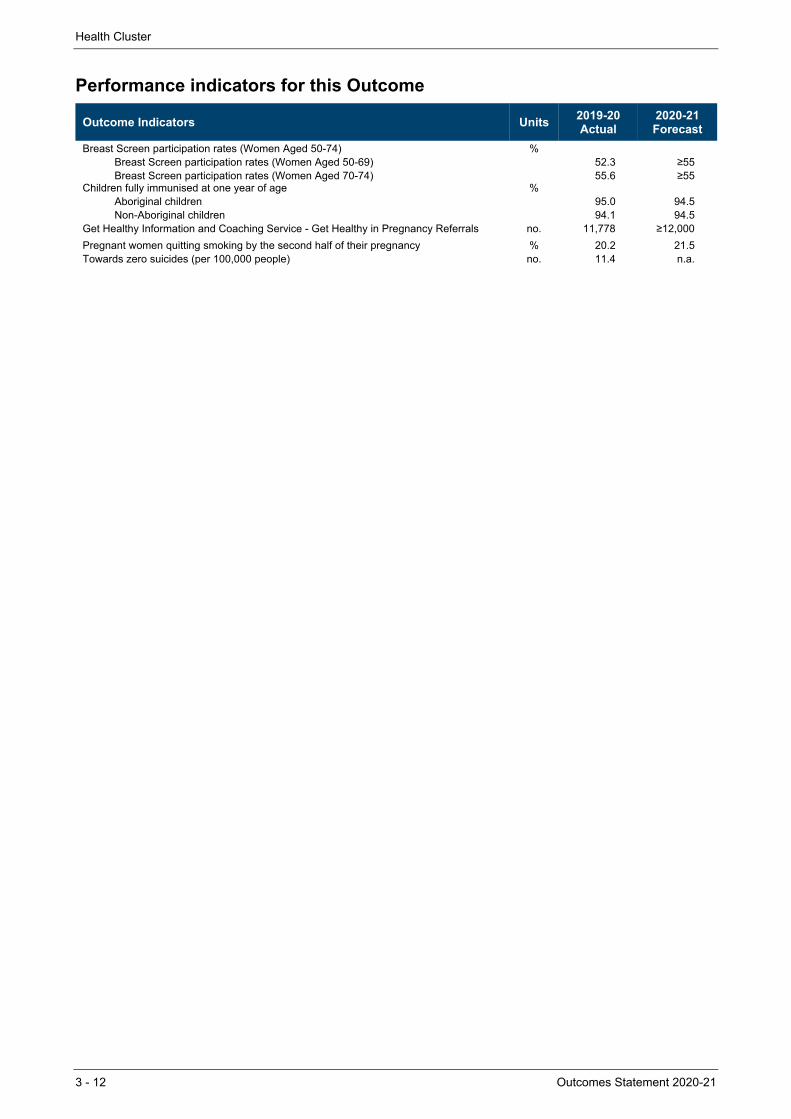
Health Cluster
3 - 12 Outcomes Statement 2020-21
Performance indicators for this Outcome
Outcome Indicators Units 2019-20 2020-21Actual Forecast
Breast Screen participation rates (Women Aged 50-74) % Breast Screen participation rates (Women Aged 50-69) 52.3 ≥55Breast Screen participation rates (Women Aged 70-74) 55.6 ≥55
Children fully immunised at one year of age % Aboriginal children 95.0 94.5Non-Aboriginal children 94.1 94.5
Get Healthy Information and Coaching Service - Get Healthy in Pregnancy Referrals no. 11,778 ≥12,000
Pregnant women quitting smoking by the second half of their pregnancy % 20.2 21.5Towards zero suicides (per 100,000 people) no. 11.4 n.a.

Health Cluster
Outcomes Statement 2020-21 3 - 13
3.7 Outcome 5: Our people and systems are continuously improving to deliver the best health outcomes and experiences
State Outcome overview and 2020-21 investment
A skilled workforce with access to world leading education and training, and a system that harnesses research and digital innovation essential to continuously improving outcomes and experiences of care across the system. This expertise is delivered by a range of statutory bodies and system managers.
2020-21 State Outcome Budget highlights
In 2020-21, the Health Cluster will invest $1.1 billion ($1.1 billion recurrent expenses and $18.4 million capital expenditure) in this Outcome, including:
$20.0 million in 2020-21 to fast-track state-wide research and clinical trials to tackle the global COVID-19 pandemic and reduce its impact on the community.
Key performance insights
This section provides analysis and insights on key Outcome Indicators for this State Outcome.
Increasing the volume of discharge summaries delivered electronically to General Practitioners (GPs)
This facilitates well-coordinated and effective clinical handover between hospitals and primary healthcare providers. Sharing information via electronic means supports patients as they return to the community and can reduce unnecessary hospital visits.
Performance against this indicator is currently exceeding the target. Over the last six months, there has been a continued increase in the percentage of discharge summaries being delivered electronically to GPs.
Chart 3.8: Increase the percentage of discharge summaries delivered electronically to GPs
Note: The 2020-21 target reflects a projected return to normal activity levels as COVID-19 restrictions are eased. Performance in 2019-20 significantly exceeded this target due to lower activity volumes induced by COVID-19.
0
10
20
30
40
50
60
70
2018-19Actual
2019-20Actual
2020-21Target
Per
cen
t
$1.1 billion
Recurrent Expenses 2020-21
$18.4 million
Capital Expenditure2020-21
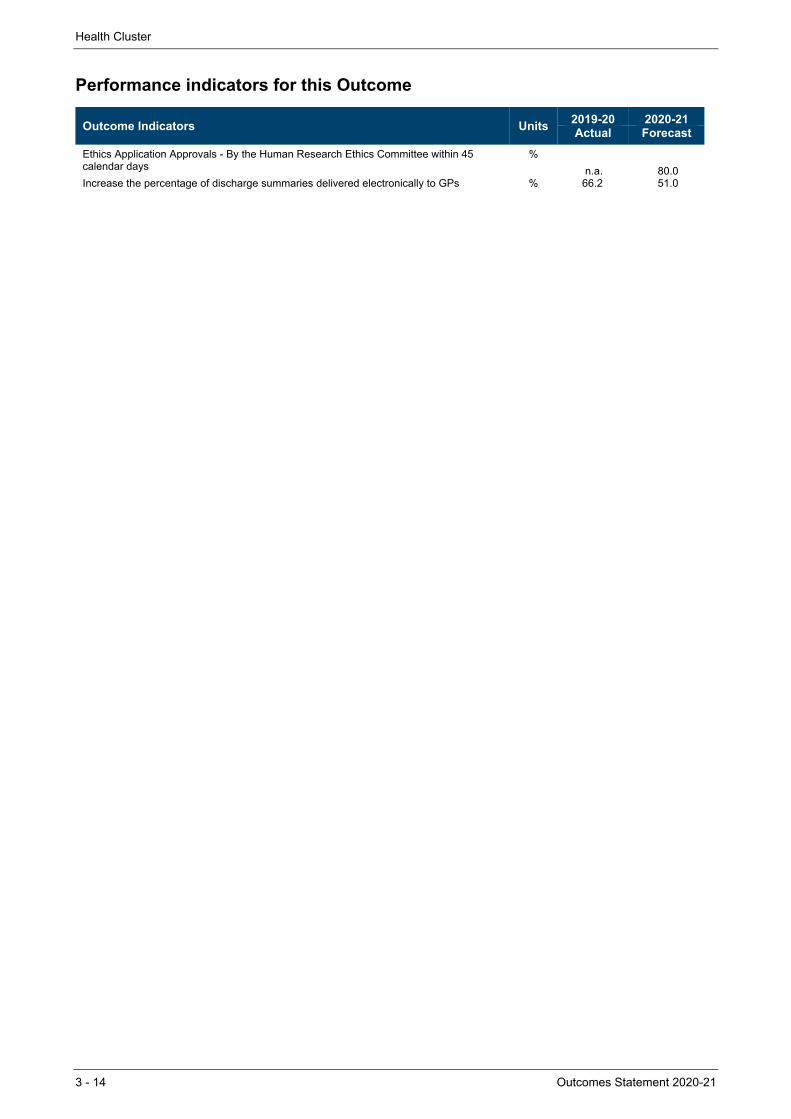
Health Cluster
3 - 14 Outcomes Statement 2020-21
Performance indicators for this Outcome
Outcome Indicators Units 2019-20 2020-21Actual Forecast
Ethics Application Approvals - By the Human Research Ethics Committee within 45 calendar days
%
n.a. 80.0Increase the percentage of discharge summaries delivered electronically to GPs % 66.2 51.0

Outcome Statement 2020-21 4 - 1
4. PLANNING, INDUSTRY AND ENVIRONMENT CLUSTER
4.1 Introduction
The Planning, Industry and Environment Cluster is responsible for the stewardship of the NSW Government’s natural and built assets. The Cluster’s key areas of focus include planning and enabling value-adding development and infrastructure that drives economic activity, protecting our native flora and fauna, ensuring our energy security through lower carbon emissions options, creating better public and open spaces, securing and improving the State’s water supply, increasing housing affordability and supply, and improving outcomes for Aboriginal people across the State.
State Outcomes to be delivered by the Planning, Industry and Environment Cluster
State Outcomes What the Cluster is delivering for people and
business
Example Programs(a)
underway to support delivery of Outcomes
1. Connecting communities to resilient and sustainable energy and local environments
Protecting and preserving the quality of our environment via active stewardship to support a healthy New South Wales while securing an affordable, reliable and sustainable energy future.
2020-21 investment: $2.0 billion recurrent expenses & $229.9 million capital expenditure
• Conserving and preserving national parks • Accessing secure and sustainable energy • Supporting a sustainable, climate-resilient
NSW • Encouraging a circular economy to better
manage our resources
2. Create a strong and liveable NSW
Planning for great places that create the conditions for prosperity, economic development, innovation and jobs, delivering infrastructure and a diverse housing mix that responds to the needs of communities, and securing environmental sustainability, good design, greener places and safe and inclusive public spaces that bring communities together.
2020-21 investment: $1.2 billion recurrent expenses & $28.8 million capital expenditure
• Coordinating and enabling the place and infrastructure outcomes of regional plans
• Delivering better outcomes for place, design, public spaces and green infrastructure
• Make strong, fair and quick assessments driving balanced outcomes
3. Maximise community benefit from government land and property
Delivering a coordinated, strategic approach to the use of government-owned property to maximise community benefits by delivering quality public spaces and diverse housing outcomes.
2020-21 investment: $2.0 billion recurrent expenses & $499.2 million capital expenditure
• Better use of land and property • Empowering Aboriginal communities for
independent social and economic futures • Better place creation • Optimise benefits of Crown land
$5.9 billion
Recurrent Expenses 2020-21
$772.6 million
Capital Expenditure2020-21

Planning, Industry and Environment Cluster
4 - 2 Outcomes Statement 2020-21
State Outcomes What the Cluster is delivering for people and
business
Example Programs(a)
underway to support delivery of Outcomes
4. Sustainable, secure and healthy water resources and services
Providing confidence to communities and stakeholders through the transparent stewardship of water resources, provision of services and reforms that support sustainable and healthy environments, economies and societies across New South Wales.
2020-21 investment: $698.4 million recurrent expenses & $14.7 million capital expenditure
• Improved water sustainability, access and health
• Improved water regulation
(a) Note that Programs are being further refined as the outcome and performance framework continues to mature.
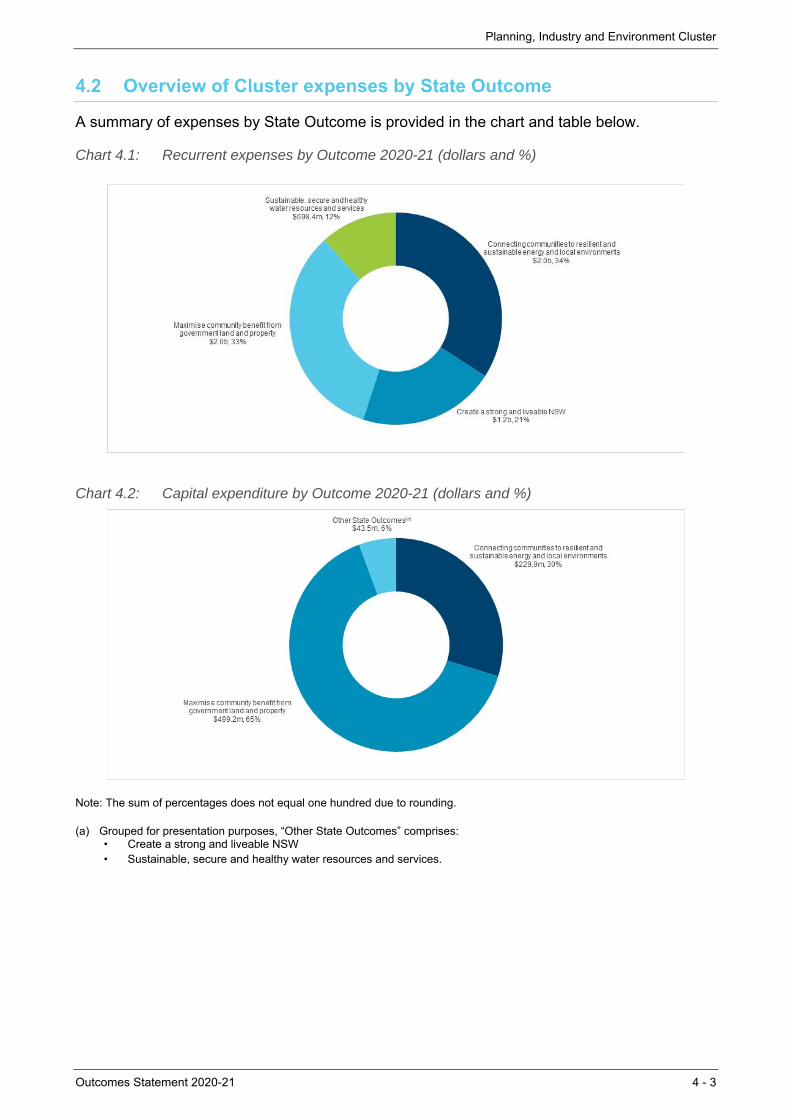
Planning, Industry and Environment Cluster
Outcomes Statement 2020-21 4 - 3
4.2 Overview of Cluster expenses by State Outcome
A summary of expenses by State Outcome is provided in the chart and table below.
Chart 4.1: Recurrent expenses by Outcome 2020-21 (dollars and %)
Chart 4.2: Capital expenditure by Outcome 2020-21 (dollars and %)
Note: The sum of percentages does not equal one hundred due to rounding. (a) Grouped for presentation purposes, “Other State Outcomes” comprises:
• Create a strong and liveable NSW • Sustainable, secure and healthy water resources and services.
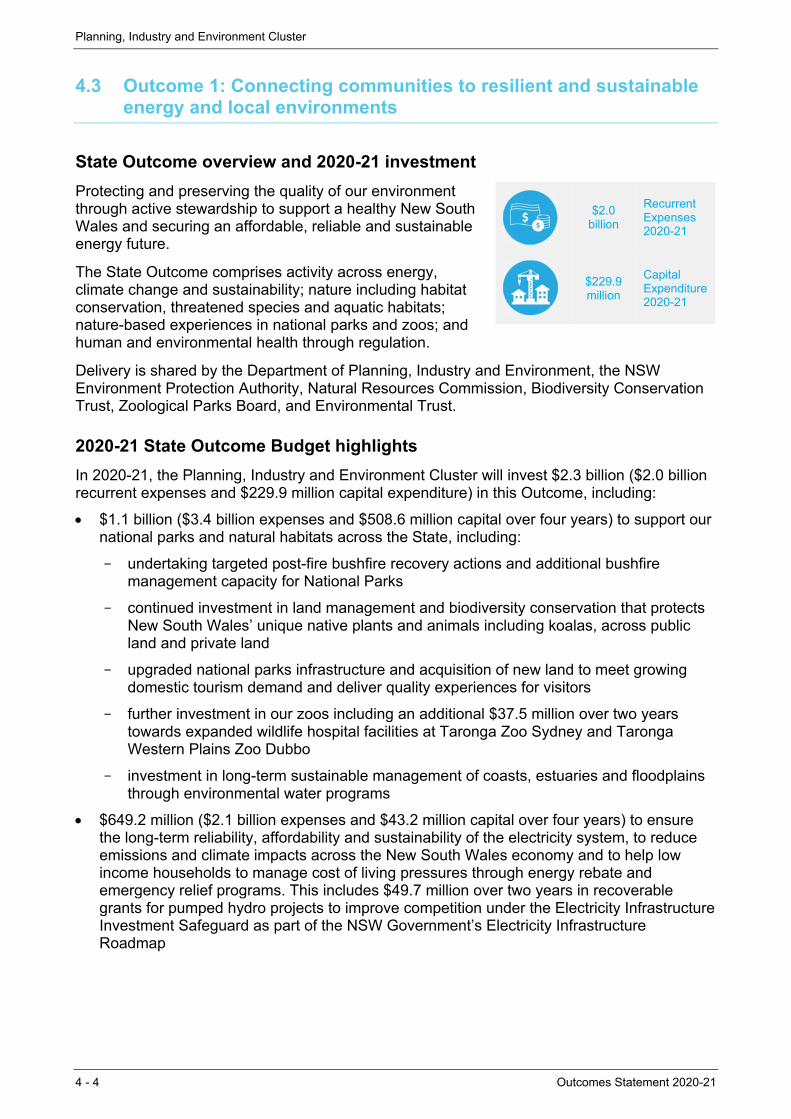
Planning, Industry and Environment Cluster
4 - 4 Outcomes Statement 2020-21
4.3 Outcome 1: Connecting communities to resilient and sustainable energy and local environments
State Outcome overview and 2020-21 investment
Protecting and preserving the quality of our environment through active stewardship to support a healthy New South Wales and securing an affordable, reliable and sustainable energy future.
The State Outcome comprises activity across energy, climate change and sustainability; nature including habitat conservation, threatened species and aquatic habitats; nature-based experiences in national parks and zoos; and human and environmental health through regulation.
Delivery is shared by the Department of Planning, Industry and Environment, the NSW Environment Protection Authority, Natural Resources Commission, Biodiversity Conservation Trust, Zoological Parks Board, and Environmental Trust.
2020-21 State Outcome Budget highlights
In 2020-21, the Planning, Industry and Environment Cluster will invest $2.3 billion ($2.0 billion recurrent expenses and $229.9 million capital expenditure) in this Outcome, including:
$1.1 billion ($3.4 billion expenses and $508.6 million capital over four years) to support our national parks and natural habitats across the State, including:
– undertaking targeted post-fire bushfire recovery actions and additional bushfire management capacity for National Parks
– continued investment in land management and biodiversity conservation that protects New South Wales’ unique native plants and animals including koalas, across public land and private land
– upgraded national parks infrastructure and acquisition of new land to meet growing domestic tourism demand and deliver quality experiences for visitors
– further investment in our zoos including an additional $37.5 million over two years towards expanded wildlife hospital facilities at Taronga Zoo Sydney and Taronga Western Plains Zoo Dubbo
– investment in long-term sustainable management of coasts, estuaries and floodplains through environmental water programs
$649.2 million ($2.1 billion expenses and $43.2 million capital over four years) to ensure the long-term reliability, affordability and sustainability of the electricity system, to reduce emissions and climate impacts across the New South Wales economy and to help low income households to manage cost of living pressures through energy rebate and emergency relief programs. This includes $49.7 million over two years in recoverable grants for pumped hydro projects to improve competition under the Electricity Infrastructure Investment Safeguard as part of the NSW Government’s Electricity Infrastructure Roadmap
$2.0 billion
Recurrent Expenses 2020-21
$229.9 million
Capital Expenditure2020-21
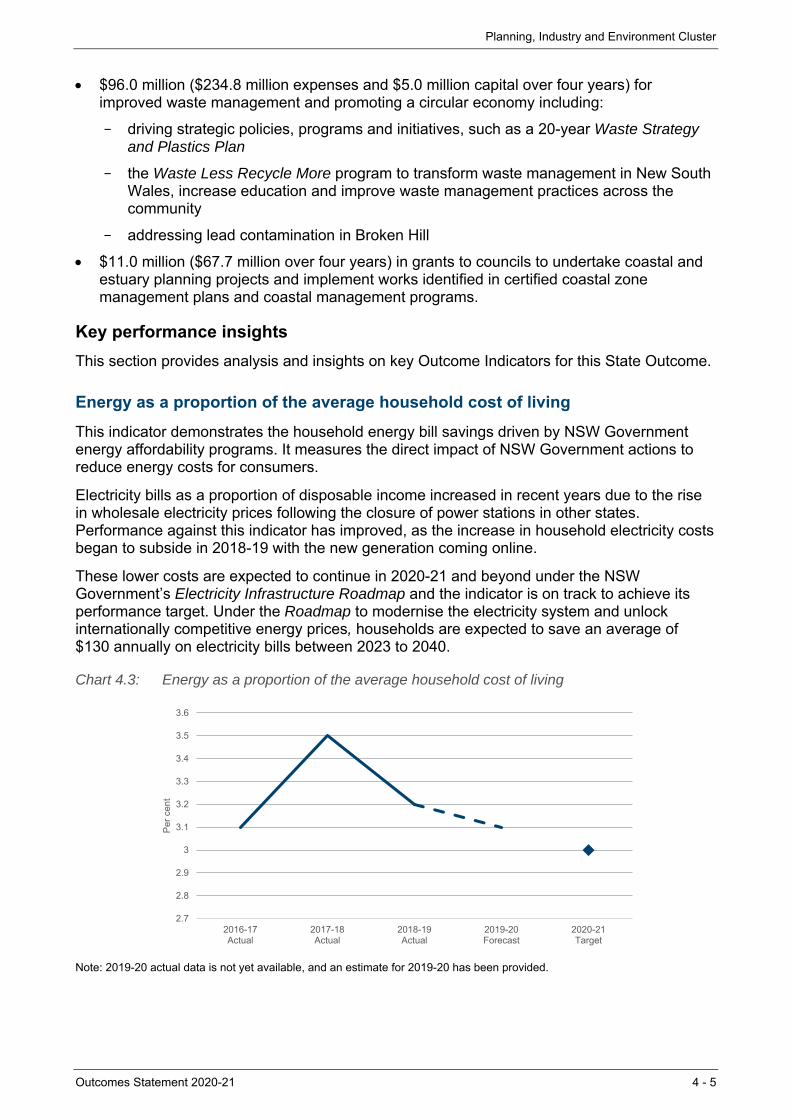
Planning, Industry and Environment Cluster
Outcomes Statement 2020-21 4 - 5
$96.0 million ($234.8 million expenses and $5.0 million capital over four years) for improved waste management and promoting a circular economy including:
– driving strategic policies, programs and initiatives, such as a 20-year Waste Strategy and Plastics Plan
– the Waste Less Recycle More program to transform waste management in New South Wales, increase education and improve waste management practices across the community
– addressing lead contamination in Broken Hill
$11.0 million ($67.7 million over four years) in grants to councils to undertake coastal and estuary planning projects and implement works identified in certified coastal zone management plans and coastal management programs.
Key performance insights
This section provides analysis and insights on key Outcome Indicators for this State Outcome.
Energy as a proportion of the average household cost of living
This indicator demonstrates the household energy bill savings driven by NSW Government energy affordability programs. It measures the direct impact of NSW Government actions to reduce energy costs for consumers.
Electricity bills as a proportion of disposable income increased in recent years due to the rise in wholesale electricity prices following the closure of power stations in other states. Performance against this indicator has improved, as the increase in household electricity costs began to subside in 2018-19 with the new generation coming online.
These lower costs are expected to continue in 2020-21 and beyond under the NSW Government’s Electricity Infrastructure Roadmap and the indicator is on track to achieve its performance target. Under the Roadmap to modernise the electricity system and unlock internationally competitive energy prices, households are expected to save an average of $130 annually on electricity bills between 2023 to 2040.
Chart 4.3: Energy as a proportion of the average household cost of living
Note: 2019-20 actual data is not yet available, and an estimate for 2019-20 has been provided.
2.7
2.8
2.9
3
3.1
3.2
3.3
3.4
3.5
3.6
2016-17Actual
2017-18Actual
2018-19Actual
2019-20Forecast
2020-21Target
Per
cen
t

Planning, Industry and Environment Cluster
4 - 6 Outcomes Statement 2020-21
Millions of tonnes of CO2 equivalent emissions (MtCO2-e) emitted annually in New South Wales (DPIE)
The NSW Government’s commitment to achieve net zero emissions by 2050 is set out in the NSW Climate Change Policy Framework released in 2016.
This indicator measures greenhouse gas emissions from all sectors of the NSW economy and all other emitting activities occurring in New South Wales.
Performance against this indicator has remained stable in recent years, following a decline in NSW emissions, with 2018 emissions 17 per cent lower than 2005 levels. The Net Zero Plan Stage 1: 2020-2030 sets out the NSW Government’s plan to reduce emissions by 35 per cent by 2030 compared to 2005 levels and ultimately achieve net zero emissions in ways that grow the economy or reduce the cost of living and doing business.
The NSW Government has committed $3.5 billion from 2020-21 to 2029-30 to support climate change related initiatives. Further detailed plans will be developed over the next two decades to ensure net zero emissions are achieved by 2050.
Chart 4.4: Millions of tonnes of CO2 equivalent emissions (MtCO2-e) emitted annually in NSW
Note: 2019-20 actual data is not yet available, and an estimate for 2019-20 has been provided.
Number of visitors each year to national parks and zoos (DPIE & Zoological Board of NSW)
Nature-based experiences are vital to people’s health and wellbeing and the New South Wales economy.
Maintaining performance against this indicator has been challenging. New South Wales expects to see increased domestic tourism in 2020-21, driven by more Australians seeking to enjoy nature in their own backyard, as more state and territory border restrictions ease and national borders remain closed to international travel. However, the impact of border closures means reduced visitor numbers to our State, particularly to our world-class zoos.
0
20
40
60
80
100
120
140
160
2015-16Actual
2017-18Actual
2019-20Forecast
2020-21Forecast
2021-22 … 2029-30Target
Mill
ion
tonn
es
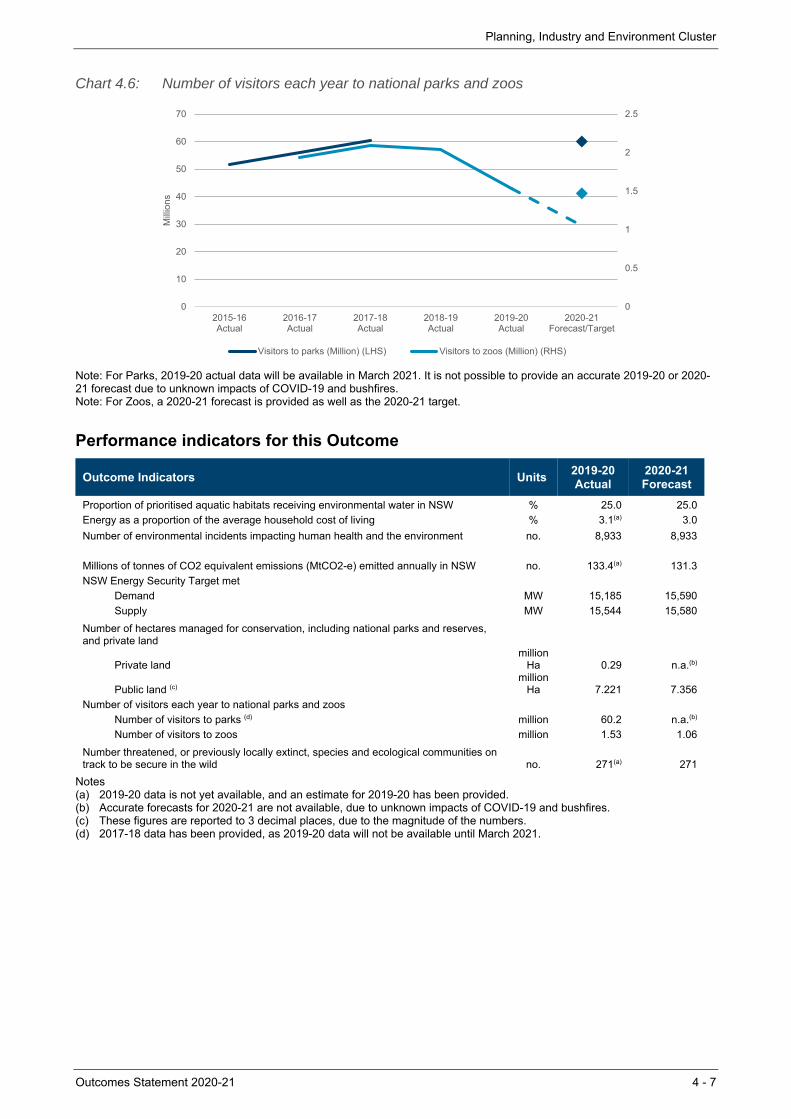
Planning, Industry and Environment Cluster
Outcomes Statement 2020-21 4 - 7
Chart 4.6: Number of visitors each year to national parks and zoos
Note: For Parks, 2019-20 actual data will be available in March 2021. It is not possible to provide an accurate 2019-20 or 2020-21 forecast due to unknown impacts of COVID-19 and bushfires. Note: For Zoos, a 2020-21 forecast is provided as well as the 2020-21 target.
Performance indicators for this Outcome
Outcome Indicators Units 2019-20 2020-21Actual Forecast
Proportion of prioritised aquatic habitats receiving environmental water in NSW % 25.0 25.0
Energy as a proportion of the average household cost of living % 3.1(a) 3.0
Number of environmental incidents impacting human health and the environment no. 8,933 8,933
Millions of tonnes of CO2 equivalent emissions (MtCO2-e) emitted annually in NSW no. 133.4(a) 131.3
NSW Energy Security Target met Demand MW 15,185 15,590
Supply MW 15,544 15,580
Number of hectares managed for conservation, including national parks and reserves, and private land
Private land million
Ha 0.29 n.a.(b)
Public land (c) million
Ha 7.221 7.356
Number of visitors each year to national parks and zoos Number of visitors to parks (d) million 60.2 n.a.(b)
Number of visitors to zoos million 1.53 1.06
Number threatened, or previously locally extinct, species and ecological communities on track to be secure in the wild no. 271(a) 271
Notes (a) 2019-20 data is not yet available, and an estimate for 2019-20 has been provided. (b) Accurate forecasts for 2020-21 are not available, due to unknown impacts of COVID-19 and bushfires. (c) These figures are reported to 3 decimal places, due to the magnitude of the numbers. (d) 2017-18 data has been provided, as 2019-20 data will not be available until March 2021.
0
0.5
1
1.5
2
2.5
0
10
20
30
40
50
60
70
2015-16Actual
2016-17Actual
2017-18Actual
2018-19Actual
2019-20Actual
2020-21Forecast/Target
Mill
ions
Visitors to parks (Million) (LHS) Visitors to zoos (Million) (RHS)
Planning, Industry and Environment Cluster
4 - 8 Outcomes Statement 2020-21
4.4 Outcome 2: Create a strong and liveable NSW
State Outcome overview and 2020-21 investment
Planning for great places that create the conditions for prosperity, economic development, innovation and jobs, delivering infrastructure and a diverse housing mix that responds to the needs of communities, and securing environmental sustainability, good design, greener places and safe and inclusive public spaces that bring communities together.
The State Outcome comprises initiatives aimed to improve liveability across New South Wales with enhanced open, green and public spaces and planning efficiencies that deliver economic stimulus and increase housing supply and infrastructure in growth areas.
2020-21 State Outcome Budget highlights
In 2020-21, the Planning, Industry and Environment Cluster will invest $1.3 billion ($1.2 billion recurrent expenses and $28.8 million capital expenditure) in this Outcome, including:
$244.3 million ($520.1 million expenses and $53.2 million capital over four years) to deliver the NSW Planning Reform Action Plan to improve the speed, effectiveness and efficiency of the NSW planning system. This includes $76.3 million ($250.0 million over three years) for the NSW Public Spaces Legacy Program, which will accelerate planning assessments and fund new and improved public and open spaces across the State. Other planning reforms include consolidating employment zones to improve simplicity and flexibility; and optimising the use of industrial land to generate greater economic value and employment
$78.5 million ($314.0 million expenses over four years) for pensioner council rate concessions to assist with the cost of living
$46.4 million ($143.5 million capital over three years) to continue the Strategic Open Spaces Program across Greater Sydney, including: new and upgraded parks at Penrith, Ermington, Appin, Leppington, Frenchs Forest, Carramar, Beaumont Hills, Hurstville; and funding for Callan Park
$32.8 million to help councils meet increases in the Emergency Services Levy to pay for new compensation arrangements for firefighters who develop cancer
$26.0 million over two years from 2021-22 to support small businesses to accelerate research and development in New South Wales, including:
$1.2 billion
Recurrent Expenses 2020-21
$28.8 million
Capital Expenditure2020-21
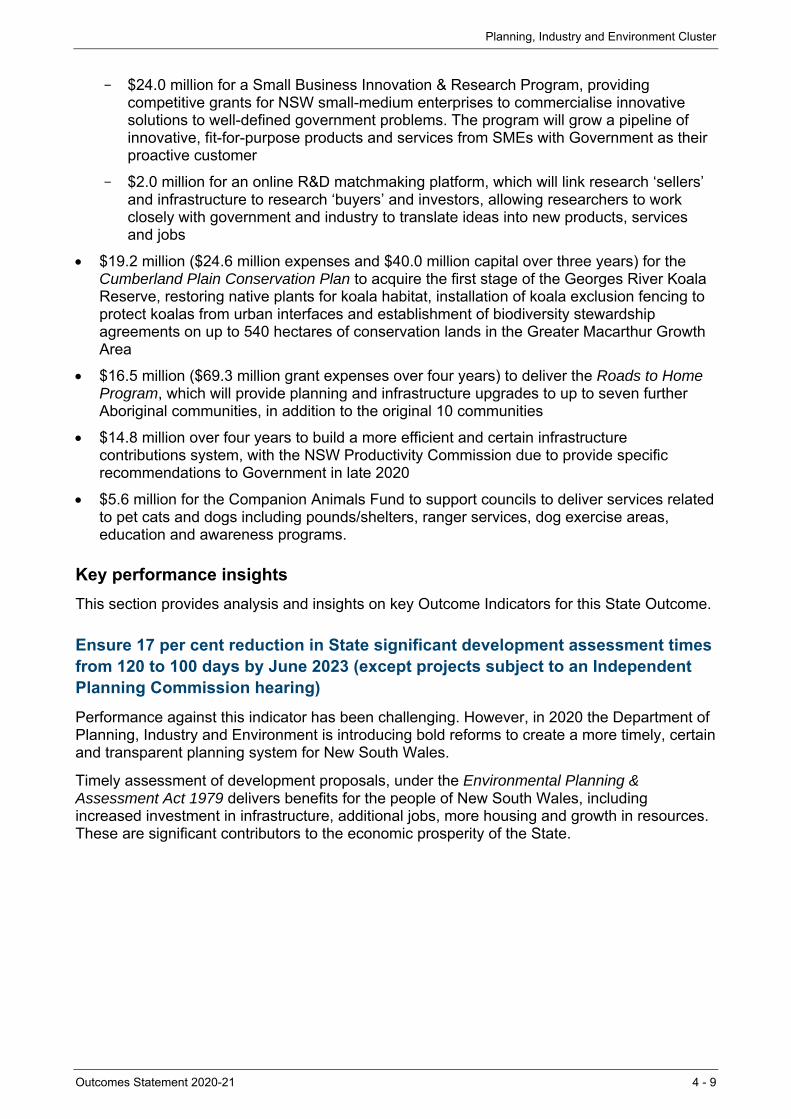
Planning, Industry and Environment Cluster
Outcomes Statement 2020-21 4 - 9
– $24.0 million for a Small Business Innovation & Research Program, providing competitive grants for NSW small-medium enterprises to commercialise innovative solutions to well-defined government problems. The program will grow a pipeline of innovative, fit-for-purpose products and services from SMEs with Government as their proactive customer
– $2.0 million for an online R&D matchmaking platform, which will link research ‘sellers’ and infrastructure to research ‘buyers’ and investors, allowing researchers to work closely with government and industry to translate ideas into new products, services and jobs
$19.2 million ($24.6 million expenses and $40.0 million capital over three years) for the Cumberland Plain Conservation Plan to acquire the first stage of the Georges River Koala Reserve, restoring native plants for koala habitat, installation of koala exclusion fencing to protect koalas from urban interfaces and establishment of biodiversity stewardship agreements on up to 540 hectares of conservation lands in the Greater Macarthur Growth Area
$16.5 million ($69.3 million grant expenses over four years) to deliver the Roads to Home Program, which will provide planning and infrastructure upgrades to up to seven further Aboriginal communities, in addition to the original 10 communities
$14.8 million over four years to build a more efficient and certain infrastructure contributions system, with the NSW Productivity Commission due to provide specific recommendations to Government in late 2020
$5.6 million for the Companion Animals Fund to support councils to deliver services related to pet cats and dogs including pounds/shelters, ranger services, dog exercise areas, education and awareness programs.
Key performance insights
This section provides analysis and insights on key Outcome Indicators for this State Outcome.
Ensure 17 per cent reduction in State significant development assessment times from 120 to 100 days by June 2023 (except projects subject to an Independent Planning Commission hearing)
Performance against this indicator has been challenging. However, in 2020 the Department of Planning, Industry and Environment is introducing bold reforms to create a more timely, certain and transparent planning system for New South Wales.
Timely assessment of development proposals, under the Environmental Planning & Assessment Act 1979 delivers benefits for the people of New South Wales, including increased investment in infrastructure, additional jobs, more housing and growth in resources. These are significant contributors to the economic prosperity of the State.
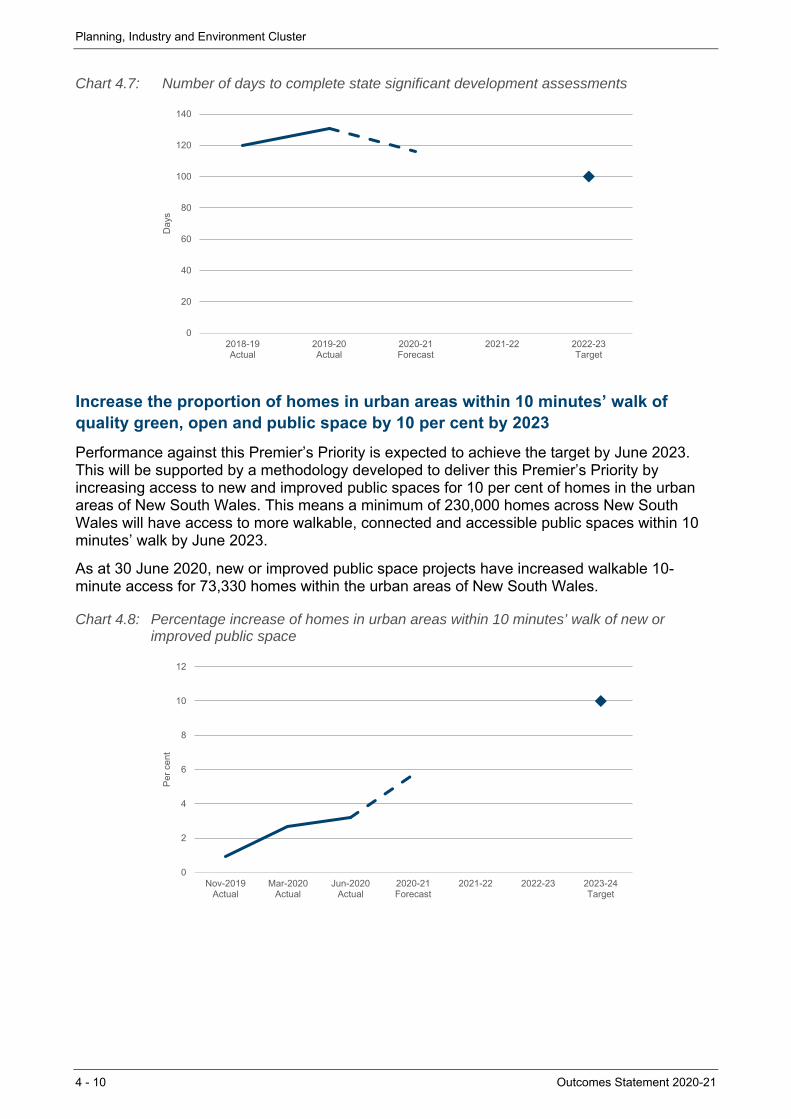
Planning, Industry and Environment Cluster
4 - 10 Outcomes Statement 2020-21
Chart 4.7: Number of days to complete state significant development assessments
Increase the proportion of homes in urban areas within 10 minutes’ walk of quality green, open and public space by 10 per cent by 2023
Performance against this Premier’s Priority is expected to achieve the target by June 2023. This will be supported by a methodology developed to deliver this Premier’s Priority by increasing access to new and improved public spaces for 10 per cent of homes in the urban areas of New South Wales. This means a minimum of 230,000 homes across New South Wales will have access to more walkable, connected and accessible public spaces within 10 minutes’ walk by June 2023.
As at 30 June 2020, new or improved public space projects have increased walkable 10-minute access for 73,330 homes within the urban areas of New South Wales.
Chart 4.8: Percentage increase of homes in urban areas within 10 minutes’ walk of new or improved public space
0
20
40
60
80
100
120
140
2018-19Actual
2019-20Actual
2020-21Forecast
2021-22 2022-23Target
Day
s
0
2
4
6
8
10
12
Nov-2019Actual
Mar-2020Actual
Jun-2020Actual
2020-21Forecast
2021-22 2022-23 2023-24Target
Per
cen
t
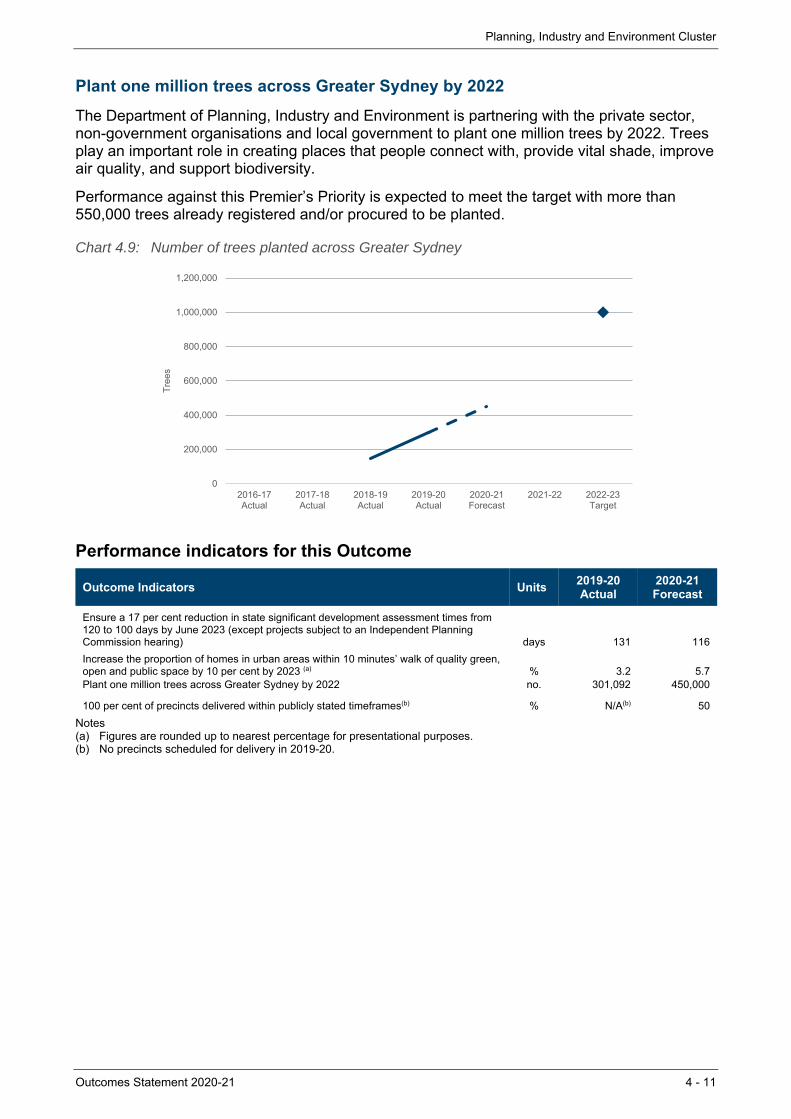
Planning, Industry and Environment Cluster
Outcomes Statement 2020-21 4 - 11
Plant one million trees across Greater Sydney by 2022
The Department of Planning, Industry and Environment is partnering with the private sector, non-government organisations and local government to plant one million trees by 2022. Trees play an important role in creating places that people connect with, provide vital shade, improve air quality, and support biodiversity.
Performance against this Premier’s Priority is expected to meet the target with more than 550,000 trees already registered and/or procured to be planted.
Chart 4.9: Number of trees planted across Greater Sydney
Performance indicators for this Outcome
Outcome Indicators Units 2019-20 2020-21Actual Forecast
Ensure a 17 per cent reduction in state significant development assessment times from 120 to 100 days by June 2023 (except projects subject to an Independent Planning Commission hearing) days 131 116
Increase the proportion of homes in urban areas within 10 minutes’ walk of quality green, open and public space by 10 per cent by 2023 (a) % 3.2 5.7Plant one million trees across Greater Sydney by 2022 no. 301,092 450,000
100 per cent of precincts delivered within publicly stated timeframes(b) % N/A(b) 50
Notes (a) Figures are rounded up to nearest percentage for presentational purposes. (b) No precincts scheduled for delivery in 2019-20.
0
200,000
400,000
600,000
800,000
1,000,000
1,200,000
2016-17Actual
2017-18Actual
2018-19Actual
2019-20Actual
2020-21Forecast
2021-22 2022-23Target
Tre
es
Planning, Industry and Environment Cluster
4 - 12 Outcomes Statement 2020-21
4.5 Outcome 3: Maximise community benefit from government land and property
State Outcome overview and 2020-21 investment
Delivering a coordinated, strategic approach to the use of government-owned property to maximise community benefits by delivering quality public spaces and diverse housing outcomes.
The State Outcome comprises activities aimed at improving asset management; the development of new, and maintenance of existing, social housing; the management of Crown land; the increase of supply of housing for Aboriginal communities; and improvements to public spaces and parklands.
Delivery is shared by the Department of Planning, Industry and Environment, Land and Housing Corporation, Aboriginal Housing Office, Property NSW, Royal Botanic Gardens and Domain Trust, Centennial and Moore Park Trust and Western Sydney Parklands Trust.
2020-21 State Outcome Budget highlights
In 2020-21, the Planning, Industry and Environment Cluster will invest $2.5 billion ($2.0 billion recurrent expenses and $499.2 million capital expenditure) in this Outcome, including:
$225.8 million ($591.6 million expenses and $146.7 million capital over four years) for Sydney Olympic Park Authority to enhance the Sydney 2000 Olympic precinct and create a vibrant, sustainable community within an unrivalled destination for sport, entertainment, recreation and business, including an additional $81.4 million for Stadium Australia maintenance and upgrades for major events including the 2023 FIFA Women’s World Cup
$182.9 million ($400.0 million expenses over three years) for the construction and acceleration of new social housing properties across New South Wales by the Land and Housing Corporation
$176.4 million ($162.5 million expenses and $93.5 million capital over two years) to create better public and open spaces and improve government infrastructure to support services. Key initiatives over the next two years include:
– $104.0 million to upgrade showgrounds, public reserves and Men’s Shed facilities to support local communities across New South Wales
– $60.8 million to upgrade accommodation for front line workers in rural and remote communities, and upgrade government service locations throughout the State
– $39.5 million to improve access to high quality nature-based experiences by upgrading National Parks’ infrastructure, access roads and carparks, and reduce pests and weeds
– $36.1 million to enhance parklands and gardens, protect major heritage assets and support participation in sport and cultural activities in the Royal Botanic Gardens, Domain, Centennial Park and Moore Park
– $15.7 million to increase participation in sport and cultural activities, and improve visitor experiences at Sydney Olympic Park facilities
$110.0 million ($200.0 million expenses over two years) for upgrades and maintenance to social housing properties, including properties managed by Community Housing Providers,
$2.0 billion
Recurrent Expenses 2020-21
$499.2 million
Capital Expenditure2020-21

Planning, Industry and Environment Cluster
Outcomes Statement 2020-21 4 - 13
to improve the quality, comfort and safety of housing for tenants and provide jobs for NSW workers
$96.4 million ($164.7 million expenses and $97.2 million capital over four years) for improvements to the Greater Sydney Parklands including: developing the Western Sydney parklands into a multi-use urban parkland that provides a diverse range of recreational, entertainment and tourist facilities; and improving Centennial Park and Moore Park trust lands to increase public use and enhance recreational, cultural and environmental value of the parklands
$69.4 million ($110.9 million expenses and $82.3 million capital over four years) for improvements to the Royal Botanic Gardens and Domain Trust including: improvements to the Australian Institute of Botanical Science facilities, and delivering a new botanical facility in Western Sydney to ensure the security of plant specimens essential for conservation, bushfire regeneration and ongoing management of the natural environment
$36.4 million ($127.9 million capital expenditure over four years) for new Aboriginal social and community housing, upgrades and maintenance works, including roof restorations/replacements, recladding, solar power installations, drought relief hydro panels, climate resilient housing works and air conditioning
$20.0 million ($80.0 million expenses over four years) for 300 new housing sector pre-apprenticeships, apprenticeships and cadetships to provide career pathways for young people and social housing tenants.
Key performance insights
This section provides analysis and insights on key Outcome Indicators for this State Outcome.
Number of additional and upgraded homes that have commenced construction in priority communities
The NSW Government is investing in social and affordable housing for priority communities in New South Wales to deliver diverse housing options where it is needed most leveraging government land and property.
Performance against this indicator is currently exceeding the 2020-21 target. 714 additional and upgraded homes commenced construction in priority communities in 2019-20, with a further 682 planned for 2020-21.

Planning, Industry and Environment Cluster
4 - 14 Outcomes Statement 2020-21
Chart 4.10: Number of additional/upgraded homes that have commenced construction in priority communities
Note: A 2020-21 forecast is provided as well as the 2020-21 target.
Percentage of entities in the DPIE Housing and Property group that are compliant with TPP19-07 NSW Asset Management Policy by 2024
The objective of the Asset Management Policy for the NSW Public Sector is to achieve a consistent and improved approach to asset planning and delivery. The indicator demonstrates to the people of New South Wales that the Government is continuously monitoring the performance and condition of its assets, increasing public accountability, and seeking to obtain better value from public funds. This is a new indicator with full compliance required by June 2024.
Performance indicators for this Outcome
Outcome Indicators Units 2019-20 2020-21Actual Forecast
Number of additional/upgraded homes that have commenced construction in priority communities no. 714.0 682.0
Number of reviews completed on NSW Government land and property in strategic precincts and/or portfolios no. 4.0 5.0
0
100
200
300
400
500
600
700
800
Sep-2019Actual
Dec-2019Actual
Mar-2020Actual
Jun-2020Actual
2020-21Forecast/Target
Hom
es
Planning, Industry and Environment Cluster
Outcomes Statement 2020-21 4 - 15
4.6 Outcome 4: Sustainable, secure and healthy water resources and services
State Outcome overview and 2020-21 investment
Providing confidence to communities and stakeholders through the transparent stewardship of water resources, and provision of services and reforms that support sustainable and healthy environments, economies and societies across New South Wales.
The State Outcome comprises activities aimed at improving water sustainability, access to and the health of water, improving water regulation, and increasing the safety of NSW dams.
Responsibility for delivery of this State Outcome is shared by the Department of Planning, Industry and Environment (Water Group) and the Natural Resources Access Regulator.
2020-21 State Outcome Budget highlights
In 2020-21, the Planning, Industry and Environment Cluster will invest $713.1 million ($698.4 million recurrent expenses and $14.7 million capital expenditure) in this Outcome, including:
$188.5 million ($754.5 million expenses over four years) for water rebates to low income households to assist with cost of living
$122.0 million ($139.6 million over four years) to continue commitments for drought relief including:
– $58.4 million for critical drought infrastructure
– $38.0 million for accelerated ground water assessments and rebates for licence holders
– $18.5 million for emergency water carting and infrastructure to ensure critical regional town water supply
– $7.1 million for business and household water saving and resourcing
$44.9 million ($61.6 million over two years) for the regional water stimulus program delivering urgent water infrastructure to improve water supply management, water security and supplementary supply via stormwater harvesting
$35.3 million ($231.2 million over four years) under the Safe and Secure Water Program for critical local water infrastructure to maintain town water supply
$30.3 million ($80.1 million over four years) to deliver investigation and enforcement of suspicious activities and alleged breaches to water regulation in New South Wales and manage dam safety.
$698.4 million
Recurrent Expenses 2020-21
$14.7 million
Capital Expenditure2020-21

Planning, Industry and Environment Cluster
4 - 16 Outcomes Statement 2020-21
Key performance insights
This section provides analysis and insights on key Outcome Indicators for this State Outcome.
Gigalitres saved, offset or brought into an improved framework as a result of investment in water efficiency projects
This indicator validates the investment in water efficiency projects and demonstrates that water initiatives are effective in ensuring sustainable and secure water resources across NSW. The important outcomes of this investment include sustainable management of groundwater resources and an increased resilience in times of drought. The persistent drought conditions through the majority of 2019–20 and the COVID-19 pandemic both presented challenges in delivering secure and healthy water resources to the State.
Performance against this indicator is now on track to achieve the targeted 800 million litres saved for the year. This builds on the successful planning phase undertaken in 2019-20, which included assessing groundwater bores for capping, site surveys, conceptual designs and procurement strategies. Future water savings are forecast to increase towards the targeted four billion litres saved by June 2023.
Chart 4.11: Gigalitres saved, offset or brought into an improved framework as a result of investment in water efficiency projects
Proportion of water strategy actions implemented across New South Wales
This indicator demonstrates that the NSW Government is ensuring efficient use of resources and planning for future water security for both regional and metropolitan New South Wales. It tracks the number of water strategies completed and the progress of water strategy action investment across New South Wales to enable greater sustainability and the security and health of water resources.
The Greater Hunter Regional Strategy was completed in 2018 and is now being implemented. The draft Regional Water Strategies for the Lachlan, Macquarie, Gwydir, Border Rivers, Far North Coast and South Coast are on public exhibition as of 30 October 2020. The remaining Regional Water Strategies are scheduled for public consultation over the coming months and into 2021.
0
0.5
1
1.5
2
2.5
3
3.5
4
4.5
2016-17Actual
2017-18Actual
2018-19Actual
2019-20Actual
2020-21Forecast
2021-22 2022-23Target
Gig
alitt
res
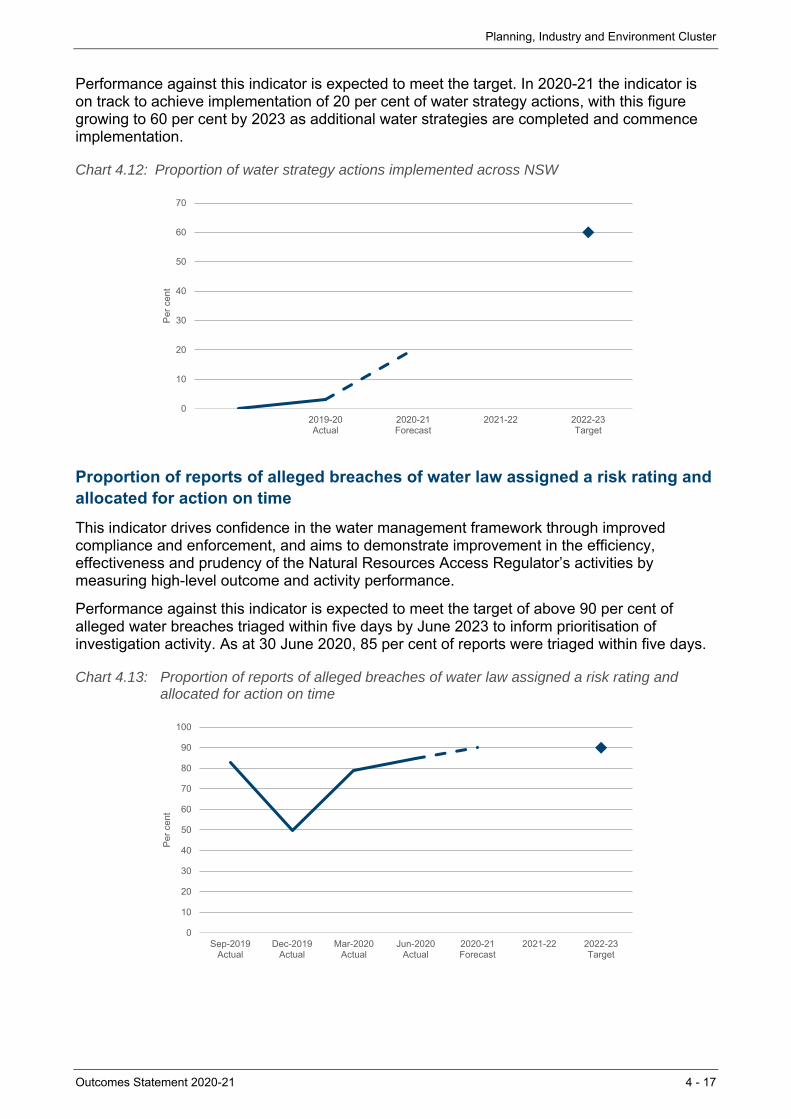
Planning, Industry and Environment Cluster
Outcomes Statement 2020-21 4 - 17
Performance against this indicator is expected to meet the target. In 2020-21 the indicator is on track to achieve implementation of 20 per cent of water strategy actions, with this figure growing to 60 per cent by 2023 as additional water strategies are completed and commence implementation.
Chart 4.12: Proportion of water strategy actions implemented across NSW
Proportion of reports of alleged breaches of water law assigned a risk rating and allocated for action on time
This indicator drives confidence in the water management framework through improved compliance and enforcement, and aims to demonstrate improvement in the efficiency, effectiveness and prudency of the Natural Resources Access Regulator’s activities by measuring high-level outcome and activity performance.
Performance against this indicator is expected to meet the target of above 90 per cent of alleged water breaches triaged within five days by June 2023 to inform prioritisation of investigation activity. As at 30 June 2020, 85 per cent of reports were triaged within five days.
Chart 4.13: Proportion of reports of alleged breaches of water law assigned a risk rating and allocated for action on time
0
10
20
30
40
50
60
70
2019-20Actual
2020-21Forecast
2021-22 2022-23Target
Per
cen
t
0
10
20
30
40
50
60
70
80
90
100
Sep-2019Actual
Dec-2019Actual
Mar-2020Actual
Jun-2020Actual
2020-21Forecast
2021-22 2022-23Target
Per
cen
t
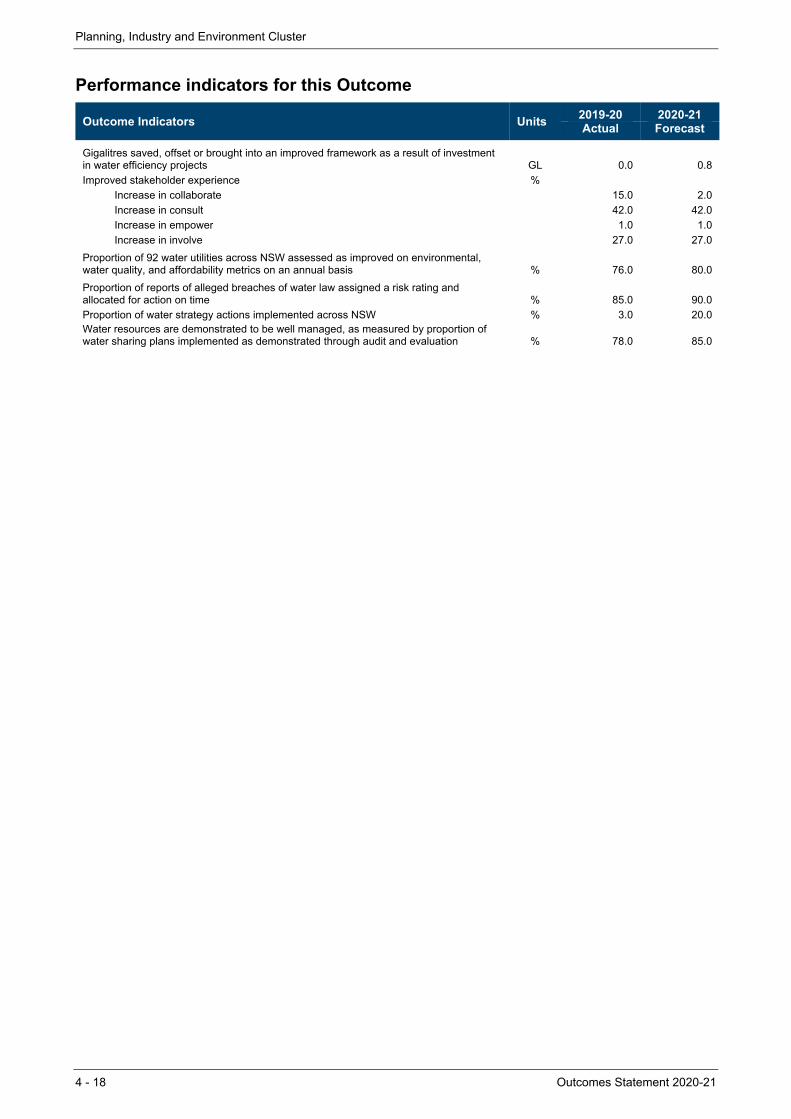
Planning, Industry and Environment Cluster
4 - 18 Outcomes Statement 2020-21
Performance indicators for this Outcome
Outcome Indicators Units 2019-20 2020-21Actual Forecast
Gigalitres saved, offset or brought into an improved framework as a result of investment in water efficiency projects GL 0.0 0.8
Improved stakeholder experience % Increase in collaborate 15.0 2.0
Increase in consult 42.0 42.0
Increase in empower 1.0 1.0
Increase in involve 27.0 27.0
Proportion of 92 water utilities across NSW assessed as improved on environmental, water quality, and affordability metrics on an annual basis % 76.0 80.0
Proportion of reports of alleged breaches of water law assigned a risk rating and allocated for action on time % 85.0 90.0
Proportion of water strategy actions implemented across NSW % 3.0 20.0Water resources are demonstrated to be well managed, as measured by proportion of water sharing plans implemented as demonstrated through audit and evaluation % 78.0 85.0
Outcomes Statement 2020-21 5 - 1
5. PREMIER AND CABINET CLUSTER
5.1 Introduction
The Premier and Cabinet Cluster works for the people of New South Wales by supporting the Premier and the Cabinet to deliver the government’s objectives. It also delivers a diverse range of Outcomes including infrastructure, long-term planning, commercial deals for major developments and precincts, preparedness for disaster and incident recovery, brings the voice of Aboriginal people into policy making, supports arts and culture, protects and preserves the State’s heritage, delivers policy and services, and facilitates stewardship of the public service.
State Outcomes delivered by Premier and Cabinet Cluster
State Outcomes What the Cluster is delivering for people and
business
Example Programs(a) underway to support delivery of Outcomes
1. Effective and coordinated government
Supporting the Cluster’s strategic direction, coordination, assurance and project delivery role across government.
2020-21 investment: $1.9 billion recurrent expenses & $715.9 million capital expenditure
Infrastructure Development Project management and delivery Disaster recovery and building future
community resilience Coordinate, prioritise and undertake
long-term planning of infrastructure
2. Excellence in arts, culture and heritage
Maximising ‘excellence in arts, culture and heritage’ leverages New South Wales’ capabilities, positioning the State as a world-class centre for performances, events, exhibitions and cultural visitation, and developing state cultural assets for future generations. Acknowledging that arts, screen, heritage and culture play a critical role in the State’s economy, from skills development and job creation to attracting tourists.
2020-21 investment: $739.7 million recurrent expenses & $757.4 million capital expenditure
Maintain World Heritage and other heritage listed sites
Collect, conserve and maintain cultural assets
Engage and exhibit Support the arts and culture industry sector Educate and inspire
3. Empowering Aboriginal communities
Empowering Aboriginal communities leads to a transformed relationship between Aboriginal peoples and government, as well as supporting the delivery of policies and practices that support Aboriginal peoples’ right to self-determination.
2020-21 investment: $60.0 million recurrent expenses & $0.1 million capital expenditure
OCHRE (Opportunity, Choice, Healing, Responsibility and Empowerment)
Stolen Generations Reparations Scheme Aboriginal Economic Prosperity Framework NSW Jurisdictional plan to Close the Gap Land and Aboriginal cultural heritage reform
$3.0 billion
Recurrent Expenses 2020-21
$1.5 billion
Capital Expenditure2020-21
Premier and Cabinet Cluster
5 - 2 Outcomes Statement 2020-21
State Outcomes What the Cluster is delivering for people and
business
Example Programs(a) underway to support delivery of Outcomes
4. Accountable and responsible government
Supporting good government decision-making and upholding government integrity.
2020-21 investment: $343.2 million recurrent expenses & $17.7 million capital expenditure
Statutory compliance of integrity agencies and independent entities
Oversight and monitoring Training and prevention Conduct, regulate and report on elections
(a) Note that Programs are being further refined as the outcome and performance framework continues to mature.
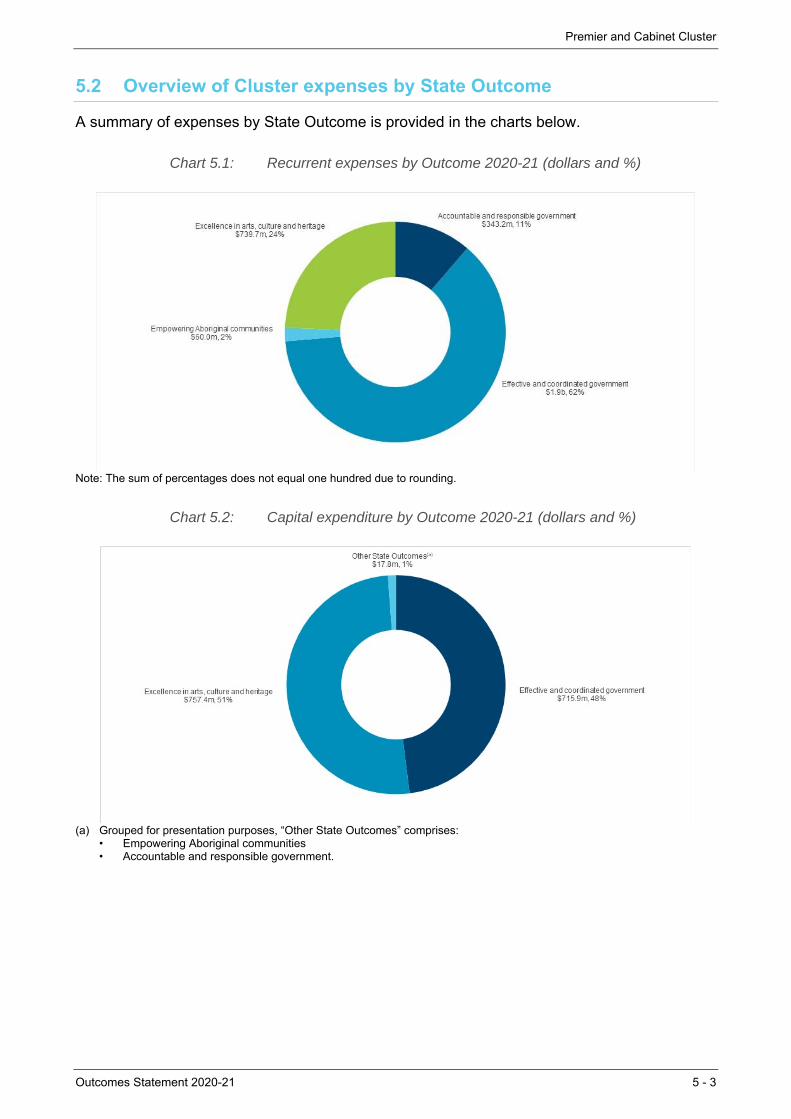
Premier and Cabinet Cluster
Outcomes Statement 2020-21 5 - 3
5.2 Overview of Cluster expenses by State Outcome
A summary of expenses by State Outcome is provided in the charts below.
Chart 5.1: Recurrent expenses by Outcome 2020-21 (dollars and %)
Note: The sum of percentages does not equal one hundred due to rounding.
Chart 5.2: Capital expenditure by Outcome 2020-21 (dollars and %)
(a) Grouped for presentation purposes, “Other State Outcomes” comprises:
• Empowering Aboriginal communities • Accountable and responsible government.
Premier and Cabinet Cluster
5 - 4 Outcomes Statement 2020-21
5.3 Outcome 1: Effective and coordinated government
State Outcome overview and 2020-21 investment
This Outcome accounts for the Cluster’s strategic direction, coordination, assurance and project delivery role across government.
2020-21 State Outcome Budget highlights
In 2020-21, the Premier and Cabinet Cluster will invest $2.6 billion ($1.9 billion recurrent expenses and $715.9 million capital expenditure) in this Outcome, including:
$1.2 billion ($1.8 billion expenses and $1.6 billion capital over four years) for Infrastructure NSW (INSW) in continued investment to support major infrastructure. INSW is currently responsible for delivering three major infrastructure projects for New South Wales with total expenditure of $2.5 billion:
– $828.0 million for the Sydney Football Stadium Redevelopment
– $750.0 million for the new Sydney Fish Markets
– $389.6 million total remaining cost in developing the Barangaroo precinct
$131.6 million ($453.6 million expenses and $102.2 million capital expenditure over four years) for Resilience NSW, created on 1 May 2020, to coordinate and oversee disaster management, disaster recovery and building community resilience to future disasters in the State of New South Wales. Resilience NSW is responsible for funding elements of the State’s recovery from the 2019-20 bushfires including:
– $865.0 million expenditure in 2020-21 in disaster relief funding as part of the recovery effort associated with the unprecedented 2019-20 bushfire crisis
$15.6 million expenditure to lead projects that create jobs and drive investment in key precincts, including:
– Atlassian head office development at Tech Central
– new Sydney University campus at the Westmead Health and Innovation District
– Harbourside shopping centre redevelopment at Pyrmont Peninsula
– Entertainment Quarter redevelopment at Moore Park.
$1.9 billion
Recurrent Expenses 2020-21
$715.9 million
Capital Expenditure2020-21
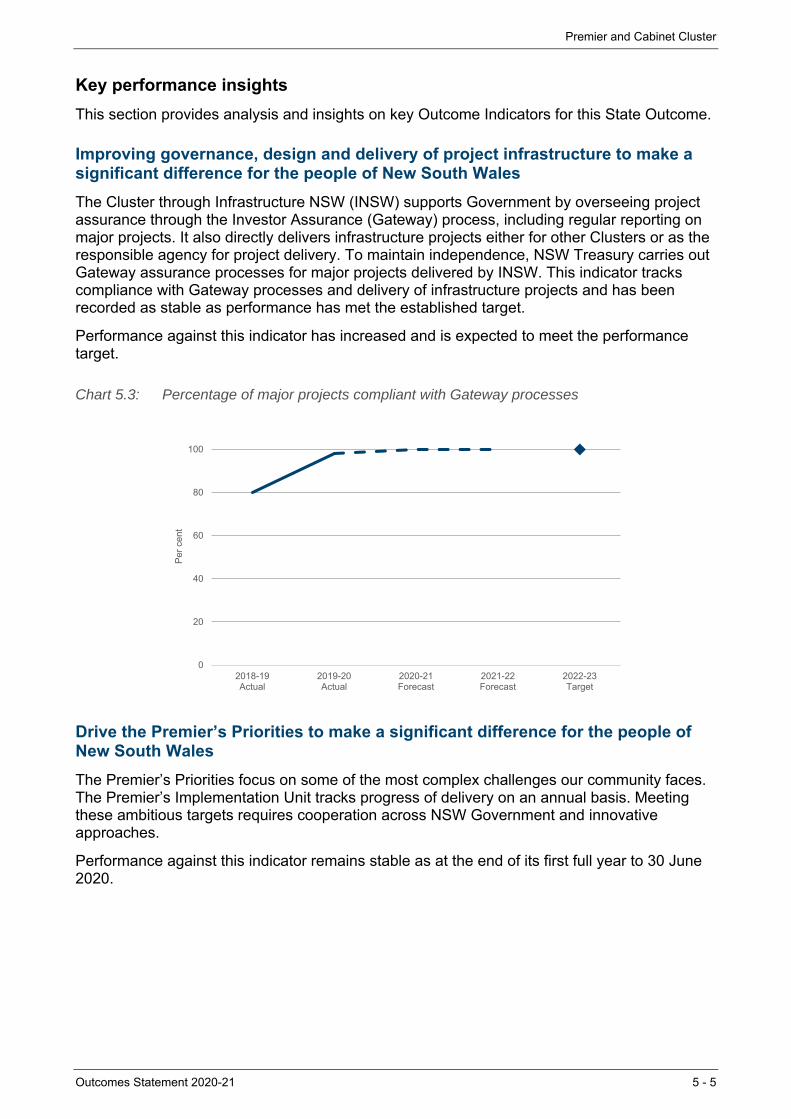
Premier and Cabinet Cluster
Outcomes Statement 2020-21 5 - 5
Key performance insights
This section provides analysis and insights on key Outcome Indicators for this State Outcome.
Improving governance, design and delivery of project infrastructure to make a significant difference for the people of New South Wales
The Cluster through Infrastructure NSW (INSW) supports Government by overseeing project assurance through the Investor Assurance (Gateway) process, including regular reporting on major projects. It also directly delivers infrastructure projects either for other Clusters or as the responsible agency for project delivery. To maintain independence, NSW Treasury carries out Gateway assurance processes for major projects delivered by INSW. This indicator tracks compliance with Gateway processes and delivery of infrastructure projects and has been recorded as stable as performance has met the established target.
Performance against this indicator has increased and is expected to meet the performance target.
Chart 5.3: Percentage of major projects compliant with Gateway processes
Drive the Premier’s Priorities to make a significant difference for the people of New South Wales
The Premier’s Priorities focus on some of the most complex challenges our community faces. The Premier’s Implementation Unit tracks progress of delivery on an annual basis. Meeting these ambitious targets requires cooperation across NSW Government and innovative approaches.
Performance against this indicator remains stable as at the end of its first full year to 30 June 2020.
0
20
40
60
80
100
2018-19Actual
2019-20Actual
2020-21Forecast
2021-22Forecast
2022-23Target
Per
cen
t
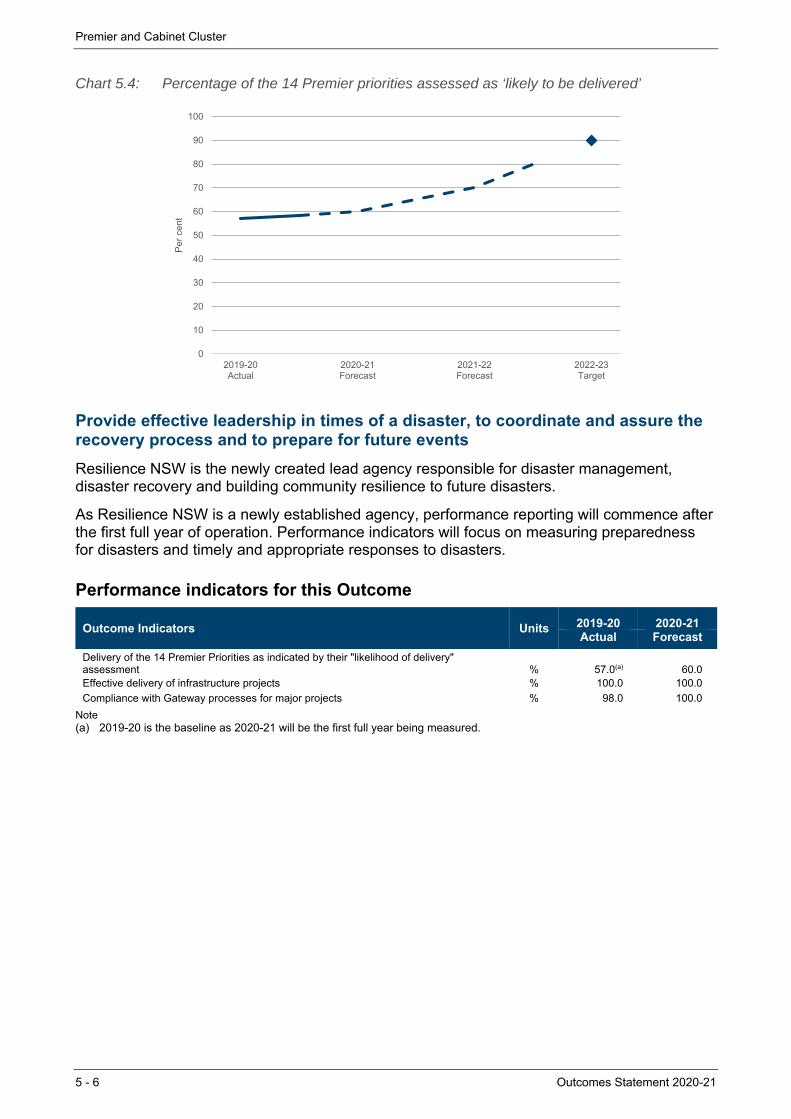
Premier and Cabinet Cluster
5 - 6 Outcomes Statement 2020-21
Chart 5.4: Percentage of the 14 Premier priorities assessed as ‘likely to be delivered’
Provide effective leadership in times of a disaster, to coordinate and assure the recovery process and to prepare for future events
Resilience NSW is the newly created lead agency responsible for disaster management, disaster recovery and building community resilience to future disasters.
As Resilience NSW is a newly established agency, performance reporting will commence after the first full year of operation. Performance indicators will focus on measuring preparedness for disasters and timely and appropriate responses to disasters.
Performance indicators for this Outcome
Outcome Indicators Units 2019-20 2020-21Actual Forecast
Delivery of the 14 Premier Priorities as indicated by their "likelihood of delivery" assessment % 57.0(a) 60.0Effective delivery of infrastructure projects % 100.0 100.0
Compliance with Gateway processes for major projects % 98.0 100.0
Note (a) 2019-20 is the baseline as 2020-21 will be the first full year being measured.
0
10
20
30
40
50
60
70
80
90
100
2019-20Actual
2020-21Forecast
2021-22Forecast
2022-23Target
Per
cen
t
Premier and Cabinet Cluster
Outcomes Statement 2020-21 5 - 7
5.4 Outcome 2: Excellence in arts, culture and heritage
State Outcome overview and 2020-21 investment
Arts, screen, heritage and culture play a critical role in the State’s economy, from skills development and job creation to attracting cultural tourists. Maximising ‘excellence in arts, culture and heritage’ will leverage New South Wales’ current capabilities, further position the State as a world-class centre for performances, events, exhibitions and cultural visitation, as well as the development of new state cultural assets for future generations.
2020-21 State Outcome Budget highlights
In 2020-21, the Premier and Cabinet Cluster will invest $1.5 billion ($739.7 million recurrent expenses and $757.4 million capital expenditure) in this Outcome, including:
$840.0 million total government contribution for the creation of a new Powerhouse site at Parramatta along with expanded storage at the Museum Discovery Centre
$66.0 million ($1.0 million in expenses and $103.5 million in capital expenditure over two years) for an Arts Maintenance and Upgrade Fund to both stimulate jobs and the economy through improving accessibility, sustainability and functionality of our cultural assets. The COVID-19 pandemic has led to an ideal opportunity to address critical maintenance and deliver upgrades to maintain the quality and heritage of New South Wales’ cultural infrastructure with limited disruption to building operations
$50.0 million the Arts Rescue and Restart package for NSW arts and cultural organisations to ensure the sector continues to make an important contribution to the NSW economy during and after the COVID-19 pandemic
$35.0 million ($175.0 million in expenses over five years) expansion for ‘Made in NSW’ Film Industry support
$21.8 million ($0.8 million in expenses and $23.5 million in capital expenditure remaining over two years) for Australian Museum to complete the Project Discover transformation with the principal elements opening to the public on 28 November 2020
$3.3 million ($2.1 million in expenses and $12.3 million capital over four years) for upgrades to the State Library of NSW to both stimulate jobs along with improving accessibility and functionality of the State Library of NSW.
$739.7 million
Recurrent Expenses 2020-21
$757.4 million
Capital Expenditure2020-21
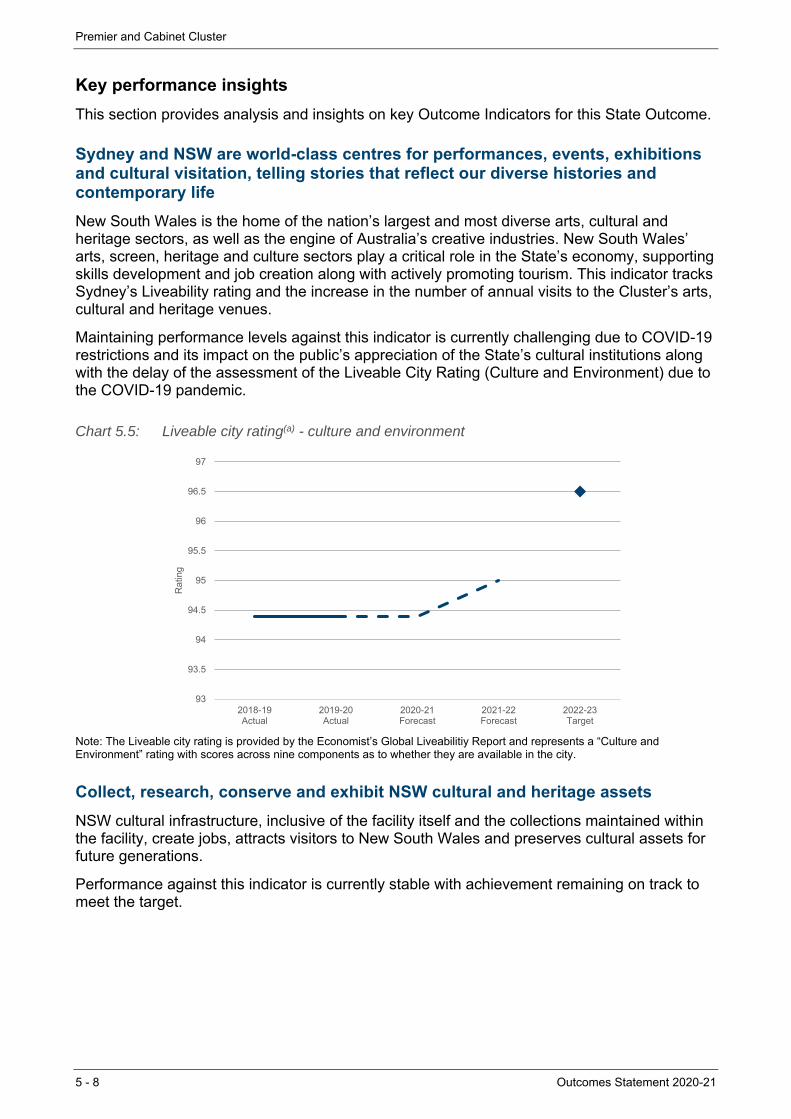
Premier and Cabinet Cluster
5 - 8 Outcomes Statement 2020-21
Key performance insights
This section provides analysis and insights on key Outcome Indicators for this State Outcome.
Sydney and NSW are world-class centres for performances, events, exhibitions and cultural visitation, telling stories that reflect our diverse histories and contemporary life
New South Wales is the home of the nation’s largest and most diverse arts, cultural and heritage sectors, as well as the engine of Australia’s creative industries. New South Wales’ arts, screen, heritage and culture sectors play a critical role in the State’s economy, supporting skills development and job creation along with actively promoting tourism. This indicator tracks Sydney’s Liveability rating and the increase in the number of annual visits to the Cluster’s arts, cultural and heritage venues.
Maintaining performance levels against this indicator is currently challenging due to COVID-19 restrictions and its impact on the public’s appreciation of the State’s cultural institutions along with the delay of the assessment of the Liveable City Rating (Culture and Environment) due to the COVID-19 pandemic.
Chart 5.5: Liveable city rating(a) - culture and environment
Note: The Liveable city rating is provided by the Economist’s Global Liveabilitiy Report and represents a “Culture and Environment” rating with scores across nine components as to whether they are available in the city.
Collect, research, conserve and exhibit NSW cultural and heritage assets
NSW cultural infrastructure, inclusive of the facility itself and the collections maintained within the facility, create jobs, attracts visitors to New South Wales and preserves cultural assets for future generations.
Performance against this indicator is currently stable with achievement remaining on track to meet the target.
93
93.5
94
94.5
95
95.5
96
96.5
97
2018-19Actual
2019-20Actual
2020-21Forecast
2021-22Forecast
2022-23Target
Rat
ing
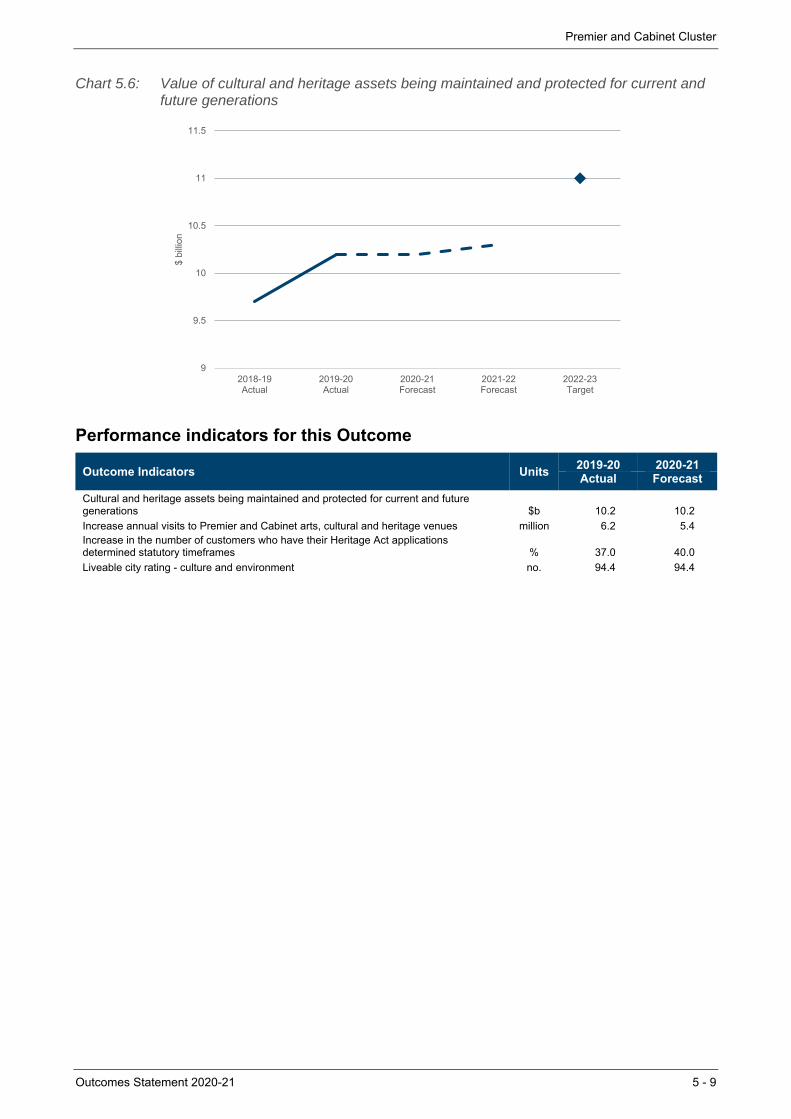
Premier and Cabinet Cluster
Outcomes Statement 2020-21 5 - 9
Chart 5.6: Value of cultural and heritage assets being maintained and protected for current and future generations
Performance indicators for this Outcome
Outcome Indicators Units 2019-20 2020-21Actual Forecast
Cultural and heritage assets being maintained and protected for current and future generations $b 10.2 10.2
Increase annual visits to Premier and Cabinet arts, cultural and heritage venues million 6.2 5.4Increase in the number of customers who have their Heritage Act applications determined statutory timeframes % 37.0 40.0
Liveable city rating - culture and environment no. 94.4 94.4
9
9.5
10
10.5
11
11.5
2018-19Actual
2019-20Actual
2020-21Forecast
2021-22Forecast
2022-23Target
$ bi
llion
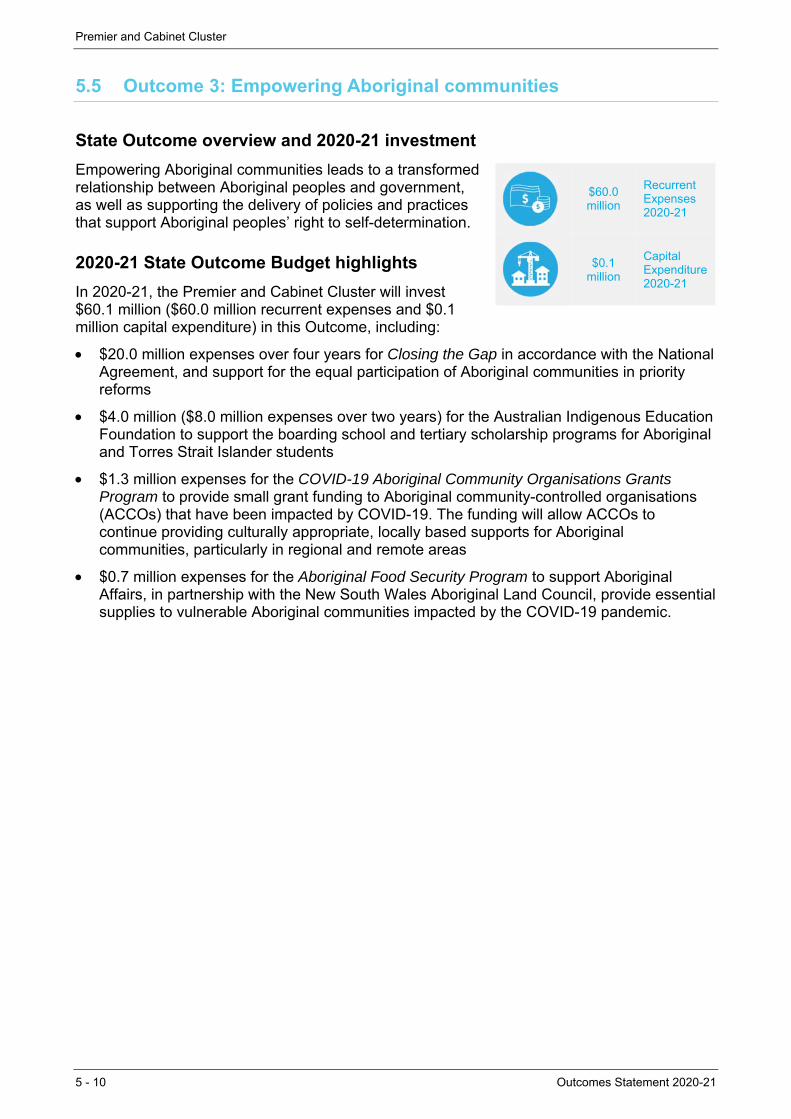
Premier and Cabinet Cluster
5 - 10 Outcomes Statement 2020-21
5.5 Outcome 3: Empowering Aboriginal communities
State Outcome overview and 2020-21 investment
Empowering Aboriginal communities leads to a transformed relationship between Aboriginal peoples and government, as well as supporting the delivery of policies and practices that support Aboriginal peoples’ right to self-determination.
2020-21 State Outcome Budget highlights
In 2020-21, the Premier and Cabinet Cluster will invest $60.1 million ($60.0 million recurrent expenses and $0.1 million capital expenditure) in this Outcome, including:
$20.0 million expenses over four years for Closing the Gap in accordance with the National Agreement, and support for the equal participation of Aboriginal communities in priority reforms
$4.0 million ($8.0 million expenses over two years) for the Australian Indigenous Education Foundation to support the boarding school and tertiary scholarship programs for Aboriginal and Torres Strait Islander students
$1.3 million expenses for the COVID-19 Aboriginal Community Organisations Grants Program to provide small grant funding to Aboriginal community-controlled organisations (ACCOs) that have been impacted by COVID-19. The funding will allow ACCOs to continue providing culturally appropriate, locally based supports for Aboriginal communities, particularly in regional and remote areas
$0.7 million expenses for the Aboriginal Food Security Program to support Aboriginal Affairs, in partnership with the New South Wales Aboriginal Land Council, provide essential supplies to vulnerable Aboriginal communities impacted by the COVID-19 pandemic.
$60.0 million
Recurrent Expenses 2020-21
$0.1 million
Capital Expenditure2020-21
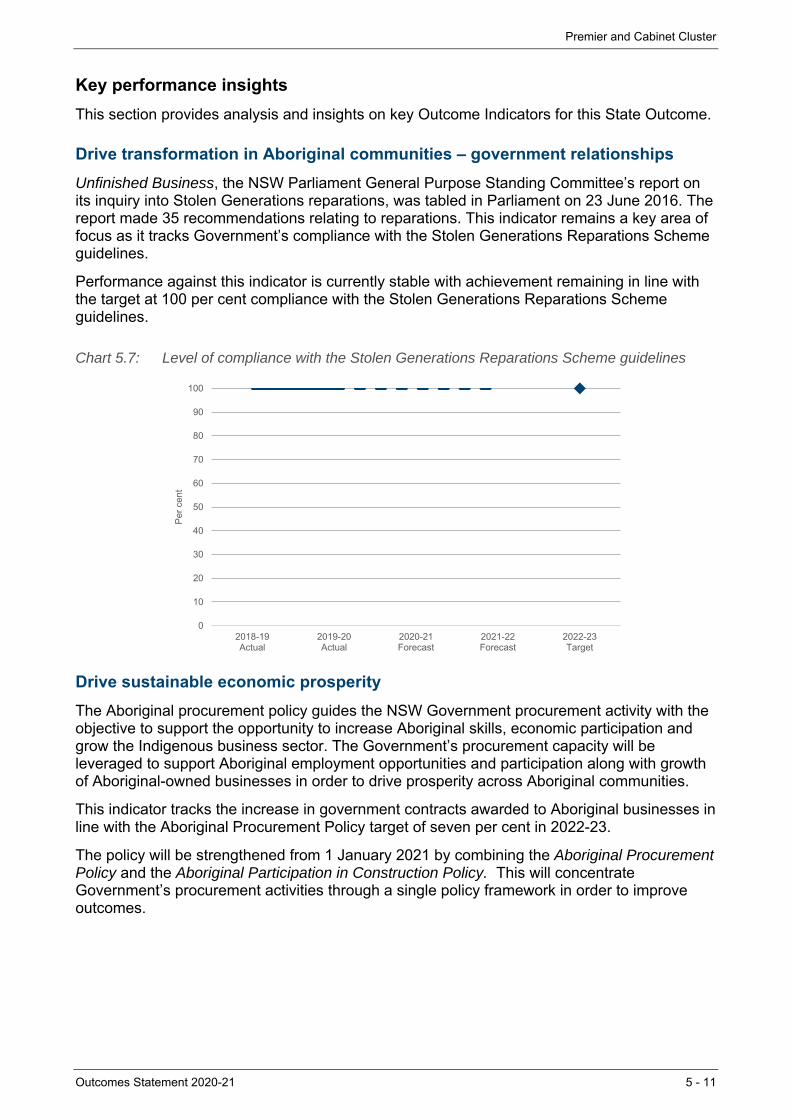
Premier and Cabinet Cluster
Outcomes Statement 2020-21 5 - 11
Key performance insights
This section provides analysis and insights on key Outcome Indicators for this State Outcome.
Drive transformation in Aboriginal communities – government relationships
Unfinished Business, the NSW Parliament General Purpose Standing Committee’s report on its inquiry into Stolen Generations reparations, was tabled in Parliament on 23 June 2016. The report made 35 recommendations relating to reparations. This indicator remains a key area of focus as it tracks Government’s compliance with the Stolen Generations Reparations Scheme guidelines.
Performance against this indicator is currently stable with achievement remaining in line with the target at 100 per cent compliance with the Stolen Generations Reparations Scheme guidelines.
Chart 5.7: Level of compliance with the Stolen Generations Reparations Scheme guidelines
Drive sustainable economic prosperity
The Aboriginal procurement policy guides the NSW Government procurement activity with the objective to support the opportunity to increase Aboriginal skills, economic participation and grow the Indigenous business sector. The Government’s procurement capacity will be leveraged to support Aboriginal employment opportunities and participation along with growth of Aboriginal-owned businesses in order to drive prosperity across Aboriginal communities.
This indicator tracks the increase in government contracts awarded to Aboriginal businesses in line with the Aboriginal Procurement Policy target of seven per cent in 2022-23.
The policy will be strengthened from 1 January 2021 by combining the Aboriginal Procurement Policy and the Aboriginal Participation in Construction Policy. This will concentrate Government’s procurement activities through a single policy framework in order to improve outcomes.
0
10
20
30
40
50
60
70
80
90
100
2018-19Actual
2019-20Actual
2020-21Forecast
2021-22Forecast
2022-23Target
Per
cen
t
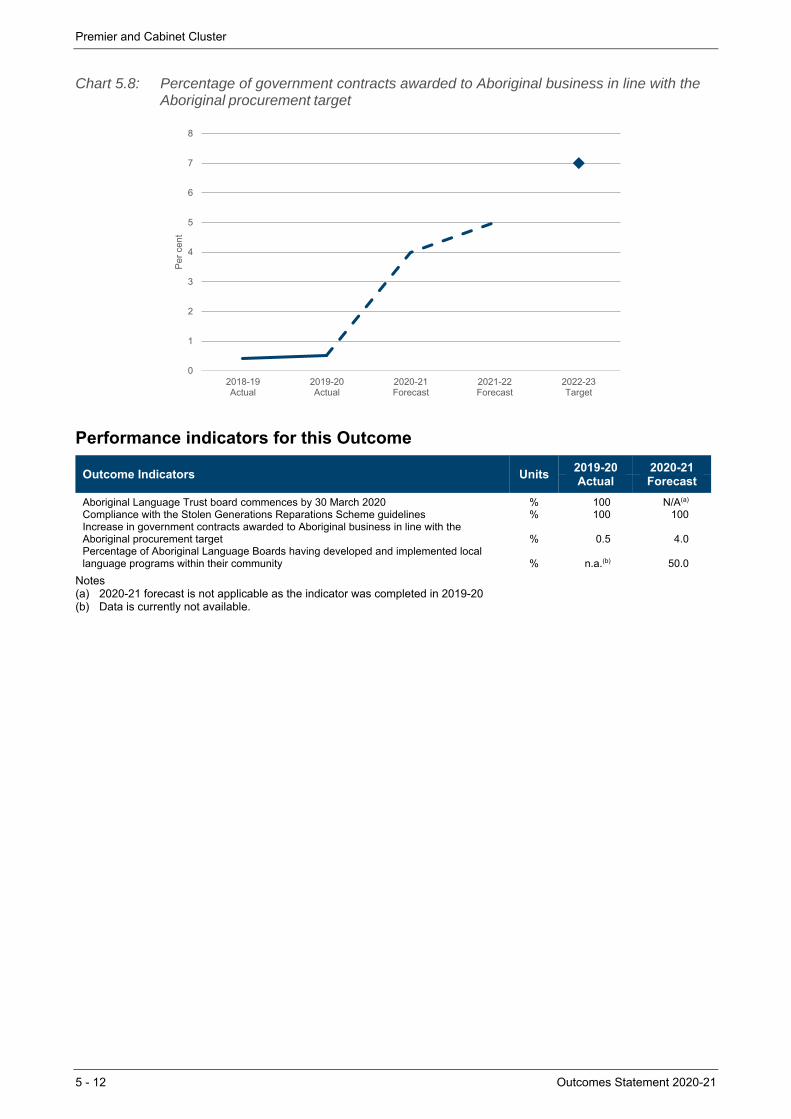
Premier and Cabinet Cluster
5 - 12 Outcomes Statement 2020-21
Chart 5.8: Percentage of government contracts awarded to Aboriginal business in line with the
Aboriginal procurement target
Performance indicators for this Outcome
Outcome Indicators Units 2019-20 2020-21Actual Forecast
Aboriginal Language Trust board commences by 30 March 2020 % 100 N/A(a)
Compliance with the Stolen Generations Reparations Scheme guidelines % 100 100Increase in government contracts awarded to Aboriginal business in line with the Aboriginal procurement target % 0.5 4.0Percentage of Aboriginal Language Boards having developed and implemented local language programs within their community % n.a.(b) 50.0
Notes (a) 2020-21 forecast is not applicable as the indicator was completed in 2019-20 (b) Data is currently not available.
0
1
2
3
4
5
6
7
8
2018-19Actual
2019-20Actual
2020-21Forecast
2021-22Forecast
2022-23Target
Per
cen
t
Premier and Cabinet Cluster
Outcomes Statement 2020-21 5 - 13
5.6 Outcome 4: Accountable and responsible government
State Outcome overview and 2020-21 investment
This Outcome accounts for the Cluster’s role in supporting good government decision-making and upholding government integrity.
2020-21 State Outcome Budget highlights
In 2020-21, the Premier and Cabinet Cluster will invest $360.9 million ($343.2 million recurrent expenses and $17.7 million capital expenditure) in this Outcome, including:
$168.2 million ($480.7 million expenses and $16.4 million capital over four years) for the New South Wales Electoral Commission to simplify, modernise and improve the conduct of elections and to increase regulation of Local Government election participants’ campaign finance, making it consistent with oversight of the State elections including:
– Up to $48.9 million reserved over two years to ensure COVID-19 safe local government elections can be held in September 2021
– $11.7 million ($5.2 million expenses and $6.5 million capital over four years) for funding of the Online Electoral Funding and Disclosure System (FDC Online)
$41.9 million ($137.4 million expenses and $1.1 million capital over four years) for the Public Service Commission
$32.2 million ($112.0 million expenses and $2.8 million capital over four years) for the Independent Commission Against Corruption (ICAC) to enhance the Commission’s ability to fulfil its statutory obligations
$29.0 million ($100.2 million expenses and $2.7 million capital over four years) for the New South Wales Ombudsman
$24.8 million ($94.9 million expenses and $4.8 million capital over four years) to the Law Enforcement Conduct Commission to oversee law enforcement agencies, ensuring that policing in New South Wales is carried out in a responsible and appropriate manner.
$343.2 million
Recurrent Expenses 2020-21
$17.7 million
Capital Expenditure2020-21
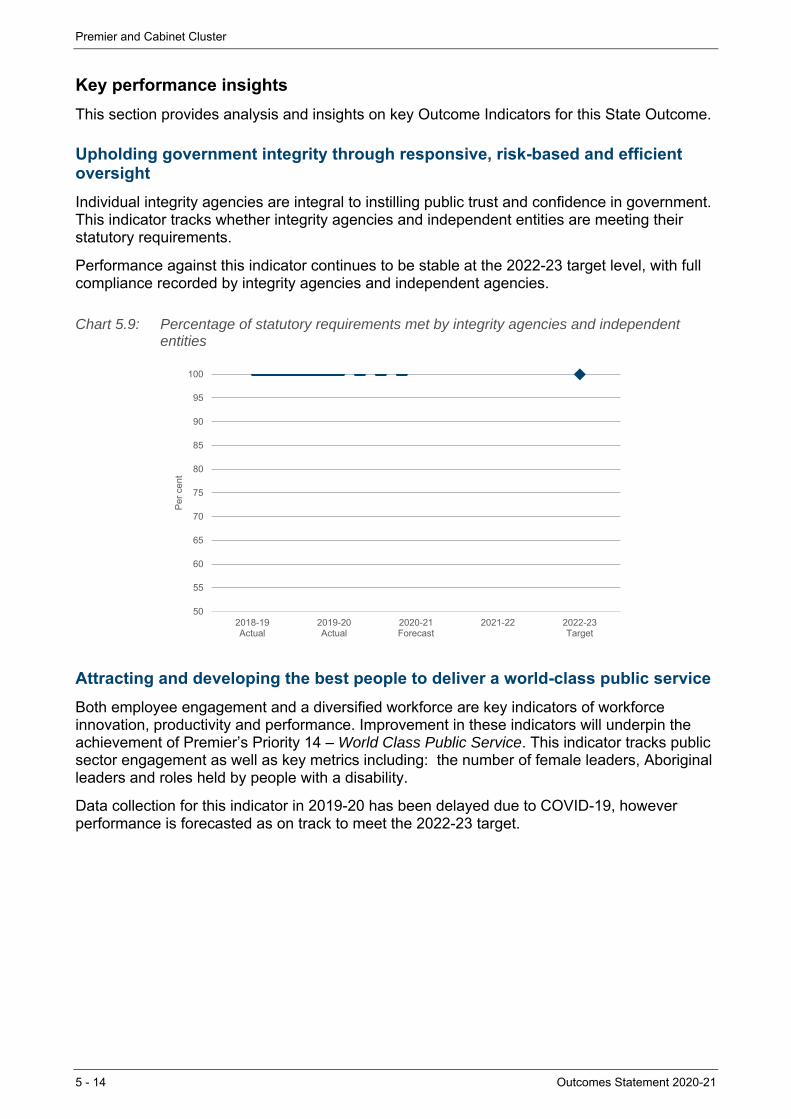
Premier and Cabinet Cluster
5 - 14 Outcomes Statement 2020-21
Key performance insights
This section provides analysis and insights on key Outcome Indicators for this State Outcome.
Upholding government integrity through responsive, risk-based and efficient oversight
Individual integrity agencies are integral to instilling public trust and confidence in government. This indicator tracks whether integrity agencies and independent entities are meeting their statutory requirements.
Performance against this indicator continues to be stable at the 2022-23 target level, with full compliance recorded by integrity agencies and independent agencies.
Chart 5.9: Percentage of statutory requirements met by integrity agencies and independent entities
Attracting and developing the best people to deliver a world-class public service
Both employee engagement and a diversified workforce are key indicators of workforce innovation, productivity and performance. Improvement in these indicators will underpin the achievement of Premier’s Priority 14 – World Class Public Service. This indicator tracks public sector engagement as well as key metrics including: the number of female leaders, Aboriginal leaders and roles held by people with a disability.
Data collection for this indicator in 2019-20 has been delayed due to COVID-19, however performance is forecasted as on track to meet the 2022-23 target.
50
55
60
65
70
75
80
85
90
95
100
2018-19Actual
2019-20Actual
2020-21Forecast
2021-22 2022-23Target
Per
cen
t
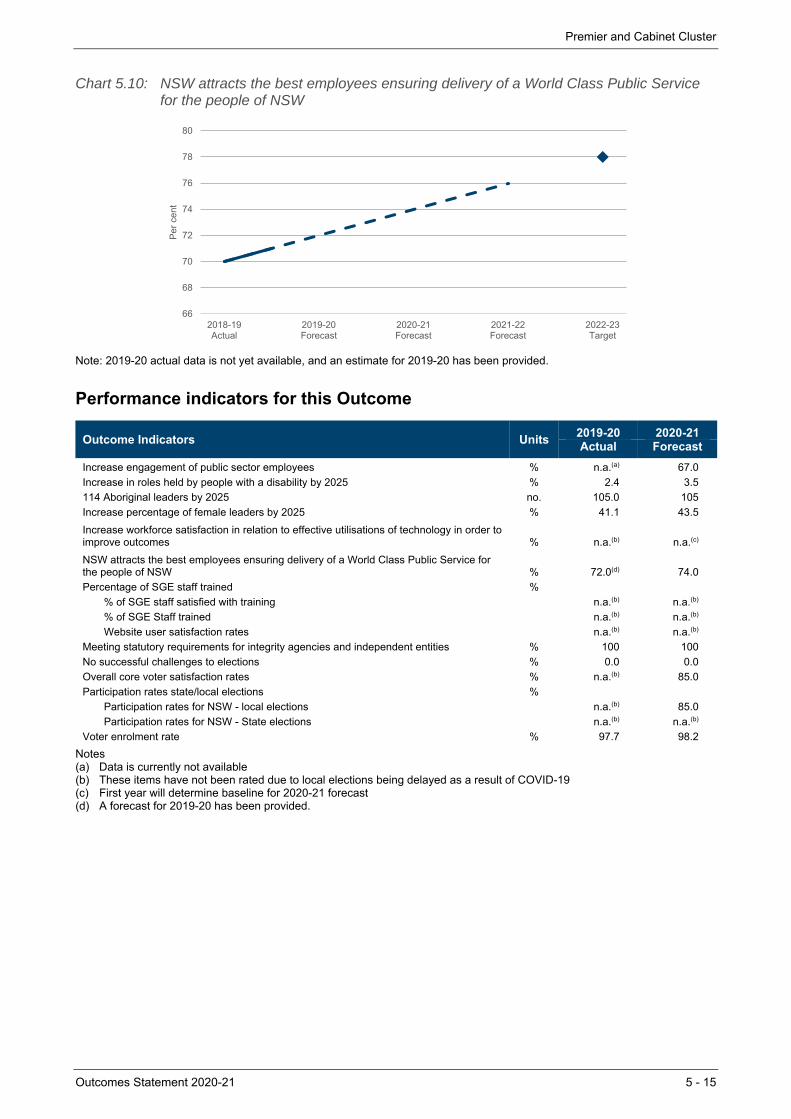
Premier and Cabinet Cluster
Outcomes Statement 2020-21 5 - 15
Chart 5.10: NSW attracts the best employees ensuring delivery of a World Class Public Service for the people of NSW
Note: 2019-20 actual data is not yet available, and an estimate for 2019-20 has been provided.
Performance indicators for this Outcome
Outcome Indicators Units 2019-20 2020-21Actual Forecast
Increase engagement of public sector employees % n.a.(a) 67.0
Increase in roles held by people with a disability by 2025 % 2.4 3.5
114 Aboriginal leaders by 2025 no. 105.0 105
Increase percentage of female leaders by 2025 % 41.1 43.5
Increase workforce satisfaction in relation to effective utilisations of technology in order to improve outcomes % n.a.(b) n.a.(c)
NSW attracts the best employees ensuring delivery of a World Class Public Service for the people of NSW % 72.0(d) 74.0
Percentage of SGE staff trained % % of SGE staff satisfied with training n.a.(b) n.a.(b)
% of SGE Staff trained n.a.(b) n.a.(b)
Website user satisfaction rates n.a.(b) n.a.(b)
Meeting statutory requirements for integrity agencies and independent entities % 100 100
No successful challenges to elections % 0.0 0.0
Overall core voter satisfaction rates % n.a.(b) 85.0
Participation rates state/local elections % Participation rates for NSW - local elections n.a.(b) 85.0
Participation rates for NSW - State elections n.a.(b) n.a.(b)
Voter enrolment rate % 97.7 98.2
Notes (a) Data is currently not available (b) These items have not been rated due to local elections being delayed as a result of COVID-19 (c) First year will determine baseline for 2020-21 forecast (d) A forecast for 2019-20 has been provided.
66
68
70
72
74
76
78
80
2018-19Actual
2019-20Forecast
2020-21Forecast
2021-22Forecast
2022-23Target
Per
cen
t
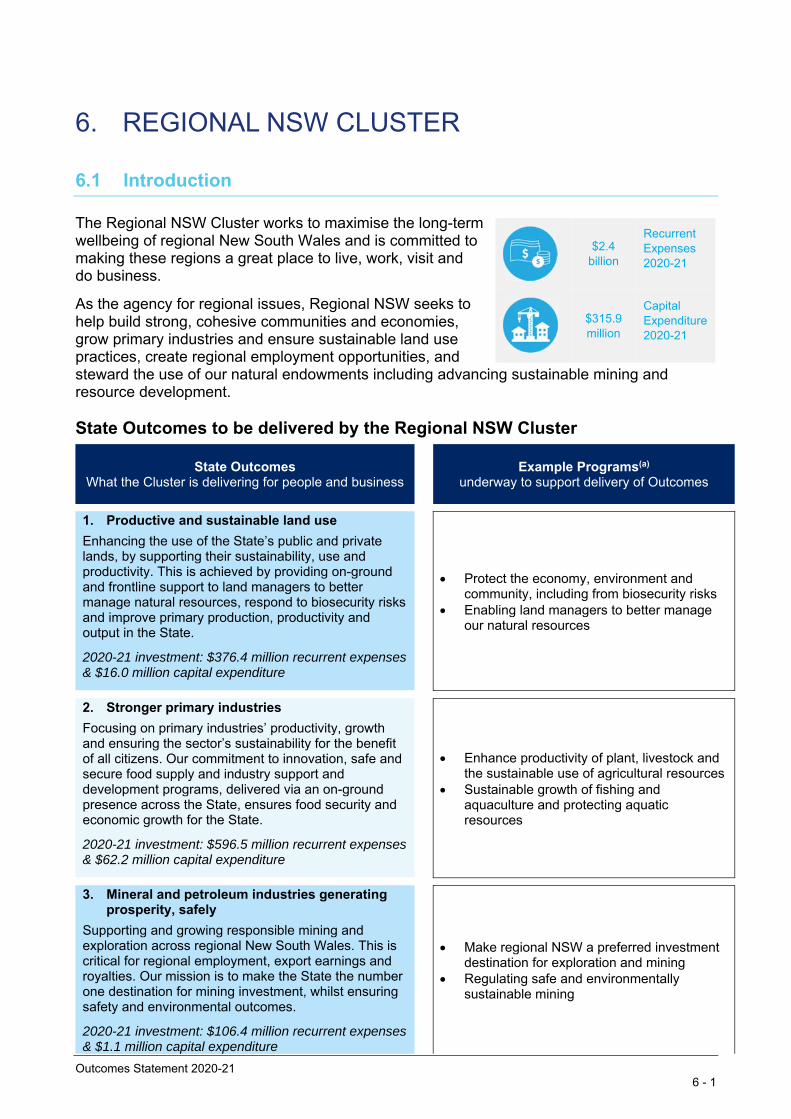
Outcomes Statement 2020-21 6 - 1
6. REGIONAL NSW CLUSTER
6.1 Introduction
The Regional NSW Cluster works to maximise the long-term wellbeing of regional New South Wales and is committed to making these regions a great place to live, work, visit and do business.
As the agency for regional issues, Regional NSW seeks to help build strong, cohesive communities and economies, grow primary industries and ensure sustainable land use practices, create regional employment opportunities, and steward the use of our natural endowments including advancing sustainable mining and resource development.
State Outcomes to be delivered by the Regional NSW Cluster
State Outcomes What the Cluster is delivering for people and business
Example Programs(a)
underway to support delivery of Outcomes
1. Productive and sustainable land use
Enhancing the use of the State’s public and private lands, by supporting their sustainability, use and productivity. This is achieved by providing on-ground and frontline support to land managers to better manage natural resources, respond to biosecurity risks and improve primary production, productivity and output in the State.
2020-21 investment: $376.4 million recurrent expenses & $16.0 million capital expenditure
Protect the economy, environment and community, including from biosecurity risks
Enabling land managers to better manage our natural resources
2. Stronger primary industries
Focusing on primary industries’ productivity, growth and ensuring the sector’s sustainability for the benefit of all citizens. Our commitment to innovation, safe and secure food supply and industry support and development programs, delivered via an on-ground presence across the State, ensures food security and economic growth for the State.
2020-21 investment: $596.5 million recurrent expenses & $62.2 million capital expenditure
Enhance productivity of plant, livestock and the sustainable use of agricultural resources
Sustainable growth of fishing and aquaculture and protecting aquatic resources
3. Mineral and petroleum industries generating prosperity, safely
Supporting and growing responsible mining and exploration across regional New South Wales. This is critical for regional employment, export earnings and royalties. Our mission is to make the State the number one destination for mining investment, whilst ensuring safety and environmental outcomes.
2020-21 investment: $106.4 million recurrent expenses & $1.1 million capital expenditure
Make regional NSW a preferred investment destination for exploration and mining
Regulating safe and environmentally sustainable mining
$2.4 billion
Recurrent Expenses 2020-21
$315.9 million
Capital Expenditure2020-21
Regional NSW Cluster
6 - 2 Outcomes Statement 2020-21
State Outcomes What the Cluster is delivering for people and business
Example Programs(a)
underway to support delivery of Outcomes
4. Stronger and cohesive regional communities and economies
Focusing on community wellbeing and economic growth in regional New South Wales. Regions have endured unprecedented destruction and disruption through the compounding impacts of drought, bushfires, floods and COVID-19. We continue to refocus efforts on the changed economic conditions and refreshing the 20-Year Economic Vision for Regional NSW.
2020-21 investment: $1.3 billion recurrent expenses & $236.6 million capital expenditure
Growth, development and wellbeing in regional NSW
Regional Growth NSW Development Corporation
(a) Note that Programs are being further refined as the outcome and performance framework continues to mature.
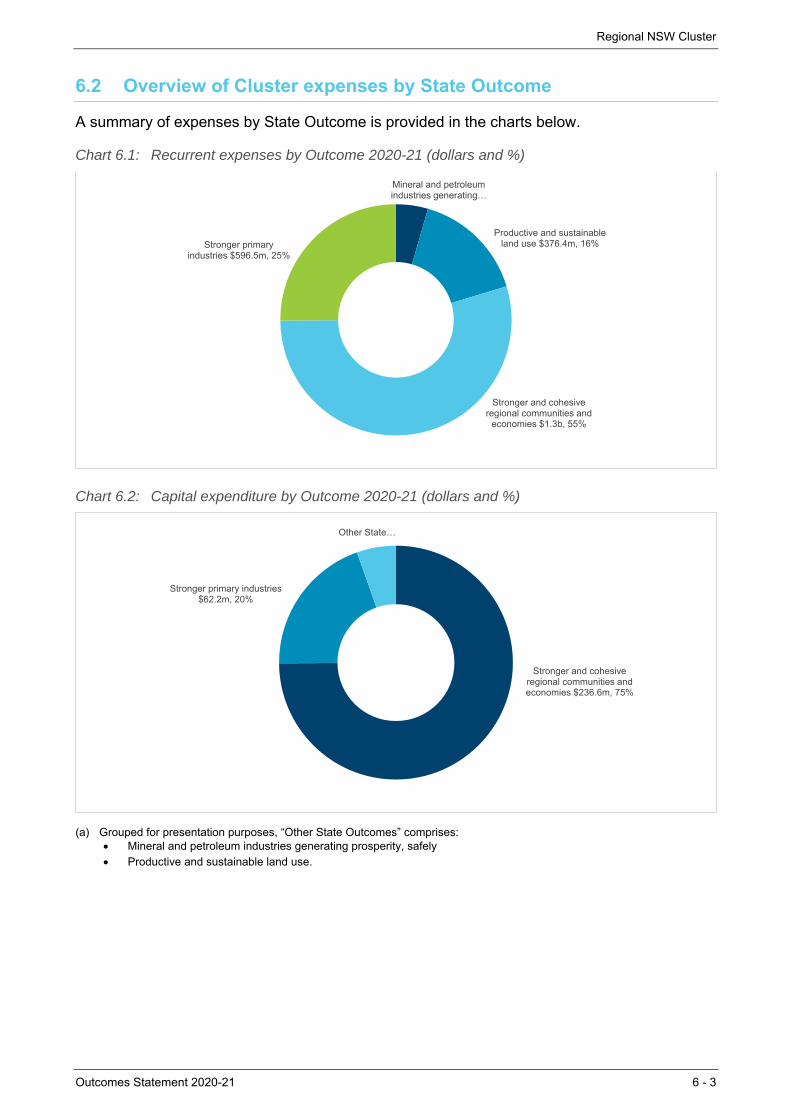
Regional NSW Cluster
Outcomes Statement 2020-21 6 - 3
6.2 Overview of Cluster expenses by State Outcome
A summary of expenses by State Outcome is provided in the charts below.
Chart 6.1: Recurrent expenses by Outcome 2020-21 (dollars and %)
Chart 6.2: Capital expenditure by Outcome 2020-21 (dollars and %)
(a) Grouped for presentation purposes, “Other State Outcomes” comprises: Mineral and petroleum industries generating prosperity, safely Productive and sustainable land use.
Mineral and petroleum industries generating …
Productive and sustainable land use $376.4m, 16%
Stronger and cohesive regional communities and
economies $1.3b, 55%
Stronger primary industries $596.5m, 25%
Stronger and cohesive regional communities and economies $236.6m, 75%
Stronger primary industries $62.2m, 20%
Other State …
Regional NSW Cluster
6 - 4 Outcomes Statement 2020-21
6.3 Outcome 1: Productive and sustainable land use
State Outcome overview and 2020-21 investment
Led by Local Land Services (LLS), this Outcome’s focus is to enhance the use of the State’s public and private lands, through supporting their sustainability, use and productivity. This is achieved by providing on-ground and frontline support to land managers. Everyone in New South Wales will benefit from well managed access to, and use of, natural resources that maximise economic opportunities in a safe and sustainable way.
2020-21 State Outcome Budget highlights
In 2020-21, the Regional NSW Cluster will invest $392.4 million ($376.4 million recurrent expenses and $16.0 million capital expenditure) in this Outcome, including:
$128.1 million to support private landholders to rebuild essential boundary fences destroyed by recent bushfires ($111.1 million) and to address pest, weed and animal welfare issues ($17.0 million) arising from the 2019-20 bushfires
$77.5 million ($279.8 million expenses and $25.0 million capital over four years) for the conservation and restoration of natural and cultural resources, through conservation earthworks, river and coastal restoration and rehabilitation, emergency response, native vegetation management, and pest and weed control in alignment with the Local Land Services Act 2013
$72.0 million ($237.8 million expenses and $14.7 million capital over four years) to protect the economy, environment and community from invasive species, and plant and animal biosecurity risks
$47.9 million ($94.4 million expenses over four years) to deliver the National Land Care Program and to partner with Landcare communities in New South Wales and Catchment Action NSW to conserve and fund our natural resource priorities arising from vegetation loss, soil degradation and pests, weeds and animals
$15.8 million ($35.9 million expenses over two years) to extend the NSW Border Wild Dog Exclusion Fence by 742 km.
$376.4 million
Recurrent Expenses 2020-21
$16.0 million
Capital Expenditure2020-21
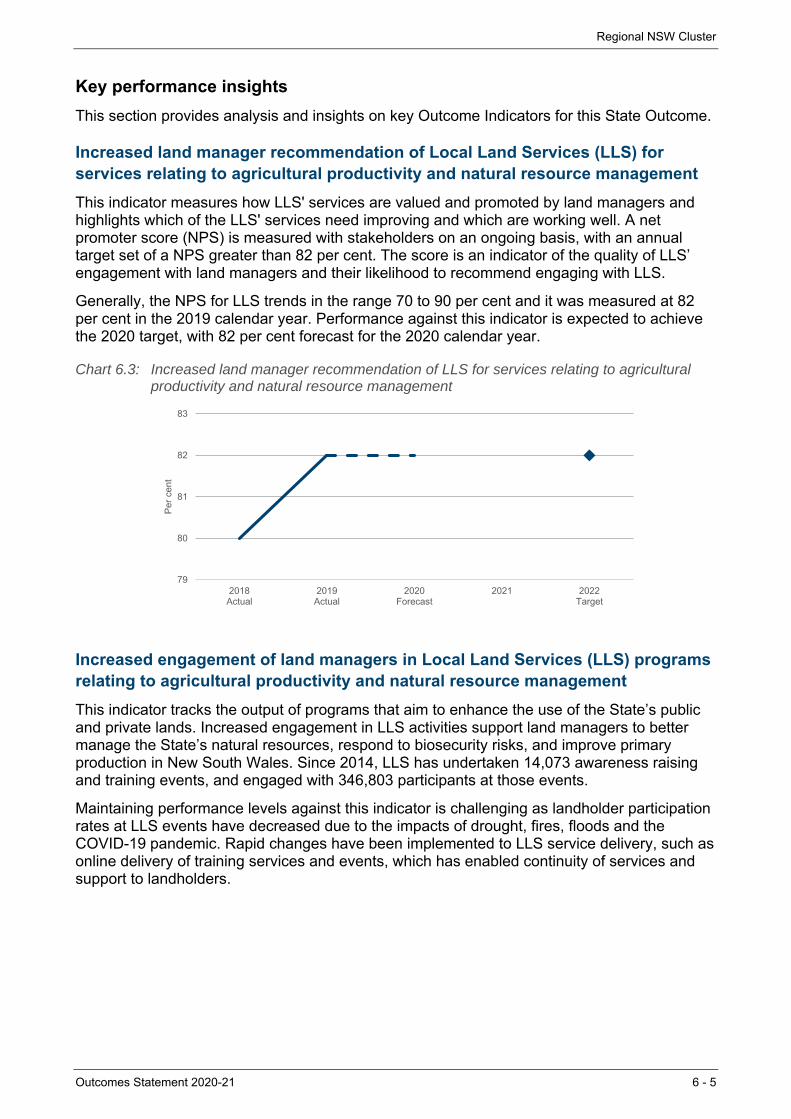
Regional NSW Cluster
Outcomes Statement 2020-21 6 - 5
Key performance insights
This section provides analysis and insights on key Outcome Indicators for this State Outcome.
Increased land manager recommendation of Local Land Services (LLS) for services relating to agricultural productivity and natural resource management
This indicator measures how LLS' services are valued and promoted by land managers and highlights which of the LLS' services need improving and which are working well. A net promoter score (NPS) is measured with stakeholders on an ongoing basis, with an annual target set of a NPS greater than 82 per cent. The score is an indicator of the quality of LLS’ engagement with land managers and their likelihood to recommend engaging with LLS.
Generally, the NPS for LLS trends in the range 70 to 90 per cent and it was measured at 82 per cent in the 2019 calendar year. Performance against this indicator is expected to achieve the 2020 target, with 82 per cent forecast for the 2020 calendar year.
Chart 6.3: Increased land manager recommendation of LLS for services relating to agricultural productivity and natural resource management
Increased engagement of land managers in Local Land Services (LLS) programs relating to agricultural productivity and natural resource management
This indicator tracks the output of programs that aim to enhance the use of the State’s public and private lands. Increased engagement in LLS activities support land managers to better manage the State’s natural resources, respond to biosecurity risks, and improve primary production in New South Wales. Since 2014, LLS has undertaken 14,073 awareness raising and training events, and engaged with 346,803 participants at those events.
Maintaining performance levels against this indicator is challenging as landholder participation rates at LLS events have decreased due to the impacts of drought, fires, floods and the COVID-19 pandemic. Rapid changes have been implemented to LLS service delivery, such as online delivery of training services and events, which has enabled continuity of services and support to landholders.
79
80
81
82
83
2018Actual
2019Actual
2020Forecast
2021 2022Target
Per
cen
t
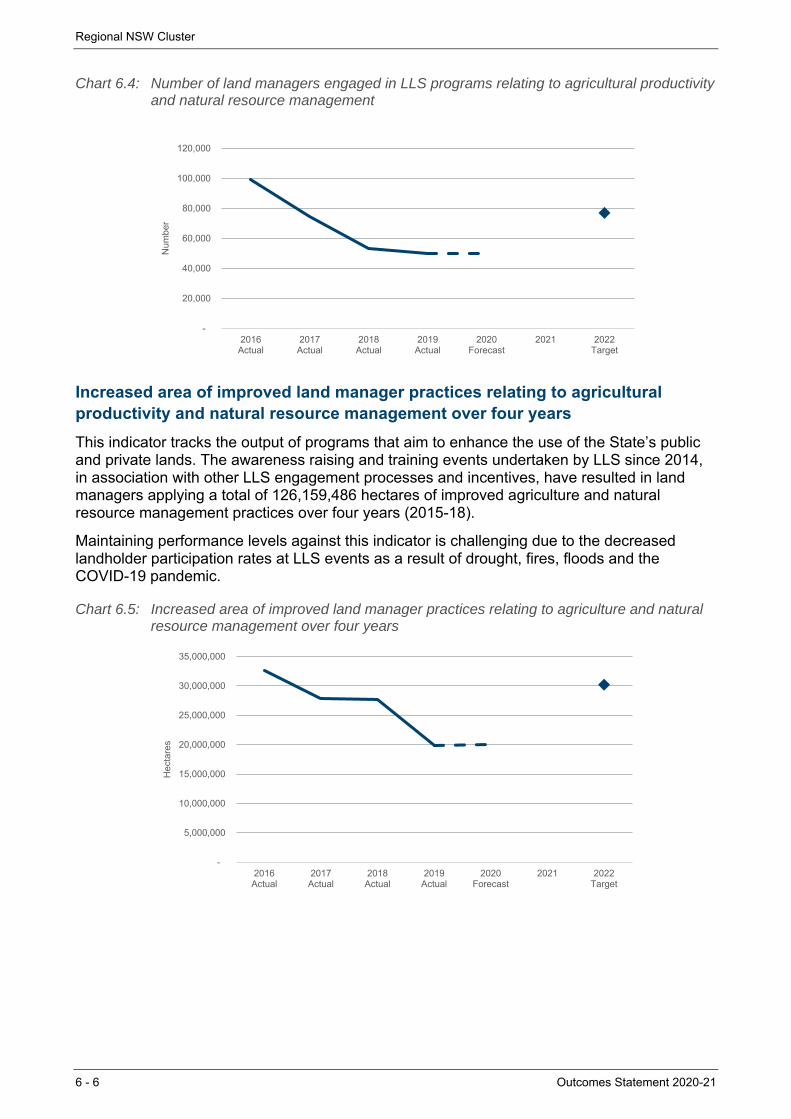
Regional NSW Cluster
6 - 6 Outcomes Statement 2020-21
Chart 6.4: Number of land managers engaged in LLS programs relating to agricultural productivity and natural resource management
Increased area of improved land manager practices relating to agricultural productivity and natural resource management over four years
This indicator tracks the output of programs that aim to enhance the use of the State’s public and private lands. The awareness raising and training events undertaken by LLS since 2014, in association with other LLS engagement processes and incentives, have resulted in land managers applying a total of 126,159,486 hectares of improved agriculture and natural resource management practices over four years (2015-18).
Maintaining performance levels against this indicator is challenging due to the decreased landholder participation rates at LLS events as a result of drought, fires, floods and the COVID-19 pandemic.
Chart 6.5: Increased area of improved land manager practices relating to agriculture and natural resource management over four years
-
20,000
40,000
60,000
80,000
100,000
120,000
2016Actual
2017Actual
2018Actual
2019Actual
2020Forecast
2021 2022Target
Num
ber
-
5,000,000
10,000,000
15,000,000
20,000,000
25,000,000
30,000,000
35,000,000
2016Actual
2017Actual
2018Actual
2019Actual
2020Forecast
2021 2022Target
Hec
tare
s
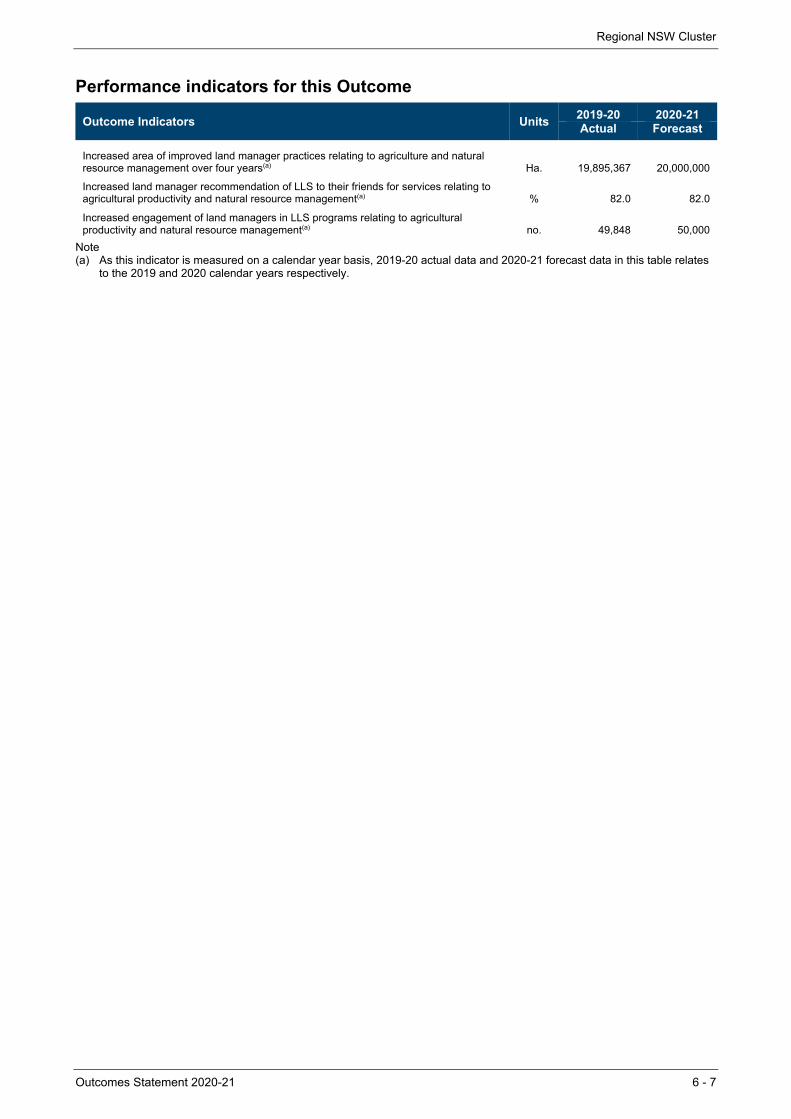
Regional NSW Cluster
Outcomes Statement 2020-21 6 - 7
Performance indicators for this Outcome
Outcome Indicators Units 2019-20 2020-21Actual Forecast
Increased area of improved land manager practices relating to agriculture and natural resource management over four years(a) Ha. 19,895,367 20,000,000
Increased land manager recommendation of LLS to their friends for services relating to agricultural productivity and natural resource management(a) % 82.0 82.0
Increased engagement of land managers in LLS programs relating to agricultural productivity and natural resource management(a) no. 49,848 50,000
Note (a) As this indicator is measured on a calendar year basis, 2019-20 actual data and 2020-21 forecast data in this table relates
to the 2019 and 2020 calendar years respectively.
Regional NSW Cluster
6 - 8 Outcomes Statement 2020-21
6.1 Outcome 2: Stronger primary industries
State Outcome overview and 2020-21 investment
Led by the Department of Primary Industries (DPI), this Outcome’s focus is on the state’s primary industries’ productivity, growth and ensuring the sector’s sustainability for the benefit of all citizens. DPI plays a central role in the government’s commitment to regional New South Wales by driving a strong primary industries sector. Our commitment to innovation, safe and secure food supply and industry support and development programs, delivered via an on-ground presence across the State, ensures food security and economic growth for the State.
2020-21 State Outcome Budget highlights
In 2020-21, the Regional NSW Cluster will invest $658.7 million ($596.5 million recurrent expenses and $62.2 million capital expenditure) in this Outcome, including:
$146.2 million ($278.8 million expenses and $0.2 million capital over four years) for continuing on-farm drought assistance measures, including transport subsidies, funding for emergency water carting for farms, waiving of interest charges on Farm Innovation Fund loans provided by the NSW Rural Assistance Authority and to build the skills of our current and future farmers
$142.5 million ($471.9 million expenses and $4.8 million capital over four years) to enable the sustainable growth of fishing and aquaculture through investment in research and protecting aquatic resources through licencing and compliance activities, including an additional $28.3 million ($57.9 million expenses and $1.1 million capital over two years) to deliver the Marine Estate Management Administration Strategy
$140.1 million ($493.6 million expenses and $115.3 million capital over four years) to enhance productivity of plant and livestock farming systems whilst ensuring the sustainable use of agricultural resources, including capital investment of $11.6 million ($50.8 million over three years) in the State’s primary industries research and development (R&D) infrastructure portfolio under the World Class Food and Fibre (WCFF) program
$131.7 million ($448.1 million expenses over four years) to protect and promote biosecurity compliance for legislative responsibilities under the Biosecurity Act 2015 (Cth) (including invasive plants and animals), deliver legislative food safety requirements, safeguarding animal welfare, and ensuring market access by undertaking biosecurity preparedness exercises, disaster response impact and assessments recovery advisory services, including $19.1 million ($43.5 million over two years) to bolster the delivery of the State’s biosecurity activities in combatting pests, weeds and plant and animal diseases in rural communities
$21.0 million ($84.3 million expenses over four years) to lead policy, industry development, research and regulatory oversight as set out in the Plantations and Reafforestation Act 1999 and to undertake legislative requirements under the Game and Feral Animal Control Act 2002.
$596.5 million
Recurrent Expenses 2020-21
$62.2 million
Capital Expenditure2020-21
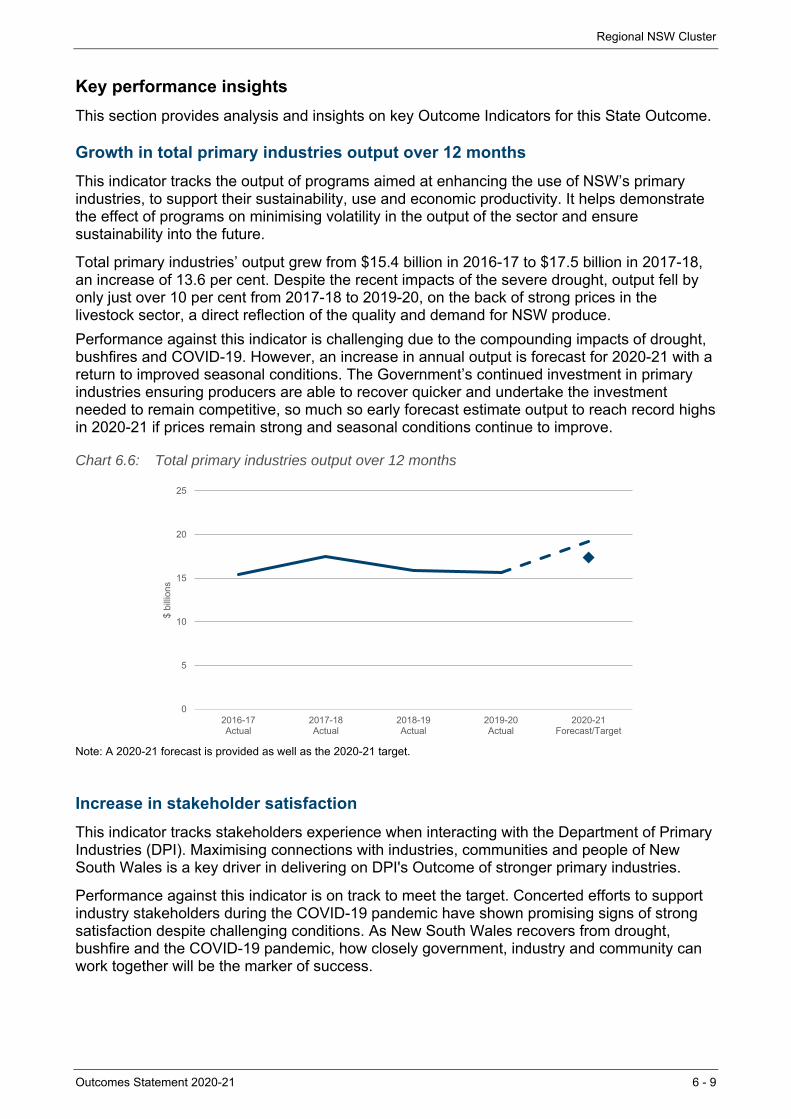
Regional NSW Cluster
Outcomes Statement 2020-21 6 - 9
Key performance insights
This section provides analysis and insights on key Outcome Indicators for this State Outcome.
Growth in total primary industries output over 12 months
This indicator tracks the output of programs aimed at enhancing the use of NSW’s primary industries, to support their sustainability, use and economic productivity. It helps demonstrate the effect of programs on minimising volatility in the output of the sector and ensure sustainability into the future.
Total primary industries’ output grew from $15.4 billion in 2016-17 to $17.5 billion in 2017-18, an increase of 13.6 per cent. Despite the recent impacts of the severe drought, output fell by only just over 10 per cent from 2017-18 to 2019-20, on the back of strong prices in the livestock sector, a direct reflection of the quality and demand for NSW produce.
Performance against this indicator is challenging due to the compounding impacts of drought, bushfires and COVID-19. However, an increase in annual output is forecast for 2020-21 with a return to improved seasonal conditions. The Government’s continued investment in primary industries ensuring producers are able to recover quicker and undertake the investment needed to remain competitive, so much so early forecast estimate output to reach record highs in 2020-21 if prices remain strong and seasonal conditions continue to improve.
Chart 6.6: Total primary industries output over 12 months
Note: A 2020-21 forecast is provided as well as the 2020-21 target.
Increase in stakeholder satisfaction
This indicator tracks stakeholders experience when interacting with the Department of Primary Industries (DPI). Maximising connections with industries, communities and people of New South Wales is a key driver in delivering on DPI's Outcome of stronger primary industries.
Performance against this indicator is on track to meet the target. Concerted efforts to support industry stakeholders during the COVID-19 pandemic have shown promising signs of strong satisfaction despite challenging conditions. As New South Wales recovers from drought, bushfire and the COVID-19 pandemic, how closely government, industry and community can work together will be the marker of success.
0
5
10
15
20
25
2016-17Actual
2017-18Actual
2018-19Actual
2019-20Actual
2020-21Forecast/Target
$ bi
llion
s
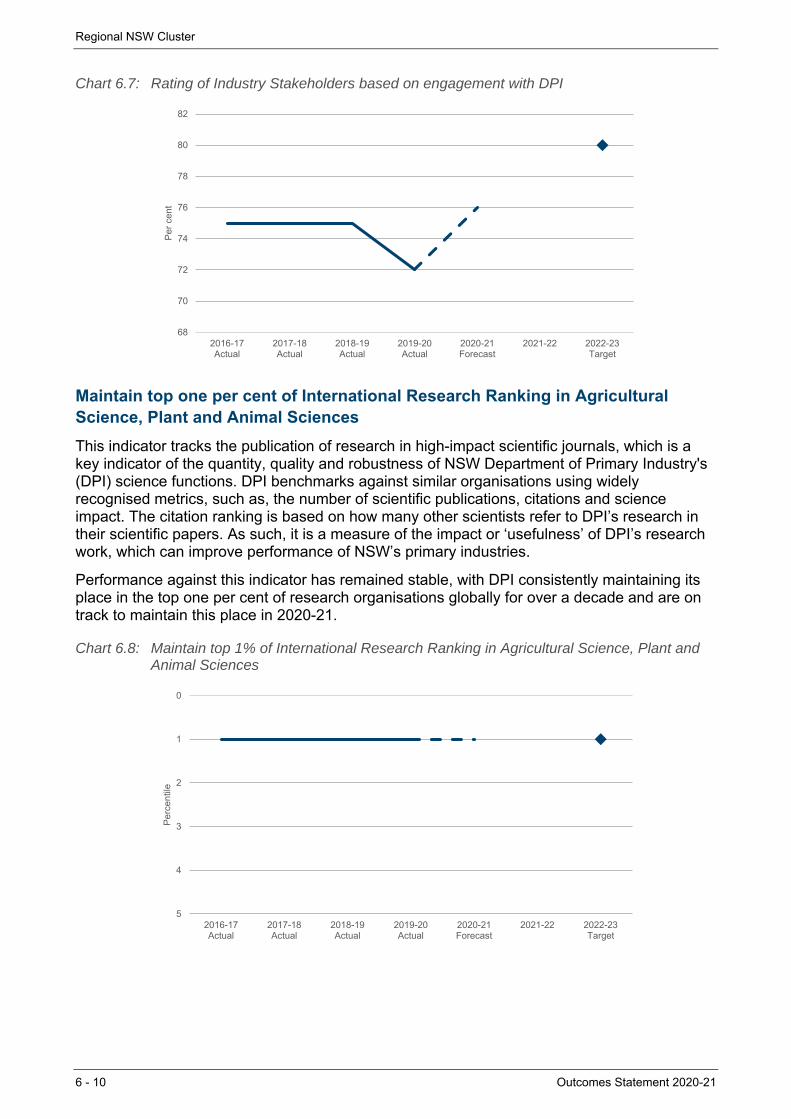
Regional NSW Cluster
6 - 10 Outcomes Statement 2020-21
Chart 6.7: Rating of Industry Stakeholders based on engagement with DPI
Maintain top one per cent of International Research Ranking in Agricultural Science, Plant and Animal Sciences
This indicator tracks the publication of research in high-impact scientific journals, which is a key indicator of the quantity, quality and robustness of NSW Department of Primary Industry's (DPI) science functions. DPI benchmarks against similar organisations using widely recognised metrics, such as, the number of scientific publications, citations and science impact. The citation ranking is based on how many other scientists refer to DPI’s research in their scientific papers. As such, it is a measure of the impact or ‘usefulness’ of DPI’s research work, which can improve performance of NSW’s primary industries.
Performance against this indicator has remained stable, with DPI consistently maintaining its place in the top one per cent of research organisations globally for over a decade and are on track to maintain this place in 2020-21.
Chart 6.8: Maintain top 1% of International Research Ranking in Agricultural Science, Plant and Animal Sciences
68
70
72
74
76
78
80
82
2016-17Actual
2017-18Actual
2018-19Actual
2019-20Actual
2020-21Forecast
2021-22 2022-23Target
Per
cen
t
0
1
2
3
4
52016-17Actual
2017-18Actual
2018-19Actual
2019-20Actual
2020-21Forecast
2021-22 2022-23Target
Per
cent
ile
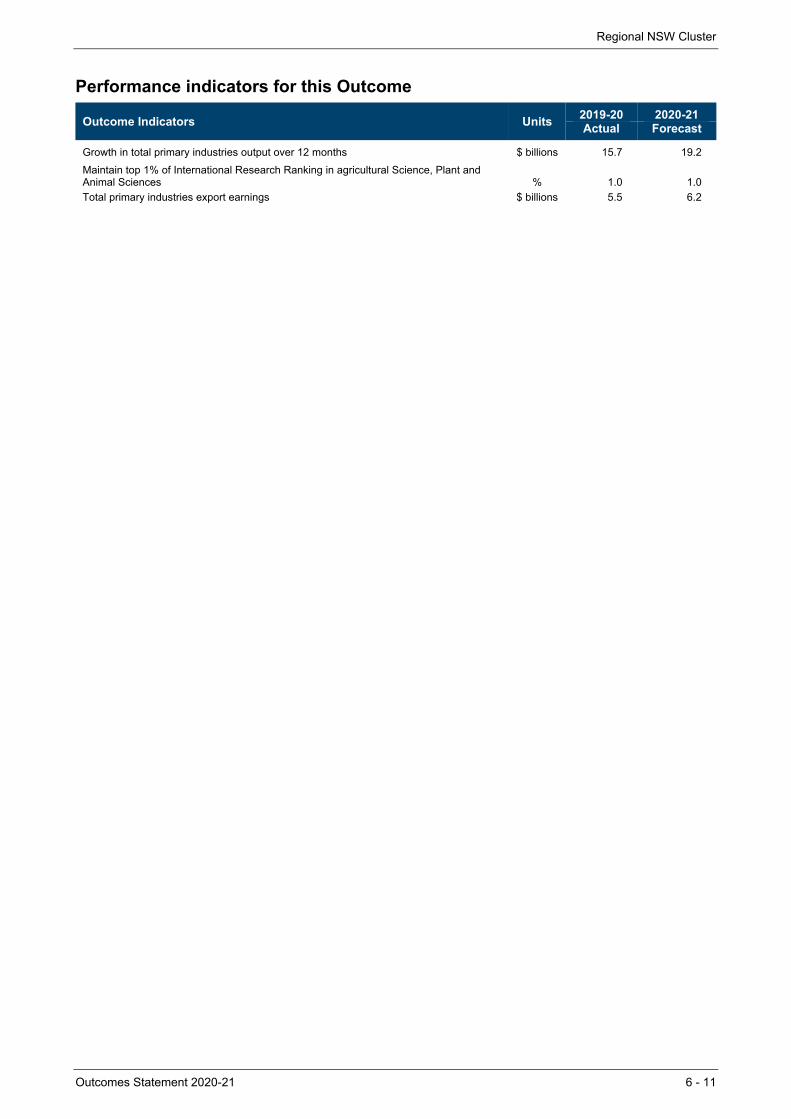
Regional NSW Cluster
Outcomes Statement 2020-21 6 - 11
Performance indicators for this Outcome
Outcome Indicators Units 2019-20 2020-21Actual Forecast
Growth in total primary industries output over 12 months $ billions 15.7 19.2
Maintain top 1% of International Research Ranking in agricultural Science, Plant and Animal Sciences % 1.0 1.0
Total primary industries export earnings $ billions 5.5 6.2
Regional NSW Cluster
6 - 12 Outcomes Statement 2020-21
6.2 Outcome 3: Mineral and petroleum industries generating prosperity, safely
State Outcome overview and 2020-21 investment
Led by the Mining, Exploration & Geoscience division and the NSW Resources Regulator, this Outcome’s focus is to support and grow responsible mining and exploration across regional New South Wales. Our mission is to make New South Wales a preferred investment destination for exploration and mining through leading practice policy and legislation, excellence in geoscience, efficient titles assessment and proactive regulation. The sustainable growth of the minerals industry creates opportunity for economic growth and meaningful employment opportunities for the people of New South Wales.
2020-21 State Outcome Budget highlights
In 2020-21, the Regional NSW Cluster will invest $107.5 million ($106.4 million recurrent expenses and $1.1 million capital expenditure) in this Outcome, including:
$26.8 million ($108.1 million expenses and $1.0 million capital over four years) to set the strategic policy direction for the industry and provide world class geoscientific information to support mineral and petroleum exploration and mining, including $45.2 million over four years from the Coal Innovation Fund for research and investment in carbon capture, use and storage and low emissions coal technology projects
$26.4 million ($104.8 million expenses and $1.0 million capital over four years) to regulate mine and petroleum site safety in relation to Work Health and Safety compliance and enforcement
$11.3 million ($44.8 million expenses and $1.0 million capital over four years) to deliver robust assessment of exploration and mining titles applications and calculation of quarterly royalty returns for collection by Revenue NSW
$6.6 million ($26.1 million expenses over four years) to undertake regulatory compliance inspections and investigate instances of non-compliance of the Mining Act 1992.
$106.4 million
Recurrent Expenses 2020-21
$1.1 million
Capital Expenditure2020-21
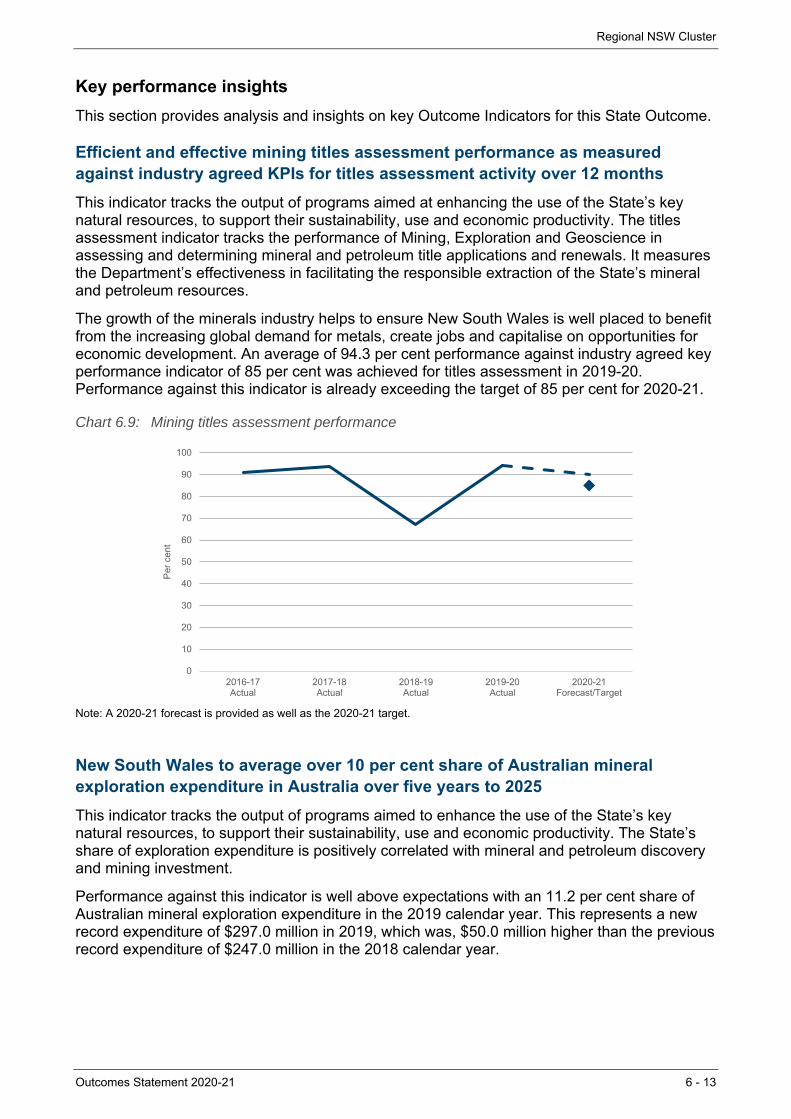
Regional NSW Cluster
Outcomes Statement 2020-21 6 - 13
Key performance insights
This section provides analysis and insights on key Outcome Indicators for this State Outcome.
Efficient and effective mining titles assessment performance as measured against industry agreed KPIs for titles assessment activity over 12 months
This indicator tracks the output of programs aimed at enhancing the use of the State’s key natural resources, to support their sustainability, use and economic productivity. The titles assessment indicator tracks the performance of Mining, Exploration and Geoscience in assessing and determining mineral and petroleum title applications and renewals. It measures the Department’s effectiveness in facilitating the responsible extraction of the State’s mineral and petroleum resources.
The growth of the minerals industry helps to ensure New South Wales is well placed to benefit from the increasing global demand for metals, create jobs and capitalise on opportunities for economic development. An average of 94.3 per cent performance against industry agreed key performance indicator of 85 per cent was achieved for titles assessment in 2019-20. Performance against this indicator is already exceeding the target of 85 per cent for 2020-21.
Chart 6.9: Mining titles assessment performance
Note: A 2020-21 forecast is provided as well as the 2020-21 target.
New South Wales to average over 10 per cent share of Australian mineral exploration expenditure in Australia over five years to 2025
This indicator tracks the output of programs aimed to enhance the use of the State’s key natural resources, to support their sustainability, use and economic productivity. The State’s share of exploration expenditure is positively correlated with mineral and petroleum discovery and mining investment.
Performance against this indicator is well above expectations with an 11.2 per cent share of Australian mineral exploration expenditure in the 2019 calendar year. This represents a new record expenditure of $297.0 million in 2019, which was, $50.0 million higher than the previous record expenditure of $247.0 million in the 2018 calendar year.
0
10
20
30
40
50
60
70
80
90
100
2016-17Actual
2017-18Actual
2018-19Actual
2019-20Actual
2020-21Forecast/Target
Per
cen
t

Regional NSW Cluster
6 - 14 Outcomes Statement 2020-21
Chart 6.10: Proportion of NSW’s share of Australian mineral exploration expenditure in Australia
Proportion of high risk and priority mine sites proactively inspected for compliance with work health and safety (WHS) & Mining Act requirements
This indicator tracks the number of sites which the New South Wales Resources Regulator considered to be high-risk from a Work Health and Safety (WHS) or environmental perspective, which have been subject to inspection in the reporting period. Proactive, consistent regulation of high-risk sites continue to contribute to improved industry performance and ultimately better health, safety and environmental outcomes in New South Wales mines. Regulatory oversight is a key aspect of ensuring compliance with the legislative requirements and providing certainty in the regulatory process and framework.
Performance against this indicator is stable and performance targets are in development.
Chart 6.11: Proportion of high risk and priority mine sites proactively inspected for compliance with WHS & Mining Act requirement
Note: Performance targets are in development.
0
2
4
6
8
10
12
2016Actual
2017Actual
2018Actual
2019Actual
2020Forecast
… 2025Target
Per
cen
t
0
20
40
60
80
100
120
2019-20Actual
2020-21Forecast
Per
cen
t
WHS Mining Act
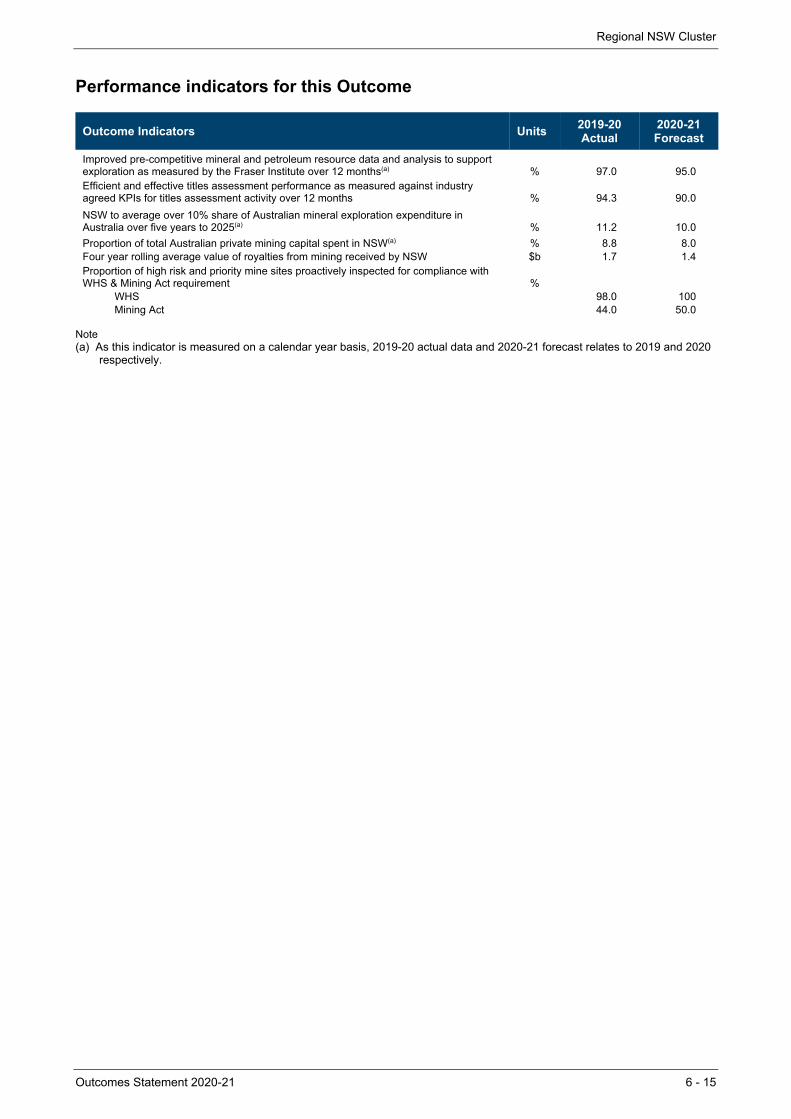
Regional NSW Cluster
Outcomes Statement 2020-21 6 - 15
Performance indicators for this Outcome
Note (a) As this indicator is measured on a calendar year basis, 2019-20 actual data and 2020-21 forecast relates to 2019 and 2020
respectively.
Outcome Indicators Units 2019-20 2020-21Actual Forecast
Improved pre-competitive mineral and petroleum resource data and analysis to support exploration as measured by the Fraser Institute over 12 months(a) % 97.0 95.0Efficient and effective titles assessment performance as measured against industry agreed KPIs for titles assessment activity over 12 months % 94.3 90.0
NSW to average over 10% share of Australian mineral exploration expenditure in Australia over five years to 2025(a) % 11.2 10.0
Proportion of total Australian private mining capital spent in NSW(a) % 8.8 8.0Four year rolling average value of royalties from mining received by NSW $b 1.7 1.4Proportion of high risk and priority mine sites proactively inspected for compliance with WHS & Mining Act requirement %
WHS 98.0 100Mining Act 44.0 50.0
Regional NSW Cluster
6 - 16 Outcomes Statement 2020-21
6.3 Outcome 4: Stronger and cohesive regional communities and economies
State Outcome overview and 2020-21 investment
Led by Public Works Advisory & Regional Development and Strategy, Delivery & Performance divisions, this Outcome’s focus is community wellbeing and economic growth in regional New South Wales. The regions have endured unprecedented destruction and disruption through the compounding impacts of droughts, bushfires, floods and COVID-19. The implementation of a refreshed of the 20-Year Economic Vision for Regional NSW will support industries and communities to recover and build resilience.
2020-21 State Outcome Budget highlights
In 2020-21, the Regional NSW Cluster will invest $1.5 billion ($1.3 billion recurrent expenses and $236.6 million capital expenditure) in this Outcome, including:
$560.5 million ($830.2 million in expenses over three years) for the Make Safe and Clean-up Program and to deliver the Bushfire Industry Recovery Package and the Bushfire Local Economic Recovery Fund following the 2019-20 bushfires, including co-funding from the Commonwealth
$323.1 million ($201.8 million recurrent expenses and $397.8 million capital over four years) for Snowy Hydro Legacy Fund projects including Special Activation Precincts to deliver place-based solutions to foster economic development, and to bring a faster, more reliable digital network to regional NSW through the Regional Digital Connectivity Program
$212.5 million ($509.2 million expenses over four years) enabling the growth, development and wellbeing in regional New South Wales, including $18.2 million ($60.6 million expenses over four years) to deliver a new round of Resources for Regions and for the Indigenous Tourism stream of the Regional Growth Environment and Tourism Fund
$107.7 million ($261.8 million over two years) from the $3.0 billion Jobs and Infrastructure Acceleration Fund to deliver a regional stimulus package, including the new $100.0 million Regional Job Creation Fund to incentivise the attraction and expansion of businesses and job retention and creation in regional NSW and delivery of fast tracked infrastructure projects, including $25.0 million for the Orange Sports Complex
$80.0 million ($300.0 million over two years) to provide for the Regional Growth Fund 2.0 to boost regional economic stimulus and job creation, including:
– $10.0 million over four years for the Office for Regional Youth
– $3.0 million over four years to support the Office of Drought Response
$64.5 million ($254.1 million expenses over four years) for Public Works Advisory to deliver regional projects and to provide infrastructure and advisory services.
$1.3 billion
Recurrent Expenses 2020-21
$236.6 million
Capital Expenditure2020-21
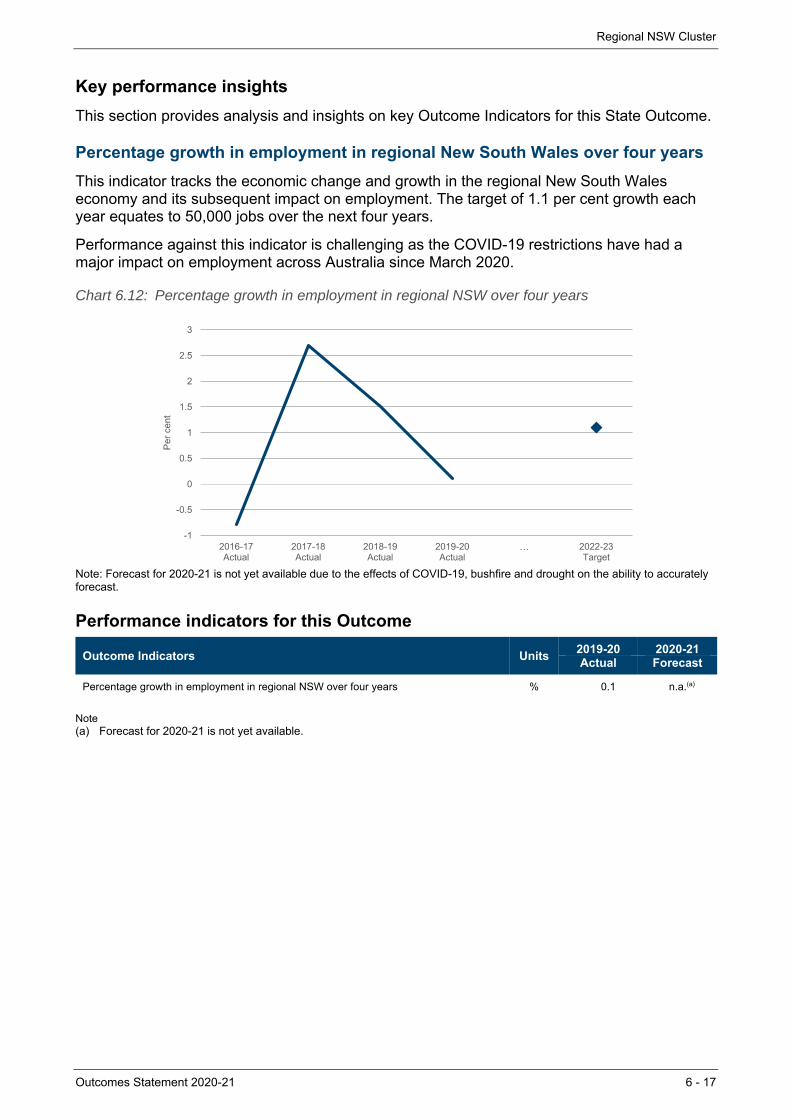
Regional NSW Cluster
Outcomes Statement 2020-21 6 - 17
Key performance insights
This section provides analysis and insights on key Outcome Indicators for this State Outcome.
Percentage growth in employment in regional New South Wales over four years
This indicator tracks the economic change and growth in the regional New South Wales economy and its subsequent impact on employment. The target of 1.1 per cent growth each year equates to 50,000 jobs over the next four years.
Performance against this indicator is challenging as the COVID-19 restrictions have had a major impact on employment across Australia since March 2020.
Chart 6.12: Percentage growth in employment in regional NSW over four years
Note: Forecast for 2020-21 is not yet available due to the effects of COVID-19, bushfire and drought on the ability to accurately forecast.
Performance indicators for this Outcome
Outcome Indicators Units 2019-20 2020-21Actual Forecast
Percentage growth in employment in regional NSW over four years % 0.1 n.a.(a)
Note (a) Forecast for 2020-21 is not yet available.
-1
-0.5
0
0.5
1
1.5
2
2.5
3
2016-17Actual
2017-18Actual
2018-19Actual
2019-20Actual
… 2022-23Target
Per
cen
t

Outcomes Statement 2020-21 7- 1
7. STRONGER COMMUNITIES CLUSTER
7.1 Introduction
The Stronger Communities Cluster delivers community services that support a safe and just New South Wales. It supports safer, stronger communities through: the protection of children and families; building resilience to natural disasters and emergencies; promoting public safety; operating an effective legal system; reducing reoffending; supporting community harmony and social cohesion; and promoting physical activity and participation in organised sport, active recreation and sporting events.
The Stronger Communities Cluster has responsibility for delivering on key policies for the Government, including seven State Outcomes and five Premier’s Priorities.
State Outcomes to be delivered by the Stronger Communities Cluster
State Outcomes What the Cluster is delivering for people and
business
Example Programs(a) underway to support delivery of Outcomes
1. Active and inclusive communities
Delivering programs and support services that aim to improve wellbeing, increase physical activity and community participation, and promote community harmony social inclusion and cohesion, particularly for participants in the National Disability Insurance Scheme (NDIS).
2020-21 investment: $4.1 billion recurrent expenses & $26.7 million capital expenditure
Supporting the NDIS Office of Sport Programs Community Support and Development Multicultural NSW
2. Children and families thrive
Ensuring the safety and wellbeing of vulnerable, children, young people and families, and protecting them from the risk of harm, abuse and neglect.
2020-21 investment: $2.5 billion recurrent expenses & $21.9 million capital expenditure
Out-of-Home Care and Permanency Support
Child Protection Targeted Early Intervention Domestic and Family Violence
3. Efficient and effective legal system
Resolving matters through legal services, the administration of courts and tribunals, and client-facing justice services to victims and vulnerable people.
2020-21 investment: $1.7 billion recurrent expenses & $140.7 million capital expenditure
Courts and Tribunals Legal Aid and Justice Services
$17.8 billion
Recurrent Expenses 2020-21
$1.3 billion
Capital Expenditure2020-21
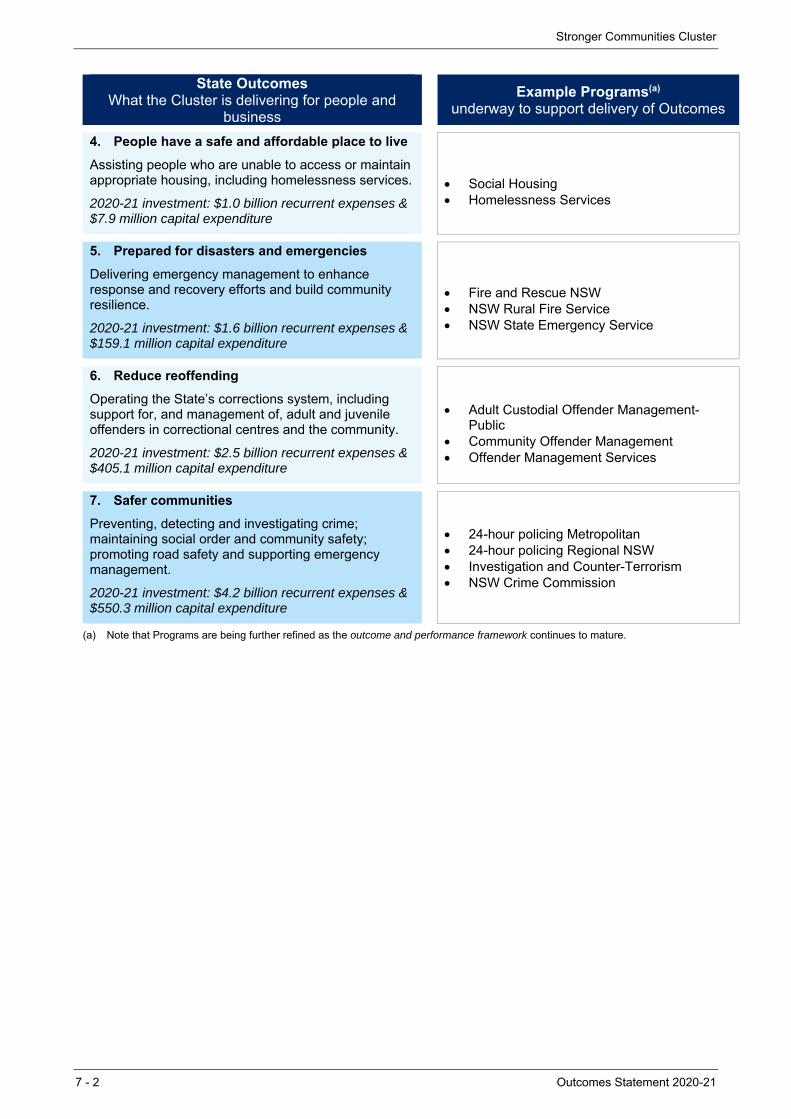
Stronger Communities Cluster
7 - 2 Outcomes Statement 2020-21
State Outcomes What the Cluster is delivering for people and
business
Example Programs(a) underway to support delivery of Outcomes
4. People have a safe and affordable place to live
Assisting people who are unable to access or maintain appropriate housing, including homelessness services.
2020-21 investment: $1.0 billion recurrent expenses & $7.9 million capital expenditure
Social Housing Homelessness Services
5. Prepared for disasters and emergencies
Delivering emergency management to enhance response and recovery efforts and build community resilience.
2020-21 investment: $1.6 billion recurrent expenses & $159.1 million capital expenditure
Fire and Rescue NSW NSW Rural Fire Service NSW State Emergency Service
6. Reduce reoffending
Operating the State’s corrections system, including support for, and management of, adult and juvenile offenders in correctional centres and the community.
2020-21 investment: $2.5 billion recurrent expenses & $405.1 million capital expenditure
Adult Custodial Offender Management-
Public Community Offender Management Offender Management Services
7. Safer communities
Preventing, detecting and investigating crime; maintaining social order and community safety; promoting road safety and supporting emergency management.
2020-21 investment: $4.2 billion recurrent expenses & $550.3 million capital expenditure
24-hour policing Metropolitan 24-hour policing Regional NSW Investigation and Counter-Terrorism NSW Crime Commission
(a) Note that Programs are being further refined as the outcome and performance framework continues to mature.
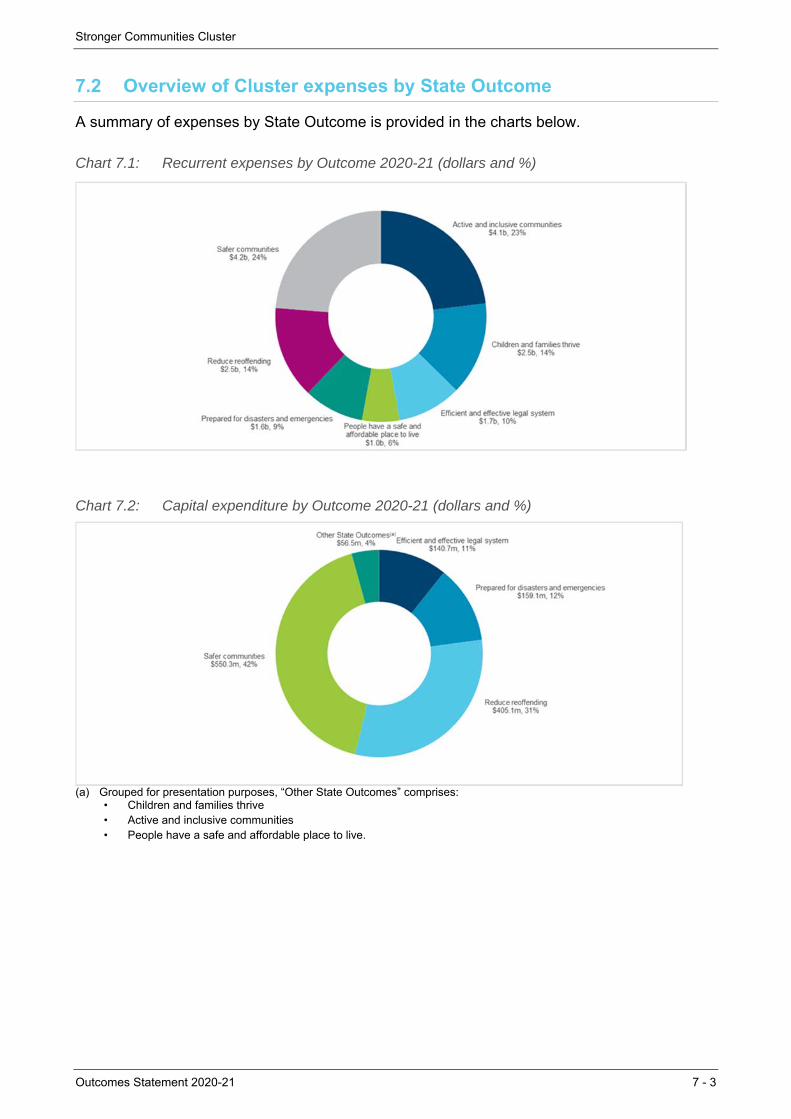
Stronger Communities Cluster
Outcomes Statement 2020-21 7 - 3
7.2 Overview of Cluster expenses by State Outcome
A summary of expenses by State Outcome is provided in the charts below.
Chart 7.1: Recurrent expenses by Outcome 2020-21 (dollars and %)
Chart 7.2: Capital expenditure by Outcome 2020-21 (dollars and %)
(a) Grouped for presentation purposes, “Other State Outcomes” comprises:
• Children and families thrive • Active and inclusive communities • People have a safe and affordable place to live.
Stronger Communities Cluster
7 - 4 Outcomes Statement 2020-21
7.3 Outcome 1: Active and inclusive communities
State Outcome overview and 2020-21 investment
This Outcome captures the range of programs and support services that aim to improve wellbeing, increase physical activity and community participation, and promote community harmony, social inclusion and cohesion, particularly for participants in the National Disability Insurance Scheme (NDIS).
Services are delivered under this Outcome by the Department of Communities and Justice (including Women NSW), Multicultural NSW, Office of the Ageing and Disability Commissioner, and the Office of Sport.
2020-21 State Outcome Budget highlights
In 2020-21, the Stronger Communities Cluster will invest $4.1 billion ($4.1 billion recurrent expenses and $26.7 million capital expenditure) in this Outcome, including:
$3.5 billion in 2020-21 ($14.7 billion over four years) in cash and in-kind contributions for individual packages and other supports for people with disability under the NDIS
$148.0 million in 2020-21 to continue the Active Kids Voucher Program to provide two $100 vouchers for families to use towards the cost of sporting activities for children
$100.0 million across 2020-21 and 2021-22, for the Greater Cities and Regional Sports Facility Fund, which aims to create spaces that enable communities to participate in sport at all levels by investing in new and existing facilities to improve sports infrastructure across Greater Sydney, Newcastle, Wollongong and regional New South Wales
$50.0 million in 2020-21 to establish a one-off, time-limited Social Sector Transformation Fund. The Fund will support small and medium sized social and health services to invest in priority areas of transformation. These areas will include technology and digital service delivery, business and operating model design and workforce capability. A grant process will be designed in partnership with the sector and applications for funding will open in early 2021 to support not-for-profits in greatest need
$39.9 million in 2020-21 ($81.4 million over three years) for the completion of critical capital works and maintenance to Stadium Australia (in the Planning, Industry and Environment Cluster) to ensure the stadium remains fit-for-purpose to host major events, including the 2023 FIFA Women’s World Cup
$27.1 million in 2020-21 ($112.5 million over four years) to continue existing disability inclusion services including to support resident rights in disability group homes, authorise restrictive practices, facilitate a new Disability Advocacy Futures Program and lead the development of Disability Inclusion Action Planning in New South Wales
$9.0 million in 2020-21 to extend targeted investments in food charities, OzHarvest and Foodbank, to provide support for people experiencing food insecurity, particularly arising from the COVID-19 pandemic
$5.0 million in 2020-21 ($10.0 million over two years) for grants to support women returning to paid employment following extended time away from the workforce
$4.0 million in 2020-21 to provide additional support to vulnerable temporary visa holders and asylum seekers during the COVID-19 pandemic
$4.1 billion
Recurrent Expenses 2020-21
$26.7 million
Capital Expenditure2020-21
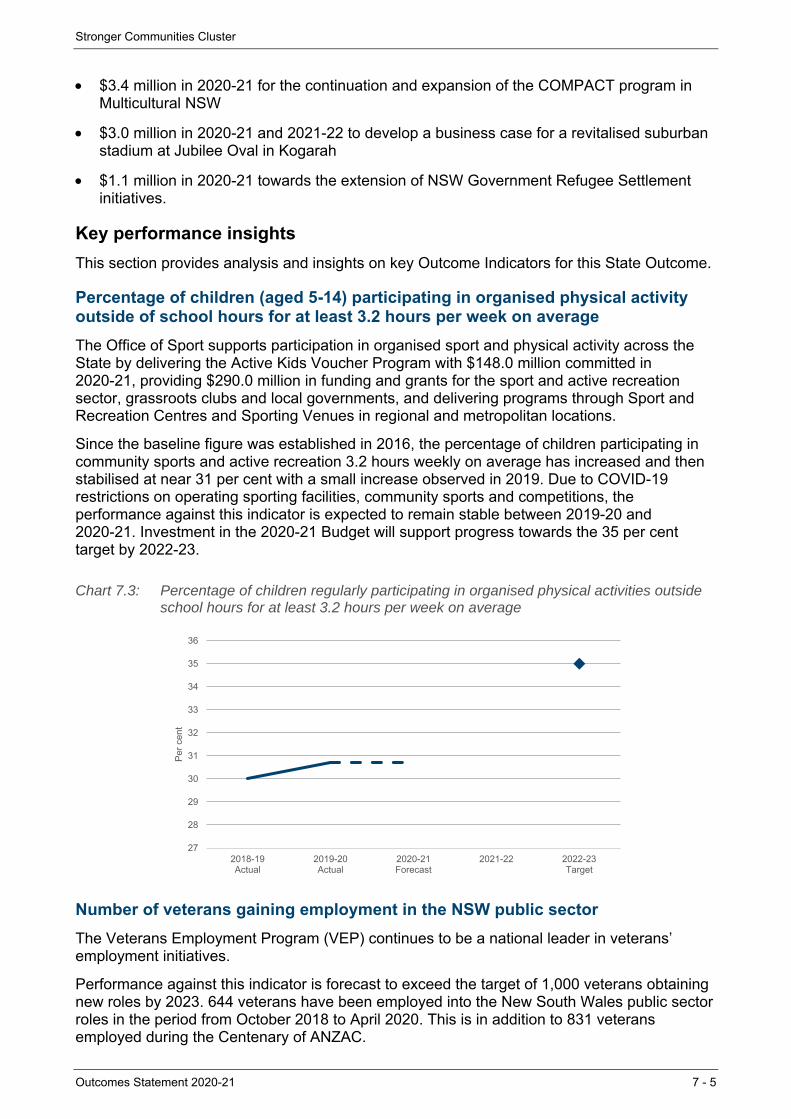
Stronger Communities Cluster
Outcomes Statement 2020-21 7 - 5
$3.4 million in 2020-21 for the continuation and expansion of the COMPACT program in Multicultural NSW
$3.0 million in 2020-21 and 2021-22 to develop a business case for a revitalised suburban stadium at Jubilee Oval in Kogarah
$1.1 million in 2020-21 towards the extension of NSW Government Refugee Settlement initiatives.
Key performance insights
This section provides analysis and insights on key Outcome Indicators for this State Outcome.
Percentage of children (aged 5-14) participating in organised physical activity outside of school hours for at least 3.2 hours per week on average
The Office of Sport supports participation in organised sport and physical activity across the State by delivering the Active Kids Voucher Program with $148.0 million committed in 2020-21, providing $290.0 million in funding and grants for the sport and active recreation sector, grassroots clubs and local governments, and delivering programs through Sport and Recreation Centres and Sporting Venues in regional and metropolitan locations.
Since the baseline figure was established in 2016, the percentage of children participating in community sports and active recreation 3.2 hours weekly on average has increased and then stabilised at near 31 per cent with a small increase observed in 2019. Due to COVID-19 restrictions on operating sporting facilities, community sports and competitions, the performance against this indicator is expected to remain stable between 2019-20 and 2020-21. Investment in the 2020-21 Budget will support progress towards the 35 per cent target by 2022-23.
Chart 7.3: Percentage of children regularly participating in organised physical activities outside school hours for at least 3.2 hours per week on average
Number of veterans gaining employment in the NSW public sector
The Veterans Employment Program (VEP) continues to be a national leader in veterans’ employment initiatives.
Performance against this indicator is forecast to exceed the target of 1,000 veterans obtaining new roles by 2023. 644 veterans have been employed into the New South Wales public sector roles in the period from October 2018 to April 2020. This is in addition to 831 veterans employed during the Centenary of ANZAC.
27
28
29
30
31
32
33
34
35
36
2018-19Actual
2019-20Actual
2020-21Forecast
2021-22 2022-23Target
Per
cen
t
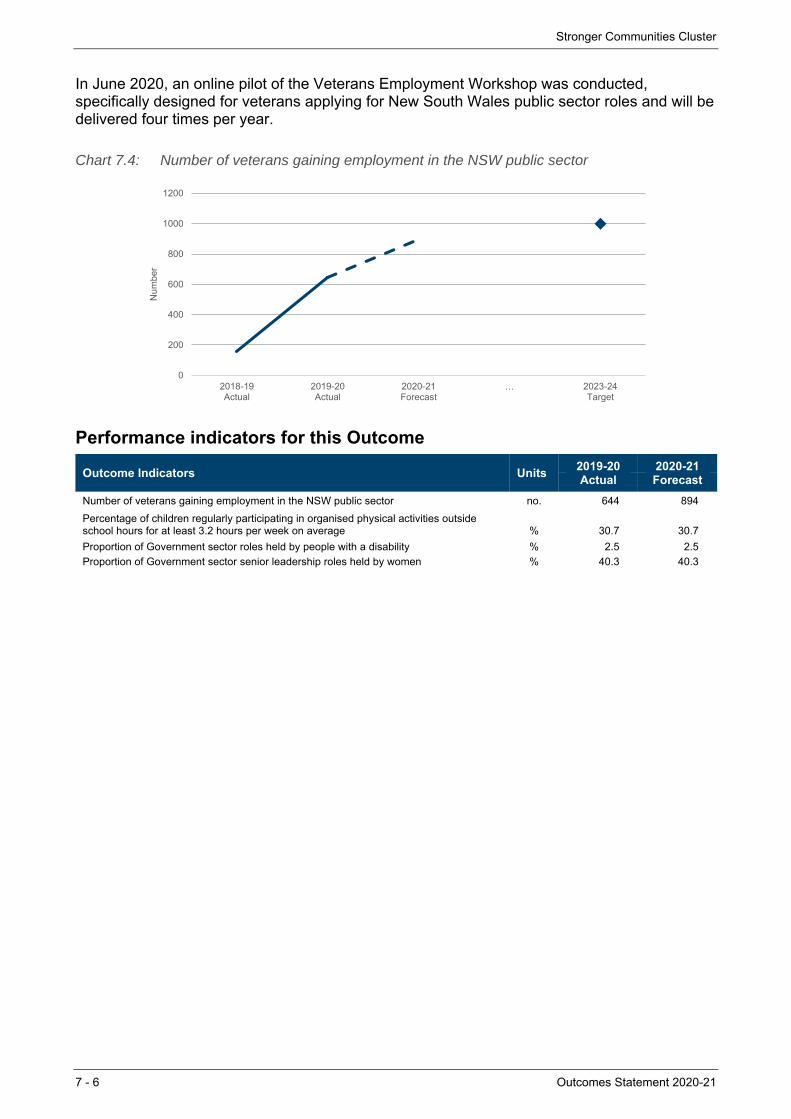
Stronger Communities Cluster
7 - 6 Outcomes Statement 2020-21
In June 2020, an online pilot of the Veterans Employment Workshop was conducted, specifically designed for veterans applying for New South Wales public sector roles and will be delivered four times per year.
Chart 7.4: Number of veterans gaining employment in the NSW public sector
Performance indicators for this Outcome
Outcome Indicators Units 2019-20 2020-21Actual Forecast
Number of veterans gaining employment in the NSW public sector no. 644 894
Percentage of children regularly participating in organised physical activities outside school hours for at least 3.2 hours per week on average % 30.7 30.7
Proportion of Government sector roles held by people with a disability % 2.5 2.5
Proportion of Government sector senior leadership roles held by women % 40.3 40.3
0
200
400
600
800
1000
1200
2018-19Actual
2019-20Actual
2020-21Forecast
… 2023-24Target
Num
ber

Stronger Communities Cluster
Outcomes Statement 2020-21 7 - 7
7.4 Outcome 2: Children and families thrive
State Outcome overview and 2020-21 investment
This Outcome focuses on ensuring the safety and wellbeing of vulnerable, children, young people and families, protecting them from the risk of harm, abuse and neglect. Services supporting this Outcome are delivered by the Department of Communities and Justice and the Office of the Children’s Guardian.
This work also supports the Premier’s Priorities to protect our most vulnerable children, increase permanency for children in out-of-home-care, and reduce domestic violence reoffending.
2020-21 State Outcome Budget highlights
In 2020-21, the Stronger Communities Cluster will invest $2.6 billion ($2.5 billion recurrent expenses and $21.9 million capital expenditure) in this Outcome, including:
$1.4 billion in 2020-21 to support the safety, welfare and wellbeing of vulnerable children in out-of-home care and permanency support
$160.5 million in 2020-21 ($538.1 million over four years) to reduce domestic and family violence re-offending and support victim safety through the continuation of early intervention initiatives, victim support and perpetrator interventions
$41.4 million in 2020-21 (up to $171.9 million over four years) to continue supporting evidence-based interventions for vulnerable children and families, such as Multisystemic Therapy for Child Abuse and Neglect (MST-CAN) and Functional Family Therapy Child Welfare (FFT-CW) services
$3.1 million in 2020-21 to boost frontline support services for those at risk of domestic violence, as part of the NSW Government’s response to the COVID-19 pandemic.
Key performance insights
This section provides analysis and insights on key Outcome Indicators for this State Outcome.
Number of people charged with a domestic violence (DV) assault who had an earlier domestic assault charge in the last 12 months
Performance against this indicator has been challenging. In the 12 months to June 2020, there were 1,797 DV assault reoffenders, 17 less than the 2015 baseline. There has been a slight decrease in the number of reoffenders since the baseline with more work to be done to meet the target by 2023.
In recognition of the complex nature of domestic violence and reoffending behaviours, the NSW Government continues to develop and deliver evidence-based programs to address challenges and reduce DV reoffending in the short and long-term.
Family preservation programs (e.g. MST-CAN) aimed at reducing Domestic and Family Violence (DFV) reoffending will continue to receive investment to address the underlying trauma that results in harm to children, young people and families. Early intervention, victim support, and perpetrator intervention initiatives that have demonstrable success in reducing DFV reoffending will also receive investment. These programs have also received an additional investment in 2020-21 to support victims of DFV during the COVID-19 pandemic.
$2.5 billion
Recurrent Expenses 2020-21
$21.9 million
Capital Expenditure2020-21
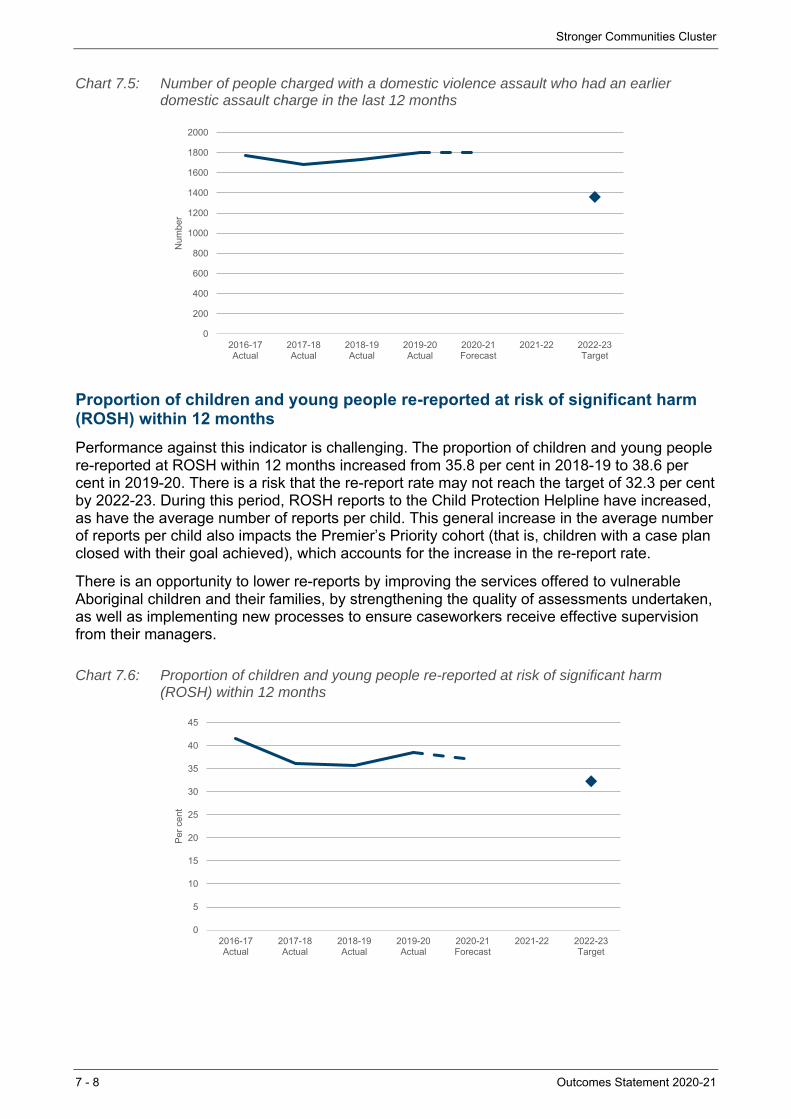
Stronger Communities Cluster
7 - 8 Outcomes Statement 2020-21
Chart 7.5: Number of people charged with a domestic violence assault who had an earlier domestic assault charge in the last 12 months
Proportion of children and young people re-reported at risk of significant harm (ROSH) within 12 months
Performance against this indicator is challenging. The proportion of children and young people re-reported at ROSH within 12 months increased from 35.8 per cent in 2018-19 to 38.6 per cent in 2019-20. There is a risk that the re-report rate may not reach the target of 32.3 per cent by 2022-23. During this period, ROSH reports to the Child Protection Helpline have increased, as have the average number of reports per child. This general increase in the average number of reports per child also impacts the Premier’s Priority cohort (that is, children with a case plan closed with their goal achieved), which accounts for the increase in the re-report rate.
There is an opportunity to lower re-reports by improving the services offered to vulnerable Aboriginal children and their families, by strengthening the quality of assessments undertaken, as well as implementing new processes to ensure caseworkers receive effective supervision from their managers.
Chart 7.6: Proportion of children and young people re-reported at risk of significant harm (ROSH) within 12 months
0
200
400
600
800
1000
1200
1400
1600
1800
2000
2016-17Actual
2017-18Actual
2018-19Actual
2019-20Actual
2020-21Forecast
2021-22 2022-23Target
Num
ber
0
5
10
15
20
25
30
35
40
45
2016-17Actual
2017-18Actual
2018-19Actual
2019-20Actual
2020-21Forecast
2021-22 2022-23Target
Per
cen
t

Stronger Communities Cluster
Outcomes Statement 2020-21 7 - 9
Number of children and young people exiting out-of-home care (OOHC) to restoration, guardianship or adoption
Performance against this target has continued to improve although achieving the target remains challenging. In 2019-20 1,134 children and young people moved from OOHC to a permanent, safe and loving home, an increase of 8 per cent compared to 2018-19. In 2019-20, there was a 20 per cent increase in the number of children who exited OOHC to Guardianship compared with 2018-19, and a record number of open adoptions with 162 children adopted in 2019-20.
Around 2,206 children and young people entered OOHC in 2019-20, a slight decrease from 2018-19. There has been a 43 per cent reduction in all children and young people entering OOHC in NSW in 2019-20, compared to 2015-16.
Key areas identified to help drive positive outcomes and reach the target of this indicator include, recontracting preservation services and strengthening early intervention, strengthening monitoring and performance mechanisms, undertaking permanency reviews for children in long term stable placements to explore opportunities for permanency, building the sectors capability to progress case plan goals of restoration, guardianship and adoption and the implementation of the Aboriginal Case Management Policy.
Chart 7.7: Number of children and young people exiting Out-of-Home Care to restoration, guardianship or adoption
Note: The target for this indicator is 5,250 children and young people exiting OOHC to restoration, guardianship or adoption over four years to for 2022-23 and has not been included given the chart scale for presentational purposes.
Performance indicators for this Outcome
Outcome Indicators Units 2019-20 2020-21Actual Forecast
Number of children and young people exiting Out-of-Home Care to restoration, guardianship or adoption no. 1,134 1,134
Number of entries to Out-of-Home Care no. 2,206 2,200
Number of people charged with a domestic violence assault who had an earlier domestic assault charge in the last 12 months no. 1,797 1,797
Proportion of children and young people re-reported at risk of significant harm (ROSH) within 12 months % 38.6 37.0
0
200
400
600
800
1000
1200
1400
1600
2017-18Actual
2018-19Actual
2019-20Actual
2020-21Forecast
Num
ber
Stronger Communities Cluster
7 - 10 Outcomes Statement 2020-21
7.5 Outcome 3: Efficient and effective legal system
State Outcome overview and 2020-21 investment
This Outcome focuses on the resolution of matters through legal services, the administration of courts and tribunals, and client-facing justice services to victims and vulnerable people.
This Outcome captures services provided across the Department of Communities and Justice, Legal Aid NSW, the Office of the Director of Public Prosecutions, the Crown Solicitor’s Office, the Judicial Commission of NSW and NSW Trustee and Guardian.
2020-21 State Outcome Budget highlights
In 2020-21, the Stronger Communities Cluster will invest $1.9 billion ($1.7 billion recurrent expenses and $140.7 million capital expenditure) in this Outcome, including:
$55.0 million in 2020-21 and $45.0 million in 2021-22 for the Sustaining Critical Infrastructure Program, delivering infrastructure upgrades across the Department’s critical asset base, including investment in audio visual link facilities and other upgrades for courthouses and correctional centres
$32.1 million in 2020-21 ($133.4 million across four years) to continue the Government’s investment in Early Appropriate Guilty Plea reform
$30.6 million in 2020-21 ($126.9 million across four years) to maintain the increased capacity of the current District Court, continuing to reduce the backlog of cases
$17.5 million in 2020-21 ($54.5 million over three years) for a major digital courts and tribunals reform project to digitise services, improve productivity in the legal system, enhance processes and improve customer experience
$11.6 million in 2020-21 ($85.1 million over four years) to reform the fee structure of private lawyers engaged by Legal Aid NSW
$11.0 million in 2020-21 for a number of Countering Violent Extremism programs
$3.6 million in 2020-21 ($7.8 million over two years) of Commonwealth funding for Legal Aid NSW to help people with disabilities, their families, carers and supporters to access and engage with the Royal Commission into Violence, Abuse, Neglect and Exploitation of People with Disability
$1.9 million in 2020-21 ($7.9 million over four years) to continue the work of the Public Sector Prosecutions Unit.
$1.7 billion
Recurrent Expenses 2020-21
$140.7 million
Capital Expenditure2020-21

Stronger Communities Cluster
Outcomes Statement 2020-21 7 - 11
Key performance insights
This section provides analysis and insights on key Outcome Indicators for this State Outcome.
Percentage of Local Court criminal cases finalised within six months
Performance against this indicator has been affected by the need to defer cases during the early stages of the COVID-19 pandemic, which increased the pending caseload in the Local Court by approximately 25,000 cases.
Performance is expected to improve as the Local Court actively manages pending caseloads to resolve matters as quickly as possible. New investment in digitisation, funded in the 2020-21 Budget is expected to deliver productivity gains in future years that will assist in offsetting growing caseloads.
Chart 7.8: Percentage of Local Court criminal cases finalised within 6 months
Percentage of District Court criminal cases finalised within 12 months
Performance against this indicator is currently challenging. The appointment of additional judges combined with the impact of legislative reform has allowed the District Court to improve its performance against time standards. While there was a need to defer jury trials in the early stage of the COVID-19 pandemic, jury trials have now recommenced. Over the next year the District Court is expected to make good progress in recovering its past performance.
Chart 7.9: Percentage of District Court criminal cases finalised within 12 months
50
55
60
65
70
75
80
85
90
95
100
2018-19Actual
2019-20Actual
2020-21Forecast
2021-22 2022-23Target
Per
cen
t
50
55
60
65
70
75
80
2018-19Actual
2019-20Actual
2020-21Forecast
2021-22 2022-23Target
Per
cen
t
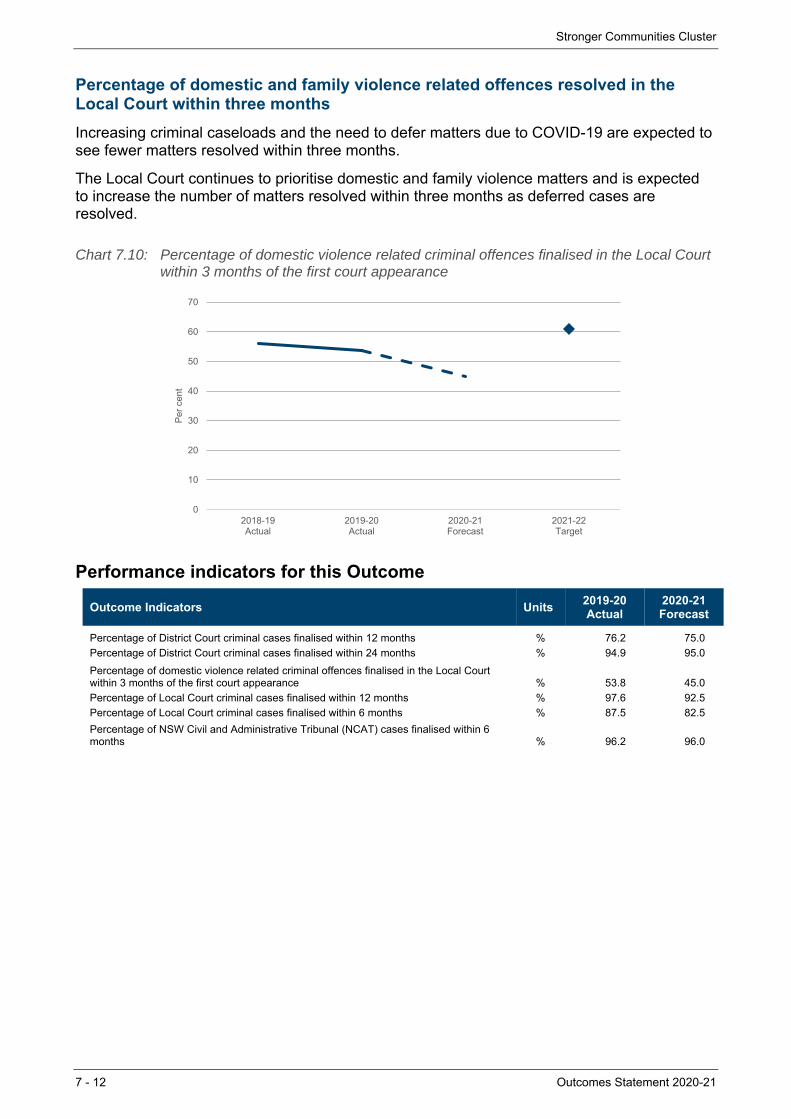
Stronger Communities Cluster
7 - 12 Outcomes Statement 2020-21
Percentage of domestic and family violence related offences resolved in the Local Court within three months
Increasing criminal caseloads and the need to defer matters due to COVID-19 are expected to see fewer matters resolved within three months.
The Local Court continues to prioritise domestic and family violence matters and is expected to increase the number of matters resolved within three months as deferred cases are resolved.
Chart 7.10: Percentage of domestic violence related criminal offences finalised in the Local Court within 3 months of the first court appearance
Performance indicators for this Outcome
Outcome Indicators Units 2019-20 2020-21Actual Forecast
Percentage of District Court criminal cases finalised within 12 months % 76.2 75.0
Percentage of District Court criminal cases finalised within 24 months % 94.9 95.0
Percentage of domestic violence related criminal offences finalised in the Local Court within 3 months of the first court appearance % 53.8 45.0
Percentage of Local Court criminal cases finalised within 12 months % 97.6 92.5
Percentage of Local Court criminal cases finalised within 6 months % 87.5 82.5
Percentage of NSW Civil and Administrative Tribunal (NCAT) cases finalised within 6 months % 96.2 96.0
0
10
20
30
40
50
60
70
2018-19Actual
2019-20Actual
2020-21Forecast
2021-22Target
Per
cen
t
Stronger Communities Cluster
Outcomes Statement 2020-21 7 - 13
7.6 Outcome 4: People have a safe and affordable place to live
State Outcome overview and 2020-21 investment
This Outcome captures the assistance provided to people who are unable to access or maintain appropriate housing. This assistance allows those in need of assistance to live independently within society.
The services supporting this Outcome are delivered by the Department of Communities and Justice, and include:
homelessness services
social housing and support.
2020-21 State Outcome Budget highlights
In 2020-21, the Stronger Communities Cluster will invest $1.0 billion ($1.0 billion recurrent expenses and $7.9 million capital expenditure) in this Outcome. Also contributing to this Outcome, the Planning, Industry and Environment Cluster will invest significant funding over four years in upgrades, maintenance and new construction of social housing properties. For more detail, refer to Chapter 8.
Investment through the Stronger Communities Cluster includes:
$291.8 million in 2020-21 to deliver a range of specialist homelessness services across New South Wales
$29.0 million spread across 2020-21 and 2021-22 to extend the Together Home initiative to deliver housing and wraparound support to break the cycle of homelessness for hundreds of people sleeping rough, building on the Government’s existing $36.0 million commitment announced in June 2020
$27.2 million in 2020-21 to assist people experiencing or at risk of homelessness access services and stay in the private rental market where possible during the COVID-19 pandemic
$17.3 million in 2020-21 to supply 53 new homes to address Aboriginal housing needs across a range of major regional and metro locations, and support employment in construction/trade industry
$14.4 million in 2020-21 and $52.4 million in 2021-22 to support the Aboriginal Community Housing (ACHP) sector to undertake maintenance, roof restoration/replacements, air-conditioning and solar power installation, and construct granny flats and extensions to improve living conditions for Aboriginal people.
$1.0 billion
Recurrent Expenses 2020-21
$7.9 million
Capital Expenditure2020-21
Stronger Communities Cluster
7 - 14 Outcomes Statement 2020-21
Key performance insights
This section provides analysis and insights on key Outcome Indicators for this State Outcome.
Number of homeless persons in NSW living in improvised dwellings, tents, or sleeping out
Performance against this indicator is on track to meet the target. This measure is assessed by using Census data, which will be available after the 2021 Census. However, the most recent City of Sydney Street Count in February 2020 showed a 23 per cent reduction in street homelessness in inner-Sydney compared with 2017.
With the spread of COVID-19, new programs were introduced to help protect those at risk. Between 1 April and 25 October 2020 of the COVID-19 pandemic 25,411 people have been assisted with temporary accommodation across NSW including 3,589 former rough sleepers. Under the Together Home program, around 273 households have transitioned from temporary accommodation to stable accommodation with wrap-around assistance to support them remaining in the tenancy.
Proportion of tenants successfully transitioning out of social housing annually
Performance against this indicator is challenging in light of unaffordability and instability in the low cost private rental market and increase in unemployment.
Future Directions for Social Housing is the Government’s ten-year vision for social housing in New South Wales. It was released in 2016, when 17.9 per cent (1,323 of 7,408) of households who exited social housing did so via successful transition to the private market. This proportion has declined since to 14 per cent (1,003 of 7,164) and 14.9 per cent (942 of 6,327) in 2018-19 and 2019-20, respectively.
Prior to COVID-19, the downward trend in positive exits was due to several factors such as unaffordability and instability in the private rental market. COVID-19 has made traditionally low paid, casual jobs less certain and has reduced the incomes of many New South Wales citizens, especially in areas of the State with a higher proportion of vulnerable households.
The NSW Government is currently developing a housing strategy for the State which will set a 20-year vision for housing in New South Wales and consider housing needs from homelessness to home ownership, including social and affordable housing and Opportunity Pathways programs. This is expected to improve housing access across the spectrum, supporting transitions out of social housing.

Stronger Communities Cluster
Outcomes Statement 2020-21 7 - 15
Chart 7.12: Proportion of tenants successfully transitioning out of social housing annually
Note: The target for this indicator is to maintain performance and has not been included in the chart for presentational purposes.
Proportion of social housing applicants each year who are diverted from social housing to the private rental market, not returning for further assistance 12 months later
Performance against this indicator is exceeding the performance target. Consistently since Future Directions was released, around 80 per cent of people receiving support under diversion programs do not need further assistance 12 months after receiving the subsidy or payment. These programs include one-off support (such as no interest bond loans) and medium-term rent subsidies in the private rental market (Rent Choice/Start Safely).
In 2018-19, 13,049 (80.3 per cent) of people receiving diversionary assistance did not require further assistance within 12 months. In 2019-20, this increased to 15,271 (81.3 per cent).
Chart 7.13: Proportion of social housing applicants each year who are diverted from social housing to the private rental market not returning for further assistance 12 months later
0
4
8
12
16
20
2016-17Actual
2017-18Actual
2018-19Actual
2019-20Actual
2020-21Forecast
Per
cen
t
50
60
70
80
90
100
2018-19Actual
2019-20Actual
2020-21Forecast
2021-22 2022-23Target
Per
cen
t
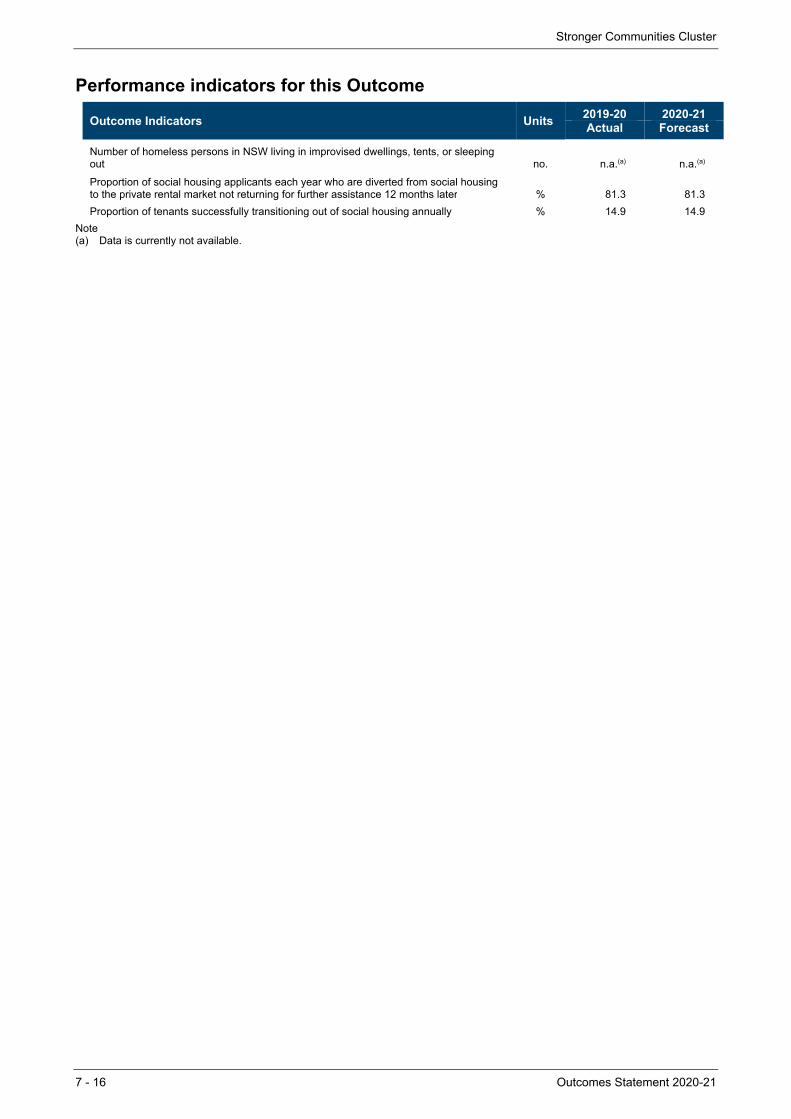
Stronger Communities Cluster
7 - 16 Outcomes Statement 2020-21
Performance indicators for this Outcome
Outcome Indicators Units 2019-20 2020-21Actual Forecast
Number of homeless persons in NSW living in improvised dwellings, tents, or sleeping out no. n.a.(a) n.a.(a)
Proportion of social housing applicants each year who are diverted from social housing to the private rental market not returning for further assistance 12 months later % 81.3 81.3
Proportion of tenants successfully transitioning out of social housing annually % 14.9 14.9
Note (a) Data is currently not available.
Stronger Communities Cluster
Outcomes Statement 2020-21 7 - 17
7.7 Outcome 5: Prepared for disasters and emergencies
State Outcome overview and 2020-21 investment
This Outcome focuses on the duties and responsibilities of the emergency services, including co-ordination of emergency prevention, preparedness, response and recovery operations. It is comprised of the operations under Fire and Rescue NSW (FRNSW), the NSW Rural Fire Service (NSW RFS), and the NSW State Emergency Service (NSW SES).
2020-21 State Outcome Budget highlights
In 2020-21, the Stronger Communities Cluster will invest $1.8 billion ($1.6 billion recurrent expenses and $159.1 million capital expenditure) in this Outcome, including:
$105.4 million ($53.9 million recurrent expenses and $51.5 million capital) over four years for the Stay Safe and Keep Operational program, which will support the expansion of the Government Radio Network across the State
$34.4 million in 2020-21 to support the replacement and refurbishment of Rural Fire Service firefighting vehicles
$10.7 million in 2020-21 ($9.7 million recurrent expenses and $1.0 million capital) for additional bushfire hazard reduction across New South Wales to reduce fuel loads and protect lives and property.
The Government’s response to the NSW Bushfire Inquiry invests $192.2 million over five years to protecting life, property and supporting our emergency management personnel. Key initiatives include:
$36.0 million for a new first responder mental health strategy for emergency services
$23.0 million in additional personal protective clothing for frontline firefighters
$17.0 million to retrofit NSW RFS and NSW National Parks and Wildlife Service vehicles and replace FRNSW tankers
$9.5 million to fund initial priority works for the fire trail network
$8.3 million extension of an integrated dispatch system for the NSW RFS
$5.4 million enhancements to the NSW RFS aerial fleet and training facilities
$2.9 million to deliver critical equipment for 31 multi-agency Emergency Operations Centres
$2.8 million improvements to NSW RFS’s Fires Near Me app
Funding is also allocated to agencies outside the Stronger Communities Cluster including Resilience NSW and National Parks and Wildlife Service.
$1.6 billion
Recurrent Expenses 2020-21
$159.1 million
Capital Expenditure2020-21
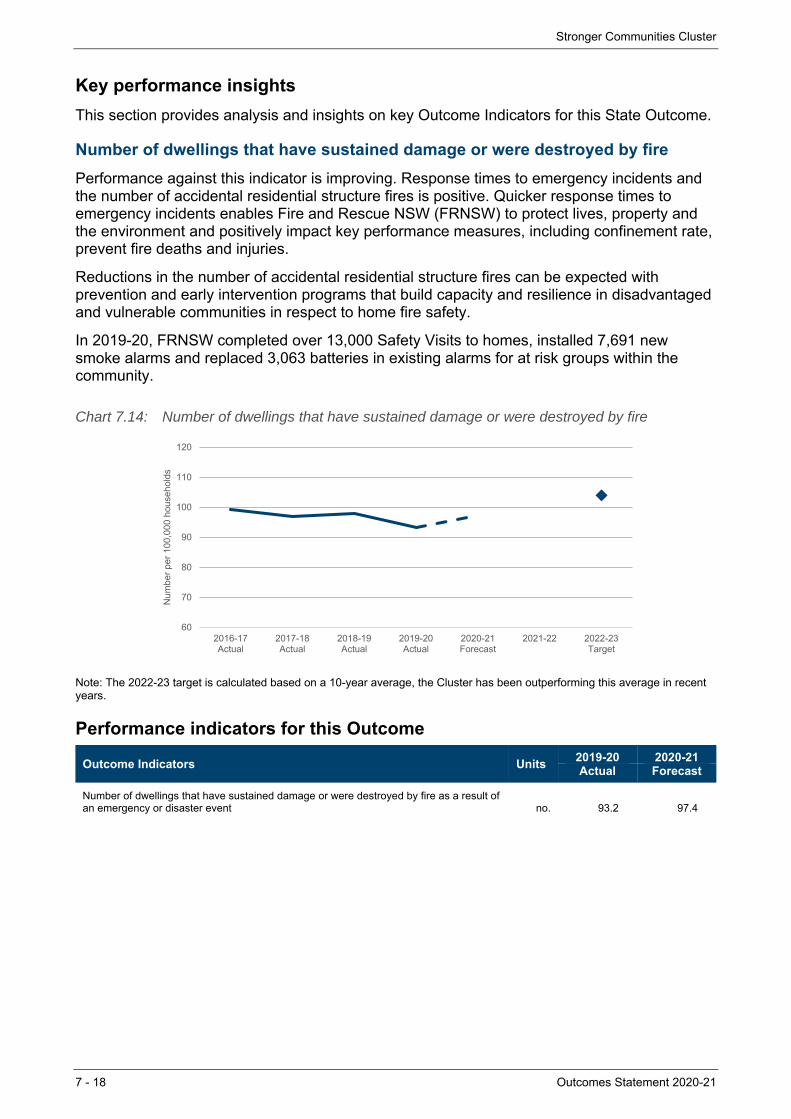
Stronger Communities Cluster
7 - 18 Outcomes Statement 2020-21
Key performance insights
This section provides analysis and insights on key Outcome Indicators for this State Outcome.
Number of dwellings that have sustained damage or were destroyed by fire
Performance against this indicator is improving. Response times to emergency incidents and the number of accidental residential structure fires is positive. Quicker response times to emergency incidents enables Fire and Rescue NSW (FRNSW) to protect lives, property and the environment and positively impact key performance measures, including confinement rate, prevent fire deaths and injuries.
Reductions in the number of accidental residential structure fires can be expected with prevention and early intervention programs that build capacity and resilience in disadvantaged and vulnerable communities in respect to home fire safety.
In 2019-20, FRNSW completed over 13,000 Safety Visits to homes, installed 7,691 new smoke alarms and replaced 3,063 batteries in existing alarms for at risk groups within the community.
Chart 7.14: Number of dwellings that have sustained damage or were destroyed by fire
Note: The 2022-23 target is calculated based on a 10-year average, the Cluster has been outperforming this average in recent years.
Performance indicators for this Outcome
Outcome Indicators Units 2019-20 2020-21Actual Forecast
Number of dwellings that have sustained damage or were destroyed by fire as a result of an emergency or disaster event no. 93.2 97.4
60
70
80
90
100
110
120
2016-17Actual
2017-18Actual
2018-19Actual
2019-20Actual
2020-21Forecast
2021-22 2022-23Target
Num
ber
per
100,
000
hous
ehol
ds
Stronger Communities Cluster
Outcomes Statement 2020-21 7 - 19
7.8 Outcome 6: Reduce reoffending
State Outcome overview and 2020-21 investment
This Outcome relates to the State’s corrections system, including support for, and management of, adult and juvenile offenders in correctional centres and the community.
The Cluster works to achieve this Outcome through focusing on the following strategic priorities:
reducing adult and juvenile reoffending
reducing domestic violence reoffending in both adults and juveniles
addressing Aboriginal overrepresentation in both adult and youth justice systems
addressing the needs of women and young female offenders
countering terrorism and violent extremism.
2020-21 State Outcome Budget highlights
In 2020-21, the Stronger Communities Cluster will invest $2.9 billion ($2.5 billion recurrent expenses and $405.1 million capital expenditure) in this Outcome, including:
$108.8 million in 2020-21 ($451.8 million across four years) to support the continuation of programs including the Strategy to Reduce Reoffending and the Electronic Monitoring of Sex Offenders
$18.6 million ($3.4 million recurrent expenditure and $15.2 million capital) over four years for body scanners for correctional centres
$9.9 million in 2020-21 to improve Youth Justice security infrastructure, invest in information technology enhancements and deliver priority reforms in response to the Shearer report to improve centre safety for staff and detainees
$8.6 million in 2020-21 to continue flagship programs to divert young people away from the criminal justice system including early intervention scheme ‘Youth on Track’ and diversion scheme ‘A Place to Go’.
$2.5 billion
Recurrent Expenses 2020-21
$405.1 million
Capital Expenditure2020-21
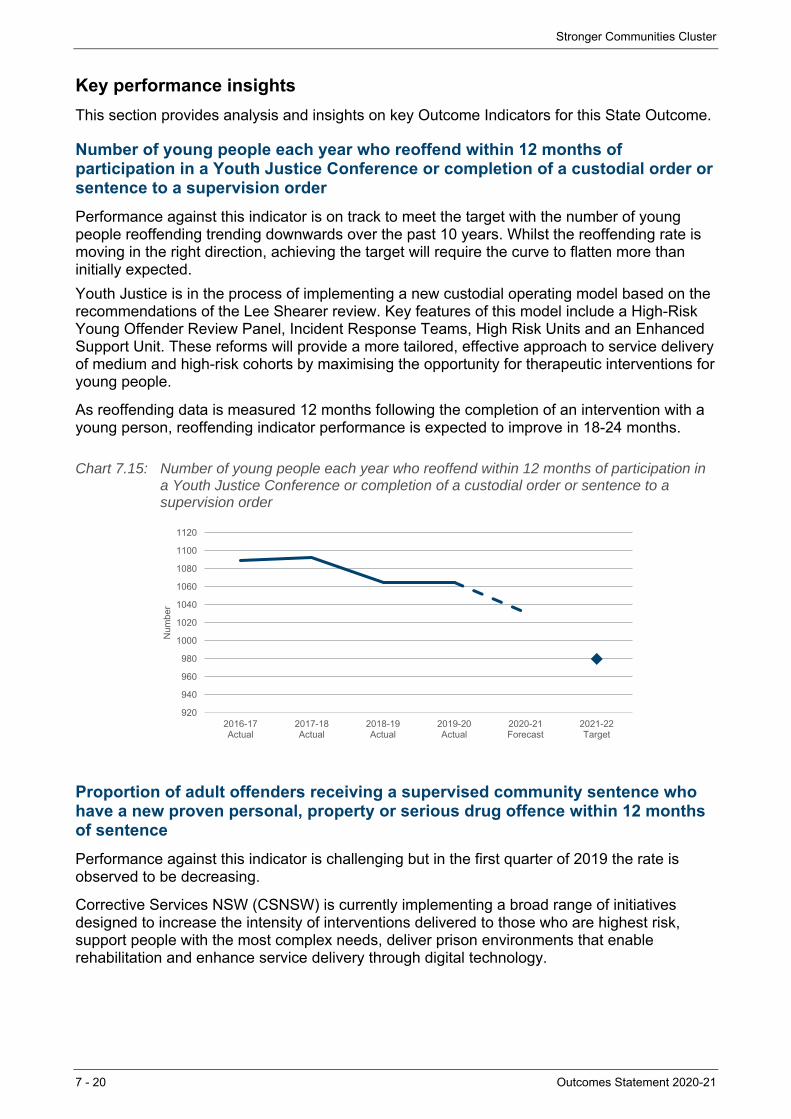
Stronger Communities Cluster
7 - 20 Outcomes Statement 2020-21
Key performance insights
This section provides analysis and insights on key Outcome Indicators for this State Outcome.
Number of young people each year who reoffend within 12 months of participation in a Youth Justice Conference or completion of a custodial order or sentence to a supervision order
Performance against this indicator is on track to meet the target with the number of young people reoffending trending downwards over the past 10 years. Whilst the reoffending rate is moving in the right direction, achieving the target will require the curve to flatten more than initially expected.
Youth Justice is in the process of implementing a new custodial operating model based on the recommendations of the Lee Shearer review. Key features of this model include a High-Risk Young Offender Review Panel, Incident Response Teams, High Risk Units and an Enhanced Support Unit. These reforms will provide a more tailored, effective approach to service delivery of medium and high-risk cohorts by maximising the opportunity for therapeutic interventions for young people.
As reoffending data is measured 12 months following the completion of an intervention with a young person, reoffending indicator performance is expected to improve in 18-24 months.
Chart 7.15: Number of young people each year who reoffend within 12 months of participation in a Youth Justice Conference or completion of a custodial order or sentence to a supervision order
Proportion of adult offenders receiving a supervised community sentence who have a new proven personal, property or serious drug offence within 12 months of sentence
Performance against this indicator is challenging but in the first quarter of 2019 the rate is observed to be decreasing.
Corrective Services NSW (CSNSW) is currently implementing a broad range of initiatives designed to increase the intensity of interventions delivered to those who are highest risk, support people with the most complex needs, deliver prison environments that enable rehabilitation and enhance service delivery through digital technology.
920
940
960
980
1000
1020
1040
1060
1080
1100
1120
2016-17Actual
2017-18Actual
2018-19Actual
2019-20Actual
2020-21Forecast
2021-22Target
Num
ber

Stronger Communities Cluster
Outcomes Statement 2020-21 7 - 21
Chart 7.16: Proportion of adult offenders receiving a supervised community sentence who have a new proven personal, property or serious drug offence within 12 months of sentence
Proportion of adult offenders released from custody who have a new proven personal, property or serious drug offence in the 12 months following release
Performance against this indicator is challenging. People on supervised or community-based orders represent the largest cohort of offenders managed by CSNSW at approximately 35,000 people. The delivery of rehabilitation and support for this cohort reduces the likelihood of reoffending and is critical in improving community safety and ensuring people do not become further entrenched in the criminal justice system.
There has been some improvement when the quarterly (rather than annual) reoffending rate is considered. Over the past two quarters, the rate of reoffending has reduced 30.4 per cent in Q4 2018 and 29.6 per cent in Q1 2019. The fall in the reoffending rate in the most recent quarter was greater for females than males.
Chart 7.17: Proportion of adult offenders released from custody who have a new proven personal, property or serious drug offence in the 12 months following release
0
2
4
6
8
10
12
14
2015-16Actual
2016-17Actual
2017-18Actual
2018-19Actual
2019-20Forecast
… 2022-23Target
Per
cen
t
0
5
10
15
20
25
30
35
2015-16Actual
2016-17Actual
2017-18Actual
2018-19Actual
2019-20Forecast
… 2022-23Target
Per
cen
t
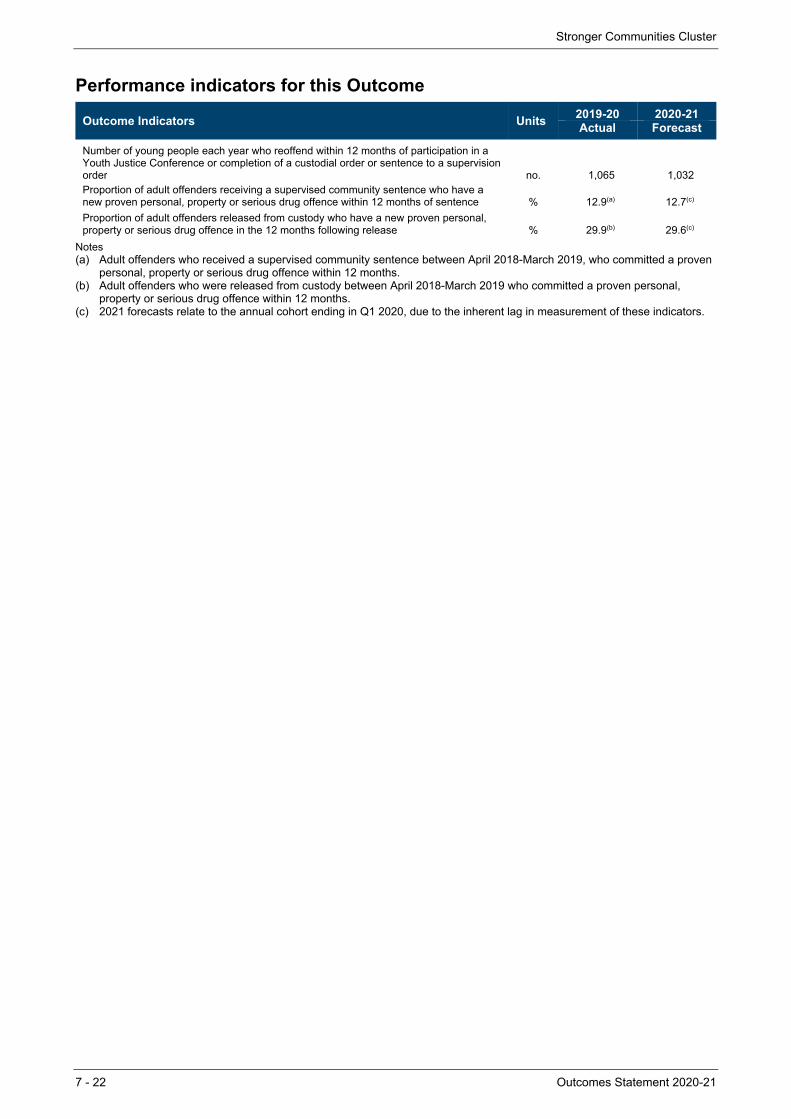
Stronger Communities Cluster
7 - 22 Outcomes Statement 2020-21
Performance indicators for this Outcome
Outcome Indicators Units 2019-20 2020-21Actual Forecast
Number of young people each year who reoffend within 12 months of participation in a Youth Justice Conference or completion of a custodial order or sentence to a supervision order no. 1,065 1,032Proportion of adult offenders receiving a supervised community sentence who have a new proven personal, property or serious drug offence within 12 months of sentence % 12.9(a) 12.7(c)
Proportion of adult offenders released from custody who have a new proven personal, property or serious drug offence in the 12 months following release % 29.9(b) 29.6(c)
Notes (a) Adult offenders who received a supervised community sentence between April 2018-March 2019, who committed a proven
personal, property or serious drug offence within 12 months. (b) Adult offenders who were released from custody between April 2018-March 2019 who committed a proven personal,
property or serious drug offence within 12 months. (c) 2021 forecasts relate to the annual cohort ending in Q1 2020, due to the inherent lag in measurement of these indicators.
Stronger Communities Cluster
Outcomes Statement 2020-21 7 - 23
7.9 Outcome 7: Safer communities
This Outcome captures activities relating to preventing, detecting and investigating crime; maintaining social order and community safety; promoting road safety and supporting emergency management.
This Outcome is delivered by the NSW Police Force and the NSW Crime Commission, who focus on:
preventing, disrupting and responding to crime, including serious and organised criminal activities
monitoring and promoting road safety
maintaining social order
performing and coordinating emergency and rescue operations
confiscating the proceeds of crime.
2020-21 State Outcome Budget highlights
In 2020-21, the Stronger Communities Cluster will invest $4.8 billion ($4.2 billion recurrent expenses and $550.3 million capital expenditure) in this Outcome, including:
$61.4 million in 2020-21 for police resourcing costs associated with the COVID-19 hotel quarantine operations and to support the Victorian border operations
$60.0 million over three years for the Goulburn Police Academy to upgrade training facilities, student rooms and parade ground
$41.2 million in 2020-21 for 250 additional police. These will join the 450 police recruited in 2019-20, as part of the State’s commitment to deliver 1,500 new police over four years to enhance the State’s crime fighting capability and keep the community safe
$30.4 million to complete the $47.8 million Future Light Helicopter Program replacing PolAir 1, 3 and 4
$21.0 million over two years to implement the Law Enforcement Monitoring Facility to enable telecommunications interception in criminal investigations
$15.0 million in 2020-21 ($37.7 million over two years) for property related capital works program in metropolitan and rural areas. These works include commencement of new or replacement police stations under the Regional Small Station Program, heating ventilation and air conditioning, disaster resilience, facade cladding remediation, female amenities upgrade, solar panel programs, security upgrades and minor works.
$4.2 billion
Recurrent Expenses 2020-21
$550.3 million
Capital Expenditure2020-21
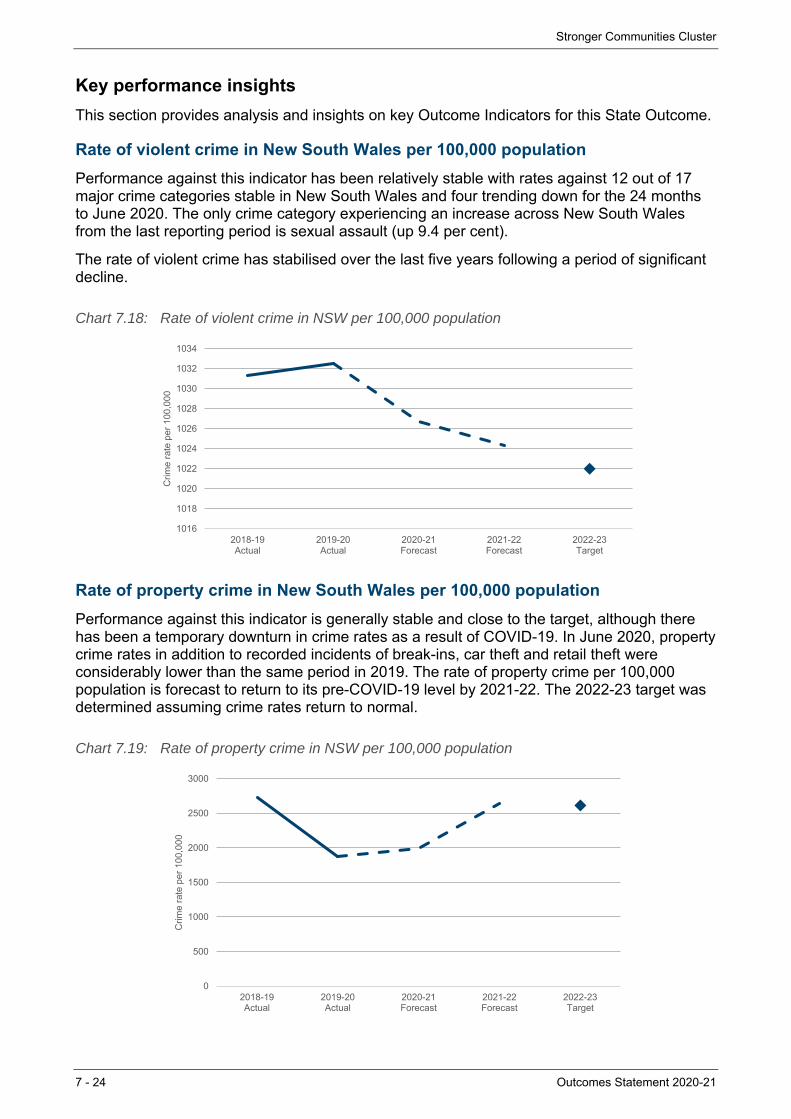
Stronger Communities Cluster
7 - 24 Outcomes Statement 2020-21
Key performance insights
This section provides analysis and insights on key Outcome Indicators for this State Outcome.
Rate of violent crime in New South Wales per 100,000 population
Performance against this indicator has been relatively stable with rates against 12 out of 17 major crime categories stable in New South Wales and four trending down for the 24 months to June 2020. The only crime category experiencing an increase across New South Wales from the last reporting period is sexual assault (up 9.4 per cent).
The rate of violent crime has stabilised over the last five years following a period of significant decline.
Chart 7.18: Rate of violent crime in NSW per 100,000 population
Rate of property crime in New South Wales per 100,000 population
Performance against this indicator is generally stable and close to the target, although there has been a temporary downturn in crime rates as a result of COVID-19. In June 2020, property crime rates in addition to recorded incidents of break-ins, car theft and retail theft were considerably lower than the same period in 2019. The rate of property crime per 100,000 population is forecast to return to its pre-COVID-19 level by 2021-22. The 2022-23 target was determined assuming crime rates return to normal.
Chart 7.19: Rate of property crime in NSW per 100,000 population
1016
1018
1020
1022
1024
1026
1028
1030
1032
1034
2018-19Actual
2019-20Actual
2020-21Forecast
2021-22Forecast
2022-23Target
Crim
e ra
te p
er 1
00,0
00
0
500
1000
1500
2000
2500
3000
2018-19Actual
2019-20Actual
2020-21Forecast
2021-22Forecast
2022-23Target
Crim
e ra
te p
er 1
00,0
00
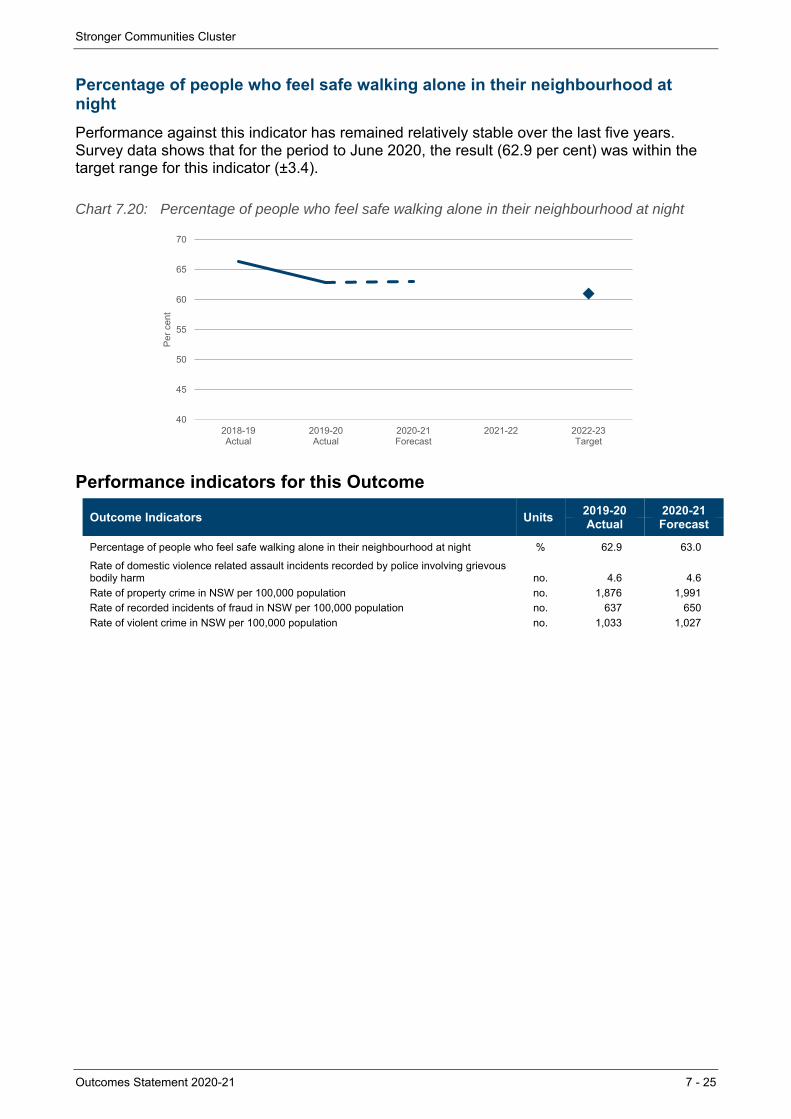
Stronger Communities Cluster
Outcomes Statement 2020-21 7 - 25
Percentage of people who feel safe walking alone in their neighbourhood at night
Performance against this indicator has remained relatively stable over the last five years. Survey data shows that for the period to June 2020, the result (62.9 per cent) was within the target range for this indicator (±3.4).
Chart 7.20: Percentage of people who feel safe walking alone in their neighbourhood at night
Performance indicators for this Outcome
Outcome Indicators Units 2019-20 2020-21Actual Forecast
Percentage of people who feel safe walking alone in their neighbourhood at night % 62.9 63.0
Rate of domestic violence related assault incidents recorded by police involving grievous bodily harm no. 4.6 4.6
Rate of property crime in NSW per 100,000 population no. 1,876 1,991
Rate of recorded incidents of fraud in NSW per 100,000 population no. 637 650
Rate of violent crime in NSW per 100,000 population no. 1,033 1,027
40
45
50
55
60
65
70
2018-19Actual
2019-20Actual
2020-21Forecast
2021-22 2022-23Target
Per
cen
t
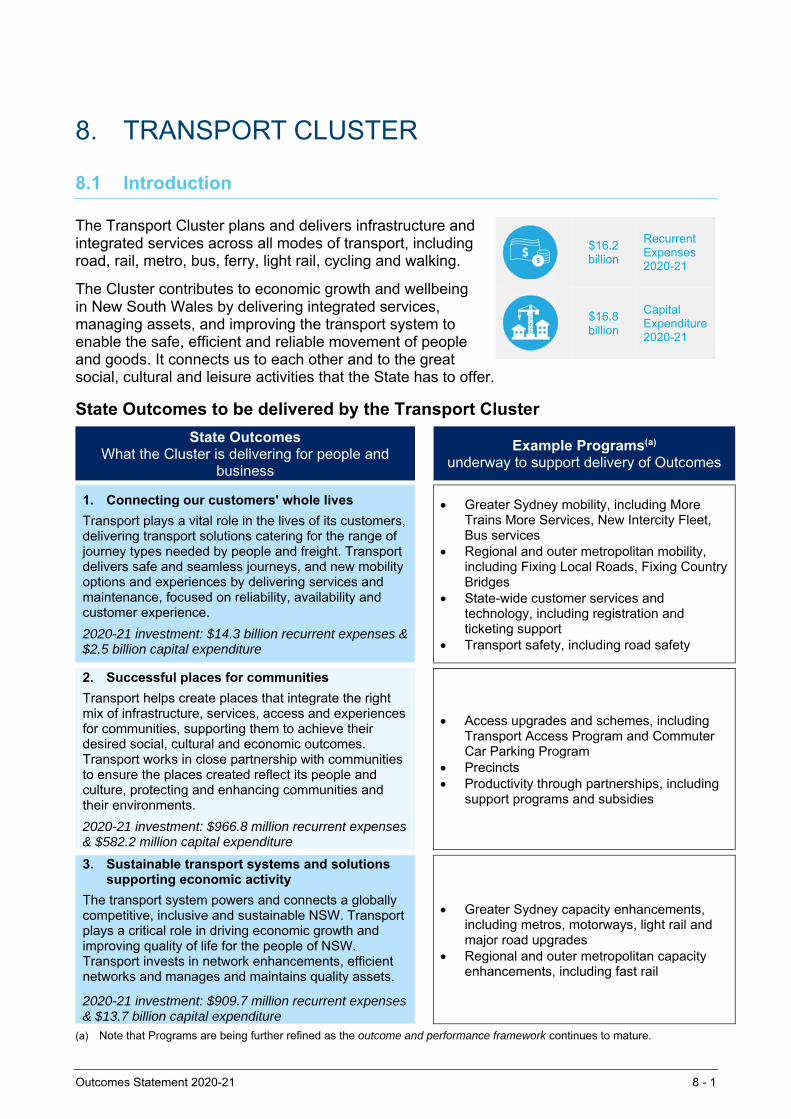
Outcomes Statement 2020-21 8 - 1
8. TRANSPORT CLUSTER
8.1 Introduction
The Transport Cluster plans and delivers infrastructure and integrated services across all modes of transport, including road, rail, metro, bus, ferry, light rail, cycling and walking.
The Cluster contributes to economic growth and wellbeing in New South Wales by delivering integrated services, managing assets, and improving the transport system to enable the safe, efficient and reliable movement of people and goods. It connects us to each other and to the great social, cultural and leisure activities that the State has to offer.
State Outcomes to be delivered by the Transport Cluster
State Outcomes What the Cluster is delivering for people and
business
Example Programs(a) underway to support delivery of Outcomes
1. Connecting our customers' whole lives
Transport plays a vital role in the lives of its customers, delivering transport solutions catering for the range of journey types needed by people and freight. Transport delivers safe and seamless journeys, and new mobility options and experiences by delivering services and maintenance, focused on reliability, availability and customer experience.
2020-21 investment: $14.3 billion recurrent expenses & $2.5 billion capital expenditure
Greater Sydney mobility, including More Trains More Services, New Intercity Fleet, Bus services
Regional and outer metropolitan mobility, including Fixing Local Roads, Fixing Country Bridges
State-wide customer services and technology, including registration and ticketing support
Transport safety, including road safety
2. Successful places for communities
Transport helps create places that integrate the right mix of infrastructure, services, access and experiences for communities, supporting them to achieve their desired social, cultural and economic outcomes. Transport works in close partnership with communities to ensure the places created reflect its people and culture, protecting and enhancing communities and their environments.
2020-21 investment: $966.8 million recurrent expenses & $582.2 million capital expenditure
Access upgrades and schemes, including Transport Access Program and Commuter Car Parking Program
Precincts Productivity through partnerships, including
support programs and subsidies
3. Sustainable transport systems and solutions supporting economic activity
The transport system powers and connects a globally competitive, inclusive and sustainable NSW. Transport plays a critical role in driving economic growth and improving quality of life for the people of NSW. Transport invests in network enhancements, efficient networks and manages and maintains quality assets.
2020-21 investment: $909.7 million recurrent expenses & $13.7 billion capital expenditure
Greater Sydney capacity enhancements, including metros, motorways, light rail and major road upgrades
Regional and outer metropolitan capacity enhancements, including fast rail
(a) Note that Programs are being further refined as the outcome and performance framework continues to mature.
$16.2 billion
Recurrent Expenses 2020-21
$16.8 billion
Capital Expenditure2020-21

Transport Cluster
8 - 2 Outcomes Statement 2020-21
8.2 Overview of Cluster expenses by State Outcome
A summary of expenses by State Outcome is provided in the charts below.
Chart 8.1: Recurrent expenses by Outcome 2020-21 (dollars and %)
(a) Grouped for presentation purposes, “Other State Outcomes” comprises:
• Successful Places for Communities • Sustainable Transport Systems and Solutions Supporting Economic Activity.
Chart 8.2: Capital expenditure by Outcome 2020-21 (dollars and %)
Connecting our customers' whole lives $15.5b, 87%
Other State Outcomes(a)
$2.2b, 13%
Connecting our customers' whole lives $2.5b, 15%
Successful Places for Communities $582.2m, 3%
Sustainable Transport Systems and Solutions Supporting
Economic Activity $13.7b, 81%
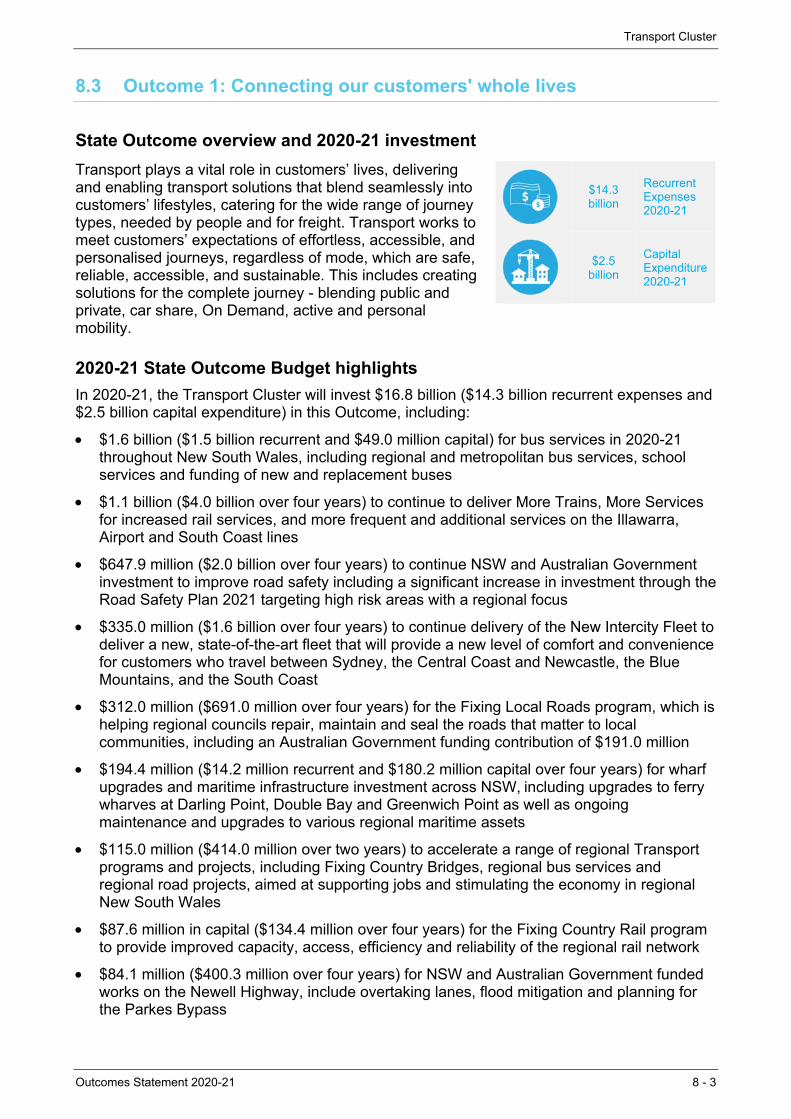
Transport Cluster
Outcomes Statement 2020-21 8 - 3
8.3 Outcome 1: Connecting our customers' whole lives
State Outcome overview and 2020-21 investment
Transport plays a vital role in customers’ lives, delivering and enabling transport solutions that blend seamlessly into customers’ lifestyles, catering for the wide range of journey types, needed by people and for freight. Transport works to meet customers’ expectations of effortless, accessible, and personalised journeys, regardless of mode, which are safe, reliable, accessible, and sustainable. This includes creating solutions for the complete journey - blending public and private, car share, On Demand, active and personal mobility.
2020-21 State Outcome Budget highlights
In 2020-21, the Transport Cluster will invest $16.8 billion ($14.3 billion recurrent expenses and $2.5 billion capital expenditure) in this Outcome, including:
$1.6 billion ($1.5 billion recurrent and $49.0 million capital) for bus services in 2020-21 throughout New South Wales, including regional and metropolitan bus services, school services and funding of new and replacement buses
$1.1 billion ($4.0 billion over four years) to continue to deliver More Trains, More Services for increased rail services, and more frequent and additional services on the Illawarra, Airport and South Coast lines
$647.9 million ($2.0 billion over four years) to continue NSW and Australian Government investment to improve road safety including a significant increase in investment through the Road Safety Plan 2021 targeting high risk areas with a regional focus
$335.0 million ($1.6 billion over four years) to continue delivery of the New Intercity Fleet to deliver a new, state-of-the-art fleet that will provide a new level of comfort and convenience for customers who travel between Sydney, the Central Coast and Newcastle, the Blue Mountains, and the South Coast
$312.0 million ($691.0 million over four years) for the Fixing Local Roads program, which is helping regional councils repair, maintain and seal the roads that matter to local communities, including an Australian Government funding contribution of $191.0 million
$194.4 million ($14.2 million recurrent and $180.2 million capital over four years) for wharf upgrades and maritime infrastructure investment across NSW, including upgrades to ferry wharves at Darling Point, Double Bay and Greenwich Point as well as ongoing maintenance and upgrades to various regional maritime assets
$115.0 million ($414.0 million over two years) to accelerate a range of regional Transport programs and projects, including Fixing Country Bridges, regional bus services and regional road projects, aimed at supporting jobs and stimulating the economy in regional New South Wales
$87.6 million in capital ($134.4 million over four years) for the Fixing Country Rail program to provide improved capacity, access, efficiency and reliability of the regional rail network
$84.1 million ($400.3 million over four years) for NSW and Australian Government funded works on the Newell Highway, include overtaking lanes, flood mitigation and planning for the Parkes Bypass
$14.3 billion
Recurrent Expenses 2020-21
$2.5 billion
Capital Expenditure2020-21
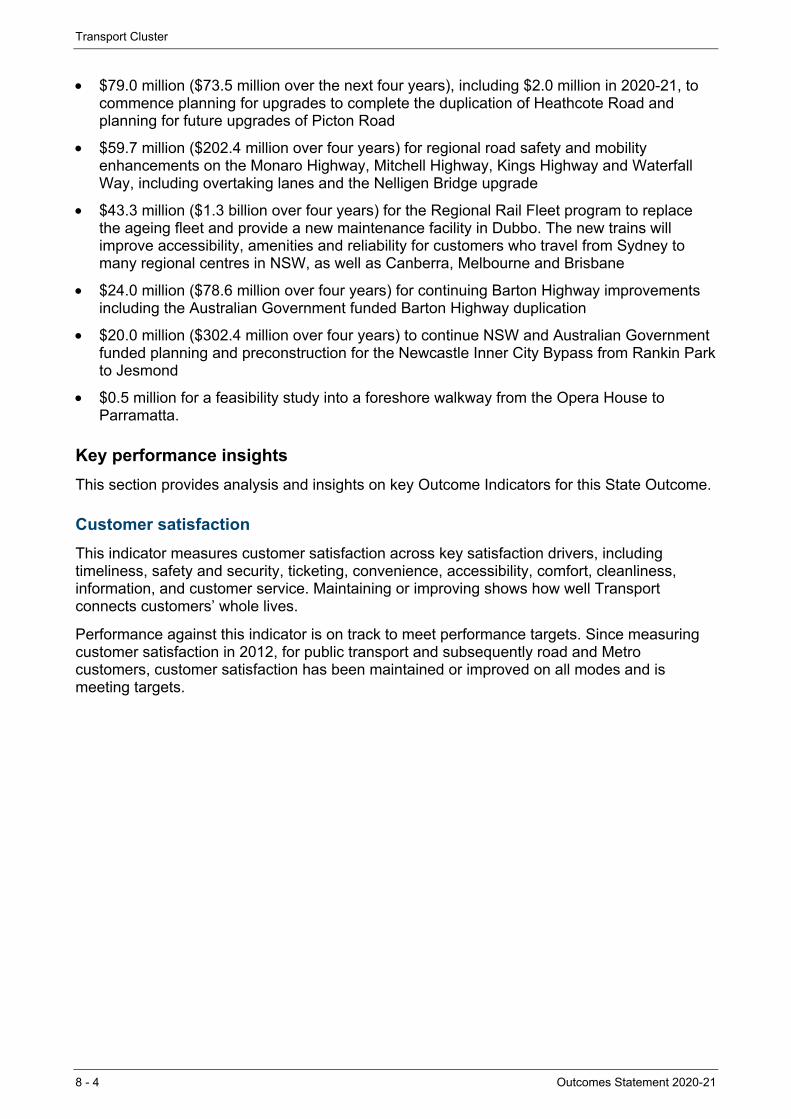
Transport Cluster
8 - 4 Outcomes Statement 2020-21
$79.0 million ($73.5 million over the next four years), including $2.0 million in 2020-21, to commence planning for upgrades to complete the duplication of Heathcote Road and planning for future upgrades of Picton Road
$59.7 million ($202.4 million over four years) for regional road safety and mobility enhancements on the Monaro Highway, Mitchell Highway, Kings Highway and Waterfall Way, including overtaking lanes and the Nelligen Bridge upgrade
$43.3 million ($1.3 billion over four years) for the Regional Rail Fleet program to replace the ageing fleet and provide a new maintenance facility in Dubbo. The new trains will improve accessibility, amenities and reliability for customers who travel from Sydney to many regional centres in NSW, as well as Canberra, Melbourne and Brisbane
$24.0 million ($78.6 million over four years) for continuing Barton Highway improvements including the Australian Government funded Barton Highway duplication
$20.0 million ($302.4 million over four years) to continue NSW and Australian Government funded planning and preconstruction for the Newcastle Inner City Bypass from Rankin Park to Jesmond
$0.5 million for a feasibility study into a foreshore walkway from the Opera House to Parramatta.
Key performance insights
This section provides analysis and insights on key Outcome Indicators for this State Outcome.
Customer satisfaction
This indicator measures customer satisfaction across key satisfaction drivers, including timeliness, safety and security, ticketing, convenience, accessibility, comfort, cleanliness, information, and customer service. Maintaining or improving shows how well Transport connects customers’ whole lives.
Performance against this indicator is on track to meet performance targets. Since measuring customer satisfaction in 2012, for public transport and subsequently road and Metro customers, customer satisfaction has been maintained or improved on all modes and is meeting targets.
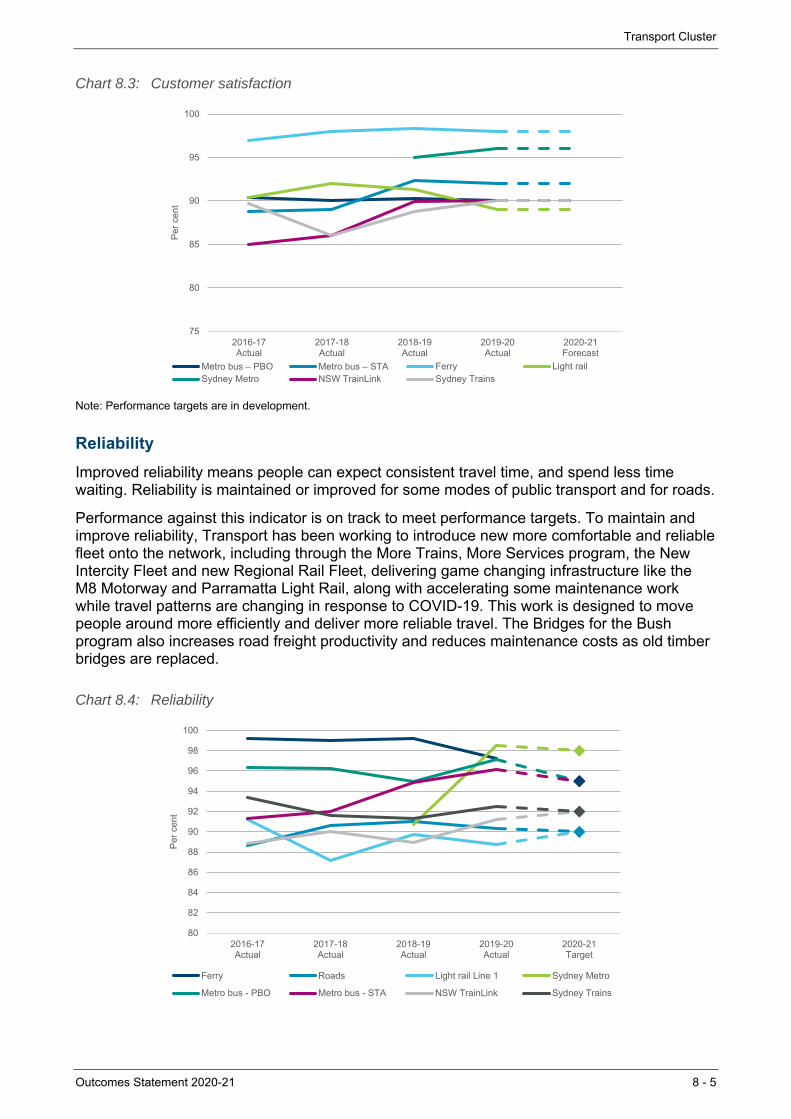
Transport Cluster
Outcomes Statement 2020-21 8 - 5
Chart 8.3: Customer satisfaction
Note: Performance targets are in development.
Reliability
Improved reliability means people can expect consistent travel time, and spend less time waiting. Reliability is maintained or improved for some modes of public transport and for roads.
Performance against this indicator is on track to meet performance targets. To maintain and improve reliability, Transport has been working to introduce new more comfortable and reliable fleet onto the network, including through the More Trains, More Services program, the New Intercity Fleet and new Regional Rail Fleet, delivering game changing infrastructure like the M8 Motorway and Parramatta Light Rail, along with accelerating some maintenance work while travel patterns are changing in response to COVID-19. This work is designed to move people around more efficiently and deliver more reliable travel. The Bridges for the Bush program also increases road freight productivity and reduces maintenance costs as old timber bridges are replaced.
Chart 8.4: Reliability
75
80
85
90
95
100
2016-17Actual
2017-18Actual
2018-19Actual
2019-20Actual
2020-21Forecast
Per
cen
t
Metro bus – PBO Metro bus – STA Ferry Light railSydney Metro NSW TrainLink Sydney Trains
80
82
84
86
88
90
92
94
96
98
100
2016-17Actual
2017-18Actual
2018-19Actual
2019-20Actual
2020-21Target
Per
cen
t
Ferry Roads Light rail Line 1 Sydney Metro
Metro bus - PBO Metro bus - STA NSW TrainLink Sydney Trains
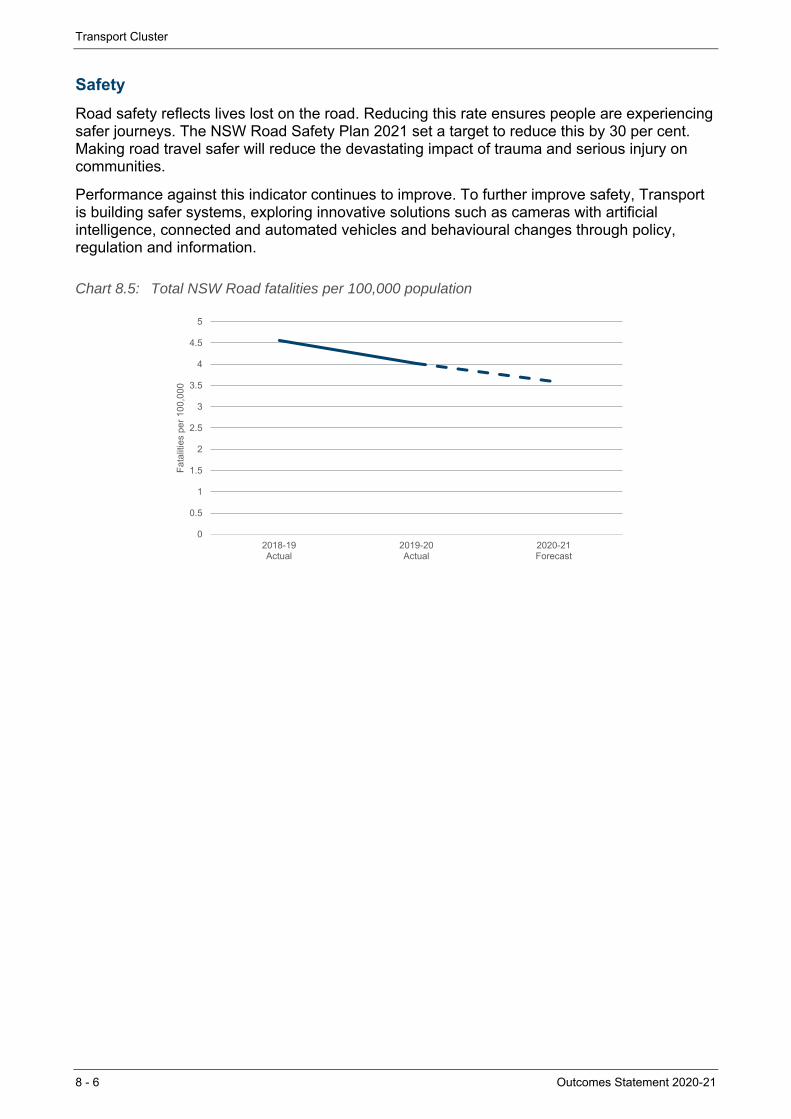
Transport Cluster
8 - 6 Outcomes Statement 2020-21
Safety
Road safety reflects lives lost on the road. Reducing this rate ensures people are experiencing safer journeys. The NSW Road Safety Plan 2021 set a target to reduce this by 30 per cent. Making road travel safer will reduce the devastating impact of trauma and serious injury on communities.
Performance against this indicator continues to improve. To further improve safety, Transport is building safer systems, exploring innovative solutions such as cameras with artificial intelligence, connected and automated vehicles and behavioural changes through policy, regulation and information.
Chart 8.5: Total NSW Road fatalities per 100,000 population
0
0.5
1
1.5
2
2.5
3
3.5
4
4.5
5
2018-19Actual
2019-20Actual
2020-21Forecast
Fat
aliti
es p
er 1
00,0
00

Transport Cluster
Outcomes Statement 2020-21 8 - 7
Performance indicators for this Outcome
Outcome Indicators (a) Units 2019-20 2020-21Actual Forecast
Customer satisfaction %
Sydney Metro bus – PBO(b) 90.0 ≥90
Sydney Metro bus – STA 92.0 ≥92
Ferry 98.0 ≥98
Light rail 89.0 ≥89
Sydney Metro 96.0 ≥96
NSW TrainLink 90.0 ≥90
Sydney Trains 90.0 ≥90
Day-return regional - per cent of regional population with access to public transport day-return to nearest city or major centre % 90.2 ≥90
Reliability %
on-time running (Ferry) 97.2 95.0
Road journey time reliability 90.3 90.0
headway (Light rail line 1) (c) (d) 88.7 90.0
headway (Sydney Metro) 98.5 98.0
on-time running (Metro bus – PBO)(b) 97.1 95.0
on-time running (Metro bus – STA) 96.1 95.0
on-time running (NSW TrainLink) 91.2 92.0
punctuality (Sydney Trains) 92.5 92.0
Safety - Total NSW Road fatalities per 100,000 population (e) no. 4.0 ≤3.6
Notes (a) All customer satisfaction indicators are based on November 2019 results for 2019-20. All public transport reliability
indicators for 2020-21 are targets. A customer satisfaction survey for road users was not undertaken in 2019-20 due to COVID-19.
(b) PBO: Private Bus Operator (c) A light rail service is considered on time if a headway is achieved within a two-minute tolerance. A headway is the time
between two vehicles on the light rail network. (d) Light rail line 1, is the route from Central Station to Dulwich Hill. (e) Road fatalities rate per 100,000 population is the 2019-20 preliminary 12 months result to June 2020.

Transport Cluster
8 - 8 Outcomes Statement 2020-21
8.4 Outcome 2: Successful places for communities
State Outcome overview and 2020-21 investment
Transport helps create places that integrate the right mix of infrastructure, services, access and experiences for communities, supporting them to achieve their desired social, cultural and economic outcomes. At the heart of communities are places – where people come together to interact, transact and travel to other communities. Transport works in close partnership with communities to ensure the places created reflect its people and culture, protecting and enhancing communities and their environments.
2020-21 State Outcome Budget highlights
In 2020-21, the Transport Cluster will invest $1.5 billion ($966.8 million recurrent expenses and $582.2 million capital expenditure) in this Outcome, including:
$268.0 million ($958.0 million over four years) to continue the upgrade of train stations and additional ferry wharves under the Transport Access Program to make them more accessible including new lifts, ramps and footbridges
$230.0 million ($608.2 million over four years) in NSW and Australian Government funding to provide additional car spaces through the Commuter Car Parking program
$78.5 million recurrent for the Commonwealth Home Support Program to support older individuals to stay independent and in their own home for longer by providing transportation for medical and recreational reasons
$42.1 million recurrent ($173.4 million over four years) for transport disability subsidies including the Taxi Transport Subsidy Scheme and the Wheelchair Accessible Taxi Driver Incentive Scheme
$1.0 million ($13.1 million over two years) to improve flood immunity on Wakehurst Parkway, and improve access to the Northern Beaches Hospital and other services for the local community.
Key performance insights
This section provides analysis and insights on key Outcome Indicators for this State Outcome.
Customer Satisfaction for people with disability
This indicator demonstrates that people with a disability or other mobility limitations will have the same access to services as the rest of the community - resulting in social and economic inclusion and wellbeing. Customer satisfaction for people with a disability also indicates whether people with disability have the same experience of modes as the general population.
Performance against this indicator is currently stable. Transport is delivering the Transport Access program to improve access to public transport for people with limited mobility. This includes upgrading train stations and ferry wharfs, ensuring wayfinding is more accessible. Transport is also designing and building new fleet and stations that are accessible. Sydney Metro projects are focused on inclusive place making to enhance communities.
Initiatives like the Regional Seniors Travel Card also help to support connections for people in rural and regional and remote NSW communities.
$966.8 million
Recurrent Expenses 2020-21
$582.2 million
Capital Expenditure2020-21
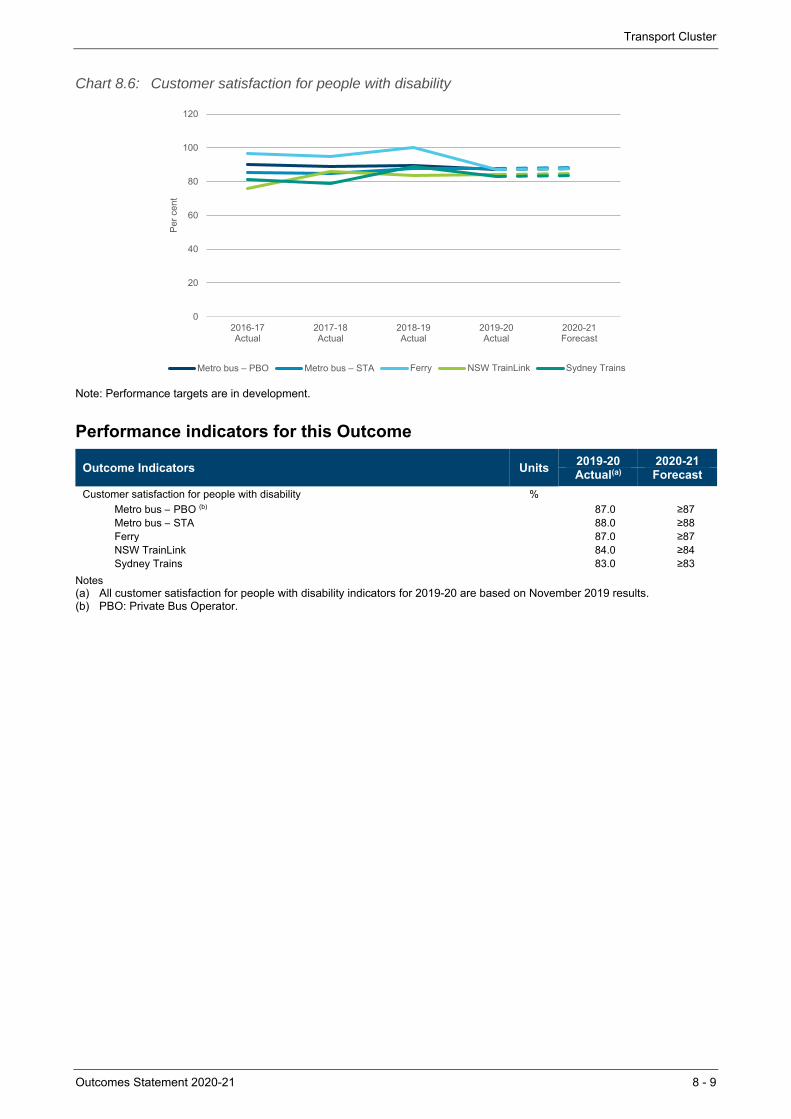
Transport Cluster
Outcomes Statement 2020-21 8 - 9
Chart 8.6: Customer satisfaction for people with disability
Note: Performance targets are in development.
Performance indicators for this Outcome
Outcome Indicators Units 2019-20 2020-21Actual(a) Forecast
Customer satisfaction for people with disability %
Metro bus – PBO (b) 87.0 ≥87Metro bus – STA 88.0 ≥88Ferry 87.0 ≥87NSW TrainLink 84.0 ≥84Sydney Trains 83.0 ≥83
Notes (a) All customer satisfaction for people with disability indicators for 2019-20 are based on November 2019 results. (b) PBO: Private Bus Operator.
0
20
40
60
80
100
120
2016-17Actual
2017-18Actual
2018-19Actual
2019-20Actual
2020-21Forecast
Per
cen
t
Metro bus – PBO Metro bus – STA Ferry NSW TrainLink Sydney Trains
Transport Cluster
8 - 10 Outcomes Statement 2020-21
8.5 Outcome 3: Sustainable transport systems and solutions supporting economic activity
State Outcome overview and 2020-21 investment
The transport system powers and connects a globally competitive and sustainable New South Wales. Transport plays a critical role in driving economic growth and improving quality of life with a new focus on place and mobility. Transport will support the transformation of regional centres into hubs for investment, employment, tourism and essential services. Transport invests in network enhancements, manages and maintains quality assets and efficient networks.
2020-21 State Outcome Budget highlights
In 2020-21, the Transport Cluster will invest $14.6 billion ($909.7 million recurrent expenses and $13.7 billion capital expenditure) in this Outcome, including:
$2.7 billion ($8.3 billion over four years) to continue delivery of the Sydney Metro City and Southwest linking Chatswood and Bankstown
$2.1 billion (over $10.4 billion over four years) to progress construction of Sydney Metro West, to provide a faster, easier and more reliable journey between Westmead and the Sydney CBD
$1.3 billion ($3.1 billion over four years) to continue construction of the WestConnex Motorway including delivery of the final stage of the project, the M4-M5 link tunnels and Rozelle Interchange by 2023
$810.0 million ($9.2 billion over four years) for the planning and construction for the NSW and Australian Government funded Sydney Metro – Western Sydney Airport to be completed in time for the opening of the airport
$656.5 million ($1.4 billion over four years) to continue construction of Parramatta Light Rail (Stage 1) to support growth in Western Sydney by connecting new communities and places
$547.9 million ($1.5 billion over four years) for NSW and Australian Government funded road upgrades to support the new Western Sydney Airport at Badgerys Creek including The Northern Road between Narellan and Penrith and the M12 Motorway
$544.6 million ($4.2 billion over four years) to commence construction on the Sydney Gateway project and continue planning and preconstruction activities for the M6 Stage 1 Extension
$431.9 million ($1.4 billion over four years) for NSW and Australian Government funded projects underway on the Princes Highway, including the new Nowra Bridge, the Batemans Bay Bridge, Albion Park Rail Bypass and the Berry to Bomaderry Upgrade, as well as planning for further upgrades to the Princes Highway between Nowra and the Victorian border to improve safety, journey times and freight efficiency
$356.3 million ($5.7 billion over four years) for the planning and preconstruction for the Western Harbour Tunnel and Warringah Freeway Upgrade as part of the Western Harbour Tunnel program
$909.7 million
Recurrent Expenses 2020-21
$13.7 billion
Capital Expenditure2020-21
Transport Cluster
Outcomes Statement 2020-21 8 - 11
$341.9 million ($383.4 million over four years) to continue the NSW and Australian Government funded Pacific Highway upgrade program, including completing construction between Woolgoolga and Ballina
$169.1 million ($603.8 million over the next four years) for Pinch Points and Clearways, including programs such as Gateway to the South, Hunter Pinch Points and the recently announced State and Commonwealth Government Pinch Point stimulus of $240m
$135.0 million ($1.0 billion over four years) for the planning and preconstruction activities for the NSW and Australian Government funded Coffs Harbour Bypass
$76.7 million recurrent ($175.2 million over three years) for the Regional Seniors Travel Card program providing $250 per year towards fuel, taxi travel or NSW TrainLink tickets for eligible seniors living in regional New South Wales
$36.0 million to extend savings for primary producers on heavy vehicle registration charges until 1 July 2021 as part of the Government’s drought support package
$31.4 million ($258.3 million over four years) initial NSW and Australian Government investment in a Fast Rail network, including planning for improved alignment north of Mittagong, duplication between Berry and Gerringong, planning of a new alignment between Sydney and Woy Woy, and planning work to improve the route to the Central West to support faster travel times
$10.9 million ($19.0 million over two years) for the Skill and Employment Generation program to significantly increase the apprenticeship intake for trade skills across road and rail industry sectors, expanding the graduate entry program and expansion of the Rail Skills Centre.
Key performance insights
This section provides analysis and insights on key Outcome Indicators for this State Outcome.
30-minute city
This indicator reflects the capability of the transport network to provide 30-minute peak-hour access (the 30-minute city) to metropolitan centres for people living in Greater Sydney. Access to employment, services and education drives economic growth and quality of life.
Performance against this indicator is currently stable. Transport will continue to improve performance by delivering game changing infrastructure like Sydney Metro, Parramatta Light Rail, NorthConnex Tunnel and WestConnex (including the recently delivered M8 Tunnel, the M4-M5 link and Rozelle Interchange projects in delivery). Exploring projects like faster rail will also bring new opportunities to connect regions with services and jobs, and enable economic activity. Changes to ways of working, in response to COVID-19, has also provided Transport with the opportunity to reshape demand and travel patterns which will further enable a 30-minute city.
Transport will deliver more efficient freight networks with projects like the Sydney Gateway which will deliver economic benefit through improved freight movements and connections to Sydney Airport and Port Botany.
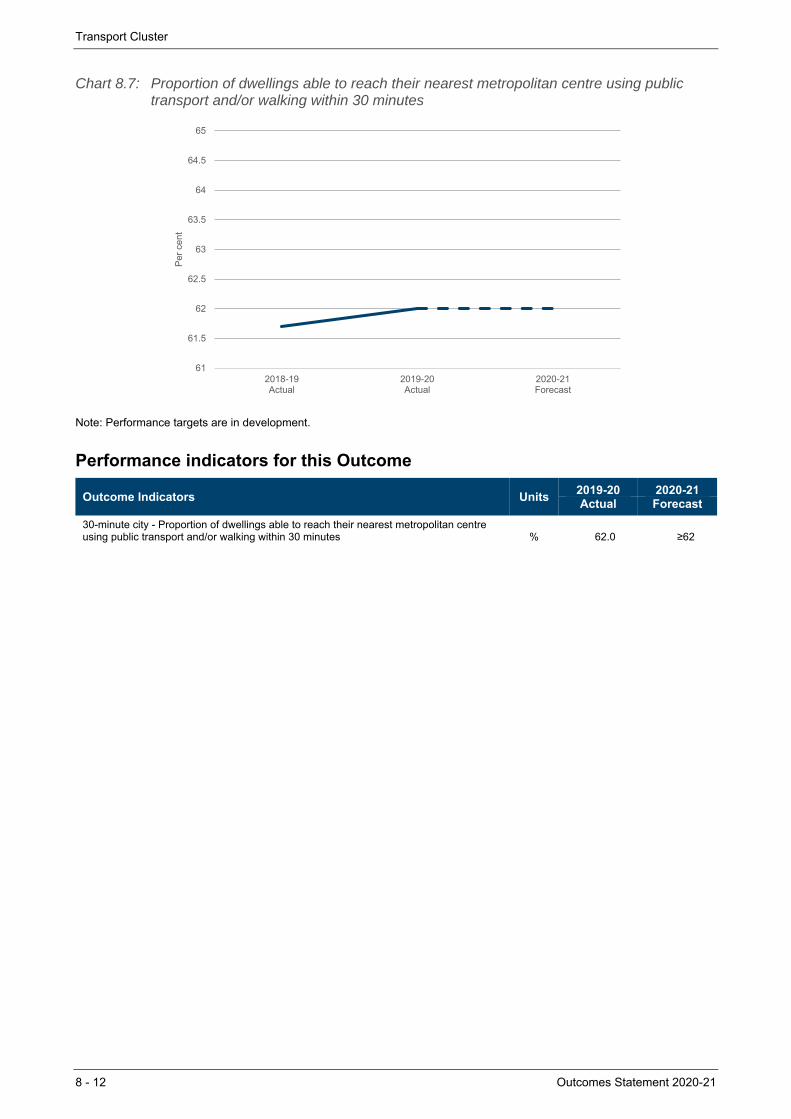
Transport Cluster
8 - 12 Outcomes Statement 2020-21
Chart 8.7: Proportion of dwellings able to reach their nearest metropolitan centre using public transport and/or walking within 30 minutes
Note: Performance targets are in development.
Performance indicators for this Outcome
Outcome Indicators Units 2019-20 2020-21Actual Forecast
30-minute city - Proportion of dwellings able to reach their nearest metropolitan centre using public transport and/or walking within 30 minutes % 62.0 ≥62
61
61.5
62
62.5
63
63.5
64
64.5
65
2018-19Actual
2019-20Actual
2020-21Forecast
Per
cen
t
Outcomes Statement 2020-21 9 - 1
9. TREASURY CLUSTER
9.1 Introduction
The Treasury Cluster, as the Government’s principal financial and economic adviser, helps the Government to make New South Wales a great place to live and work. The Cluster comprises several entities, including the Small Business Commission, Destination NSW, Western City and Aerotropolis Authority (to be renamed as the Western Parkland City Authority from December 2020) and the Crown Finance Entity. The Crown Finance Entity reports large expenditures in relation to whole-of-State assets and liabilities. The Treasury, by comparison, represents a smaller proportion of total Cluster expenditure.
State Outcomes to be delivered by the Treasury Cluster
State Outcomes What the Cluster is delivering for people and
business
Example Programs(a) underway to support delivery of Outcomes
1. A strong, resilient and diverse economy
Driving whole-of-state economic policy and strategy, creating a competitive business and investment environment, supporting and attracting new and expanding businesses to create jobs for the people of NSW, and growing the visitor economy.
2020-21 investment: $1.5 billion recurrent expenses & $36.6 million capital expenditure
Growing the NSW Visitor Economy Delivering the Global NSW Strategy Building a Strong and Productive Economy
2. A sustainable fiscal environment enabling delivery of outcomes
Managing whole-of-State financial asset and liability activities, as measured by investment and debt performance, and maintenance of the State’s triple-A credit rating. Working towards the State’s objective of full funding of the Defined Benefits Superannuation liability by 2040. Providing informed, evidence-based fiscal, commercial and financial analysis and advice. 2020-21 investment: $12.4 billion recurrent expenses & $6.4 million capital expenditure
Fiscal Planning and Management Sector Support and Resource Allocation Commercial and Commissioning Sector, Procurement Services, Analytics and
Systems
3. Stewardship of the public sector performance and financial system
Steward and support sector performance to deliver outcomes for citizens, ensure transparency and accountability and the effective use of public funds.
2020-21 investment: $56.1 million recurrent expenses & $1.9 million capital expenditure
Performance and Financial Systems Stewardship
Digitally Focussed Treasury Highly Capable, Collaborative and Diverse
Team
(a) Note that Programs are being further refined as the outcome and performance framework continues to mature.
$13.9 billion
Recurrent Expenses 2020-21
$44.9 million
Capital Expenditure2020-21
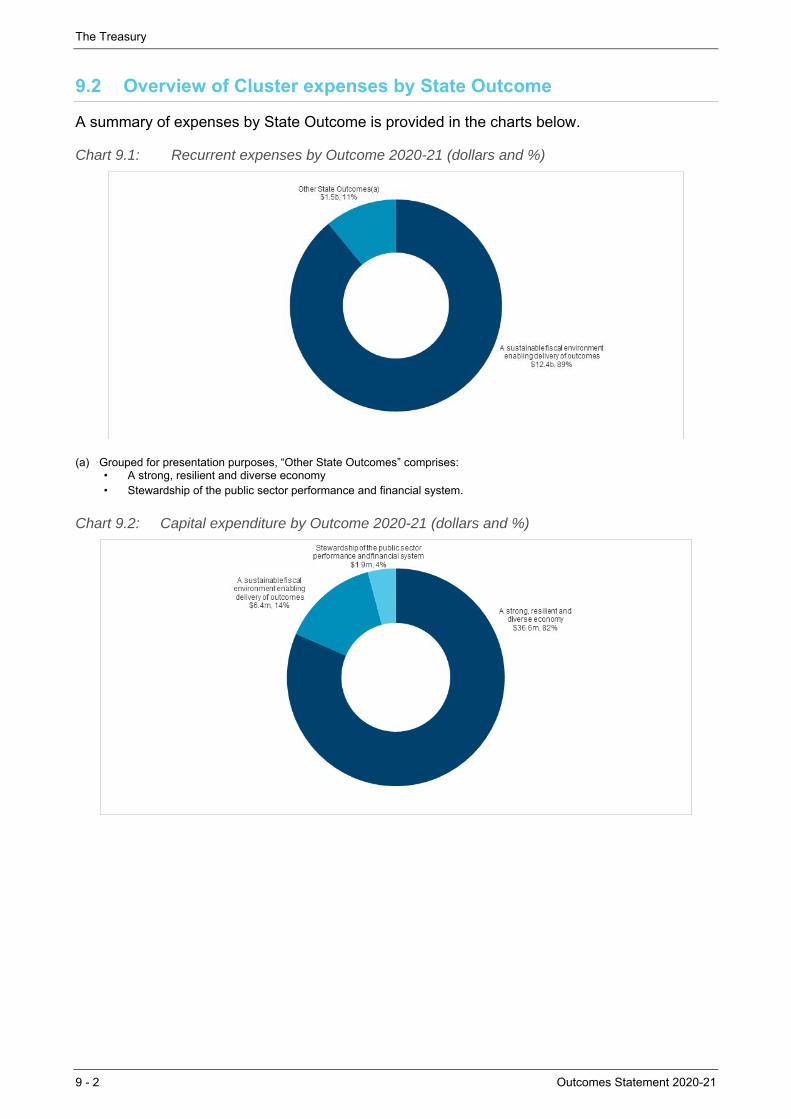
The Treasury
9 - 2 Outcomes Statement 2020-21
9.2 Overview of Cluster expenses by State Outcome
A summary of expenses by State Outcome is provided in the charts below.
Chart 9.1: Recurrent expenses by Outcome 2020-21 (dollars and %)
(a) Grouped for presentation purposes, “Other State Outcomes” comprises: • A strong, resilient and diverse economy • Stewardship of the public sector performance and financial system.
Chart 9.2: Capital expenditure by Outcome 2020-21 (dollars and %)
The Treasury
Outcomes Statement 2020-21 9 - 3
9.3 Outcome 1: A strong, resilient and diverse economy
State Outcome overview and 2020-21 investment
New South Wales is Australia’s largest state economy, accounting for around a third of the nation’s economic output and home to nearly a third of Australians.
Treasury is the Government’s chief advisor on productivity, economic analysis and development and contributes to a strong, resilient and diverse economy through economic and productivity reform, industry support and investment.
2020-21 State Outcome Budget highlights
In 2020-21, the Treasury Cluster will invest $1.5 billion ($1.5 billion recurrent expenses and $36.6 million capital expenditure) in this Outcome, including:
$1.0 billion ($2.1 billion revenue forgone over two years) for payroll tax cuts to support businesses and jobs across New South Wales
$500.0 million for a digital voucher scheme to stimulate local spending in the NSW economy for eligible registered businesses, including restaurants, visitor attractions and performing arts institutions
$366.0 million in COVID-19 Stimulus funding to support New South Wales’ economic recovery including the Small Business Recovery Grant Scheme, support for international students and quarantine arrangements for international travellers
$250.0 million for the Jobs Plus Program to drive job creation by supporting businesses and industries seeking to scale and grow in New South Wales
$200.1 million ($728.0 million over four years) to promote New South Wales tourism through Destination NSW
$142.0 million ($472.0 million over two years) to provide small and medium sized businesses which do not pay payroll tax with a $1,500 digital voucher to be used towards the cost of any government fees and charges
$29.8 million for strategic, planning and enabling activities to support the ongoing delivery of the Western Sydney Aerotropolis, which will become a hub for growth industries and provide additional jobs across the Western Parkland City
$22.4 million ($179.8 million over four years) to support the Global NSW Strategy in growing trade and attracting investment to help job creation and cement the State’s position as a regional economic powerhouse. A key component will be developing NSW industry and innovation capabilities to support future jobs and industries
$10.6 million ($48.2 million over four years) to establish and support Tech Central at Central-Eveleigh to drive innovation, the creation of new technology and commercialisation of new products and services
$9.8 million ($39.3 million over four years) for the Business Connect Program which provides professional business advice for small businesses across New South Wales to support them to start, run, adapt and grow
$6.0 million for the NSW Small Business Commission to deliver increased mediation and advisory services to commercial parties following the measures announced by the Government to provide relief to tenants in financial duress due to COVID-19
$1.5 billion
Recurrent Expenses 2020-21
$36.6 million
Capital Expenditure2020-21
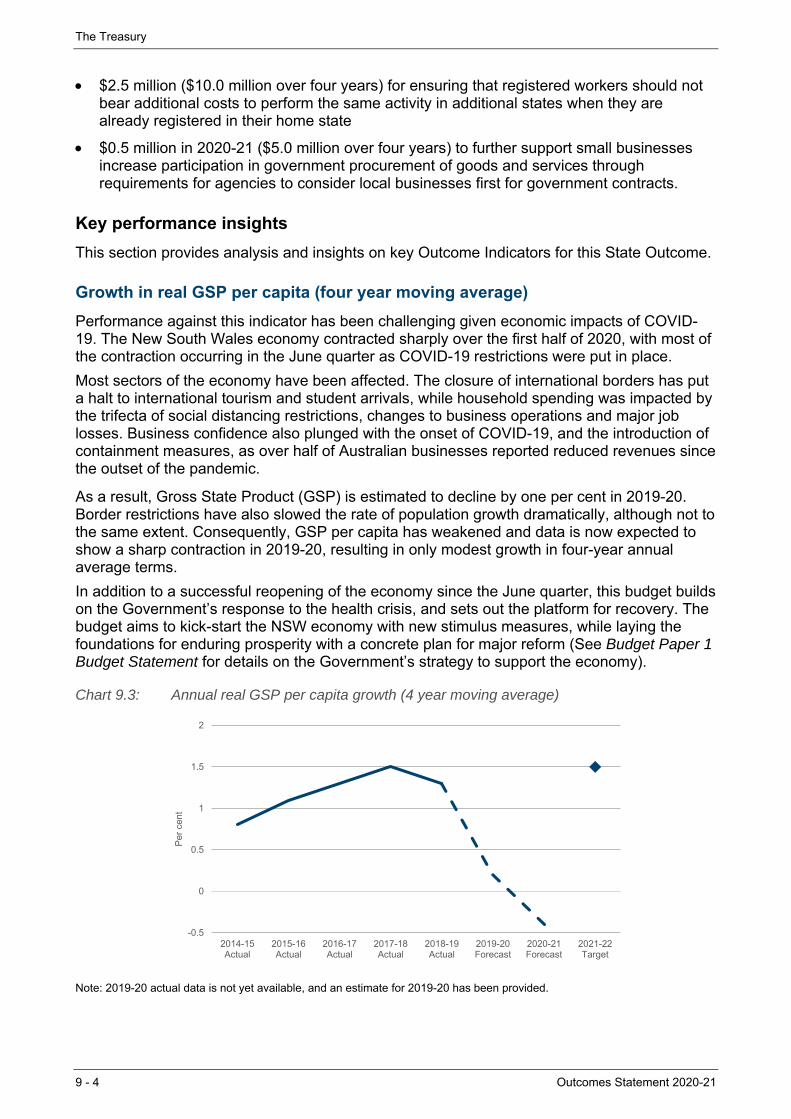
The Treasury
9 - 4 Outcomes Statement 2020-21
$2.5 million ($10.0 million over four years) for ensuring that registered workers should not bear additional costs to perform the same activity in additional states when they are already registered in their home state
$0.5 million in 2020-21 ($5.0 million over four years) to further support small businesses increase participation in government procurement of goods and services through requirements for agencies to consider local businesses first for government contracts.
Key performance insights
This section provides analysis and insights on key Outcome Indicators for this State Outcome.
Growth in real GSP per capita (four year moving average)
Performance against this indicator has been challenging given economic impacts of COVID-19. The New South Wales economy contracted sharply over the first half of 2020, with most of the contraction occurring in the June quarter as COVID-19 restrictions were put in place.
Most sectors of the economy have been affected. The closure of international borders has put a halt to international tourism and student arrivals, while household spending was impacted by the trifecta of social distancing restrictions, changes to business operations and major job losses. Business confidence also plunged with the onset of COVID-19, and the introduction of containment measures, as over half of Australian businesses reported reduced revenues since the outset of the pandemic.
As a result, Gross State Product (GSP) is estimated to decline by one per cent in 2019-20. Border restrictions have also slowed the rate of population growth dramatically, although not to the same extent. Consequently, GSP per capita has weakened and data is now expected to show a sharp contraction in 2019-20, resulting in only modest growth in four-year annual average terms.
In addition to a successful reopening of the economy since the June quarter, this budget builds on the Government’s response to the health crisis, and sets out the platform for recovery. The budget aims to kick-start the NSW economy with new stimulus measures, while laying the foundations for enduring prosperity with a concrete plan for major reform (See Budget Paper 1 Budget Statement for details on the Government’s strategy to support the economy).
Chart 9.3: Annual real GSP per capita growth (4 year moving average)
Note: 2019-20 actual data is not yet available, and an estimate for 2019-20 has been provided.
-0.5
0
0.5
1
1.5
2
2014-15Actual
2015-16Actual
2016-17Actual
2017-18Actual
2018-19Actual
2019-20Forecast
2020-21Forecast
2021-22Target
Per
cen
t
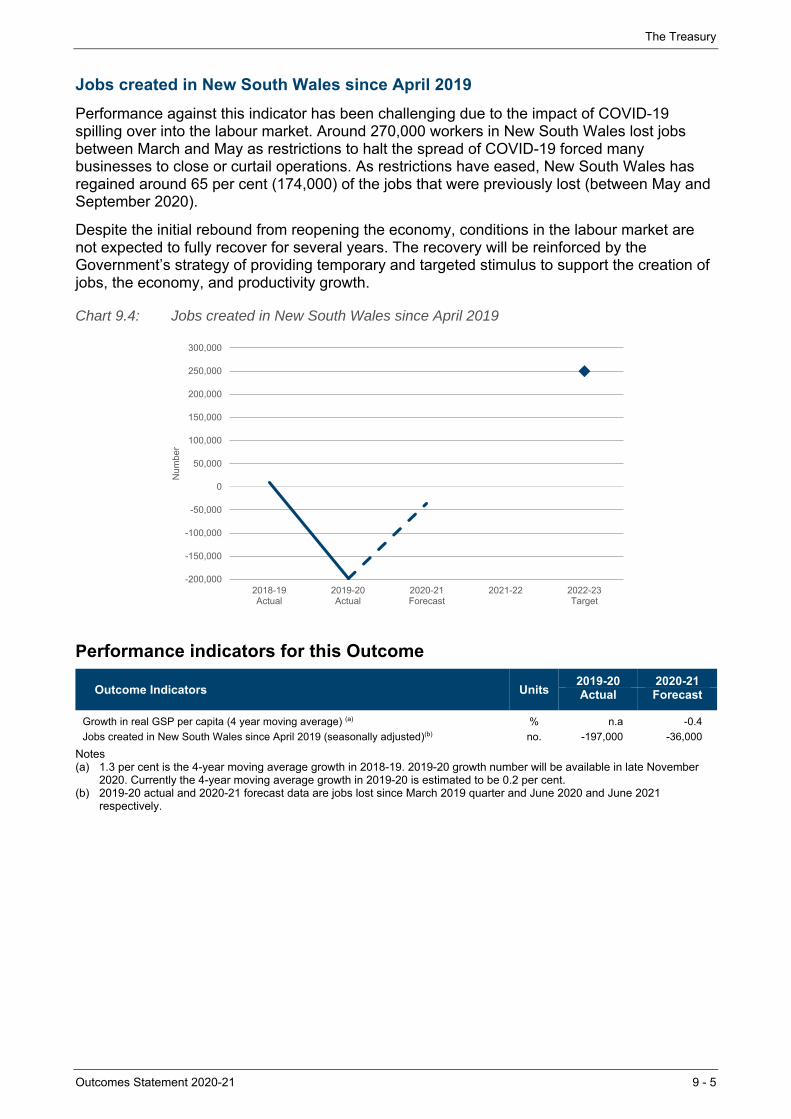
The Treasury
Outcomes Statement 2020-21 9 - 5
Jobs created in New South Wales since April 2019
Performance against this indicator has been challenging due to the impact of COVID-19 spilling over into the labour market. Around 270,000 workers in New South Wales lost jobs between March and May as restrictions to halt the spread of COVID-19 forced many businesses to close or curtail operations. As restrictions have eased, New South Wales has regained around 65 per cent (174,000) of the jobs that were previously lost (between May and September 2020).
Despite the initial rebound from reopening the economy, conditions in the labour market are not expected to fully recover for several years. The recovery will be reinforced by the Government’s strategy of providing temporary and targeted stimulus to support the creation of jobs, the economy, and productivity growth.
Chart 9.4: Jobs created in New South Wales since April 2019
Performance indicators for this Outcome
Outcome Indicators Units 2019-20 2020-21Actual Forecast
Growth in real GSP per capita (4 year moving average) (a) % n.a -0.4
Jobs created in New South Wales since April 2019 (seasonally adjusted)(b) no. -197,000 -36,000
Notes (a) 1.3 per cent is the 4-year moving average growth in 2018-19. 2019-20 growth number will be available in late November
2020. Currently the 4-year moving average growth in 2019-20 is estimated to be 0.2 per cent. (b) 2019-20 actual and 2020-21 forecast data are jobs lost since March 2019 quarter and June 2020 and June 2021
respectively.
-200,000
-150,000
-100,000
-50,000
0
50,000
100,000
150,000
200,000
250,000
300,000
2018-19Actual
2019-20Actual
2020-21Forecast
2021-22 2022-23Target
Num
ber
The Treasury
9 - 6 Outcomes Statement 2020-21
9.4 Outcome 2: A sustainable fiscal environment enabling delivery of outcomes
State Outcome overview and 2020-21 investment
In its fiscal management role for the State, NSW Treasury ensures that the people of New South Wales have access to services and infrastructure that deliver social and economic benefits, underpinned by a strong and sustainable economic and financial position.
2020-21 State Outcome Budget highlights
In 2020-21, the Treasury Cluster will invest $12.4 billion ($12.4 billion recurrent expenses and $6.4 million capital expenditure) in this Outcome, including:
$2.5 billion in 2020-21 ($10.3 billion expenses and $0.7 million capital over four years) to administer the provision of workers' compensation, health and general liability, property and motor vehicle cover to government and its employees, mostly through the Treasury Managed Fund
management of the Treasury Banking System post the completion of the banking tender to drive efficiencies through new banking arrangements and maximise returns on the State’s centrally managed cash holdings
managing the State’s core debt portfolio to minimise the market value and cost of debt within specified risk parameters and managing any significant finance risks for the State
administering Restart NSW, the Social and Affordable Housing Fund and NSW Generations Fund, to maximise returns for investment in productive infrastructure and boost delivery of social and affordable housing across New South Wales
overseeing the State’s investments, including the retained interests in Ausgrid and Endeavour Energy, as well as administering the residual assets and liabilities of major State asset recycling and long-term lease transactions
managing the NSW public sector Defined Benefit Superannuation Scheme.
$12.4 billion
Recurrent Expenses 2020-21
$6.4 million
Capital Expenditure2020-21

The Treasury
Outcomes Statement 2020-21 9 - 7
Key performance insights
This section provides analysis and insights on key Outcome Indicators for this State Outcome.
Maintaining the triple-A credit rating and managing fiscal responsibilities
Performance against indicators has been challenging due to the Government’s fiscal strategy to balance short term stimulus with medium-term sustainability. The easing of restrictions, opening up of the economy and targeted stimulus spending will help support economic growth.
Over the medium-term, the Government’s fiscal strategy switches to fiscal repair, with the aim of returning the State’s operating position and debt levels to a more sustainable position. Through fiscal repair measures announced in this Budget the Government is aiming to ensure it manages a fiscal position commensurate with a triple-A credit rating over the medium-term.
Chart 9.5: Annual expense growth below long-term revenue growth
Note: For more information, refer to 2020-21 Budget Paper 1 Budget Statement.
Performance indicators for this Outcome
Outcome Indicators Units 2019-20 2020-21Actual Forecast
Annual expense growth below long-term revenue growth (a) % 9.7 11.2Full funding of the State’s superannuation liability by June 2040 (b) $billion 14.7 14.9
Maintaining the Triple-A Credit Rating no. Yes Yes
Reducing the long-term fiscal gap (c) % 3.5 n.a.
Notes (a) 2019-20 Actual is the calculated result based on General Government results as they currently stand and is subject to final
internal and audit approval. Final audit approval will be published with the Total State Sector Accounts 2019-20. (b) Full funding of the State’s defined benefit superannuation liability by 2040 is on track in 2020-21. The Government will aim
to update the Fiscal Responsibility Act 2012, after a clearer picture of the economic and fiscal outlook emerges. For more information, refer to 2020-21 Budget Paper 1.
(c) The 2016 Intergenerational Report (IGR) projected the fiscal gap to reach 3.4% by 2055-56. Since then, as a result of budget measures, the fiscal gap is projected to increase by 0.1% by 2055-56 (as at 2019-20 Budget). This projection will be updated and will be same as the forecast figure contained in the 2020-21 Budget Paper 1. The 2021 IGR will be released in 2021 and will extend fiscal gap projections to 2060-61.
-5
0
5
10
15
2016-17Actual
2017-18Actual
2018-19Actual
2019-20Actual
2020-21Forecast
2021-22Forecast
2022-23Forecast
2023-24Forecast
Per
cen
t
Long-term average revenue growth
The Treasury
9 - 8 Outcomes Statement 2020-21
9.5 Outcome 3: Stewardship of the public sector performance and financial system
State Outcome overview and 2020-21 investment
Under the Government Sector Finance Act 2018, Treasury’s role is to be the performance and financial steward for the NSW Government Sector. This moves Treasury’s role beyond the traditional financial and regulatory function, towards seeking to support Sector performance to deliver outcomes for citizens, ensure transparency, accountability and the effective use of public funds. Under this objective, Treasury aims to build Sector capability and assist agencies to achieve their own performance goals while also meeting all compliance and reporting obligations.
2020-21 State Outcome Budget highlights
In 2020-21, the Treasury Cluster will invest $58.0 million ($56.1 million recurrent expenses and $1.9 million capital expenditure) in this Outcome, including:
$33.9 million to deliver a comprehensive suite of activities including; embedding of evidence based decision making, embedding of Outcome Budgeting, digitising procurement guidelines and tools, ongoing training and guidance on budgeting and financial reporting systems, commissioning and social impact investment policy guidance, banking best practice support and tools, investment and debt advice and stewardship
$7.5 million to promote a Digitally Focused Treasury, starting with the replacement of several legacy component products with flexible modern tools to enhance digital design and responsiveness.
Key performance insights
This section provides analysis and insights on key Outcome Indicators for this State Outcome.
No material adverse findings in Audit Office Reports to Parliament
The Audit Office of NSW performs independent review of the sector, including financial audits, performance audits and internal controls reviews. The results are reported to Parliament to ensure accountability to the people of New South Wales.
Performance against this indicator is stable. There have been no qualified financial audit opinions in any of the recent year-ends. Some performance audits have recorded deficiencies that require mitigation by targeted agencies. Treasury is continuing to support the Sector through a range of activities including developing and maintaining appropriate performance and financial management policy instruments and building sector capability to adhere to them.
$56.1 million
Recurrent Expenses 2020-21
$1.9 million
Capital Expenditure2020-21
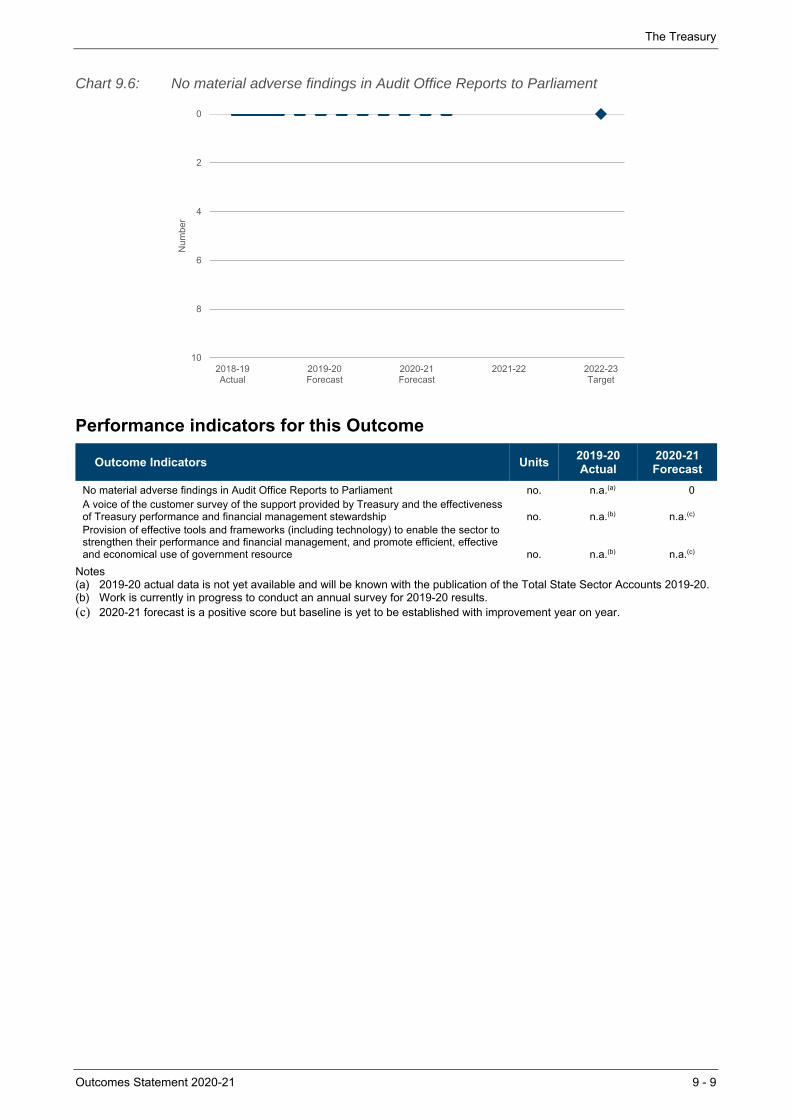
The Treasury
Outcomes Statement 2020-21 9 - 9
Chart 9.6: No material adverse findings in Audit Office Reports to Parliament
Performance indicators for this Outcome
Outcome Indicators Units 2019-20 2020-21Actual Forecast
No material adverse findings in Audit Office Reports to Parliament no. n.a.(a) 0A voice of the customer survey of the support provided by Treasury and the effectiveness of Treasury performance and financial management stewardship no. n.a.(b) n.a.(c)
Provision of effective tools and frameworks (including technology) to enable the sector to strengthen their performance and financial management, and promote efficient, effective and economical use of government resource no. n.a.(b) n.a.(c)
Notes (a) 2019-20 actual data is not yet available and will be known with the publication of the Total State Sector Accounts 2019-20. (b) Work is currently in progress to conduct an annual survey for 2019-20 results. (c) 2020-21 forecast is a positive score but baseline is yet to be established with improvement year on year.
0
2
4
6
8
102018-19Actual
2019-20Forecast
2020-21Forecast
2021-22 2022-23Target
Num
ber
Outcomes Statement 2020-21 10 - 1
10. THE LEGISLATURE
10.1 Introduction
The Legislature, or the Parliament of New South Wales, operates under the Constitution as the system of representative democracy and responsible government for the State, making laws, appropriating funds, overseeing the Executive Government and debating public policy issues.
The Legislature’s objectives and strategic priorities
The Legislature contributes to and supports the following key objectives:
the effective functioning of the Parliament and its committees
members of Parliament are supported to fulfil their parliamentary roles
the community has access to Parliament and is aware of the role and functions of the Parliament.
A key driver of the Legislature’s strategic priorities is to ensure Members of Parliament and staff are better able to respond to the needs of the NSW community. Throughout the 57th Parliament, the administration is committed to delivering the physical and digital assets essential to a modern Parliament, developing the Parliament’s engagement with NSW citizens and supporting members to serve the community.
Strategic Priority Description
Modernisation of the Parliament
Strengthened governance framework, procedural innovations plus supporting technology/infrastructure, digital transformation, audio-visual upgrades, integrated service delivery, customer service enhancement, contemporary systems and processes.
Strengthening engagement with the public and enhanced trust in Parliament as an institution
Access to the institution, engagement models, institutional integrity initiatives and perceived independence of Parliament.
Safeguarding the independence of a strong Parliament
Financial independence from the executive, asserting Parliament’s powers, strengthening inter-parliament relationships and administrative collaboration.
Support members in their evolving role as elected representatives
Skills development, integrity, wellbeing and security.
Develop the capabilities of the Parliament’s workforce
Leadership development, further development of profession-specific capability frameworks, adaptive roles, enhanced individualised development plans, succession planning and other workforce planning initiatives.
$185.1 million
Recurrent Expenses 2020-21
$42.1 million
Capital Expenditure2020-21
The Legislature
10 - 2 Outcomes Statement 2020-21
2020-21 Budget highlights
In 2020-21, the Legislature will invest $227.2 million ($185.1 million recurrent expenses and $42.1 million capital expenditure) on its activities and strategic priorities.
The Legislature’s activities include enabling the effective functioning and operation of both Houses of Parliament and their committees, supporting members to fulfil their parliamentary duties through the delivery of key services, engagement with Parliament and its proceedings, and the running of education programs for schools and other members of the community on the role and function of the Parliament.
The Legislature also provides for the administration and payment of members’ salaries, allowances and additional entitlements – in accordance with the Parliamentary Remuneration Act 1989 – along with maintenance of the parliamentary precinct and 98 electorate offices across the State.
Key initiatives are highlighted below for 2020-211:
$14.0 million for Digital Parliament ($26.3 million capital and $9.8 million expenses over four years) to develop and implement modern ICT services for Parliament including cloud migration and digital transformation, defining the right Enterprise Resource Planning system for Parliament, and replacing ageing infrastructure
$6.0 million for audio-visual services ($14.2 million capital and $5.2 million expenses over four years) to modernise the audio-visual services in Parliament by offering members and the public vastly improved access to live and archived recordings of parliamentary events
$7.5 million ($10.1 million capital over four years) to continue ceilings and building services replacement at Parliament House
$4.6 million to continue urgent infrastructure upgrades at Parliament House
$4.0 million ($17.5 million over four years) to continue the project to replace the roof membrane at Parliament House
$3.5 million for minor capital works to continue the Parliament’s program to allow urgent and routine replacement of office furniture, fittings and equipment.
Key performance information
The Legislature’s performance information is published in the annual reports of the three parliamentary departments that support it: the Department of the Legislative Assembly, the Department of the Legislative Council and the Department of Parliamentary Services. Key performance measures relating to its objectives and strategic priorities are currently being enhanced.
1 Values are representative of both capital and recurrent expenditure for 2020-21.