bu yang cao et al- effect of shock compression method on the defect substructure in monocrystalline...
TRANSCRIPT

8/3/2019 Bu Yang Cao et al- Effect of shock compression method on the defect substructure in monocrystalline copper
http://slidepdf.com/reader/full/bu-yang-cao-et-al-effect-of-shock-compression-method-on-the-defect-substructure 1/12
Materials Science and Engineering A 409 (2005) 270–281
Effect of shock compression method on the defectsubstructure in monocrystalline copper
Bu Yang Cao a, David H. Lassilab, Matt S. Schneider a, Bimal K. Kad a, Chong Xiang Huang c,Yong Bo Xu c, Daniel H. Kalantar b, Bruce A. Remington b, Marc Andre Meyers a,∗
a Materials Science and Engineering Program, University of California, San Diego, 9500 Gilman Dr., UCSD 0411, La Jolla, CA 92093, USAb Lawrence Livermore National Laboratory, Livermore, CA 94550, USA
c Chinese Academy of Sciences, Shenyang Natl. Lab. for Matls. Sci., Inst. of Metal, Shenyang, Liao Ning 110016, China
Received in revised form 20 May 2005; accepted 30 June 2005
Abstract
Monocrystallinecopper samples with orientationsof [0 0 1] and[2 2 1] were shocked at pressuresrangingfrom 20 to 60 GPa using two techniques:
direct drive lasers and explosively driven flyer plates. The pulse duration for these techniques differed substantially: 40 ns for the laser experiments
at 0.5 mm into the sample and 1.1∼1.4s for the flyer-plate experiments at 5 mm into the sample. The residual microstructures were dependent
on orientation, pressure, and shocking method. The much shorter pulse duration in the laser driven shock yielded microstructures in recovery
samples closer to those generated at the shock front. For the flyer-plate experiments, the longer pulse duration allows shock-generated defects
to reorganize into lower energy configurations. Calculations show that the post-shock cooling for the laser driven shock is 10 3 ∼ 104 faster than
that for plate-impact shock, increasing the amount of annealing and recrystallization in recovery samples for the latter. At the higher pressure
level, extensive recrystallization was observed in the plate-impact samples, while it was absent in laser driven shock. An effect that is proposed
to contribute significantly to the formation of recrystallized regions is the existence of micro-shear-bands, which increase the local temperature
beyond the prediction from adiabatic compression.
© 2005 Elsevier B.V. All rights reserved.
Keywords: Laser; Shock compression; Plate impact; Shear localization in copper; Shock waves; Explosives
1. Introduction
It is indeed a distinct honor to give a presentation in this
symposium and to author a paper commemorating this festive
occasion. The principal themes of Prof. J.C.M. Li’s work have
been micromechanisms of mechanical behavior in crystalline
and amorphous materials (metals, metallic glasses, porous mate-
rials, and polymers). The nature of his work has been both
theoretical and experimental. Professor Li is undoubtedly one
of the global authorities in this field, and his contributions have
spanned 50 years. Among the numerous original inroads into
heretofore uncharted territory, the following come to mind:
Submitted for the TMS Symposium: Micromechanics of Advanced Materi-
als II, in Honor of James C.M. Li’s 80th Birthday, February 13–17, 2005, San
Francisco, CA.∗ Corresponding author. Tel.: +1 858 534 4719; fax: +1 858 534 5698.
E-mail address: [email protected] (M.A. Meyers).
• mechanism for plastic deformation of metallic glasses (e.g.
[1–4]);
• shear localization in metallic glasses (e.g. [2–4]);
• mechanism for the grain-size dependence of yield stress (e.g.
[5]);
• use of impression testing using micron-sized cylindrical
indenters to determine adhesion, creep resistance, viscosity,
and the kinetics of stress relaxation (e.g. [6]);
• dislocation dynamics through stress relaxation (e.g. [6,7]);
• combustion synthesis of intermetallic compounds (e.g. [8]);
• thermally-activated description of plastic flow (e.g. [9]).
Shock compressed materials show a great variety of
microstructures in which the mechanisms envisioned by Prof.
Li play a pivotal role. Although the effects of the uniaxial-strain
high-strain-rate loading have been studied for the past 50 years,
not all aspects have been elucidated. Smith [10] first described
the shock compression of materials in mechanistic terms. In the
early techniques, samples were subjected to shock compression
0921-5093/$ – see front matter © 2005 Elsevier B.V. All rights reserved.
doi:10.1016/j.msea.2005.06.076

8/3/2019 Bu Yang Cao et al- Effect of shock compression method on the defect substructure in monocrystalline copper
http://slidepdf.com/reader/full/bu-yang-cao-et-al-effect-of-shock-compression-method-on-the-defect-substructure 2/12
B.Y. Cao et al. / Materials Science and Engineering A 409 (2005) 270–281 271
by explosives, either by direct loading or by impact. Thesamples
were recovered and the microstructure was analyzed to evaluate
the effects of the shock pre-straining on the material. Later, dif-
ferent kinds of experiments have been designed to investigate
the dynamic behavior of different materials [11–15].
Recovery experiments provide a convenient way to study
defect generation and energy storage mechanisms in materials
subjected to shockwaves especially given the difficulty involved
in studying the physical properties of the materials during the
shock (rapid loading rate and short time interval). Since that
time, much work has been done on quite a number of materials
to develop a hydrodynamic understanding of the material behav-
ior, and severalreviewshave summarizedthe systematic changes
in the structure–property relationships generated by shock wave
passage through the material [16,17]. Most of this work corre-
lates the microstructure and mechanical property changes to the
compression characteristics like peak pressure, pulse duration,
rarefaction rate, and even temperature. Also, much work has
been done to model these responses and to compare the behav-
iors to those observed at low strain rates [16–18]. Remington etal. [19] review the most significant recent work.
For the experimental techniques of shock compression, it is
essential that the principal parameters be well characterized in
the experiments. Flyer-plate impact and laser shock are two typ-
ical loading methods employed in shock–recovery experiments.
In the flyer-plate impact experiment, the plate impacts a target
at a known velocity. If the impact is perfectly planar and if the
velocity vector of the impacting plate is perfectly normal to the
impact plane, then a state of pure one-dimensional strain will
be produced in both flyer plate and target. The minimization of
lateral strain in shock compression has been shown by Gray et
al. [20] and Mogilevsky and Teplyakova [21] to be important.Lasers deliver high energy densities in extremely short pulse
durations enabling research in regimes of pressure and strain
rates never before explored. Lasers have been shown to gener-
ate pressures from 10 to over 500 GPa. The TPa regime is also
currently accessible (e.g. [22]) through the use of the hohlraum
concept. R. Cauble et al. developed methods to obtain the
equation-of-state data in the 10–40 Mbar (1–4 TPa) regime [23].
Lasers also provide an easy way to vary pulse duration (“dwell
time”) with picosecond resolution, which can then be correlated
to thepressuredata to yield a strainrate.Lasers typically produce
less residual strain as compared to other techniques and post-
shock heating is minimized because of the short-duration pulses
and the small specimen size/geometry. Laser-driven shocks arecreated by the rapid heating of the surface from the intense laser
illumination of the material [24]. Lasers are uncovering a new
frontier in materials dynamics under extreme states of shock
compression.
Both the flyer-plate impact [25] and laser [26] techniques
have recently been employed to explore the post-shocked resid-
ual microstructures of monocrystalline copper. Significant dif-
ferences in the residual microstructure have been observed at
high pressures.
It is the objective of this paper to demonstrate that the dif-
ferences of the residual microstructures (which are orientation
dependent) are to a large extent due to how the heat gener-
ated inside the samples during shock is extracted. Post-shock
recovery (annealing) and recrystallization processes dominate
the residual microstructures, if the time interval and temperature
are sufficient. The unique advantage of laser shock compression
over plate impact, namely the rapid post-shock cooling, is dis-
cussed.
2. Experimental methods
Explosively driven flyer plates and direct drive lasers produce
different shock pulses. Fig. 1 shows the characteristic shapes
of these two shock waves. The shock wave produced by plate
impact has initially a square shape (Fig. 1(a)) [24]. It has a flat
top that has a length equal to twice the time required for the
wave to travel through the projectile. The portion of the wave
in which the pressure returns to zero is called the “release”.
During impact, elastic waves with velocity C 0 and shock waves
with velocity U s areemitted into the target and projectile. For the
experiments reported herein, the duration of the pulse at a depth
of 5 mm from the impact interface was in the 1.1–1.4s range.For the cases studied here (thick samples, ∼1 mm) and mod-
erately short laser pulses (2–3 ns), the launched shock quickly
Fig. 1. Shock wave configurations: (a) shock wave (trapezoidal) produced by
plate impact: time durationis 1.1s andpeakpressure is 60GPa;(b) pulse shape
of typical laser shock experiment: time duration is 40 ns and peak pressure to
20 GPa.

8/3/2019 Bu Yang Cao et al- Effect of shock compression method on the defect substructure in monocrystalline copper
http://slidepdf.com/reader/full/bu-yang-cao-et-al-effect-of-shock-compression-method-on-the-defect-substructure 3/12
272 B.Y. Cao et al. / Materials Science and Engineering A 409 (2005) 270–281
Fig. 2. Theexperimental sets fortwo kinds of shock compression methods: (a) shock–recovery experimentsperformed by accelerationof a flyer plate by an explosive
charge; (b) anvil with OFE, HP and single crystal test samples; (c) sample and recovery chamber for laser shock experiments; (d) the cross section of the samples
and recovery chamber for laser shock experiments.
evolves into a blast wave, which has a triangular shape. A typical
pulse shape is shown in Fig. 1(b). At 0.5 mm into the sample,
the pulse duration is around 40 ns, at an energy around 300 J, ata laser energy of around 300 J, which produces an initial pres-
sure of approximately 60 GPa. In our experiments, phase plates
were also utilized to smooth the beam over the entire surface
of interest. Thus, the difference in the sample pressure duration
(pressure dwell time) is of order ∼1000.
In the explosion-driven flyer-plate experiments, two orienta-
tions of monocrystalline copper, 0 0 1 and 2 2 1 were shock-
compressed in the shock/recovery experiments at low temper-
ature (88 K). The setup used for this experiment is shown in
Fig. 2(a). It is described in detail by Lassila et al. [25]. The cop-
per samples were shocked by an explosion-driven flyer plate,
providing an initial pulse duration of 1.4s for a 30 GPa and
1.1s for a 60 GPa shock. The monocrystalline cylinders, witha diameter of 20 mm and thickness of 4.5 mm, were embedded in
a copper plate (Fig. 2(b)). Lateral and bottom momentum traps
were employed to trap the lateral release waves and to prevent
spalling of the copper. These traps were made from a Cu–Be
alloy because of its enhanced strength relative to unalloyed Cu.
The flyer-plate velocity was determined by using pins located
in four positions equally spaced around the lateral momentum
trap (Fig. 2(a)). The shock pressures were determined using the
flyer-plate velocity in conjunction with the U s versus U p lin-
ear relationship. The copper samples were shocked at 30 and
57 GPa, from an initial temperature of 88 K obtained by cooling
the assembly with liquid nitrogen. The surface of the monocrys-
tals was protected from direct impact by electrodeposition of
Cu cover plate material, followed by finish machining to a high
tolerance (prior to electrodeposition, the Cu samples were pro-tected with a release agent).
The laser shock experiments were primarily carried out at the
OMEGA Laser Facility at University of Rochester’s Laboratory
for Laser Energetics (LLE). Preliminary and follow-up exper-
iments were performed using the JANUS Laser at Lawrence
Livermore National Laboratory (LLNL). The input laser ener-
gies used in the experiments were, for [0 0 1]: 40 J, 70 J, 205 J,
and 300 J. For the [2 2 1] orientation, one experiment at laser
energy of 300 J was carried out. The energies can be translated
into pressures using Lindl’s equation [27]:
P = 40I 15
λ2/3
(1)
where P is pressure (MBar), I 15 thelaser intensity (1015 W/cm2),
and λ is wavelength in micrometers. The laser spot size was on
the order of 2.5–3 mm, depending on the size of the sample
and the pulse durations were typically 2.5 ns with a small num-
ber of experiments occurring at 6 ns. This experimental setup
provided energy densities on the order of 50 MJ/m2. For the
recovery experiments, single crystals of Cu with an [1 0 0] orien-
tation were obtained from Goodfellow in the form of disks with
2.0–3.0 mm diameter and 1 mm thickness. They were mounted
into foam-filled recovery tubes shown in Fig. 2(c). Foam with
a density of 50 mg/cm3
was used to decelerate the samples for

8/3/2019 Bu Yang Cao et al- Effect of shock compression method on the defect substructure in monocrystalline copper
http://slidepdf.com/reader/full/bu-yang-cao-et-al-effect-of-shock-compression-method-on-the-defect-substructure 4/12
B.Y. Cao et al. / Materials Science and Engineering A 409 (2005) 270–281 273
recovery. The shock amplitude at the surface of the Cu crystal
can be obtained from the laser energy and the computed values
(using hydrocode calculations). In some experiments, a CH plas-
tic layer was used as an ablator. This resulted in an impedance
mismatch at the CH/Cu interface, which enhanced the shock
pressure in the copper specimen. Due to the short duration of the
shock created by the 3 ns laser pulse, the decay in the specimen
is very rapid. This decay is calculated by a hydrodynamics code.
3. Experimental results
3.1. Deformation microstructures for plate impact and
laser shock at 30–40 GPa
The microstructures are characterized by stacking faults
for both the plate impacted and laser shocked 1 0 0 sam-
ples, as shown in Fig. 3. This is known and has been estab-
lished by Murr [28,29], among others. The average spacing
between stacking faults is between 230 and 450 nm for the
laser shocked samples and between 180 and 220 for the plate-impact shocked sample. Fig. 3(a and b) show the stacking-fault
patterns similar to the ones observed by Murr [30] for the
30 GPa plate-impact shocked samples. It shows the two sets
of stacking faults as the traces of [2 2 0] and [2 2 0] orienta-
tions in the (0 0 1) plane when the TEM electron beam direction
is B = 0 0 1. Fig. 3(c) shows the stacking faults formed in
40 GPa laser shocked samples. All four stacking-fault variants,
viz. the (1 1 1)1/6[1 1 2], (1 1 1)1/6[1 1 2], (1 1 1)1/6[1 1 2], and
(1 1 1)1/6[1 1 2] are observed, indicated as A, B, C, and D. This
is due to the fact that, for [0 0 1], they all have the same resolved
shear stress. However, there is a significant difference in the
activation along [2 2 0] (SF: A, B) versus [2 2 0] (SF: C, D)with the density of occurrence significantly higher in the for-
mer. It should be noted that, in the 30 GPa plate-impact shocked
1 0 0 monocrystalline copper samples, we observed isolated
regions of recrystallization as well as localized deformation
bands. These were absent for the laser shocked specimens.
The substructure of the plate impacted 221 sample shocked
at 30 GPacontains bands,whose morphologies vary through this
sample. Some large bands, shown in the left part of Fig. 4(a),
have a width around 120–130 nm. Micro-bands with a width of
20–30nm were found within these large bands. More detailed
TEM shows that there are two sets of micro-bands with an angle
of around 70◦; one direction is more predominant than the other
one. Huang and Gray [31] proposed a model to explain theformation of micro-bands, based on the development of coarse
slip bands. In their model, double dislocation walls are formed
parallel to the primary slip planes at first. Secondary slip is
induced by the internal stresses in the region between the dou-
ble walls. Then, the interaction of the primary and secondary
dislocations results in a final stable dislocation configuration.
The laser shocked 2 2 1 samples are characterized by a greater
density of twins than bands. Although some bands with width of
100–200 nm were observed, very similar to those big bands in
the 30 GPa plate impacted samples, twins were more prevalent
throughout the sample. Fig. 4(b) shows two traces of twins with
a (1 1 1) habit plane.
Fig. 3. (a) Stacking faults in 30 GPa plate-impacted 1 0 0 sample; (b) stacking
faults in 30 GPa plate-impacted 1 0 0 sample with large magnification; (c)
40GPa laser shocked 1 0 0 sample(fromMeyers et al. [25]): four sets (marked
as A, B, C, D) areobserved.Variant A exhibitsthe highest density of occurrence.
Energy input = 205J, g = 200, B =[001].
3.2. Deformation microstructures for plate impact and
laser shock at 55–60 GPa
Micro-twins occur in the samples shocked at 55–60 GPa both
in the plate impact and the laser shock cases. In plate-impacted
1 0 0 monocrystalline samples, as shown in Fig. 5(a), there is
only one set of micro-twins with (1 1 1) as their habit plane. The

8/3/2019 Bu Yang Cao et al- Effect of shock compression method on the defect substructure in monocrystalline copper
http://slidepdf.com/reader/full/bu-yang-cao-et-al-effect-of-shock-compression-method-on-the-defect-substructure 5/12
274 B.Y. Cao et al. / Materials Science and Engineering A 409 (2005) 270–281
Fig. 4. (a) Micro-bands in 30 GPa plate-impacted 2 2 1 samples; (b) twins in
35 GPa laser shocked 2 2 1 samples.
sizes for the micro-twins vary from 80 to 180 nm. For the laser-
shocked 1 0 0 samples, there aretwo sets of micro-twins.When
imaged at B = [0 0 1], they appear at exactly 90 degrees to each
other aligned along [2 2 0] (set A) and [2 2 0] (set B) directions,
respectively, and they are present roughly in the same proportion
(not shown here). Set A exhibits a wide range of lengths, from
as small as 70 nm to as large as 1m; the mean value is around125 nm. In contrast, the set B micro-twins have a near uniform
length of 70 nm. Fig. 5(b) shows set A, which has the (1 1 1)
habit plane and are elongated along [1 2 1], when imaged in
the edge orientation at B close to [1 0 1]. It should be noted
that the deformation microstructure was not uniform around the
perforation in either of the two kinds of samples.
Forthe 57 GPa plate-impactshocked samples, there aredefor-
mation bands, slip bands, recrystallized regions and dislocation
tangles in addition to micro-twins. Fig. 6(a) shows an overview
TEM near the back surface of the specimen. A deformation band
with approximately 1.8m width is seen traversing the speci-
men.In comparisonwith the slip/stacking-faults bandsaround it,
Fig. 5. (a) 57 GPa plate-impacted sample: micro-twins with the habit plane of
(11 1) shown at the electron beam direction of (01 1); (b) 55–60 GPa laser
shocked sample (from Meyers et al. [25]): micro-twins with a (1 1 1) habit
plane elongated along [1 2 1] in 60 GPa laser shocked 1 0 0 sample. Energy
input= 320 J, g = 0–20, B =[101].
this deformation band is larger andbreaks them up.Selectedarea
diffraction identifies the vertical slip bands as (1 1 1). It appears
that the horizontal slip bands were activated earlier than the ver-
tical bands because the horizontal bands seem to be interrupted
by the vertical ones. One can also see that the appearance of these stacking faults is different from the ones shown in Fig. 3.
There is evidence for recovery processes within them. These
broad bands are absent in the laser shock case because of the
much shorter time intervals involved. Indeed, the shock velocity
is approximately 5.6 mm/ s. A duration of 1.4s can generate
heterogeneities extending over a few millimeters. On the other
hand, for the laser shock case, with a duration of 40 ns at 0.5 mm,
the ability to generate inhomogeneities is much more restricted.
These would be a few micrometers long, and their thickness
would be greatly reduced. In Fig. 6(b), for the plate impact case,
regular dislocation cell arrays can be seen. Between two arrays,
there are dislocation tangles and in some places the density of

8/3/2019 Bu Yang Cao et al- Effect of shock compression method on the defect substructure in monocrystalline copper
http://slidepdf.com/reader/full/bu-yang-cao-et-al-effect-of-shock-compression-method-on-the-defect-substructure 6/12
B.Y. Cao et al. / Materials Science and Engineering A 409 (2005) 270–281 275
Fig. 6. TEM for 57 GPa plate-impacted 1 0 0 copper samples: (a) overview of the sample (×10 K); (b) dislocation circles shown in the first thin foil along the shock
direction.
dislocation is very high. By comparing the TEM observations in
different positions, the dislocation density becomes lower along
the shock direction. Extended regions of dislocation arrays and
stacking faults can be seen. By measuring the distances between
the repeated structures in both Fig. 6(a and b), as indicated in
the two pictures, it can be seen that the two different structureshave the same width of around 500 nm. The periodicity of the
features of Fig. 6(a) is remarkable. It is speculated that these
features are due to the recovered stacking-fault arrays seen in
Fig. 6(b). Mughrabi and Ungar [32] found some dislocation cell
structures very similar to our observations, but they are quite
unlike the cells observed by other investigators (e.g., Johari and
Thomas [33]). Gray and Follansbee [34] believe that increasing
peak pressure or pulse duration decreases the observed disloca-
tion cell size and increases the yield strength.
However, the major difference between the laser shocked
samples andplate-impact shocked samples in 55–60 GParegime
is the presence of fully recrystallized regions in the latter. The
recrystallized grains in the 57 GPa plate-impact shocked 1 0 0sample are similar to those for the 30 GPa plate impact, but much
more extensive.
For the 55–60GPa laser shocked samples, there are some
laths away from the center (Fig. 7), while micro-twins are sit-
uated closer to the center. Unlike the micro-twins, the laths are
elongated close to 2 2 0. In some regions they are aligned along
[2 2 0] and in others along [2 2 0]. The intermediate area shows
laths misoriented from [2 2 0]. Given the curvature of the laths, it
is unlikely that they conform to any single habit plane. Nonethe-
less, the projected width of the lath interface shows a minimum
at B = [0 0 1], and a maximum at either [10 1], or [1 0 1], where
the respective {1 1 1} are in the edge orientation. The lath inter-
face plane is parallel to [0 0 1], and therefore, uniquely different
from micro-twins. In fact, on rare occasions we observe laths
containing some micro-twins.
Meyers [26] explained the features revealed in Fig. 7 f or laser
shocked samples. These features are believed to be consistent
with the “wavy sub-grains” observed after high-pressure shock compression by Murr [30] (in particular, note the similarities
with Figs. 34 and 35 in ref. [30]). This structure is also analogous
to the oneobserved by Gray [35] in specimenswherethe residual
strain was high. Thus, it is suggested that the substructures are
due to thermal recovery of the shock-induced microstructure.
Fig. 7. View of laths imaged at beam direction B = [10 1] in 55–60 GPa laser
shocked 1 0 0 samples (from Meyers et al. [25]).

8/3/2019 Bu Yang Cao et al- Effect of shock compression method on the defect substructure in monocrystalline copper
http://slidepdf.com/reader/full/bu-yang-cao-et-al-effect-of-shock-compression-method-on-the-defect-substructure 7/12
276 B.Y. Cao et al. / Materials Science and Engineering A 409 (2005) 270–281
The orientation close to {1 1 1} of the boundaries is a residue
of the original twin boundaries. This microstructure represents
the recovered state of a heavily twinned and dislocated structure.
While forthe plate-impactshockedsamplesat thesamepressure,
the heavily dislocated structures may indicate that the there is
not as much as thermal recovery in the laser shocked samples.
The 2 2 1 samples plate-impacted at 57 GPa were full of
large recrystallized grains, which were shown by both TEM and
SEM – Electron Channeling Contrast [36] in Fig. 8(a and b).
Annealing twins grow in the recrystallized grains. In 60 GPa
laser shocked 2 2 1 samples, there is a high density of disloca-
tion, as shown in Fig. 9(a). These dislocations are tangled and
some bands were formed as a result of heavy dislocation den-
sity. Deformation twins were found in this sample, as shown in
Fig. 9(b).
4. Analysis
4.1. Heat extraction from shocked specimens
Laser and plate-impact shocks have differentwave shapes and
very different duration times: 2 ns for the laser experiments and
1–2s for flyer-plate experiments. It is important to note these
here because this likely results in very different effects on the
heat generated during the shock and the heat transfer afterwards.
When a shock wave compressed the sample, the shock ampli-
tude attenuates along the propagation direction. We cansee from
Fig.1(a) that therarefactionovertakingthe peak pressureplateau
from the back travels with the velocity of C + U p. The front of
the shock wave travels with the velocity of U s. The bottom of
the part that is beyond the peak pressure travels with a velocity
of C 0. Hence, eventually the rarefaction will catch up with theshock front, leading to a triangular shaped blast wave, much like
in thelaser experiment.For the plate-impactshock wave, thedis-
tance that the peak pressure is maintained, S, can be calculated
to a first approximation by:
S =U 2s t p
U p + C − U s(2)
U s = C0 + S 1U p (3)
This calculation in Eq. (2) neglects the advance of the interface.
If we do consider that, a more precise solution is given as Eq.
(4):
S =U sCt p
U p + C − U s(4)
The parameters for copper are: S1 = 1.489; when P = 60GPa,
U s1 = 5.696 km/s, U p1 = 1.180 km/s, C 1 = 5.903 km/s; when
P = 30GPa, U s1 = 4.95 km/s, U p1 = 0.679 km/s, C 1 = 5.131 km/s.
Thus, when the peak pressure is 60 GPa, the distance that the
peak pressure is maintained, S, will be 25.73 mm and 26.67 mm,
according to Eqs. (2) and (4), individually.
We can, thus, obtain the progress of the shock pulse through
the sample and its decay, shown in Fig. 10(a) for both 30 and
57 GPa. Fig. 10(b) represents the shock pressure decay for laser
shocked samples, extracted from the laser impact energies and
Fig. 8. 57 GPa plate-impacted 2 2 1 sample (a) TEM showing annealing
twins and recrystallized grains in; (b) recrystallized grains were observed by
SEM–ECC in 57GPa impacted 2 2 1 sample.
hydrocode calculations. Note that the maximum pressure versus
distance plotted in Fig. 10(b), at small distances, is nearly the
same as the laser ablation pressure (Eq. (1)), which can be high,
at the higher laser energies. There is an exponential decrease as
a function of propagation distance. The difference between the

8/3/2019 Bu Yang Cao et al- Effect of shock compression method on the defect substructure in monocrystalline copper
http://slidepdf.com/reader/full/bu-yang-cao-et-al-effect-of-shock-compression-method-on-the-defect-substructure 8/12
B.Y. Cao et al. / Materials Science and Engineering A 409 (2005) 270–281 277
Fig. 9. 60 GPa laser shocked 2 2 1 samples: (a) dislocation structures; (b)
twins.
decay rates in Fig. 10(a and b) is the result of the difference in
pulse duration.
Based on thepressures given in Fig. 10, the shock andresidual
temperatures inside the samples can be calculated through Eqs.
(5) and (6) [17]. The shock temperature T s is:
T s = T 0 exp
γ 0
V 0(V 0 − V 1)
+
P (V 0 − V 1)
2Cv+
exp
−γ 0V 0
V 1
2Cv
× V 1
V 0P exp
γ 0
V 0 V
2 −
γ 0
V 0 (V 0 − V )
dV (5)
Fig. 10. Pressure profiles along the samples during shock: (a) plate-impact
shock; (b) laser shock from Meyers et al. [26].
The residual temperature T r is:
T r = T s exp
−γ 0
V 0(V 0 − V 1)
(6)
γ 0 is 1.99 for copper, P the peak pressure of the shock waves, V 1is the specific volume of the material directly behind the shock;
V 1 can be calculated from the relationships between the shock
parameters.
P =C2
0(V 0 − V )
[V 0 − S (V 0 − V )]2(7)
V =C2
0
2PS 2
1 +
4PSV 0
C20
+2S (S − 1)V 0P
C20
− 1
(m3/kg)
(8)
C 0 and S are the parameters used to describe the relationship
between shock velocity U s and particle velocity U p:
U = C0 + S 1U p + S 2U 2p + · · · (9)
For Cu, C 0 = 3.94 × 10³ m/s, S1 = 1.489 × 10³ m/s. We also
need to consider the heat capacity C v (the specific heat at con-
stant volume). The values of specific heat at constant pressure
8/3/2019 Bu Yang Cao et al- Effect of shock compression method on the defect substructure in monocrystalline copper
http://slidepdf.com/reader/full/bu-yang-cao-et-al-effect-of-shock-compression-method-on-the-defect-substructure 9/12
278 B.Y. Cao et al. / Materials Science and Engineering A 409 (2005) 270–281
C p usually are easier to measure than C v. C v can be evaluated
solely from C p and P versus T data.
Cv = T
∂S
∂T
v
(10)
Cp = T ∂S
∂T
p
(11)
Cp − Cv =υTβ2
KT(12)
where v is the specific volume, β is the volumetric expansion
coefficient and K T is the isothermal coefficient of compressibil-
ity.
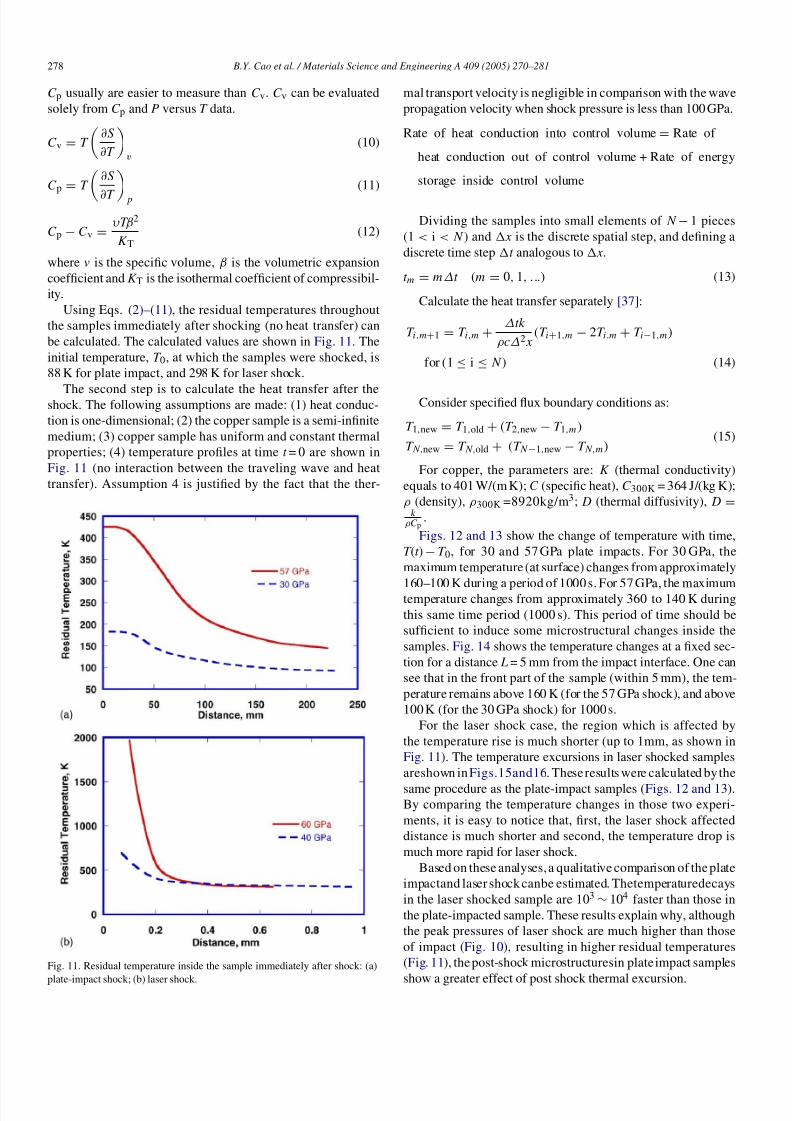
Using Eqs. (2)–(11), the residual temperatures throughout
the samples immediately after shocking (no heat transfer) can
be calculated. The calculated values are shown in Fig. 11. The
initial temperature, T 0, at which the samples were shocked, is
88 K for plate impact, and 298 K for laser shock.
The second step is to calculate the heat transfer after theshock. The following assumptions are made: (1) heat conduc-
tion is one-dimensional; (2) the copper sample is a semi-infinite
medium; (3) copper sample has uniform and constant thermal
properties; (4) temperature profiles at time t = 0 are shown in
Fig. 11 (no interaction between the traveling wave and heat
transfer). Assumption 4 is justified by the fact that the ther-
Fig. 11. Residual temperature inside the sample immediately after shock: (a)
plate-impact shock; (b) laser shock.
mal transport velocity is negligible in comparison with the wave
propagation velocity when shock pressure is less than 100 GPa.
Rate of heat conduction into control volume = Rate of
heat conduction out of control volume + Rate of energy
storage inside control volume
Dividing the samples into small elements of N − 1 pieces
(1 < i < N ) and x is the discrete spatial step, and defining a
discrete time step t analogous to x.
t m = m∆t (m = 0, 1, ...) (13)
Calculate the heat transfer separately [37]:
T i,m+1 = T i,m +∆tk
ρc∆2x(T i+1,m − 2T i.m + T i−1,m)
for (1 ≤ i ≤ N ) (14)
Consider specified flux boundary conditions as:
T 1,new = T 1,old + (T 2,new − T 1,m)
T N,new = T N,old + (T N −1,new − T N,m)(15)
For copper, the parameters are: K (thermal conductivity)
equals to 401 W/(m K); C (specific heat), C 300K = 364 J/(kg K);
ρ (density), ρ300K =8920kg/m3; D (thermal diffusivity), D =k
ρCp.
Figs. 12 and 13 show the change of temperature with time,
T (t ) − T 0, for 30 and 57 GPa plate impacts. For 30 GPa, the
maximum temperature (at surface) changes from approximately
160–100 K during a period of 1000 s. For 57 GPa, the maximumtemperature changes from approximately 360 to 140 K during
this same time period (1000 s). This period of time should be
sufficient to induce some microstructural changes inside the
samples. Fig. 14 shows the temperature changes at a fixed sec-
tion for a distance L = 5 mm from the impact interface. One can
see that in the front part of the sample (within 5 mm), the tem-
perature remains above 160 K (for the 57 GPa shock), and above
100 K (for the 30 GPa shock) for 1000 s.
For the laser shock case, the region which is affected by
the temperature rise is much shorter (up to 1mm, as shown in
Fig. 11). The temperature excursions in laser shocked samples
areshown in Figs.15and16. These results were calculated by the
same procedure as the plate-impact samples (Figs. 12 and 13).By comparing the temperature changes in those two experi-
ments, it is easy to notice that, first, the laser shock affected
distance is much shorter and second, the temperature drop is
much more rapid for laser shock.
Based on these analyses, a qualitative comparison of the plate
impactand laser shock canbe estimated. Thetemperaturedecays
in the laser shocked sample are 103 ∼ 104 faster than those in
the plate-impacted sample. These results explain why, although
the peak pressures of laser shock are much higher than those
of impact (Fig. 10), resulting in higher residual temperatures
(Fig. 11), the post-shock microstructuresin plate impact samples
show a greater effect of post shock thermal excursion.

8/3/2019 Bu Yang Cao et al- Effect of shock compression method on the defect substructure in monocrystalline copper
http://slidepdf.com/reader/full/bu-yang-cao-et-al-effect-of-shock-compression-method-on-the-defect-substructure 10/12
B.Y. Cao et al. / Materials Science and Engineering A 409 (2005) 270–281 279
Fig. 12. Temperature change for copper plate-impacted at 30 GPa.
4.2. Heat generation in shear localization regions
Fig. 6(a) shows a shear localization area. Other observations
also confirm the presence of localized regions of concentrated
shear. The plastic deformation in these regions substantially
exceeds those predicted from uniaxial strain, and one can expect
local fluctuations in temperature. Indeed, the temperature rise in
the shear localization areas can be calculated from the constitu-
tive response of copper. This deformation-induced temperature
rise was considered earlier by Lassila et al. [25]. It is expressed
as:
T d =β
ρCp ε1
ε0
σ dε (16)
where ρ is the density, C p the heat capacity, and β is the Tay-
lor factor. For most metals, β is usually taken as 0.9–1.0. The
strength of the material σ has to be estimated under specified
conditions in different cases. We use the Johnson–Cook [38]
equation:
σ = (σ 0 + Bεn)
1 + C log
ε
ε0
[1 − T ∗m] (17)
where
T ∗ =T − T r
T m − T r
(18)
Fig. 13. Temperature change for copper plate-impacted at 57 GPa.
The temperature change due to the plastic deformation is
expressed as:
T ∗ = 1 − exp
−0.9
1 + C log ε
ε0
ρCp(T m − T r)
×
σ 0ε +
Bεn+1
n + 1
(19)
Fig. 14. Temperature change for fixed section at L = 5 mm along the plate-
impacted sample.

8/3/2019 Bu Yang Cao et al- Effect of shock compression method on the defect substructure in monocrystalline copper
http://slidepdf.com/reader/full/bu-yang-cao-et-al-effect-of-shock-compression-method-on-the-defect-substructure 11/12
280 B.Y. Cao et al. / Materials Science and Engineering A 409 (2005) 270–281
Fig. 15. Temperature change in laser shocked copper with 200J (40 GPa).
Fig. 16. Temperature change in laser shocked copper with 300J (60 GPa).
where T r =90K, T m =1356K, B = 53.7 MPa, C = 0.026,
σ 0 = 330 MPa (the value for shock hardened copper), n = 0.56,
m = 1.04, ρ90 K = 9.05 g/cm3, C p,90 K = 260 J/(kg K). Fig. 17
expresses the increase in temperature as a function of strain
for a hypothetical shock hardened copper specimen. There is
considerable local heat generation around heavily deformed
Fig. 17. Temperature rise due to plastic deformation.
areas (such as deformation bands). These regions can act as
initiation sites for post-shock recrystallization.
5. Conclusions
Laser and plate-impact shocked copper with two orientations
([0 0 1] and [2 2 1]) revealed similarities as well as differences,
that are interpreted in terms of the shock compression and ther-
mal excursion processes. The observations can be summarized
as:
• At lower pressures (30–40 GPa range), there are profuse
stacking faults in the 1 0 0 orientation which have traces
at 90◦ for both the laser and plate-impact experiments. The
stacking-fault spacing is about the same 200–300 nm.
• In the 55–60 GPa range, micro-twins are observed for both
the laser and plate-impact shocked 1 0 0 orientation.
• For the 57 GPa shock in both the 1 0 0 and 2 2 1 orienta-
tions, there are recrystallized grains for the plate impact case,
while no recrystallized grains appeared in laser shocked sam-ples.
• Regions of shear localization were observed after the plate
impact shock, while they are absent after the laser shock.
These micro-shear-bands have a thickness of approximately
1.5m.
Thecoolingtimesare calculated forthe laser andplate-impact
experiments. Plate-impact experiments were carried out at an
initial temperature of 88 K whereas the laser shock experiments
were conducted at ambient temperature. Nevertheless, the dif-
ferences are of a factor of 5000. The differences in residual
microstructures areattributed to the much larger cooling times inthe plate-impact experiments. One possible explanation for the
extensive recrystallization observed is the formation of shear
concentration regions (shear bands) which can raise the local
temperature by hundreds of degrees Centigrade (depending on
the plastic strain), creating localized conditions for recrystalliza-
tion.
Acknowledgements
This research was supported by the Department of Energy
through Grants DEFG0398DP00212 and DEFG0300SF2202.
We thank the Shenyang National Laboratory for Materials Sci-
ence for support of Bu Yang Cao during her stay in China. The
plate-impact experiments were conducted at the New Mexico
Institute of Mining and Technology.
References
[1] J.C.M. Li, in: L.E. Murr, C. Stein (Eds.), Frontiers in Materials
Science—Distinguished Lectures, Marcel Dekker, New York, 1976, p.
527.
[2] J.C.M. Li, Metallic Glass, ASM, Metals Park, Ohio, 1976, pp. 224–246.
[3] J.C.M. Li, Proceedings of Fourth International Conference Rapidly
Quenched Metals, Sendi, Japan, 1981.
[4] J.C.M. Li, Proc. Mater. Res. Soc. Symp. Rapidly Solidified Amorphous
and Crystalline Alloys, Boston, 1981.

8/3/2019 Bu Yang Cao et al- Effect of shock compression method on the defect substructure in monocrystalline copper
http://slidepdf.com/reader/full/bu-yang-cao-et-al-effect-of-shock-compression-method-on-the-defect-substructure 12/12
B.Y. Cao et al. / Materials Science and Engineering A 409 (2005) 270–281 281
[5] J.C.M. Li, Trans. TMS-AIME 227 (1963) 75.
[6] J.C.M. Li, Can. J. Phys. 45 (1967) 493–509.
[7] I. Gupta, J.C.M. Li, Met. Trans. 1 (1970) 2323–2330.
[8] P. Zhu, J.C.M. Li, C.T. Liu, Reaction mechanism of combustion syn-
thesis of NiAl, Mater. Sci. Eng. A 329 (2002) 57–68.
[9] J.C.M. Li, in: A.R. Rosenfield, G.T. Hahn, A.L. Bement, R.I. Jaf-
fee (Eds.), Dislocation Dynamics, McGraw-Hill, New York, 1968, pp.
87–116.
[10] C.S. Smith, Trans. AIME 212 (1958) 574.[11] P.S. Decarli, M.A. Meyers, in: M.A. Meyers, L.E. Murr (Eds.), Shock
Waves and High-Strain-Rate Phenomena in Metals, 1981, pp. 341–373.
[12] P.C. Chou, J. Carleone, J. Appl. Phys. 48 (1977) 4187–4195.
[13] J.M. Walsh, J. Appl. Phys. 56 (1984) 1997–2006.
[14] D.E. Grady, J. Impact Eng. 5 (1987) 285–293.
[15] C.Y. Hsu, K.C. Hsu, L.E. Murr, M.A. Meyers, in: M.A. Meyers, L.E.
Murr (Eds.), Shock Waves and High-Strain-Rate Phenomena in Metals,
1981, pp. 433–452.
[16] G.T. Gray III, Mater. Res. Soc. Symp. Proc. 499 (1998) 87–98.
[17] M.A. Meyers, Dynamic Behavior of Materials, John Wiley and Sons
Inc., New York, 1994.
[18] K.S. Vecchio, U. Andrade, M.A. Meyers, L.W. Meyer, Shock Compres-
sion of Condensed Matter, 1991, pp. 527–530.
[19] B.A. Remington, G. Bazan, J. Belak, E. Bringa, M. Caturla, J.D. Colvin,
M.J. Edwards, S.G. Glendinning, D.S. Ivanov, B. Kad, D.H. Kalantar,
M. Kumar, B.F. Lasinski, K.T. Lorenz, J.M. Mcnaney, D.D. Meyerhofer,
M.A. Meyers, S.M. Pollaine, D. Rowley, M. Schneider, J.S. Stolken,
J.S. Wark, S.V. Weber, W.G. Wolfer, B. Yaakobi, L.V. Zhigilei, Metall.
Mater. Trans. 35A (2004) 2587–2607.
[20] G.T. Gray III, E.S. Follansbee, C.E. Frantz, Mater. Sci. Eng., A 111
(1989) 9–16.
[21] M.A. Mogilevsky, L.A. Teplyakova, in: L.E. Murr, K.P. Staudham-
mer, M.A. Meyers (Eds.), Metallurgical Applications of Shock-Wave
and High-Strain-Rate Phenomena, Marcel Dekker, New York, 1986, pp.
419–427.
[22] M. Pollington, P. Thompson, J. Maw, Discov. Sci. Technol. J. AWE 5
(2002) 16–25.
[23] R. Cauble, T.S. Perry, D.R. Bach, K.S. Budil, B.A. Hammel, G.W.
Collins, D.M. Gold, J. Dunn, P. Celliers, Phys. Rev. Lett. 80 (1998)
1248–1251.
[24] J.F. Ready, Industrial Applications of Lasers, Academic Press, San
Diego, 1997.
[25] D.H. Lassila, T. Shen, B.Y. Cao, M.A. Meyers, Metall. Mater. Trans.
35A (2004) 2729–2739.[26] M.A. Meyers, F. Gregori, B.K. Kad, M.S. Schneider, D.H. Kalantar,
B.A. Remington, G. Ravichandran, T. Boehly, J.S. Wark, Acta. Metall.
51 (2003) 1211–1228.
[27] J. Lindl, Phys. Plasmas 2 (1995) 3933–3982.
[28] L.E. Murr, K.P. Staudhammer, Mater. Sci. Eng. 20 (1975) 35–46.
[29] L.E. Murr, Scripta Met. 12 (1978) 201–206.
[30] L.E. Murr, in: M.A. Meyers, L.E. Murr (Eds.), Shock Waves and
High-Strain-Rate Phenomena in Metals, Plenum, NY, 1981, pp. 607–
673.
[31] J.C. Huang, G.T. Gray III, Acta Metall. 37 (12) (1989) 3335–3347.
[32] H. Mughrabi, T. Ungar, W. Kienle, M. Wilkens, Philos. Mag. A 53
(1986) 793–813.
[33] O. Johari, G. Thomas, Acta. Metall. 12 (1964) 1153–1159.
[34] G.T. Gray III, P.S. Follansbee, in: C.Y. Chiem, H.D. Kunze, L.W. Meyers
(Eds.), Impact Loading and Dynamic Behavior of Materials, Informa-
tionsgells, Verlag, 1988, p. 541.
[35] G.T. Gray III, in: M.A. Meyers, L.E. Murr, K.P. Staudhammer (Eds.),
Shock-Wave and High-Strain-Rate Phenomena in Materials, Dekker, NY,
1992, pp. 899–911.
[36] R. Zauter, F. Petry, M. Bayerlein, C. Sommer, H.-J. Christ, H. Mughrabi,
Philos. Mag. A 66 (1992) 425–436.
[37] F. Kreith, M.S. Bohn, Principles of Heat Transfer, Brooks/Cole, CA,
2000.
[38] G.R. Johnson, W.H. Cook, Proceedings of Seventh International Sym-
posium on Ballistics ADPA, the Netherlands, 1983.