bssml16 l1. introduction, models, and evaluations
TRANSCRIPT

D E C E M B E R 8 - 9 , 2 0 1 6

BigML, Inc 2
Poul Petersen CIO, BigML, Inc.
Intro, Models & EvaluationGetting Started with Machine Learning

BigML, Inc 3Introduction, Models, and Evaluations
Audience DiversityExpert: Published papers at KDD, ICML, NIPS, etc or developed own ML algorithms used at large scale.
Aficionado: Understands pros/cons of different techniques and/or can tweak algorithms as needed.
Newbie: Just taking Coursera ML class or reading an introductory book to ML.
Absolute beginner: ML sounds like science fiction
Practitioner: Very familiar with ML packages (Weka, Scikit, R, etc).

BigML, Inc 4Introduction, Models, and Evaluations
Building BigML’s Platform
2011
Prototyping and Beta
API-first Approach
2013
Evaluations, Batch Predictions,
Ensembles, Sunburst
2015
Association Discovery,
Correlations, Samples, Statistical
Tests
2014
Anomaly Detection, Clusters, Flatline
2016
Scripts, Libraries, Executions,
WhizzML, Logistic Regression
2012
Core ML workflow: source, dataset,
model, prediction

BigML, Inc 5Introduction, Models, and Evaluations
time
Auto
mat
ion Paving the Path to Automatic Machine Learning
AREST API
Programmable Infrastructure
Sauron• Automatic deployment and
auto-scaling
Data Generation and Filtering
C
Flatline• DSL for transformation and
new field generation
B
Wintermute• Distributed Machine
Learning Framework
2011 2016
Automatic Model Selection
E
SMACdown • Automatic parameter
optimization
WorkflowAutomation
D
WhizzML• DSL for programmable
workflows
BigML Vision

BigML, Inc 6Introduction, Models, and Evaluations
BigML Architecture Tools
REST API
Distributed Machine Learning Backend
Web-based Frontend
Visualizations
Smart Infrastructure (auto-deployable, auto-scalable)
SOURCESERVER
DATASETSERVER
MODELSERVER
PREDICTIONSERVER
EVALUATIONSERVER
SAMPLESERVER
WHIZZMLSERVER
- https://bigml.com/tools
- https://bigml.com/api
SERVERS
EVENTS GEARMAN
QUEUE
DESIRED
TOPOLOGY
AWS
COSTS
RUNQUEUE
SCALER
BUSY
SCALER
AUTO
TOPOLOGY
AUTO
TOPOLOGY
AUTO
TOPOLOGY
AUTO
TOPOLOGY
ACTUAL
TOPOLOGY

BigML, Inc 7Introduction, Models, and Evaluations
SOURCE DATASET CORRELATIONSTATISTICAL
TEST
MODEL ENSEMBLELOGISTIC
REGRESSION EVALUATION
ANOMALY DETECTOR
ASSOCIATION DISCOVERY PREDICTION
BATCH PREDICTIONSCRIPT LIBRARY EXECUTION
Dat
a Ex
plo
ratio
nSu
per
vise
d
Lear
ning
Uns
uper
vise
d
Lear
ning
Aut
omat
ion
CLUSTER Scoring
BigML’s Platform

BigML, Inc 8Introduction, Models, and Evaluations
What is ML?
• You are looking to buy a house
• Recently found a house you like
• Is the asking price fair?
Imagine:
What Next?

BigML, Inc 9Introduction, Models, and Evaluations
What is ML?Why not ask an expert?
• Experts can be rare / expensive • Hard to validate experience:
• Experience with similar properties? • Do they consider all relevant variables? • Knowledge of market up to date?
• Hard to validate answer: • How many times expert right / wrong? • Probably can’t explain decision in detail
• Humans are not good at intuitive statistics

BigML, Inc 10Introduction, Models, and Evaluations
Human Intuition Consider the following two cities:
Common Intuition: People in Cloud City never need sunglasses since it’s so cloudy
Did it occur to you: Sun City sells more sunglasses per-capita than LA
Cloud City 350 grey and rainy days15 sunny days
Sun City 15 grey and rainy days350 sunny days
Question: Where is the number of sunglasses sold (per-capita) bigger?

BigML, Inc 11Introduction, Models, and Evaluations
Human IntuitionImagine Mr. Fernández is selected at random
Is Mr. Fernández more likely to be a librarian or a farmer?
Did it occur to you that worldwide there is an estimated 1 billion people officially employed in agriculture?
Mr. Fernández
http://www.globalagriculture.org/report-topics/industrial-agriculture-and-small-scale-farming.html

BigML, Inc 12Introduction, Models, and Evaluations
Intuitive Statistics
Madrid 81 87 93 % 234 270 87 %
Barcelona 192 263 73 % 55 80 69 %
John FrankWins Total Success Wins Total Success
Trials 273 350 78 % 289 350 83 %
John and Frank are both practicing litigation law in Madrid and Barcelona.
Simpson’s Paradox A trend that appears in different groups of data disappears when these groups are combined, and the reverse trend appears for the aggregate data.
Which attorney will you choose?

BigML, Inc 13Introduction, Models, and Evaluations
What is ML?Replace the expert with data?• Intuition: square footage relates to price. • Collect data from past sales
SQFT SOLD
2424 360000
1785 307500
1003 185000
4135 600000
1676 328500
1012 247000
3352 420000
2825 435350
PRICE = 125.3*SQFT + 96535
PREDICT
400262
320195
222211
614651
306538
223339
516541
450508

BigML, Inc 14Introduction, Models, and Evaluations
What is ML?
Price?

BigML, Inc 15Introduction, Models, and Evaluations
What is ML?
Price?
SQFT relates to Price?
SQFT SALE PRICE
2424 360000,0
1785 307500,0
1003 185000,0
4135 600000,0
1676 328500,0
1012 247000,0
3352 420000,0
2825 435350,0
PRICE = 125.3*SQFT + 96535

BigML, Inc 16Introduction, Models, and Evaluations
What is ML?Replace the expert scorecard
• Experts can be rare / expensive • Hard to validate experience:
• Experience with similar properties? • Do they consider all relevant variables? • Knowledge of market up to date?
• Hard to validate answer: • How many times expert right / wrong? • Probably can’t explain decision in detail
• Humans are not good at intuitive statistics

BigML, Inc 17Introduction, Models, and Evaluations
What is ML?Replace the expert with data• Intuition: square footage relates to price. • Collect data from past sales
SQFT SOLD
2424 360000,0
1785 307500,0
1003 185000,0
4135 600000,0
1676 328500,0
1012 247000,0
3352 420000,0
2825 435350,0
PRICE = 125.3*SQFT + 96535
BigML, Inc 18Introduction, Models, and Evaluations
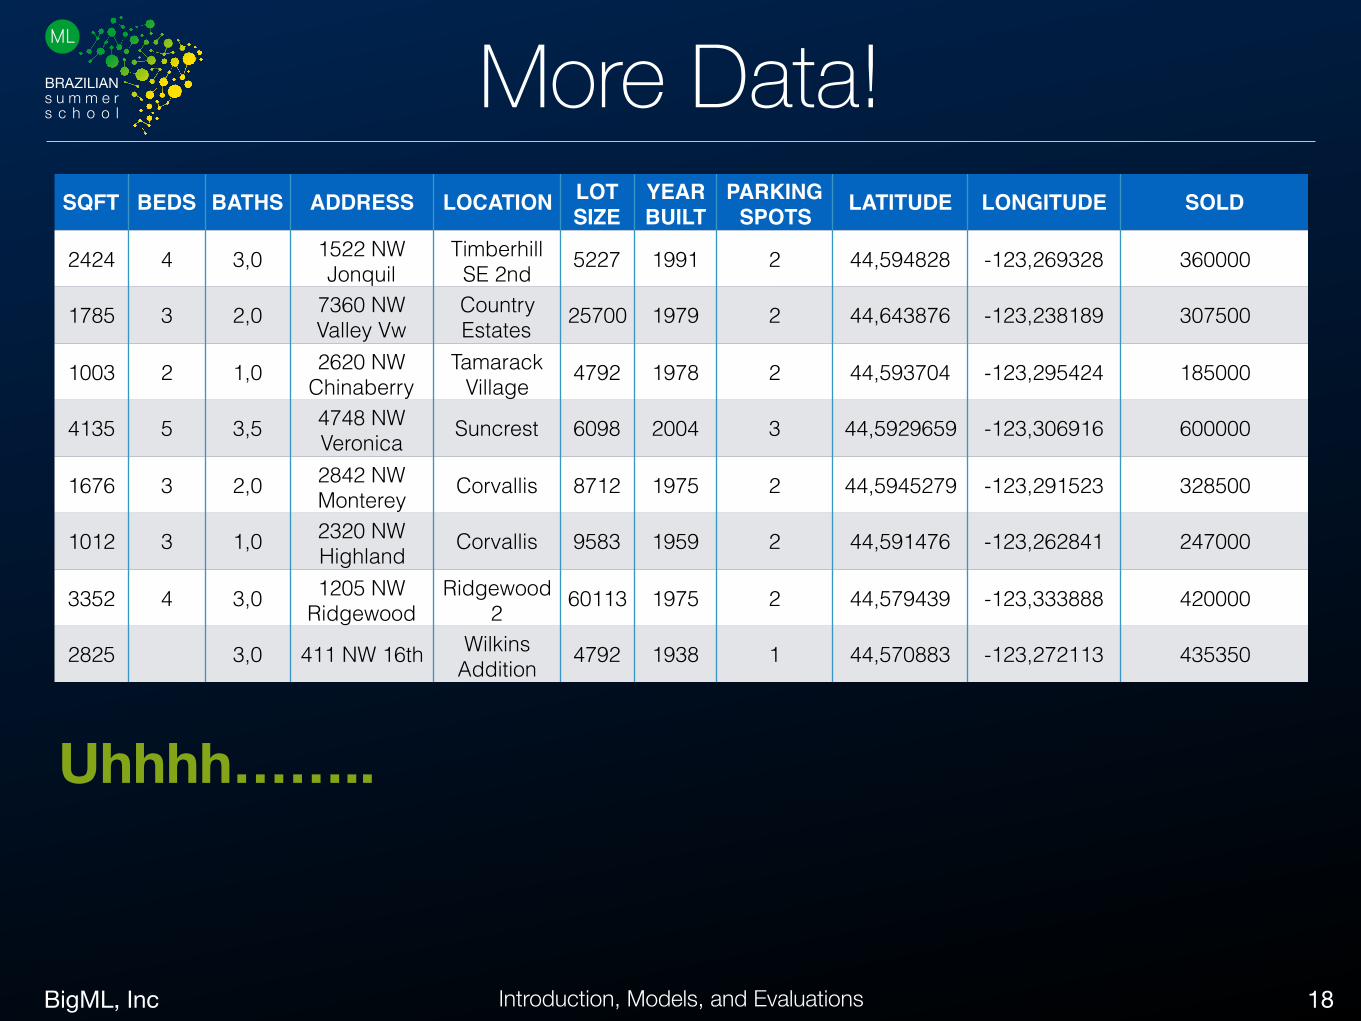
More Data!SQFT BEDS BATHS ADDRESS LOCATION LOT
SIZEYEAR BUILT
PARKING SPOTS LATITUDE LONGITUDE SOLD
2424 4 3,0 1522 NW Jonquil
Timberhill SE 2nd 5227 1991 2 44,594828 -123,269328 360000
1785 3 2,0 7360 NW Valley Vw
Country Estates 25700 1979 2 44,643876 -123,238189 307500
1003 2 1,0 2620 NW Chinaberry
Tamarack Village 4792 1978 2 44,593704 -123,295424 185000
4135 5 3,5 4748 NW Veronica Suncrest 6098 2004 3 44,5929659 -123,306916 600000
1676 3 2,0 2842 NW Monterey Corvallis 8712 1975 2 44,5945279 -123,291523 328500
1012 3 1,0 2320 NW Highland Corvallis 9583 1959 2 44,591476 -123,262841 247000
3352 4 3,0 1205 NW Ridgewood
Ridgewood 2 60113 1975 2 44,579439 -123,333888 420000
2825 3,0 411 NW 16th Wilkins Addition 4792 1938 1 44,570883 -123,272113 435350
Uhhhh……..

BigML, Inc 19Introduction, Models, and Evaluations
This is ML…
Price?
SQFT relates to Price?
SQFT SALE PRICE
2424 360000,0
1785 307500,0
1003 185000,0
4135 600000,0
1676 328500,0
1012 247000,0
3352 420000,0
2825 435350,0
PRICE = 125.3*SQFT + 96535
DATA
MODELINSTANCE PREDICTION
“a field of study that gives computers the ability to learn without being explicitly
programmed”
Professor Arthur Samuel, 1959

BigML, Inc 20
Model Demo #1

BigML, Inc 21Introduction, Models, and Evaluations
Supervised Learning
animal state … proximity actiontiger hungry … close run
elephant happy … far take picture… … … … …
Classification
animal state … proximity min_kmhtiger hungry … close 70
hippo angry … far 10… …. … … …
Regression
animal state … proximity action1 action2tiger hungry … close run look untasty
elephant happy … far take picture call friends… … … … … …
Multi-Label Classification
label(s)

BigML, Inc 22Introduction, Models, and Evaluations
Decision Trees

BigML, Inc 23Introduction, Models, and Evaluations
Decision Trees
Website Visits > 0

BigML, Inc 24Introduction, Models, and Evaluations
Decision Trees
Minutes Used > 200

BigML, Inc 25Introduction, Models, and Evaluations
Decision Trees
Last Bill > $180

BigML, Inc 26Introduction, Models, and Evaluations
Decision Trees
Last Bill > $180 and Support Calls > 0

BigML, Inc 27Introduction, Models, and Evaluations
Why Decision Trees• Works for classification or regression • Easy to understand: splits are features and values • Lightweight and super fast at prediction time • Relatively parameter free • Data can be messy
• Useless features are automatically ignored • Works with un-normalized data • Works with missing data • Resilient to outliers
• Well suited for non-linear problems • Top performer when combined into ensembles…

BigML, Inc 28Introduction, Models, and Evaluations
Handling Missing Data
Missing@ Decision Trees KNN Logistic
RegressionNaive Bayes
Neural Networks SVM
Training Yes No No Yes Yes* No
Prediction Yes No No Yes No No

BigML, Inc 29Introduction, Models, and Evaluations
Data Types
numeric
1 2 3
1, 2.0, 3, -5.4 categoricaltrue, yes, red, mammal categoricalcategorical
A B C
DATE-TIME2013-09-25 10:02
DATE-TIME
YEAR
MONTH
DAY-OF-MONTH
YYYY-MM-DD
DAY-OF-WEEK
HOUR
MINUTE
YYYY-MM-DD
YYYY-MM-DD
M-T-W-T-F-S-D
HH:MM:SS
HH:MM:SS
2013
September
25
Wednesday
10
02
text / itemsBe not afraid of greatness: some are born great, some achieve greatness, and some have greatness thrust upon 'em.
text
“great”“afraid”“born”“some”
appears 2 timesappears 1 timeappears 1 timeappears 2 times

BigML, Inc 30Introduction, Models, and Evaluations
Text Analysis
Be not afraid of greatness: some are born great, some achieve greatness, and some have greatnessthrust upon 'em.
great: appears 4 times
Bag of Words

BigML, Inc 31Introduction, Models, and Evaluations
Text Analysisgreat afraid born achieve
4 1 1 1
… … … …
Be not afraid of greatness: some are born great, some achieve greatness, and some have greatnessthrust upon ‘em.
Model
The token “great” does not occur
The token “afraid” occurs more than once

BigML, Inc 32
Model Demo #2

BigML, Inc 33Introduction, Models, and Evaluations
Learning Problems (fit)
• Model does not fit well enough
• Does not capture the underlying trend of the data
• Change algorithm or features
Under-fitting Over-fitting
• Model fits too well does not “generalize”
• Captures the noise or outliers of the data
• Change algorithm or filter outliers

BigML, Inc 34Introduction, Models, and Evaluations
Why Not Decision Trees
• Slightly prone to over-fitting • But we’ll fix this with ensembles
• Splitting prefers decision boundaries that are parallel to feature axes
• More data • Predictions outside training data can be problematic
• We’ll fix this with model competence • Can be sensitive to small changes in training data
BigML, Inc 35Introduction, Models, and Evaluations
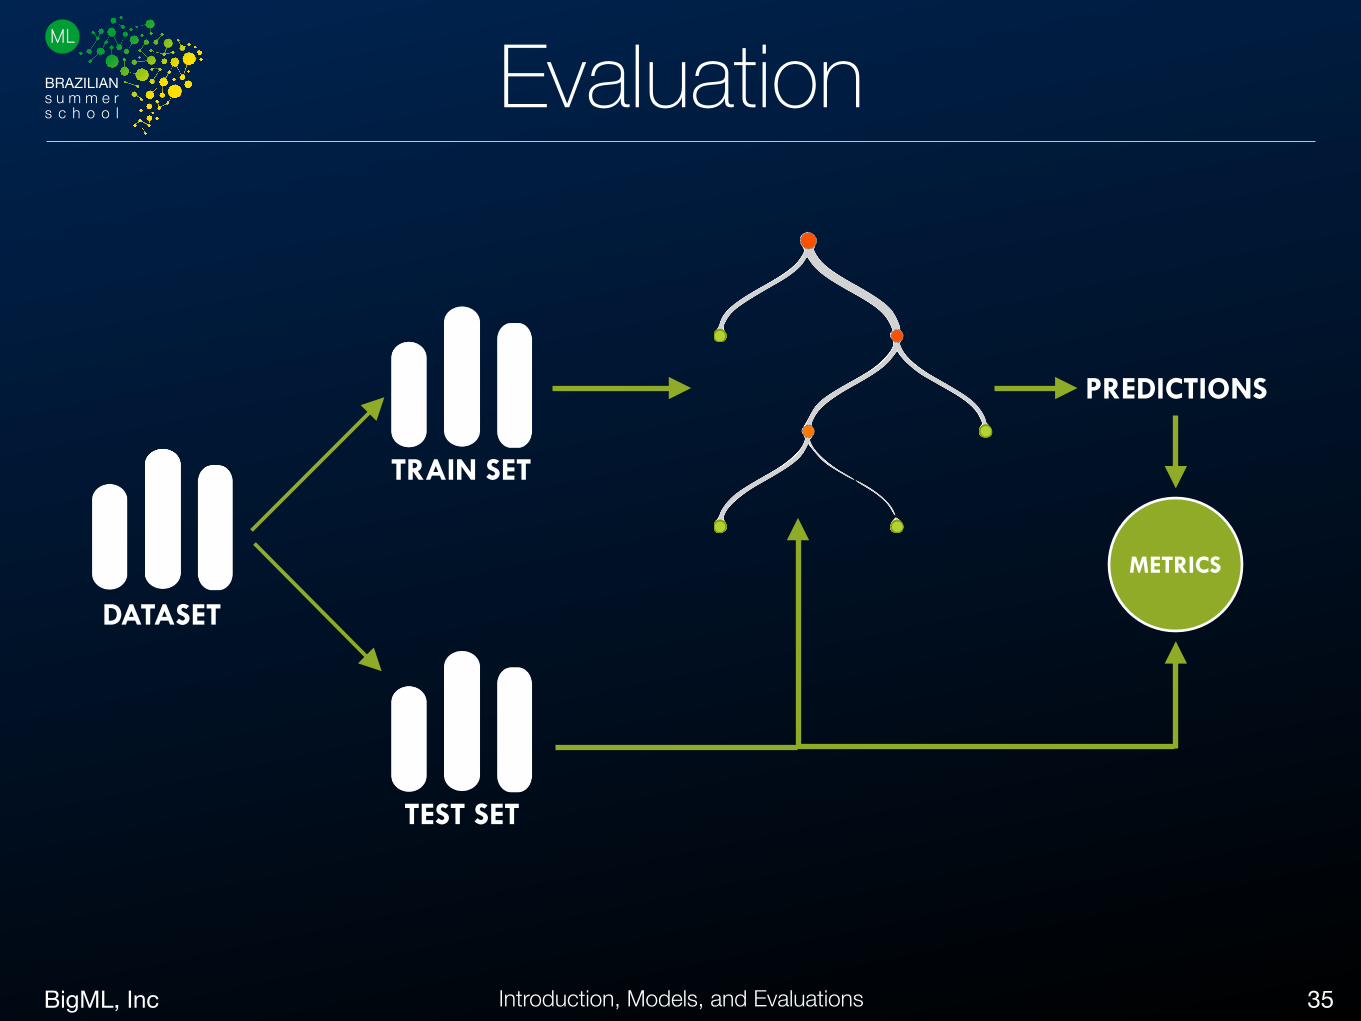
Evaluation
DATASET
TRAIN SET
TEST SET
PREDICTIONS
METRICS

BigML, Inc 36Introduction, Models, and Evaluations
AccuracyTP + TN
Total
• “Percentage correct” - like an exam • = 1 then no mistakes • = 0 then all mistakes • Intuitive but not always useful • Watch out for unbalanced classes!

BigML, Inc 37Introduction, Models, and Evaluations
Accuracy
Classified as Fraud
Classified as Not Fraud
TP = 0 FP = 0 TN = 7 FN = 3
ACC = 70%
=Fraud=Not FraudPositive
Class
NegativeClass

BigML, Inc 38Introduction, Models, and Evaluations
Precision
__TP__ TP + FP
• “accuracy” of positive class
• = 1 then no FP
• = 0 then no TP

BigML, Inc 39Introduction, Models, and Evaluations
Precision
Classified as Fraud
Classified as Not Fraud
TP = 2 FP = 2 TN = 5 FN = 1
P = 50%
=Fraud=Not FraudPositive
Class
NegativeClass

BigML, Inc 40Introduction, Models, and Evaluations
Recall
__TP__ TP + FN
• percentage of positive class
correctly identified
• = 1 then no FN
• = 0 then no TP

BigML, Inc 41Introduction, Models, and Evaluations
Recall
Classified as Fraud
Classified as Not Fraud
TP = 2 FP = 2 TN = 5 FN = 1
R = 66%
=Fraud=Not FraudPositive
Class
NegativeClass

BigML, Inc 42Introduction, Models, and Evaluations
f-Measure
2 * Recall * Precision Recall + Precision
• harmonic mean of Recall & Precision
• = 1 then Recall = Precision = 1
• If Precision OR Recall is small then
f-measure is small

BigML, Inc 43Introduction, Models, and Evaluations
f-Measure
Classified as Fraud
Classified as Not Fraud
R = 66% P = 50%
f = 57%
=Fraud=Not FraudPositive
Class
NegativeClass

BigML, Inc 44Introduction, Models, and Evaluations
Phi Coefficient__________TP*TN_-_FP*FN__________
SQRT[(TP+FP)(TP+FN)(TN+FP)(TN+FN)]
• Returns a value between -1 and 1
• -1 then predictions are opposite reality
• 0 no correlation between predictions
and reality
• 1 then predictions are always correct

BigML, Inc 45Introduction, Models, and Evaluations
Phi Coefficient
Classified as Fraud
Classified as Not Fraud
TP = 2 FP = 2 TN = 5 FN = 1
Phi = 0.356
=Fraud=Not FraudPositive
Class
NegativeClass

BigML, Inc 46
Model Demo #3

BigML, Inc 47Introduction, Models, and Evaluations
Evaluations

BigML, Inc 48Introduction, Models, and Evaluations
Evaluations

BigML, Inc 49Introduction, Models, and Evaluations
Evaluations

BigML, Inc 50Introduction, Models, and Evaluations
Mean Absolute Error
e1 e2
e7
e6
e5
e4
e3
MAE = |e1| + |e2| + … + |en|n

BigML, Inc 51Introduction, Models, and Evaluations
Mean Squared Error
e1 e2
e7
e6
e5
e4
e3
MSE = (e1)2 + (e2)2 + … + (en)2
n

BigML, Inc 52Introduction, Models, and Evaluations
MSE / MAE
• For both MAE & MSE: Smaller is
better, but values are unbounded
• MSE is always larger than or equal to
MAE

BigML, Inc 53Introduction, Models, and Evaluations
R Squared Error
e1 e2
e7
e6
e5
e4
e3Mean
v1v2
v3 v4 v5
v7v6
MSEmodel
MSEmeanRSE = 1 -

BigML, Inc 54Introduction, Models, and Evaluations
R-Squared Error
• RSE: measure of how much better the
model is than always predicting the
mean
• < 0 model is worse then mean
• = 0 model is no better than the mean
• = 1 model fits the data perfectly

BigML, Inc 55
Model Demo #3
