bsr agriculture: trends and...
TRANSCRIPT

BSR Agriculture: trends and challenges
Mikhail Durkin
Östra Ågatan 53, SE-753 22
Uppsala, Sweden
+46 73-977 07 93;
co-funded by EU LIFE Programme

Commonalities vs. differences
Importance for national economy overweighs environmental losses
Diversified production between countries – due to climate, traditions, market, etc.
Disparity of farm structure – general trend towards industrialisation
Regional competition instead of joint ”Baltic” branding
Miscommunication of environmental footprint co-funded by EU LIFE Programme

Scale of the BSR agriculture (EU MS)
Estonia Latvia Lithuania
Sweden
Denmark
Finland
Germany -BSR
Poland
Share of Baltic rural population (31% of EU)
EstoniaLatviaLithuaniaFinland
Sweden
Denmark
Germany-BSR
Poland
Share of output, 56 B €/yr (15% of EU)
Estonia Latvia Lithuania
Finland
Sweden
Denmark
Poland
Germany-tot
Share of CAP support, 16 B € (27% of EU)
sheep&goatshorsesfruits
poultrypotatoes
poultry
cattle
ind.crops
veg & hort
foragepigs
cereals
milk
Share of output (€) per category
http://ec.europa.eu/agriculture/statistics/factsheets/pdf/eu_en.pdf
co-funded by EU LIFE Programme

-2
0
2
4
6
8
10
Denmark Germany Estonia Latvia Lithuania Poland Finland Sweden
GDP Growth, % change on previous year
2010 2011 2012 2013 2014 2015
0
50
100
150
200
250
Denmark Germany Estonia Latvia Lithuania Poland Finland Sweden
Evolution of agricultural income
2005 2006 2007 2008 2009 2010 2011 2012 2013 2014
http://ec.europa.eu/agriculture/statistics/agricultural/2013/index_en.htm
co-funded by EU LIFE Programme

DENMARK
cereals
ind.crops
forage
veg & hort
potatoesfruits
cattlepigs
horsessheep&goats
poultry
milk
eggs
≈9,9 B€/yr
5% farms < 2 ha UAA5% farms < 2000 €
http://www.arc2020.eu/capwatch/http://ec.europa.eu/agriculture/statistics/factsheets/pdf/dk_en.pdf
co-funded by EU LIFE Programme

GERMANY4 Federal Länder: SH, MV, B, S
cereals
ind.crops
forageveg & hort
potatoesfruits
cattle
pigs
horsessheep&goats
poultry
milk
eggs
≈11,3 B€/yr
5% farms < 2 ha UAA0,6% farms < 2000 €
http://www.arc2020.eu/capwatch/http://ec.europa.eu/agriculture/statistics/factsheets/pdf/de_en.pdf
co-funded by EU LIFE Programme

FINLAND
cereals
ind.crops
forage
veg & hort
potatoesfruitscattle
pigs
horsessheep&goats
poultry
milk
eggs
≈4,0 B€/yr
3% farms < 2 ha UAA7% farms < 2000 €
http://www.arc2020.eu/capwatch/http://ec.europa.eu/agriculture/statistics/factsheets/pdf/fi_en.pdf
co-funded by EU LIFE Programme

Estonia Direct Payments 2015-2020
ESTONIA
cereals
ind.crops
forage
veg & hort
potatoesfruitscattle
pigs
horsessheep&goats
poultry
milk
eggs
≈0,8 B€/yr
12% farms < 2 ha UAA44% farms < 2000 €
http://www.arc2020.eu/capwatch/http://ec.europa.eu/agriculture/statistics/factsheets/pdf/ee_en.pdf
co-funded by EU LIFE Programme

LATVIA
cereals
ind.crops
forageveg & hortpotatoesberries
cattle
pigs
poultry
milk
eggsother animal
≈1,0 B€/yr
12% farms < 2 ha UAA56% farms < 2000 €
http://www.arc2020.eu/capwatch/http://ec.europa.eu/agriculture/statistics/factsheets/pdf/lv_en.pdf
co-funded by EU LIFE Programme

LITHUANIA
≈2,2 B€/yr
cereals
ind.crops
forageveg & hortpotatoesberries
cattle
pigs
sheep&goats
poultry
milk
eggs other
16% farms < 2 ha UAA50% farms < 2000 €
http://www.arc2020.eu/capwatch/http://ec.europa.eu/agriculture/statistics/factsheets/pdf/lt_en.pdf
co-funded by EU LIFE Programme

POLAND
cereals
ind.crops
forage
veg & hort
potatoesfruitscattle
pigs
horsessheep&goats
poultry
milk
eggs
≈21,8 B€/yr
24% farms < 2 ha UAA32% farms < 2000 €
http://www.arc2020.eu/capwatch/http://ec.europa.eu/agriculture/statistics/factsheets/pdf/pl_en.pdf
co-funded by EU LIFE Programme

http://www.arc2020.eu/capwatch/http://ec.europa.eu/agriculture/statistics/factsheets/pdf/se_en.pdf
SWEDEN
cereals
ind.crops
forage
veg & hortpotatoesfruitscattle
pigs
hor…sheep&goats
poultry
milk
eggs
≈5,4 B€/yr
2% farms < 2 ha UAA11% farms < 2000 €
co-funded by EU LIFE Programme

http://www.gks.ru/wps/wcm/connect/rosstat_main/rosstat/ru/statistics/publications/catalog/doc_1138623506156ENG, summarised data: http://www.gks.ru/wps/wcm/connect/rosstat_main/rosstat/en/figures/agriculture/
+ 200 M€/yr≈ 2,7 B€/yr(64% - animal, 34% - crop)(92% - holdings, 8% farms)
Rural population 30% Agri part of GRP 10% UAA 835 thous. ha (4%)
396,8
857,4
150,2
Animals, K AU
cattle
pigs
goats&sheep
522,4
806,8
449,2
143
Plants production, Kt
crops
potatoes
vegetables
berries
432,4
990,8
180,03
Poultry, milk & eggs, Kt
poultry
milk
eggs
RUSSIA4 Oblasts: KLD, LED, NOV, PSK
20
7
4
MINERAL, KGN/HA
MINERAL, KGP/HA
ORGANIC, T/HA
Average fertiliser use/yr
co-funded by EU LIFE Programme

http://www.minpriroda.gov.by/uploads/files/000597_638747_part_7.pdfhttp://belstat.gov.by/ofitsialnaya-statistika/regiony-respubliki-belarus/publikatsii/index_640/ and http://belstat.gov.by/en/
+ ? M€/yr≈ 3,85 B€/yr(77% - holdings, 21% - individ.2% - farms)
Rural population 28% Agri part of GRP 30% UAA 2626 thous. ha (27%)
BELARUS3 Oblasts: Brest, Grodno, Vitebsk
2135,0
1592,5
72,0 40,0
Animals, K AU
cattle
pigs
goats&sheep
horses
3535,62736,8
725,8
Plant production, Kt
cereals
potatoes
vegetables
790,5
3368
84,75
Poultry, milk & eggs, K t
poultry
milk
eggs
97
33
10
MINERAL, KGN/HA
MINERAL, KGP/HA
ORGANIC, T/HA
Average fertiliser use/yr
co-funded by EU LIFE Programme
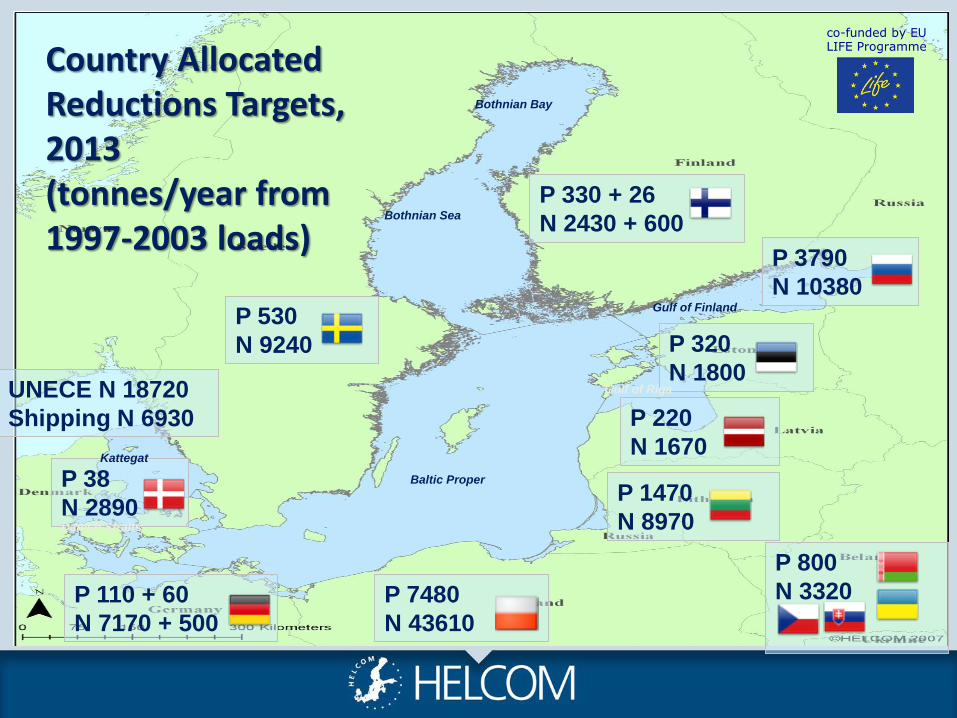
Reductions/ country
(tonnes/year)
P 530
N 9240 P 320
N 1800
P 1470
N 8970
P 220
N 1670
P 110 + 60
N 7170 + 500
P 38
N 2890
P 330 + 26
N 2430 + 600
Bothnian Bay
Bothnian Sea
Gulf of Finland
Gulf of Riga
Baltic Proper
Danish Straits
Kattegat
P 3790
N 10380
P 7480
N 43610
Country Allocated Reductions Targets, 2013(tonnes/year from1997-2003 loads)
P 800
N 3320
UNECE N 18720
Shipping N 6930
co-funded by EU LIFE Programme

REPORT on the implementation of Council Directive 91/676/EEC concerning the protection of waters against pollution caused by nitrates from agricultural sources based on Member State reports for the period 2008-2011
Upstream evidence for further action needed
http://ec.europa.eu/environment/water/water-nitrates/index_en.html
co-funded by EU LIFE Programme

Östra Ågatan 53, SE-
753 22 Uppsala,
Sweden
+46 73-977 07 93;
www.ccb.se
Thank you for your attention!
www.hsb-cartoon.de
co-funded by EU LIFE Programme