bsm 1.3 server...
TRANSCRIPT

BSM 1.3 Server Add-ons
Installation and Administrator's Guide
nova
scal
e &
ESC
ALA
REFERENCE 86 A2 59FA 03


novascale & ESCALA
BSM 1.3 Server Add-ons Installation and Administrator's Guide
Software June 2010
BULL CEDOC 357 AVENUE PATTON B.P.20845 49008 ANGERS CEDEX 01 FRANCE REFERENCE 86 A2 59FA 03

The following copyright notice protects this book under Copyright laws which prohibit such actions as, but not limited to, copying, distributing, modifying, and making derivative works.
Copyright © Bull SAS 2008-2010
Printed in France
Trademarks and Acknowledgements
We acknowledge the rights of the proprietors of the trademarks mentioned in this manual.
All brand names and software and hardware product names are subject to trademark and/or patent protection.
Quoting of brand and product names is for information purposes only and does not represent trademark misuse.
The information in this document is subject to change without notice. Bull will not be liable for errors contained herein, or for incidental or consequential damages in connection with the use of this material.
Preface iii
Table of Contents
List of Figures.........................................................................................................viii
List of Tables ........................................................................................................... ix
Preface.................................................................................................................. xi
Scope and Audience of this Manual ........................................................................... xi
Using this Manual ................................................................................................... xi
Related Information .................................................................................................. xi
Highlighting .......................................................................................................... xii
Chapter 1. Bull System Manager Server Add-ons Concepts ......................................1
1.1 Bull System Manager .......................................................................................................... 1 1.1.1 Overview................................................................................................................. 1 1.1.2 Monitoring ............................................................................................................... 2 1.1.3 Event Reception ........................................................................................................ 3 1.1.4 Hardware Manager .................................................................................................. 3 1.1.5 Storage Manager ..................................................................................................... 3 1.1.6 Virtualization Manager.............................................................................................. 3
1.2 Bull System Manager Server Add-ons ................................................................................... 4
Chapter 2. Bull System Manager Server Add-ons Installation and Configuration ............5
2.1 General Installation Requirements......................................................................................... 5 2.1.1 Supported Operating Systems .................................................................................... 5 2.1.2 Required Disk Space ................................................................................................. 5 2.1.3 Required Memory ..................................................................................................... 5 2.1.4 Installation Requirements............................................................................................ 5 2.1.5 Operational Requirements.......................................................................................... 6 2.1.6 Restrictions ............................................................................................................... 7
2.2 Installing Bull System Manager Server Add-ons for Windows .................................................. 8 2.2.1 Prerequisites ............................................................................................................. 8 2.2.2 Installing Management Server Add-ons from the Bull System Manager CD-ROM............... 8 2.2.3 Un-installing Bull System Manager Server Add-ons Components ................................... 11 2.2.4 Upgrading to a New Bull System Manager Server Add-ons Version.............................. 11
2.3 Installing Bull System Manager Server Add-ons for Linux ....................................................... 12 2.3.1 Prerequisites ........................................................................................................... 12 2.3.2 Installing Management Server Add-ons from the CD-ROM............................................ 13 2.3.3 Uninstalling Bull System Manager Server Add-on Components ..................................... 15 2.3.4 Upgrading to new Bull System Manager Server Add-on Versions.................................. 16

iv Bull System Manager 1.3 Server Add-ons - Installation and Administrator's Guide
2.4 Monitoring Configuration ..................................................................................................17 2.4.1 Configuration GUI...................................................................................................17 2.4.2 Categories and Services ..........................................................................................17
Chapter 3. Bull System Manager Server Add-ons Description...................................19
3.1 Internal Storage (Free).......................................................................................................19 3.1.1 BSM GAMTT for LSI MegaRAID 320-2x Management .................................................19
3.1.1.1 Default Categories & Services (independent of OS type)..............................20 3.1.1.2 GAMTTraid Category..............................................................................20 3.1.1.3 check_gamttRAID (any OS) Nagios command............................................20
3.1.2 BSMLSICIM for LSI 22320 Chip Management ............................................................22 3.1.2.1 Default Categories & Services (independent of OS type)..............................23 3.1.2.2 check_LSICIM (any OS) Nagios command.................................................23 3.1.2.3 check_LSICIM_ctrl (any OS) Nagios command ...........................................23
3.1.3 BSM MegaRaidSAS (LSI MegaRAID SAS (IR) Management) .........................................25 3.1.3.1 Default Categories & Services (independent of OS type)..............................26 3.1.3.2 MegaRaidSAS(_IR) Category....................................................................26 3.1.3.3 check_MegaRaidSAS(_IR) (any OS) Nagios command................................26
3.2 External Storage Server Add-ons ........................................................................................27 3.2.1 BSMStoreWayFDA (StoreWay FDA Management)......................................................27
3.2.1.1 Default Categories & Services (independent of OS type)..............................28 3.2.1.2 StoreWayFDA Category ..........................................................................28 3.2.1.3 check_NECFDA (any OS) Nagios command..............................................28 3.2.1.4 Bull System Manager Configuration ..........................................................29
3.2.2 BSMEmcClariion (EMC CLARiiON Management) .......................................................30 3.2.2.1 Default Categories & Services (independent of OS type)..............................30 3.2.2.2 EmcClariion Category .............................................................................31 3.2.2.3 check_EMCCLARIION (any OS) Nagios command.....................................31 3.2.2.4 Bull System Manager Configuration ..........................................................31
3.2.3 BSMNetApp (NetApp Management) .........................................................................32 3.2.3.1 Default Categories & Services (independent of OS type)..............................32 3.2.3.2 NetApp Category ...................................................................................33 3.2.3.3 Reporting Indicators ................................................................................33 3.2.3.4 Nagios check commands.........................................................................34 3.2.3.5 Bull System Manager Configuration ..........................................................35
3.2.4 BSMStoreWayDPA (StoreWay DPA Management)......................................................36 3.2.4.1 Default Categories & Services (independent of OS type)..............................36 3.2.4.2 StoreWayDPA Category ..........................................................................37 3.2.4.3 Nagios check commands.........................................................................37 3.2.4.4 Bull System Manager Configuration ..........................................................37
3.2.5 BSM SwitchBrocade (Brocade Fibre Channel Switch Management)...............................38 3.2.5.1 Default Categories & Services (independent of OS type)..............................38 3.2.5.2 Optional Categories & Services (independent of OS type) ...........................39 3.2.5.3 Brocade Category...................................................................................39 3.2.5.4 Brocade_Sensors Category ......................................................................39 3.2.5.5 Nagios check commands.........................................................................40 3.2.5.6 Bull System Manager Configuration ..........................................................40 3.2.5.7 Configuration of optional Brocade_Sensors category ..................................40

Preface v
3.3 External Device Server Add-ons ......................................................................................... 41 3.3.1 BSM WaterCooledDoor (Water Cooled Door Management)........................................ 41
3.3.1.1 Default Categories & Services (independent of OS type) ............................. 41 3.3.1.2 Hardware Category................................................................................ 42 3.3.1.3 Sensors Category ................................................................................... 42 3.3.1.4 Reporting Indicators ................................................................................ 42 3.3.1.5 Nagios check commands......................................................................... 43 3.3.1.6 Bull System Manager Configuration .......................................................... 43
3.3.2 BSM PDU-APC (APC Power Distribution Unit Management).......................................... 44 3.3.2.1 Default Categories & Services (independent of OS type) ............................. 44 3.3.2.2 PDUAPC Category.................................................................................. 45 3.3.2.3 Power Category ..................................................................................... 45 3.3.2.4 Reporting Indicators ................................................................................ 45 3.3.2.5 Nagios check commands......................................................................... 46 3.3.2.6 Bull System Manager Configuration .......................................................... 46
3.4 Virtualization Server Add-ons............................................................................................. 47 3.4.1 Overview............................................................................................................... 47
3.4.1.1 Definitions.............................................................................................. 47 3.4.1.2 Topology Representation ......................................................................... 47
3.4.2 BSMVMwareESX for ”VMware ESX” Management .................................................... 49 3.4.2.1 Overview............................................................................................... 49 3.4.2.2 Bull System Manager Configuration .......................................................... 50
3.4.2.2.1 ESX Virtual Platform ................................................................ 50 3.4.2.2.2 Editing Virtual Machine Set-up ................................................. 55 3.4.2.2.3 Virtualization Supervision ........................................................ 56
3.4.2.3 Nagios Check Commands ....................................................................... 58 3.4.2.4 Reporting Indicators ................................................................................ 59 3.4.2.5 Bull System Manager Console .................................................................. 59
3.4.3 BSMVMwareVC for "Virtual Center" Management ..................................................... 61 3.4.3.1 Overview............................................................................................... 61 3.4.3.2 Bull System Manager Configuration .......................................................... 62
3.4.3.2.1 VirtualCenter managed DataCenter Platform.............................. 62 3.4.3.2.2 Datacenter Elements Edition..................................................... 67 3.4.3.2.3 Virtualization Supervision ........................................................ 68
3.4.3.3 Nagios Check Commands ....................................................................... 70 3.4.3.4 Collect task ............................................................................................ 70 3.4.3.5 Reporting Indicators ................................................................................ 71 3.4.3.6 Bull System Manager Console .................................................................. 72
3.4.4 BSMEscalaLPAR "EscalaLPAR" Management .............................................................. 75 3.4.4.1 Overview............................................................................................... 75 3.4.4.2 Bull System Manager Configuration .......................................................... 77
3.4.4.2.1 Virtualization Supervision ........................................................ 77 3.4.4.3 Nagios Check Commands ....................................................................... 80 3.4.4.4 Bull System Manager Console .................................................................. 81
3.4.4.4.1 Operation.............................................................................. 81 3.4.4.4.2 Escala Supervision.................................................................. 83 3.4.4.4.3 Escala Reporting .................................................................... 84

vi Bull System Manager 1.3 Server Add-ons - Installation and Administrator's Guide
3.5 Bull Products Server Add-ons..............................................................................................85 3.5.1 BSMDD4A for Bull “Dynamic Domains For Applications” Management .........................85
3.5.1.1 Default Categories & Services Proposed for Linux Hosts...............................86 3.5.1.2 DynamicDomains Category......................................................................86 3.5.1.3 check_DynamicDomains (Linux OS) Nagios Command ...............................86
3.5.2 BSMBVS for Bull Video Services Management ............................................................87 3.5.2.1 BullVideoServices Category......................................................................88 3.5.2.2 check_BVS Nagios Command ..................................................................88
3.5.3 BSMJOnAS for JOnAS Management .........................................................................88 3.5.3.1 JOnAS Overview ....................................................................................88 3.5.3.2 JOnAS Domain Topology.........................................................................89 3.5.3.3 JOnAS Monitoring Information .................................................................89 3.5.3.4 Bull System Manager Configuration ..........................................................90 3.5.3.5 JOnAS Category and Service ...................................................................92 3.5.3.6 JOnAS Reporting Indicators......................................................................93 3.5.3.7 Bull System Manager Console ..................................................................93
Appendix A. Check Commands for AddOn Customizable Services ............................ 95
A.1 Internal Storage Management ............................................................................................95 A.1.1 BSMGAMTT ...........................................................................................................95
A.1.1.1 check_gamttRAID ....................................................................................95 A.1.2 BSMLSICIM ............................................................................................................98
A.1.2.1 check_LSICIM .........................................................................................98 A.1.3 BSMMegaRaidSAS ...............................................................................................100
A.1.3.1 check_MegaRaidSAS(_IR) ......................................................................100 A.2 External Storage Management .........................................................................................103
A.2.1 BSMStoreWayFDA................................................................................................103 A.2.1.1 check_NECFDA ....................................................................................103
A.2.2 BSMEmcClariion ...................................................................................................104 A.2.2.1 check_EMCCLARIION ...........................................................................104
A.2.3 BSMNetApp.........................................................................................................106 A.2.3.1 check-netapp-cpuload............................................................................106 A.2.3.2 check-netapp-numdisks ..........................................................................107 A.2.3.3 check-netapp-failedfans..........................................................................109 A.2.3.4 check-netapp-failedpwr..........................................................................110 A.2.3.5 check_netapp_globalstatus.....................................................................111 A.2.3.6 check_netappvol ...................................................................................112 A.2.3.7 check_netappraid .................................................................................113
A.2.4 BSMWaterCooledDoor..........................................................................................114 A.2.4.1 check_sensor ........................................................................................114
A.2.5 BSMStoreWayDPA................................................................................................116 A.2.5.1 check_StoreWayDPA ............................................................................116
A.2.6 BSMSwitchBrocade ...............................................................................................118 A.2.6.1 check_brocade .....................................................................................118
A.2.7 BSMPDU-APC .......................................................................................................120 A.2.7.1 check_PDUAPC.....................................................................................120
Preface vii
A.3 Virtualization Management ............................................................................................. 124 A.3.1 BSMVMwareESX .................................................................................................. 124
A.3.1.1 check_esx3 .......................................................................................... 124 A.3.2 BSMVMwareVC ................................................................................................... 127
A.3.2.1 check_virtualcenter.pl ............................................................................ 127 A.3.3 BSMEscalaLpar..................................................................................................... 129
A.3.3.1 check_NSM_escala_lpar ....................................................................... 129 A.4 Bull Products Management .............................................................................................. 134
A.4.1 BSMDD4A ........................................................................................................... 134 A.4.1.1 check_DynamicDomains ........................................................................ 134
A.4.2 BSMBVS .............................................................................................................. 136 A.4.2.1 check_BVS........................................................................................... 136
A.4.3 BSMJOnAS .......................................................................................................... 138 A.4.3.1 Check_JOnAS ...................................................................................... 138
Appendix B. Third Party License Agreement ..........................................................141
B.1 VMware(R) Infrastructure Perl Toolkit Agreement ................................................................ 141
Index ................................................................................................................. 143

viii Bull System Manager 1.3 Server Add-ons - Installation and Administrator's Guide
List of Figures
Figure 1-1. Bull System Manager Architecture....................................................................................2 Figure 2-1. Windows Installation - Bull System Manager Welcome Page ..............................................9 Figure 2-2. Windows Installation - Bull System Manager Install Page ....................................................9 Figure 2-3. Windows Installation - Selecting Bull System manager Server Add-ons ...............................10 Figure 2-4. Windows Installation - Bull System Manager Server Add-ons Install Page............................10 Figure 2-5. Linux Installation - Bull System Manager Welcome Page ...................................................13 Figure 2-6. Linux Installation - Selecting Bull System Manager Components .........................................14 Figure 2-7. Linux Installation - Selecting Bull System Manager Server Add-ons .....................................14 Figure 2-8. Linux Installation - Bull System Manager Server Add-Ons Install page.................................15 Figure 3-1. GAM Monitoring Components ......................................................................................19 Figure 3-2. LSI CIM Monitoring Components ...................................................................................22 Figure 3-3. MegaRAID SAS Monitoring Components........................................................................25 Figure 3-4. StoreWay FDA Monitoring Components.........................................................................27 Figure 3-5. EMC CLARiiON Monitoring Components .......................................................................30 Figure 3-6. NetApp Monitoring Components ...................................................................................32 Figure 3-7. StoreWayDPA Monitoring Components..........................................................................36 Figure 3-8. Brocade Fibre Channel Switch Monitoring Components ...................................................38 Figure 3-9. Water Cooled Door Monitoring Components..................................................................41 Figure 3-10 APC Power Distribution Unit Monitoring Components......................................................44 Figure 3-11. BSM Console Views .....................................................................................................47 Figure 3-12. Virtual Managers view .................................................................................................48 Figure 3-13. Virtual Manager MonitoringWindow .............................................................................48 Figure 3-14. VMwareESX Add-on components...................................................................................49 Figure 3-15. ESX Virtual Platforms page............................................................................................50 Figure 3-16. ESX Platform Properties.................................................................................................51 Figure 3-17. ESX Virtual Machines pane ...........................................................................................53 Figure 3-18. Host Topology modification confirmation screen..............................................................54 Figure 3-19. VMware service properties pane ...................................................................................57 Figure 3-20. VMwareESX monitoring information...............................................................................60 Figure 3-21. VMwareESX reporting information .................................................................................60 Figure 3-22. VMwareVC Add-on components....................................................................................61 Figure 3-23. VMware DataCenter Platforms page ..............................................................................62 Figure 3-24. Virtual Center Properties ..............................................................................................63 Figure 3-25. Datacenters panel ........................................................................................................64 Figure 3-26. Topology modification confirmation ...............................................................................66 Figure 3-27. VMwareESX service properties pane..............................................................................69 Figure 3-28. Virtual Center Web Access ...........................................................................................72 Figure 3-29. VMware Datacenter monitoring information....................................................................73 Figure 3-30. CPU Performance indicator for a Virtual Machine............................................................74 Figure 3-31. EscalaLPAR Add-on components for HMC managed systems.............................................76 Figure 3-32. EscalaLPAR Add-on components for IVM managed systems...............................................76 Figure 3-33. VIOS.UsedPool Service Properties pane .........................................................................79 Figure 3-34. Reporting indicators .....................................................................................................80 Figure 3-35. HMC activation from Bull System Manager Console ........................................................81 Figure 3-36. IVM activation from Bull System Manager Console ..........................................................82 Figure 3-37. Escala HMC reported Supervision .................................................................................83 Figure 3-38. Escala IVM reported supervision....................................................................................83 Figure 3-39. DDFA Monitoring Components ......................................................................................85

Preface ix
Figure 3-40. BVS Web Server Monitoring Components ...................................................................... 87 Figure 3-41. JOnAS Architecture...................................................................................................... 89 Figure 3-42. JOnAS configuration.................................................................................................... 90 Figure 3-43. JOnAS domains .......................................................................................................... 90 Figure 3-44. JOnAS properties ........................................................................................................ 91 Figure 3-45. JOnAS category and services........................................................................................ 92 Figure 3-46. JOnAS indicators......................................................................................................... 93 Figure 3-47. JOnAS category view................................................................................................... 93 Figure 3-48. jonasAdmin launching ................................................................................................. 94
List of Tables
Table 2-1. Bull System Manager - Required Memory ......................................................................... 5 Table 2-2. Management Server Add-ons Installation Requirements ...................................................... 5 Table 2-3. Management Server Add-ons Operational Requirements .................................................... 7 Table 3-1. GAMTT monitoring services .......................................................................................... 20 Table 3-2. LSI CIM monitoring services .......................................................................................... 23 Table 3-3. MegaRaid SAS (IR) monitoring services.......................................................................... 26 Table 3-4. StoreWay FDA monitoring services................................................................................ 28 Table 3-5. EmcClariion monitoring services.................................................................................... 30 Table 3-6. NetApp monitoring services.......................................................................................... 32 Table 3-7. StoreWayDPA monitoring services................................................................................. 36 Table 3-8. Default Brocade Fibre Channel Switch monitoring services ............................................... 38 Table 3-9. Optional Brocade Fibre Channel Switch monitoring services ............................................ 39 Table 3-10. Water Cooled Door monitoring services......................................................................... 41 Table 3-11. DDF4 categories and services ....................................................................................... 86 Table 3-12. Bull Video Services categories and services .................................................................... 87

x Bull System Manager 1.3 Server Add-ons - Installation and Administrator's Guide

Preface xi
Preface
Scope and Audience of this Manual
Bull System Manager Server Add-ons are Bull products, which provide extension to Bull System Manager for managing Bull platforms specific devices or tools. Administration environments can include different platforms from the NovaScale Universal or Intensive Series, Express 5800 Series, EvolutiveLine Blade Series or Escala servers
In order to monitor a specific item, Bull System Manager Server Add-ons configuration must be customized. This manual explains also how, as an Administrator you can perform configuration tasks for these Add-ons.
Note Configuration tasks may only be performed by Administrators.
Using this Manual
For a conceptual approach to Bull System Manager Server Add-ons, read Chapter 1.
Chapter 2 describes how to install and configure Bull System Manager Server Add-ons.
Chapter 3 describes how to configure the elements for each Server Add-on on the Management server. It provides detailed information about all resource properties, as well as concrete examples, to help the customization of the configuration (Modifying Service Parameters, etc.). This chapter also contains full details regarding the categories and services of the monitoring server provided by these Bull System Manager Server Add-ons.
Appendix A contains reference information about Nagios check commands used by Bull System Manager Server Add-on monitoring services.
Related Information • Bull System Manager Installation Guide (Ref. 86 A2 54FA).
• Bull System Manager User’s Guide (Ref. 86 A2 55FA). The Bull System Manager GUI (Graphical User Interface) and its use are described in this guide.
• Bull System Manager Administrator’s Guide (Ref. 86 A2 56FA).
• Restrictions and known problems are described in the associated Release Notes (Ref. 86 A2 57FA).
• Dynamic Domains for Applications User’s Guide (Ref. 86 A2 63ER).

xii Bull System Manager 1.3 Server Add-ons - Installation and Administrator's Guide
Highlighting
The following highlighting conventions are used in this book:
Bold Identifies commands, keywords, files, structures, directories and other items whose names are predefined by the system. Also identifies graphical objects such as buttons, labels and icons that the user selects.
Italics Identifies chapters, sections, paragraphs and book names to which the reader must refer for details.
Monospace Identifies examples of specific data values, examples of text similar to displayed messages from the system, or information you should actually type.
Note Important information.

Chapter 1. Bull System Manager Server Add-ons Concepts 1
Chapter 1. Bull System Manager Server Add-ons Concepts
1.1 Bull System Manager
1.1.1 Overview
Bull System Manager monitoring is used for the following tasks:
• Monitoring machines: Bull System Manager checks if the hosts are accessible, using the ping command from the System Manager. The machines to be monitored are either specified by the Administrator or detected by a discovery mechanism.
• Monitoring specific elements of the hardware, Operating System, services and Internet such as Power Status, CPU load, memory usage, disk usage, number of users, processes and service execution, http and ftp services. The administrator can define status thresholds (OK, WARNING, CRITICAL, UNKNOWN) for each element monitored. When an anomaly occurs or when there is a return to normal status, alerts (in a log file) and notifications (by e-mail, by Bull autocall and/or by SNMP traps) are generated.
Note Hardware and OS monitoring for Bull Intel-Based platforms are provided by the Bull System Manager Server package, not by the Add-on packages.
Bull System Manager Server Add-ons extend Bull System Manager monitoring with more specific links to third-party management tools for specific devices and/or specific system functionalities.
Note These Server Add-ons packages extend the management server independently of the platform and/or OS type (storage, network, virtualization, framework, etc.).
Bull System Manager consists of three main components that can be deployed onto Windows and Linux systems:
• Management Server and Server Add-ons
• Management Console
• Management Agent.
Note Management Agent component can also be installed onto AIX systems
Management Server and Server Add-ons
Provides the infrastructure and services responsible for the collection of and treatment of management data. Management Server must be installed on the server dedicated to management.

2 Bull System Manager 1.3 Server Add-ons - Installation and Administrator's Guide
Management Console
Provides third-party management tools for the end-user station running the Bull System Manager console web GUI.
Management Agent
Provides instrumentation and administration tools for the servers monitored. Management Agent must be installed on each server that is to be monitored.
Figure 1-1. Bull System Manager Architecture
Note Bull System Manager for different operating systems is distributed on the same CD-ROM.
1.1.2 Monitoring
A Service (or monitoring service) defines how specific host elements are monitored. A service can be defined for all hosts or for a list of hosts, depending on the OS (Windows, Linux, AIX or any) and/or on the model. Notification properties are defined for each service.
Services are organized into monitoring categories. For instance, the SystemLoad category includes the CPU and Memory services for a Windows host.

Chapter 1. Bull System Manager Server Add-ons Concepts 3
1.1.3 Event Reception
Bull System Manager can receive SNMP traps from any SNMP agent. SNMP traps enable an agent to notify the Bull System Manager Server of significant events via a SNMP message. SNMP Traps must be defined in a MIB (Management Information Base).
1.1.4 Hardware Manager
A Hardware Manager manages hardware for one or more servers.
1.1.5 Storage Manager
A Storage Manager manages storage for one or more servers and/or bays.
1.1.6 Virtualization Manager
A Virtualization Manager manages a set of virtual machines, classed as a Virtualization Platform.

4 Bull System Manager 1.3 Server Add-ons - Installation and Administrator's Guide
1.2 Bull System Manager Server Add-ons
Bull System Manager Server Add-ons include additional management packages to extend Bull System Manager Server.
A Bull System Manager Server Add-on provides functional links (monitoring, GUI call, reporting, etc.) between a Bull System Manager Server and a third-party management tool.
All the Server Add-ons are distributed on the Bull System Manager Server CD-ROM.
Note There is a difference between Server Add-ons and the third-party management tools. Even if the third-party management tool is dedicated to an OS and/or a platform type, its Bull System Manager Server Add-on can be installed on a Bull System Manager Server machine (for example, on Linux and Windows, on IA32 and IA64, etc.).
This release provides several Bull System Manager Server Add-ons. Some of them are free and delivered on the Bull System Manager CD-ROM. The others must be purchased.
System Domain Server Add-on LSI GAMTT Mgt Package
LSI CIM Mgt Package
Internal Storage (BSM Server CD) LSI MegaRaid SAS Mgt Package
StoreWay FDA Mgt Package
EMC CLARiiON Mgt Package
NetApp Mgt Package
StoreWay DPA Mgt Package
External Storage (BSM Server CD)
Switch Brocade Mgt Package
Bull Water Cooled Door Mgt Package External Device (BSM Server CD) APC PDU Mgt Package
Dynamic Domains Mgt Package
Bull Video Service Mgt Package
Bull Tools Management (BSM Server CD)
JOnAS framework Mgt Package
Vmware ESX Mgt Package
VMware Virtual Center Mgt Package
Virtualization Management (BSM Server CD)
Escala LPAR Mgt Package
The Server Add-ons are described in the following chapters.

Chapter 2. Bull System Manager Server Add-ons Installation and Configuration 5
Chapter 2. Bull System Manager Server Add-ons Installation and Configuration
2.1 General Installation Requirements
Before installing Bull System Manager, check that the environment meets the software and hardware requirements, described below.
2.1.1 Supported Operating Systems
Bull System Manager Server Add-ons operate on Linux and Windows operating systems.
The principal requirement is the pre-installation of Bull System Manager Server. See Bull System Manager Installation Guide for details.
2.1.2 Required Disk Space
In general, each Server Add-on needs between 1 and 2 MB.
2.1.3 Required Memory
The following table indicates the required memory for the Management Server.
Bull System Manager Memory Management Server 2 GB
Table 2-1. Bull System Manager - Required Memory
2.1.4 Installation Requirements
Server Add-ons Component * BSMServer1.3-x
Table 2-2. Management Server Add-ons Installation Requirements
6 Bull System Manager 1.3 Server Add-ons - Installation and Administrator's Guide
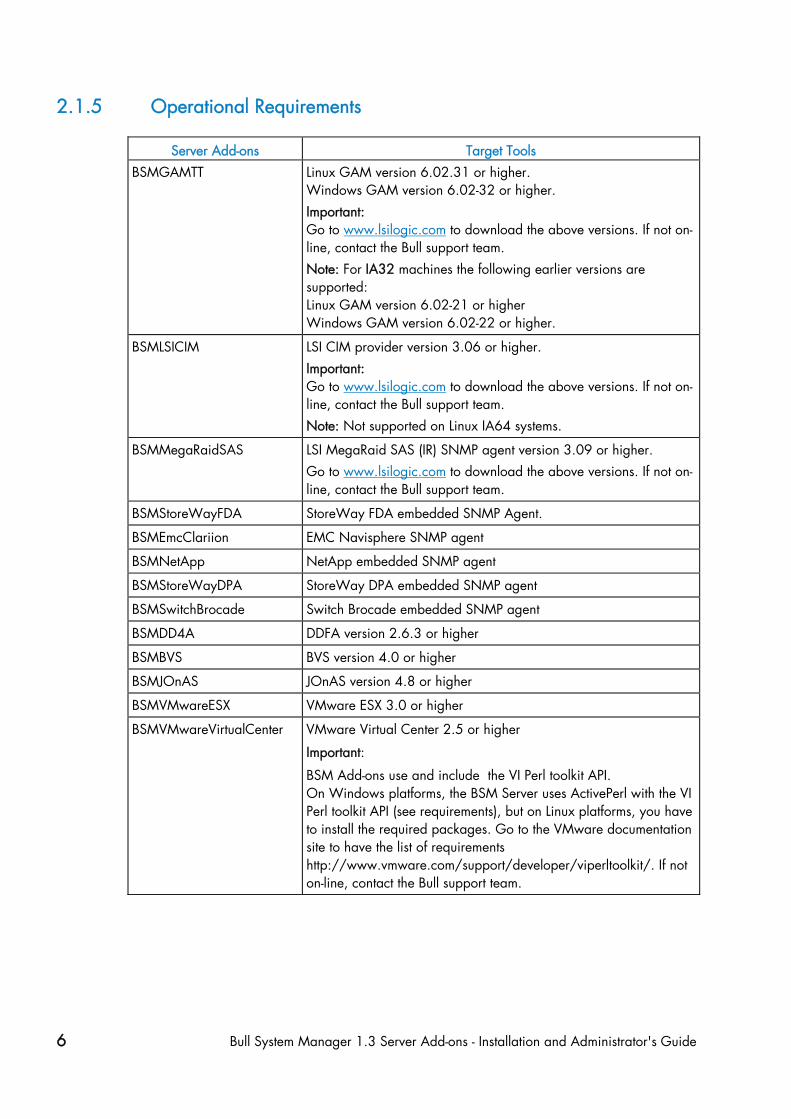
2.1.5 Operational Requirements
Server Add-ons Target Tools BSMGAMTT
Linux GAM version 6.02.31 or higher. Windows GAM version 6.02-32 or higher. Important: Go to www.lsilogic.com to download the above versions. If not on-line, contact the Bull support team. Note: For IA32 machines the following earlier versions are supported: Linux GAM version 6.02-21 or higher Windows GAM version 6.02-22 or higher.
BSMLSICIM LSI CIM provider version 3.06 or higher. Important: Go to www.lsilogic.com to download the above versions. If not on-line, contact the Bull support team. Note: Not supported on Linux IA64 systems.
BSMMegaRaidSAS LSI MegaRaid SAS (IR) SNMP agent version 3.09 or higher. Go to www.lsilogic.com to download the above versions. If not on-line, contact the Bull support team.
BSMStoreWayFDA StoreWay FDA embedded SNMP Agent.
BSMEmcClariion EMC Navisphere SNMP agent
BSMNetApp NetApp embedded SNMP agent
BSMStoreWayDPA StoreWay DPA embedded SNMP agent
BSMSwitchBrocade Switch Brocade embedded SNMP agent
BSMDD4A DDFA version 2.6.3 or higher
BSMBVS BVS version 4.0 or higher
BSMJOnAS JOnAS version 4.8 or higher
BSMVMwareESX VMware ESX 3.0 or higher
BSMVMwareVirtualCenter VMware Virtual Center 2.5 or higher
Important:
BSM Add-ons use and include the VI Perl toolkit API. On Windows platforms, the BSM Server uses ActivePerl with the VI Perl toolkit API (see requirements), but on Linux platforms, you have to install the required packages. Go to the VMware documentation site to have the list of requirements http://www.vmware.com/support/developer/viperltoolkit/. If not on-line, contact the Bull support team.

Chapter 2. Bull System Manager Server Add-ons Installation and Configuration 7
Server Add-ons Target Tools BSMEscalaLPAR IVM VIOS for Power5 and Power6 (Escala PL or EL Blade servers)
or HMC version 6.1 and higher
BSMWaterCooledDoor Device firmware: EMM release 1.1.0 build14
BSMAPCPDU APC Switch rack PDU AP7821, AP7921 and AP7922 with firmware release 3 and higher.
Table 2-3. Management Server Add-ons Operational Requirements
2.1.6 Restrictions
Windows N/A
Linux N/A
8 Bull System Manager 1.3 Server Add-ons - Installation and Administrator's Guide
2.2 Installing Bull System Manager Server Add-ons for Windows
2.2.1 Prerequisites
To install Bull System Manager Server Add-ons on Windows:
• The user must be a member of an Administrators group. The default administrator login is Administrator.
• The installation program requires the Internet Explorer web browser. Other browsers, such as Netscape or Mozilla, cannot be used to install Bull System Manager on Windows.
• Management Server Add-ons are to be installed on the server dedicated to management.
• Acrobat Reader is required to view PDF versions of the Bull System Manager documentation.
• The Server Add-ons are included on the Bull System Manager CD-ROM.
2.2.2 Installing Management Server Add-ons from the Bull System Manager CD-ROM
Management Server Add-ons, to be installed on the server dedicated to management, require the components indicated in 2.1.4 Installation Requirements, and must be installed from the CD-ROM.
To install Management Server Add-ons from the CD-ROM:
1. From the dedicated server, launch the installation program.
2. Log on as Administrator.
3. Insert the Bull System Manager CD-ROM in the drive. The installation program is launched automatically and opens the Welcome page.
Note If the installation does not start automatically, double-click <CD-ROM drive> / setup.exe.

Chapter 2. Bull System Manager Server Add-ons Installation and Configuration 9
Figure 2-1. Windows Installation - Bull System Manager Welcome Page
4. Click Install Now to open the Install page, which allows the selection of the required Bull System Manager components:
− Management Server Add-ons and provides the following information:
− What to install?
− What to do now?
Figure 2-2. Windows Installation - Bull System Manager Install Page

10 Bull System Manager 1.3 Server Add-ons - Installation and Administrator's Guide
Select Management Server Add-ons
Figure 2-3. Windows Installation - Selecting Bull System manager Server Add-ons
Select an Add-ons family (Storage, Virtualization, Bull Application or Other Devices), then Windows 32 bits operating system.
Figure 2-4. Windows Installation - Bull System Manager Server Add-ons Install Page
5. Click the corresponding Install Package Now link to install the Server Add-ons package. The wizard prompts for a destination folder. The default value can be changed if required.
At the end of the installation process, the Management Server Add-ons components are automatically operational.
Chapter 2. Bull System Manager Server Add-ons Installation and Configuration 11
2.2.3 Un-installing Bull System Manager Server Add-ons Components
Un-installation operations must be launched locally. Launching the un-installation program removes all files and folders.
To un-install Bull System Manager Add-ons components:
1. From the Control Panel, launch Add/Remove Programs.
2. Select the required Bull System Manager Server Add-ons components and click Remove.
Note After un-installation operations, customized categories from previous versions may remain in the configuration. These elements must be removed using the BSM Configuration GUI.
2.2.4 Upgrading to a New Bull System Manager Server Add-ons Version
When upgrading to a new BSM Server Add-ons version, the existing BSM Server Add-ons environment that may have been customized is maintained.
BSM Server Add-ons are upgraded via the standard installation program.
Note When you upgrade to a new of the BSM Management Server, you must also upgrade BSM Server Add-ons to benefit from new improvements.
See the Release Notes for more details about migrating specific Add-ons, where applicable.

12 Bull System Manager 1.3 Server Add-ons - Installation and Administrator's Guide
2.3 Installing Bull System Manager Server Add-ons for Linux
2.3.1 Prerequisites
To install Bull System Manager Server Add-ons for Linux:
• The user must be logged as root.
• The installation program requires the Mozilla web browser (Version >1.4.3 or Firefox): If Mozilla is not installed, launch another web browser and open the file: <CD-ROM Mount point>/product /index.html It is advised to uninstall the previous version of Mozilla before installing a new version. This operation will not delete bookmarks, histories, cookies and other information stored in the profile directory. The Mozilla directory must be set as a root PATH environment variable. If a previous version of Mozilla is still installed, the new Mozilla directory must be set at the beginning of the PATH variable.
• Management Server Add-ons must be installed on the server dedicated to management.
• Acrobat Reader is required to view PDF versions of the Bull System Manager documentation.
• The Server Add-ons are present on the Bull System Manager CD-ROM or on the Bull System Manager Add-ons CD-ROM.
Notes • You can check if the required packages from a given addOn are installed by launching:
− cd <CD-ROM mount point> − ./checkEnvAddon.sh –a <addOn> AddOn is the name of the RPM (BSM<addOnIdent>.<version>.Bull) or the short addOnIdent.
• The RPM packages listed above may have their own dependencies and require other RPM packages.
• If the RPM has been installed, the result of the checkEnvAddon is listed in the corresponding installation log (post_install_BSM<addonIdent> log in the <BSM Installation>/engine/tmp/ directory.
Chapter 2. Bull System Manager Server Add-ons Installation and Configuration 13
2.3.2 Installing Management Server Add-ons from the CD-ROM
Management Server Add-ons to be installed on the server dedicated to management, require the components indicated in 2.1.4 Installation Requirements, and must be installed from the CD-ROM.
To install Management Server Add-ons from the CD-ROM:
1. From the dedicated server, launch the installation program.
2. Log on as root.
3. Insert the Bull System Manager CD-ROM in the drive. The CD-ROM file system is automatically mounted as one of the following directories:
− /mnt/cdrom or /mnt/dvd (Red Hat and Advanced Server distributions)
− /media/cdrom or /media/dvd (SuSE distribution).
4. Launch the following commands: cd <CD-ROM mount point> ./install.sh
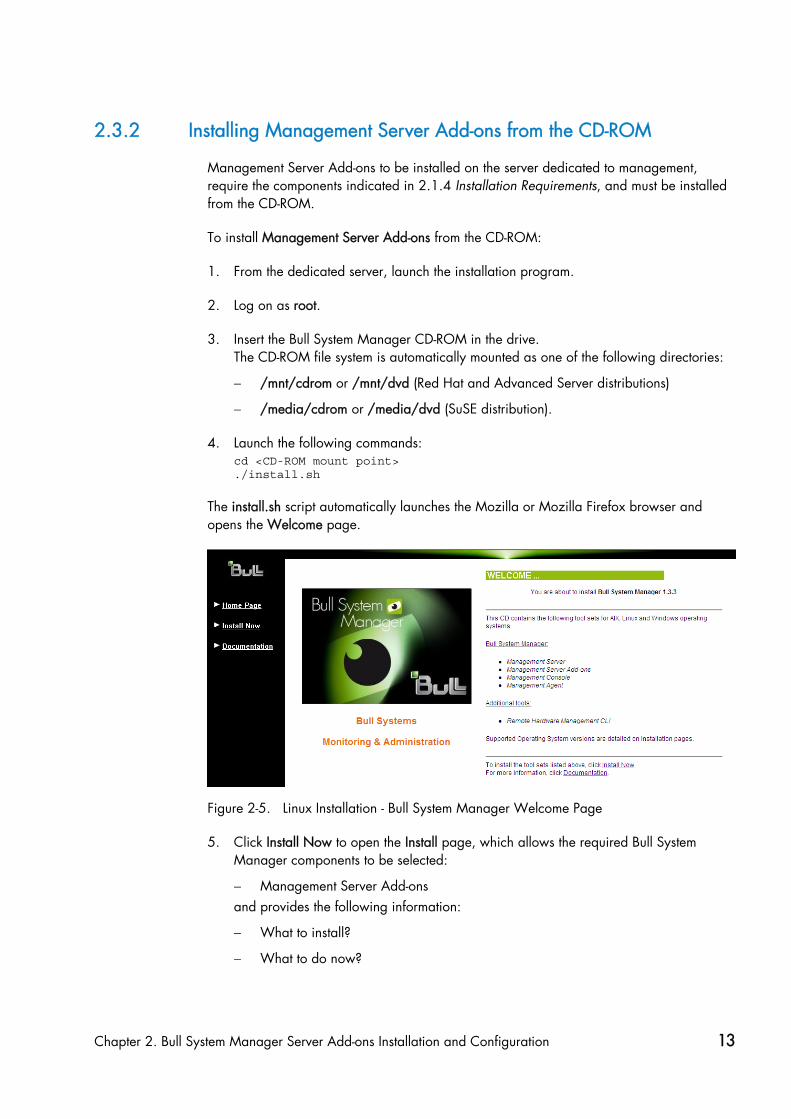
The install.sh script automatically launches the Mozilla or Mozilla Firefox browser and opens the Welcome page.
Figure 2-5. Linux Installation - Bull System Manager Welcome Page
5. Click Install Now to open the Install page, which allows the required Bull System Manager components to be selected:
− Management Server Add-ons and provides the following information:
− What to install?
− What to do now?

14 Bull System Manager 1.3 Server Add-ons - Installation and Administrator's Guide
Figure 2-6. Linux Installation - Selecting Bull System Manager Components
6. Select Management Server Add-ons.
Figure 2-7. Linux Installation - Selecting Bull System Manager Server Add-ons

Chapter 2. Bull System Manager Server Add-ons Installation and Configuration 15
7. Select an Add-ons family (Storage, Virtualization, Bull Application or Other Devices),
Select the Linux 32 bits operating system.
Figure 2-8. Linux Installation - Bull System Manager Server Add-Ons Install page
8. Install the selected Bull System Manager Server Add-ons packages as described below. cd <CD-ROM mount point>/product/mgtpack/BSM<toolname>/linux rpm –Uhv BSM<toolname>-1.3-x.noarch.rpm
2.3.3 Uninstalling Bull System Manager Server Add-on Components
1. Log on as root.
2. Launch the command: rpm -e BSM<toolname>-1.3-x.noarch.rpm

16 Bull System Manager 1.3 Server Add-ons - Installation and Administrator's Guide
2.3.4 Upgrading to new Bull System Manager Server Add-on Versions
When upgrading to new Bull System Manager Server Add-on versions, the existing Bull System Manager Add-ons environment that may have been customized is maintained.
Bull System Manager Add-ons are upgraded via the standard rpm installation command:
rpm –Uhv BSM<toolname>-1.3-x.noarch.rpm
Note When you upgrade the Bull System Manager Management Server, you MUST upgrade the previously installed server add-ons to benefit from new improvements.
See the Release Notes for more details about migrating specific add-ons, where applicable.
Chapter 2. Bull System Manager Server Add-ons Installation and Configuration 17
2.4 Monitoring Configuration
Configuring Bull System Manager Monitoring consists mainly in specifying the parameters required for monitoring tasks. Most configuration tasks are performed via the Bull System Manager Configuration GUI (Graphical User Interface).
Bull System Manager Server Add-ons extend the Monitoring configuration default rules that the Administrator can customize. New monitoring categories and services are provided.
2.4.1 Configuration GUI
Bull System Manager provides a GUI to perform the main configuration tasks.
Starting the Configuration GUI
To start the Configuration GUI, either:
• From the Bull System Manager Console, click the icon representing the Configuration GUI in the Administration zone (top right)
• Or click the Configuration link on the Bull System Manager Home Page, URL: http://<Bull System Manager server name>/BSM
• Or, from a web browser, go to the following URL: http://<Bull System Manager server name>/BSM/config/
2.4.2 Categories and Services
Bull System Manager Server Add-ons deliver more default monitoring categories and services. These categories and services depend on the Operating System running on the host:
• Services for Windows hosts will be applied to all hosts using a Windows Operating System
• Services for Linux hosts will be applied to all hosts using a Linux Operating System
• Services for hosts, independently of the Operating System, will be applied to all hosts.
The Administrator can change the default monitoring configuration by:
• Customizing services, to define specific thresholds and monitoring properties or to modify the list of monitored hosts. A service can be customized to create one or more occurrences of this service with the same name. Each occurrence can have a different host list and different monitoring properties. For instance, if you do not want to monitor file systems in the same way on all Linux hosts, customize the All service in the FileSystems category.
Note The Administrator CANNOT modify the OS and/or model type of these monitoring services and categories, as internal, tool semantic checks may reject such modifications.

18 Bull System Manager 1.3 Server Add-ons - Installation and Administrator's Guide
• Cloning services, to define new elements monitored. One or more services are created, with different names from the original names. All properties can be edited except the check command. For instance, to monitor a specific logical drive on a Windows system, clone the C service and modify the check command parameters.
• Customizing categories, to restrict monitoring a whole category to a list of hosts.
• Creating a category, to assign a set of cloned services to this category.
See the Bull System Manager Administrator’s Guide for more details about the configuration.

Chapter 3. Bull System Manager Server Add-ons Description 19
Chapter 3. Bull System Manager Server Add-ons Description Bull System Manager Server Add-ons provide different functional items for each Management Package.
3.1 Internal Storage (Free)
3.1.1 BSM GAMTT for LSI MegaRAID 320-2x Management
GAMTT (or GAM) is the LSI tool used to survey, configure and control RAID provided by LSI MegaRAID Ultra320 SCSI cards.
See http://www.lsilogic.com/products/megaraid/index.html to download the GAMTT install package and for more information.
Note This tool runs on NovaScale machines under Linux or Windows.
The corresponding Bull System Manager Add-on creates monitoring links between Bull System Manager and the GAM SNMP agent.
The following figure shows the different monitoring components:
Figure 3-1. GAM Monitoring Components
20 Bull System Manager 1.3 Server Add-ons - Installation and Administrator's Guide
3.1.1.1 Default Categories & Services (independent of OS type)
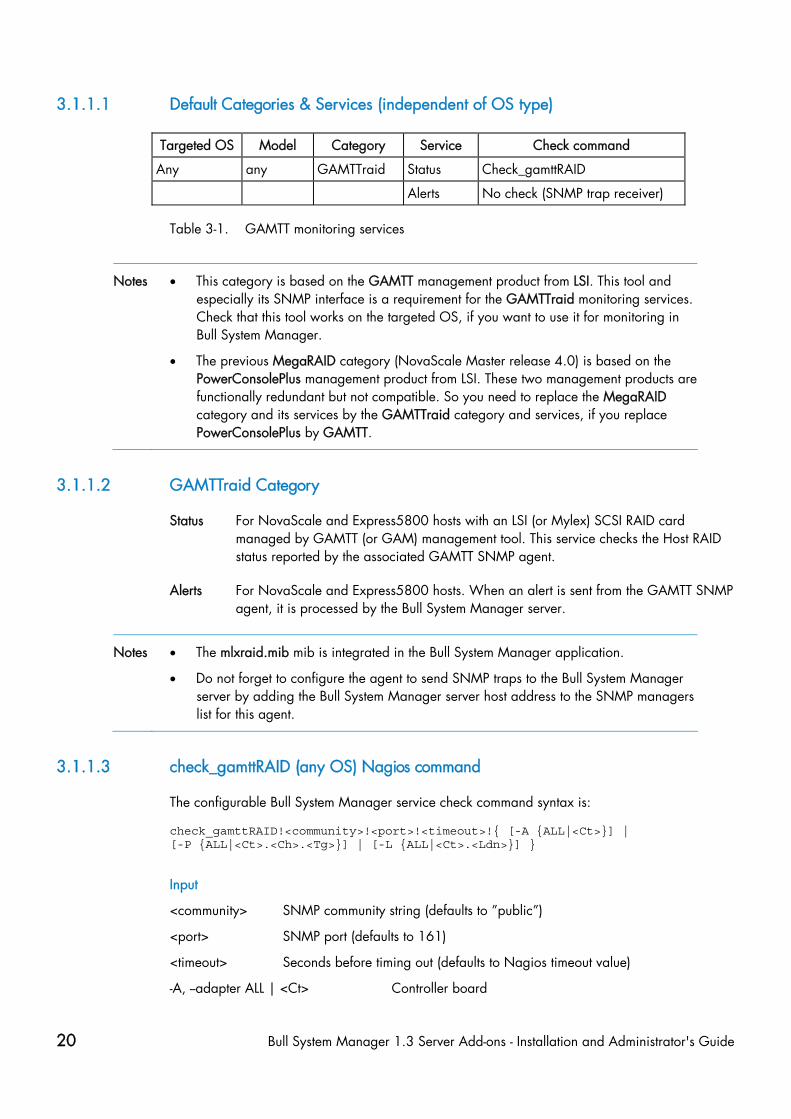
Targeted OS Model Category Service Check command
Any any GAMTTraid Status Check_gamttRAID
Alerts No check (SNMP trap receiver)
Table 3-1. GAMTT monitoring services
Notes • This category is based on the GAMTT management product from LSI. This tool and especially its SNMP interface is a requirement for the GAMTTraid monitoring services. Check that this tool works on the targeted OS, if you want to use it for monitoring in Bull System Manager.
• The previous MegaRAID category (NovaScale Master release 4.0) is based on the PowerConsolePlus management product from LSI. These two management products are functionally redundant but not compatible. So you need to replace the MegaRAID category and its services by the GAMTTraid category and services, if you replace PowerConsolePlus by GAMTT.
3.1.1.2 GAMTTraid Category
Status For NovaScale and Express5800 hosts with an LSI (or Mylex) SCSI RAID card managed by GAMTT (or GAM) management tool. This service checks the Host RAID status reported by the associated GAMTT SNMP agent.
Alerts For NovaScale and Express5800 hosts. When an alert is sent from the GAMTT SNMP agent, it is processed by the Bull System Manager server.
Notes • The mlxraid.mib mib is integrated in the Bull System Manager application.
• Do not forget to configure the agent to send SNMP traps to the Bull System Manager server by adding the Bull System Manager server host address to the SNMP managers list for this agent.
3.1.1.3 check_gamttRAID (any OS) Nagios command
The configurable Bull System Manager service check command syntax is:
check_gamttRAID!<community>!<port>!<timeout>!{ [-A {ALL|<Ct>}] | [-P {ALL|<Ct>.<Ch>.<Tg>}] | [-L {ALL|<Ct>.<Ldn>}] }
Input
<community> SNMP community string (defaults to ”public”)
<port> SNMP port (defaults to 161)
<timeout> Seconds before timing out (defaults to Nagios timeout value)
-A, --adapter ALL | <Ct> Controller board

Chapter 3. Bull System Manager Server Add-ons Description 21
-P, --physical ALL | <Ct>.<Ch>.<Tg> Physical device addr
-L, --logical ALL | <Ct>.<Ldn> Logical drive addr
Output See the output of the check_gamttRAID command in Appendix A.
Default syntax for ”GAMTTraid.Status” (the service name as defined in Nagios configuration based on the category name and service name defined in BSM configuration)
check_gamttRAID!public!161!60!-A ALL

22 Bull System Manager 1.3 Server Add-ons - Installation and Administrator's Guide
3.1.2 BSMLSICIM for LSI 22320 Chip Management
LSI CIM is the LSI tool used to survey, configure and control RAID provided by LSI MegaRAID 22320 SCSI cards.
See http://www.lsilogic.com/products/megaraid/index.html for more information or for downloading the LSI CIM install package.
Note This tool runs on NovaScale machines under Linux or Windows.
The corresponding Bull System Manager Add-on creates monitoring links between Bull System Manager and the LSI CIM provider.
The following figure shows the different monitoring components:
Figure 3-2. LSI CIM Monitoring Components

Chapter 3. Bull System Manager Server Add-ons Description 23
3.1.2.1 Default Categories & Services (independent of OS type)
Targeted OS Model Category Service Check command Any Any LsiCIM RAIDStatus check_LSICIM
CTRLstatus check_LSICIM_ctrl
Table 3-2. LSI CIM monitoring services
Note This category is based on the LSI CIM management product. This tool is a requirement for the following LsiCIM monitoring services. Check that this tool works on the targeted OS, if you want to use it for monitoring in Bull System Manager.
LsiCIM Category
RAIDstatus For NovaScale and Express5800 hosts with an LSI SCSI RAID card managed by the LSI CIM management tool. This service checks the Host RAID status reported by the associated LSI CIM provider.
CTRLstatus For NovaScale and Express5800 hosts with an LSI SCSI RAID card managed by the LSI CIM management tool. This service checks the status of a specific RAID SCSI controller reported by the associated LSI CIM provider.
3.1.2.2 check_LSICIM (any OS) Nagios command
The configurable Bull System Manager service check command syntax is:
check_LSICIM
Input N/A
Output
See the output of the check_LSICIM shell command in Appendix A.
Default syntax for "LsiCIM.CTRL.Status" (the service name as defined in Nagios configuration based on the category name and service name defined in BSM configuration)
check_LSICIM
3.1.2.3 check_LSICIM_ctrl (any OS) Nagios command
The configurable Bull System Manager service check command syntax is:
check_LSICIM_ctrl![<ctrlname>]
Input
<ctrlname> Name of the controller to check

24 Bull System Manager 1.3 Server Add-ons - Installation and Administrator's Guide
Note The name of the controller must be protected with a quotation mark if the name contains blank characters.
Output
See the output of the check_LSICIM shell command in Appendix A.
Default syntax for "LsiCIM.CTRL.Status" (the service name as defined in Nagios configuration based on the category name and service name defined in BSM configuration)
check_LSICIM!’ctrlname’

Chapter 3. Bull System Manager Server Add-ons Description 25
3.1.3 BSM MegaRaidSAS (LSI MegaRAID SAS (IR) Management)
The corresponding Bull System Manager Add-on creates monitoring links between Bull System Manager and the LSI MegaRAID SAS(IR) SNMP agent.
It supports the adapters from MegaRAID SAS/SATA Value and Feature Line and the LSI SAS ICs 1064, 1068 and 1078.
Figure 3-3. MegaRAID SAS Monitoring Components
BSM Server machine
Target machine
BSM core
MegaRaidSAS add-on
SNMP service (host OS)
MegaRAID SAS (IR)
SNMP agent
MegaRAID SAS LSISAS 1064,1068(E) or 1078
BSM Server
SNMP
trap mngr
LSI Logic
software
hardware
Get
Trap

26 Bull System Manager 1.3 Server Add-ons - Installation and Administrator's Guide
3.1.3.1 Default Categories & Services (independent of OS type)
Targeted OS Model Category Service Check command
Any Any MegaRaidSAS Status check_MegaRAIDSAS
Alerts No check (SNMP trap receiver)
Any Any MegaRaidSAS_IR Status check_MegaRAIDSAS_IR
Alerts No check (SNMP trap receiver)
Table 3-3. MegaRaid SAS (IR) monitoring services
Note This category is based on the MegaRAID SAS (IR) SNMP agent. This SNMP interface is a requirement for the following MegaRaidSAS(-IR) monitoring services.
3.1.3.2 MegaRaidSAS(_IR) Category
Status For NovaScale hosts with a MegaRAID SAS card or an integrated LSI SAS chip managed by MegaRAID Storage Management tool. This service checks the MegaRAID SAS (IR) status reported by the MegaRAID SAS (IR) SNMP agent.
Alerts For NovaScale hosts with a MegaRAID SAS card or an integrated LSI SAS chip. When an alert is sent from the MegaRAID SAS (IR) SNMP agent, it is processed by the Bull System Manager Server.
Notes • The lsi-adaptersas(ir).mib mib is integrated in the Bull System Manager application.
• Do not forget to configure the MegaRAID SAS (IR) SNMP agent to send SNMP traps to the Bull System Manager Server by adding the Bull System Manager Server host address to the agent’s SNMP managers list.
3.1.3.3 check_MegaRaidSAS(_IR) (any OS) Nagios command
The configurable Bull System Manager service check command syntax is:
check_MegaRaidSAS(_IR)!<community>!<port>!<timeout>
See the check_ MegaRaidSAS(_IR) command in Appendix A for parameters details.
Default syntax for "MegaRaidSAS(_IR).Status" (the service name as defined in Nagios configuration based on the category name and service name defined in BSM configuration)
check_ MegaRaidSAS(_IR)!public!161!60
Chapter 3. Bull System Manager Server Add-ons Description 27
3.2 External Storage Server Add-ons
3.2.1 BSMStoreWayFDA (StoreWay FDA Management)
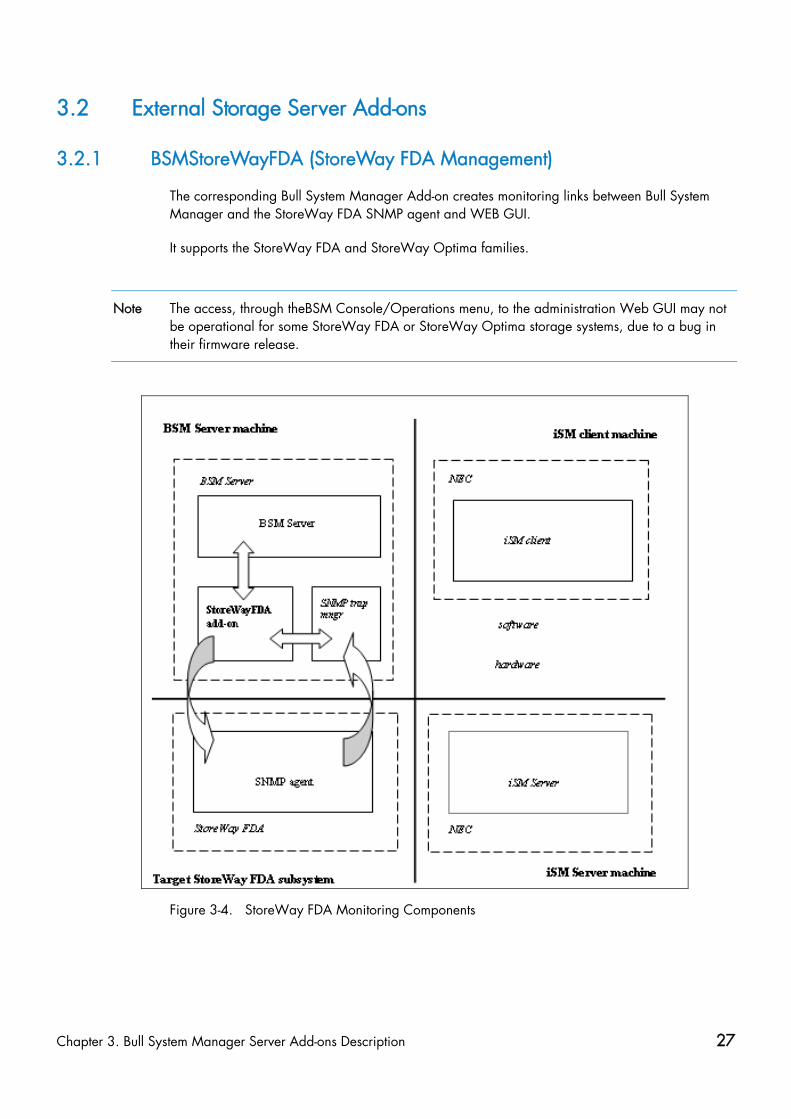
The corresponding Bull System Manager Add-on creates monitoring links between Bull System Manager and the StoreWay FDA SNMP agent and WEB GUI.
It supports the StoreWay FDA and StoreWay Optima families.
Note The access, through theBSM Console/Operations menu, to the administration Web GUI may not be operational for some StoreWay FDA or StoreWay Optima storage systems, due to a bug in their firmware release.
Figure 3-4. StoreWay FDA Monitoring Components

28 Bull System Manager 1.3 Server Add-ons - Installation and Administrator's Guide
3.2.1.1 Default Categories & Services (independent of OS type)
Targeted OS Model Category Service Check command Any BayStoreWay
FDA StoreWayFDA Status check_NECFDA
Alerts No check (SNMP trap receiver)
Table 3-4. StoreWay FDA monitoring services
Note This category is based on the StoreWay FDA SNMP agent. This SNMP interface is a requirement for the StoreWayFDA monitoring services.
3.2.1.2 StoreWayFDA Category
Status For StoreWay FDA hosts managed via SNMP agents. This service checks the StoreWay FDA status reported by the SNMP agent.
Alerts For StoreWay FDA hosts. When an alert is sent from the StoreWay FDA SNMP agent, it is processed by the Bull System Manager Server.
Notes • The Armg2_4.mib mib is integrated in the Bull System Manager application.
• Do not forget to configure the StoreWay FDA agent to send SNMP traps to the Bull System Manager Server by adding the Bull System Manager Server host address to the agent’s SNMP managers list.
3.2.1.3 check_NECFDA (any OS) Nagios command
The configurable Bull System Manager service check command syntax is:
check_storewayfda!<community>!<port>!<timeout>
See the check_NECFDA command in Appendix A for parameters details.
Default syntax for "StoreWayFDA.Status" (the service name as defined in Nagios configuration based on the category name and service name defined in BSM configuration)
check_necfda!public!161!60

Chapter 3. Bull System Manager Server Add-ons Description 29
3.2.1.4 Bull System Manager Configuration
StoreWay FDA configuration for Bull System Manager is available from the configuration GUI by selecting Topology → StoreWay → StoreWayFDAs.
To edit a StoreWay FDA, select Edit.
To define a new StoreWay FDA in the Bull System Manager configuration database, click the New StoreWay FDA button and initialize the following attributes:
StoreWay FDA name name of the StoreWay FDA
description description
network name bay netname
snmp port number SNMP port number
snmp community SNMP community

30 Bull System Manager 1.3 Server Add-ons - Installation and Administrator's Guide
3.2.2 BSMEmcClariion (EMC CLARiiON Management)
The corresponding Bull System Manager Add-on creates monitoring links between Bull System Manager and the EMC Navisphere SNMP agent and web GUI.
Figure 3-5. EMC CLARiiON Monitoring Components
3.2.2.1 Default Categories & Services (independent of OS type)
Targeted OS Model Category Service Check command
Any bayEmcClariion EmcClariion Alerts No check (SNMP trap receiver)
Status check_EMCCLARIION
Table 3-5. EmcClariion monitoring services
Note This category is based on the EMC Navisphere SNMP agent. This SNMP interface is a requirement for the EmcClariion monitoring services.
BSM Server machine
EMC CLARiiON storage system
BSM core
Navisphere SNMP agent
BSM Server
EMC CLARiiON
EmcClariion Add-on
Trap Get
SNMP trap mngr

Chapter 3. Bull System Manager Server Add-ons Description 31
3.2.2.2 EmcClariion Category
Status For EMC CLARiiON hosts managed via Navisphere SNMP agent. This service checks the Emc Clariion status reported by the SNMP agent.
Alerts For EMC CLARiiON hosts. When an alert is sent from the Navisphere SNMP agent, it is processed by the Bull System Manager Server.
Notes • The clariion.mib mib is integrated in the Bull System Manager application.
• Do not forget to configure the Navisphere agent to send SNMP traps to the Bull System Manager Server by adding the Bull System Manager Server host address to the agent’s SNMP managers list.
3.2.2.3 check_EMCCLARIION (any OS) Nagios command
The configurable Bull System Manager service check command syntax is:
check_EmcClariion!<community>!<port>!<timeout>
See the check_ EMCCLARIION command in Appendix A for parameters details.
Default syntax for ”EmcClariion.Status” (the service name as defined in Nagios configuration based on the category name and service name defined in BSM configuration)
check_EmcClariion!public!161!60
3.2.2.4 Bull System Manager Configuration
EmcClariion configuration for Bull System Manager is available from the configuration GUI by selecting Topology → StoreWay hosts → EmcClariions.
To edit an EmcClariion, select Edit.
To define a new EmcClariion in the Bull System Manager configuration database, click the New EMC CLARiiON button and initialize the following attributes:
StoreWay EMC CLARiiON name name of the EMC CLARiiON
description description
network name bay netname
SNMP port number SNMP port number
SNMP community SNMP community

32 Bull System Manager 1.3 Server Add-ons - Installation and Administrator's Guide
3.2.3 BSMNetApp (NetApp Management)
The corresponding Bull System Manager Add-on creates monitoring links between Bull System Manager and the NetApp SNMP agent and WEB GUI.
Figure 3-6. NetApp Monitoring Components
3.2.3.1 Default Categories & Services (independent of OS type)
Targeted OS Model Category Service Check command
any bayNetApp NetApp Alerts No check (SNMP trap receiver)
CPULoad check-netapp-cpuload
Disks check-netapp-numdisks
Fans check-netapp-failedfans
GlobalStatus check_netapp_globalstatus
Power check-netapp-failedpwr
RAIDStatus check_netappraid
VolumeStatus check_netappvol
Table 3-6. NetApp monitoring services
BSM Server machine
NetApp storage system
BSM core
SNMP agent
BSM Server
NetApp
NetAppAdd-on
Trap Get
SNMP trap mngr

Chapter 3. Bull System Manager Server Add-ons Description 33
Note This category is based on the NetApp SNMP agent. This SNMP interface is a requirement for the NetApp monitoring services.
3.2.3.2 NetApp Category
CPULoad For NetApp hosts managed via SNMP agents. This service checks the NetApp CPU load reported by the SNMP agent.
Disks For NetApp hosts managed via SNMP agents. This service checks the status of the NetApp disks reported by the SNMP agent.
Fans For NetApp hosts managed via SNMP agents. This service checks the status of the NetApp fans reported by the SNMP agent.
GlobalStatus For NetApp hosts managed via SNMP agents. This service checks the NetApp Global Status reported by the SNMP agent.
Power For NetApp hosts managed via SNMP agents. This service checks the status of the NetApp power supplies reported by the SNMP agent.
RAIDStatus For NetApp hosts managed via SNMP agents. This service checks the NetApp RAID status reported by the SNMP agent.
VolumeStatus For NetApp hosts managed via SNMP agents. This service checks the NetApp volume status reported by the SNMP agent.
Alerts For NetApp hosts. When an alert is sent from the NetApp SNMP agent, it is processed by the Bull System Manager Server.
Notes • The netapp.mib mib is integrated in the Bull System Manager application.
• Do not forget to configure the NetApp agent to send SNMP traps to the Bull System Manager Server by adding the Bull System Manager Server host address to the agent’s SNMP managers list.
3.2.3.3 Reporting Indicators
A reporting indicator is defined for the CPU load of the NetApp storage system. It gets values from the corresponding monitoring service.
Indicator applied to the NetApp Host
Indicator Corresponding Service
<NetApp_host>_CPULoad CPULoad

34 Bull System Manager 1.3 Server Add-ons - Installation and Administrator's Guide
3.2.3.4 Nagios check commands
check-netapp-cpuload (any OS) Nagios command
The Bull System Manager service check command syntax is:
check_snmp -C public -o .1.3.6.1.4.1.789.1.2.1.3.0 -w 90 -c 95 -u '%' -l "CPU LOAD"
See the check-netapp-cpuload command in Appendix A for details.
check-netapp-numdisks (any OS) Nagios command
The Bull System Manager service check command syntax is:
check_snmp -C public -o .1.3.6.1.4.1.789.1.6.4.1.0, .1.3.6.1.4.1.789.1.6.4.2.0, .1.3.6.1.4.1.789.1.6.4.8.0, .1.3.6.1.4.1.789.1.6.4.7.0 -u 'Total Disks','Active','Spare','Failed' -l ""
See the check-netapp-numdisks command in Appendix A for details.
check-netapp-failedfans (any OS) Nagios command
The Bull System Manager service check command syntax is:
check_snmp -C public -o .1.3.6.1.4.1.789.1.2.4.3.0 -l "Fans"
See the check-netapp-failedfans command in Appendix A for details.
check_netapp_globalstatus (any OS) Nagios command
The configurable Bull System Manager service check command syntax is:
check_NetAppGlobalStatus!<community>!<port>!<timeout>
See the check_netapp_globalstatus command in Appendix A for parameters details.
Default syntax for "NetApp.GlobalStatus": (the service name as defined in Nagios configuration based on the category name and service name defined in BSM configuration)
check_ NetAppGlobalStatus!public!161!60
check-netapp-failedpwr (any OS) Nagios command
The Bull System Manager service check command syntax is:
check_snmp -C public -o .1.3.6.1.4.1.789.1.2.4.5.0 -l "Power"
See the check-netapp-failedpwr command in Appendix A for details.

Chapter 3. Bull System Manager Server Add-ons Description 35
check_netappraid (any OS) Nagios command
The configurable Bull System Manager service check command syntax is:
check_NetAppRaid!<community>!<port>!<timeout>
See the check_netappraid command in Appendix A for parameters details.
Default syntax for ”NetApp.RAIDStatus”: (the service name as defined in Nagios configuration based on the category name and service name defined in BSM configuration)
check_NetAppRaid!public!161!60
check_netappvol (any OS) Nagios command
The configurable Bull System Manager service check command syntax is:
check_NetAppVol!<community>!<port>!<timeout>
See the check_netappvol command in Appendix A for parameters details.
Default syntax for ”NetApp.VolumeStatus”: (the service name as defined in Nagios configuration based on the category name and service name defined in BSM configuration)
check_NetAppVol!public!161!60
3.2.3.5 Bull System Manager Configuration
NetApp configuration for Bull System Manager is available from the configuration GUI by selecting Topology → StoreWay hosts → NetApps.
To edit a NetApp, select Edit.
To define a new NetApp in the Bull System Manager configuration database, click the New NetApp button and initialize the following attributes:
StoreWay NetApp name name of the NetApp
description description
network name bay netname
SNMP port number SNMP port number
SNMP community SNMP community

36 Bull System Manager 1.3 Server Add-ons - Installation and Administrator's Guide
3.2.4 BSMStoreWayDPA (StoreWay DPA Management)
The corresponding Bull System Manager Add-on creates monitoring links between Bull System Manager and the StoreWay DPA SNMP agent and WEB GUI.
Figure 3-7. StoreWayDPA Monitoring Components
3.2.4.1 Default Categories & Services (independent of OS type)
Targeted OS Model Category Service Check command
Any bayStoreWayDPA StoreWayDPA Alerts No check (SNMP trap receiver)
TaskStatus check_StoreWayDPA
Table 3-7. StoreWayDPA monitoring services
Note This category is based on the StoreWay DPA SNMP agent. This SNMP interface is a requirement for the StoreWayDPA monitoring services.
BSM Server machine
StoreWay DPA storage system
BSM core
StoreWay DPA SNMP agent
BSM Server
StoreWay DPA
StoreWayDPA Add-on
Trap
SNMP trap mngr
Chapter 3. Bull System Manager Server Add-ons Description 37
3.2.4.2 StoreWayDPA Category
TaskStatus For StoreWay DPA hosts managed via its SNMP agent. This service checks the StoreWay DPA Backup Engine and Task Launcher status reported by the SNMP agent.
Alerts For StoreWay DPA hosts. When an alert is sent from the StoreWay DPA SNMP agent, it is processed by the Bull System Manager Server.
Notes • The storewaydpa.mib mib is integrated in the Bull System Manager application.
• Do not forget to configure the StoreWay DPA agent to send SNMP traps to the Bull System Manager Server by adding the Bull System Manager Server host address to the agent’s SNMP managers list.
3.2.4.3 Nagios check commands
Check_StoreWayDPA (any OS) Nagios command
The Bull System Manager service check command syntax is:
check_StoreWayDPA!<community>!<port>!<timeout>
See the check_ StoreWayDPA command in Appendix A for parameters details.
Default syntax for ”StoreWayDPA.TaskStatus” (the service name as defined in Nagios configuration based on the category name and service name defined in BSM configuration)
check_ StoreWayDPA!public!161!60
3.2.4.4 Bull System Manager Configuration
StoreWayDPA configuration for Bull System Manager is available from the configuration GUI by selecting Topology → StoreWay hosts → StoreWayDPAs.
To edit an StoreWayDPA, select Edit.
To define a new StoreWayDPA in the Bull System Manager configuration database, click the New StoreWay DPA button and initialize the following attributes:
StoreWay StoreWay DPA name name of the StoreWay DPA
description description
network name bay netname
SNMP port number SNMP port number
SNMP community SNMP community

38 Bull System Manager 1.3 Server Add-ons - Installation and Administrator's Guide
3.2.5 BSM SwitchBrocade (Brocade Fibre Channel Switch Management)
The corresponding Bull System Manager Add-on creates monitoring links between Bull System Manager and the Brocade Fibre Channel Switch SNMP agent and WEB GUI.
Figure 3-8. Brocade Fibre Channel Switch Monitoring Components
3.2.5.1 Default Categories & Services (independent of OS type)
Targeted OS Model Category Service Check command
Any baySwitchBrocade Brocade Alerts No check (SNMP trap receiver)
Status check_brocade
Ports check_brocade
Table 3-8. Default Brocade Fibre Channel Switch monitoring services
Note This category is based on the Brocade Fibre Channel Switch SNMP agent. This SNMP interface is a requirement for the default Brocade Fibre Channel Switch monitoring services.
BSM Server machine
Brocade Fibre Channel Switch
BSM core
Brocade FC Switch SNMP agent
BSM Server
Brocade Fibre Channel Switch
Switch Brocade Add-on
Trap
SNMP trap mngr
Chapter 3. Bull System Manager Server Add-ons Description 39
3.2.5.2 Optional Categories & Services (independent of OS type)
Targeted OS Model Category Service Check command
Any baySwitchBrocade Brocade_Sensors Fans check_brocade
Temp check_brocade
Table 3-9. Optional Brocade Fibre Channel Switch monitoring services
Note This category is based on the Brocade Fibre Channel Switch SNMP agent. This SNMP interface is a requirement for the optional Brocade Fibre Channel Switch monitoring services.
3.2.5.3 Brocade Category
Status For SwitchBrocade hosts managed via its SNMP agent. This service checks the Brocade Fibre Channel Switch global status reported by the SNMP agent.
Ports For SwitchBrocade hosts managed via its SNMP agent. This service checks each Brocade Fibre Channel Switch port status reported by the SNMP agent.
Alerts For SwitchBrocade hosts. When an alert is sent from the Brocade Fibre Channel Switch SNMP agent, it is processed by the Bull System Manager Server.
Notes • The SW-MIB.mib and SW-TRAP.mib mib files are integrated in the Bull System Manager application.
• Do not forget to configure the Brocade Fibre Channel Switch snmp agent to send SNMP traps to the Bull System Manager Server by adding the Bull System Manager Server host address to the agent’s SNMP managers list.
3.2.5.4 Brocade_Sensors Category
Fans For SwitchBrocade hosts managed via SNMP agents. This service checks each Brocade Fibre Channel Switch fan status reported by the SNMP agent.
Temp For SwitchBrocade hosts managed via SNMP agents. This service checks each Brocade Fibre Channel Switch temperature sensor status reported by the SNMP agent.

40 Bull System Manager 1.3 Server Add-ons - Installation and Administrator's Guide
3.2.5.5 Nagios check commands
check_brocade (any OS) Nagios command
The Bull System Manager service check command syntax is:
check_brocade!<sensor>
values available for <sensor> are:
switch
port
fan
temp
See the check_ brocade command in Appendix A for parameters details.
3.2.5.6 Bull System Manager Configuration
SwitchBrocade configuration for Bull System Manager is available from the configuration GUI by selecting Topology → StoreWay hosts → SwitchBrocade.
To edit a SwitchBrocade, select Edit.
To define a new SwitchBrocade in the Bull System Manager configuration database, click the New SwitchBrocade button and initialize the following attributes:
Switch Brocade name name of the Brocade Fibre Channel Switch
description description
network name bay netname
SNMP port number SNMP port number
SNMP community SNMP community
3.2.5.7 Configuration of optional Brocade_Sensors category
The configuration of the optional Brocade_Sensors category for SwitchhBrocade hosts is available from the configuration GUI by selecting Supervision → Monitoring → Categories/Services-> manage categories.
This opens a new window. Select Add from an unused category template and check the Brocade_Sensors category. Then click on Add from the selected category.
Add the SwitchBrocade hosts to the hostlist and click on OK. Validate the new configuration by clicking on Save & Reload.

Chapter 3. Bull System Manager Server Add-ons Description 41
3.3 External Device Server Add-ons
3.3.1 BSM WaterCooledDoor (Water Cooled Door Management)
The corresponding Bull System Manager Add-on creates monitoring links between Bull System Manager and the Baseboard Management Controller of the Bull Water Cooled Door device and its web GUI.
Figure 3-9. Water Cooled Door Monitoring Components
3.3.1.1 Default Categories & Services (independent of OS type)
Targeted OS Model Category Service Check command
any devWaterCooledDoor Hardware Alerts No check (SNMP trap receiver)
PowerStatus check_IPMI_powerstatus
Sensors CurrentPower check_IPMI_sensor
DeltaPressure check_pressure
TemperatureAverage check_IPMI_sensor
ValveAperture check_IPMI_sensor
Table 3-10. Water Cooled Door monitoring services
BSM Server machine
BSM core
BMC SNMP agent
BSM Server
Water Cooled Door
Water Cooled Door Add-on
TrapHardware command
SNMP trap mngr
BMC IPMI

42 Bull System Manager 1.3 Server Add-ons - Installation and Administrator's Guide
Note These categories are based on the IPMI Hardware commands. The IPMI interface is a requirement for the WaterCooledDoor monitoring services.
3.3.1.2 Hardware Category
PowerStatus For WaterCooledDoor hosts managed via IPMI Hardware commands. This service checks the WaterCooledDoor power status reported by the BMC.
Alerts For WaterCooledDoor hosts. When an alert is sent from the WaterCooledDoor SNMP agent, it is processed by the Bull System Manager Server.
Note The WaterCooledDoorMIB.mib is integrated in the Bull System Manager application. The Alerts service inherits also from the bmclanpet.mib, which is also integrated in the Bull System Manager application.
3.3.1.3 Sensors Category
CurrentPower For WaterCooledDoor hosts managed via IPMI Hardware commands. This service checks the power consumption of the WaterCooledDoor reported by the BMC.
DeltaPressure For WaterCooledDoor hosts managed via IPMI Hardware commands. This service checks the in/out pressure difference of the water circuit of the WaterCooledDoor reported by the BMC.
TemperatureAverage For WaterCooledDoor hosts managed via IPMI Hardware commands. This service checks the temperature average of the different temperature sensors of the WaterCooledDoor reported by the BMC.
ValveAperture For WaterCooledDoor hosts managed via IPMI Hardware commands. This service checks the cooled water circuit valve aperture reported by the BMC.
Note Do not forget to configure the BMC’s SNMP agent to send SNMP traps to the Bull System Manager Server by adding the BSM Server host address to the SNMP managers list.
3.3.1.4 Reporting Indicators
Reporting indicators are defined for the WaterCooledDoor host, which obtain values from the corresponding monitoring services.
Indicators applied to the WaterCooledDoor Host
Indicator Corresponding Service <WaterCooledDoor_host>_CurrentPower Sensors.CPULoad <WaterCooledDoor_host>_DeltaPressure Sensors.DeltaPressure <WaterCooledDoor_host>_TemperatureAverage Sensors.TemperatureAverage <WaterCooledDoor_host>_ValveAperture Sensors.ValveAperture

Chapter 3. Bull System Manager Server Add-ons Description 43
3.3.1.5 Nagios check commands
check_IPMI_powerstatus (any OS) Nagios command
The Bull System Manager service check command syntax is:
check_IPMILAN_powerstatus
See the check_IPMI_powerstatus command in Appendix A for details.
check_pressure (any OS) Nagios command
The Bull System Manager service check command syntax is:
check_sensor!’Air Pressure’
See the check-sensor command in Appendix A for details.
check_IPMI_sensor (any OS) Nagios command
The configurable Bull System Manager service check command syntax is:
check_sensor!<sensor>
See the check_sensor command in Appendix A for parameters details.
3.3.1.6 Bull System Manager Configuration
The WaterCooledDoor configuration for Bull System Manager is available from the configuration GUI by selecting Topology → Device hosts → WaterCooledDoors.
To edit a WaterCooledDoor, select Edit.
To define a new WaterCooledDoor in the Bull System Manager configuration database, click the New Water Cooled Door button and initialize the following attributes:
Water Cooled Door name Name of the Water Cooled Door
description Description
network name Address IP of Water Cooled Door’s BMC
user User name to access the BMC
password Password associated to the user name

44 Bull System Manager 1.3 Server Add-ons - Installation and Administrator's Guide
3.3.2 BSM PDU-APC (APC Power Distribution Unit Management)
The corresponding Bull System Manager Add-on creates monitoring links between Bull System Manager and the APC Power Distribution Unit SNMP agent and WEB GUI.
Figure 3-10 APC Power Distribution Unit Monitoring Components
3.3.2.1 Default Categories & Services (independent of OS type)
Targeted OS Model Category Service Check command
Any devPDUAPC PDUAPC Alerts No check (SNMP trap receiver)
Status check_pduapc_status
Power Consumption check_pduapc_pwr_consumption
Outlets check_pduapc_outlets
Table 3-11. Default APC Power Distribution Unit monitoring services
Note This category is based on the APC Power Distribution Unit SNMP agent. This SNMP interface is a requirement for the default APC Power Distribution Unit monitoring services.
BSM Server machine
APC Power Distribution Unit
BSM core
APC PDU SNMP agent
BSM Server
APC Power Distribution Unit
PDU-APC Add-on
Trap
SNMP trap mngr
Get

Chapter 3. Bull System Manager Server Add-ons Description 45
3.3.2.2 PDUAPC Category
Alerts For APC PDU hosts. When an alert is sent from the APC PDU SNMP agent, it is processed by the Bull System Manager Server.
Status For APC PDU hosts managed via its SNMP agent. This service checks the APC PDU power supplies status reported by the SNMP agent.
Notes • The powernet398.mib mib file are integrated in the Bull System Manager application. The trap severity SEVERE was changed to CRITICAL
• Do not forget to configure the APC PDU snmp agent to send SNMP traps to the Bull System Manager Server by adding the Bull System Manager Server host address to the agent’s SNMP managers list.
3.3.2.3 Power Category
Consumption For APC PDU hosts managed via SNMP agents. This service checks the global power consumption (in Watts) for each APC PDU.
Outlets For APC PDU hosts managed via SNMP agents. This service checks each APC PDU outlet status reported by the SNMP agent.
3.3.2.4 Reporting Indicators
A reporting indicator is defined for the global power consumption of APC Power Distribution Unit. It gets values from the corresponding monitoring service.
Indicator applied to the PDUAPC Host
Indicator Corresponding Service
<PDUAPC_host>.Consumption Consumption

46 Bull System Manager 1.3 Server Add-ons - Installation and Administrator's Guide
3.3.2.5 Nagios check commands
check_PDUAPC (any OS) Nagios command
The Bull System Manager service check command syntax is:
check_PDUAPC!<action>!snmp_community!snmp_port
values available for <action> are:
Status
Consumption
Outlets
See the check_ PDUAPC command in Appendix A for parameters details.
3.3.2.6 Bull System Manager Configuration
APC PDU configuration for Bull System Manager is available from the configuration GUI by selecting Topology → Device hosts → PDUAPC.
To edit a PDUAPC, select Edit.
To define a new PDUAPC in the Bull System Manager configuration database, click the New PDUAPC button and initialize the following attributes:
PDUAPC name name of the APC power Distribution Unit
description description
network name bay netname
SNMP port number SNMP port number
SNMP community SNMP community

Chapter 3. Bull System Manager Server Add-ons Description 47
3.4 Virtualization Server Add-ons
3.4.1 Overview
The Bull System Manager Server Virtualization Add-ons deliver an optional management package to manage virtual machines. A virtualization Add-on can provide:
• Supervision features to detect abnormalities and notify the corresponding defined entities.
• Administration features to perform actions on elements.
3.4.1.1 Definitions
Virtualization Add-ons use specific topology elements:
• Native Operating System (Native OS): The virtualization layer installed on a physical machine that hosts virtual machines. It is represented by a Bull System Manager host with a specific OS (specified by the Add-on).
• Virtual Machine (VM): A machine that is hosted by a native OS.. It is represented by a Bull System Manager host with a specific model (specified by the Add-on).
• Virtual Platform: The set of virtual machines and native OS deployed on a physical machine.
• Virtual Manager: The interface used to manage the virtual elements.
3.4.1.2 Topology Representation
The elements of a virtual platform are displayed in the Bull System Manager Console views.
To load a specific view, click the icon at the top of the Tree frame to select a view among available views, as shown below:
Figure 3-11. BSM Console Views
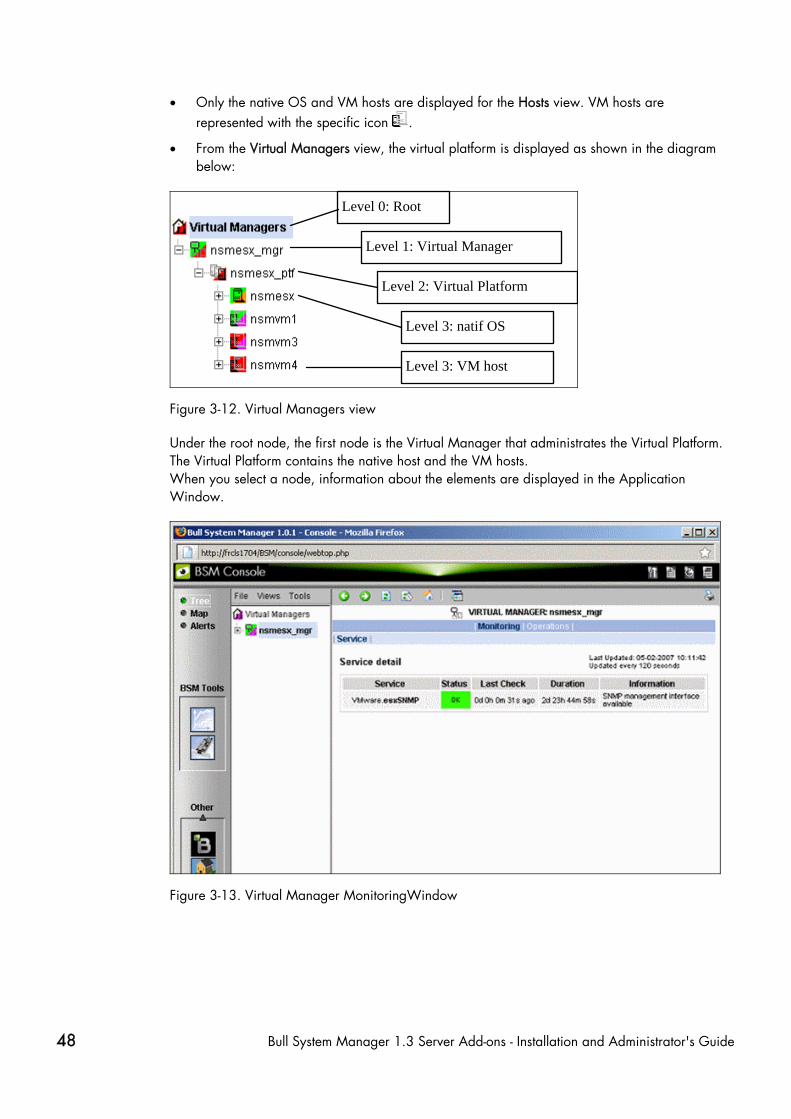
48 Bull System Manager 1.3 Server Add-ons - Installation and Administrator's Guide
• Only the native OS and VM hosts are displayed for the Hosts view. VM hosts are represented with the specific icon .
• From the Virtual Managers view, the virtual platform is displayed as shown in the diagram below:
Level 0: Root
Level 1: Virtual Manager
Level 3: natif OS
Level 2: Virtual Platform
Level 3: VM host
Figure 3-12. Virtual Managers view
Under the root node, the first node is the Virtual Manager that administrates the Virtual Platform. The Virtual Platform contains the native host and the VM hosts. When you select a node, information about the elements are displayed in the Application Window.
Figure 3-13. Virtual Manager MonitoringWindow
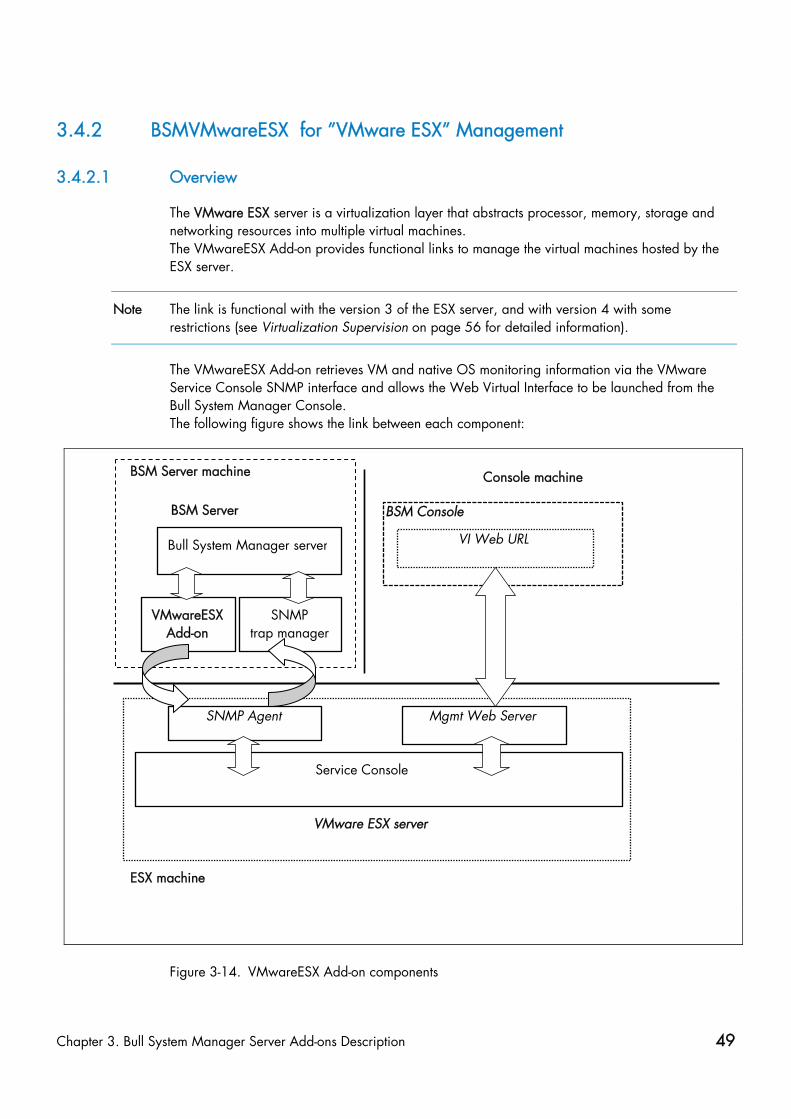
Chapter 3. Bull System Manager Server Add-ons Description 49
3.4.2 BSMVMwareESX for ”VMware ESX” Management
3.4.2.1 Overview
The VMware ESX server is a virtualization layer that abstracts processor, memory, storage and networking resources into multiple virtual machines. The VMwareESX Add-on provides functional links to manage the virtual machines hosted by the ESX server.
Note The link is functional with the version 3 of the ESX server, and with version 4 with some restrictions (see Virtualization Supervision on page 56 for detailed information).
The VMwareESX Add-on retrieves VM and native OS monitoring information via the VMware Service Console SNMP interface and allows the Web Virtual Interface to be launched from the Bull System Manager Console. The following figure shows the link between each component:
Figure 3-14. VMwareESX Add-on components
Service Console
Mgmt Web Server
VMware ESX server
ESX machine
BSM Server machine
Bull System Manager server
VMwareESX Add-on
SNMP trap manager
VI Web URL
BSM Server
Console machine
SNMP Agent
BSM Console
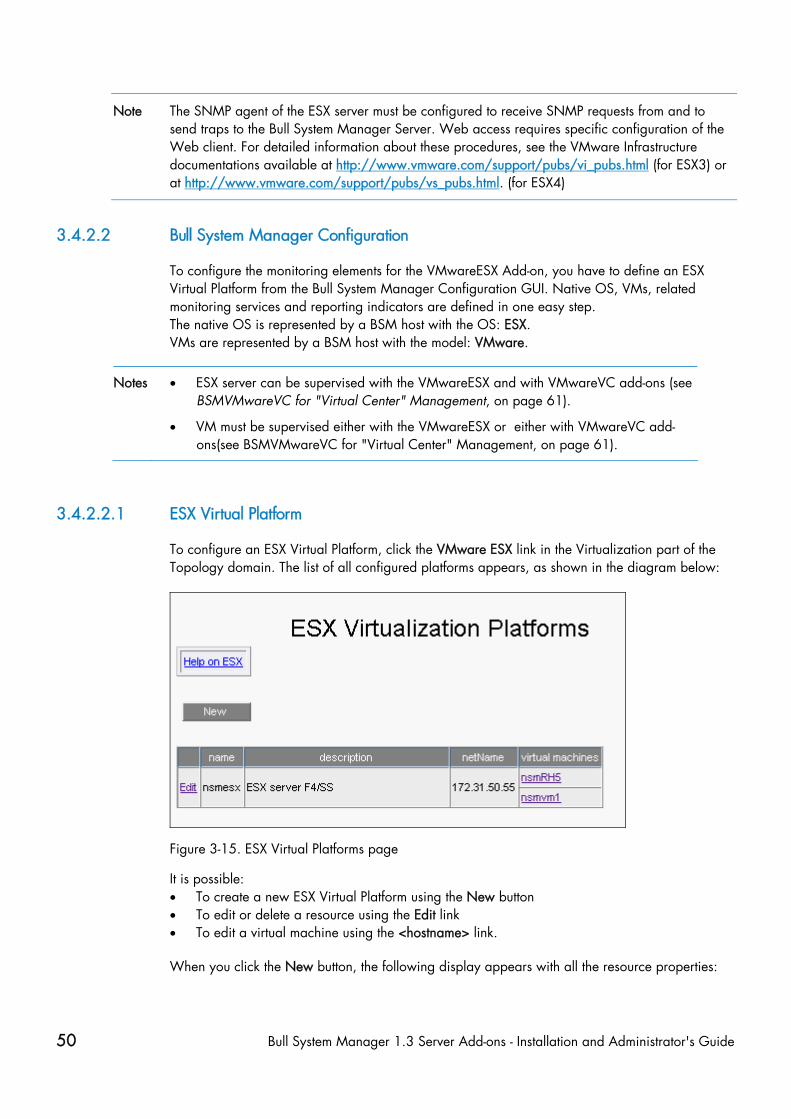
50 Bull System Manager 1.3 Server Add-ons - Installation and Administrator's Guide
Note The SNMP agent of the ESX server must be configured to receive SNMP requests from and to send traps to the Bull System Manager Server. Web access requires specific configuration of the Web client. For detailed information about these procedures, see the VMware Infrastructure documentations available at http://www.vmware.com/support/pubs/vi_pubs.html (for ESX3) or at http://www.vmware.com/support/pubs/vs_pubs.html. (for ESX4)
3.4.2.2 Bull System Manager Configuration
To configure the monitoring elements for the VMwareESX Add-on, you have to define an ESX Virtual Platform from the Bull System Manager Configuration GUI. Native OS, VMs, related monitoring services and reporting indicators are defined in one easy step. The native OS is represented by a BSM host with the OS: ESX. VMs are represented by a BSM host with the model: VMware.
Notes • ESX server can be supervised with the VMwareESX and with VMwareVC add-ons (see BSMVMwareVC for "Virtual Center" Management, on page 61).
• VM must be supervised either with the VMwareESX or either with VMwareVC add-ons(see BSMVMwareVC for "Virtual Center" Management, on page 61).
3.4.2.2.1 ESX Virtual Platform
To configure an ESX Virtual Platform, click the VMware ESX link in the Virtualization part of the Topology domain. The list of all configured platforms appears, as shown in the diagram below:
Figure 3-15. ESX Virtual Platforms page
It is possible: • To create a new ESX Virtual Platform using the New button • To edit or delete a resource using the Edit link • To edit a virtual machine using the <hostname> link.
When you click the New button, the following display appears with all the resource properties:

Chapter 3. Bull System Manager Server Add-ons Description 51
Figure 3-16. ESX Platform Properties
Besides the characteristics (name and description) of the main object, the properties of an ESX virtual platform are divided into three parts:
• ESX Server Host: used to define the physical machine and the native OS.
• SNMP Configuration: used to configure SNMP interface data.
• Virtualization Platform: used to describe the Vmware ESX platform virtual machine.
ESX Server Host Properties name ESX host short name.
This name is displayed in the Bull System Manager Console views. Click Select to choose a defined host from the BSM host list.
model Host model (see the Bull System Manager Administrator’s Guide for values).
network name ESX host network name (hostname or IP address).
Note To supervise an ESX server supervised with the VMwareVC add-on and with the VMwareESX add-on, you must first define the ESX server as an ESX virtualization platform without VM.
52 Bull System Manager 1.3 Server Add-ons - Installation and Administrator's Guide
SNMP Configuration Properties SNMP port SNMP agent port.
SNMP configuration SNMP agent community.
Virtualization Platform Properties Virtual Machines List of the VMs established by selecting the VMs obtained by requests to the
ESX server SNMP agent. The request is performed by clicking the Discover button (or Re-discover if in edition mode). See the complete description of the procedure below.
Note If VMs are linked to the ESX server, this could not be supervised later with the VMwareVC add-on.
Virtual Machines Discovered
Following the use of the Discover tool, the results are displayed as a table composed of three parts:
• The left column allows you to select the VMs to be associated to the platform
• The center part displays Virtual Machine Configuration as defined on the VMware ESX server
• The right part allows you to edit the main properties (name, network name and OS) of the corresponding BSM host. The host can be edited only if the corresponding VM is selected. You can select a host, already defined, by clicking the Select button or you can create a host by completing the corresponding fields.
Note When you select a host, already defined, you cannot change its network name and OS. However, the Select contains a Default Option corresponding to the VM name that can be edited. If the VM name contains space(s), they are replaced by underscore(s) in the host label.

Chapter 3. Bull System Manager Server Add-ons Description 53
Figure 3-17. ESX Virtual Machines pane
Virtual Machines Re-Discovered
The use of the Re-discover tool is required to check that the current BSM configuration still matches the VMware ESX configuration in order to: • Add virtual machine not yet registered in the VMware ESX Virtualization Platform • Remove virtual machine no longer defined in the VMware ESX configuration.
During the Re-discover step, if the current configuration is not compatible with VMware ESX configuration, the invalid VMs are displayed in red and the VMs not referenced in the current BSM configuration are displayed in green.
VMs no longer defined in VMware ESX are automatically unchecked and will be removed from the list shown. New VMs must be explicitly checked to be included.
Note How to Add, Delete or Modify Virtual Machine is detailed in 3.4.2.2.2 Editing Virtual Machine Set-up, on page 55.
When the configuration has been edited:
• Click OK to validate your changes
• Or click Cancel to return to Virtual Platforms pages without any change
• Or click Delete to remove the Virtual Platform and maintain the hosts corresponding to the VMs and the VMware ESX server
• Or click DeleteAll to remove the Virtual Platform and the hosts corresponding to the VMs and the VMwareESX server.
Note Host Topology modification require confirmation: a page listing all the modifications to be applied to the Topology configuration is displayed, as shown in the following figure.

54 Bull System Manager 1.3 Server Add-ons - Installation and Administrator's Guide
Figure 3-18. Host Topology modification confirmation screen
If you do not agree, click NO to return to the platform configuration window, otherwise click YES to create the virtual platform.
Related ESX Virtualization platform Objects
When an ESX Virtualization platform is defined, related objects are automatically generated to configure the type of Supervision linked to this type of server. The table, below, describes the objects generated during the creation of the platform.
Type Description
host VMware As defined in the Virtual Machine configuration part of the edition page.
host ESX Host corresponding to the virtualization layer, as defined in the ESX server Host configuration part.
hostgroup hostgroup representing the physical platform, named <platformName>.
manager Virtualization manager representing the management interface, named < platformName>_mgr.
categories and services The VMwareESX category and related services are instantiated for the ESX host. The Virtual Machine category and related services are instantiated for each VMware host.

Chapter 3. Bull System Manager Server Add-ons Description 55
3.4.2.2.2 Editing Virtual Machine Set-up
A virtual machine is represented by a host linked to the VMware ESX Virtualization platform. It has properties linked to the platform, and the properties of a host object.
Adding, removing or modifying properties linked to the platform must be done from the VMware Virtualization platform editing Window.
Modification of host properties must be done from the Host editing Window.
Add a virtual machine to a platform
Adding a virtual machine is done by checking the corresponding line in Virtual Machines part of the platform editing window, and setting the host characteristics in the BSM Configuration table zone (by filling in the corresponding fields or by selecting an already defined host).
Note When you edit a Virtualization platform, only the Virtual Machines defined for the Bull System Manager platform are displayed. To add a virtual machine, you must perform a Re-discovery to obtain the list of the machines defined for the Virtualization Server.
Remove a virtual machine from a platform
Removing a virtual machine is performed by unchecking the corresponding line in the Virtual Machines section for the platform.
Note The corresponding host remains in the Bull System Manager definition with model set to ‘other’. To delete it, click the Other Hosts link to get the list of all Other Hosts configured, edit the corresponding host and click the Delete button.
Modify a virtual machine defined in a platform
To modify the name of the BSM host corresponding to a virtual machine, enter the new name in the corresponding field or select it in the list of hosts, already defined in Bull System Manager by clicking the Select button.
To modify other characteristics, for example netName or OS, the Host edition form must be used.
Note To get the Host edition form corresponding to the virtual machine, click the Hostname link displayed in the global platforms page.
Delete all virtual machines and corresponding hosts.
To delete all virtual machines and corresponding hosts, use the DeleteAll button of the Virtualization Platform Edition form. Keep in mind the fact that the virtualization server and the platform will also be deleted from the Bull System Manager configuration.
56 Bull System Manager 1.3 Server Add-ons - Installation and Administrator's Guide
3.4.2.2.3 Virtualization Supervision
As specified above, services are instantiated for each host defined in the Virtualization Platform. You can disable virtualization supervision by editing the hostgroup or manager properties, or by editing each service (refer to the Bull System Manager Administration Guide for details).
Note Du to changes in the SNMP agent on ESX4, the Memory and CPU services are no longer functional. Consequently, they are not instantiated for hosts depending from an ESX4 platform.
Monitoring Services
Monitoring services defined for the native OS are associated with the VMwareESX category.
Services Applied to the Native OS
Service Description Check_command Status Checks ESX server status check_esx_server
SNMP Checks the ESX SNMP interface check_esx_snmp
Memory Checks ESX memory avaibility Not available with ESX4
check_esx_mem
Alerts Processes alerts received from the ESX SNMP agent
none (SNMP Trap receiver)
Monitoring services defined for VM hosts are associated with the VirtualMachine category.
Services Applied to the VM Host
Service Description Check_command Status Checks VM status check_esx_vm
CPU Checks VM CPU usage Not available with ESX4
check_esx_vm_cpu
Memory Checks VM memory avaibility Not available with ESX4
check_esx_vm_mem
Monitoring services related to Virtual Platform elements are automatically created during the edition of the ESX Virtual Platform. Theses services can be displayed and edited from the Services page in the Supervision domain, but only attributes related to monitoring or notification can be edited.

Chapter 3. Bull System Manager Server Add-ons Description 57
Figure 3-19. VMware service properties pane
Note During ESX Platform definition, all services are defined and activated for the ESX server and for each VM. To deactivate the monitoring for a service, set status (Monitoring attributes part) to be inactive.
58 Bull System Manager 1.3 Server Add-ons - Installation and Administrator's Guide
3.4.2.3 Nagios Check Commands
check_esx_server
The configurable Bull System Manager service check command syntax is:
check_esx_server!<snmp_community>!<wThres>%!<cThres>%
See the check_esx3 command in Appendix A for parameters details.
check_esx_snmp
The configurable Bull System Manager service check command syntax is:
check_esx_snmp!<snmp_community>
See the check_esx3 command in Appendix A for parameters details.
check_esx_mem
The configurable Bull System Manager service check command syntax is:
check_esx_mem!<snmp_community>!<wThres>!<cThres>
See the check_esx3 command in Appendix A for parameters details.
check_esx_vm
The configurable Bull System Manager service check command syntax is:
check_esx_vm!<esx_server>!<snmp_community>!<vmname>
See the check_esx3 command in Appendix A for parameters details.
check_esx_vm_memory
The configurable Bull System Manager service check command syntax is:
check_esx_vm!<esx_server>!<snmp_community>!<vmname><wThres>!<cThres>
See the check_esx3 command in Appendix A for parameters details.
check_esx_vm_cpu
The configurable Bull System Manager service check command syntax is:
check_esx_cpu!<esx_server>!<snmp_community>!<vmname><wThres>!<cThres>
See the check_esx3 command in Appendix A for parameters details.
Chapter 3. Bull System Manager Server Add-ons Description 59
3.4.2.4 Reporting Indicators
Reporting indicators are defined for VM hosts and for the native OS. They get values from the corresponding monitoring services.
Indicators Applied to the Native OS
Indicator Corresponding Service <esx_server>_esxMemory esxMemory
Indicators Applied to the VM Host
Indicator Corresponding Service
<vm_host>_vmCPU vmCPU <vm_host>_vmMemory vmMemory
Note During ESX Platform definition, all indicators are defined and activated for the ESX server and for each VM. To deactivate the reporting of one indicator, set it to inactive. Beware, if you deactivate the corresponding service, the indicator will no longer be updated.
3.4.2.5 Bull System Manager Console
VMwareESX Operation
From the Virtual Manager or from any element of the Virtual Platform, you can launch the Virtual Infrastructure Web Interface by selecting the following cascading menu:
Operation → Application → VMware ESX Web Access
VMwareESX Monitoring
From the platform or host elements, you can access monitoring information. From the hosts element, you can display information related to the associated service by selecting Monitoring menus. From the platform element, you can display monitoring information related to all elements by selecting Monitoring menus. For instance, you can view all services of the hosts in the platform, as shown in the following figure:
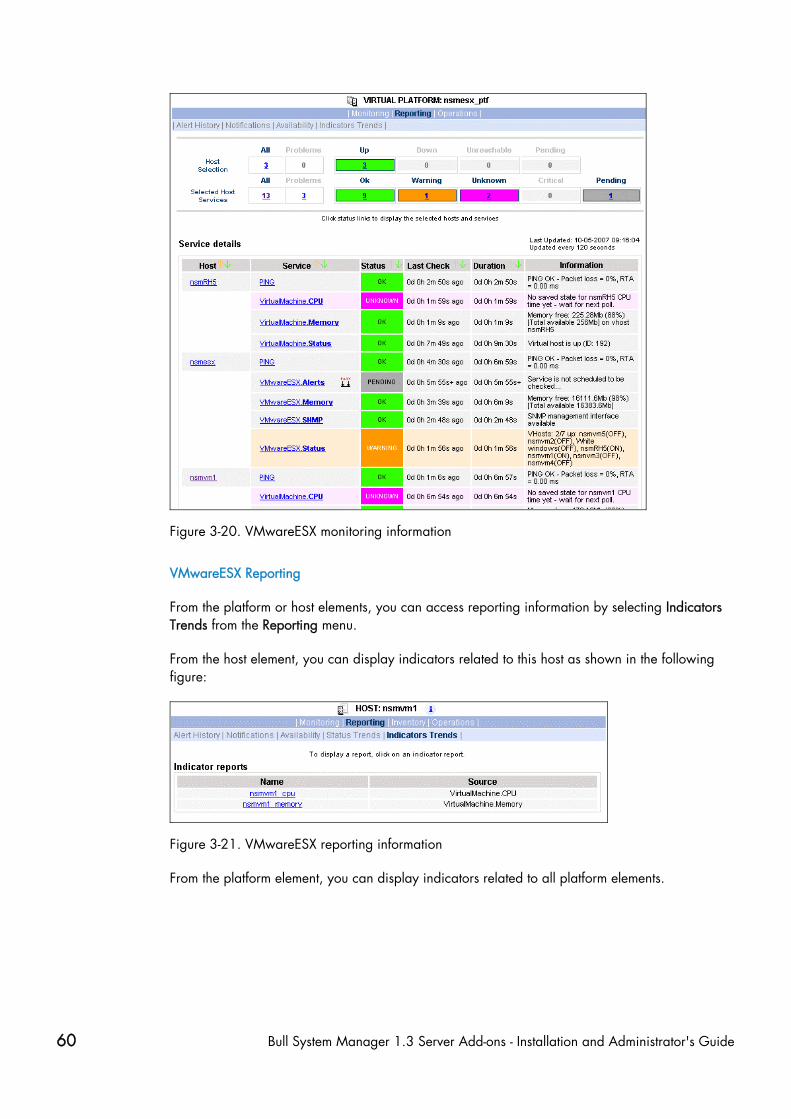
60 Bull System Manager 1.3 Server Add-ons - Installation and Administrator's Guide
Figure 3-20. VMwareESX monitoring information
VMwareESX Reporting
From the platform or host elements, you can access reporting information by selecting Indicators Trends from the Reporting menu.
From the host element, you can display indicators related to this host as shown in the following figure:
Figure 3-21. VMwareESX reporting information
From the platform element, you can display indicators related to all platform elements.

Chapter 3. Bull System Manager Server Add-ons Description 61
3.4.3 BSMVMwareVC for "Virtual Center" Management
3.4.3.1 Overview
The VMware Virtual Center or vCenter provides a central point of control for managing, monitoring, provisioning and migrating virtual machines (VM). The VMwareVC Add-on provides functional links to supervise the virtual machines and the ESX servers managed by vCenter
The VMwareVC Add-on retrieves VM and ESX monitoring information via the VI Perl toolkit API and allows the Web Virtual Interface to be launched from the Bull System Manager Console. It can be also process trap information sent by vCenter, if the vCenter alarms are configured to send it. The following figure shows the link between each component:
Figure 3-22. VMwareVC Add-on components
Note The SNMP agent of the vCenter server must be configured to send traps to the Bull System Manager Server. Web access requires specific configuration of the Web client. For detailed information about these procedures, see the VMware Infrastructure documentation available at http://www.vmware.com/support/pubs/vi_pubs.html.

62 Bull System Manager 1.3 Server Add-ons - Installation and Administrator's Guide
3.4.3.2 Bull System Manager Configuration
Virtual Center uses, as a top-level structure, the datacenter to group hosts and VMs that reside on the hosts.
This organization will be kept in the BSM Topology: VMs or hosts managed by a vCenter server are represented as element of a Datacenter platform (virtualization platform). The vCenter server is defined as a virtualization manager.
The configuration of the monitoring elements for the VMwareVC Add-on is easily performed. In one step, you define the set of Datacenters managed by a given vCenter Server, with the hosts and VMs they contain and all related monitoring services. Host representing the ESX server is defined with the OS: ESX. VM is represented by a BSM host with the model: VMware.
Notes • ESX servers can also be supervised with the VMwareESX add-ons if no VM is associated to it (see BSMVMwareESX for ”VMware ESX” Management, on page 49).
• VMs supervised with the VMwareESX cannot be supervised by the VMwareVC add-ons.
3.4.3.2.1 VirtualCenter managed DataCenter Platform
To configure a set of Datacenter Platforms managed by vCenter, click the VMware DataCenters link in the Virtualization part of the Topology domain. The list of all platforms configured appears, as in the following example:
Figure 3-23. VMware DataCenter Platforms page
It is possible: • To create a new set of platforms managed by vCenter by using the New button • To edit or delete a platform using the <Datacenter> link • To edit or delete a vCenter using the <Manager> link • To edit a virtual machine or ESX using the <hostname> link.
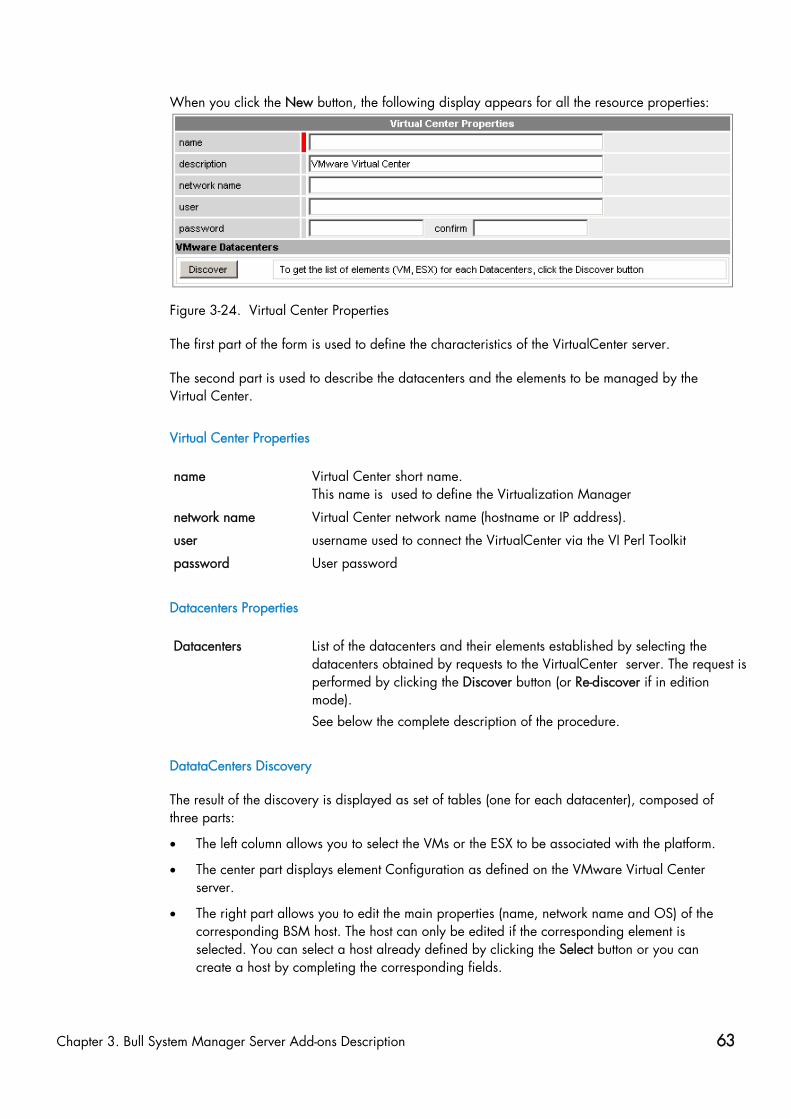
Chapter 3. Bull System Manager Server Add-ons Description 63
When you click the New button, the following display appears for all the resource properties:
Figure 3-24. Virtual Center Properties
The first part of the form is used to define the characteristics of the VirtualCenter server.
The second part is used to describe the datacenters and the elements to be managed by the Virtual Center.
Virtual Center Properties name Virtual Center short name.
This name is used to define the Virtualization Manager
network name Virtual Center network name (hostname or IP address).
user username used to connect the VirtualCenter via the VI Perl Toolkit
password User password
Datacenters Properties Datacenters List of the datacenters and their elements established by selecting the
datacenters obtained by requests to the VirtualCenter server. The request is performed by clicking the Discover button (or Re-discover if in edition mode). See below the complete description of the procedure.
DatataCenters Discovery
The result of the discovery is displayed as set of tables (one for each datacenter), composed of three parts:
• The left column allows you to select the VMs or the ESX to be associated with the platform.
• The center part displays element Configuration as defined on the VMware Virtual Center server.
• The right part allows you to edit the main properties (name, network name and OS) of the corresponding BSM host. The host can only be edited if the corresponding element is selected. You can select a host already defined by clicking the Select button or you can create a host by completing the corresponding fields.
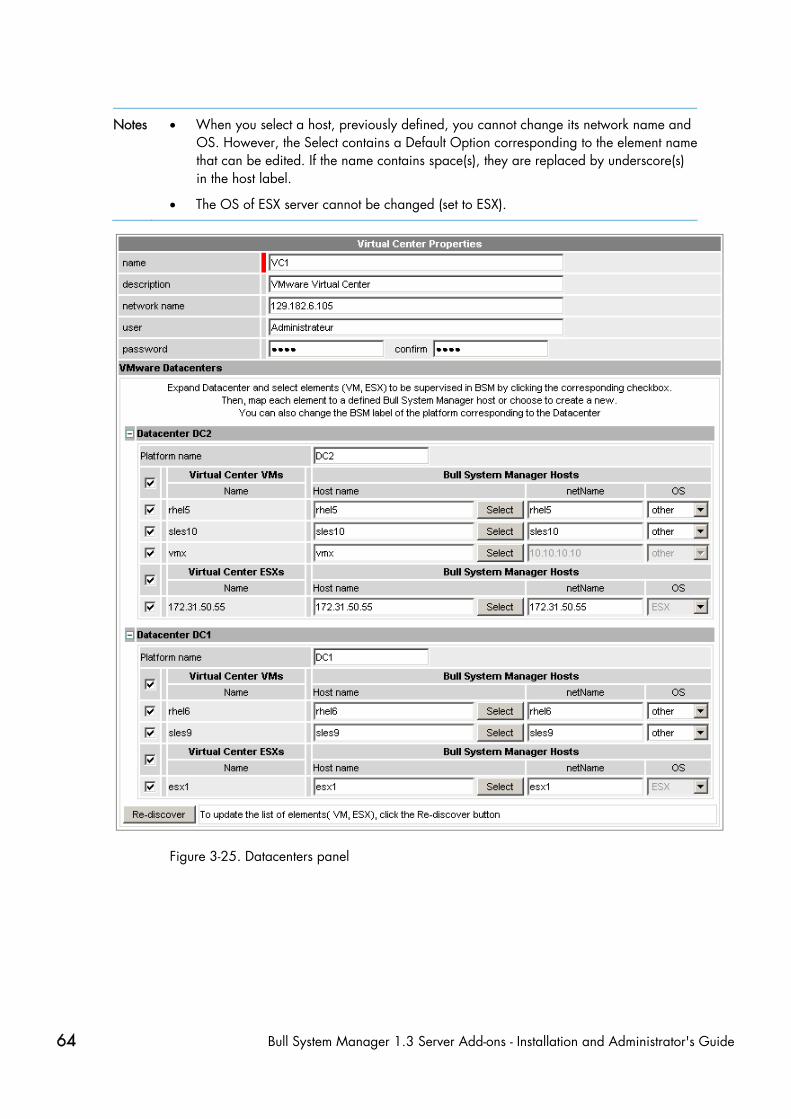
64 Bull System Manager 1.3 Server Add-ons - Installation and Administrator's Guide
Notes • When you select a host, previously defined, you cannot change its network name and OS. However, the Select contains a Default Option corresponding to the element name that can be edited. If the name contains space(s), they are replaced by underscore(s) in the host label.
• The OS of ESX server cannot be changed (set to ESX).
Figure 3-25. Datacenters panel

Chapter 3. Bull System Manager Server Add-ons Description 65
Datacenters Re-Discovery
Re-Discovery is required to check that the current BSM configuration still matches the Virtual Center configuration in order to: • Add an element not yet registered in the Datacenter Platform • Remove an element no longer defined in the Virtual Center configuration.
During the Re-discovery step, if the current configuration is not compatible with Virtual Center configuration, the invalid elements are displayed in red and the elements not referenced in the current BSM configuration are displayed in green.
Elements no longer defined in Virtual Center are automatically unchecked and will be removed from the platform when the form is validated. New elements must be explicitly checked to be added to the platform to be linked to the platform when the form is validated.
Note How to Add, Delete or Modify Datacenter elements is detailed in 67, on page 55.
When the Datacenter elements have been edited:
• Click OK to validate your edition
• Or click Cancel to return to Datacenter Platform pages without making any changes
• Or click Delete to remove the VirtualCenter and Datacenter platforms manged and maintain the hosts corresponding to the VMs and the ESX server
• Or click DeleteAll to remove the VirtualCenter, Datacenter platforms managed and the hosts corresponding to the VMs and the VMwareESX server.
Note Any changes made are shown in the Topology modification Window and requires confirmation: a page listing all modifications to be applied to the Topology configuration is displayed, as shown in the following figure.
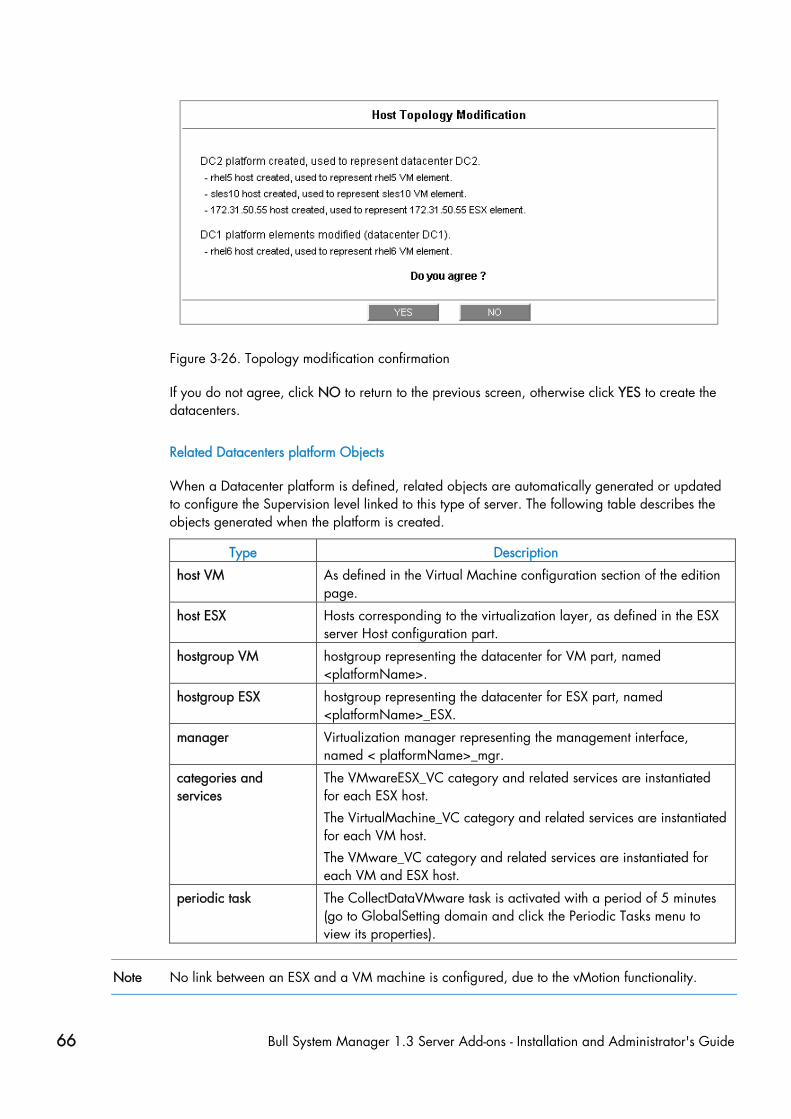
66 Bull System Manager 1.3 Server Add-ons - Installation and Administrator's Guide
Figure 3-26. Topology modification confirmation
If you do not agree, click NO to return to the previous screen, otherwise click YES to create the datacenters.
Related Datacenters platform Objects
When a Datacenter platform is defined, related objects are automatically generated or updated to configure the Supervision level linked to this type of server. The following table describes the objects generated when the platform is created.
Type Description
host VM As defined in the Virtual Machine configuration section of the edition page.
host ESX Hosts corresponding to the virtualization layer, as defined in the ESX server Host configuration part.
hostgroup VM hostgroup representing the datacenter for VM part, named <platformName>.
hostgroup ESX hostgroup representing the datacenter for ESX part, named <platformName>_ESX.
manager Virtualization manager representing the management interface, named < platformName>_mgr.
categories and services
The VMwareESX_VC category and related services are instantiated for each ESX host.
The VirtualMachine_VC category and related services are instantiated for each VM host.
The VMware_VC category and related services are instantiated for each VM and ESX host.
periodic task The CollectDataVMware task is activated with a period of 5 minutes (go to GlobalSetting domain and click the Periodic Tasks menu to view its properties).
Note No link between an ESX and a VM machine is configured, due to the vMotion functionality.

Chapter 3. Bull System Manager Server Add-ons Description 67
3.4.3.2.2 Datacenter Elements Edition
A VM or an ESX is represented by a host linked to the Datacenter Virtualization platform. It has properties linked to the platform, and also properties of a host object.
Adding, removing or modifying properties linked to the platform must be done using the VMware Datacenter platform Window.
Modification of host properties must be done using the Host Window.
Add an element (VM or ESX) to a datacenter
An element is added by checking the corresponding line in the platform Window, and by setting the host characteristics in the BSM Configuration table zone (fill in the corresponding fields or select a host that is already defined).
Note When you edit a Datacenter platform, only the elements defined as part of the Bull System Manager platform are displayed. To add an element, you must perform a Re-discovery to get the list of all elements defined in the datacenter.
Remove an element from a datacenter
Removing an element is performed by unchecking the corresponding line in the platform Window.
Notes • The corresponding host remains in the Bull System Manager definition with the model set to ‘other’. To delete it, click the Other Hosts link to get the list of all the Other Hosts configured, edit the corresponding host and click the Delete button.
• If all the elements of a platform are deleted, the platform itself is deleted.
Modify an element defined in a datacenter
To modify the name of a BSM host corresponding to an element, enter the new name in the corresponding field or select it in the list of hosts already defined in Bull System Manager by clicking the Select button.
To modify other characteristics, such as netName or OS, the Host edition form must be used.
Note To view the Host Window for the definition of elements corresponding to the virtual machine, click the Hostname link displayed in the global platforms page.
Delete all elements and corresponding hosts.
Use the DeleteAll button to delete all elements managed by a Virtual Center and corresponding hosts.

68 Bull System Manager 1.3 Server Add-ons - Installation and Administrator's Guide
3.4.3.2.3 Virtualization Supervision
As specified above, services are instantiated for each host defined in the Virtualization Platform. You can disable virtualization supervision for a service by editing the hostgroup or manager properties, or by editing each service (refer to the Bull System Manager Administration Guide for details).
Monitoring Services
Services Applied to the ESX
Categorie Service Description Check_command VMwareESX_VC Status Checks ESX server status check_esx_virtualcenter
VMwareESX_VC CPU Checks CPU usage as computed by vCenter
check_esx_virtualcenter
VMwareESX_VC Memory Checks Memory usage as computed by vCenter
check_esx_virtualcenter
VMware_VC Alerts Processes alerts received from vCenter
none (SNMP Trap receiver)
Services Applied to the VM Host
Categorie Service Description Check_command VirtualMachine_VC Status Checks VM status check_ vm_virtualcenter
VirtualMachine_VC CPU Checks CPU usage as computed by vCenter
check_vm_virtualcenter
VirtualMachine_VC Memory Checks Memory usage as computed by vCenter
check_vm_virtualcenter
VMware_VC Alerts Processes alerts received from vCenter
none (SNMP Trap receiver)
Monitoring services related to the VirtualCenter elements managed are automatically created when the Datacenters Window elements are modified. Theses services can be displayed and edited using the Services page in the Supervision domain, but only the attributes related to monitoring or notification can be edited.

Chapter 3. Bull System Manager Server Add-ons Description 69
Figure 3-27. VMwareESX service properties pane
Note During Platform definition, all services are defined and activated for each ESX server and VM selected. To deactivate monitoring for a service, set status for the Monitoring attributes to inactive.

70 Bull System Manager 1.3 Server Add-ons - Installation and Administrator's Guide
3.4.3.3 Nagios Check Commands
check_esx_virtualcenter
The configurable Bull System Manager service check command syntax is:
check_esx_virtualcenter!<vcenter-netname>!<esx_name>
See the check_virtualcenter.pl command in Appendix A for parameters details.
check_vm_virtualcenter
The configurable Bull System Manager service check command syntax is:
check_ vm_virtualcenter!<vcenter-netname>!<vm_name>
See the check_virtualcenter.pl command in Appendix A for parameters details.
mportant
Collect task: The check_virtualcenter.pl command uses information collected by a periodic task (see below). Failure in this process will result in "UNKNOWN" status for Nagios plugin. See the check_virtualcenter.pl command in Appendix A for examples.
3.4.3.4 Collect task
The collect task periodically schedules (each 5 minutes) the script collectVMvCenter.sh that requests all the information from the vCenter needed by the Nagios plugin, and stores it in a cache file. This task is enabled when at least one vCenter is configured in the BSM.
The script is localized in the <BSM Installation>/engine/bin directory and its execution is logged in the <BSM Installation>/engine/tmp/collectVMvCenter.log file.
mportant
Migrating from BSM 1.1.6: When migrating from BSM 1.1.6, the CollectDataVMware task must be enabled.
In GlobalSetting domain, click the Periodic Tasks menu and edit the CollectDataVMware task, the screen below is displayed:

Chapter 3. Bull System Manager Server Add-ons Description 71
Set the enable property to Yes and apply the changes. The modification will be taken into account the next time the task is Saved and Reloaded action.
3.4.3.5 Reporting Indicators
Reporting Indicators are defined for ESX and VM hosts. They obtain values from the corresponding monitoring services.
Indicators applied to ESX host:
Indicator Corresponding Service <esx_server>_CPU_vc VMwareESX_VC .CPU
<esx_server>_Memory_vc VMwareESX_VC .Memory
Indicators applied to VM host:
Indicator Corresponding Service <vm_name>_CPU_vc VirtualMachine_VC .CPU
<vm_name>_Memory_vc VirtualMachine_VC .Memory
Note During the definition of the Datacenter, all the indicators are defined and activated for the ESX server and for each VM. To deactivate the reporting for an indicator, set it to inactive. Beware, if you deactivate the corresponding service, the indicator will no longer be collected.

72 Bull System Manager 1.3 Server Add-ons - Installation and Administrator's Guide
3.4.3.6 Bull System Manager Console
VMwareVC Operation
From the Virtual Manager or from any Virtual Platform element, you can launch the Virtual Infrastructure Web Interface by selecting the following cascading menu:
Operation → Application → VMware vCenter Web Web
Figure 3-28. Virtual Center Web Access
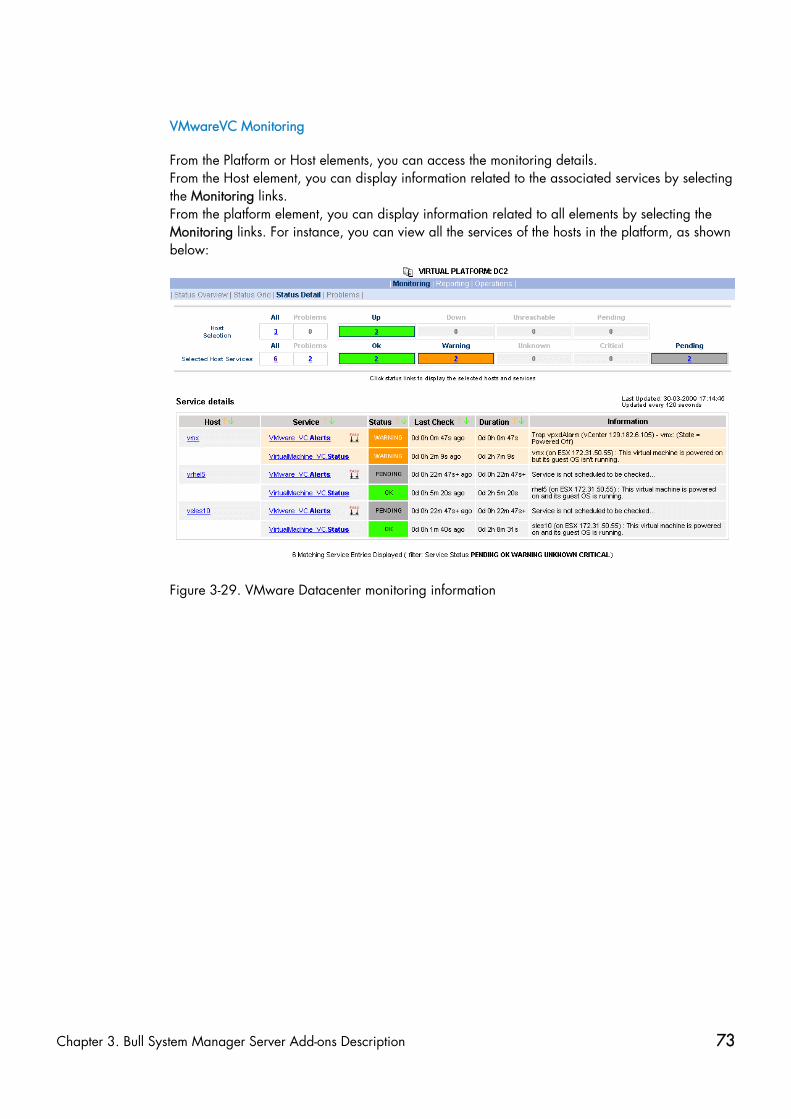
Chapter 3. Bull System Manager Server Add-ons Description 73
VMwareVC Monitoring
From the Platform or Host elements, you can access the monitoring details. From the Host element, you can display information related to the associated services by selecting the Monitoring links. From the platform element, you can display information related to all elements by selecting the Monitoring links. For instance, you can view all the services of the hosts in the platform, as shown below:
Figure 3-29. VMware Datacenter monitoring information

74 Bull System Manager 1.3 Server Add-ons - Installation and Administrator's Guide
VMwareVC Reporting
From the platform or Host elements, you can access reporting information by selecting Indicators Trends from the Reporting menu.
From the Host element, you can display indicators related to this host as shown below.
Figure 3-30. CPU Performance indicator for a Virtual Machine
From the platform element, you can display indicators related to all platform elements (VM and ESX host).
Chapter 3. Bull System Manager Server Add-ons Description 75
3.4.4 BSMEscalaLPAR "EscalaLPAR" Management
3.4.4.1 Overview
Dynamic logical partitioning (LPAR) is a system architecture delivered on Escala systems that is used to divide a single server into several completely independent virtual servers or logical partitions.
The HMC (Hardware Management Console) is a special-purpose system that provides management tools for controlling one or more Escala Privilege Line servers and associated logical partitions (LPARs). Management can be performed either through the HMC GUI or through the command-line interface (using a SSH connection to the HMC).
For system not managed by an HMC, Integrated Virtualization Manager (IVM) provides a local management of the partitions. IVM, which is part of the Virtual I/O Server, is a special purpose partition that provides virtual I/O resources for the other partitions.
The EscalaLPAR Add-on provides functional links to supervise the logical partitions by requesting the HMC system or the IVM component.
mportant
Escala Supervision with HMC or IVM requires the setting of a non-prompt SSH connection between the Bull System Manager Server and the manager. Private key for the Bull System Manager server is automatically generated at the installation of Bull System Manager server under <BSM installation directory>/engine/etc/ssh (see Appendix F for detailed information). To allow a non-prompt connection between the BSM Server and the HMC, the public key must be installed on the HMC or IVM hosting server. Refer to the HMC or IVM documentation to see how to install the key.
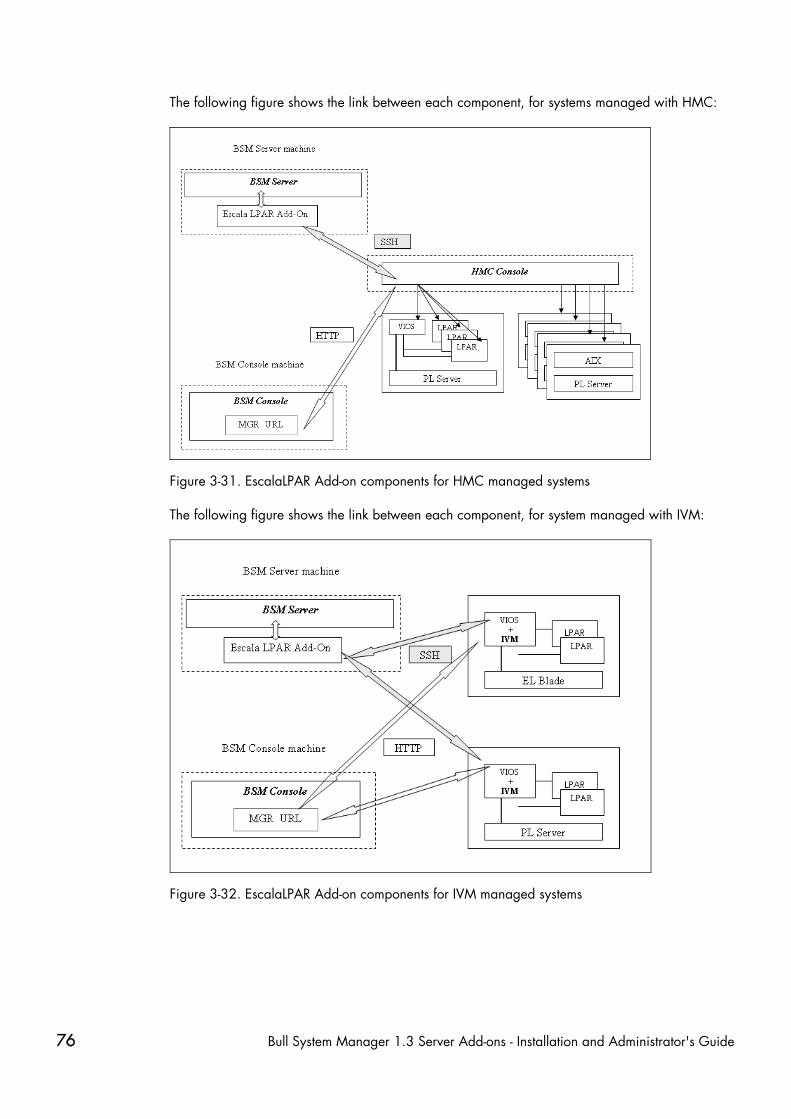
76 Bull System Manager 1.3 Server Add-ons - Installation and Administrator's Guide
The following figure shows the link between each component, for systems managed with HMC:
Figure 3-31. EscalaLPAR Add-on components for HMC managed systems
The following figure shows the link between each component, for system managed with IVM:
Figure 3-32. EscalaLPAR Add-on components for IVM managed systems
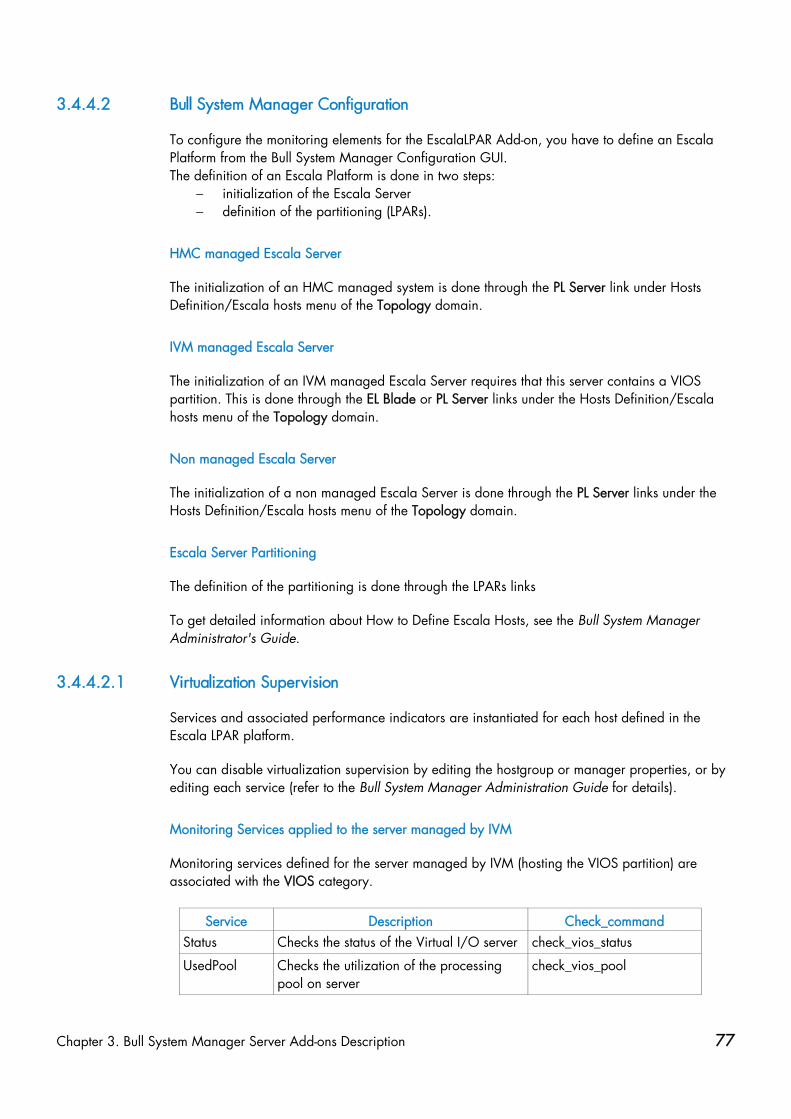
Chapter 3. Bull System Manager Server Add-ons Description 77
3.4.4.2 Bull System Manager Configuration
To configure the monitoring elements for the EscalaLPAR Add-on, you have to define an Escala Platform from the Bull System Manager Configuration GUI. The definition of an Escala Platform is done in two steps:
− initialization of the Escala Server − definition of the partitioning (LPARs).
HMC managed Escala Server
The initialization of an HMC managed system is done through the PL Server link under Hosts Definition/Escala hosts menu of the Topology domain.
IVM managed Escala Server
The initialization of an IVM managed Escala Server requires that this server contains a VIOS partition. This is done through the EL Blade or PL Server links under the Hosts Definition/Escala hosts menu of the Topology domain.
Non managed Escala Server
The initialization of a non managed Escala Server is done through the PL Server links under the Hosts Definition/Escala hosts menu of the Topology domain.
Escala Server Partitioning
The definition of the partitioning is done through the LPARs links
To get detailed information about How to Define Escala Hosts, see the Bull System Manager Administrator's Guide.
3.4.4.2.1 Virtualization Supervision
Services and associated performance indicators are instantiated for each host defined in the Escala LPAR platform.
You can disable virtualization supervision by editing the hostgroup or manager properties, or by editing each service (refer to the Bull System Manager Administration Guide for details).
Monitoring Services applied to the server managed by IVM
Monitoring services defined for the server managed by IVM (hosting the VIOS partition) are associated with the VIOS category.
Service Description Check_command Status Checks the status of the Virtual I/O server check_vios_status
UsedPool Checks the utilization of the processing pool on server
check_vios_pool

78 Bull System Manager 1.3 Server Add-ons - Installation and Administrator's Guide
Monitoring Services applied to the server managed by HMC
Monitoring services defined for the PL server managed by an HMC are associated with the PowerHypervisor category.
Service Description Check_command UsedPool Checks the utilization of the
processing pool on the server ceck_cec_used_pool
Monitoring Services Applied to the LPAR Host
Monitoring services defined for LPAR hosts are associated with the VirtualMachine category.
Service Description Check_command Status Checks LPAR status check lpar_status
UsedCPU Checks the utilization of the entitled CPU by the partition
check_lpar_used_cpu
Monitoring services related to Escala Platform elements are automatically created when the platform details are edited. Theses services can be displayed and edited from the Services page in the Supervision domain, but only the attributes related to monitoring or notification can be edited.

Chapter 3. Bull System Manager Server Add-ons Description 79
Figure 3-33. VIOS.UsedPool Service Properties pane
Note During Platform definition, all services are defined and activated for the server and for each LPAR. To deactivate the monitoring of a service, edit it and set its status (Monitoring attributes part) to inactive.
Reporting indicators
A performance indicator is defined for the Escala server to describe the utilization of the processing pool. This indicator is identified as <escalaServer>_UsedPool.
A reporting indicator is defined for each LPAR to describe the utilization of the CPU permitted for a given LPAR. This indicator is identified as <lpar_host>_UsedCPU.

80 Bull System Manager 1.3 Server Add-ons - Installation and Administrator's Guide
Figure 3-34. Reporting indicators
Note The collection of all these indicators is activated during the Platform definition. To deactivate some of them, edit the indicator and set its status to inactive.
3.4.4.3 Nagios Check Commands
check_vios_status
The configurable BSM service check command syntax is:
check_vios_status!<ssh_user>!<identity_file>
See the check_NSM_escala_lpar command in Appendix A for parameters details.
check_vios_used_pool
The configurable BSM service check command syntax is:
check_vios_used_pool!<ssh_user>!<identity_file>!<sample_time>!<warning_threshold>!<critical_threshold>
See the check_NSM_escala_lpar command in Appendix A for parameters details.
check_cec_used_pool
The configurable BSM service check command syntax is:
check_cec_used_pool!<hmc_netname>!<ssh_user>!<identity_file>!<cec_name>!<sample_time>!<warning_threshold>!<critical_threshold>
See the check_NSM_escala_lpar command in Appendix A for parameters details.
check_lpar_status
The configurable BSM service check command syntax is:
check_lpar_status!<mgr_type>!<mgr_netName>!<ssh_user>!<identity_file>!<system_name>!<lpar_name>
See the check_NSM_ escala_lpar command in Appendix A for parameters details.

Chapter 3. Bull System Manager Server Add-ons Description 81
check_lpar_used_cpu
The configurable BSM service check command syntax is:
check_vios_lpar_used_cpu!<mgr_type>!<mgr_netName>!<ssh_user>!<identity_file>! <system_name>!<lpar_name>!<sample_time>!<warning_threshold>!<critical_threshold>
See the check_NSM_ escala_lpar command in Appendix A for parameters details.
3.4.4.4 Bull System Manager Console
3.4.4.4.1 Operation
From the Virtual Manager or from any element of the Escala Platform:
• If the system is managed by HMC, you can launch the HMC Web Interface by selecting the cascading menu below:
Operation → Virtualization → HMC
Figure 3-35. HMC activation from Bull System Manager Console

82 Bull System Manager 1.3 Server Add-ons - Installation and Administrator's Guide
• If the system is managed by IVM, you can launch the IVM Web Interface by selecting the cascading menu below:
Operation → Virtualization → IVM
Figure 3-36. IVM activation from Bull System Manager Console

Chapter 3. Bull System Manager Server Add-ons Description 83
3.4.4.4.2 Escala Supervision
To see all theservices related to an HMC managed Escala server, use the Virtual Managers view, click the platform node and select Monitoring/Status detail menu. The following page is displayed:
Figure 3-37. Escala HMC reported Supervision
To see all services related to an IVM managed Escala server, use the Virtual Managers view, click the platform node and select Monitoring/Status detail menu. The following page is displayed:
Figure 3-38. Escala IVM reported supervision
84 Bull System Manager 1.3 Server Add-ons - Installation and Administrator's Guide
3.4.4.4.3 Escala Reporting
From the host hosting the Vios partition or from host representing the hardware of HMC managed PL Escala, you can display reporting indicators to see the changes for the utilization of the processing pool.
From any LPAR host, you can display reporting indicators to see the changes in use for the partition CPU.

Chapter 3. Bull System Manager Server Add-ons Description 85
3.5 Bull Products Server Add-ons
3.5.1 BSMDD4A for Bull “Dynamic Domains For Applications” Management
Dynamic Domains For Applications (DDFA) software is a tool that can be used on the Linux operating system to simulate the partitioning of a multi-CPU machine at application level. Dynamic Domains for Applications can be used with standard Linux distributions and can be managed using the Webmin standard administration tool. See the Dynamic Domains for Applications User’s Guide (ref 86 A2 63ER) for more information. You can install DDFA from the Bull Extension Pack for RedHat CD.
Note DDFA runs only on Linux machines and uses a Webmin module for its management. You can download the prerequisite Webmin package from the web site: http://www.webmin.com
WARNING: You have to verify the URL (“http://<hostname>:10000/ddomains/xml.cgi”) used by BSM nagios plugin is trusted by the targeted webmin..
This Add-on creates monitoring links between Bull System Manager and the DDFA management webmin module.
The following figure shows the different components used for monitoring:
Figure 3-39. DDFA Monitoring Components
Bull System Manager Server Add-ons provide the default Bull product categories, as below.

86 Bull System Manager 1.3 Server Add-ons - Installation and Administrator's Guide
3.5.1.1 Default Categories & Services Proposed for Linux Hosts
Targeted OS Model Category Service Check command Linux Any DynamicDomains All check_dd4a
Default
Table 3-11. DDF4 categories and services
3.5.1.2 DynamicDomains Category
All Service
For Linux hosts with the Dynamic Domains management tool. This service dynamically checks the global status reported by the associated webmin module for all the Dynamic Domains defined.
Note There is no need to reconfigure the tool to survey newly defined Dynamic Domains.
default Service
For Linux hosts with the Dynamic Domains management tool. This service checks the status of the default Dynamic Domain.
Note When creating a new Dynamic Domain, statically clone the default monitoring service to survey the new dynamic domain.
3.5.1.3 check_DynamicDomains (Linux OS) Nagios Command
The configurable Bull System Manager service check command syntax is:
check_DynamicDomains!<{ALL|<DomainName>}
Default syntax for DynamicDomains.All (the service name as defined in Nagios configuration based on the category name and service name defined in BSM configuration):
check_DynamicDomains!ALL
Default syntax for DynamicDomains.default (the service name as defined in Nagios configuration based on the category name and service name defined in BSM configuration):
check_DynamicDomains!default

Chapter 3. Bull System Manager Server Add-ons Description 87
3.5.2 BSMBVS for Bull Video Services Management
Bull Video Services (BVS) software is a tool that can be used with standard Linux distributions and Windows and can be managed using Web server.
See the Bull Video Services User’s Guide for more information.
You can install BVS from the Bull Video Services CD (ref 36673900-xxx).
Note BSMBVS supports only BVS version 4.x on Linux machines and uses an non-secure HTTP access to integrated Web server for management. The access to BVS administration Web tool through the BSM Console/Operations menu is not implemented.
This Add-on creates monitoring links between Bull System Manager and the BVS management Web server module.
The following figure shows the different monitoring components:
Figure 3-40. BVS Web Server Monitoring Components
Targeted OS Model Category Services Check command
Linux
any BullVideoServices Streaming Recording Datagrams
check_BullVideoServices
Table 3-12. Bull Video Services categories and services

88 Bull System Manager 1.3 Server Add-ons - Installation and Administrator's Guide
3.5.2.1 BullVideoServices Category
Streaming For NovaScale hosts acting as a Bull video server. This service checks the status of the video streaming service.
Recording For NovaScale hosts acting as a Bull video server. This service checks the status of the video recording service.
Datagrams For NovaScale hosts acting as a Bull video server. This service checks the status of the video datagram errors.
3.5.2.2 check_BVS Nagios Command
The configurable Bull System Manager service check command syntax is:
check_BVS!<serviceName>
See the check_BVS command, in Appendix A for parameters details.
For instance, Default syntax for BullVideoService.Streaming (the service name as defined in Nagios configuration based on the category name and service name defined in BSM configuration) is:
check_BVS!Streaming
3.5.3 BSMJOnAS for JOnAS Management
3.5.3.1 JOnAS Overview
JOnAS is a pure Java, open source application server. Its high modularity allows it to be used as:
• A J2EE server, for deploying and running EAR applications (i.e. applications composed of both web and ejb components)
• An EJB container, for deploying and running EJB components (e.g. for applications without a web interface or when using JSP/Servlet engines that are not integrated as a JOnAS container)
• A web container, for deploying and running JSPs and Servlets (e.g. for applications without EJB components).
The JOnAS architecture is illustrated in the following figure, which shows the WEB and EJB containers that rely on JOnAS services.

Chapter 3. Bull System Manager Server Add-ons Description 89
Figure 3-41. JOnAS Architecture
See http://jonas.objectweb.org/doc/index.html for more information.
3.5.3.2 JOnAS Domain Topology
A JOnAS management domain is composed of a set of JOnAS servers that are running under the same management authority. All the servers in the domain must have a distinct server name and a common domain name.
The servers in a domain can be administered by a management application running on a server playing the role of administrator or master. The managed servers play the role of slaves.
A default domain configuration is provided in $JONAS_ROOT/conf/domain.xml. This configuration corresponds to a domain named jonas managed by a server also named jonas.
JOnAS administrators are responsible for the configuration and administration of JOnAS servers running within a management domain.
3.5.3.3 JOnAS Monitoring Information
Bull System Manager retrieves domain and server monitoring information from JOnAS (administrator or master) server via web services.
Note Web services are operational only if the conf/server.xml file on JOnAS (administrator or master) server is correctly configured as below: The localhost value must be replaced by the DNS host name.
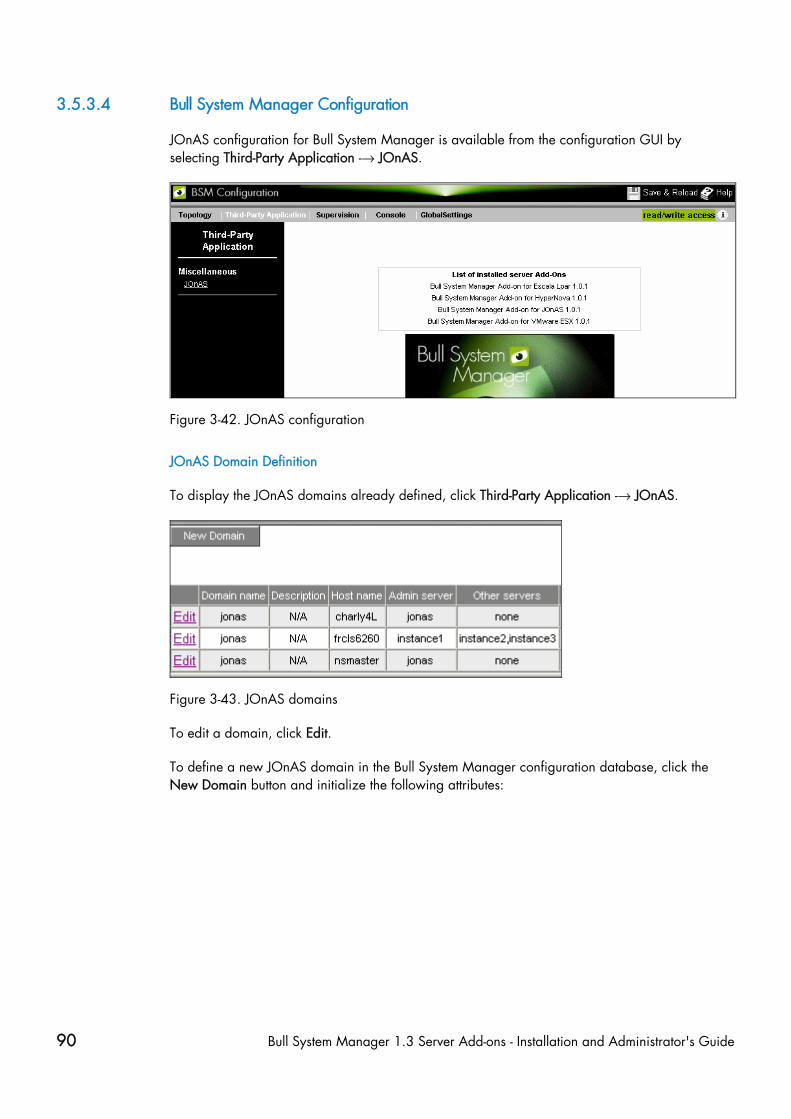
90 Bull System Manager 1.3 Server Add-ons - Installation and Administrator's Guide
3.5.3.4 Bull System Manager Configuration
JOnAS configuration for Bull System Manager is available from the configuration GUI by selecting Third-Party Application -→ JOnAS.
Figure 3-42. JOnAS configuration
JOnAS Domain Definition
To display the JOnAS domains already defined, click Third-Party Application -→ JOnAS.
Figure 3-43. JOnAS domains
To edit a domain, click Edit.
To define a new JOnAS domain in the Bull System Manager configuration database, click the New Domain button and initialize the following attributes:

Chapter 3. Bull System Manager Server Add-ons Description 91
Figure 3-44. JOnAS properties
domain name name of JOnAS domain
description description of the domain
Domain information access
host name name of the host
port number port number
user name name of the user
password password
Domain monitored Servers
admin server name name of JOnAS administator or master server
master server master server flag
If the master server flag is set to Yes, the Get Servers button is displayed:

92 Bull System Manager 1.3 Server Add-ons - Installation and Administrator's Guide
Click the Get Servers button to list all the servers belonging to the specified domain:
other servers the selected servers will be monitored by Bull System Manager.
3.5.3.5 JOnAS Category and Service
The definition of a domain creates or updates a JOnAS category and creates a service for the JOnAS server identified by the JOnAS server name.
Figure 3-45. JOnAS category and services
The check_NSM_JOnAS command defined for the service returns the state of the server (RUNNING, STOPPED, FAILED, UNREACHABLE). If the server is running, the following attributes are returned:
• Threads count • Memory allocated and used • HTTP requests count • Committed transactions count

Chapter 3. Bull System Manager Server Add-ons Description 93
3.5.3.6 JOnAS Reporting Indicators
Threads and MemoryUsed indicators are created for each JOnAS service.
• The Threads indicator returns the current threads count. • The MemoryUsed indicator returns the current memory used.
Figure 3-46. JOnAS indicators
3.5.3.7 Bull System Manager Console
JOnAS Monitoring Representation
The JOnAS category groups services monitoring for all the servers in the domain.
Figure 3-47. JOnAS category view
Launching the jonasAdmin Application
The JOnAS administration tool, jonasAdmin, can be launched contextually from a Service Node on the Bull System Manager console by clicking: Operations → Application → jonasAdmin

94 Bull System Manager 1.3 Server Add-ons - Installation and Administrator's Guide
Figure 3-48. jonasAdmin launching
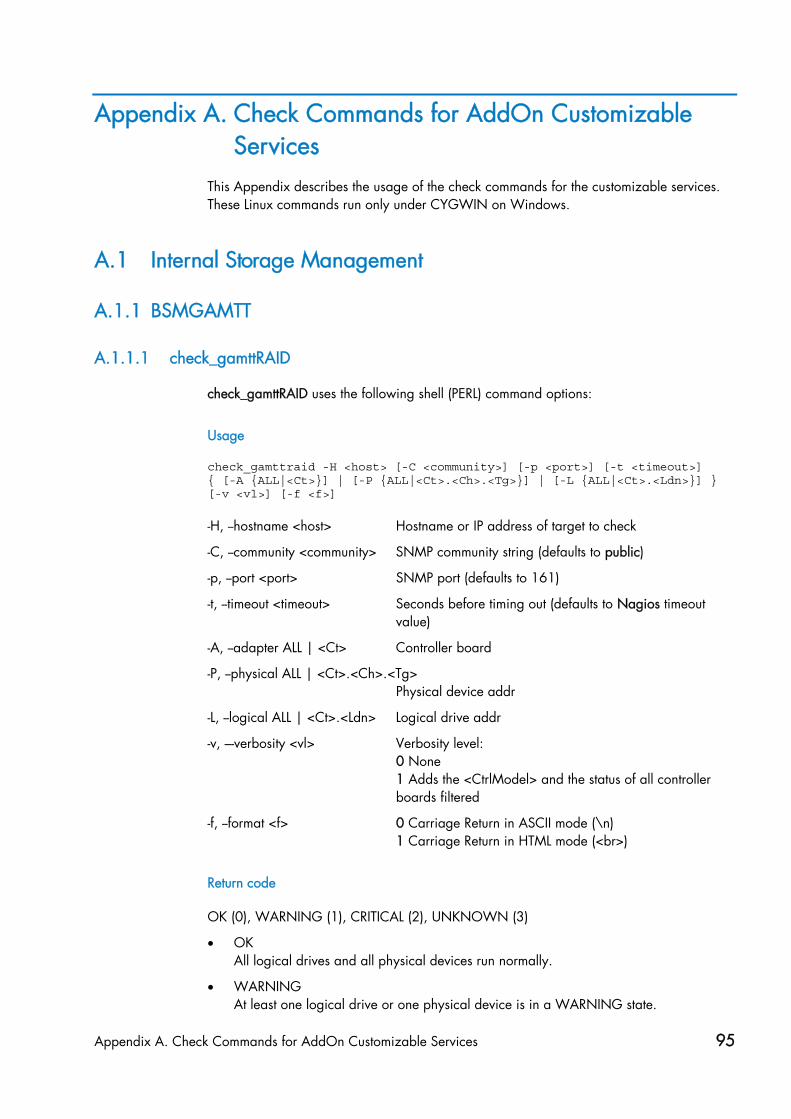
Appendix A. Check Commands for AddOn Customizable Services 95
Appendix A. Check Commands for AddOn Customizable Services
This Appendix describes the usage of the check commands for the customizable services. These Linux commands run only under CYGWIN on Windows.
A.1 Internal Storage Management
A.1.1 BSMGAMTT
A.1.1.1 check_gamttRAID
check_gamttRAID uses the following shell (PERL) command options:
Usage
check_gamttraid -H <host> [-C <community>] [-p <port>] [-t <timeout>] { [-A {ALL|<Ct>}] | [-P {ALL|<Ct>.<Ch>.<Tg>}] | [-L {ALL|<Ct>.<Ldn>}] } [-v <vl>] [-f <f>]
-H, --hostname <host> Hostname or IP address of target to check
-C, --community <community> SNMP community string (defaults to public)
-p, --port <port> SNMP port (defaults to 161)
-t, --timeout <timeout> Seconds before timing out (defaults to Nagios timeout value)
-A, --adapter ALL | <Ct> Controller board
-P, --physical ALL | <Ct>.<Ch>.<Tg> Physical device addr
-L, --logical ALL | <Ct>.<Ldn> Logical drive addr
-v, –-verbosity <vl> Verbosity level: 0 None 1 Adds the <CtrlModel> and the status of all controller boards filtered
-f, --format <f> 0 Carriage Return in ASCII mode (\n) 1 Carriage Return in HTML mode (<br>)
Return code
OK (0), WARNING (1), CRITICAL (2), UNKNOWN (3)
• OK All logical drives and all physical devices run normally.
• WARNING At least one logical drive or one physical device is in a WARNING state.

96 Bull System Manager 1.3 Server Add-ons - Installation and Administrator's Guide
• CRITICAL At least one logical drive or one physical device is in a CRITICAL state.
• UNKNOWN All other types of processing errors (bad parameter, no response, and so on).
Note In the case of multiple errors, the global state will be the most severe one; CRITICAL > WARNING > OK.
Output
A string composed with a global state descriptor followed, if they exist, by error states of the components concerned (controller, Logical Device, Physical Device).
global state descriptor:
The first line shows the global state. The syntax is: GAMTT RAID [CT |PD |LD ]<GlobalStatus>
”CT ” if ”-A”. ”PD ” if ”-P”. ”LD ” if ”-L”.
state descriptor by controller
These may be present after the global state descriptor if an error exists.
The syntax is: [ CT(Ct<Ct>) <CtrlModel> <CtrlStatus> [{LD(Ct<Ct> Nu<Ldn>) <LDType> <LDStatus>[, ] …}] [{PD(Ct<Ct> Ch<Ch> Tg<Tg>) <PDType> <PDStatus>[, ] …}] …]
<GlobalStatus> most severe status detected <CtrlModel> controller model <CtrlStatus> most severe state detected for an element of this controller (LD and PD) <Ct> controller number <Ldn> logical drive number <LDType> logical drive type: RAIDx or JBOD <LDStatus> logical drive status <Ct> controller number <Ch> channel number <Tg> target number <PDType> physical device type: Disk, Processor, Ctrl Channel, � <PDStatus> physical device status

Appendix A. Check Commands for AddOn Customizable Services 97
Examples:
• If global state is OK: > check_gamttraid -H <host> GAMTT RAID OK >
> check_gamttraid -H <host> -P 0.0.1 GAMTT RAID PD OK >
> check_gamttraid -H <host> -L 0.0 GAMTT RAID LD OK >
> check_gamttraid -H <host> –v 1 GAMTT RAID OK CT(Ct0) MegaRAID Ultra320-2x OK CT(Ct1) DAC960FFX2 OK CT(Ct2) MegaRAID Ultra320-2x OK >
> check_gamttraid -H <host> -A 1 –v 1 GAMTT RAID CT OK CT(Ct1) DAC960FFX2 OK >
• If global state is CRITICAL or WARNING, only the elements concerned are displayed: > check_gamttraid -H <host> GAMTT RAID CRITICAL CT(Ct0) MegaRAID Ultra320-2x CRITICAL PD(Ct0 Ch0 Tg1) Disk Dead >
> check_gamttraid -H <host> -L 0.1 GAMTT RAID LD CRITICAL CT(Ct0) MegaRAID Ultra320-2x CRITICAL LD(Ct0 Nu1) RAID5 Critical >
• If return code is UNKNOWN: > check_gamttraid -H <host> GAMTT RAID UNKNOWN - snmp query timed out >

98 Bull System Manager 1.3 Server Add-ons - Installation and Administrator's Guide
A.1.2 BSMLSICIM
A.1.2.1 check_LSICIM
check_LSICIM uses the following shell (PERL) command options:
Usage
check_LSICIM –H <host> [-C <ctrlname>]
-H, --hostname <host> Hostname or IP address of target to check
-C, --ctrlname <ctrlname> Name of the controller to check
Note The name of the controller must be protected with a quotation mark if the name contains blank characters.
Return code
OK (0), WARNING (1), CRITICAL (2), UNKNOWN (3)
• OK: All controllers run normally.
• WARNING: At least one controllers is in a WARNING state.
• CRITICAL: At least one controllers is in a CRITICAL state.
• UNKNOWN All other types of processing errors (bad parameter, no response, etc.).
Note In the case of multiple errors, the global state will be the most severe one; CRITICAL > WARNING > OK.
Output
A string indicates the state of mirroring followed, where applicable, by the component error states (controller, Logical Device, Physical Device) concerned.
If the GlobalStatus determined by the most severe status of components is not OK, the state of the component is reported with the following format:
[CT(Ct<Ct>) <CtrlName> <CtrlStatus> [{> LD(Ct<Ct> Nu<Ldn>) <LDType> <LDStatus>[, ] …}] [{ - PD(Ct<Ct> Ch<Ch> Tg<Tg>) <PDManufacturer> <PDModel> <PDStatus>[, [{> PD(Ct<Ct> Ch<Ch> Tg<Tg>) <PDManufacturer> <PDModel> <PDStatus>[, ] …}]
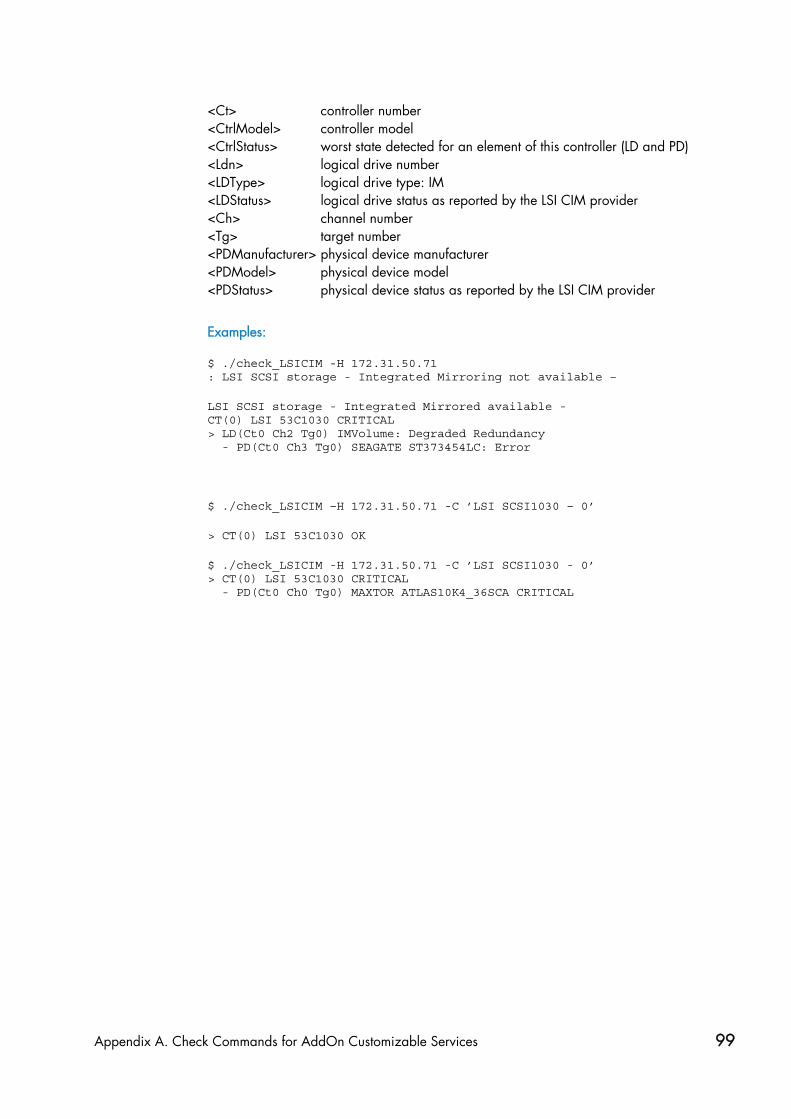
Appendix A. Check Commands for AddOn Customizable Services 99
<Ct> controller number <CtrlModel> controller model <CtrlStatus> worst state detected for an element of this controller (LD and PD) <Ldn> logical drive number <LDType> logical drive type: IM <LDStatus> logical drive status as reported by the LSI CIM provider <Ch> channel number <Tg> target number <PDManufacturer> physical device manufacturer <PDModel> physical device model <PDStatus> physical device status as reported by the LSI CIM provider
Examples:
$ ./check_LSICIM -H 172.31.50.71 : LSI SCSI storage - Integrated Mirroring not available –
LSI SCSI storage - Integrated Mirrored available - CT(0) LSI 53C1030 CRITICAL > LD(Ct0 Ch2 Tg0) IMVolume: Degraded Redundancy - PD(Ct0 Ch3 Tg0) SEAGATE ST373454LC: Error
$ ./check_LSICIM –H 172.31.50.71 -C ’LSI SCSI1030 – 0’
> CT(0) LSI 53C1030 OK
$ ./check_LSICIM -H 172.31.50.71 -C ’LSI SCSI1030 - 0’ > CT(0) LSI 53C1030 CRITICAL - PD(Ct0 Ch0 Tg0) MAXTOR ATLAS10K4_36SCA CRITICAL
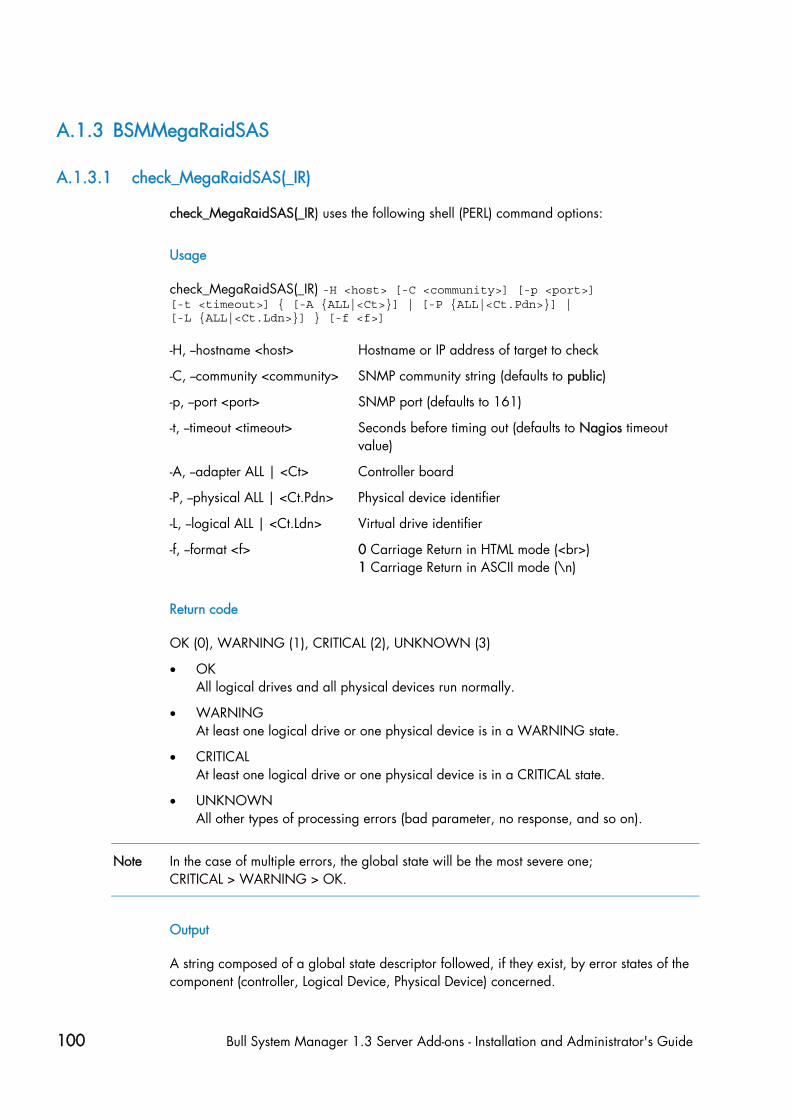
100 Bull System Manager 1.3 Server Add-ons - Installation and Administrator's Guide
A.1.3 BSMMegaRaidSAS
A.1.3.1 check_MegaRaidSAS(_IR)
check_MegaRaidSAS(_IR) uses the following shell (PERL) command options:
Usage
check_MegaRaidSAS(_IR) -H <host> [-C <community>] [-p <port>] [-t <timeout>] { [-A {ALL|<Ct>}] | [-P {ALL|<Ct.Pdn>}] | [-L {ALL|<Ct.Ldn>}] } [-f <f>]
-H, --hostname <host> Hostname or IP address of target to check
-C, --community <community> SNMP community string (defaults to public)
-p, --port <port> SNMP port (defaults to 161)
-t, --timeout <timeout> Seconds before timing out (defaults to Nagios timeout value)
-A, --adapter ALL | <Ct> Controller board
-P, --physical ALL | <Ct.Pdn> Physical device identifier
-L, --logical ALL | <Ct.Ldn> Virtual drive identifier
-f, --format <f> 0 Carriage Return in HTML mode (<br>) 1 Carriage Return in ASCII mode (\n)
Return code
OK (0), WARNING (1), CRITICAL (2), UNKNOWN (3)
• OK All logical drives and all physical devices run normally.
• WARNING At least one logical drive or one physical device is in a WARNING state.
• CRITICAL At least one logical drive or one physical device is in a CRITICAL state.
• UNKNOWN All other types of processing errors (bad parameter, no response, and so on).
Note In the case of multiple errors, the global state will be the most severe one; CRITICAL > WARNING > OK.
Output
A string composed of a global state descriptor followed, if they exist, by error states of the component (controller, Logical Device, Physical Device) concerned.
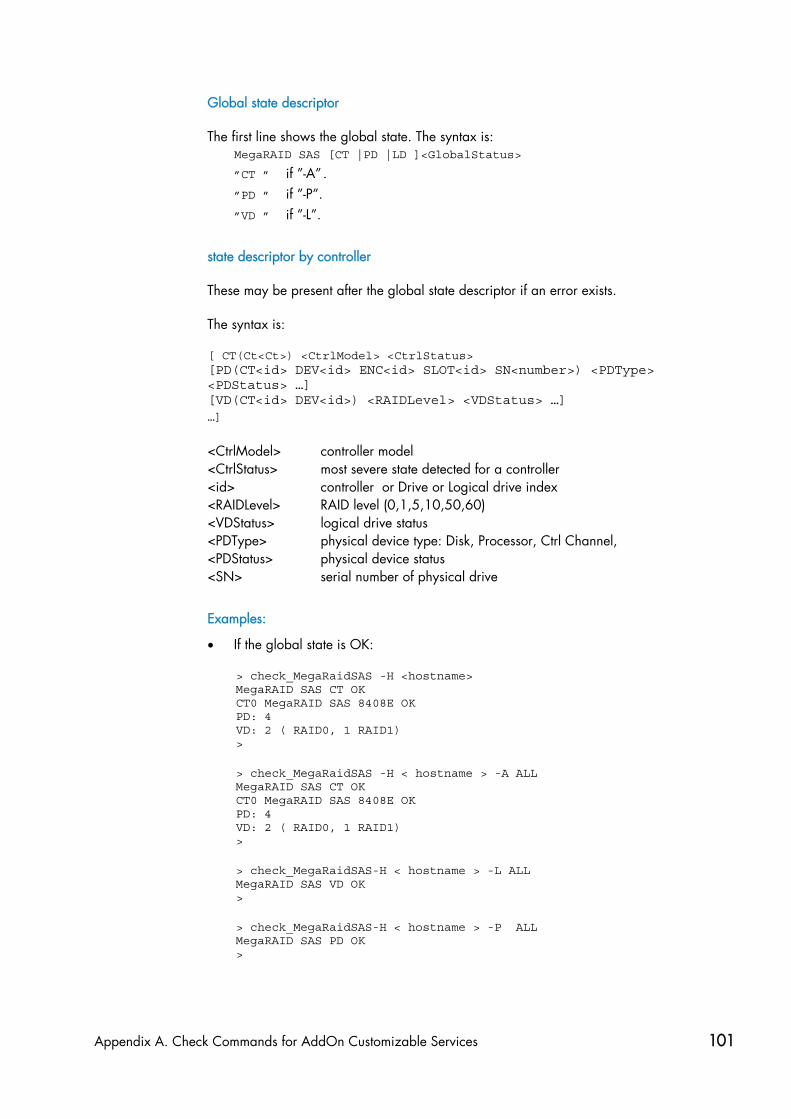
Appendix A. Check Commands for AddOn Customizable Services 101
Global state descriptor
The first line shows the global state. The syntax is: MegaRAID SAS [CT |PD |LD ]<GlobalStatus>
”CT ” if ”-A”. ”PD ” if ”-P”. ”VD ” if ”-L”.
state descriptor by controller
These may be present after the global state descriptor if an error exists.
The syntax is:
[ CT(Ct<Ct>) <CtrlModel> <CtrlStatus> [PD(CT<id> DEV<id> ENC<id> SLOT<id> SN<number>) <PDType> <PDStatus> …] [VD(CT<id> DEV<id>) <RAIDLevel> <VDStatus> …] …]
<CtrlModel> controller model <CtrlStatus> most severe state detected for a controller <id> controller or Drive or Logical drive index <RAIDLevel> RAID level (0,1,5,10,50,60) <VDStatus> logical drive status <PDType> physical device type: Disk, Processor, Ctrl Channel, <PDStatus> physical device status <SN> serial number of physical drive
Examples:
• If the global state is OK:
> check_MegaRaidSAS -H <hostname> MegaRAID SAS CT OK CT0 MegaRAID SAS 8408E OK PD: 4 VD: 2 ( RAID0, 1 RAID1) >
> check_MegaRaidSAS -H < hostname > -A ALL MegaRAID SAS CT OK CT0 MegaRAID SAS 8408E OK PD: 4 VD: 2 ( RAID0, 1 RAID1) >
> check_MegaRaidSAS-H < hostname > -L ALL MegaRAID SAS VD OK >
> check_MegaRaidSAS-H < hostname > -P ALL MegaRAID SAS PD OK >

102 Bull System Manager 1.3 Server Add-ons - Installation and Administrator's Guide
> check_MegaRaidSAS-H < hostname > -P 0.2 MegaRAID SAS PD OK >
> check_MegaRaidSAS-H < hostname > -L 0.1 MegaRAID SAS VD OK >
• If the global state is CRITICAL or WARNING, only the elements concerned are displayed:
> check_MegaRaidSAS -H <hostname> -L ALL MegaRAID SAS VD WARNING VD(CT0 DEV0) RAID1 degraded VD(CT0 DEV2) RAID1 degraded> >
> check_MegaRaidSAS -H <hostname> MegaRAID SAS CT CRITICAL CT0 MegaRAID SAS 8408E CRITICAL PD: 4 VD: 2 ( RAID0, 1 RAID1) PD(CT0 DEV0 ENC1 SLOT0 SN50010b90000972e2) DISK offline> VD(CT0 DEV0) RAID1 degraded VD(CT0 DEV1) RAID0 offline> >
• If the return code is UNKNOWN:
> check_MegaRaidSAS-H <hostname> MegaRAID SAS UNKNOWN - no MegaRAID SAS Adapter present
>
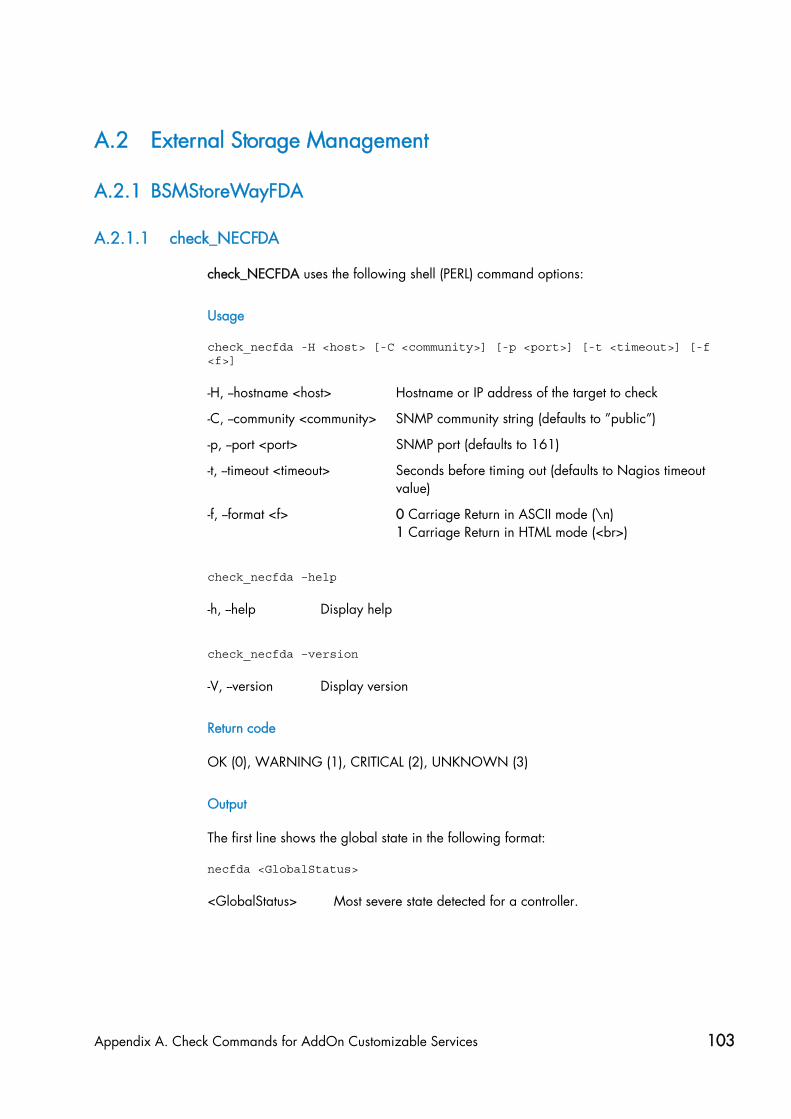
Appendix A. Check Commands for AddOn Customizable Services 103
A.2 External Storage Management
A.2.1 BSMStoreWayFDA
A.2.1.1 check_NECFDA
check_NECFDA uses the following shell (PERL) command options:
Usage
check_necfda -H <host> [-C <community>] [-p <port>] [-t <timeout>] [-f <f>]
-H, --hostname <host> Hostname or IP address of the target to check
-C, --community <community> SNMP community string (defaults to ”public”)
-p, --port <port> SNMP port (defaults to 161)
-t, --timeout <timeout> Seconds before timing out (defaults to Nagios timeout value)
-f, --format <f> 0 Carriage Return in ASCII mode (\n) 1 Carriage Return in HTML mode (<br>)
check_necfda –help
-h, --help Display help
check_necfda –version
-V, --version Display version
Return code
OK (0), WARNING (1), CRITICAL (2), UNKNOWN (3)
Output
The first line shows the global state in the following format:
necfda <GlobalStatus>
<GlobalStatus> Most severe state detected for a controller.

104 Bull System Manager 1.3 Server Add-ons - Installation and Administrator's Guide
Examples:
• If the global state is OK > check_necfda -H <host> necfda OK >
• If the global state is CRITICAL or WARNING, only the errors are displayed :
• When the return code is UNKNOWN: > check_necfda -H <host> necfda CRITICAL >
> check_necfda -H <host> necfda WARNING >
> check_necfda -H <host> necfda UNKNOWN - snmp query timed out >
> check_necfda -H <host> necfda UNKNOWN - no data received >
A.2.2 BSMEmcClariion
A.2.2.1 check_EMCCLARIION
check_EMCCLARIION uses the following shell (PERL) command options:
Usage
check_EmcClariion -H <host> [-C <community>] [-p <port>] [-t <timeout>] [-f <f>]
-H, --hostname <host> Hostname or IP address of the target to check
-C, --community <community> SNMP community string (defaults to public)
-p, --port <port> SNMP port (defaults to 161)
-t, --timeout <timeout> Seconds before timing out (defaults to Nagios timeout value)
-f, --format <f> 0 Carriage Return in HTML mode (<br>) 1 Carriage Return in ASCII mode (\n)
check_EmcClariion –help
-h, --help Display help
check_EmcClariion –version
-V, --version Display version

Appendix A. Check Commands for AddOn Customizable Services 105
Return code
OK (0), WARNING (1), CRITICAL (2), UNKNOWN (3)
Output
The first line shows the global state in the following format:
EmcClariion <GlobalStatus>
<GlobalStatus> Most severe state detected for a controller.
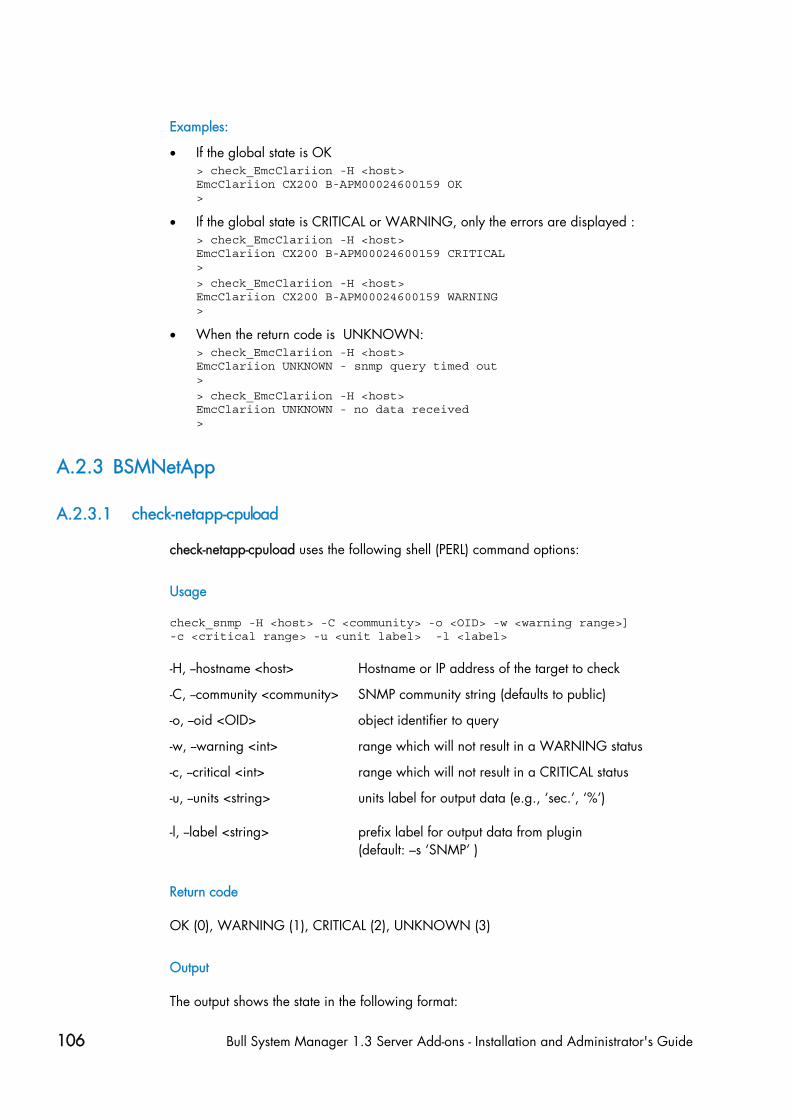
106 Bull System Manager 1.3 Server Add-ons - Installation and Administrator's Guide
Examples:
• If the global state is OK > check_EmcClariion -H <host> EmcClariion CX200 B-APM00024600159 OK >
• If the global state is CRITICAL or WARNING, only the errors are displayed : > check_EmcClariion -H <host> EmcClariion CX200 B-APM00024600159 CRITICAL >
> check_EmcClariion -H <host> EmcClariion CX200 B-APM00024600159 WARNING >
• When the return code is UNKNOWN: > check_EmcClariion -H <host> EmcClariion UNKNOWN - snmp query timed out >
> check_EmcClariion -H <host> EmcClariion UNKNOWN - no data received >
A.2.3 BSMNetApp
A.2.3.1 check-netapp-cpuload
check-netapp-cpuload uses the following shell (PERL) command options:
Usage
check_snmp -H <host> -C <community> -o <OID> -w <warning range>] -c <critical range> -u <unit label> -l <label>
-H, --hostname <host> Hostname or IP address of the target to check
-C, --community <community> SNMP community string (defaults to public)
-o, --oid <OID> object identifier to query
-w, --warning <int> range which will not result in a WARNING status
-c, --critical <int> range which will not result in a CRITICAL status
-u, --units <string> units label for output data (e.g., ‘sec.’, ‘%’)
-l, --label <string> prefix label for output data from plugin (default: –s ‘SNMP’ )
Return code
OK (0), WARNING (1), CRITICAL (2), UNKNOWN (3)
Output
The output shows the state in the following format:

Appendix A. Check Commands for AddOn Customizable Services 107
CPU LOAD <Status> - <int> %
<Status> status of the command <int> CPU load.
Examples:
• If the state is OK > check_snmp -H $HOSTADDRESS$ -C public -o .1.3.6.1.4.1.789.1.2.1.3.0 -w 90 -c 95 -u '%' -l "CPU LOAD" CPU LOAD OK – 8% >
• If the global state is CRITICAL or WARNING:
> check_snmp -H $HOSTADDRESS$ -C public -o .1.3.6.1.4.1.789.1.2.1.3.0 -w 90 -c 95 -u '%' -l "CPU LOAD" CPU LOAD WARNING – 92%
> check_snmp -H $HOSTADDRESS$ -C public -o .1.3.6.1.4.1.789.1.2.1.3.0 -w 90 -c 95 -u '%' -l "CPU LOAD" CPU LOAD CRITICAL – 99%
A.2.3.2 check-netapp-numdisks
check-netapp-numdisks uses the following shell (PERL) command options:
Usage
check_snmp -H <host> -C <community> -o <OID1,OID2,OID3,OID4> -u <unit label> -l <label>
-H, --hostname <host> Hostname or IP address of the target to check
-C, --community <community> SNMP community string (defaults to ”public”)
-o, --oid <OID> object identifiers to query
-u, --units <string> units label for output data (e.g., ‘sec.’, ‘%’)
-l, --label <string> prefix label for output data from plugin (default: –s ‘SNMP’ )
Return code
OK (0), WARNING (1), CRITICAL (2), UNKNOWN (3)
Output
The output shows the state in the following format:
<Status> - <int> Total Disks <int> Active <int> Spare <int> Failed
<Status> status of the command <int> number of disks.

108 Bull System Manager 1.3 Server Add-ons - Installation and Administrator's Guide
Examples:
• If the state is OK
> check_snmp -H $HOSTADDRESS$ -C public -o .1.3.6.1.4.1.789.1.6.4.1.0,.1.3.6.1.4.1.789.1.6.4.2.0,.1.3.6.1.4.1.789.1.6.4.8.0,.1.3.6.1.4.1.789.1.6.4.7.0 –u 'Total Disks','Active','Spare','Failed' -l "" OK – 8 Total Disks 7 Active 1 Spare 0 Failed >
• If the state is WARNING
> check_snmp -H $HOSTADDRESS$ -C public -o .1.3.6.1.4.1.789.1.6.4.1.0,.1.3.6.1.4.1.789.1.6.4.2.0,.1.3.6.1.4.1.789.1.6.4.8.0,.1.3.6.1.4.1.789.1.6.4.7.0 –u 'Total Disks','Active','Spare','Failed' -l "" WARNING – 8 Total Disks 6 Active 1 Spare 1 Failed >

Appendix A. Check Commands for AddOn Customizable Services 109
A.2.3.3 check-netapp-failedfans
check-netapp-failedfans uses the following shell (PERL) command options:
Usage
check_snmp -H <host> -C <community> -o <OID> -l <label>
-H, --hostname <host> Hostname or IP address of the target to check
-C, --community <community> SNMP community string (defaults to ”public”)
-o, --oid <OID> object identifiers to query
-l, --label <string> prefix label for output data from plugin (default: –s ‘SNMP’ )
Return code
OK (0), WARNING (1), CRITICAL (2), UNKNOWN (3)
Output
The output shows the state in the following format:
Fans <Status> - < msg>
<Status> status of the command <msg> msg concerning failed fans.
Examples:
• If the state is OK
> check_snmp -H $HOSTADDRESS$ -C public -o .1.3.6.1.4.1.789.1.2.4.3.0 -l "Fans"
Fans OK – There are no failed fans. >
• If the state is WARNING > check_snmp -H $HOSTADDRESS$ -C public -o .1.3.6.1.4.1.789.1.2.4.3.0 -l "Fans"
Fans WARNING – There are 2 failed fans. >

110 Bull System Manager 1.3 Server Add-ons - Installation and Administrator's Guide
A.2.3.4 check-netapp-failedpwr
check-netapp-failedpwr uses the following shell (PERL) command options:
Usage
check_snmp -H <host> -C <community> -o <OID> -l <label>
-H, --hostname <host> Hostname or IP address of the target to check
-C, --community <community> SNMP community string (defaults to ”public”)
-o, --oid <OID> object identifiers to query
-l, --label <string> prefix label for output data from plugin (default: –s ‘SNMP’ )
Return code
OK (0), WARNING (1), CRITICAL (2), UNKNOWN (3)
Output
The output shows the state in the following format:
Power <Status> - < msg>
<Status> status of the command <msg> msg concerning failed power supplies.
Examples:
• If the state is OK
> check_snmp -H $HOSTADDRESS$ -C public -o .1.3.6.1.4.1.789.1.2.4.5.0 -l "Power"
Power OK – There are no failed power supplies. >
• If the state is WARNING > check_snmp -H $HOSTADDRESS$ -C public -o .1.3.6.1.4.1.789.1.2.4.5.0 -l "Power"
Power WARNING – There are 2 failed power supplies. >

Appendix A. Check Commands for AddOn Customizable Services 111
A.2.3.5 check_netapp_globalstatus
check_netapp_globalstatus uses the following shell (PERL) command options:
Usage
check_NetAppGlobalStatus -H <host> [-C <community>] [-p <port>] [-t <timeout>] [-f <f>]
-H, --hostname <host> Hostname or IP address of the target to check
-C, --community <community> SNMP community string (defaults to public)
-p, --port <port> SNMP port (defaults to 161)
-t, --timeout <timeout> Seconds before timing out (defaults to Nagios timeout value)
-f, --format <f> 0 Carriage Return in HTML mode (<br>) 1 Carriage Return in ASCII mode (\n)
check_NetAppGlobalStatus –help
-h, --help Display help
check_NetAppGlobalStatus –version
-V, --version Display version
Return code
OK (0), WARNING (1), CRITICAL (2), UNKNOWN (3)
Output
The output shows the global state in the following format:
<GlobalStatus> - <msg>
<GlobalStatus> Global state of the NetApp storage system. <msg> message explaining the global state
Examples:
• If the global state is OK > check_NetAppGlobalStatus -H <host> OK – The system’s global status is normal >
• If the global state is CRITICAL or WARNING: > check_NetAppGlobalStatus -H <host> WARNING - /vol/luns is full (using or reserving 100% of space and 0% of inodes, using 63% of reserve). >

112 Bull System Manager 1.3 Server Add-ons - Installation and Administrator's Guide
A.2.3.6 check_netappvol
check_netappvol uses the following shell (PERL) command options:
Usage
check_NetAppVol -H <host> [-C <community>] [-p <port>] [-t <timeout>] [-f <f>]
-H, --hostname <host> Hostname or IP address of the target to check
-C, --community <community> SNMP community string (defaults to public)
-p, --port <port> SNMP port (defaults to 161)
-t, --timeout <timeout> Seconds before timing out (defaults to Nagios timeout value)
-f, --format <f> 0 Carriage Return in HTML mode (<br>) 1 Carriage Return in ASCII mode (\n)
check_NetAppGlobalVol –help
-h, --help Display help
check_NetAppGlobalVol –version
-V, --version Display version
Return code
OK (0), WARNING (1), CRITICAL (2), UNKNOWN (3)
Output
The first line shows the global volume state in the following format:
NetApp <model> <GlobalVolumeStatus>
<GlobalVolumeStatus> Global state of all volumes of the NetApp storage system. <model> model of NetApp storage system
The following lines show the status of each volume
Volume <name>, <status> (<raidtype, <voltype>, <aggregateName>)

Appendix A. Check Commands for AddOn Customizable Services 113
Examples:
• If the global state is OK > check_NetAppGlobalStatus -H <host> NetApp FAS3020 RAID OK Volume vol0, online (raid_dp, flexible, aggr0) Volume BULL_TRAVAIL, online (raid_dp, flexible, BULL) Volume luns, online (raid_dp, flexible, BULL) Volume GORKI, online (raid_dp, flexible, aggr1) >
• If the global state is CRITICAL or WARNING: > check_NetAppGlobalStatus -H <host> NetApp FAS3020 RAID WARNING Volume vol0, online (raid_dp, flexible, aggr0) Volume BULL_TRAVAIL, online (raid_dp, flexible, BULL) Volume luns, online (raid_dp, flexible, BULL) Volume GORKI, offline (raid_dp, flexible, aggr1) >
A.2.3.7 check_netappraid
check_netappraid uses the following shell (PERL) command options:
Usage
check_NetAppGlobalRaid -H <host> [-C <community>] [-p <port>] [-t <timeout>] [-f <f>]
-H, --hostname <host> Hostname or IP address of the target to check
-C, --community <community> SNMP community string (defaults to public)
-p, --port <port> SNMP port (defaults to 161)
-t, --timeout <timeout> Seconds before timing out (defaults to Nagios timeout value)
-f, --format <f> 0 Carriage Return in HTML mode (<br>) 1 Carriage Return in ASCII mode (\n)
check_NetAppRaid –help
-h, --help Display help
check_NetAppRaid –version
-V, --version Display version
Return code
OK (0), WARNING (1), CRITICAL (2), UNKNOWN (3)
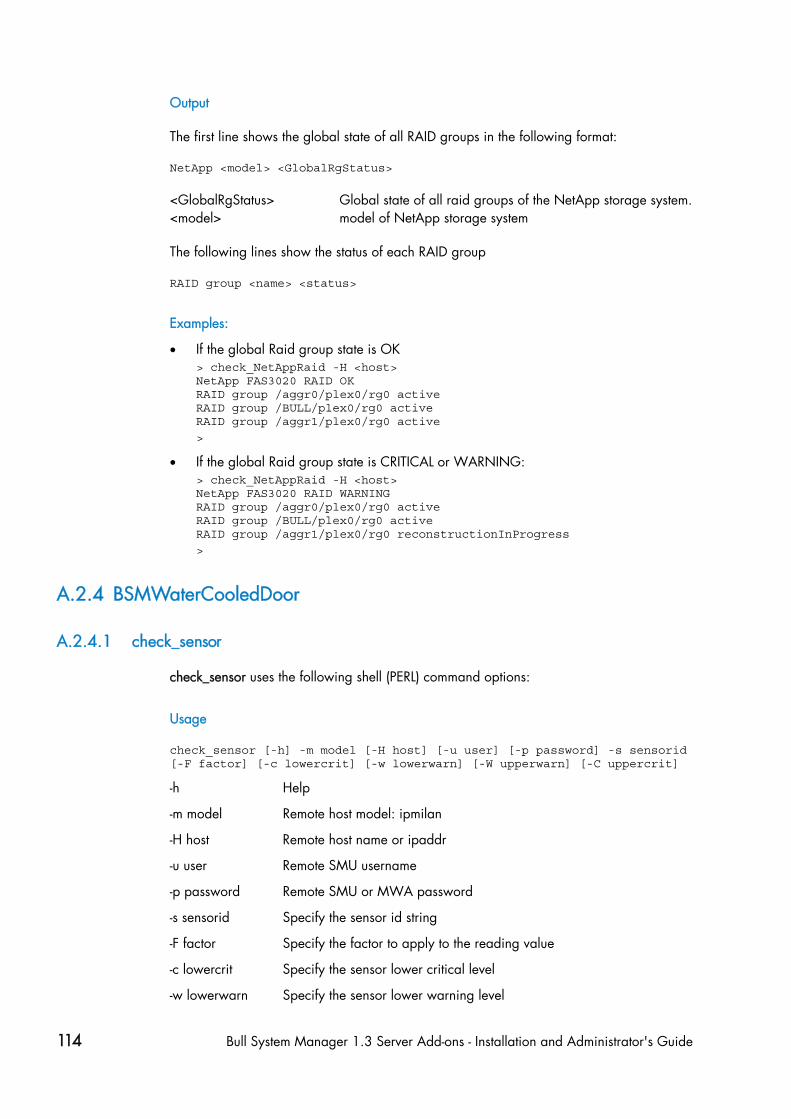
114 Bull System Manager 1.3 Server Add-ons - Installation and Administrator's Guide
Output
The first line shows the global state of all RAID groups in the following format:
NetApp <model> <GlobalRgStatus>
<GlobalRgStatus> Global state of all raid groups of the NetApp storage system. <model> model of NetApp storage system
The following lines show the status of each RAID group
RAID group <name> <status>
Examples:
• If the global Raid group state is OK > check_NetAppRaid -H <host> NetApp FAS3020 RAID OK RAID group /aggr0/plex0/rg0 active RAID group /BULL/plex0/rg0 active RAID group /aggr1/plex0/rg0 active
>
• If the global Raid group state is CRITICAL or WARNING: > check_NetAppRaid -H <host> NetApp FAS3020 RAID WARNING RAID group /aggr0/plex0/rg0 active RAID group /BULL/plex0/rg0 active RAID group /aggr1/plex0/rg0 reconstructionInProgress
>
A.2.4 BSMWaterCooledDoor
A.2.4.1 check_sensor
check_sensor uses the following shell (PERL) command options:
Usage
check_sensor [-h] -m model [-H host] [-u user] [-p password] -s sensorid [-F factor] [-c lowercrit] [-w lowerwarn] [-W upperwarn] [-C uppercrit]
-h Help
-m model Remote host model: ipmilan
-H host Remote host name or ipaddr
-u user Remote SMU username
-p password Remote SMU or MWA password
-s sensorid Specify the sensor id string
-F factor Specify the factor to apply to the reading value
-c lowercrit Specify the sensor lower critical level
-w lowerwarn Specify the sensor lower warning level

Appendix A. Check Commands for AddOn Customizable Services 115
-C uppercrit Specify the sensor upper critical level
-W upperwarn Specify the sensor upper warning level
Return code
OK(0), WARNING(1), CRITICAL(2), UNKNOWN(3).
Output
The output shows the state and the value of the sensor in the following format:
<sensor status> : <value>
Examples:
> check_sensor -m ipmilan -H 172.31.50.71 -u super -p pass -s 'Pwr Consumption'
OK : 142.480 Watts
>
> check_sensor -m ipmilan -H 172.31.50.71 -u super -p pass -s 'Valve Vperture'
OK : 21.750 %
>

116 Bull System Manager 1.3 Server Add-ons - Installation and Administrator's Guide
> check_sensor -m ipmilan -H 172.31.50.71 -u super -p pass -s 'Air Pressure' –F 1000
OK : 19 Pa
>
check_sensor -m ipmilan -H 172.31.50.71 -u super -p pass -s ’Average Temp.’
OK : 18.3 degrees C
>
A.2.5 BSMStoreWayDPA
A.2.5.1 check_StoreWayDPA
check_StoreWayDPA uses the following shell (PERL) command options:
Usage
check_StoreWayDPA -H <host> [-C <community>] [-p <port>] [-t <timeout>] [-f <f>]
-H, --hostname <host> Hostname or IP address of the target to check
-C, --community <community> SNMP community string (defaults to public)
-p, --port <port> SNMP port (defaults to 161)
-t, --timeout <timeout> Seconds before timing out (defaults to Nagios timeout value)
-f, --format <f> 0 Carriage Return in HTML mode (<br>) 1 Carriage Return in ASCII mode (\n)
check_StoreWayDPA –help
-h, --help Display help
check_StoreWayDPA –version
-V, --version Display version
Return code
OK (0), WARNING (1), CRITICAL (2), UNKNOWN (3)
Output
The first line shows the task state in the following format:

Appendix A. Check Commands for AddOn Customizable Services 117
StoreWay DPA <TaskStatus>
<TaskStatus> Most severe task state detected on a StoreWay DPA system.

118 Bull System Manager 1.3 Server Add-ons - Installation and Administrator's Guide
Examples:
• If the task state is OK > check_StoreWayDPA -H <host> StoreWay DPA OK >
• If the global state is CRITICAL, only the tasks with state stopped are displayed : > check_StoreWayDPA -H <host> StoreWay DPA CRITICAL
Backup Engine stopped >
> check_StoreWayDPA -H <host> StoreWay DPA CRITICAL
Task Launcher stopped >
> check_StoreWayDPA -H <host> StoreWay DPA CRITICAL
Backup Engine and Task Launcher stopped >
• When the return code is UNKNOWN: > check_StoreWayDPA -H <host> StoreWay DPA UNKNOWN - snmp query timed out >
> check_StoreWayDPA -H <host> StoreWay DPA UNKNOWN - no data received >
A.2.6 BSMSwitchBrocade
A.2.6.1 check_brocade
check_brocade uses the following shell (PERL) command options:
Usage
check_fcsw.pl -H <host IP address> -c <command>
-H <host> Hostname or IP address of the target to check
-c <command> specifies the type of element to be monitored
switch : gets the monitoring state of the FC switch itself
port : gets the monitoring state of the FC ports
fan : gets the monitoring state of the fans
temp : gets the monitoring state of the temperature sensors
-h, --help displays help

Appendix A. Check Commands for AddOn Customizable Services 119
Return code
OK (0), WARNING (1), CRITICAL (2), UNKNOWN (3)
Output
The output displays the state of the sensor.

120 Bull System Manager 1.3 Server Add-ons - Installation and Administrator's Guide
Examples:
• If the task state is OK > check_fcsw.pl -H <host> -c switch Global switch status is OK >
> check_fcsw.pl -H <host> -c port All 16 FC ports are OK >
> check_fcsw.pl -H <host> -c temp All 4 Temperature Sensors are OK >
> check_fcsw.pl -H <host> -c fan All 4 Fans are OK >
• When the return code is UNKNOWN: > check_fcsw.pl -H <host> -c switch Cannot access to Switch status, Cannot acces to Switch name >
> check_fcsw.pl -H <host> -c temp Cannot access to sensors states >
> check_fcsw.pl -H <host> -c port Cannot access to FC port states >
A.2.7 BSMPDU-APC
A.2.7.1 check_PDUAPC
check_PDUAPC uses the following shell (PERL) command options:
Usage
check_PDUAPC -H <host IP address> -s <action> [-p <port>] [-C <community>] [-T <snmp timeout>]
-H <host> Hostname or IP address of the target to check
-c <action> Status : gets the APC PDU power supply(ies) status
Consumption : gets the APC PDU power consumption (in Watts)
Status : gets the APC PDU outlets status
-p <port> snmp port number (default value: 161)
-C <community> snmp community (default value: public)
-T <timeout> snmp timeout (default value: 30 seconds)
-h, --help displays help

Appendix A. Check Commands for AddOn Customizable Services 121
Return code
OK (0), WARNING (1), CRITICAL (2), UNKNOWN (3)
Output
The output displays the APC PDU power supply(ies) state, the APC PDU global power consumption or the APC PDU outlets state.

122 Bull System Manager 1.3 Server Add-ons - Installation and Administrator's Guide
Examples:
• Action Status
Return code OK: > check_PDUAPC -H 129.182.6.174 -a Status
Power Distribution Unit: 129.182.6.174, MODEL: "AP7922", Serial Nb: "ZA0909003404", Firm Rev: "v3.5.7"
All Power Supplies OK >
Return code WARNING: > check_PDUAPC -H 129.182.6.174 -a Status
Power Distribution Unit: 129.182.6.174, MODEL: "AP7922", Serial Nb: "ZA0909003404", Firm Rev: "v3.5.7"
Power Supply 1 OK, Power Supply 2 FAILED >
Return code CRITICAL: > check_PDUAPC -H 129.182.6.174 -a Status
Power Distribution Unit: 129.182.6.174, MODEL: "AP7922", Serial Nb: "ZA0909003404", Firm Rev: "v3.5.7"
All Power Supplies FAILED >
• Action Consumption:
Return code OK: > check_PDUAPC -H 129.182.6.174 -a Consumption
Power OK: Reading 0 Watts
Return code WARNING: > check_PDUAPC -H 129.182.6.174 -a Consumption
Power WARNING: Reading 6000 > Threshold 5520 Watts>
Return code CRITICAL: > check_PDUAPC -H 129.182.6.174 -a Consumption
Power CRITICAL: Reading 8000 > Threshold 7360 Watts
>
• Action Outlets:
Return code OK: > check_PDUAPC -H 129.182.6.174 -a Outlets
Power Distribution Unit: 129.182.6.174, MODEL: "AP7922", Serial Nb: "ZA0909003404", Firm Rev: "v3.5.7"
Outlets(1 - 16) power: On(1)
>
> check_PDUAPC -H 129.182.6.174 -a Outlets
Power Distribution Unit: 129.182.6.174, MODEL: "AP7922", Serial Nb: "ZA0909003404", Firm Rev: "v3.5.7"
Outlets(1,3,5,7,9,11,12,14,16) power: On(1)
Outlets(2,4,6,8,10,13,15) power: Off(2)
>

Appendix A. Check Commands for AddOn Customizable Services 123
Return code WARNING: > check_PDUAPC -H 129.182.6.174 -a Outlets
Power Distribution Unit: 129.182.6.174, MODEL: "AP7922", Serial Nb: "ZA0909003404", Firm Rev: "v3.5.7"
Outlets(1 - 16) power: Off(2)
>

124 Bull System Manager 1.3 Server Add-ons - Installation and Administrator's Guide
A.3 Virtualization Management
A.3.1 BSMVMwareESX
A.3.1.1 check_esx3
The Nagios check commands used by the BSMrVMwareESX Add-on uses the shell (PERL) check_esx3 command.
Usage
check_esx3 -H esxname [-N|-M|-B] [-C community] [-v virtualhost] [-l thing [-w warn -c crit]] [-t timeout]
-H <esxname> Hostname or IP address of the ESX server to check
-N, -M, -B Set context for check execution -N for Nagios mode, -M for MRTG mode, -B for BSM mode.
-C <community> SNMP community string (defaults to public)
-v <virtualhost> Name of the virtual host to check
-l <item> Specify what to check Available item values: CPU, MEM, SNMP, STATE, LIST, LISTNET.
-w <warnThreshold> Warning threshold
-c <criticalThreshold> Critical threshold.
-h, --help Display help
Return code
OK(0), WARNING(1), CRITICAL(2), UNKNOWN(3).
Output
The output depends on which Nagios commands are called, as shown below.
check_esx_server
The check_esx3 shell is called using the following syntax:
check_esx3 -B -H <esxname> -C <community> -l LIST -w <warn>% -c <crit>%
Output:
VHosts: <nb-up>/<nb-all> up: <VMname> (<status>), �.

Appendix A. Check Commands for AddOn Customizable Services 125
Example:
check_esx3 –H esx -C public –w 50% -c 0%
VHosts: 2/4 up: nsmvm5(OFF), nsmvm1(ON), nsmvm3(ON), nsmvm4(OFF)
Status is set to WARNING if more than 50% of VMs are down. Status is set to CRITICAL if all VMs are down.
Note The list of VMs used to establish ESX server status corresponds to all the VMs declared on the ESX server and not only to those declared on the Bull System Manager ESX platform. The VMname is that declared on the VMware ESX server (this name can be different from the BSM hostname).
check_esx_snmp
The check_esx3 shell is called using the following syntax:
check_esx3 -B -H <esxname> -C <community> -l SNMP
Output: OK SNMP management interface available
CRITICAL SNMP management interface not available
check_esx_mem
The check_esx3 shell is called using the following syntax:
check_esx3 -B -H <esxname> -C <community> -l MEM -w <warn>% -c <crit>%
Output:
Memory free: <free>Mb (<percent_free>) [Total available <total>Mb]
Example:
check_esx3 –H esx -C public -l MEM –w 20% -c 10%
Memory free: 16111.6Mb (98%) [Total available 16383.6Mb]
Status is set to WARNING if less than 20% of memory is available. Status is set to CRITICAL if less than 10% of memory is available.
check_esx_vm
The check_esx3 shell is called using the following syntax:
check_esx3 -B -H <esxname> -C <community> -v <virtualHost> -l STATE
Output:
OK VHost <VMname>is up (ID: <id>)
CRITICAL VHost <VMname>is down (ID: <id>)

126 Bull System Manager 1.3 Server Add-ons - Installation and Administrator's Guide
Example:
check_esx_vm –H esx -C public –v nsmvm1 –l STATE
VHost nsmvm1 is up (ID: 48)
Status is set to OK if the VM is up. Status is set to CRITICAL if the VMs are down.
Note The VMname is that declared on the ESX server (this name can be different from the BSM hostname).
check_esx_vm_memory
The check_esx3 shell is called using the following syntax:
check_esx3 -B -H <esxname> -C <community> -v <virtualHost> -l MEM -w <warn>% -c <crit>%
Output:
Memory free: <free>Mb (<percent_free>) [Total available <total>Mb] on vhost <VMname>
Example:
check_esx_vm_mem –B –H esx –C public –v nsmvm1 –w 20% -c 10%
Memory free: 460.8Mb (90%) [Total available 512Mb] on vhost smvm1
Status is set to WARNING if less than 20% of memory is available. Status is set to CRITICAL if if less than 10% of memory is available.
Note The VMname is that declared on the ESX server (this name can be different from the BSM hostname).
check_esx_vm_cpu
The check_esx3 shell is called using the following syntax:
check_esx3 -B -H <esxname> -C <community> -v <virtualHost> -l CPU -w <warn>% -c <crit>%
Output:
CPU usage is <percent_used> on <VMname> nsmvm1 (<time>average)
Example:
check_esx_vm_cpu –B –H esx –C public –v nsmvm1 –w 80% -c 90%
CPU usage is 3% on nsmvm1 (301s average)
Status is set to WARNING if more than 80% of CPU is used. Status is set to CRITICAL if if more than 90% of CPU is used.
Note The VMname is that declared on the ESX server (this name can be different from the BSM hostname).

Appendix A. Check Commands for AddOn Customizable Services 127
A.3.2 BSMVMwareVC
A.3.2.1 check_virtualcenter.pl
The Nagios check commands used by BSMVMwareVC Add-on uses the shell (PERL) check_virtualcenter.pl command.
Usage
check_virtualcenter.pl -—server <vCenter> --vmname <VM_id> --hostname <ESX_id> --stat <cpu|mem> --crit <nb> --warn <nb>
where:
--server <vCenter> Hostname or IP address of the vCenter
--vmname <VM_id> Name of the VM (in vCenter context)
--hostname <ESX_id> Name of the ESX host (in vCenter context)
--stat <type> Type of performance statistics to check. Two values are available:
• cpu: check the average percentage of CPU usage
• mem: check the average percentage of Memorty usage
--warn <nb> Warning threshold for performance statistics
--crit <nb> Critical threshold for performance statistics
--help Display help
Return code
OK(0), WARNING(1), CRITICAL(2), UNKNOWN(3).
Output
The output depends on which Nagios commands are called, as shown below.
check_esx_virtualcenter case
The check_virtualcenter shell is called using the following syntax:
check_virtualcenter -—server <vCenter> --hostname <ESX_id> [--stat <CPU|Memory> --warn <nb> --crit <nb>]
Output:
<ESXhost>: <message>

128 Bull System Manager 1.3 Server Add-ons - Installation and Administrator's Guide
Example 1:
check_ virtualcenter –server 129.182.6.105 –hostname 172.31.50.55
172.31.50.55: Nothing to report about this host.
The status returned is determined by the vCenter server.
Example 2:
check_ virtualcenter –server 129.182.6.105 –hostname 172.31.50.55 –stat mem –crit 80 –warn 70
172.31.50.55: Memory usage is 24.95 (sampling period 20 sec)
The status returned is dependant on the threshold setting. In this example, the status returned is good.
check_vm_virtualcenter case
The check_vm_virtualcenter shell is called using the following syntax:
check_virtualcenter -—server <vCenter> --vmname <VM_id> [--stat <CPU|Memory> --warn <nb> --crit <nb>]
Output:
<VMhost> (on ESX <ESXhost>): <message>
Example 1:
check_virtualcenter –server 129.182.6.105 –vmname sles10
sles10: This virtual machine is powered on and its guest OS is running)
The status is determined by the vCenter server except when the Operating System is not running (status set to WARNING).
Example 2:
check_virtualcenter –server 129.182.6.105 –vmname sles10 –stat mem –crit 80 –warn 70
sles10): Memory usage is 11.99 (sampling period 20 sec)
The status returned is dependant on the threshold setting. In this example, the status returned is good.
Failure case
Example 1:
172.16.115.100 : information status for this host is not available (/opt/BSMServer/engine/tmp/VCcache1721611358.pm not found)has
This output indicates that the collect task has not started or has failed to collect information from vCenter.
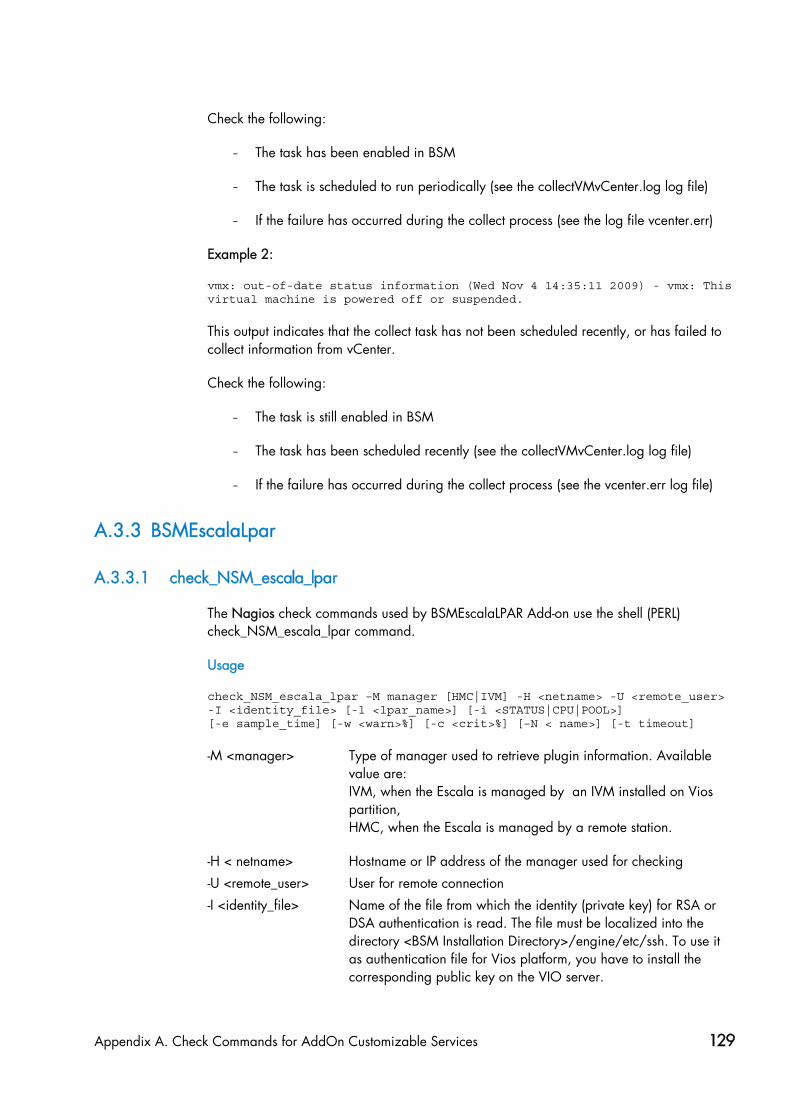
Appendix A. Check Commands for AddOn Customizable Services 129
Check the following:
- The task has been enabled in BSM
- The task is scheduled to run periodically (see the collectVMvCenter.log log file)
- If the failure has occurred during the collect process (see the log file vcenter.err)
Example 2:
vmx: out-of-date status information (Wed Nov 4 14:35:11 2009) - vmx: This virtual machine is powered off or suspended.
This output indicates that the collect task has not been scheduled recently, or has failed to collect information from vCenter.
Check the following:
- The task is still enabled in BSM
- The task has been scheduled recently (see the collectVMvCenter.log log file)
- If the failure has occurred during the collect process (see the vcenter.err log file)
A.3.3 BSMEscalaLpar
A.3.3.1 check_NSM_escala_lpar
The Nagios check commands used by BSMEscalaLPAR Add-on use the shell (PERL) check_NSM_escala_lpar command.
Usage
check_NSM_escala_lpar –M manager [HMC|IVM] -H <netname> -U <remote_user> -I <identity_file> [-l <lpar_name>] [-i <STATUS|CPU|POOL>] [-e sample_time] [-w <warn>%] [-c <crit>%] [–N < name>] [-t timeout]
-M <manager> Type of manager used to retrieve plugin information. Available value are: IVM, when the Escala is managed by an IVM installed on Vios partition, HMC, when the Escala is managed by a remote station.
-H < netname> Hostname or IP address of the manager used for checking
-U <remote_user> User for remote connection
-I <identity_file> Name of the file from which the identity (private key) for RSA or DSA authentication is read. The file must be localized into the directory <BSM Installation Directory>/engine/etc/ssh. To use it as authentication file for Vios platform, you have to install the corresponding public key on the VIO server.

130 Bull System Manager 1.3 Server Add-ons - Installation and Administrator's Guide
-N < name> Name of the CEC or Vios LPAR (used in output of the plugin related to a given logical partition).
-l <lpar_name> Name of the logical partition to check
-i <check information> Available values are: STATUS (to check the status of the VIO server or of a logical partition), POOL (to check the utilization of the processing pool), CPU (to check the utilization of the CPU entitled to a partition). Default value is STATUS
-e <sample time> Sample time in minutes used to perform calculation on utilization. Default value is 5.
-w <warnThreshold> Warning threshold
-c <criticalThreshold> Critical threshold.
-h, --help Display help
Return code
OK(0), WARNING(1), CRITICAL(2), UNKNOWN(3).
Output
The output depends on the type of check performed, as shown in the examples below.
check_vios _status
The check_NSM_escala_lpar shell is called using the following syntax:
check_NSM_escala_lpar –M IVM –H <vios_netName> -N <server_name> -U <user> -I <identity_file>
Output:
Only two states are possible for Vios status: OK or UNKNOWN:
− for OK state, the output is "Virtual I/O Server state: Operating"
− for UNKNOWN state, the output is "Unable to determine Virtual I/O Server state", following the reason.
Note The check_vios_status command is dependent on the state of the Vios system given by the lssyscfg IVM command.

Appendix A. Check Commands for AddOn Customizable Services 131
Example:
check_NSM_escala_lpar –H ivm1 –U padmin –I id_dsa_nsm
Output: Virtual I/O Server state: Operating Return code: OK.
check_vios_used_pool case
The check_NSM_escala_lpar shell is called using the following syntax:
check_NSM_escala_lpar –M IVM –H <vios_netName> -U <user> -I <identity_file> -N <server_name> -i POOL -e <sample_time> -w <warn>% -c <crit>%
Output:
Processing pool (nbCPU / CPUTotal units entitled) - utilization on <sampleTime> mn <check_status>: <utilization percent>%
Note The check_vios_used_pool command is based on the pool_cycle metrics (total_pool_cycle, utilized_pool_cycle) obtained by the lslparutil IVM command. It requires that the data collection is activated by the chlparutil command: chlparutil –r config –s 30
Example:
check_NSM_escala_lpar –H 192.168.207.60 –U padmin –I id_dsa_nsm -i POOL –e 5 –w 70% –c 80%
Output: Processing pool (1.4 / 2 units entitled) - utilization on 5 mn OK: 2.16 %
Return code: OK
check_cec_used_pool case
The check_NSM_escala_lpar shell is called using the following syntax:
check_NSM_escala_lpar –M HMC –H <hmc_netName> -U <user> -I <identity_file> -N <cecname>-i POOL -e <sample_time> -w <warn>% -c <crit>%
Output:
Processing pool (nbCPU / CPUTotal units entitled) (HMC <hmc_netname> - utilization on <sampleTime> mn <check_status>: <utilization percent>%

132 Bull System Manager 1.3 Server Add-ons - Installation and Administrator's Guide
Note The check_cec_used_pool command is based on pool_cycle metrics (total_pool_cycle, utilized_pool_cycle) obtained by the lslparutil HMC command. It requires that data collection is activated for the system by the chlparutil command: chlparutil –r config –s 3600 [–m <systemName>]
If the systemName parameter is not specified, the data collection is activated for all managed systems.
Example:
check_NSM_escala_lpar –H 192.168.207.60 –U padmin –I id_dsa_nsm -i POOL –e 5 –w 70% –c 80%
Output: Processing pool (1.4 / 2 units entitled) (HMC 172.16.108.112) - utilization on 120 mn OK: 52.83 %
Return code: OK
check_lpar_status case
The check_NSM_escala_lpar shell is called using the following syntax:
check_NSM_escala_lpar –M [IVM|HMC] –H <netName> -U <user> -I <identity_file> -l <lpar_name> -N <name>
Output:
Logical partition <lpar_name> on <server_name> (HMC or IVM): <lpar_status>
Note The check_vios_lpar_status command is based on the Lpar state obtained by the lssyscfg IVM command.
Examples:
check_NSM_escala_lpar –H 192.168.207.60 –U padmin –I id_dsa_nsm –N ivm1 l part1
Output: Logical partition galilei on staix35 (IVM): Running
Return code: OK.
check_NSM_escala_lpar –H 192.168.207.60 –U padmin –I id_dsa_nsm –N ivm1 l part2
Output: Logical partition tyrex on staix35 (IVM): Not Available
Return code: CRITICAL.
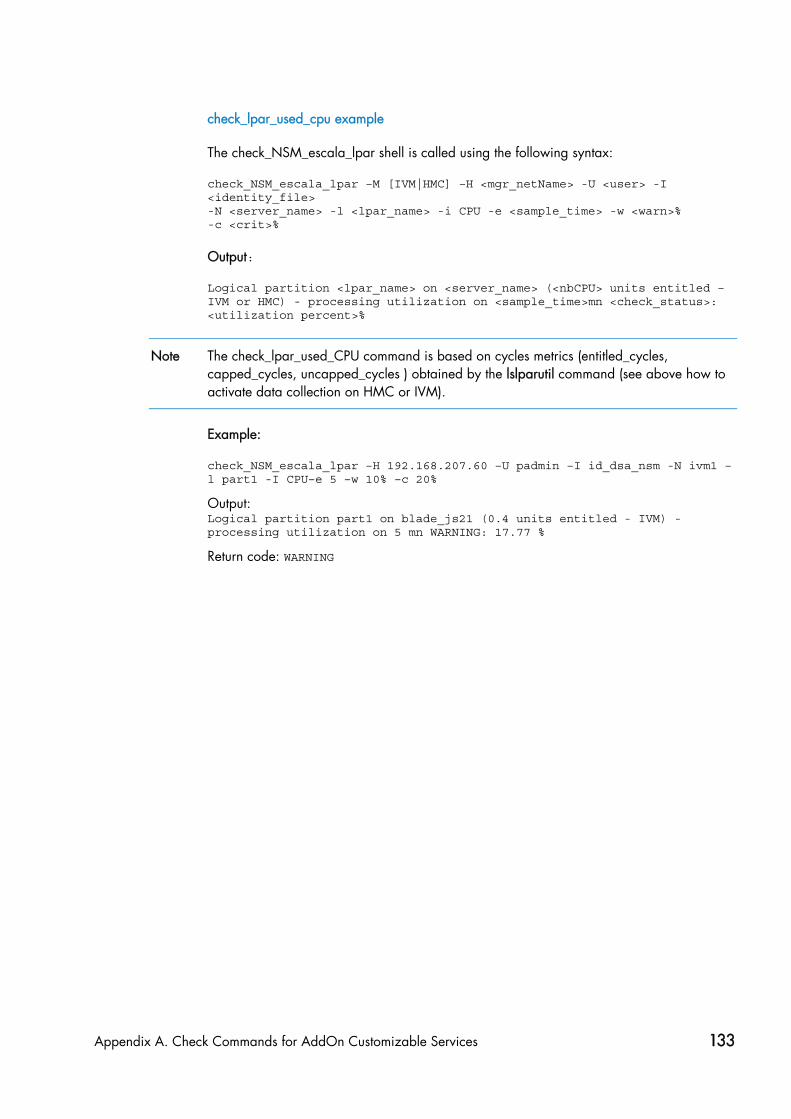
Appendix A. Check Commands for AddOn Customizable Services 133
check_lpar_used_cpu example
The check_NSM_escala_lpar shell is called using the following syntax:
check_NSM_escala_lpar –M [IVM|HMC] –H <mgr_netName> -U <user> -I <identity_file> -N <server_name> -l <lpar_name> -i CPU -e <sample_time> -w <warn>% -c <crit>%
Output:
Logical partition <lpar_name> on <server_name> (<nbCPU> units entitled – IVM or HMC) - processing utilization on <sample_time>mn <check_status>: <utilization percent>%
Note The check_lpar_used_CPU command is based on cycles metrics (entitled_cycles, capped_cycles, uncapped_cycles ) obtained by the lslparutil command (see above how to activate data collection on HMC or IVM).
Example:
check_NSM_escala_lpar –H 192.168.207.60 –U padmin –I id_dsa_nsm -N ivm1 –l part1 -I CPU–e 5 –w 10% –c 20%
Output: Logical partition part1 on blade_js21 (0.4 units entitled - IVM) - processing utilization on 5 mn WARNING: 17.77 %
Return code: WARNING

134 Bull System Manager 1.3 Server Add-ons - Installation and Administrator's Guide
A.4 Bull Products Management
A.4.1 BSMDD4A
A.4.1.1 check_DynamicDomains
check_DynamicDomains uses the check_DD4A shell (PERL) command options:
Usage
check_DD4A -H <host> [-w ] [-D <domainName>]
-H, --hostname <host> Hostname or IP address of target to check
-D, --domain ALL | <domainName> ALL domains or a specific one: <domainName>
-w, –-web WEB HTML output format
Return code
OK (0), WARNING (1), CRITICAL (2), UNKNOWN (3)
• OK All ”Dynamic Domains” run normally.
• WARNING At least one ”Dynamic Domain” is in a WARNING state.
• CRITICAL At least one ” Dynamic Domain ” is in a CRITICAL state.
• UNKNOWN All other types of processing errors (bad parameter, no response, etc.).
Note In the case of multiple errors, the global state will be the most severe one; CRITICAL > WARNING > OK.
Output
A string with a global state descriptor followed, if they exist, by the error states of the component (controller, Logical Device, Physical Device) concerned.
If -D ALL or without -D parameter is used, the first line displays the defined Dynamic Domains number. Then, only Dynamic Domains with issues are displayed with their status, the number of CPUs used, their CPU load (and associated threshold) and their number of tasks.
Note The global state is not displayed textually, only the command return code contains this status information.

Appendix A. Check Commands for AddOn Customizable Services 135
If -D <domainName> is used, the command output displays the defined Dynamic Domain name with number of CPUs it uses, its CPU load (and associated threshold) and its number of tasks.
Examples:
• check_DD4A -H <host>
• check_DD4A -H <host> -D ALL 4 Dyn.Domains. - domain2 : WARNING CPUs: 4 / 4, tasks: 70 load: 80% ( > 75% ) - domain3 : CRITICAL CPUs: 4 / 4, tasks: 110 load: 100% ( > 75% )
• check_DD4A -H <host> -D default default : OK CPUs: 7 / 8, tasks: 37 load: 0.56% ( < 75% )

136 Bull System Manager 1.3 Server Add-ons - Installation and Administrator's Guide
A.4.2 BSMBVS
A.4.2.1 check_BVS
check_BullVideoServices uses the check_BVS shell (PERL) command options:
Usage
check_BVS -H <host> -S {Streaming|Recording|Datagrams} [{–p <period>} | { -l <begin> -t <end> }] [-w]
-H, --hostname <host> Hostname or IP address of target to check
-S, --service Streaming|Recording|Datagrams
-p, --period <period> | -l <begin> -t <end> indicates to the Bull Video Server the period in seconds to calculate the average values
-w, --web WEB HTML output format
Return code
OK (0), WARNING (1), CRITICAL (2), UNKNOWN (3)
• OK Bull Video Server runs normally.
• WARNING Bull Video Server is in WARNING state.
• CRITICAL Bull Video Server is in CRITICAL state.
• UNKNOWN All other type of processing errors (bad parameter, and so on).
The BVS state UNREACHABLE (Bull Video Server is in UNREACHABLE state (daemon not started, communication timeout, etc.) will be transformed to Nagios UNKNOWN status.
The status values (OK, WARNING, CRITICAL) are fixed by the video server itself according to the criteria indicated by the Bull Video Server Administrator.
Output
The following information is displayed. Average values are calculated using the value specified by the ‘polling interval’ textbox from the service configuration screen. The default value is 1 min. A modification of this value will be automatically taken into account by the check_BVS plugin.

Appendix A. Check Commands for AddOn Customizable Services 137
Streaming service
Status global status of streaming service
Channels number of channels used for streaming (average)
Rate average rate in MB/s
Load percentage of disk rate in relation to a value declared on BVS server
Example: check_BVS -H <host> -S Streaming
Status: OK channels: 17.00, rate (MB/s): 38.84, load: 12.69 %
Recording service
Status global status of recording service
Channels number of channels used for recording (average)
Rate average rate in MB/s
Load percentage of disk rate in relation to a value declared on BVS server.
Example: check_BVS -H <host> -S Recording
Status: OK channels: 7.00, rate (MB/s): 3.84, load: 7.69 %
Datagram service
Status global status of datagram service
Nb of late dg number of UDP datagrams sent late per second (average)
Avg late value average delay value in ms. A delay value between 0 and 10 ms is considered as a normal value.
Nb of deleted dg number of deleted UDP datagrams per second (average).
Example: check_BVS -H <host> -S Datagrams
Status: OK nb of late dg: 128.67, avg late value: 1.03 ms, nb of deleted dg: 3.08
Service inaccessible
If a service is inaccessible only the RC will be displayed.
Example: check_BVS -H <host> -S <service>
Status: UNREACHABLE
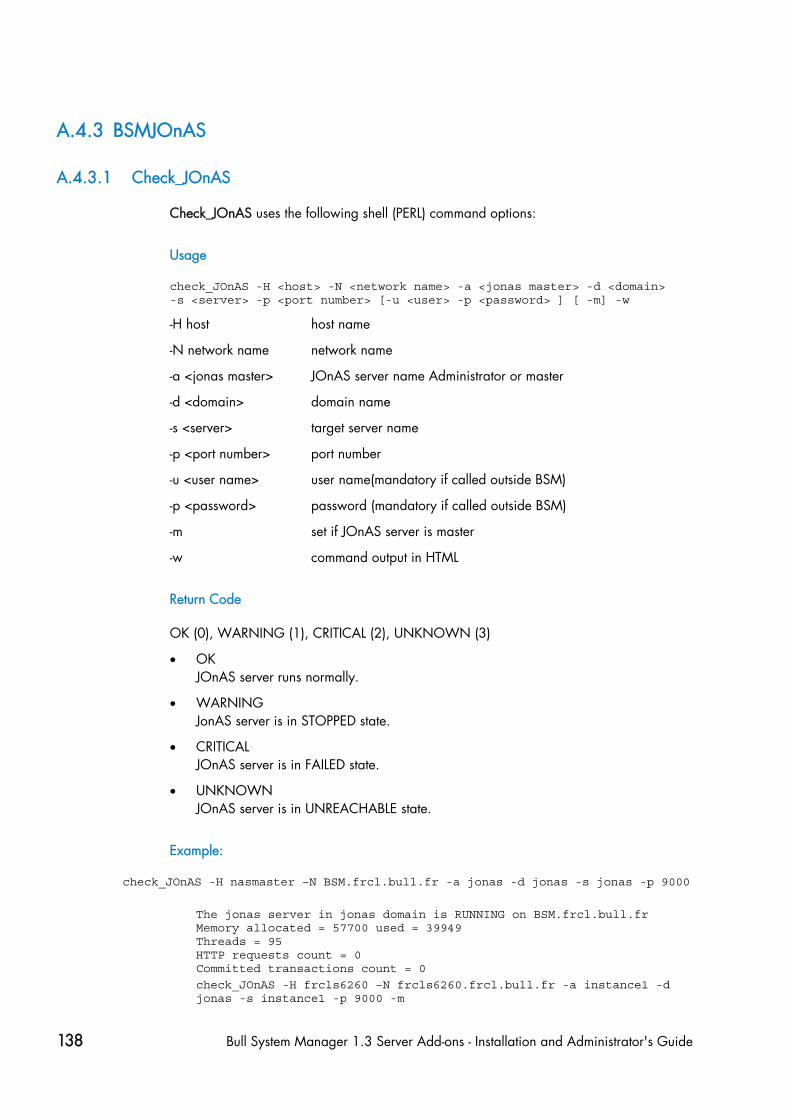
138 Bull System Manager 1.3 Server Add-ons - Installation and Administrator's Guide
A.4.3 BSMJOnAS
A.4.3.1 Check_JOnAS
Check_JOnAS uses the following shell (PERL) command options:
Usage
check_JOnAS -H <host> -N <network name> -a <jonas master> -d <domain> -s <server> -p <port number> [-u <user> -p <password> ] [ -m] -w
-H host host name
-N network name network name
-a <jonas master> JOnAS server name Administrator or master
-d <domain> domain name
-s <server> target server name
-p <port number> port number
-u <user name> user name(mandatory if called outside BSM)
-p <password> password (mandatory if called outside BSM)
-m set if JOnAS server is master
-w command output in HTML
Return Code
OK (0), WARNING (1), CRITICAL (2), UNKNOWN (3)
• OK JOnAS server runs normally.
• WARNING JonAS server is in STOPPED state.
• CRITICAL JOnAS server is in FAILED state.
• UNKNOWN JOnAS server is in UNREACHABLE state.
Example:
check_JOnAS -H nasmaster –N BSM.frcl.bull.fr -a jonas -d jonas -s jonas -p 9000
The jonas server in jonas domain is RUNNING on BSM.frcl.bull.fr Memory allocated = 57700 used = 39949 Threads = 95 HTTP requests count = 0 Committed transactions count = 0
check_JOnAS -H frcls6260 –N frcls6260.frcl.bull.fr -a instance1 -d jonas -s instance1 -p 9000 -m

Appendix A. Check Commands for AddOn Customizable Services 139
The instance1 (master)server in jonas domain is RUNNING on frcls6260 Memory allocated = 64315 used = 36359 Threads = 98 HTTP requests count = 478157905 Committed transactions count = 0

140 Bull System Manager 1.3 Server Add-ons - Installation and Administrator's Guide

Appendix B. Third Party License Agreement 141
Appendix B. Third Party License Agreement
B.1 VMware(R) Infrastructure Perl Toolkit Agreement VMware, Inc. ("VMware") provides the VMware Infrastructure Perl Toolkit ("Toolkit") to you subject to the following terms and conditions. If you disagree with any of the following terms, then do not use this Toolkit.
1. This Toolkit contains a variety of materials, including but not limited to, interface definitions, documentation, sample utility applications and sample code regarding programming interfaces to one or more VMware products as referenced in such materials ("VMware Software"). This Toolkit is intended to be used to execute supplied sample utilities or to serve as a guide for writing programs to interact with the VMware Software.
2. Subject to the restrictions below, you may download and make a reasonable number of copies of the Toolkit contents for your personal use solely for the purpose of creating software that communicates with VMware Software ("Developer Software"). You agree to defend, indemnify and hold harmless VMware, and any of its directors, officers, employees, affiliates or agents, from and against any and all claims, losses, damages, liabilities and other expenses (including reasonable attorneys' fees), arising from your modification and distribution of the utility applications or sample code or breach of this Toolkit Terms and Conditions.
3. Restrictions: You may not (1) use the Toolkit to design or develop anything other than Developer Software; (2) make any more copies of the Toolkit than are reasonably necessary for the authorized use and backup and archival purposes; (3) modify, create derivative works of, reverse engineer, reverse compile, or disassemble the Toolkit, except that you may modify and create derivative works of the utility applications and sample code and distribute the modified utility applications and sample code in connection with Developer Software; (4) distribute, sell, lease, rent, lend, or sublicense any part of the Toolkit to any third party except as provided herein; (5) use the Toolkit to (a) design or develop programs to circumvent or over-ride the display of any VMware End User License Agreements to end customers and (b) design or develop software to upload or otherwise transmit any material containing software viruses or other computer code, files or programs designed to interrupt, destroy, or limit the functionality of any software or hardware.
4. VMware retains ownership of the Toolkit, including without limitation all copyrights and other intellectual property rights therein.
5. You may not represent that the programs you develop using the Toolkit are certified or otherwise endorsed by VMware. You may not use the VMware name or any other trademarks or service marks of VMware in connection with programs that you develop using the Toolkit.
6. If you are currently entitled to support from VMware, you may submit a support request for installation assistance of this Toolkit and assistance in executing unmodified utility applications provided with this Toolkit. Except as provided herein, you are not entitled any VMware support for this Toolkit or any other services from VMware in connection with this Toolkit.
142 Bull System Manager 1.3 Server Add-ons - Installation and Administrator's Guide
7. Term, Termination and Changes: This Agreement shall continue as long as you are in compliance with the terms specified herein or until otherwise terminated. You and or VMware each may terminate this Agreement for any reason at any time. You agree, upon termination, to destroy all copies of the Toolkit within your possession or control. The Confidential Information, Limitations of Warranties, Liability and Indemnification sections set out in this Agreement shall survive any termination or expiration of this Agreement.
8. Limitations of Warranties and Liability: THE TOOLKIT IS PROVIDED "AS IS" WITHOUT ANY WARRANTIES OF ANY KIND. TO THE MAXIMUM EXTENT PERMITTED BY APPLICABLE LAW, VMWARE DISCLAIMS ANY IMPLIED WARRANTIES, INCLUDING, WITHOUT LIMITATION, ANY IMPLIED WARRANTIES OF MERCHANTABILITY, FITNESS FOR A PARTICULAR PURPOSE AND NON-INFRINGEMENT OF INTELLECTUAL PROPERTY RIGHTS.
TO THE MAXIMUM EXTENT PERMITTED BY APPLICABLE LAW, IN NO EVENT WILL VMWARE BE LIABLE FOR ANY LOST PROFITS OR BUSINESS OPPORTUNITIES, LOSS OF USE, BUSINESS INTERRUPTION, LOSS OF DATA, OR ANY OTHER INDIRECT, SPECIAL, INCIDENTAL, OR CONSEQUENTIAL DAMAGES ARISING OUT OF THE TOOLKIT OR YOUR USE OF THE TOOLKIT, UNDER ANY THEORY OF LIABILITY, WHETHER BASED IN CONTRACT, TORT, NEGLIGENCE, PRODUCT LIABILITY, OR OTHERWISE. BECAUSE SOME JURISDICTIONS DO NOT ALLOW THE EXCLUSION OR LIMITATION OF LIABILITY FOR CONSEQUENTIAL OR INCIDENTAL DAMAGES, THE PRECEDING LIMITATION MAY NOT APPLY TO YOU.
VMWARE'S LIABILITY ARISING OUT OF THE TOOLKIT PROVIDED HEREUNDER WILL NOT, IN ANY EVENT, EXCEED US$5.00.
THE FOREGOING LIMITATIONS SHALL APPLY TO THE MAXIMUM EXTENT PERMITTED BY APPLICABLE LAW, REGARDLESS OF WHETHER VMWARE HAS BEEN ADVISED OF THE POSSIBILITY OF SUCH DAMAGES AND REGARDLESS OF WHETHER ANY REMEDY FAILS OF ITS ESSENTIAL PURPOSE.
9. These terms are governed by the laws of the State of California and the United States of America without regard to conflict of laws principles. You may not assign any part of this Agreement without the prior written consent of VMware. Any attempted assignment without consent shall be void. These terms constitute the entire agreement between you and VMware with respect to the Toolkit, and supersede all prior written or oral communications, understandings and agreements. Any waiver of these terms must be in writing to be effective. If any provision of these terms is found to be invalid or unenforceable, the remaining terms will continue to be valid and enforceable to the fullest extent permitted by law.

Index 143
Index
A Alerts, 1
Alerts Service, 20, 26, 28
All Service, 86
Armg2_4.mib, 28
B BSMEscalaLPAR, 75
BSMGAMTT, 19
BSMLSICIM, 22
BSMMegaRaidSAS, 25
Bull Video Services Management, 87
BullVideoServices Category, 88
BVS, 87
C check command
syntax, 95
check_ EMCCLARIION, 31
check_ JOnAS, 138
check_BVS, 88, 136
check_DynamicDomains, 86, 134
check_EMCCLARIION, 104, 116, 118, 120
check_esx_mem, 58, 125
check_esx_server, 58, 124, 127
check_esx_snmp, 58, 125
check_esx_vm, 58, 125, 128
check_esx_vm_cpu, 58, 126
check_esx_vm_memory, 58, 126
check_esx3, 124, 127
check_gamttRAID, 20, 95
check_LSICIM, 23, 98
check_LSICIM_ctrl, 23
check_MegaRaidSAS(_IR), 26
check_MegaRaidSAS(_IR), 100
check_NECFDA, 28, 103
check_netapp_globalstatus, 111
check_netapp_globalstatus, 34
check_netapp-numdisks, 107
check_netappraid, 35, 113
check_netappvol, 35, 112
check_NSM_escala_lpar, 129
check_NSM_JOnAS, 92
check_sensor, 114
check-netapp-cpuload, 34
check-netapp-cpuload, 106
check-netapp-failedfans, 34, 109
check-netapp-failedpwr, 34, 110
check-netapp-numdisks, 34
CIM, 22
clariion.mib, 31, 37, 39, 45
Commands check_ JOnAS S, 138 check_BVS, 88, 136 check_DynamicDomains, 134 check_EMCCLARIION, 104, 116, 118, 120 check_esx_mem, 58 check_esx_server, 58 check_esx_snmp, 58 check_esx_vm, 58 check_esx_vm_cpu, 58 check_esx_vm_memory, 58 check_esx3, 124, 127 check_gamttRAID, 20, 95 check_LSICIM, 23, 98 check_LSICIM_ctrl, 23 check_MegaRaidSAS(_IR), 26, 100

144 Bull System Manager 1.3 Server Add-ons - Installation and Administrator's Guide
check_NECFDA, 103 check_netapp_globalstatus, 111 check_netapp-numdisks, 107 check_netappraid, 113 check_netappvol, 112 check_NSM_escala_lpar, 129 check_NSM_JOnAS, 92 check_sensor, 114 check-netapp-cpuload, 106 check-netapp-failedfans, 109 check-netapp-failedpwr, 110 ping, 1
CPULoad, 33
CTRLstatus Service, 23
CurrentPower, 42
D Datagrams Service, 88
DDFA, 85
DeltaPressure, 42
Disk Space Requirements, 5
Disks, 33
Dynamic Domains For Applications, 85
DynamicDomains Category, 86
E EMC CLARiiON Management, 30, 36, 38, 44
EmcClariion Category, 31, 37, 39, 45
EscalaLPAR, 75
ESX Virtual Platform, 50
F Fans, 33
G GAM, 19
GAMTT, 19
GAMTTraid Category, 20
GlobalStatus, 33
GUI, 17 configuration tasks, 17 starting, 17
H Hardware Management Console (HMC), 75
Hardware Manager, 3
HMC (Hardware Management Console), 75
Host ESX, 54, 66 VMware, 54, 66
I Installation
Requirements, 5 Windows, 8
Installation (Linux), 12
Integrated Virtualization Manager (IVM), 75
IVM (Integrated Virtualization Manager), 75
J JOnAS, 88
jonasAdmin, 93
L Logical partitioning (LPAR), 75
LPAR (logical partitioning), 75
LSI 22320 chip, 22
LSI CIM, 22
LSI MegaRAID, 19
LSI MegaRAID SAS (IR), 25
lsi-adaptersas(ir).mib, 26

Index 145
LsiCIM Category, 23
M MegaRAID, 19
megaraid.mib, 20
MegaRaidSAS(_IR) Category, 26
Memory Requirements, 5
MIB, 3
Monitoring Configuration, 17
N NetApp Category, 33
NetApp Management, 32
netapp.mib, 33
Notifications, 1
O Operating Systems, 5
P Partitioning, 75
ping command, 1
Power, 33
PowerStatus, 42
R RAIDStatus, 33
RAIDstatus Service, 23
Recording Service, 88
Restrictions, 7
S Server Add-On, 4
Service Cloning, 18 Creating, 18 Customization, 17 Customizing, 18 definition, 2
ServiceStatus, 20, 26, 28
SNMP traps, 3
Storage Manager, 3
Storage Server, 27
StoreWay FDA Management, 27
StoreWayFDA Category, 28
Streaming Service, 88
T TemperatureAverage, 42
Thresholds, 1
U Uninstallation (Linux), 15
Uninstallation (Windows), 11
Upgrading (Linux), 16
Upgrading (Windows), 11
URL Bull System Manager main page, 17
V ValveAperture, 42
Virtualization Manager, 3
Virtualization Server, 41, 47
Vmware ESX, 49, 62
VolumeStatus, 33

146 Bull System Manager 1.3 Server Add-ons - Installation and Administrator's Guide
W Water Cooled Door Management, 41
WaterCooledDoorMIB.mib, 42


BULL CEDOC
357 AVENUE PATTON
B.P.20845
49008 ANGERS CEDEX 01
FRANCE
REFERENCE 86 A2 59FA 03