bryte chemical laboratory quality assurance · pdf filebryte chemical laboratory quality...
TRANSCRIPT
Quality Assurance Technical Document 8
Bryte Chemical Laboratory
Quality Assurance Manual
May 2006
State of California The Resources Agency Department of Water Resources
Bryte Chemical Laboratory Quality Assurance Manual
May 2006
State of California The Resources Agency
Department of Water Resources Bryte Chemical Laboratory
1450 Riverbank Road West Sacramento, California 95605
(916) 375-6008 (916) 375-6019 FAX
State of California Arnold Schwarzenegger
Governor
The Resources Agency Mike Chrisman
Secretary for Resources
Department of Water Resources Lester Snow
Director
Nancy Saracino Chief Deputy Director
Jerry Johns
Deputy Director
Les Harder Deputy Director
Gerald Johns
Deputy Director
L. Lucinda Chipponeri Deputy Director
David Sandino Chief Counsel
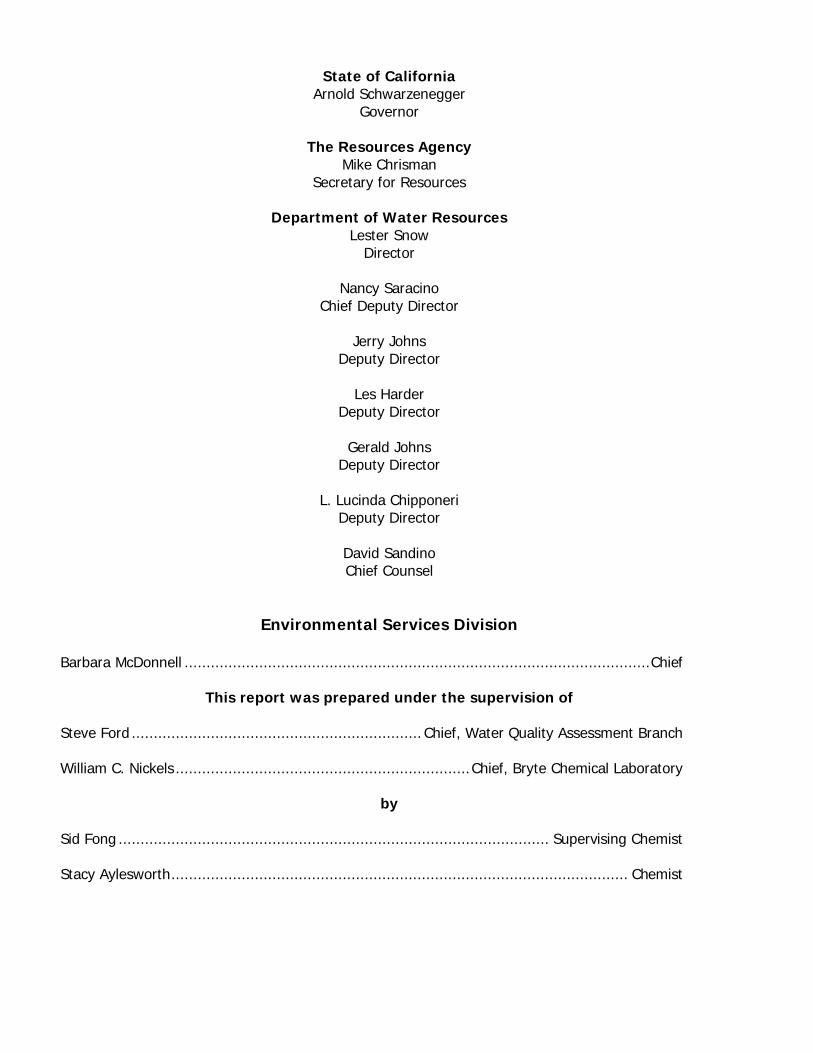
Environmental Services Division
Barbara McDonnell ..........................................................................................................Chief
This report was prepared under the supervision of Steve Ford .................................................................. Chief, Water Quality Assessment Branch William C. Nickels ...................................................................Chief, Bryte Chemical Laboratory
by Sid Fong .................................................................................................. Supervising Chemist
Stacy Aylesworth........................................................................................................ Chemist
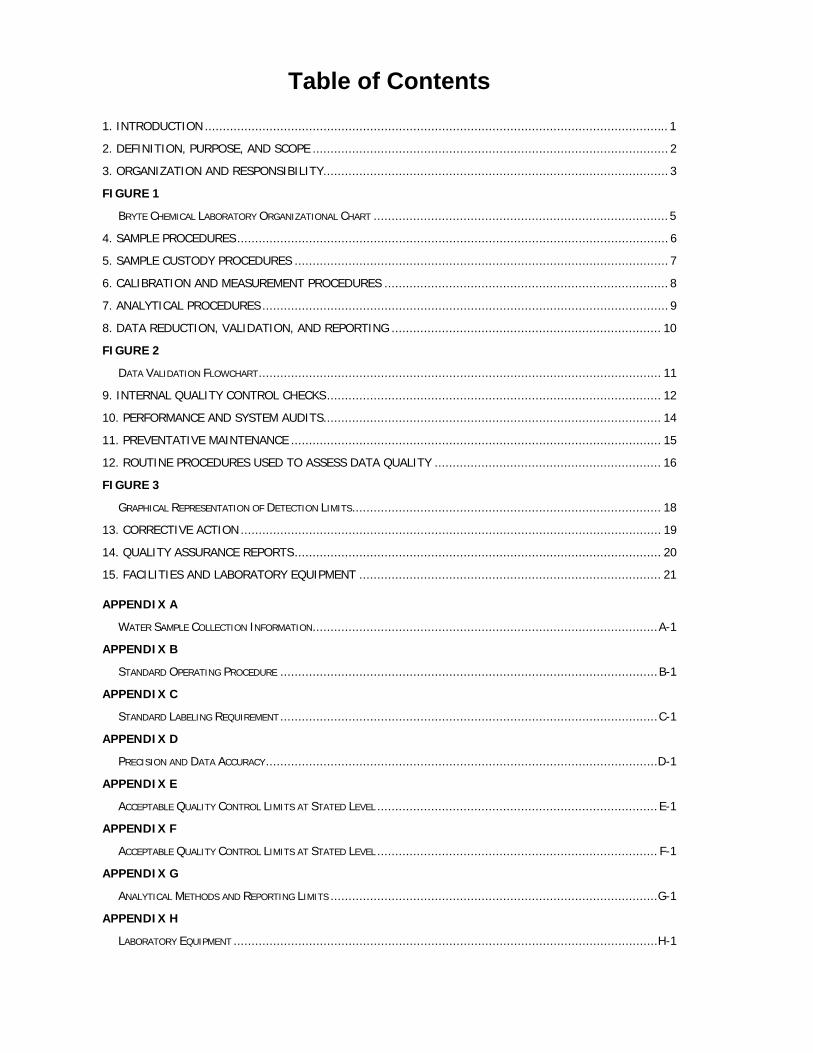
Table of Contents
1. INTRODUCTION ................................................................................................................................. 1
2. DEFINITION, PURPOSE, AND SCOPE ................................................................................................... 2
3. ORGANIZATION AND RESPONSIBILITY................................................................................................ 3
FIGURE 1 ............................................................................................................................................. 9
BRYTE CHEMICAL LABORATORY ORGANIZATIONAL CHART ..................................................................................5
4. SAMPLE PROCEDURES ........................................................................................................................ 6
5. SAMPLE CUSTODY PROCEDURES ........................................................................................................ 7
6. CALIBRATION AND MEASUREMENT PROCEDURES ............................................................................... 8
7. ANALYTICAL PROCEDURES ................................................................................................................. 9
8. DATA REDUCTION, VALIDATION, AND REPORTING ........................................................................... 10
FIGURE 2 ........................................................................................................................................... 15
DATA VALIDATION FLOWCHART................................................................................................................ 11
9. INTERNAL QUALITY CONTROL CHECKS............................................................................................. 12
10. PERFORMANCE AND SYSTEM AUDITS.............................................................................................. 14
11. PREVENTATIVE MAINTENANCE ....................................................................................................... 15
12. ROUTINE PROCEDURES USED TO ASSESS DATA QUALITY ............................................................... 16
FIGURE 3 ........................................................................................................................................... 22
GRAPHICAL REPRESENTATION OF DETECTION LIMITS...................................................................................... 18
13. CORRECTIVE ACTION ..................................................................................................................... 19
14. QUALITY ASSURANCE REPORTS...................................................................................................... 20
15. FACILITIES AND LABORATORY EQUIPMENT .................................................................................... 21
APPENDIX A ........................................................................................................................................ 1
WATER SAMPLE COLLECTION INFORMATION................................................................................................A-1
APPENDIX B ........................................................................................................................................ 1
STANDARD OPERATING PROCEDURE .........................................................................................................B-1
APPENDIX C ........................................................................................................................................ 1
STANDARD LABELING REQUIREMENT.........................................................................................................C-1
APPENDIX D........................................................................................................................................ 1
PRECISION AND DATA ACCURACY.............................................................................................................D-1
APPENDIX E ........................................................................................................................................ 1
ACCEPTABLE QUALITY CONTROL LIMITS AT STATED LEVEL ..............................................................................E-1
APPENDIX F ........................................................................................................................................ 1
ACCEPTABLE QUALITY CONTROL LIMITS AT STATED LEVEL .............................................................................. F-1
APPENDIX G ........................................................................................................................................ 1
ANALYTICAL METHODS AND REPORTING LIMITS ...........................................................................................G-1
APPENDIX H........................................................................................................................................ 1
LABORATORY EQUIPMENT ......................................................................................................................H-1
1. Introduction
The Bryte Chemical Laboratory’s primary role within the Department of Water Resources is to provide analytical, chemical, and biological laboratory services for DWR. As a secondary role, the laboratory provides these same services to other governmental agencies. This manual addresses the quality assurance and quality control measures used by the laboratory in determining the organic, inorganic, and biological entities found in California waters. This QA manual addresses all activities that are essential in the operation of the analytical laboratory.
The principles presented in this manual are used to ensure the laboratory is providing information that is factual, precise, accurate, reliable, and adequate for its intended use. This manual is designed to meet the U.S. Environmental Protections Agency policy guidelines as outlined in the Interim Guidelines and Specifications for Preparing Quality Assurance Project Plans, QAMS-005/80, and also to meet the California Department of Health Services, Environmental Laboratory Accreditation Program.
1
2. Definition, Purpose, and Scope
Definition of Terms Quality Assurance Program: An orderly assemblage of management policies, objectives, principles, and general procedures by which an agency or laboratory outlines how it intends to produce data of known and accepted quality. Quality Assurance: The total integrated program for assuring the reliability of monitoring and measurement data. QA is a system for integrating the quality planning, quality assessment, and quality improvement efforts to meet user requirements. Quality Control: The routine application of procedures for obtaining prescribed standards of performance in the monitoring and measurement process. Quality Assessment: The overall system of activities to provide assurance that the QC task is being performed effectively. Quality Assessment involves a continuing evaluation of performance of the production system and the results produced. Standard Operating Procedure: A detailed written procedure designed to systematize and standardize the performance of the procedure. Purpose of Manual The purpose of this manual is to describe the QA/QC program for all laboratory practices in order to generate the most precise and accurate data possible. To achieve this purpose, a comprehensive and scientifically sound QA plan has been implemented and is now used.
Scope - Objectives The ultimate goal of the laboratory is to produce quality data that is accurate, precise, complete, representative, and compatible. While proper validated methodologies are necessary, these alone are not sufficient to assure data quality. The QA plan is designed to control and monitor laboratory activities, ensuring the laboratory meets the data quality objectives listed above. The QA program will be carried out under the direction of the Laboratory QA Officer who reports directly to the Chief of the Bryte Chemical Laboratory. It covers all aspects of sample receiving, storage, preparation, analysis, and reporting. Standard QC procedures, data reduction, and reporting will be in compliance with requirements in Standard Methods for Examination of Water and Wastewater, 19th ed. or later editions. Written SOPs for sample receipt, chain of custody, preservation, storage, preparation, analysis, safety, and reporting shall be followed. Log books, printed documents, data, or other written documentation shall be available to describe the work performed in each of the following stages of analysis: • Chain of custody • Sample preservation • Sample receipt • Sample storage • Sample preparation • Sample Analysis • Data reduction • Data reporting • QA/QC
2
3. Organization and Responsibility
Executing an effective QA program in the laboratory demands the commitment and attention of both management and staff. All laboratory personnel within the organization play a vital role in assuring a continued commitment to the quality of work accomplished. (See Figure 1, Bryte Chemical Laboratory Organizational Chart). The laboratory staff is highly qualified and trained in the following areas: • Gas chromatography/mass spectrometry
(GC/MS) • Gas chromatography (GC) • High performance liquid chromatography
(HPLC) • Purge and trap techniques • Ion chromatography (IC) • Flame atomic absorption spectroscopy (AA) • Graphite furnace atomic absorption
spectroscopy • Colorimetric analytical techniques • Carbon analysis (TOC, DC) • Wet chemical analysis • Analytical method development • Emission spectroscopy (ICP, ICP/MS) • Sample preparation • Fecal coliform • Chlorophyll and pheophytin • Phytoplankton
Chief of the Bryte Chemical Laboratory The Chief of the Bryte Chemical Laboratory is responsible for all operational activities within the laboratory and is accountable for all data generated by the laboratory. QA responsibilities consist of: • Final review of all data generated by the
laboratory • Final authority to release data to requestor • Final authority on all analytical procedures and
SOPs used by laboratory personnel • Coordinates with the Laboratory QA
Officer in implementing the laboratory QA plan and its policies, revisions, and any corrective action to ensure compliance
• Periodic audits of the QA plan to ensure the objectives and procedures are being followed
Laboratory QA Officer The Laboratory QA Officer is independent and reports only to the Chief of the Bryte Chemical Laboratory. The Laboratory QA Officer: • Recommends QA policy to the Chief of the Bryte
Chemical Laboratory • Develops and manages the laboratory QA plan,
revises it as needed • Oversees QC practices in the laboratory and
data management • Helps develop analytical procedures • Develops precision and accuracy
guidelines/criteria • Reviews data quality and laboratory
performance audits • Conducts data quality and laboratory
performance audits • Prescribes and monitors corrective actions • Recommends QC training for personnel • Coordinates all QC/QA activities • Approves SOPs • Monitors laboratory performance, turnaround,
and holding times Data Control Section The Data Control Section is responsible for all data coordination and review. Staff performs the following: • Reviews all analysis report forms for
completeness • Reviews all analysis request forms to ensure
compliance within contractual obligations • Ensures requestor receives the final completed
data report • Maintains records and archives of all data
reports
Laboratory Staff Since the greatest amount of responsibility for a successful QA program rests with the analysts, it is important that they be highly qualified and competent. New and experienced laboratory personnel shall be carefully trained for new specific work assignments. Laboratory personnel have on-site access to technical journals and textbooks as well as access to the Resources Agency Library services. Combined administrative and technical staff meetings will be held to help provide a good
3
information exchange forum. Laboratory personnel are responsible for: • Having a working knowledge of the QA plan • Ensuring that all work generated is in
compliance with QC acceptance criteria • Performing all work according to written
SOPs • Ensuring that all documentation to their work
is complete and accurate • Ensuring that acceptance of any data outside
QC criteria must be approved by laboratory management
• Maintaining records for a all QC data • Notifying management immediately of any QC
issues • Writing and updating SOPs • Meeting holding and turnaround times
4
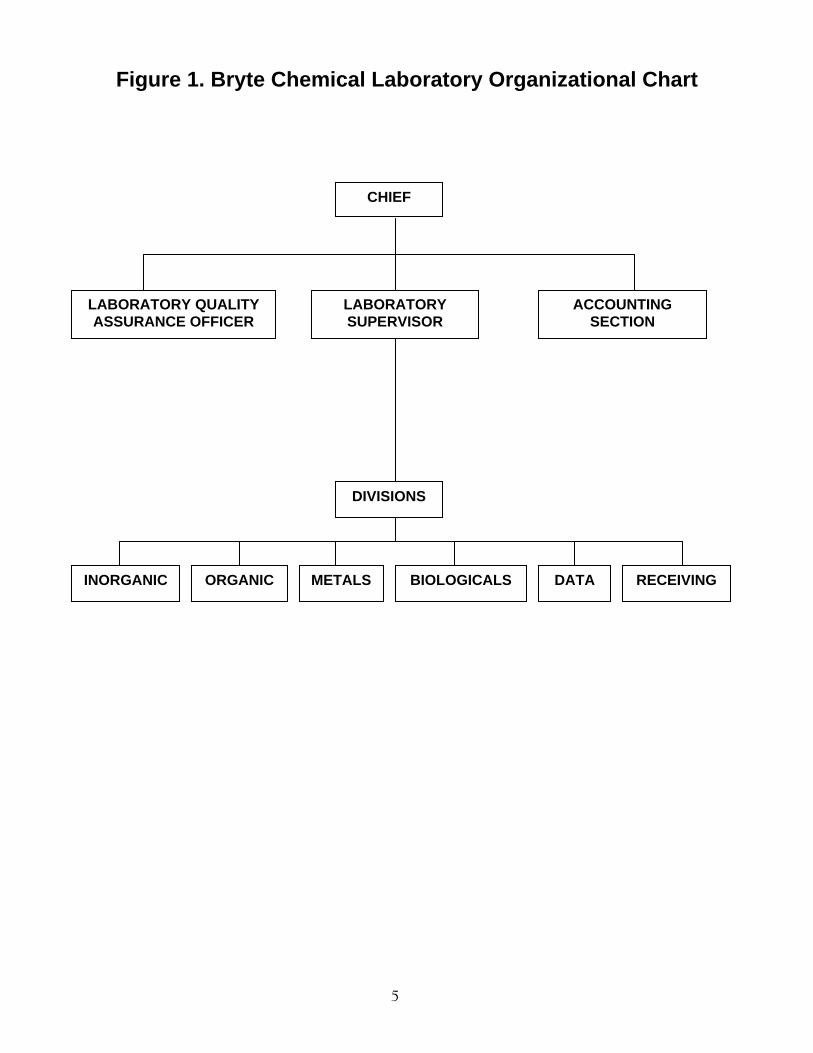
Figure 1. Bryte Chemical Laboratory Organizational Chart
LABORATORY QUALITY ASSURANCE OFFICER
CHIEF
ACCOUNTING SECTION
INORGANIC ORGANIC METALS BIOLOGICALS DATA RECEIVING
DIVISIONS
LABORATORY SUPERVISOR
5

4. Sample Procedures
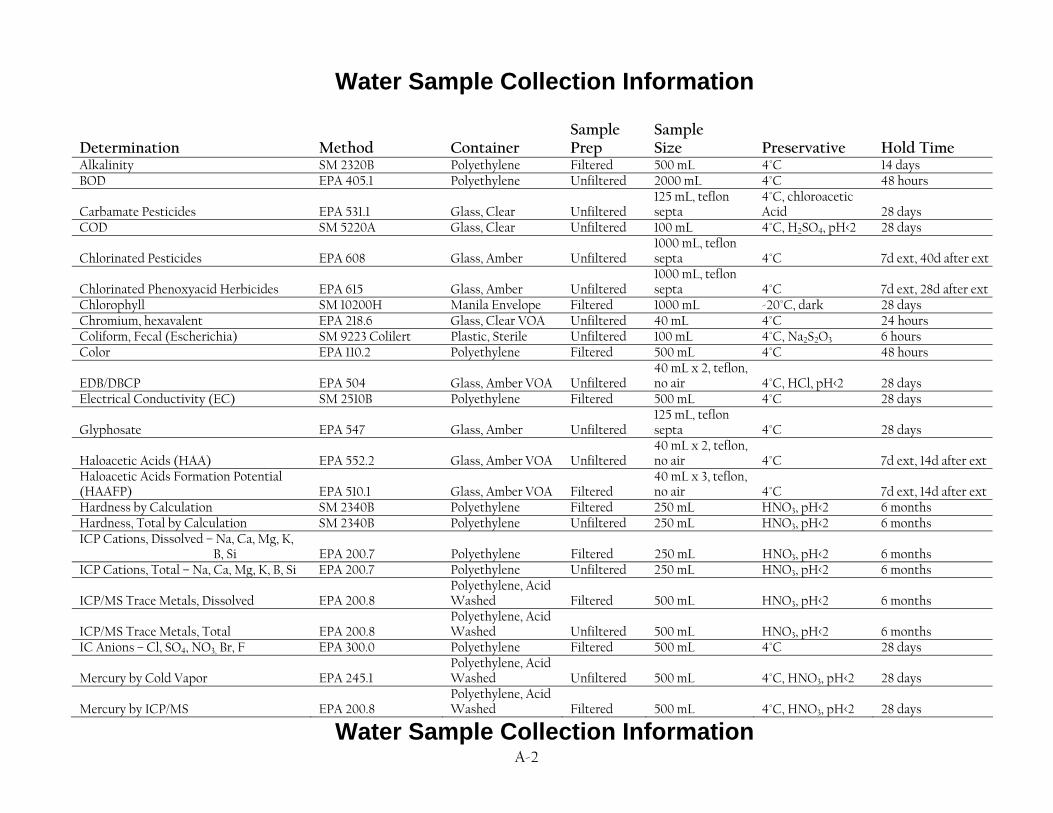
The laboratory does not take part in any of the actual sampling activities, but the sample collection process is a major concern of the laboratory. Since the ultimate quality of data generated begins with the sample collection process, the laboratory can assist in the sampling procedure by providing consultation and assistance to project managers and any contractors involved in a project. (See DWR Sampling Manual.) Sample Containers and Holding Times The laboratory supplies all necessary sampling materials to DWR field sampling units. Using properly cleaned containers and correct preservatives as well as adhering to proper holding times are essential factors for maintaining sample integrity and representativeness. Requirements for sample containers, preservation techniques, and holding times are found in one of the following references (or later editions): • Standard Methods for the Examination of Water and Wastewater, American Public Health Association, et al., 19th Edition, or later • Federal Register Volume 49, No. 209, Friday, October 26, 1984, EPA, 40 Code of Federal Regulations, Part 136 • Handbook for Sampling and Sample Preservation of Water and Wastewater, EPA 600/4-82-029, September 1982 (Does not apply to drinking water) SOPs for cleaning and preparing glassware and sample containers are strictly complied with to ensure that the sample is not contaminated during the collection process due to containers. Appropriate volumes of the sample must also be collected to ensure that the required detection limits can be met, the QC samples analyzed, and any necessary sample reanalysis performed.
For proper containers, holding times, preservation techniques, and volumes required, see Appendix A (Water Sample Collection Information). Sample Submittal Samples are brought to the laboratory by delivery services or field sampling crews. Any sample taken in a nonstandard container, improperly preserved, or shipped in an unacceptable manner may be rejected. Each sample or group of samples needs to be entered into the Field and Laboratory Information Management System (FLIMS). This can be done either manually in the laboratory or in the field and then electronically transferred directly into FLIMS. All pertinent field data is tracked by FLIMS such as the date, time, location, field sampler, field data, laboratory tests requested, etc. When the samples are completely logged in, FLIMS notifies the laboratory personnel that samples need to be analyzed. Sample Storage and Handling The samples received by the laboratory are placed in appropriate storage or sent directly to the test area. The storage areas are located in the receiving room and consist of refrigerators at 4°C, freezers at -10°C, and designated storage cabinets for sample types (i.e., metals, standard minerals, etc.). Once the analysis is completed, the remaining sample is kept for 30-60 days in storage, and then discarded. If a contracting officer should request return of a sample prior to the expiration interval, it will be returned in a manner that meets the required criteria. Quality Assurance Sample To evaluate and ensure acceptable results, the laboratory requires that samplers submit travel blanks, field blanks, and/or duplicate samples with their samples. For specific requirements, see DWR Water Quality Sampling Procedures.
6
5. Sample Custody Procedures
A Chain of Custody form must be completed for samples received by the laboratory which may be used as evidence for enforcement purposes. Once a sample is received, the Chain of Custody Officer or the alternate is notified. All information is then transcribed to the Chain of Custody form and the sampler signs the form, witnessed by the Chain of Custody Officer or alternate. The sample is then transferred to the appropriate location to wait for analysis. For each transfer of physical custody, an entry of disposition and one of receipt is made on the custody form.
While in the laboratory, samples are stored in a secure area under appropriate preservation and environmental conditions. Following the completion of the analysis, the samples are stored until the results are submitted to the Program Manager and permission to discard has been received. A notation of completion is made on the Chain of Custody form, and the document is then filed with the analysis report. Copies of the files are maintained in the DWR archives.
7
6. Calibration and Measurement Procedures
Calibration of instruments is required to ensure that the analytical system is operating correctly and functioning at the proper sensitivity to meet established detection limits. In general, calibration is accomplished by measuring instrument response to standards containing the analytes in known concentrations while being in compliance with manufacturer’s recommendations. Instrument Calibration and Frequency Today’s complex instrumentation and calibration frequencies are extremely varied; therefore, a bound notebook is assigned to each instrument to log the following: • All maintenance performed • All daily sensitivity checks and/or calibration
results where applicable according to methodology found in SOP
• All manufacturer’s maintenance and repairs Each log entry will contain the date, operator’s name, and operation performed (i.e., maintenance, sensitivity check, etc.). Calibration is accomplished on a daily basis or whenever the following instruments are used: • Atomic Absorption (flame and furnace) • Spectrophotometers • Gas-Liquid Chromatographs • Ion Chromatographs • Mass Spectrometers • Auto Titrators • Auto Analyzers • Atomic Emission (ICP and ICP/MS)
Other instruments may require weekly, monthly, quarterly, or even semiannual calibration (i.e., balances, ovens, exhaust hoods, etc.). Once a standard calibration range has been established, at least three standards are normally used in daily standardization where
applicable. For specifics, see the SOP for a particular analytical procedure. If a problem arises which cannot be corrected by the instrument operator, then the Laboratory QA Officer is notified. The officer will coordinate the necessary diagnostic and corrective measures to be implemented. Documentation will be provided a in the instrument log book. Calibration Standards/Reagents Preparation A critical area in the generation of quality data is the quality, purity, and traceability of the standards and reagents used in analytical calibration procedures. All primary reference standards and standard solutions used by the laboratory are obtained from the National Institute of Standards and Technology or commercial manufacturers. All standards, standard solutions, and reagents are validated prior to being used. Validation procedures range from a check for chromatographic purity to verification of concentration of the standard using standards prepared at a difference time or from a different source. All Stock Standards are labeled as to the following: • Name and concentration of stock • Method of preparation • Date prepared/Preparer’s name • Supplier, purity, lot number, and expiration date • Any other pertinent information
New working standards are compared to the remainder of the current working standards for any concentration differences, formation of precipitates, and any signs of deterioration. Reagents are also examined for purity by subjecting an aliquot to the analytical method for its intended use. For example, reagent water, organic solvents, or acids are analyzed for possible contamination prior to use.
8
7. Analytical Procedures
Analytical methods are derived from the latest editions of one of the following references: • Methods for Chemical Analyses of Water and Wastes,
EPA-600/4-79-020 (revised March 1983) (Not used for drinking water.)
• Standard Methods for the Examination of Water and Wastewater, 19th Edition or later, APHA, American Water Works Association, Water Pollution Control Federation, Washington, D.C. (1992)
• Methods for Determination of Inorganic Substances in Water and Fluvial Sediments, Techniques of Water Resources Investigations, USGS, Book 5, Washington, D.C. (1985)
• Annual Book of American Society for Testing and Material Standards, Volumes 11.01 and 11.02, ASTM, Philadelphia, Pennsylvania (1988)
• Official Methods of Analysis, 14th Edition, AOAC International, Arlington, Virginia (1984)
• Methods for Organic Chemical Analysis and Municipal and Industrial Wastes, EPA 600/4-82-057, (1982)
• Guidelines Establishing Test Procedures for the Analysis of Pollutants Under Clean Water Act, Federal Register, EPA, 40 CFR, Part 136, (1984)
• Biological Field and Laboratory Methods, EPA-670/4-73-001, (1973)
• Test Methods for Evaluating Solid Wastes, Physical/Chemical Methods, EPA, SW846, Volumes 1A, 1B, 1C, and II, (1986)
For a specific analytical method used, see Appendix F.
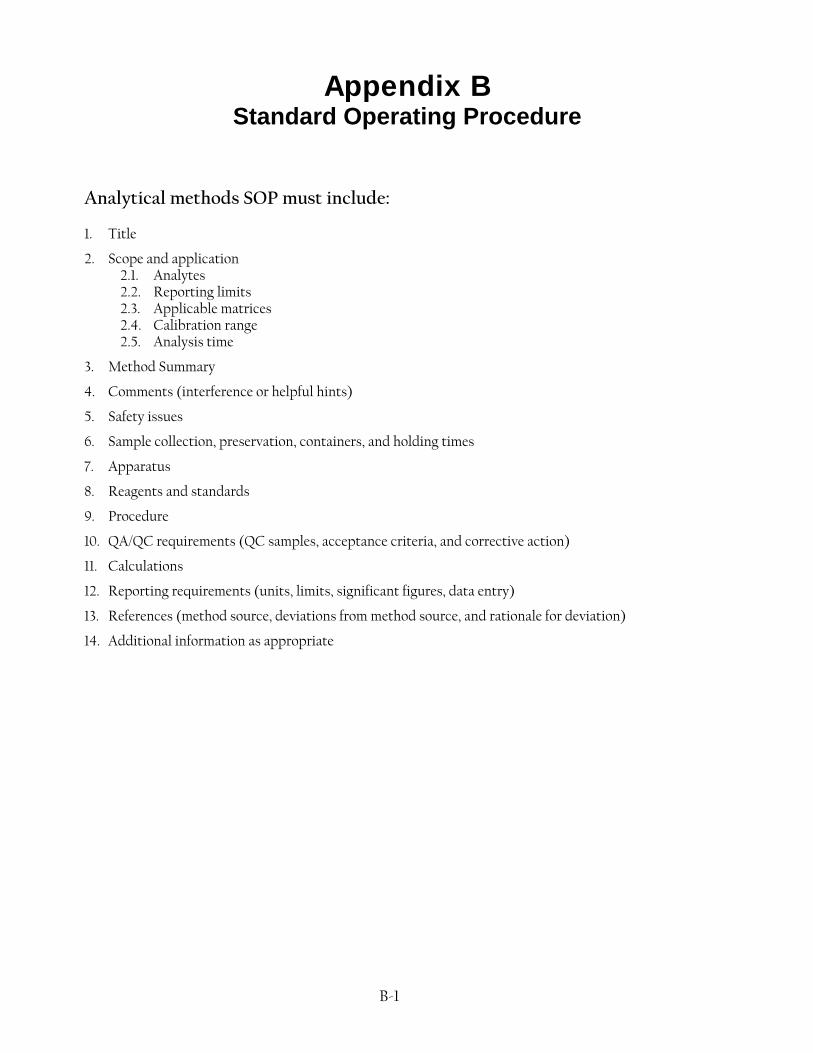
Standard Operating Procedure Analytical methods chosen are dependent upon certain objectives, some of which consist of precision and accuracy, type of sample matrix, and quantitative sensitivity. Each analytical method routinely used is documented in the form of a SOP which contains complete detailed instructions to standardize the expected performance of the analytical method. Contents of a laboratory SOP are given in Appendix B. Any deviations from published methodology are documented in the SOP. Analytical Methodology Verification Before any analytical method is routinely used to generate data, the method is validated. Criteria used to validate a method consist of the following: • Method selection by senior staff • Testing of method verifying reporting limits,
dynamic range, matrix effects, precision, and accuracy criteria
• Data acceptance criteria must be approved by the Laboratory QA Officer and Chief of the Bryte Chemical Laboratory
• Final documentation of the method in a written SOP
9
8. Data Reduction, Validation, and Reporting
The final step in analyzing samples is to review the data collected prior to reporting. The analytical data generated within the laboratory are extensively checked and cross-checked for their accuracy, precision, and completeness. The validation process consists of data generation, reduction review, and finally reporting results to the submitter. The primary responsibility for the generation of accurate data rests with the analyst. The analyst performs the data calculation functions and is responsible for the initial examination of the finished data. All data reduction steps applied to the raw data is outlined in the appropriate analytical SOPs. Each analyst reviews the quality of their work based on the following guidelines: • The appropriate SOP has been followed • Sample preparation is correct and complete • Analytical results are correct an complete • Blank correction procedures and followed, if
applicable • QC samples are within established QC limits • All documentation is complete, including analysis
report, QC form and QC charts The QC procedures outlined in the analytical SOP are used for the preliminary validation of the results along with any historical data, if available. When applicable, correlation checks are used to validate the data, such as anion-cation balances, specific conductance versus dissolved solids, dissolved solids versus calculated dissolved solids, Biological Oxygen Demand versus suspended solids, Chemical Oxygen Demand or Total Organic Carbon, etc. After data reduction and validation steps are computed, the analyst enters the data into the FLIMS and releases the QC batch. The data package is the forwarded electronically in the FLIMS to the QA Officer who evaluates the data along with all pertinent QC results such as laboratory control standards, matrix spikes, surrogates, duplicates, blind duplicates, blind Performance Evaluation samples, and
labortory performance records, as well as historical records to help form a basis for acceptance of data. If the data package passes QA/QC criteria, it is released in the FLIMS to the senior staff. A data package containing the required QC batches for each sample submittal is then reviewed by senior staff for final validation, completeness, and acceptance. The final review is based on the following criteria: • Calibration data reviewed • Appropriate methodologies used • QC samples within established guidelines • Comparison of historical data when available • Correlation checks reviewed (i.e., anion-cation
balance, electrical conductivity versus total dissolved solids, etc.,) when applicable.
• Evaluation of data in general by comparability, assessment, and reasonableness of sample types, (i.e., wastewaters, surface waters, groundwaters, etc.)
• Ensures completion of all analytical work requested
After validation and review by senior staff, the approved data package is incorporated into a final analysis report. The final report is released to the submitter either in a printed format with all the appropriate information or sent to the submitter by FLIMS in electronic format. The full data package is then archived for possible future use. Errors or problems which may occur are documented and transmitted to the appropriate section. The cause of the errors is then addressed either by further training or reevaluation of the analytical method SOPs to ensure quality data is generated at the analyst level. See Figure 2. Data Validation Flowchart on the following page.
10
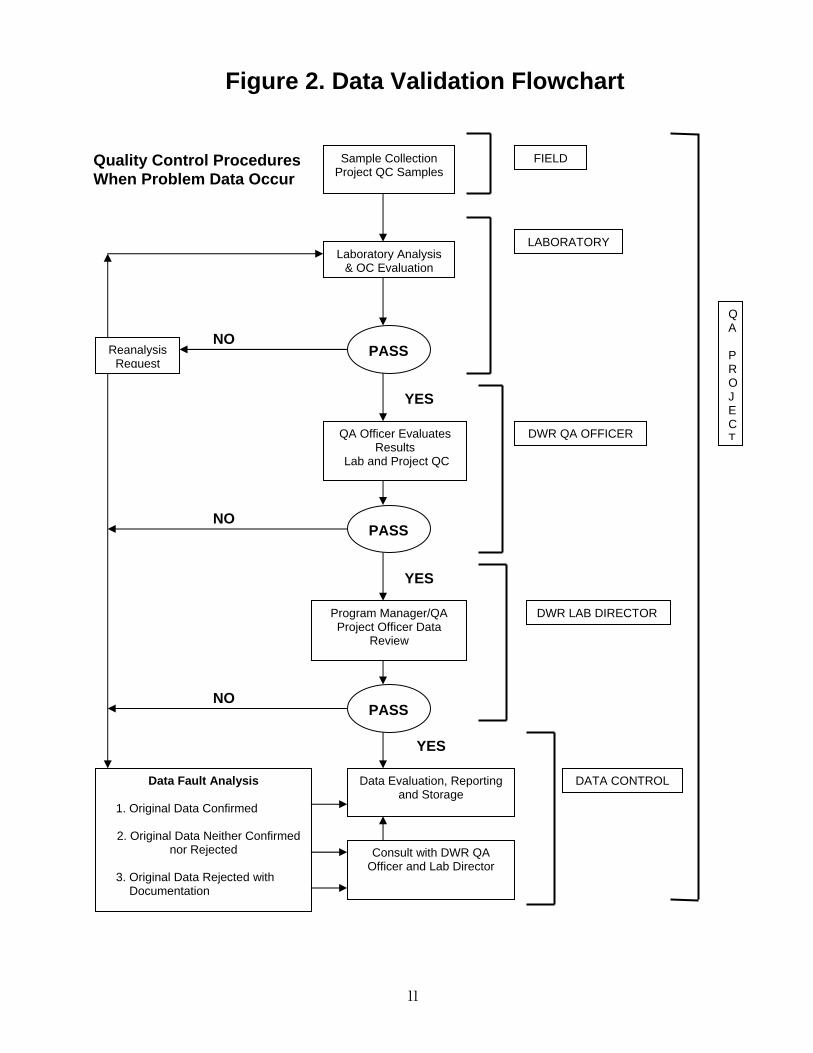
Figure 2. Data Validation Flowchart
Quality Control Procedures When Problem Data Occur
Sample Collection Project QC Samples
Laboratory Analysis & QC Evaluation
Reanalysis Request
PASS
PASS
QA Officer Evaluates Results
Lab and Project QC
PASS
Program Manager/QA Project Officer Data
Review
Data Fault Analysis
1. Original Data Confirmed
2. Original Data Neither Confirmed nor Rejected
3. Original Data Rejected with Documentation
Data Evaluation, Reporting and Storage
Consult with DWR QA Officer and Lab Director
DATA CONTROL
QA PROJECT
FIELD
LABORATORY
DWR QA OFFICER
YES
YES
YES
NO
NO
NO
DWR LAB DIRECTOR
11
9. Internal Quality Control Checks
Internal QC is the routine activities and checks such as calibrations, duplicate analysis, spiked samples, etc. included in normal procedures to control accuracy and precision of the measurement process. It determines whether the laboratory operations are within acceptable QC guidelines during sample analysis. Blanks Field Blanks are check samples which monitor contamination originating from the collection, transport, and storage of environmental samples. Laboratory prepared blank water is supplied to field personnel for processing in the same manner as samples; this includes field filtration and addition of preservatives. Travel Blanks are prepared in the laboratory from ultra-pure water. They are supplied to field personnel with each batch of empty sample bottles and are returned with the collected samples. Travel blanks are routinely used for volatile organic samples to determine whether sample transport has contaminated the samples collected. Method Blanks are prepared from laboratory blank water, substituted for samples, and analyzed with every sample set. Method blanks are used to determine the level of contamination that exists in the analytical procedure. Contamination may or may not lead to elevated concentration levels or false positive data. Ideally, the concentration of an analyte in the method blank is below the method detection level for the analyte. However, for some analytical methods, elimination of blank contamination is extremely difficult; therefore, each analytical SOP has a method blank level of acceptance. If the acceptance contamination level is exceeded, the sample set is reanalyzed. Calibration Standards Calibration standards are routinely run with every sample set. Calibration standards must fall within established QC limits before any sample results can be accepted. The limits are found in the particular analytical method SOP being used. If the calibration standards are unacceptable, the sample results are rejected, corrective action taken, and the samples reanalyzed. Check Standards The check standard is usually a midrange calibration standard used to monitor the analytical method. The check standard is analyzed every ten samples to provide evidence that the laboratory is performing the method within accepted QC guidelines. As long as check
standard results fall within established control limits, the analysis can continue. If check standard results fall outside the control limits, the data are suspect and the procedure is stopped. The analytical procedure is checked for error step by step by the analyst. Once the procedure is again acceptable, reanalysis of samples begins with the last check standard that was within acceptable control limits. Laboratory Control Sample When one is available, the LCS is analyzed routinely to verify the analytical method is in control and to also serve as a second source verification for the calibration standards of all routine analyses. The concentration of the LCS is within the working range of the analytical method and does not require extensive pretreatment, dilution, or concentration prior to analysis. The sources include, but are not limited to: QC samples, EPA, commercially prepared samples, or samples prepared in-house with different sources than those used in the calibration standards. Recovery data from the LCS are compared to the control limits which are established for those analytes monitored by the LCS. Before any data can be accepted, the analytes of interest in the LCS must fall within their expected control limits. If, for any reason, the results fall outside those limits, the sample results in the associated batch are unacceptable. Corrective steps are taken and filed with the QA/QC Officer. After the corrective action has been proven effective and the LCS is within the specified control limits, the samples are the reanalyzed. Internal Standards An internal standard is used in the more difficult analyses such as ICP, ICPMS, GC and GCMS. The internal standard is similar in analytical behavior to the analytes of interest and is added to all samples, standards, and blanks. Usually, more than one internal standard is added to each sample to evaluate the measurement of the sample throughout the entire time of analysis. The internal standards help determine the individual response factors used to calculate the concentrations of the analytes of interest.
RF = (As)(Cis)/Ais)(Cs) where:
As = Area for reference analyte to be measured Ais = Area for the internal standard Cis = Concentration of the internal standard
(µg/L)
12
Cs = Concentration of the reference analyte to be measured (µg/L)
The concentration of the analyte is calculated by: Ca = (Aa/Ais)(Cis/RF)
where: Ca = Concentration of the analyte in sample
(µg/L) Aa = peak area of the analyte RF = Response factor
The monitoring of the internal standards area counts is also used as a continuing check on instrument system performance. An average area count is established for each internal standard and any analytical run in which the internal standard area count falls outside the established criteria, the run is aborted, the cause is corrected, and the sample is reanalyzed. Surrogate Compounds Surrogate compounds are used in the analysis of organic compounds by gas chromatography (GC) and/or by a combination of gas chromatography and mass spectrometry (GC/MS). Like the internal standard, the surrogate compounds are similar in analytical behavior to the compounds of interest and are added to all samples, standards, and blanks. A known amount of surrogate is added to monitor the analytical performance of the method. The results of the surrogate compounds must fall within the established QC criteria for the analytical method. Samples that are outside the QC limits are reprepped and analyzed. If the reanalysis confirms the original analysis, both sets of data are reported with a flag attributing the out of control data to matrix interference. Samples Duplicates Duplicates are environmental samples divided into two separate aliquots analyzed independently to determine the repeatability or precision of the analytical method. The difference in the duplicate results must be within established control limits to ensure the generated data meet the quality assurance objectives for the particular analytical method. Matrix Spike/Matrix Spike Duplicates A spiked environmental sample is used to check for any matrix effects on the precision and accuracy of an analytical measurement. One out
of every 20 samples or one per batch is spiked twice with a known concentration of the analyte of interest, and then analyzed in a normal manner. The percent recovery and relative percent difference are calculated and the results must fall within established control limits to ensure the generated data meets the QA objectives for the particular analytical method used. Performance Evaluation Samples PE samples are routinely issued to the analyst to monitor both the analyst’s work and analytical procedure. The recorded results are reviewed by both the Laboratory QA Officer and senior staff. If any problems occur, follow-up corrective action is taken. PE samples may be in the form of blanks, previously analyzed environmental samples, split samples, or standard reference materials such as EPA, USGS, etc. Standard Method of Additions Standard method of additions is the practice of adding known concentrations of analyte to a sample so that matrix effects (interferences) are minimized. Whenever sample interference is suspected, the method of standard additions is employed to verify the quality of the data. Bracketing Bracketing is the use of standards to bracket the apparent concentration of the analyte in the sample. The sample is bracketed between a high and low standard, the standards being as close to the measured sample value as possible, usually ±10 percent. The calculated results are then done by interpolation as follows: Cs = [((Rs-Rls)(Chs-Cls)/(Rhs-Rls))+Cls](dilution) where: Cs = Sample concentration Rs = Response of sample Rhs = Response of High Standard Rls = Response of Low Standard Chs = Concentration of High Standard Cls = Concentration of Low Standard Normally, bracketing is used where precision of the methodology is poor. By bracketing, verification of the data quality can be obtained.
13
10. Performance and System Audits Performance and system audits are an essential part of QA to ensure that the laboratory is statistically generating consistent valid data. A system audit consists of reviewing laboratory conditions, practices, equipment, staff, and procedures used to generate quality data. Performance audits verify the ability of the laboratory to correctly identify and quantitate compounds in blind check samples. The laboratory currently participates in several ongoing auditing programs on a regular basis. The audits can be categorized into external and internal audits. External Audits The laboratory participates in the following external audit programs: • Water Pollution/Supply Performance Evaluation
Studies, U.S. Environmental Protection Agency • Standard Reference Water Sample Project, U.S.
Geological Survey • San Joaquin Valley Drainage Program interlaboratory
comparison studies • Split sample analysis with other laboratories both public
and private
Internal Audits Regular audits using an in-house blind reference sample are conducted for specific routine procedures. The results of the analyses are evaluated by the Laboratory QA Officer and the Chief of the Bryte Chemical Laboratory. System audits are conducted to assess the QA implementation in the laboratory. Inspection of QC charts, analytical procedures, equipment logs, and QA documentation in general is evaluated and reviewed for compliance and any needed operational changes.
In addition, informal audits are conducted by the Laboratory QA Officer as required when accuracy and precision of analyses appear to be drifting out of control. These audits may include the use of QC samples, varied matrices, calibration of instruments, and observation of the analyst to identify additional training of clarification needs, and may require changes in the analytical SOP. The control limits are determined by calculating the mean (X) of a minimum of 20 data points and the standard deviation (Sd) to generate a control chart that has a center line X and an upper and lower line Sd. Control charts are used to monitor trends in the data which could result in corrective actions.
DX
n=∑
D = data points n = number of data points
( )
22
1d
n x xS
n n
⎛ ⎞ ⎛ ⎞−⎜ ⎟ ⎜ ⎟⎝ ⎠ ⎝ ⎠=
−
∑ ∑
Upper Control Limit (UCL) = x + 3Sd
Lower Control Limit (LCL) = x - 3Sd
Upper Warning Limit (UWL) = x + 1.5Sd
Lower Warning Limit (LWL) = x + 1.5Sd
14
11. Preventative Maintenance
Preventative maintenance is routinely performed on all analytical equipment and instruments to minimize the amount of downtime and to maintain data quality. Equipment manuals, troubleshooting guides, and log books are available for maintenance support. Critical spare parts are kept on hand for laboratory instrumentation that is routinely repaired by laboratory staff. The inventory is monitored and maintained to avoid extended periods of downtime.
Service Contracts The laboratory maintains service contracts with manufacturers and specialty companies for complex analytical equipment (i.e., GC and ICP/MS).
General Maintenance Chemists are responsible for the routine daily maintenance of their instruments per the manufacturer’s recommendations and for documenting repairs in the equipment maintenance log books. Designated laboratory personnel are trained and responsible for more complex maintenance procedures. All necessary repairs are performed by trained staff or factory service engineers. The Chief of the Bryte Chemical
Equipment Log Books Equipment log books are maintained for all analytical instruments and equipment used in the laboratory. Each entry in the log book includes the date, the nature of the entry, and the name of the individual responsible for the entry. The following information is recorded in the log books: • Results of all sensitivity checks (verifying the
equipment is operating according to QA criteria for the method and/or meets the manufacturer’s specifications)
• All scheduled maintenance performed • Any major or minor problem encountered, a brief
description, corrective action required, and a list of any parts replaced
• Verification of equipment operation after any maintenance is performed by designated laboratory staff
The equipment log books are periodically reviewed by the Laboratory QA Officer for compliance and problem areas in the equipment.
Laboratory will be informed of the need for, and the performance of all major maintenance activities that may directly impact sample analysis schedules.
15
12. Routine Procedures Used to Assess Data Quality
The effectiveness of data quality assessment in a QA program is measured by the quality of the data generated by the laboratory. Data quality is evaluated in terms of precision, accuracy, comparability, and completeness. Precision and Accuracy Precision is the degree to which the measurement is reproducible among replicate observations, and accuracy is a determination of how close the measurement is to the true value. Laboratory precision and accuracy have been established for all analytical procedures used and are assessed for each sample set that is analyzed. The precision of analytical data is determined routinely by running duplicate tests in samples, laboratory control standards, and matrix spikes within the sample set. Accuracy is evaluated by analysis of spiked samples. Sample spikes are prepared by addition of a known amount standard solution to a sample. The spiked sample and unspiked sample are then analyzed for the parameter of interest. Precision and accuracy assessment utilize control charts and well established statistical procedures found in the following reference publications: • Handbook for Analytical Quality Control in Water and
Wastewater Laboratories (EPA 600/4-79-019, March 1979)
• Quality Assurance Practices for the Chemical and Biological Analyses of Water and Fluvial Sediments, Techniques of Water Resources Investigations, USGS, Book 5, Chapter A6, 1982
• Manual of Analytical Quality Control for Pesticides and Related Compounds in Human and Environmental Samples (EPA-600/1-79-008, January 1979)
Comparability Comparability expresses the confidence with which the data set can be compared to other data sets measuring the same properties. See Section 8.1, Data Validation and Reporting, for procedures used to evaluate comparability for assessment of data quality.
Completeness Completeness is a measure of the amount of valid data obtained from a measurement system compared to the amount that was expected to be obtained under normal conditions. For data quality assessment procedures used to evaluate the completeness of data, see Section 8.1, Data Validation and Reporting.
Detection Limits The sensitivity of any analytical method is related to the detection limits, the lowest concentration of analyte that can be detected at a specified confidence level. Definitions of Instrument Detection Limit, Method Detection Limit, Method Quantification Limit, and Practical Quantification Limit follow. The relationship of these terms is expressed graphically in Figure 3. Instrument Detection Limit Definition: The smallest signal above background noise that the instrument can detect reliably at 99 percent confidence level. Measurement: Analyze replicate blank samples to determine the extent which the analyte signal exceeds the peak-to-peak noise. Calculation: The mean value plus two standard deviations for a normal distribution or three for data distribution. Method Detection Limit Definition: The lowest possible concentration of a substance that can be identified, measured, and reported with 99 percent confidence that the analyte concentration is greater than zero and is determined from analysis of a sample in a given matrix containing analyte. Measurement: Analyze several replicates of a sample, digestate, or extracted sample with no detectable analyte to establish the estimated MDL. Prepare a concentration between three to five times the estimated MDL. Analyze seven aliquots and process each through the entire analytical method then calculate the standard deviation (Sd).
Calculation:
( )
⎛ ⎞ ⎛ ⎞−⎜ ⎟ ⎜ ⎟⎝ ⎠ ⎝ ⎠
−
∑ ∑2
2
d
n xS =
1
x
n n
( )= 3.143 dMDL S
The value 3.143 is from a table of the one-sided t distribution values where t = 6 degrees of freedom at the 99 percent confidence level.
16
Practical Quantification Limit Definition: The minimum level that can be reliably achieved by the analytical method within specified limits of precision and accuracy during routine laboratory operating conditions. Measurement: The PQL is 5 to 10 times the MDL.
Reporting Limits The reporting limit is the PQL value of the specific analytical method. For specific reporting limits, see Appendix F.
17
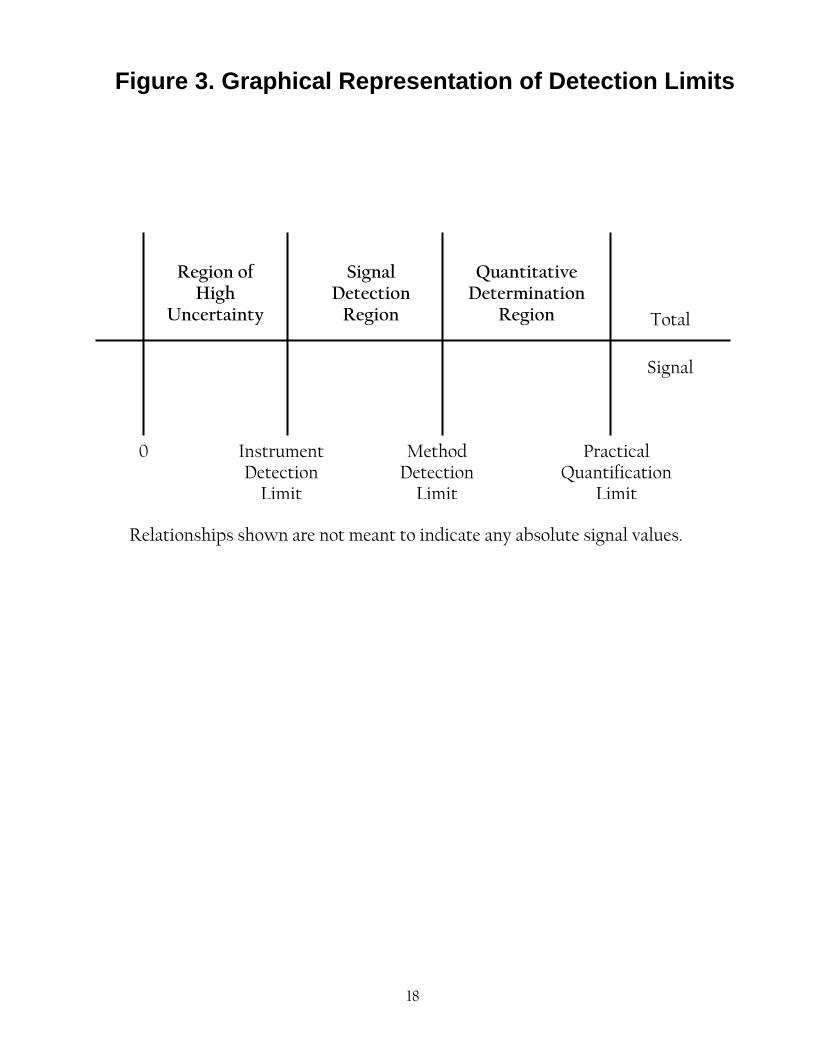
Figure 3. Graphical Representation of Detection Limits
Signal Detection
Region
Region of High
Uncertainty
Quantitative Determination
Region Total
Signal
Instrument Detection
Limit
Method Detection
Limit
Practical Quantification
Limit
0
Relationships shown are not meant to indicate any absolute signal values.
18
13. Corrective Action
When errors, deficiencies, or out of control conditions are encountered, corrective actions are necessary. The need for corrective action may be identified in any number of ways: • QC data outside acceptable limits for a given
sample set • Rising or falling trends that are detected in spike
recovery or duplicate control charts • Unacceptable levels of contamination in blanks
and reagents • Unusual changes in detection limits • Calibration standards with low sensitivity • Nonlinear or misshapen calibration curves • Deficiencies detected by Laboratory QA Officer
or senior staff reviewing analytical data • Deficiencies detected during internal or external
audits by Laboratory QA Officer, outside agency, or from performance evaluation studies
Since each analytical SOP has a QA section that outlines corrective actions to be taken, problems which may arise are usually handled at the analyst’s level. If the problem persists and cannot be handled by the analyst, the matter is referred to the Laboratory QA Officer. The following corrective
action steps are then taken: • Identification of the problem • Investigation and determination of the cause of
the problem • Corrective action determined to eliminate the
problem • Assigning responsibility for implementing
corrective action • Evaluation of the effectiveness of the corrective
action • Verification that the corrective action has
eliminated the problem • Documentation of the problem and corrective
action needed
All suspect analytical results will be evaluated. The Laboratory QA Officer will not permit the analysis to go on-line until the corrective action has been completely successful. Corrective action documentation is routinely reviewed by the Laboratory QA Officer and Chief of the Bryte Chemical Laboratory for recurring problems which may require changes in analytical procedures, methods, or additional training of analysts.
19
14. Quality Assurance Reports
QA reports are generated by the Laboratory QA Officer with assistance form senior staff. These reports are used in evaluating the overall QA program, identifying problems and trends, and planning for future needs and requirements. These reports will usually include the following: • All audit results including any necessary
corrective action required • Performance evaluation results and commentary • Problems encountered and corrective action
taken • Any significant QA problems encountered • Comments and recommendations
External reference samples from USGS, USEPA, DHS, or University of California, Davis are analyzed a minimum of three times per year. A QA report is generated after each external reference is completed. If special problems arise involving more than normal corrective action, a special QA report will be issued. The reports will be routed to specific staff members and finally, the Chief of the Bryte Chemical Laboratory.
20
15. Facilities and Laboratory Equipment
The Bryte Chemical Laboratory, located in West Sacramento, California contains a fully equipped 8,700 square foot facility. The fully air conditioned laboratory contains one large main room and smaller individual rooms with adequate hood area that is appropriately spaced with sufficient room to accommodate all personnel and equipment. The laboratory is divided into sections to handle the wide spectrum of chemical analyses performed on waters
and wastewaters. The major sections consist of receiving, volatile organics, semi-volatile organics, trace metals, wet chemistry, nutrients, biological, and storage. Most of the instrumentation used in the chemical laboratory is fully automated and computerized (see Appendix H, Laboratory Equipment).
21
Appendix A Water Sample Collection Information
A-1
A-2
Water Sample Collection Information
Determination Method Container Prep Sample Sample
Size Preservative Hold TimeAlkalinity SM 2320B Polyethylene Filtered 500 mL 4°C 14 days BOD EPA 405.1 Polyethylene Unfiltered 2000 mL 4°C 48 hours
Carbamate Pesticides EPA 531.1 Glass, Clear Unfiltered 125 mL, teflon septa
4°C, chloroacetic Acid 28 days
COD SM 5220A Glass, Clear Unfiltered 100 mL 4°C, H2SO4, pH<2 28 days
Chlorinated Pesticides EPA 608 Glass, Amber Unfiltered 1000 mL, teflon septa 4°C 7d ext, 40d after ext
Chlorinated Phenoxyacid Herbicides EPA 615 Glass, Amber Unfiltered 1000 mL, teflon septa 4°C 7d ext, 28d after ext
Chlorophyll SM 10200H Manila Envelope Filtered 1000 mL -20°C, dark 28 days Chromium, hexavalent EPA 218.6 Glass, Clear VOA Unfiltered 40 mL 4°C 24 hours Coliform, Fecal (Escherichia) SM 9223 Colilert Plastic, Sterile Unfiltered 100 mL 4°C, Na2S2O3 6 hours Color EPA 110.2 Polyethylene Filtered 500 mL 4°C 48 hours
EDB/DBCP EPA 504 Glass, Amber VOA Unfiltered 40 mL x 2, teflon, no air 4°C, HCl, pH<2 28 days
Electrical Conductivity (EC) SM 2510B Polyethylene Filtered 500 mL 4°C 28 days
Glyphosate EPA 547 Glass, Amber Unfiltered 125 mL, teflon
septa 4°C 28 days
Haloacetic Acids (HAA) EPA 552.2 Glass, Amber VOA Unfiltered no air 40 mL x 2, teflon,
4°C 7d ext, 14d after ext Haloacetic Acids Formation Potential (HAAFP) EPA 510.1 Glass, Amber VOA Filtered
40 mL x 3, teflon, no air 4°C 7d ext, 14d after ext
Hardness by Calculation SM 2340B Polyethylene Filtered 250 mL HNO3, pH<2 6 months Hardness, Total by Calculation SM 2340B Polyethylene Unfiltered 250 mL HNO3, pH<2 6 months ICP Cations, Dissolved – Na, Ca, Mg, K, B, Si EPA 200.7 Polyethylene Filtered 250 mL HNO3, pH<2 6 months ICP Cations, Total – Na, Ca, Mg, K, B, Si EPA 200.7 Polyethylene Unfiltered 250 mL HNO3, pH<2 6 months
ICP/MS Trace Metals, Dissolved EPA 200.8 Polyethylene, Acid Washed Filtered 500 mL HNO3, pH<2 6 months
ICP/MS Trace Metals, Total EPA 200.8 Polyethylene, Acid Washed Unfiltered 500 mL HNO3, pH<2 6 months
IC Anions – Cl, SO4, NO3, Br, F EPA 300.0 Polyethylene Filtered 500 mL 4°C 28 days
Mercury by Cold Vapor EPA 245.1 Polyethylene, Acid Washed Unfiltered 500 mL 4°C, HNO3, pH<2 28 days
Mercury by ICP/MS EPA 200.8 Polyethylene, Acid Washed Filtered 500 mL 4°C, HNO3, pH<2 28 days
Water Sample Collection Information

A-3
Determination Method Container Prep
Sample Sample Size Preservative Hold Time
Methylene Blue Active Substances (MBAS) EPA 425.1 Polyethylene Unfiltered 500 mL 4°C 48 hours Nitrate, Nitrite (Nutrient) SM 4500-NO3-F Polyethylene Filtered 250 mL -20°C, dark 48 hours Nitrate, Nitrite (Nutrient DWR Modified) SM 4500-NO3-F DWR Polyethylene Filtered 250 mL -20°C, dark 28 days Nitrate, Nitrite (Std Mineral-IC Anions) EPA 300.0 Polyethylene Filtered 500 mL 4°C 48 hours Nitrate, Nitrite (Std Mineral DWR Modified) EPA 300.0 DWR Polyethylene Filtered 500 mL 4°C 28 days
Nitrogen/Phosphorus Pesticides EPA 614 Glass, Amber Unfiltered 1000 mL, teflon septa 4°C 7d ext, 40d after ext
Nitrogen, Ammonia EPA 350.1 Polyethylene Filtered 250 mL -20°C, dark 28 days Nitrogen, Kjedahl, Total (TKN) EPA 351.2 Polyethylene Unfiltered 250 mL -20°C, dark 28 days Nitrogen Organic, Dissolved (DON) EPA 351.2 Polyethylene Filtered 250 mL 4°C 28 days Oil and Grease EPA 1664 Glass Unfiltered 1000 mL 4°C, H3PO4, pH<2 28 days Organic Carbon Dissolved (DOC) EPA 415.1 (D) Glass, Clear VOA Filtered 40 mL 4°C, H3PO4, pH<2 28 days Organic Carbon Total (TOC) EPA 415.1 (T) Glass, Clear VOA Unfiltered 40 mL 4°C, H3PO4, pH<2 28 days Orthophosphate SM 4500-P-F Polyethylene Filtered 250 mL 4°C 48 hours Orthophosphate DWR Modified SM 4500-P-F DWR Polyethylene Filtered 250 mL -20°C, dark 28 days pH EPA 150.1 Polyethylene Unfiltered 250 mL 4°C 15 minutes Phosphorus Total EPA 365.4 Polyethylene Unfiltered 250 mL -20°C, dark 28 days
Simulated Distribution System THM SM 5710C SDS-THM Glass, Amber VOA Filtered 40 mL x 3, teflon, no air 4°C 7 days after FP
Simulated Distribution System HAA SM 5710D SDS-HAA Glass, Amber VOA Filtered 40 mL x 3, teflon, no air 4°C 7d ext, 14d after ext
Solids, Settleable EPA 160.5 Polyethylene Unfiltered 2000 mL 4°C 7 days Solids, Total Dissolved (TDS) SM 2540C Polyethylene Filtered 500 mL 4°C 7 days Solids, Total Suspended (TSS) EPA 160.2 Polyethylene Unfiltered 500 mL 4°C 7 days Solids, Volatile Suspended (VSS) EPA 160.4 Polyethylene Unfiltered 500 mL 4°C 7 days
Trihalomethanes (THMS) EPA 501.1 Glass, Amber VOA Unfiltered 40 mL x 2, teflon, no air 4°C, HCl, pH<2 14 days
Trihalomethane Formation Potential (THMFP) EPA 510.1 Glass, Amber VOA Filtered
40 mL x 3, teflon, no air 4°C 7 days after FP
Turbidity EPA 180.1 Polyethylene Unfiltered 500 mL 4°C 48 hours UVA SM 5910B Polyethylene Filtered 250 mL 4°C 14 days
Volatile Organic Analysis (VOA) EPA 502.2 Glass, Amber VOA Unfiltered 40 mL x 2, teflon, no air 4°C, HCl, pH<2 14 days
B-1
Appendix B Standard Operating Procedure
Analytical methods SOP must include: 1. Title
2. Scope and application 2.1. Analytes 2.2. Reporting limits 2.3. Applicable matrices 2.4. Calibration range 2.5. Analysis time
3. Method Summary
4. Comments (interference or helpful hints)
5. Safety issues
6. Sample collection, preservation, containers, and holding times
7. Apparatus
8. Reagents and standards
9. Procedure
10. QA/QC requirements (QC samples, acceptance criteria, and corrective action)
11. Calculations
12. Reporting requirements (units, limits, significant figures, data entry)
13. References (method source, deviations from method source, and rationale for deviation)
14. Additional information as appropriate
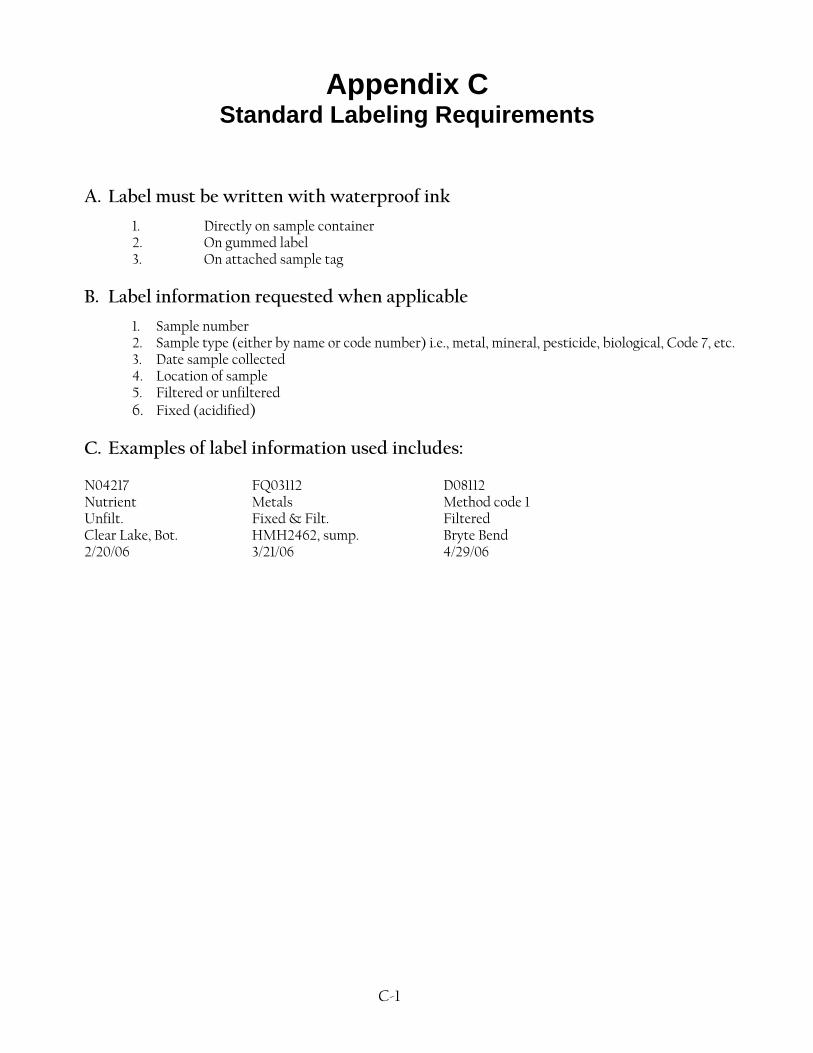
Appendix C Standard Labeling Requirements
A. Label must be written with waterproof ink
1. Directly on sample container 2. On gummed label 3. On attached sample tag
B. Label information requested when applicable
1. Sample number 2. Sample type (either by name or code number) i.e., metal, mineral, pesticide, biological, Code 7, etc. 3. Date sample collected 4. Location of sample 5. Filtered or unfiltered 6. Fixed (acidified)
C. Examples of label information used includes: N04217 FQ03112 D08112 Nutrient Metals Method code 1 Unfilt. Fixed & Filt. Filtered Clear Lake, Bot. HMH2462, sump. Bryte Bend 2/20/06 3/21/06 4/29/06
C-1
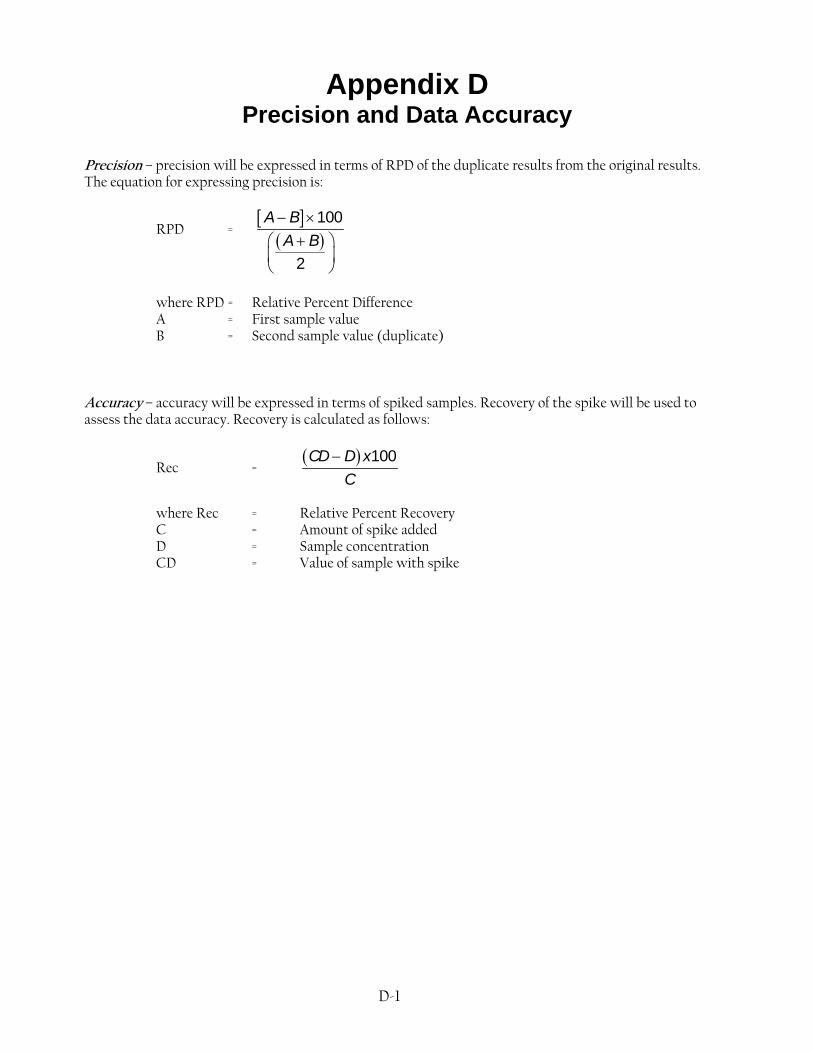
Appendix D Precision and Data Accuracy
Precision – precision will be expressed in terms of RPD of the duplicate results from the original results. The equation for expressing precision is:
RPD = [ ]
( )100
2
A BA B− ×
+⎛ ⎞⎜ ⎟⎝ ⎠
where RPD = Relative Percent Difference A = First sample value B = Second sample value (duplicate) Accuracy – accuracy will be expressed in terms of spiked samples. Recovery of the spike will be used to assess the data accuracy. Recovery is calculated as follows:
Rec = ( ) 100CD D x
C−
where Rec = Relative Percent Recovery C = Amount of spike added
D = Sample concentration CD = Value of sample with spike
D-1
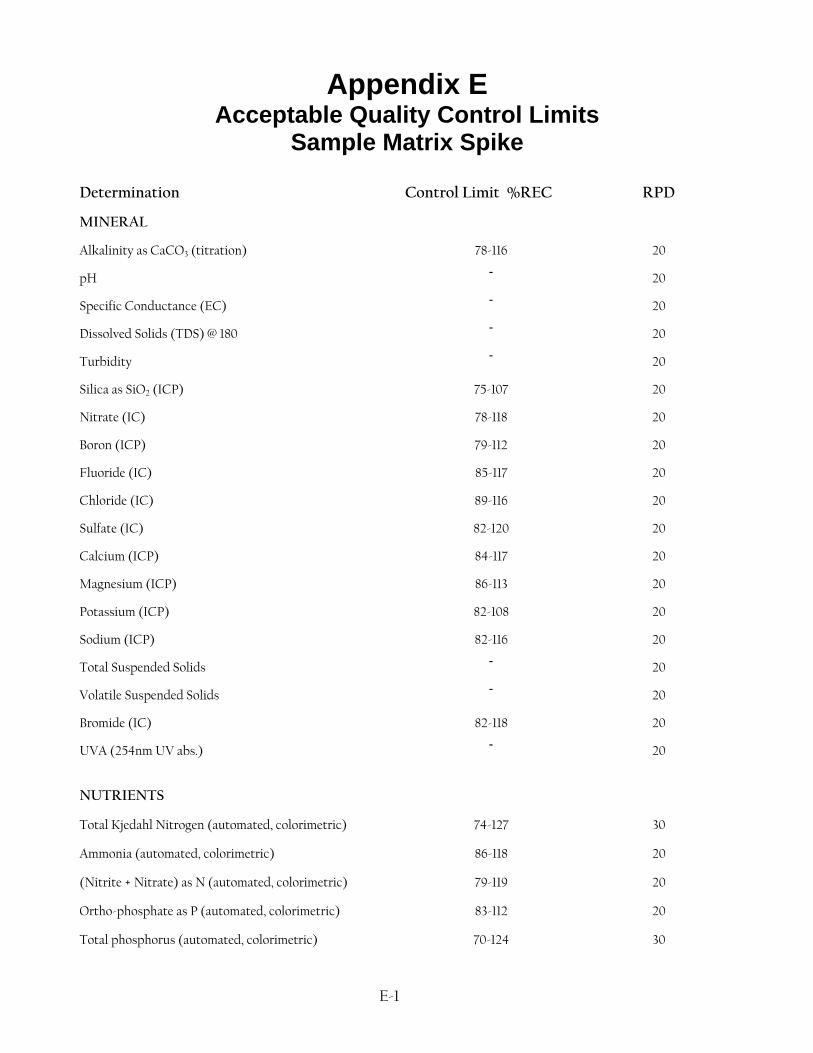
Appendix E Acceptable Quality Control Limits
Sample Matrix Spike
Determination Control Limit %REC RPD
MINERAL
Alkalinity as CaCO3 (titration) 78-116 20
pH - 20
Specific Conductance (EC) - 20
Dissolved Solids (TDS) @ 180 - 20
Turbidity - 20
Silica as SiO2 (ICP) 75-107 20
Nitrate (IC) 78-118 20
Boron (ICP) 79-112 20
Fluoride (IC) 85-117 20
Chloride (IC) 89-116 20
Sulfate (IC) 82-120 20
Calcium (ICP) 84-117 20
Magnesium (ICP) 86-113 20
Potassium (ICP) 82-108 20
Sodium (ICP) 82-116 20
Total Suspended Solids - 20
Volatile Suspended Solids - 20
Bromide (IC) 82-118 20
UVA (254nm UV abs.) - 20
NUTRIENTS
Total Kjedahl Nitrogen (automated, colorimetric) 74-127 30
Ammonia (automated, colorimetric) 86-118 20
(Nitrite + Nitrate) as N (automated, colorimetric) 79-119 20
Ortho-phosphate as P (automated, colorimetric) 83-112 20
Total phosphorus (automated, colorimetric) 70-124 30
E-1
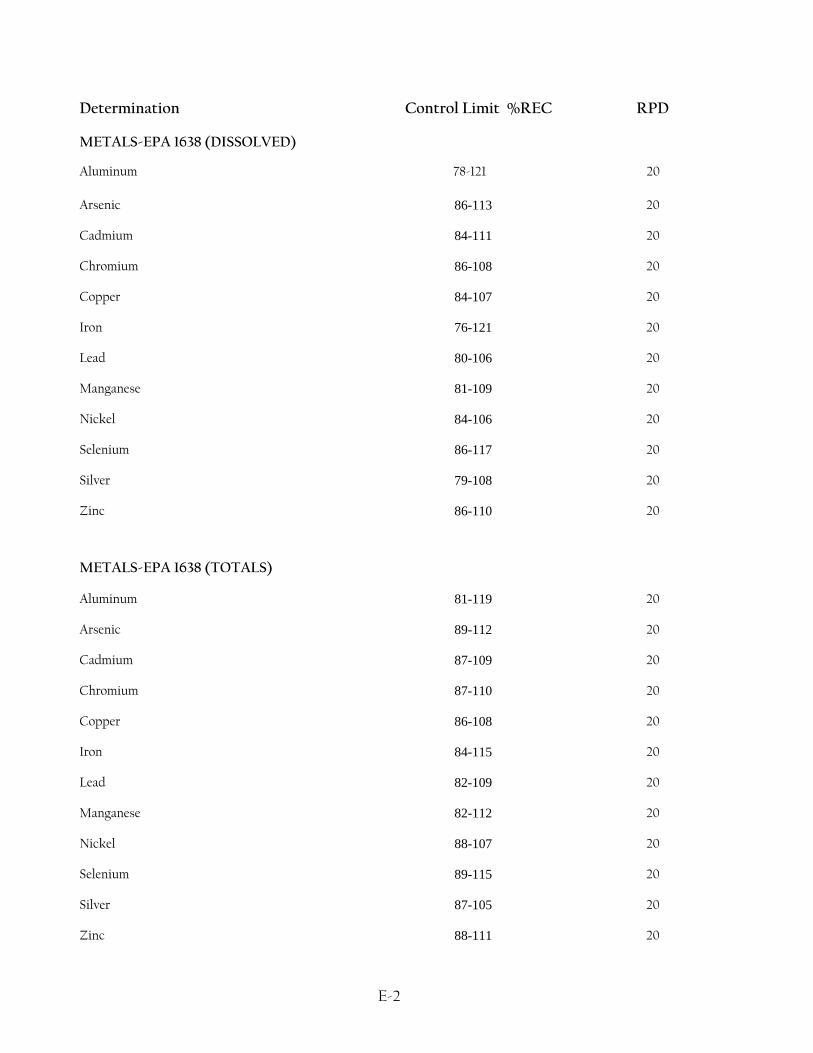
Determination Control Limit %REC RPD
METALS-EPA 1638 (DISSOLVED)
Aluminum 78-121 20
Arsenic
86-113 20
Cadmium
84-111 20
Chromium
86-108 20
Copper
84-107 20
Iron
76-121 20
Lead
80-106 20
Manganese
81-109 20
Nickel
84-106 20
Selenium
86-117 20
Silver
79-108 20
Zinc
86-110 20
METALS-EPA 1638 (TOTALS)
Aluminum
81-119 20
Arsenic
89-112 20
Cadmium
87-109 20
Chromium
87-110 20
Copper
86-108 20
Iron
84-115 20
Lead
82-109 20
Manganese
82-112 20
Nickel
88-107 20
Selenium
89-115 20
Silver
87-105 20
Zinc
88-111 20
E-2
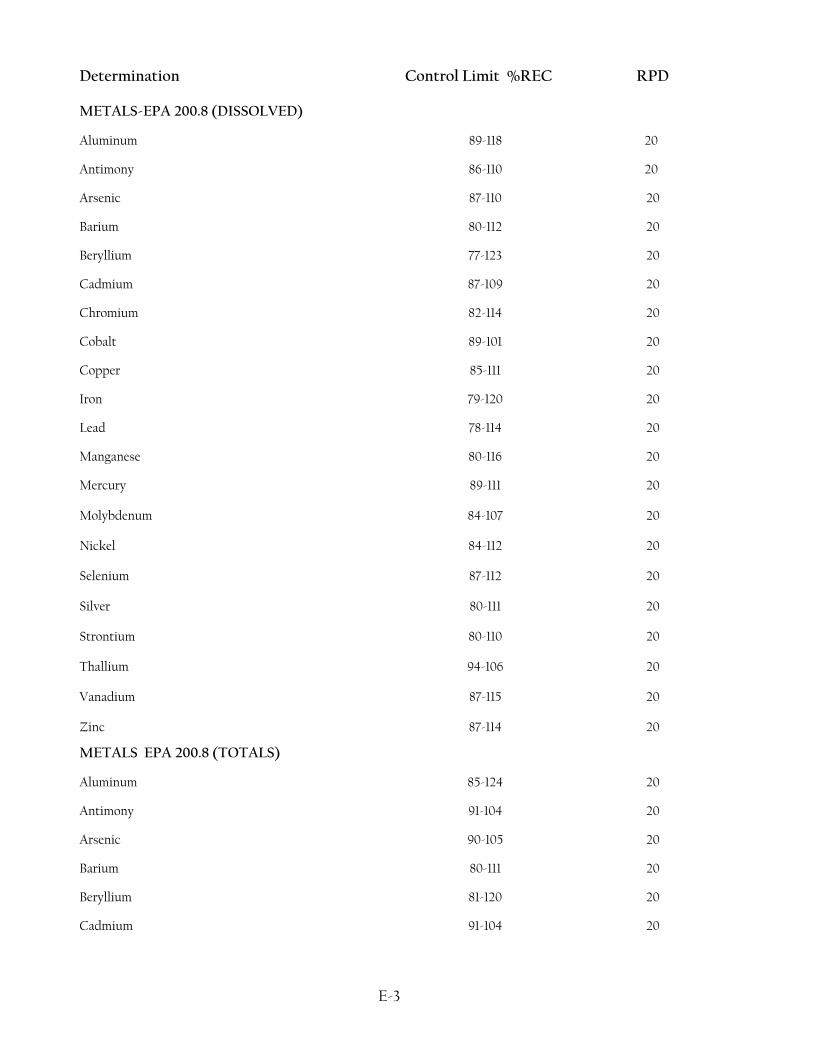
Determination Control Limit %REC RPD
METALS-EPA 200.8 (DISSOLVED)
Aluminum 89-118 20
Antimony 86-110 20
Arsenic 87-110 20
Barium 80-112 20
Beryllium 77-123 20
Cadmium 87-109 20
Chromium 82-114 20
Cobalt 89-101 20
Copper 85-111 20
Iron 79-120 20
Lead 78-114 20
Manganese 80-116 20
Mercury 89-111 20 Molybdenum 84-107 20 Nickel 84-112 20 Selenium 87-112 20 Silver 80-111 20 Strontium 80-110 20 Thallium 94-106 20 Vanadium 87-115 20 Zinc 87-114 20
METALS EPA 200.8 (TOTALS)
Aluminum 85-124 20
Antimony 91-104 20
Arsenic 90-105 20
Barium 80-111 20
Beryllium 81-120 20
Cadmium 91-104 20
E-3
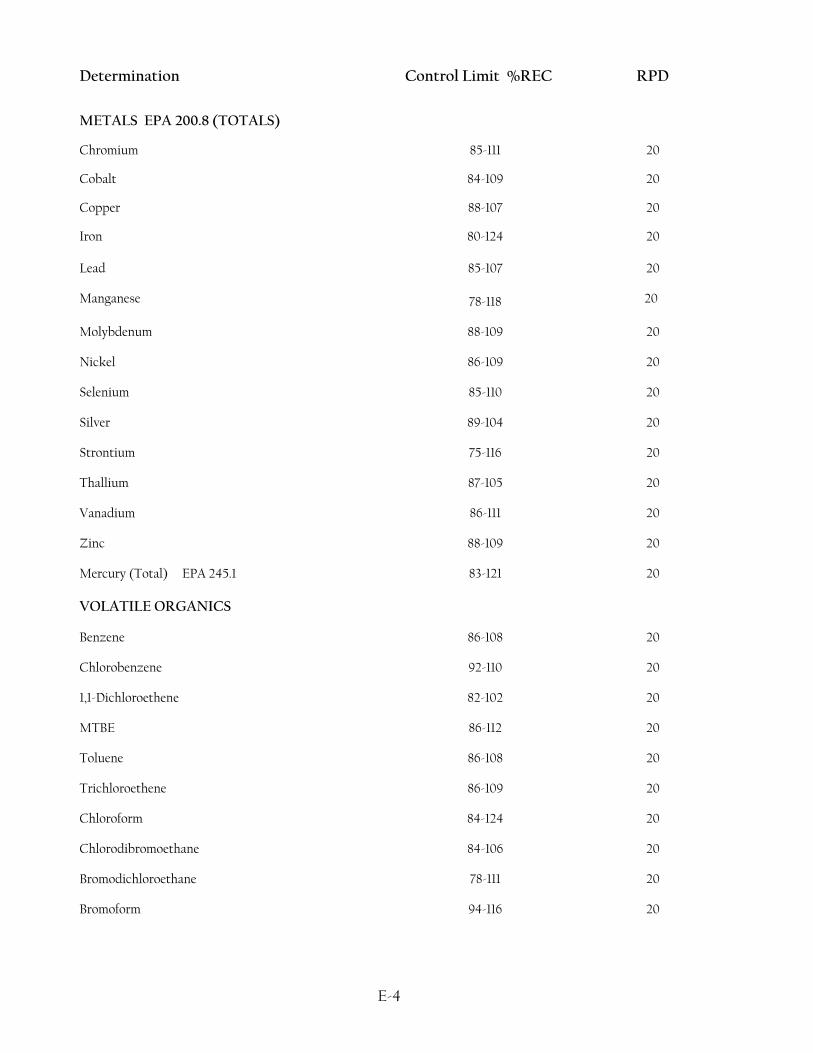
Determination Control Limit %REC RPD
METALS EPA 200.8 (TOTALS)
Chromium 85-111 20
Cobalt 84-109 20
Copper 88-107 20
Iron 80-124 20 Lead 85-107 20 Manganese
78-118
20
Molybdenum 88-109 20 Nickel 86-109 20 Selenium 85-110 20 Silver 89-104 20 Strontium 75-116 20 Thallium 87-105 20 Vanadium 86-111 20 Zinc 88-109 20 Mercury (Total) EPA 245.1 83-121 20 VOLATILE ORGANICS Benzene 86-108 20 Chlorobenzene 92-110 20 1,1-Dichloroethene 82-102 20 MTBE 86-112 20 Toluene 86-108 20 Trichloroethene 86-109 20 Chloroform 84-124 20 Chlorodibromoethane 84-106 20 Bromodichloroethane 78-111 20 Bromoform 94-116 20
E-4
Determination Control Limit %REC RPD
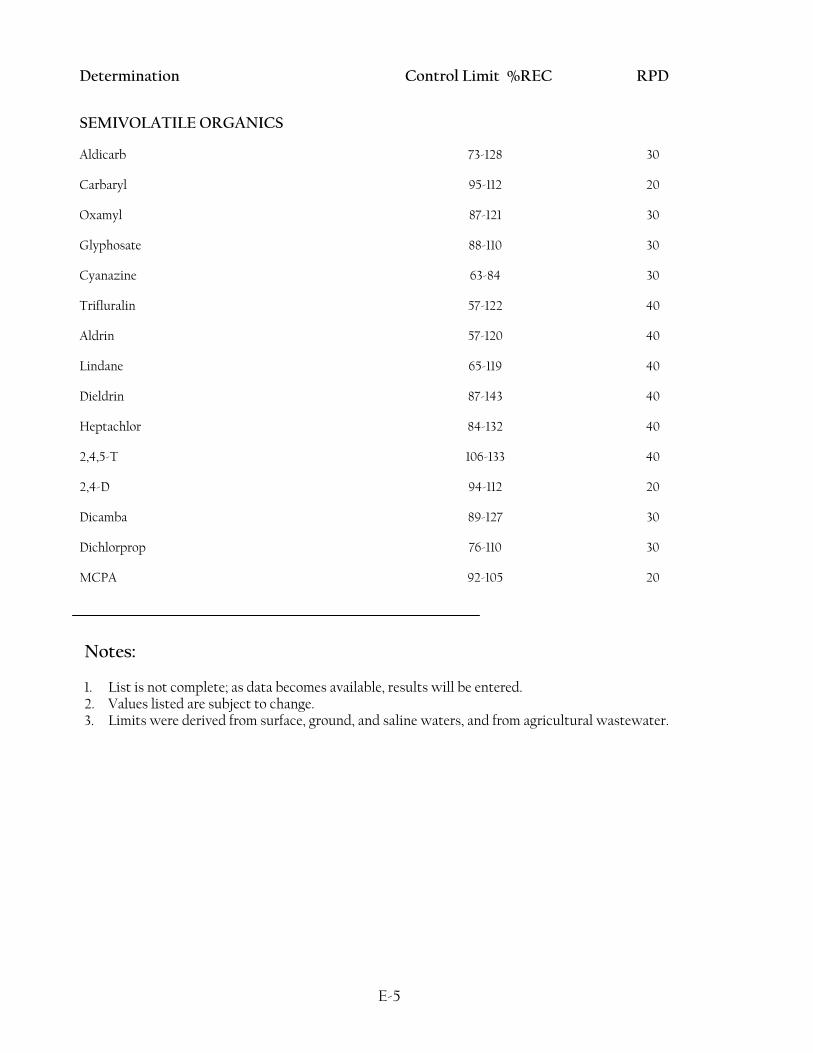
SEMIVOLATILE ORGANICS Aldicarb 73-128 30 Carbaryl 95-112 20 Oxamyl 87-121 30 Glyphosate 88-110 30 Cyanazine 63-84 30 Trifluralin 57-122 40 Aldrin 57-120 40 Lindane 65-119 40 Dieldrin 87-143 40 Heptachlor 84-132 40 2,4,5-T 106-133 40 2,4-D 94-112 20 Dicamba 89-127 30 Dichlorprop 76-110 30 MCPA 92-105 20
Notes: 1. List is not complete; as data becomes available, results will be entered. 2. Values listed are subject to change. 3. Limits were derived from surface, ground, and saline waters, and from agricultural wastewater.
E-5
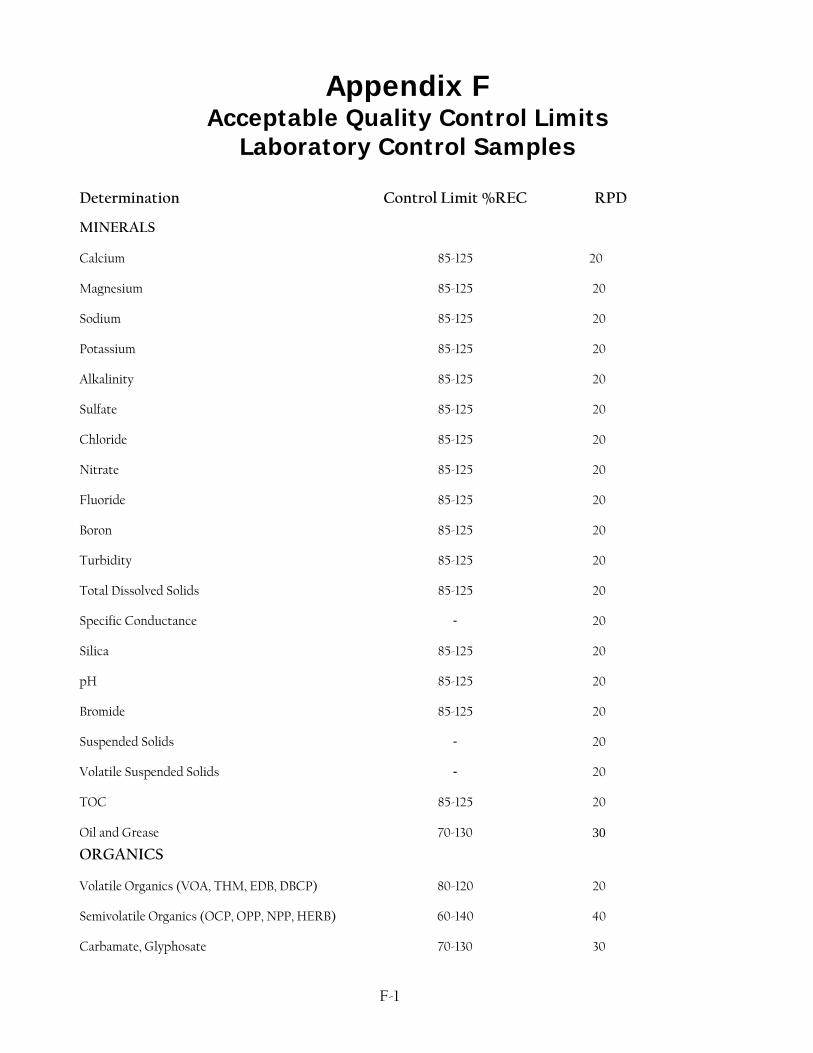
Appendix F Acceptable Quality Control Limits
Laboratory Control Samples
Determination Control Limit %REC RPD
MINERALS
Calcium 85-125 20
Magnesium 85-125
20
Sodium 85-125
20
Potassium 85-125
20
Alkalinity 85-125
20
Sulfate 85-125
20
Chloride 85-125
20
Nitrate 85-125
20
Fluoride 85-125
20
Boron 85-125
20
Turbidity 85-125
20
Total Dissolved Solids 85-125
20
Specific Conductance -
20
Silica 85-125
20
pH 85-125
20
Bromide 85-125
20
Suspended Solids -
20
Volatile Suspended Solids -
20
TOC 85-125
20
Oil and Grease 70-130
30
ORGANICS
Volatile Organics (VOA, THM, EDB, DBCP) 80-120
20
Semivolatile Organics (OCP, OPP, NPP, HERB) 60-140
40
Carbamate, Glyphosate 70-130
30
F-1
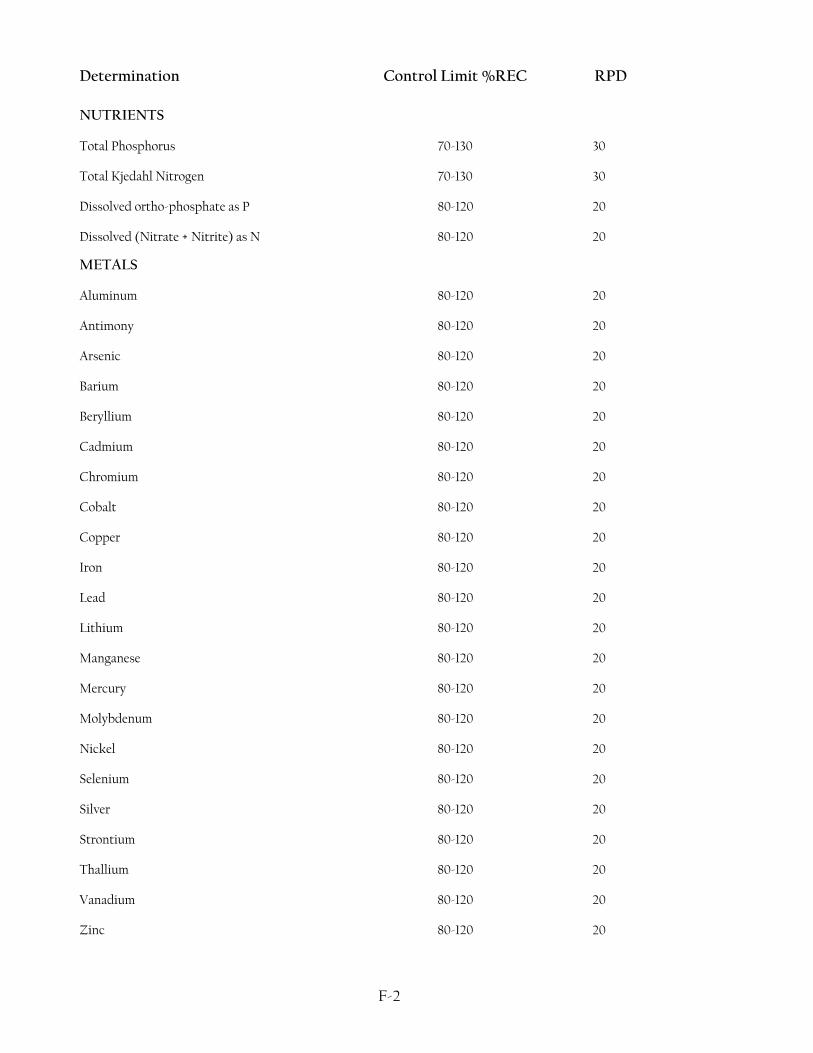
Determination Control Limit %REC RPD
NUTRIENTS
Total Phosphorus 70-130
30
Total Kjedahl Nitrogen 70-130
30
Dissolved ortho-phosphate as P 80-120
20
Dissolved (Nitrate + Nitrite) as N 80-120
20
METALS
Aluminum 80-120
20
Antimony 80-120
20
Arsenic 80-120
20
Barium 80-120
20
Beryllium 80-120
20
Cadmium 80-120
20
Chromium 80-120
20
Cobalt 80-120
20
Copper 80-120
20
Iron 80-120
20
Lead 80-120
20
Lithium 80-120
20
Manganese 80-120
20
Mercury 80-120
20
Molybdenum 80-120
20
Nickel 80-120
20
Selenium 80-120
20
Silver 80-120
20
Strontium 80-120
20
Thallium 80-120
20
Vanadium 80-120
20
Zinc 80-120
20
F-2
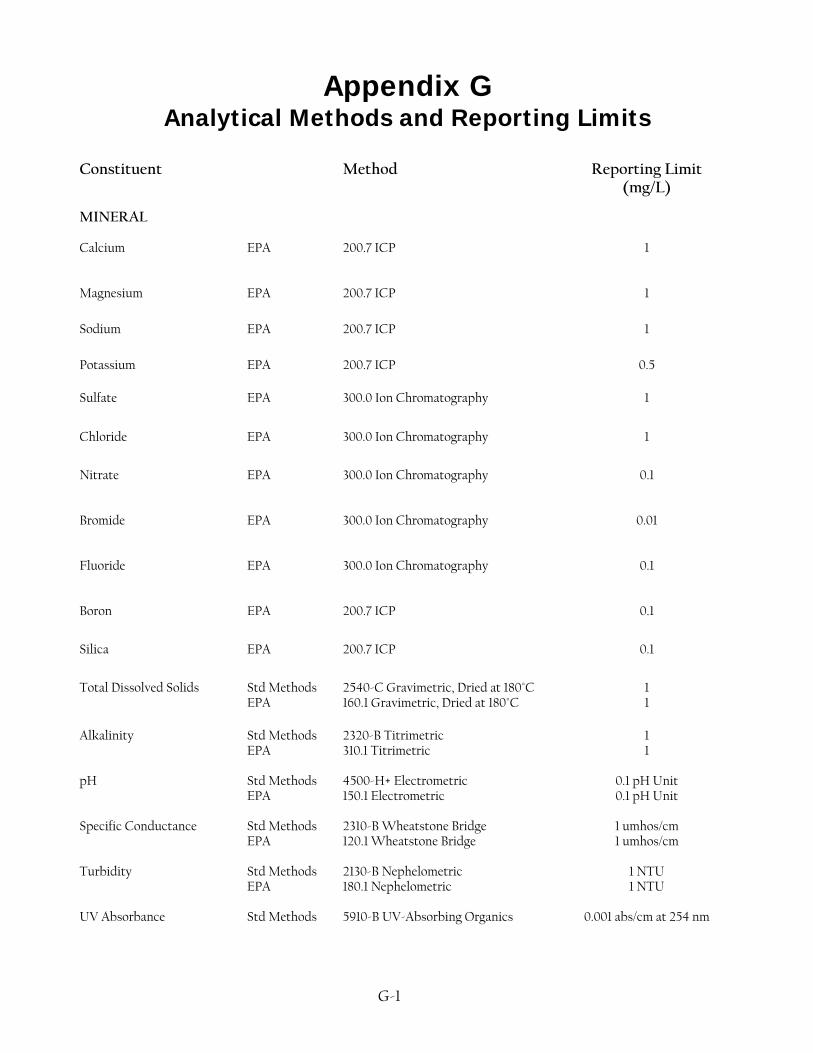
Appendix G Analytical Methods and Reporting Limits
Constituent Method Reporting Limit
(mg/L)
MINERAL
Calcium
EPA
200.7 ICP
1
Magnesium
EPA
200.7 ICP
1
Sodium
EPA
200.7 ICP
1
Potassium
EPA
200.7 ICP
0.5
Sulfate
EPA
300.0 Ion Chromatography
1
Chloride
EPA
300.0 Ion Chromatography
1
Nitrate
EPA
300.0 Ion Chromatography
0.1
Bromide
EPA
300.0 Ion Chromatography
0.01
Fluoride
EPA
300.0 Ion Chromatography
0.1
Boron
EPA
200.7 ICP
0.1
Silica
EPA
200.7 ICP
0.1
Total Dissolved Solids
Std Methods EPA
2540-C Gravimetric, Dried at 180°C 160.1 Gravimetric, Dried at 180°C
1 1
Alkalinity
Std Methods EPA
2320-B Titrimetric 310.1 Titrimetric
1 1
pH
Std Methods EPA
4500-H+ Electrometric 150.1 Electrometric
0.1 pH Unit 0.1 pH Unit
Specific Conductance
Std Methods EPA
2310-B Wheatstone Bridge 120.1 Wheatstone Bridge
1 umhos/cm 1 umhos/cm
Turbidity
Std Methods EPA
2130-B Nephelometric 180.1 Nephelometric
1 NTU 1 NTU
UV Absorbance
Std Methods
5910-B UV-Absorbing Organics
0.001 abs/cm at 254 nm
G-1

Constituent Method Reporting Limit
(mg/L) NUTRIENTS Ammonia
Std Methods EPA
4500-NH3 B, H Automated Phenate 350.1 Automated Phenate
0.01 0.01
Total Kjedahl Nitrogen
EPA
351.2 Colorimetric, Semi-Automated
0.10
Nitrate*
Std Methods EPA
4500-NO3-F CD Reduction 353.2 CD-Reduction, Automated
0.01 0.01
Nitrite*
Std Methods EPA
4500-NO3-F CD Reduction 353.2 CD-Reduction, Automated
0.01 0.01
Nitrite + Nitrate*
EPA
353.2 CD-Reduction, Automated
0.01
o-Phosphate as P
Std Methods EPA
4500-P-E Colorimetric, Ascorbic Acid 365.1 Colorimetric, Ascorbic Acid
0.01 0.01
Phosphorus, Total
EPA
365.4 Colorimetric, Semi-Automated
0.01
METALS
Aluminum
EPA
200.7 ICP 200.8 ICP/MS 1638
0.050 0.010
0.10 ug/L
Antimony
EPA
200.7 ICP 200.8 ICP/MS 1638
0.025 0.001
0.02 ug/L
Arsenic
EPA
200.7 ICP 200.8 ICP/MS 1638
0.010 0.001
0.10 ug/L
Barium
EPA
200.7 ICP 200.8 ICP/MS
0.010 0.050
Beryllium
EPA
200.7 ICP 200.8 ICP/MS
0.005 0.001
Cadmium
EPA
200.7 ICP 200.8 ICP/MS 1638
0.005 0.001
0.10 ug/L
Chromium (VI)
EPA
218.6 Ion Chromatography
0.005
* as N
G-2
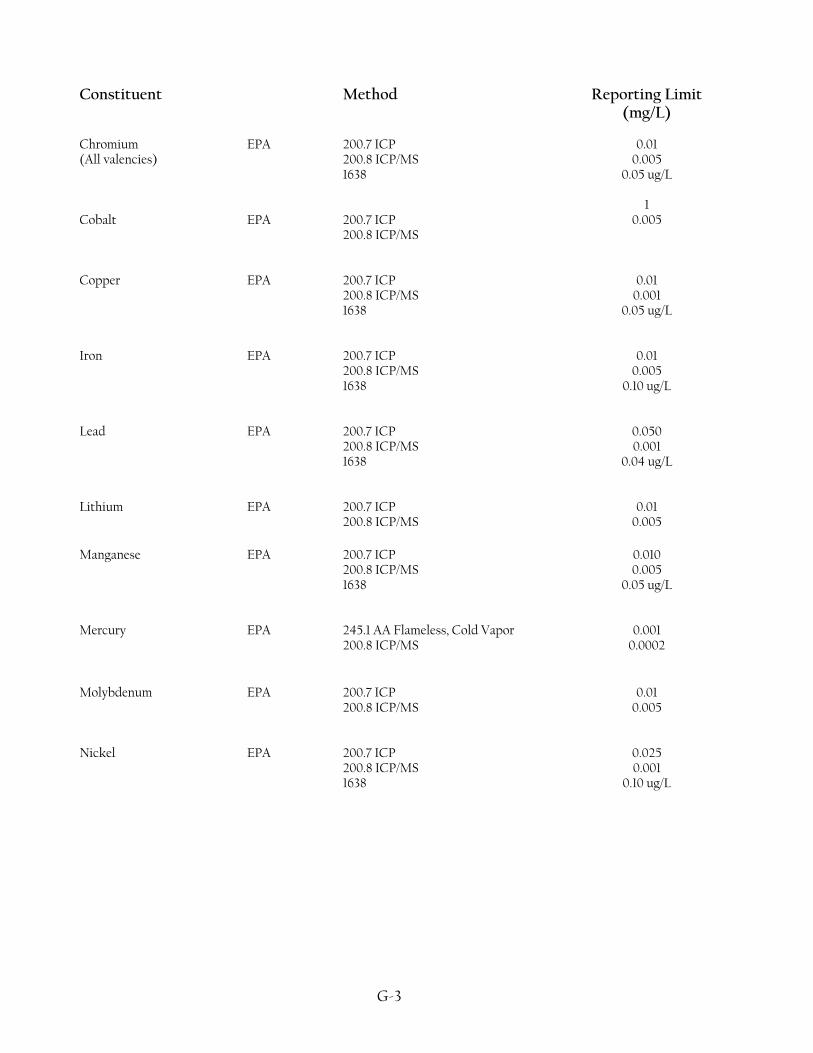
Constituent Method Reporting Limit
(mg/L) Chromium (All valencies)
EPA
200.7 ICP 200.8 ICP/MS 1638
0.01
0.005 0.05 ug/L
Cobalt
EPA
200.7 ICP 200.8 ICP/MS
1 0.005
Copper
EPA
200.7 ICP 200.8 ICP/MS 1638
0.01
0.001 0.05 ug/L
Iron
EPA
200.7 ICP 200.8 ICP/MS 1638
0.01
0.005 0.10 ug/L
Lead
EPA
200.7 ICP 200.8 ICP/MS 1638
0.050 0.001
0.04 ug/L
Lithium
EPA
200.7 ICP 200.8 ICP/MS
0.01
0.005 Manganese
EPA
200.7 ICP 200.8 ICP/MS 1638
0.010 0.005
0.05 ug/L
Mercury
EPA
245.1 AA Flameless, Cold Vapor 200.8 ICP/MS
0.001
0.0002
Molybdenum
EPA
200.7 ICP 200.8 ICP/MS
0.01
0.005
Nickel
EPA
200.7 ICP 200.8 ICP/MS 1638
0.025 0.001
0.10 ug/L
G-3
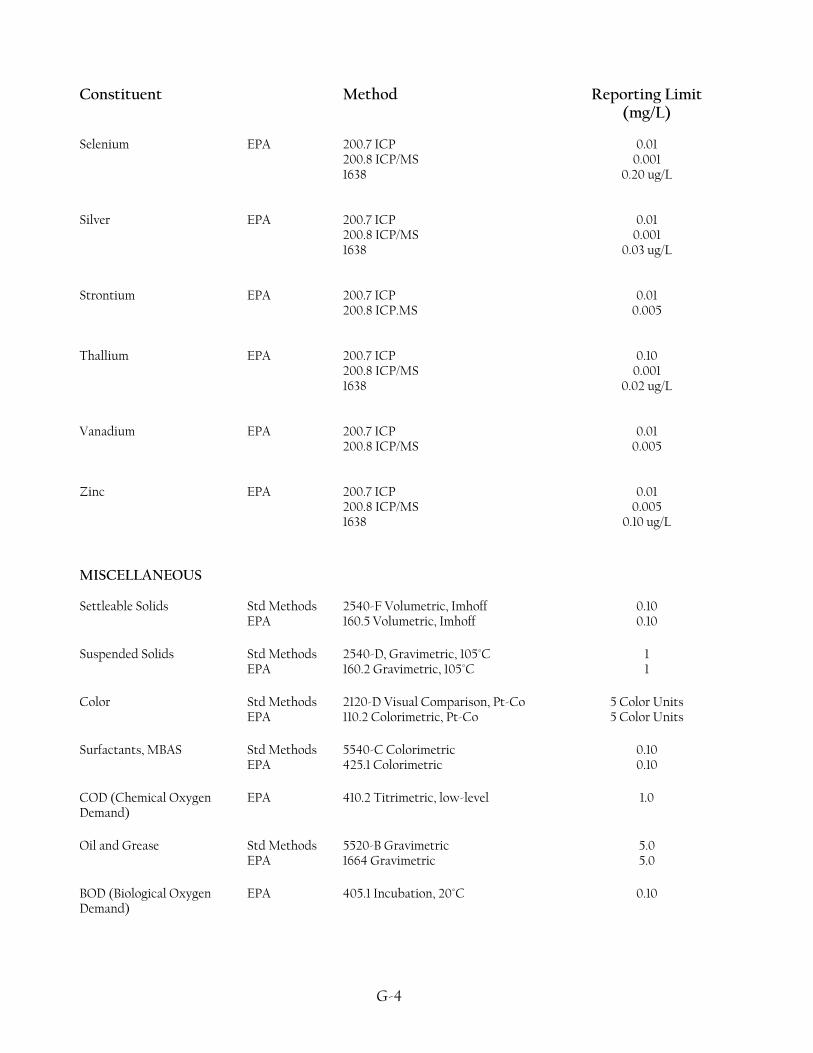
Constituent Method Reporting Limit
(mg/L) Selenium
EPA
200.7 ICP 200.8 ICP/MS 1638
0.01
0.001 0.20 ug/L
Silver
EPA
200.7 ICP 200.8 ICP/MS 1638
0.01
0.001 0.03 ug/L
Strontium
EPA
200.7 ICP 200.8 ICP.MS
0.01
0.005
Thallium
EPA
200.7 ICP 200.8 ICP/MS 1638
0.10
0.001 0.02 ug/L
Vanadium
EPA
200.7 ICP 200.8 ICP/MS
0.01
0.005
Zinc
EPA
200.7 ICP 200.8 ICP/MS 1638
0.01
0.005 0.10 ug/L
MISCELLANEOUS
Settleable Solids
Std Methods EPA
2540-F Volumetric, Imhoff 160.5 Volumetric, Imhoff
0.10 0.10
Suspended Solids
Std Methods EPA
2540-D, Gravimetric, 105°C 160.2 Gravimetric, 105°C
1 1
Color
Std Methods EPA
2120-D Visual Comparison, Pt-Co 110.2 Colorimetric, Pt-Co
5 Color Units 5 Color Units
Surfactants, MBAS
Std Methods EPA
5540-C Colorimetric 425.1 Colorimetric
0.10 0.10
COD (Chemical Oxygen Demand)
EPA
410.2 Titrimetric, low-level
1.0
Oil and Grease
Std Methods EPA
5520-B Gravimetric 1664 Gravimetric
5.0 5.0
BOD (Biological Oxygen Demand)
EPA
405.1 Incubation, 20°C
0.10
G-4
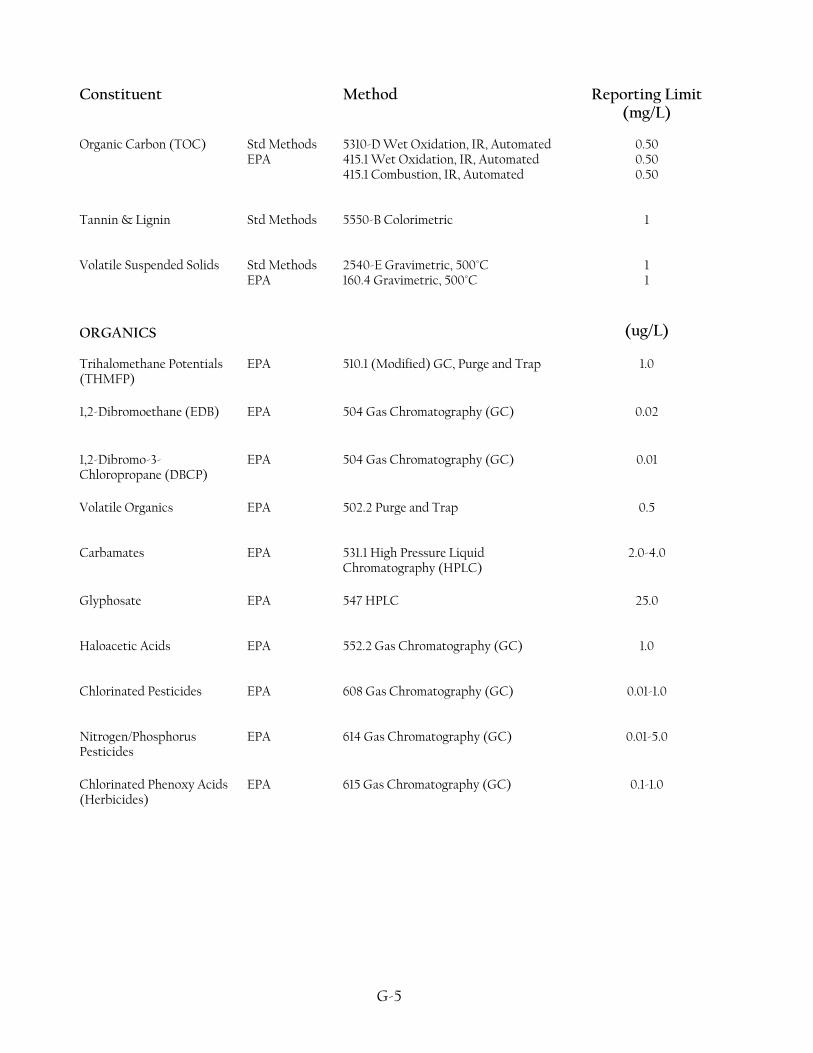
Constituent Method Reporting Limit
(mg/L) Organic Carbon (TOC)
Std Methods EPA
5310-D Wet Oxidation, IR, Automated 415.1 Wet Oxidation, IR, Automated 415.1 Combustion, IR, Automated
0.50 0.50 0.50
Tannin & Lignin
Std Methods
5550-B Colorimetric
1
Volatile Suspended Solids
Std Methods EPA
2540-E Gravimetric, 500°C 160.4 Gravimetric, 500°C
1 1
ORGANICS
(ug/L)
Trihalomethane Potentials (THMFP)
EPA
510.1 (Modified) GC, Purge and Trap
1.0
1,2-Dibromoethane (EDB)
EPA
504 Gas Chromatography (GC)
0.02
1,2-Dibromo-3-Chloropropane (DBCP)
EPA
504 Gas Chromatography (GC)
0.01
Volatile Organics
EPA
502.2 Purge and Trap
0.5
Carbamates
EPA
531.1 High Pressure Liquid Chromatography (HPLC)
2.0-4.0
Glyphosate
EPA
547 HPLC
25.0
Haloacetic Acids
EPA
552.2 Gas Chromatography (GC)
1.0
Chlorinated Pesticides
EPA
608 Gas Chromatography (GC)
0.01-1.0
Nitrogen/Phosphorus Pesticides
EPA
614 Gas Chromatography (GC)
0.01-5.0
Chlorinated Phenoxy Acids (Herbicides)
EPA
615 Gas Chromatography (GC)
0.1-1.0
G-5
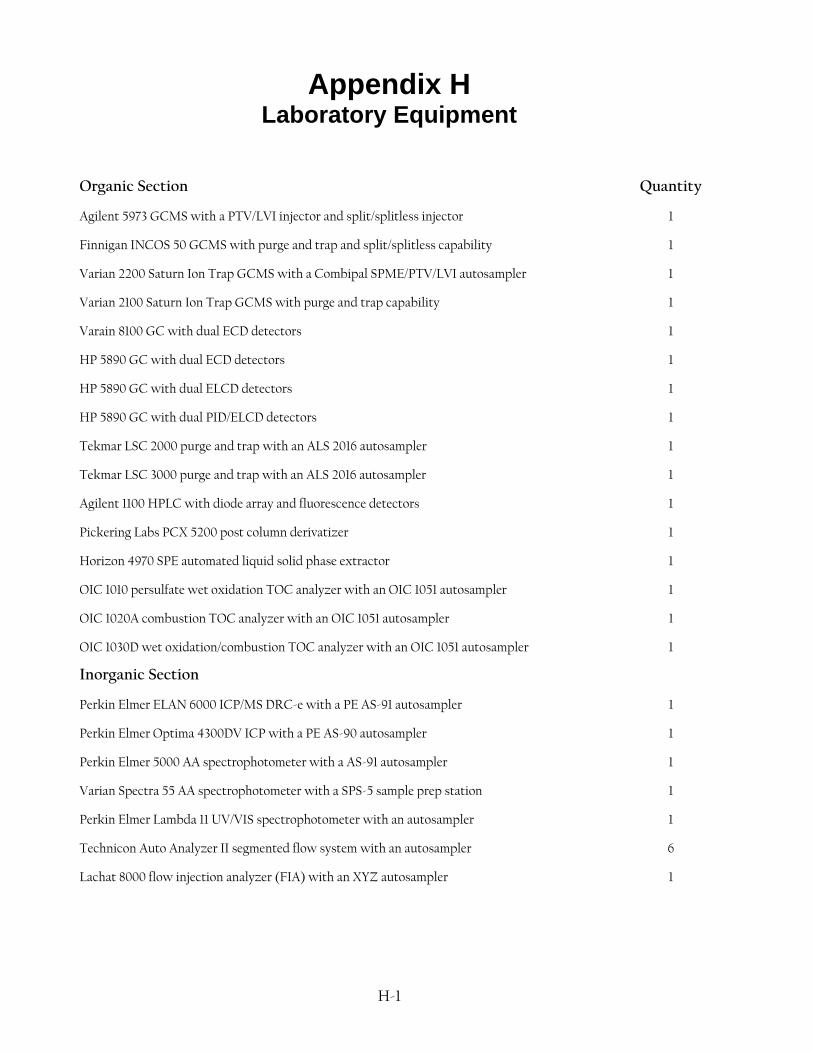
Appendix H Laboratory Equipment
Organic Section Quantity
Agilent 5973 GCMS with a PTV/LVI injector and split/splitless injector 1
Finnigan INCOS 50 GCMS with purge and trap and split/splitless capability 1
Varian 2200 Saturn Ion Trap GCMS with a Combipal SPME/PTV/LVI autosampler 1
Varian 2100 Saturn Ion Trap GCMS with purge and trap capability 1
Varain 8100 GC with dual ECD detectors 1
HP 5890 GC with dual ECD detectors 1
HP 5890 GC with dual ELCD detectors 1
HP 5890 GC with dual PID/ELCD detectors 1
Tekmar LSC 2000 purge and trap with an ALS 2016 autosampler 1
Tekmar LSC 3000 purge and trap with an ALS 2016 autosampler 1
Agilent 1100 HPLC with diode array and fluorescence detectors 1
Pickering Labs PCX 5200 post column derivatizer 1
Horizon 4970 SPE automated liquid solid phase extractor 1
OIC 1010 persulfate wet oxidation TOC analyzer with an OIC 1051 autosampler 1
OIC 1020A combustion TOC analyzer with an OIC 1051 autosampler 1
OIC 1030D wet oxidation/combustion TOC analyzer with an OIC 1051 autosampler 1
Inorganic Section
Perkin Elmer ELAN 6000 ICP/MS DRC-e with a PE AS-91 autosampler 1
Perkin Elmer Optima 4300DV ICP with a PE AS-90 autosampler 1
Perkin Elmer 5000 AA spectrophotometer with a AS-91 autosampler 1
Varian Spectra 55 AA spectrophotometer with a SPS-5 sample prep station 1
Perkin Elmer Lambda 11 UV/VIS spectrophotometer with an autosampler 1
Technicon Auto Analyzer II segmented flow system with an autosampler 6
Lachat 8000 flow injection analyzer (FIA) with an XYZ autosampler 1
H-1
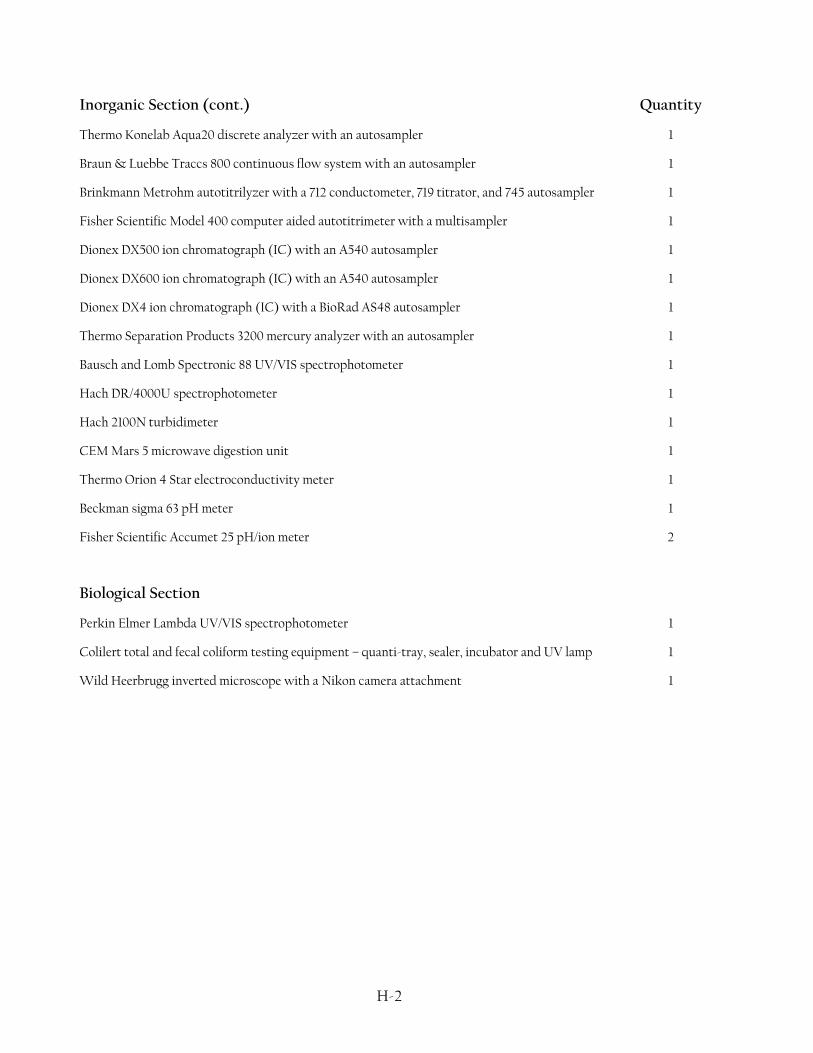
Inorganic Section (cont.) Quantity
Thermo Konelab Aqua20 discrete analyzer with an autosampler 1
Braun & Luebbe Traccs 800 continuous flow system with an autosampler 1
Brinkmann Metrohm autotitrilyzer with a 712 conductometer, 719 titrator, and 745 autosampler 1
Fisher Scientific Model 400 computer aided autotitrimeter with a multisampler 1
Dionex DX500 ion chromatograph (IC) with an A540 autosampler 1
Dionex DX600 ion chromatograph (IC) with an A540 autosampler 1
Dionex DX4 ion chromatograph (IC) with a BioRad AS48 autosampler 1
Thermo Separation Products 3200 mercury analyzer with an autosampler 1
Bausch and Lomb Spectronic 88 UV/VIS spectrophotometer 1
Hach DR/4000U spectrophotometer 1
Hach 2100N turbidimeter 1
CEM Mars 5 microwave digestion unit 1
Thermo Orion 4 Star electroconductivity meter 1
Beckman sigma 63 pH meter 1
Fisher Scientific Accumet 25 pH/ion meter 2
Biological Section
Perkin Elmer Lambda UV/VIS spectrophotometer 1
Colilert total and fecal coliform testing equipment – quanti-tray, sealer, incubator and UV lamp 1
Wild Heerbrugg inverted microscope with a Nikon camera attachment 1
H-2
Management Approval Date
Additional copies of this report may be obtained from
Department of Water Resources
Bryte Chemical Laboratory 1450 Riverbank Road
West Sacramento, CA 95605
(916) 375-6008