bruker corporation (nasdaq: brkr)s1.q4cdn.com/927487829/files/doc_presentations/2018/01/...bruker...
TRANSCRIPT
© Bruker Corporation
Bruker drives profitable growth by enabling scientific discoveries and delivering high-performance analytical, life science and diagnostic solutions.
Innovation with Integrity
Bruker Corporation (NASDAQ: BRKR)
Bruker Corporation Safe Harbor Statement
Any statements contained in this presentation that do not describe historical facts may constitute forward-looking statements
within the meaning of the Private Securities Litigation Reform Act of 1995. Forward-looking statements are based on current
expectations, forecasts and assumptions of our management and are subject to risks and uncertainties that could cause actual
results to differ materially from those indicated, including, but not limited to, risks and uncertainties relating to: adverse
changes in conditions in the global economy and volatility in the capital markets; the integration of businesses we have
acquired or may acquire in the future; fluctuations in foreign currency exchange rates; implementation of strategies for
improving our operating margins, profitability and cash flow; changing technologies; product development and market
acceptance of our products; the cost and pricing of our products; competition; dependence on collaborative partners, key
suppliers and contract manufacturers; capital spending and government funding policies; changes in governmental regulations;
the use and protection of intellectual property rights and other risk factors discussed from time to time in our filings with the
Securities and Exchange Commission, or SEC. These and other factors are identified and described in more detail in our most
recent reports filed with the SEC, including, without limitation, our annual report on Form 10-K for the year ended December
31, 2016, our most recent quarterly reports on Form 10-Q and our current reports on Form 8-K. We expressly disclaim any
intent or obligation to update these forward-looking statements other than as required by law.
© Bruker Corporation 2
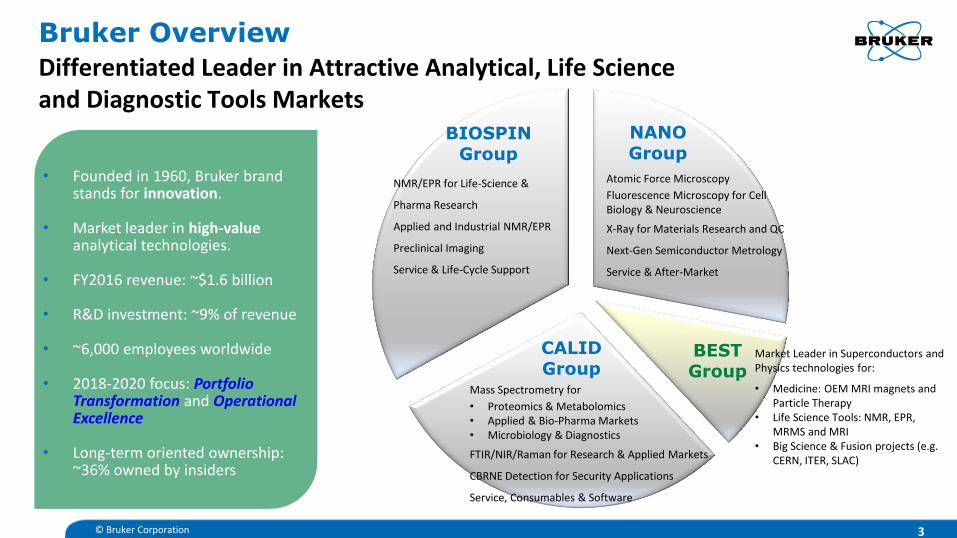
BIOSPIN Group
BEST Group
NMR/EPR for Life-Science &
Pharma Research
Applied and Industrial NMR/EPR
Preclinical Imaging
Service & Life-Cycle Support
Mass Spectrometry for
• Proteomics & Metabolomics • Applied & Bio-Pharma Markets • Microbiology & Diagnostics
FTIR/NIR/Raman for Research & Applied Markets
CBRNE Detection for Security Applications
Service, Consumables & Software
Atomic Force Microscopy
Fluorescence Microscopy for Cell Biology & Neuroscience
X-Ray for Materials Research and QC
Next-Gen Semiconductor Metrology
Service & After-Market
Market Leader in Superconductors and Physics technologies for:
• Medicine: OEM MRI magnets and Particle Therapy
• Life Science Tools: NMR, EPR, MRMS and MRI
• Big Science & Fusion projects (e.g. CERN, ITER, SLAC)
© Bruker Corporation 3
NANO Group
CALID Group
Bruker Overview
Differentiated Leader in Attractive Analytical, Life Science and Diagnostic Tools Markets
• Founded in 1960, Bruker brand
stands for innovation.
• Market leader in high-value analytical technologies.
• FY2016 revenue: ~$1.6 billion
• R&D investment: ~9% of revenue
• ~6,000 employees worldwide
• 2018-2020 focus: Portfolio
Transformation and Operational Excellence
• Long-term oriented ownership:
~36% owned by insiders
© Bruker Corporation 4
Markets:
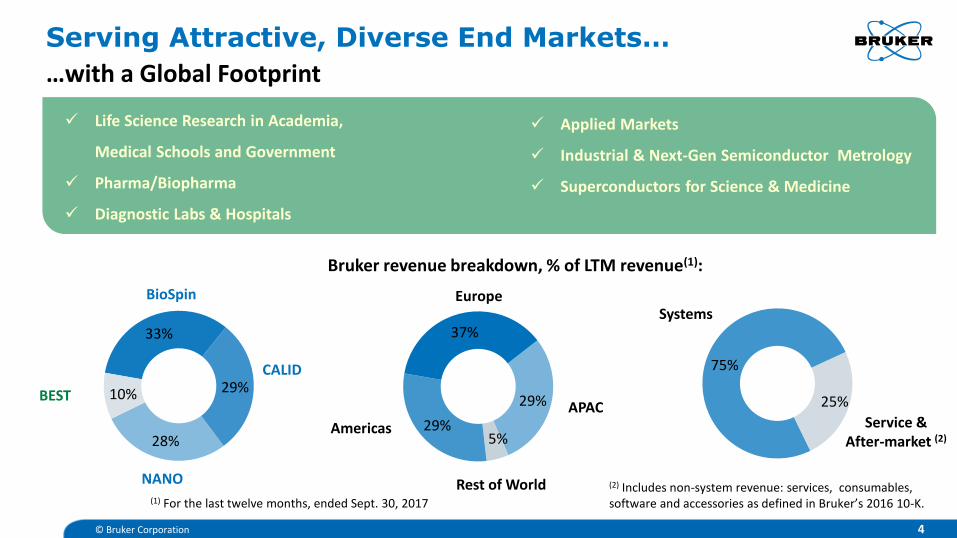
Serving Attractive, Diverse End Markets…
…with a Global Footprint
Life Science Research in Academia,
Medical Schools and Government
Pharma/Biopharma
Diagnostic Labs & Hospitals
Applied Markets
Industrial & Next-Gen Semiconductor Metrology
Superconductors for Science & Medicine
(1) For the last twelve months, ended Sept. 30, 2017
33%
29%
28%
10%
BioSpin
37%
29%
5% 29%
75%
25%
Systems
CALID
NANO
BEST
Service & After-market (2)
Americas
Europe
Rest of World
APAC
Bruker revenue breakdown, % of LTM revenue(1):
(2) Includes non-system revenue: services, consumables, software and accessories as defined in Bruker’s 2016 10-K.
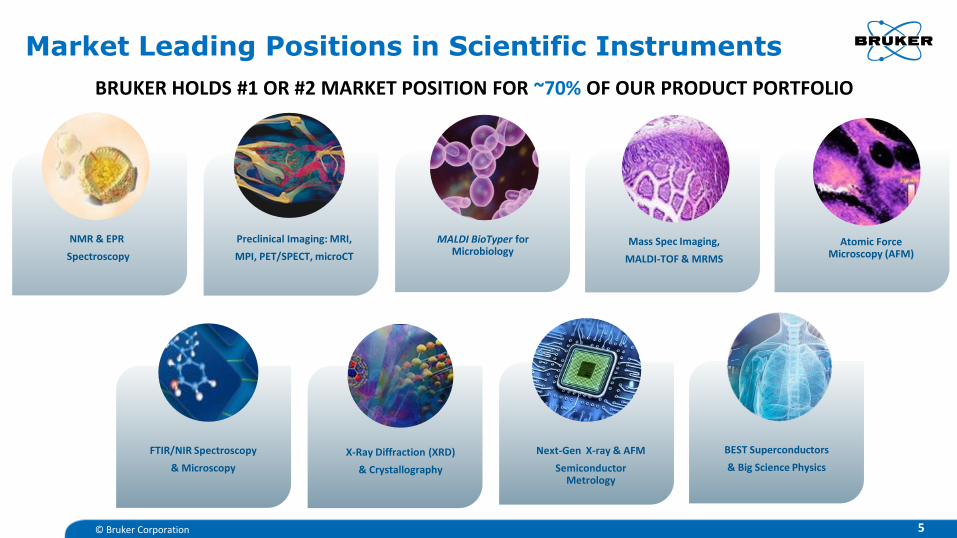
BRUKER HOLDS #1 OR #2 MARKET POSITION FOR ~70% OF OUR PRODUCT PORTFOLIO
© Bruker Corporation
Market Leading Positions in Scientific Instruments
NMR & EPR
Spectroscopy
Preclinical Imaging: MRI,
MPI, PET/SPECT, microCT
MALDI BioTyper for Microbiology
Atomic Force Microscopy
5
Mass Spec Imaging,
MALDI-TOF & MRMS
X-Ray Diffraction Next Gen Semicon Metrology
BEST Superconductors
& Big Science Physics
FTIR/NIR Spectroscopy
& Microscopy
Atomic Force Microscopy (AFM)
Next-Gen X-ray & AFM
Semiconductor Metrology
X-Ray Diffraction (XRD)
& Crystallography

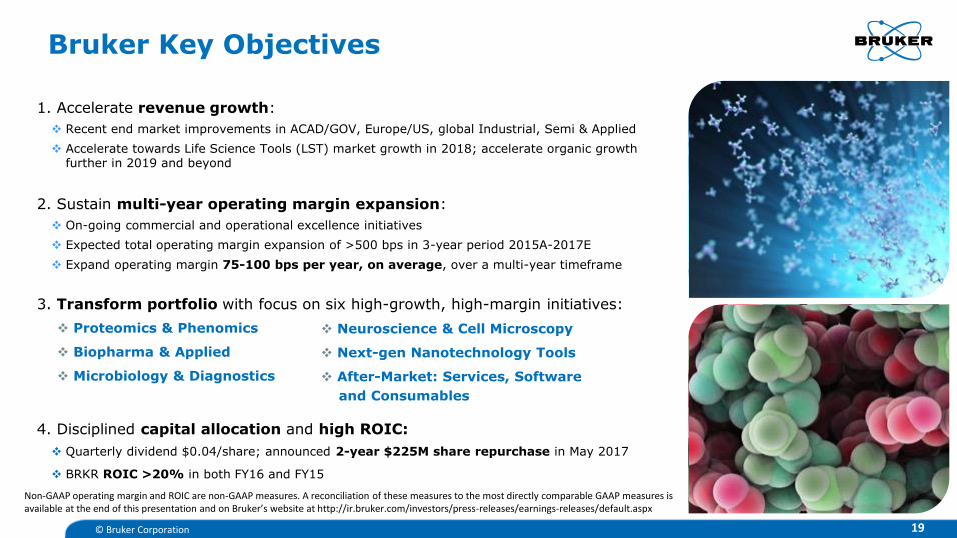
Bruker Key Objectives
1. Accelerate revenue growth:
Recent end market improvements in ACAD/GOV, Europe/US, global Industrial, Semi & Applied
Accelerate towards Life Science Tools (LST) market growth in 2018; accelerate organic growth further in 2019 and beyond
2. Sustain multi-year operating margin expansion:
On-going commercial and operational excellence initiatives
Expected total operating margin expansion of >500 bps in 3-year period 2015A-2017E
Expand operating margin 75-100 bps per year, on average, over a multi-year timeframe
3. Transform portfolio with focus on six high-growth, high-margin initiatives:
4. Disciplined capital allocation and high ROIC:
Quarterly dividend $0.04/share; announced 2-year $225M share repurchase in May 2017
BRKR ROIC >20% in both FY16 and FY15
© Bruker Corporation 6
Proteomics & Phenomics
Biopharma & Applied
Microbiology & Diagnostics
Neuroscience & Cell Microscopy
Next-gen Nanotechnology Tools
After-Market: Services, Software
and Consumables
Non-GAAP operating margin and ROIC are non-GAAP measures. A reconciliation of these measures to the most directly comparable GAAP measures is available at the end of this presentation and on Bruker’s website at http://ir.bruker.com/investors/press-releases/earnings-releases/default.aspx
© Bruker Corporation 7
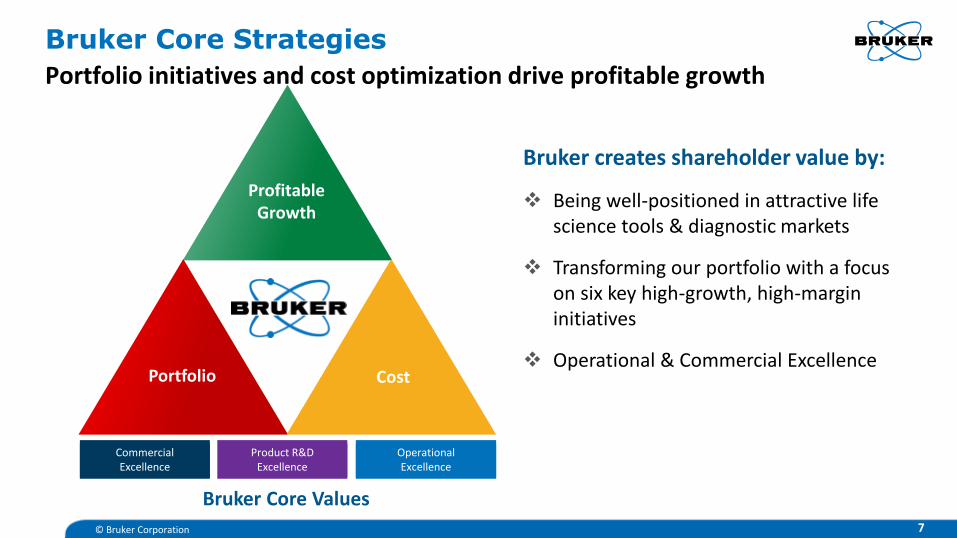
Bruker creates shareholder value by:
Being well-positioned in attractive life science tools & diagnostic markets
Transforming our portfolio with a focus on six key high-growth, high-margin initiatives
Operational & Commercial Excellence
Bruker Core Values
Bruker Core Strategies
Portfolio initiatives and cost optimization drive profitable growth
Profitable Growth
Portfolio Cost
Commercial Excellence
Product R&D Excellence
Operational Excellence
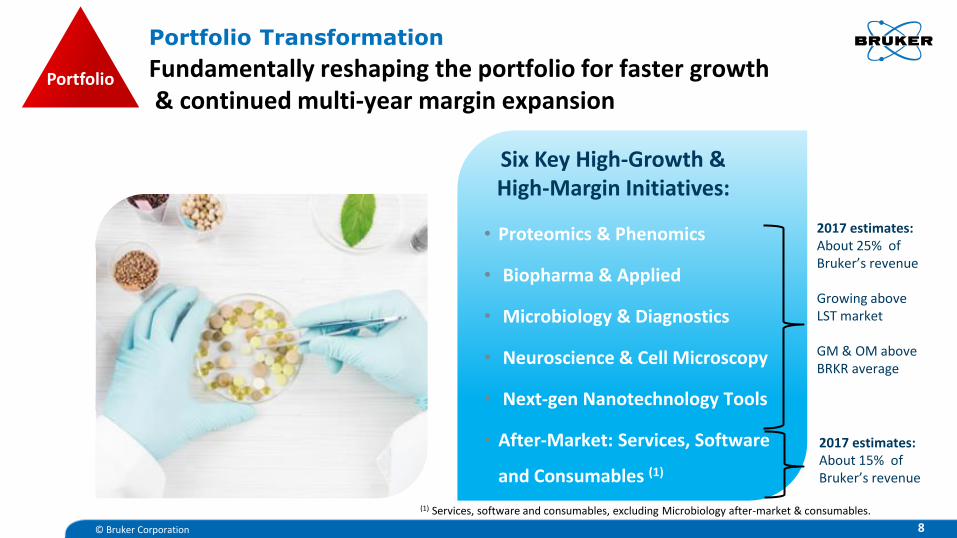
• Proteomics & Phenomics
• Biopharma & Applied
• Microbiology & Diagnostics
• Neuroscience & Cell Microscopy
• Next-gen Nanotechnology Tools
• After-Market: Services, Software
and Consumables (1)
Six Key High-Growth & High-Margin Initiatives:
8
Portfolio Transformation
Fundamentally reshaping the portfolio for faster growth & continued multi-year margin expansion
2017 estimates: About 25% of Bruker’s revenue
Growing above LST market GM & OM above BRKR average
© Bruker Corporation
(1) Services, software and consumables, excluding Microbiology after-market & consumables.
2017 estimates: About 15% of Bruker’s revenue
Portfolio

Portfolio Transformation
Proteomics & Phenomics
Structural Biology by GHz-Class NMR
Phenomics by NMR Proteomics & Phenomics by Mass Spec
• Structural biology: NMR
reveals dynamics and function
• Unique for Intrinsically
Disordered Proteins,
transcription factors,
membrane proteins, protein
aggregates (in AD/PD/ALS)
• timsTOFTM Pro trapped ion
mobility QTOF with PASEF is
game-changing for bottom-up
proteomics and MS-based
phenomics
• Phenomics clinical research
and diagnostics expected to
grow rapidly in next decade
• NMR is a core technology in
metabolomics research
© Bruker Corporation 9
NEW : • Avance NEO next-gen NMR console
NEW: • timsTOFTM Pro with PASEF
Portfolio
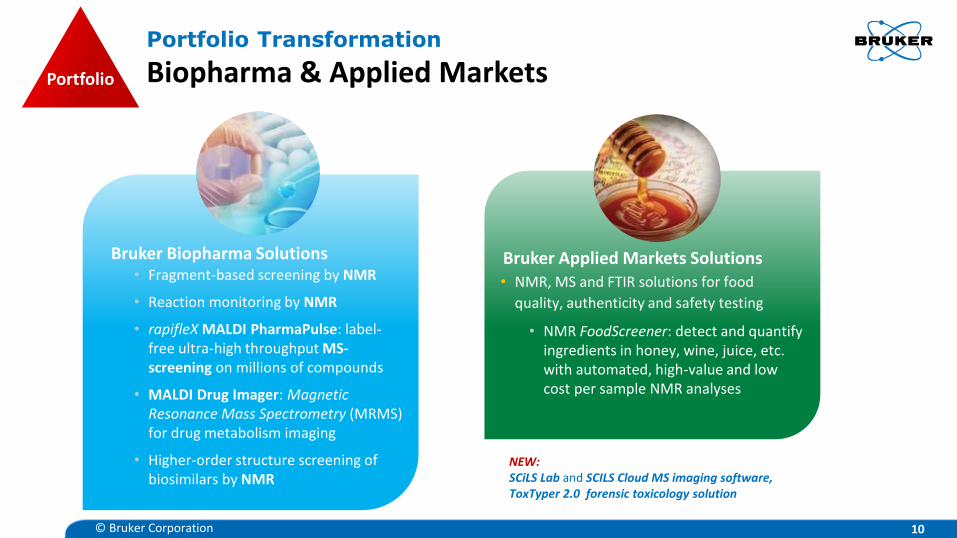
Bruker Biopharma Solutions • Fragment-based screening by NMR
• Reaction monitoring by NMR
• rapifleX MALDI PharmaPulse: label-free ultra-high throughput MS-screening on millions of compounds
• MALDI Drug Imager: Magnetic Resonance Mass Spectrometry (MRMS) for drug metabolism imaging
• Higher-order structure screening of biosimilars by NMR
• NMR, MS and FTIR solutions for food
quality, authenticity and safety testing
• NMR FoodScreener: detect and quantify ingredients in honey, wine, juice, etc. with automated, high-value and low cost per sample NMR analyses
Portfolio Transformation
Biopharma & Applied Markets
Bruker Applied Markets Solutions
© Bruker Corporation 10
NEW: SCiLS Lab and SCILS Cloud MS imaging software, ToxTyper 2.0 forensic toxicology solution
Portfolio
Portfolio Transformation
Microbiology & Diagnostics
© Bruker Corporation 11
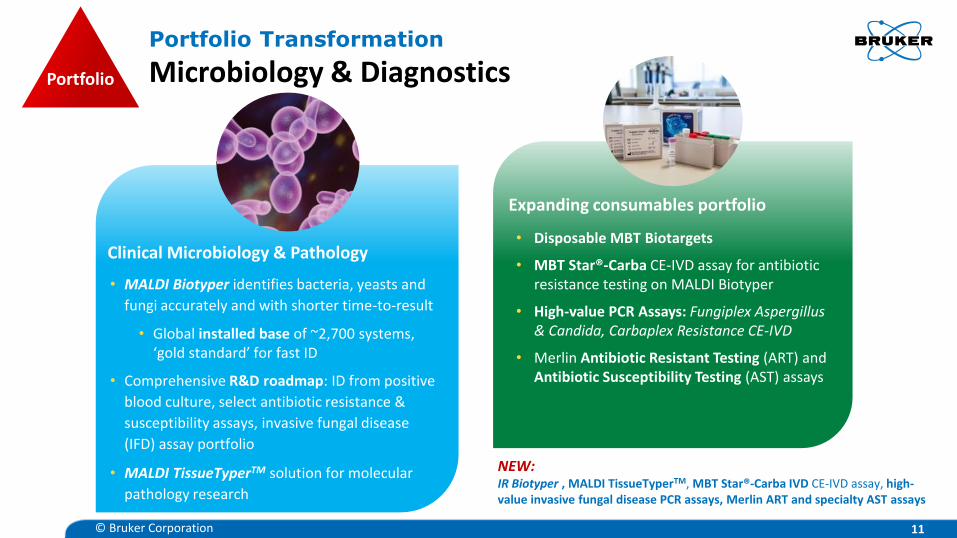
• MALDI Biotyper identifies bacteria, yeasts and
fungi accurately and with shorter time-to-result
• Global installed base of ~2,700 systems, ‘gold standard’ for fast ID
• Comprehensive R&D roadmap: ID from positive
blood culture, select antibiotic resistance &
susceptibility assays, invasive fungal disease
(IFD) assay portfolio
• MALDI TissueTyperTM solution for molecular
pathology research
Clinical Microbiology & Pathology
Expanding consumables portfolio • Disposable MBT Biotargets
• MBT Star®-Carba CE-IVD assay for antibiotic resistance testing on MALDI Biotyper
• High-value PCR Assays: Fungiplex Aspergillus & Candida, Carbaplex Resistance CE-IVD
• Merlin Antibiotic Resistant Testing (ART) and Antibiotic Susceptibility Testing (AST) assays
Portfolio
NEW: IR Biotyper , MALDI TissueTyperTM, MBT Star®-Carba IVD CE-IVD assay, high-value invasive fungal disease PCR assays, Merlin ART and specialty AST assays
Portfolio Transformation
Neuroscience & Cell Microscopy
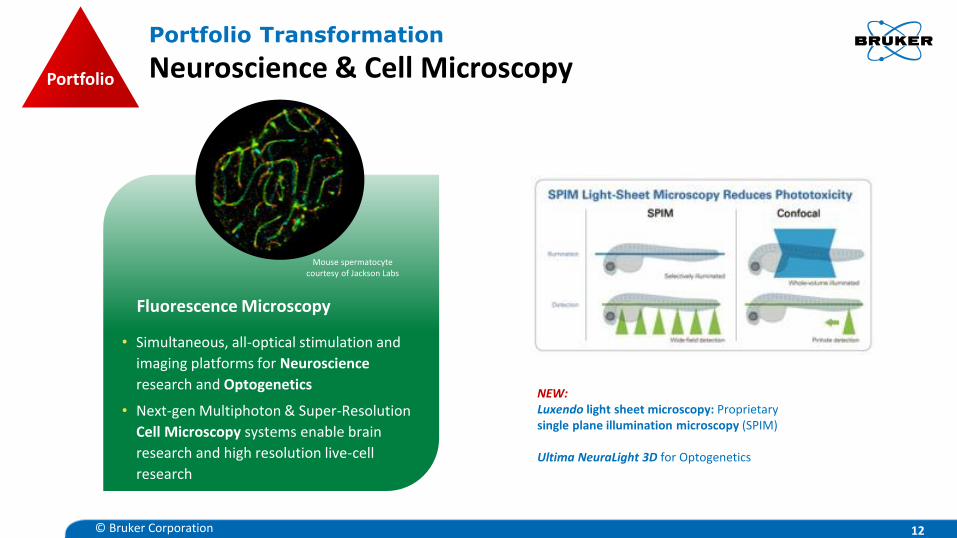
• Simultaneous, all-optical stimulation and
imaging platforms for Neuroscience
research and Optogenetics
• Next-gen Multiphoton & Super-Resolution
Cell Microscopy systems enable brain
research and high resolution live-cell
research
Fluorescence Microscopy
Mouse spermatocyte courtesy of Jackson Labs
© Bruker Corporation 12
NEW: Luxendo light sheet microscopy: Proprietary single plane illumination microscopy (SPIM) Ultima NeuraLight 3D for Optogenetics
Portfolio
Portfolio Transformation
Next-Gen Nanotechnology Tools
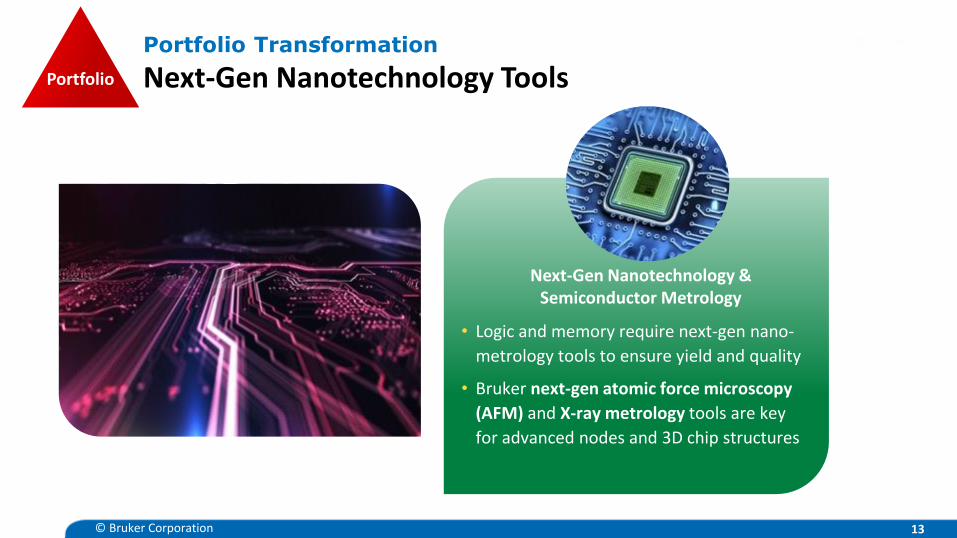
Next-Gen Nanotechnology & Semiconductor Metrology
• Logic and memory require next-gen nano-
metrology tools to ensure yield and quality
• Bruker next-gen atomic force microscopy
(AFM) and X-ray metrology tools are key
for advanced nodes and 3D chip structures
© Bruker Corporation 13
Portfolio
Fast Growing After-Market Business Focus on Services, Software and Consumables
© Bruker Corporation 14
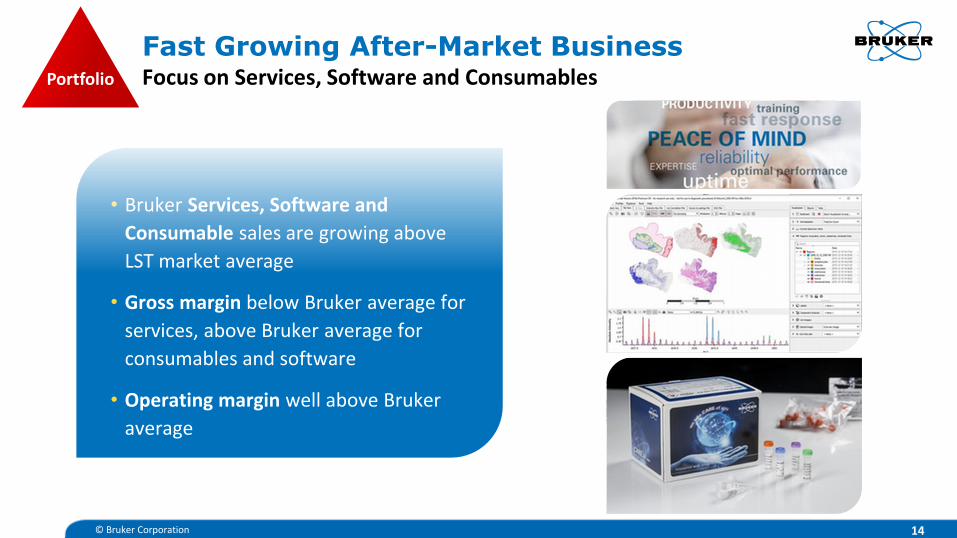
• Bruker Services, Software and
Consumable sales are growing above
LST market average
• Gross margin below Bruker average for
services, above Bruker average for
consumables and software
• Operating margin well above Bruker
average
Portfolio
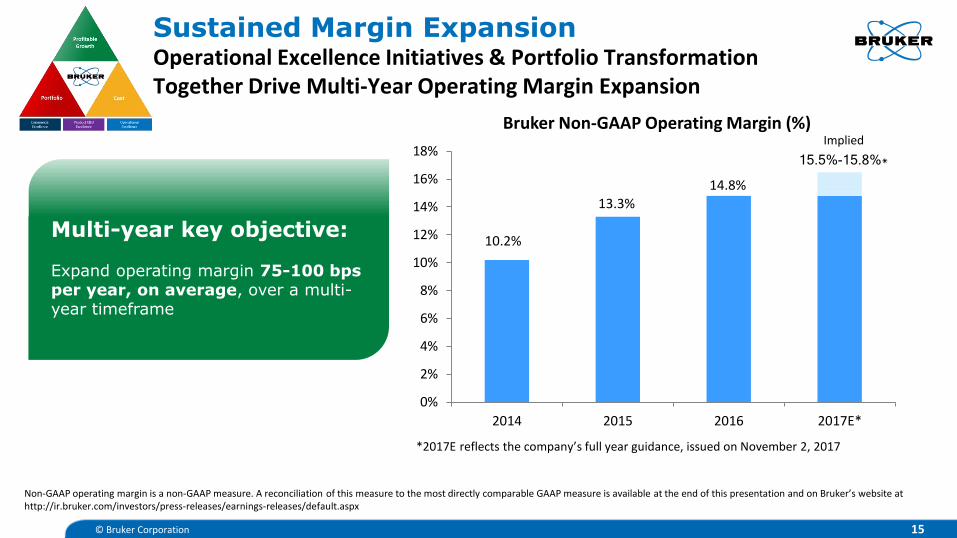
Sustained Margin Expansion Operational Excellence Initiatives & Portfolio Transformation Together Drive Multi-Year Operating Margin Expansion
© Bruker Corporation 15
Multi-year key objective: Expand operating margin 75-100 bps per year, on average, over a multi-year timeframe
10.2%
13.3%
14.8%
Implied
15.5%-15.8%*
0%
2%
4%
6%
8%
10%
12%
14%
16%
18%
2014 2015 2016 2017E*
Bruker Non-GAAP Operating Margin (%)
*2017E reflects the company’s full year guidance, issued on November 2, 2017
Non-GAAP operating margin is a non-GAAP measure. A reconciliation of this measure to the most directly comparable GAAP measure is available at the end of this presentation and on Bruker’s website at http://ir.bruker.com/investors/press-releases/earnings-releases/default.aspx
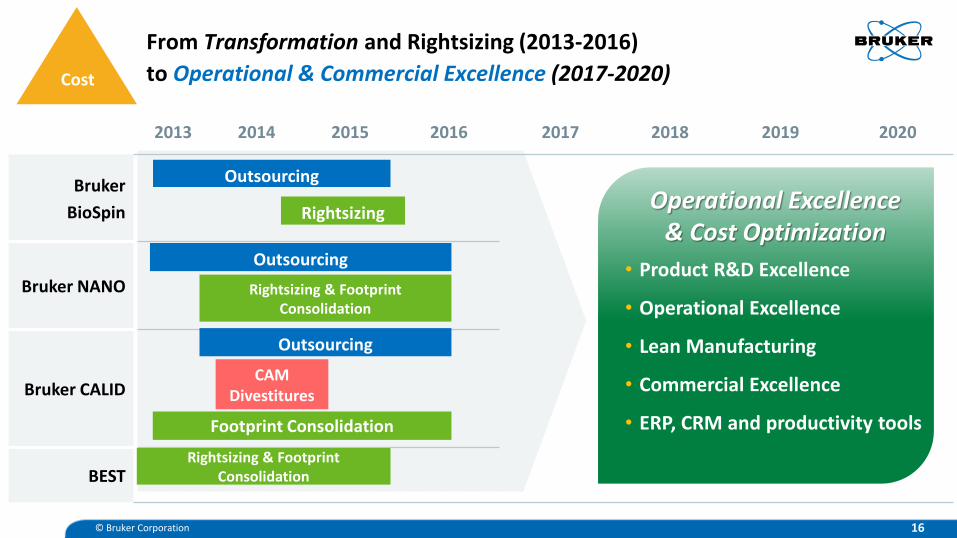
Outsourcing
2013 2014 2015 2016 2017 2018 2019 2020
Bruker
BioSpin
Bruker NANO
Bruker CALID
BEST
Rightsizing
Rightsizing & Footprint Consolidation
Outsourcing
CAM Divestitures
Rightsizing & Footprint Consolidation
Outsourcing
Footprint Consolidation
Operational Excellence & Cost Optimization
• Product R&D Excellence
• Operational Excellence
• Lean Manufacturing
• Commercial Excellence
• ERP, CRM and productivity tools
From Transformation and Rightsizing (2013-2016)
to Operational & Commercial Excellence (2017-2020)
© Bruker Corporation 16
Cost
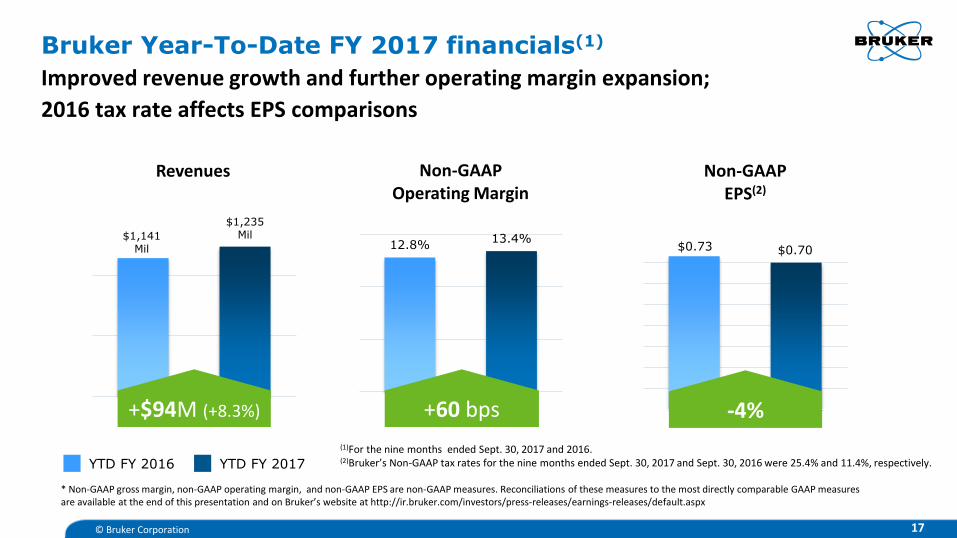
$0.73 $0.70
YTD FY 2016YTD FY 2017
Non-GAAP EPS(2)
Bruker Year-To-Date FY 2017 financials(1)
Improved revenue growth and further operating margin expansion;
2016 tax rate affects EPS comparisons
12.8% 13.4%
Non-GAAP Operating Margin
$1,141Mil
$1,235Mil
Revenues
+60 bps -4% +$94M (+8.3%)
YTD FY 2016 YTD FY 2017
© Bruker Corporation
* Non-GAAP gross margin, non-GAAP operating margin, and non-GAAP EPS are non-GAAP measures. Reconciliations of these measures to the most directly comparable GAAP measures are available at the end of this presentation and on Bruker’s website at http://ir.bruker.com/investors/press-releases/earnings-releases/default.aspx
17
(1)For the nine months ended Sept. 30, 2017 and 2016. (2)Bruker’s Non-GAAP tax rates for the nine months ended Sept. 30, 2017 and Sept. 30, 2016 were 25.4% and 11.4%, respectively.
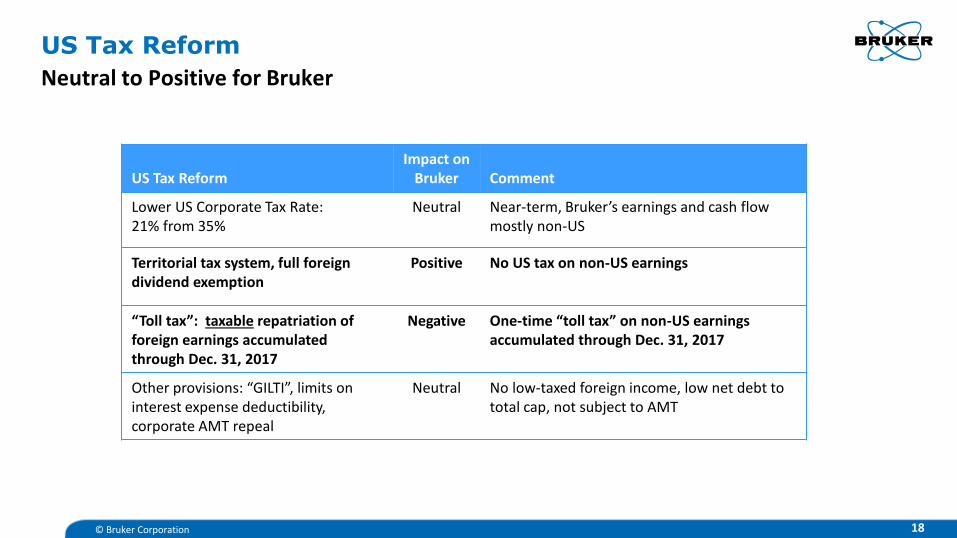
US Tax Reform
Neutral to Positive for Bruker
© Bruker Corporation 18
US Tax Reform Impact on
Bruker Comment
Lower US Corporate Tax Rate: 21% from 35%
Neutral Near-term, Bruker’s earnings and cash flow mostly non-US
Territorial tax system, full foreign dividend exemption
Positive No US tax on non-US earnings
“Toll tax”: taxable repatriation of foreign earnings accumulated through Dec. 31, 2017
Negative One-time “toll tax” on non-US earnings accumulated through Dec. 31, 2017
Other provisions: “GILTI”, limits on interest expense deductibility, corporate AMT repeal
Neutral No low-taxed foreign income, low net debt to total cap, not subject to AMT
Bruker Key Objectives
1. Accelerate revenue growth:
Recent end market improvements in ACAD/GOV, Europe/US, global Industrial, Semi & Applied
Accelerate towards Life Science Tools (LST) market growth in 2018; accelerate organic growth further in 2019 and beyond
2. Sustain multi-year operating margin expansion:
On-going commercial and operational excellence initiatives
Expected total operating margin expansion of >500 bps in 3-year period 2015A-2017E
Expand operating margin 75-100 bps per year, on average, over a multi-year timeframe
3. Transform portfolio with focus on six high-growth, high-margin initiatives:
4. Disciplined capital allocation and high ROIC:
Quarterly dividend $0.04/share; announced 2-year $225M share repurchase in May 2017
BRKR ROIC >20% in both FY16 and FY15
© Bruker Corporation 19
Proteomics & Phenomics
Biopharma & Applied
Microbiology & Diagnostics
Neuroscience & Cell Microscopy
Next-gen Nanotechnology Tools
After-Market: Services, Software
and Consumables
Non-GAAP operating margin and ROIC are non-GAAP measures. A reconciliation of these measures to the most directly comparable GAAP measures is available at the end of this presentation and on Bruker’s website at http://ir.bruker.com/investors/press-releases/earnings-releases/default.aspx
© Bruker Corporation
www.bruker.com
20
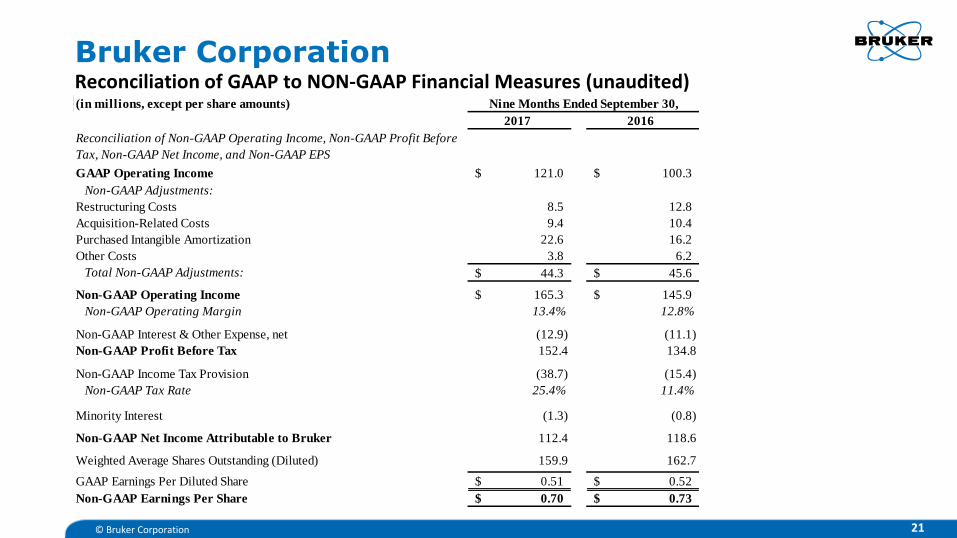
Bruker Corporation Reconciliation of GAAP to NON-GAAP Financial Measures (unaudited)
© Bruker Corporation 21
(in millions, except per share amounts)
2017 2016
Reconciliation of Non-GAAP Operating Income, Non-GAAP Profit Before
Tax, Non-GAAP Net Income, and Non-GAAP EPS
GAAP Operating Income 121.0$ 100.3$
Non-GAAP Adjustments:
Restructuring Costs 8.5 12.8
Acquisition-Related Costs 9.4 10.4
Purchased Intangible Amortization 22.6 16.2
Other Costs 3.8 6.2
Total Non-GAAP Adjustments: 44.3$ 45.6$
Non-GAAP Operating Income 165.3$ 145.9$
Non-GAAP Operating Margin 13.4% 12.8%
Non-GAAP Interest & Other Expense, net (12.9) (11.1)
Non-GAAP Profit Before Tax 152.4 134.8
Non-GAAP Income Tax Provision (38.7) (15.4)
Non-GAAP Tax Rate 25.4% 11.4%
Minority Interest (1.3) (0.8)
Non-GAAP Net Income Attributable to Bruker 112.4 118.6
Weighted Average Shares Outstanding (Diluted) 159.9 162.7
GAAP Earnings Per Diluted Share 0.51$ 0.52$
Non-GAAP Earnings Per Share 0.70$ 0.73$
Nine Months Ended September 30,
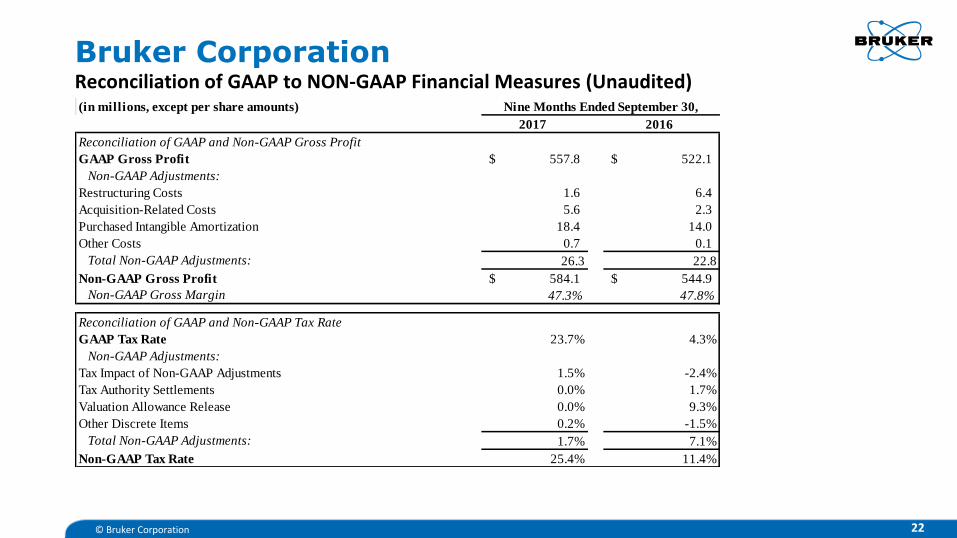
Bruker Corporation Reconciliation of GAAP to NON-GAAP Financial Measures (Unaudited)
© Bruker Corporation 22
(in millions, except per share amounts)
2017 2016
Reconciliation of GAAP and Non-GAAP Gross Profit
GAAP Gross Profit 557.8$ 522.1$
Non-GAAP Adjustments:
Restructuring Costs 1.6 6.4
Acquisition-Related Costs 5.6 2.3
Purchased Intangible Amortization 18.4 14.0
Other Costs 0.7 0.1
Total Non-GAAP Adjustments: 26.3 22.8
Non-GAAP Gross Profit 584.1$ 544.9$
Non-GAAP Gross Margin 47.3% 47.8%
Reconciliation of GAAP and Non-GAAP Tax Rate
GAAP Tax Rate 23.7% 4.3%
Non-GAAP Adjustments:
Tax Impact of Non-GAAP Adjustments 1.5% -2.4%
Tax Authority Settlements 0.0% 1.7%
Valuation Allowance Release 0.0% 9.3%
Other Discrete Items 0.2% -1.5%
Total Non-GAAP Adjustments: 1.7% 7.1%
Non-GAAP Tax Rate 25.4% 11.4%
Nine Months Ended September 30,
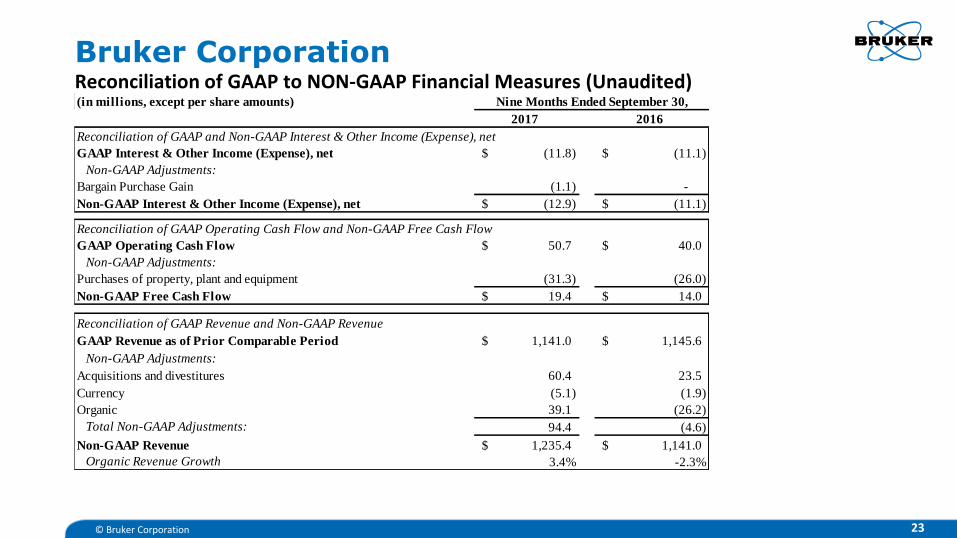
Bruker Corporation Reconciliation of GAAP to NON-GAAP Financial Measures (Unaudited)
© Bruker Corporation 23
(in millions, except per share amounts)
2017 2016
Reconciliation of GAAP and Non-GAAP Interest & Other Income (Expense), net
GAAP Interest & Other Income (Expense), net (11.8)$ (11.1)$
Non-GAAP Adjustments:
Bargain Purchase Gain (1.1) -
Non-GAAP Interest & Other Income (Expense), net (12.9)$ (11.1)$
Reconciliation of GAAP Operating Cash Flow and Non-GAAP Free Cash Flow
GAAP Operating Cash Flow 50.7$ 40.0$
Non-GAAP Adjustments:
Purchases of property, plant and equipment (31.3) (26.0)
Non-GAAP Free Cash Flow 19.4$ 14.0$
Reconciliation of GAAP Revenue and Non-GAAP Revenue
GAAP Revenue as of Prior Comparable Period 1,141.0$ 1,145.6$
Non-GAAP Adjustments:
Acquisitions and divestitures 60.4 23.5
Currency (5.1) (1.9)
Organic 39.1 (26.2)
Total Non-GAAP Adjustments: 94.4 (4.6)
Non-GAAP Revenue 1,235.4$ 1,141.0$
Organic Revenue Growth 3.4% -2.3%
Nine Months Ended September 30,
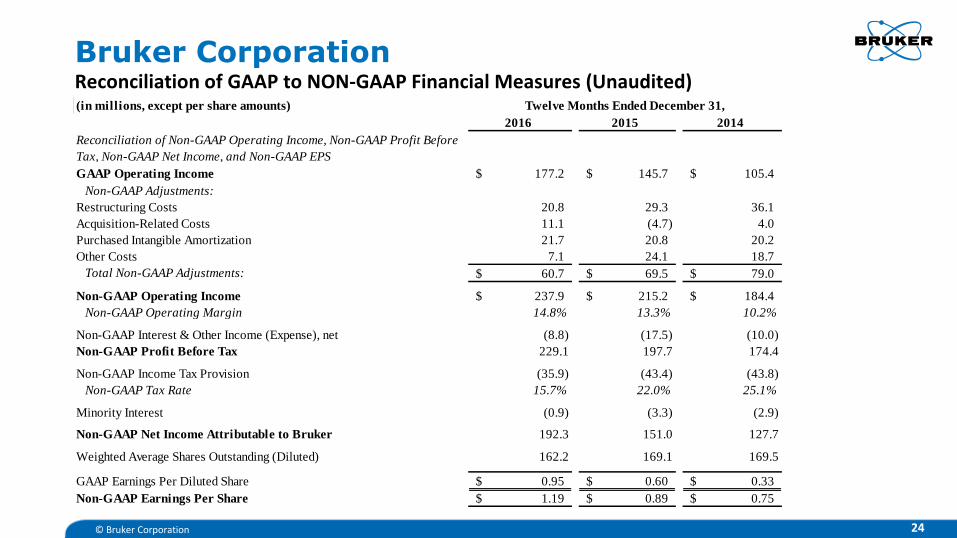
Bruker Corporation Reconciliation of GAAP to NON-GAAP Financial Measures (Unaudited)
© Bruker Corporation 24
(in millions, except per share amounts)
2016 2015 2014
Reconciliation of Non-GAAP Operating Income, Non-GAAP Profit Before
Tax, Non-GAAP Net Income, and Non-GAAP EPS
GAAP Operating Income 177.2$ 145.7$ 105.4$
Non-GAAP Adjustments:
Restructuring Costs 20.8 29.3 36.1
Acquisition-Related Costs 11.1 (4.7) 4.0
Purchased Intangible Amortization 21.7 20.8 20.2
Other Costs 7.1 24.1 18.7
Total Non-GAAP Adjustments: 60.7$ 69.5$ 79.0$
Non-GAAP Operating Income 237.9$ 215.2$ 184.4$
Non-GAAP Operating Margin 14.8% 13.3% 10.2%
Non-GAAP Interest & Other Income (Expense), net (8.8) (17.5) (10.0)
Non-GAAP Profit Before Tax 229.1 197.7 174.4
Non-GAAP Income Tax Provision (35.9) (43.4) (43.8)
Non-GAAP Tax Rate 15.7% 22.0% 25.1%
Minority Interest (0.9) (3.3) (2.9)
Non-GAAP Net Income Attributable to Bruker 192.3 151.0 127.7
Weighted Average Shares Outstanding (Diluted) 162.2 169.1 169.5
GAAP Earnings Per Diluted Share 0.95$ 0.60$ 0.33$
Non-GAAP Earnings Per Share 1.19$ 0.89$ 0.75$
Twelve Months Ended December 31,
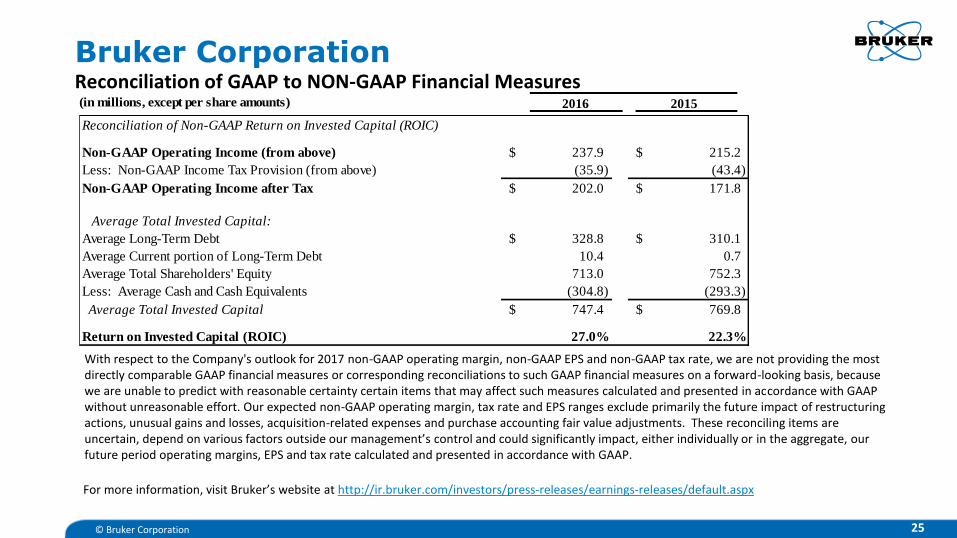
Bruker Corporation Reconciliation of GAAP to NON-GAAP Financial Measures
© Bruker Corporation 25
(in millions, except per share amounts)
For more information, visit Bruker’s website at http://ir.bruker.com/investors/press-releases/earnings-releases/default.aspx
With respect to the Company's outlook for 2017 non-GAAP operating margin, non-GAAP EPS and non-GAAP tax rate, we are not providing the most directly comparable GAAP financial measures or corresponding reconciliations to such GAAP financial measures on a forward-looking basis, because we are unable to predict with reasonable certainty certain items that may affect such measures calculated and presented in accordance with GAAP without unreasonable effort. Our expected non-GAAP operating margin, tax rate and EPS ranges exclude primarily the future impact of restructuring actions, unusual gains and losses, acquisition-related expenses and purchase accounting fair value adjustments. These reconciling items are uncertain, depend on various factors outside our management’s control and could significantly impact, either individually or in the aggregate, our future period operating margins, EPS and tax rate calculated and presented in accordance with GAAP.
2016 2015
Reconciliation of Non-GAAP Return on Invested Capital (ROIC)
Non-GAAP Operating Income (from above) 237.9$ 215.2$
Less: Non-GAAP Income Tax Provision (from above) (35.9) (43.4)
Non-GAAP Operating Income after Tax 202.0$ 171.8$
Average Total Invested Capital:
Average Long-Term Debt 328.8$ 310.1$
Average Current portion of Long-Term Debt 10.4 0.7
Average Total Shareholders' Equity 713.0 752.3
Less: Average Cash and Cash Equivalents (304.8) (293.3)
Average Total Invested Capital 747.4$ 769.8$
Return on Invested Capital (ROIC) 27.0% 22.3%