brtb is a novel o-alkylating enzyme that generates fatty
TRANSCRIPT

doi.org/10.26434/chemrxiv.9205997.v1
BrtB Is a Novel O-Alkylating Enzyme That Generates FattyAcid-Bartoloside EstersJoão P. A. Reis, Sandra A. C. Figueiredo, Pedro Leao
Submitted date: 01/08/2019 • Posted date: 02/08/2019Licence: CC BY-NC-ND 4.0Citation information: Reis, João P. A.; Figueiredo, Sandra A. C.; Leao, Pedro (2019): BrtB Is a NovelO-Alkylating Enzyme That Generates Fatty Acid-Bartoloside Esters. ChemRxiv. Preprint.
Esterification reactions are central to many aspects of industrial and biological chemistry. The formation ofcarboxyesters typically occurs through nucleophilic attack of an alcohol onto the carboxylate carbon. Undercertain conditions employed in organic synthesis, the carboxylate nucleophile can be alkylated to generateesters from alkyl halides, but this reaction has only been observed transiently in enzymatic chemistry. Here,we report a new carboxylate alkylating enzyme – BrtB – that catalyzes O-C bond formation between free fattyacids and the secondary alkyl halide moieties found in the bartolosides. Guided by this novel reactivity, weuncovered a variety of natural fatty acid-bartoloside esters, the likely end-products of bartoloside biosyntheticgene clusters.
File list (2)
download fileview on ChemRxivPreprint_Reis_et_al_2019.pdf (2.43 MiB)
download fileview on ChemRxivPreprint_Reis_et_al_2019_SI.pdf (3.91 MiB)
Reis et al. (2019) - 1 -
BrtB is a novel O-alkylating enzyme that generates fatty acid-bartoloside
esters
João P. A. Reis,1 Sandra A. C. Figueiredo1 and Pedro N. Leão1,* 1Interdisciplinary Centre of Marine and Environmental Research (CIIMAR/CIMAR), University of Porto, Avenida General Norton de Matos, s/n, 4450-208 Matosinhos, Portugal *author to whom correspondence should be addressed; E-Mail: [email protected].
Abstract
Esterification reactions are central to many aspects of industrial and biological chemistry. The formation of carboxyesters
typically occurs through nucleophilic attack of an alcohol onto the carboxylate carbon. Under certain conditions employed in
organic synthesis, the carboxylate nucleophile can be alkylated to generate esters from alkyl halides, but this reaction has only
been observed transiently in enzymatic chemistry. Here, we report a new carboxylate alkylating enzyme – BrtB – that catalyzes
O-C bond formation between free fatty acids and the secondary alkyl halide moieties found in the bartolosides. Guided by this
novel reactivity, we uncovered a variety of natural fatty acid-bartoloside esters, the likely end-products of bartoloside
biosynthetic gene clusters.
Introduction
Esters, in particular carboxyesters, are fundamental to both industrial1 and biological2 chemistry. A number of synthetic methods have been developed to generate carboxyesters, with most exploiting nucleophilic attack of an alcohol onto the carboxylic carbon,3 as typified by the century-old Fisher-Speier esterification.4 Esterification reactions that are independent of alcohols and in which the carboxylate anion acts as nucleophile are also well-known in organic synthesis, in particular with primary alkyl halides as the electrophilic partner.5 In biological chemistry, examples of carboxylates acting as nucleophiles include the activation of amino acids, aryl acids, alpha-keto acids or fatty acids by adenylation.6–9 Still, biological carboxyester formation is known to proceed either through acylation of a suitable alcohol (e.g. lipases and esterases,2 thioesterases6, condensation of α-hydroxy acids in non-ribosomal peptide synthetases7), all of which rely on nucleophilic attack onto an activated acyl carbon, or through direct oxidation by Baeyer-Villiger monooxygenases,10 which also takes advantage of the electrophilicity of a carbonyl group. To our knowledge, nosiheptide biosynthesis is the single example in living organisms in which carboxyester formation (macrolactonization) is proposed to occur via a carboxylate nucleophile, in this case with an exomethylene electrophilic partner, in an intramolecular reaction thought to be catalyzed by the NosN radical S-adenosylmethionine (rSAM)
enzyme (Fig. 1a).11 Nevertheless, during the action of haloalkane dehalogenases and certain haloacid dehalogenases,12 an ester species is formed transiently through attack of an aspartate side-chain carboxylate onto a halogenated position (Fig. 1a).
Recently, Balskus and co-workers unveiled a biological C-alkylation involved in the biosynthesis of cyclophane natural products in cyanobacteria.13 This reaction requires the previous stereoselective chlorination of an unactivated carbon center by the CylC halogenase. To create the final cyclophane dimeric scaffold, an alkylating enzyme (CylK) catalyzes an SN2 C-C bond formation between C-2 of each alkylresorcinol monomer and the halogenated carbon of the other monomer (Fig. 1b).13 A number of cyanobacterial biosynthetic gene clusters (BGCs) were found to feature both CylC and CylK homologs, suggesting that analogous C-C bond formation could be a common feature of secondary metabolite biosynthesis in cyanobacteria.13 One such BGC – brt – encodes the biosynthesis of the bartolosides, a group of chlorinated dialkylresorcinols.14,15 In brt clusters, the homolog of the CylC halogenase (BrtJ) is likely responsible for the mid-chain chlorinations that are present in all bartolosides (Fig. 1c).13–15 However, the role played by the brt-encoded CylK homolog (BrtB) has remained unclear. The reasons for this are twofold: first, the action of a CylK homolog is not necessary to explain the biosynthesis of currently known

Reis et al. (2019) - 2 -
bartolosides;14,15 second, CylK requires a free C-2 resorcinol as a nucleophile,13,16 a position that is unavailable (it is alkylated) in the bartolosides. Overall, these observations suggest that the reported bartolosides might not be the end-products of the brt gene cluster. Here, we show that BrtB is an O-alkylating enzyme that catalyzes the esterification of free (non-activated) fatty acids with the chlorinated positions found in the bartolosides, generating a diversity of fatty acid-bartoloside esters.
Results and discussion
The biosynthesis of the dialkylresorcinol skeleton in the bartolosides involves recruitment of fatty acid derivatives from primary metabolism.14 We envisioned that this could be exploited to incorporate terminal alkyne moieties into the bartolosides and generate click chemistry-accessible versions of these natural products for probing their biological role.e.g. 17 To this end, we supplemented cultures of the bartoloside A (1)-producing
cyanobacterium Synechocystis salina LEGE 06099 with 50 mg L-1 of 5-hexynoic or 6-heptynoic (2) acids. LC-HRESIMS analysis of the resulting cell extracts revealed a massive depletion of the major metabolite 1 and several of its analogues (Fig. 2a, Fig. S1) in supplemented cultures, yet, surprisingly, we did not detect any ions compatible with bartolosides containing terminal alkynes in their dialkylresorcinol skeleton. Instead, we observed a series of m/z values consistent with the incorporation of one or two units of the supplemented fatty acids into the depleted bartolosides and the concomitant loss of one or both Cl atoms, respectively (Fig. 2a, Fig. S2). This was supported by LC-HRESIMS/MS analysis of these species, which showed fragments corresponding to the intact alkyne precursors or to their neutral loss (Fig. S2). To unequivocally establish the identity of the newly observed compounds, we isolated two major metabolites (3 and 4) resulting from the supplementation with 2. Subsequent structure elucidation using 1D and 2D NMR as well as HRESIMS/MS analyses, clarified that 3 and 4 were esters of
b
HO OH
Cl
OHHO
Cl
CylK(C-alkylating)
cylindrocyclophane F
HO OH
OHHO
cylindrocyclophane biosynthesis
R = Cl, bartoloside A (1)R = H, bartoloside G (5)
A B C D E G H I J L
Synechocystis salina LEGE 06099 ~14.5 kb
brt O-alkylation
transport//other
c
DAR formation
glycosyltransferase
halogenase
Cl
R
OH
O
OHO
OH
HO
d
+HO R
O1
fatty acid
fatty acid-bartoloside ester
O
OH
O
OHO
OH
HO
R
O
R
O O
BrtB(O-alkylating)
a
Asp O-
O
R
Cl
O-
O RO-
O
O
O
Asp + OH-
Asp O-
O
R
OH
O-
O
+
L-2-Haloacid dehalogenase
NosN radical SAM
nosiheptide
NH
OSCys
OGlu
O
Glu O-
ONH
OSCys
Glu O-
ONH+
OSCys
SAM SAH
17291
7
12
245
Fig. 1 - Selected O- and C-alkylating enzymes. (a) – NosN, a radical SAM enzyme, generates an exomethylene intermediate that drives intramolecular ester
bond formation (top). Dehalogenation of alkyl halides catalyzed by L-2-haloacid dehalogenases, involves the transient formation of an ester species
resulting from the nucleophilic attack of a side chain carboxylate onto the chlorinated carbon (bottom). (b) In cylindrocyclophane biosynthesis, each
alkylresorcinol moiety is alkylated at the C-2 position by CylK. (c) The brt gene cluster from Synechocystis salina LEGE 06099 encodes the production of a
number of bartolosides, the most abundant of which are bartolosides 1 and 5 (depicted). (d) BrtB catalyzes O-C bond formation between non-activated
fatty acids and bartolosides.

Reis et al. (2019) - 3 -
bartolosides A (1) and G (5), respectively, in which 2 was now esterified to the previously chlorinated positions (Text S1, Fig. S3). Supplementation of S. salina LEGE 06099 with butyric, caprylic, lauric and palmitic acids, as well as with 7-bromoheptanoic acid led to the formation of the corresponding monoesters and diesters (Fig. S4). Overall, our results show that exogenously provided fatty acids are converted in vivo into fatty acid-bartoloside esters by S. salina LEGE 06099.
We set out to investigate whether BrtB, the only enzyme in the brt gene cluster with no ascribed function, could be responsible for ester formation. Following the protocol reported by Schultz et al.,16 we expressed and purified a Strep-Tag©-recombinant version of BrtB (NStrep-BrtB) in Escherichia coli BL21 DE3 Rosetta cells and tested its ability to convert 1 and 2 into 3 in vitro. We found that adding NStrep-BrtB to a reaction mixture composed of 1, 2 and Ca2+-containing buffer13,16 was necessary and sufficient to generate
diester 3 as well as monoester(s) 6a and/or 6b (Fig. 2b, Fig. S5). In line with the in vivo data, we found that BrtB is also able to esterify palmitic acid with 1 and generate bartoloside A palmitate(s) 7a and/or 7b as well as bartoloside A dipalmitate (8) (Fig. 2c, Fig. S6). Thus, we show that BrtB catalyzes an unprecedented C-O bond formation through esterification of a free fatty carboxylate with a secondary alkyl halide.
BrtB is the second enzyme of its family to be characterized, following the C-C bond forming CylK. These enzymes are often annotated in the GenBank as hemolysins, calcium-binding proteins, or beta-propeller proteins and contain a number of NHL repeats.13 Several alginate C5 epimerasese.g. 18 and virginiamycin B lyasee.g. 19 have some structural homology to CylK.20 Remarkably, the reverse reaction of virginiamycin B lyase would involve a carboxylate nucleophile.19 To obtain an overview of the phylogenetic placement of BrtB, how it relates to CylK, and to gain insight into the potential
a
2HO
O
R1
R2
OH
O
OHO
OH
HO
S. salinaLEGE 06099
O
OR1 = R2 = , 3 O
OR1 = , R2 = H, 4
O
OR1 = Cl, R2 = , 6bO
OR1 = , R2 = Cl, 6a
m/z 659.385(1, [M-H]-)
m/z 749.4765(6a/6b, [M-H]-)
EICs (± 5 ppm):
time (min)
m/z 839.5679(3, [M-H]-)
m/z 625.4240(5, [M-H]-)
m/z 715.5154(4, [M-H]-)
0
7.5(×107)
0
7.8(×106)
0
2.0(×106)
0
1.2(×107)
0
5.2(×105)
Z8 medium + 2 (50 mg L-1)
Z8 medium
13 1411 12
abun
danc
e
b
abun
danc
e
m/z 705.3905(1, [M-H+HCOOH]-)
EICs m/z 885.5734(6a/6b, [M-H+HCOOH]-)
EICs m/z 795.4819(3, [M-H+HCOOH]-)
NStrep-BrtB1 + 2 3 + 6a/6b
EICs (± 5 ppm):
+ 1+ NStrep-BrtB
+ 1+ 2
109 11
1
3 6a/6b
time (min)
+ 1+ 2+ NStrep-BrtB
0
2.0
(×108)
0
2.0
0
2.0assay:
palmitic acid
R1
R2
OH
O
OHO
OH
HO
NStrep-BrtB1 + C15H31
O
HO
R1 = , R2 = Cl, 7aO
O
C15H31 R1 = Cl, R2 = , 7bO
O
C15H31 R1 = R2 = , 8O
O
C15H31
c
22 24
8
time (min) time (min)8 10 12 14 16 18 20
17a/7b
m/z 705.3905(1, [M-H+HCOOH]-)
EICs m/z 1145.9177(8, [M-H+HCOOH]-)
EICs m/z 925.6541(7a/7b, [M-H+HCOOH]-)
EICs (± 5 ppm):
(×108)
0
2.00
2.0
0
2.00
5.70
5.7
0
5.7
(×104)
+ 1+ NStrep-BrtB
+ 1+ palmitic acid
+ 1+ palmitic acid+ NStrep-BrtB
assay:
abun
danc
e
bootstrap
1
0 C5 epimerases
VgbA
BGC-associatednot associatedwith BGC
d
BrtB clade
CylK clade
other homologs from cyanobacteria
Fig. 2 – Bartoloside-fatty acid esters are formed in vivo and in vitro by BrtB. In cultures of S. salina LEGE 06099 supplemented with 50 mg L-1 of 6-heptynoic
acid (2), formation of the bartoloside esters 3, 6a/6b and 4 with concomitant depletion of the corresponding bartolosides (A, 1 or G, 5) was observed by
LC-HRESIMS (a). Analysis (LC-HRESIMS) of the NStrep-BrtB-mediated O-alkylation of bartoloside A (1) with 2 to generate diester 3 and monoesters 6a/6b (b) or with palmitic acid to generate monoesters 7a/7b and diester 8, the latter in much lower amount (c). Full reactions contained 1 μM recombinant
NStrep-BrtB, 100 μM of 1 and 200 μM of either 2 (b) or palmitic acid (c). (d) Maximum-likelihood phylogenetic tree of BrtB/CylK homologs, highlighting the
positioning of BrtB (O-alkylating) and CylK (C-alkylating) homologs as well as that of additional cyanobacterial homologs that are within secondary
metabolite BGCs. The virginiamycin liases (VgbA) and C5 epimerases, distantly related to BrtB, were used as outgroups.13

Reis et al. (2019) - 4 -
of this enzyme family to reveal new biochemistry, we conducted a phylogenetic analysis including the closest BrtB/CylK homologs found in GenBank (Fig. 2d, Fig. S7). Two major, well-supported clades of BrtB/CylK homologs were found within the dataset. One is formed mostly by non-cyanobacterial sequences that are not associated with clear-cut BGCs and are not in the vicinity of halogenases. Conversely, the other major clade is dominated by cyanobacterial homologs that are within BGCs. Most of these BrtB/CylK-containing gene clusters also encode halogenases. Within this larger clade, BrtB enzymes form an independent sub-clade, basal to CylK homologs involved in the biosynthesis of different cyclophanes (Fig. 2d, Fig. S7). A large number of additional cyanobacterial CylK/BrtB homologs seem to diverge from cyclophane-associated homologs and are part of BGCs that most prominently encode type I polyketide synthases, fatty acid activating enzymes, non-ribosomal peptide synthetases, along with varied tailoring functionalities (Fig. S7). As such, our phylogenetic analysis and previous observations by Nakamura et al.13 strongly suggest that BGCs harboring CylK/BrtB-like enzymes from cyanobacteria represent opportunities for the discovery of novel enzymatic reactivity and natural product architecture.
Having established that the observed esterification was catalyzed by a brt-encoded enzyme, we hypothesized that fatty acid-bartoloside esters are the actual end-products of the brt cluster, in which case their production by cyanobacterial cells should occur without exogenous fatty acid supply. In fact, the LC-HRESIMS data for non-supplemented controls in our in vivo fatty acid supplementation experiments showed an abundant compound with m/z values and retention time consistent with a bartoloside A monopalmitate (7a/7b, Fig. S4). We thoroughly explored LC-HRESIMS data from a CH2Cl2/MeOH (2:1) cellular extract of a batch culture of S. salina LEGE 06099 and detected species with m/z values and fragmentation patterns corresponding to various mono- and diesters of bartolosides, the most abundant of which likely corresponded to bartoloside A monopalmitate(s) 7a and/or 7b (Fig. 3a), while a peak consistent with bartoloside A dipalmitate (8) was also detected but less abundant (Fig 3a). We isolated the major bartoloside ester 7a, and confirmed its structure through HRESIMS/MS and 1D and 2D NMR analyses (Fig. 3b, Text S1, Fig. S8). We further inspected the LC-HRESIMS data for esters of bartolosides 1 and 5 with fatty acids known to occur in cyanobacterial cells.21 This revealed 20 additional bartoloside esters, of varying chain length and saturation, as confirmed by HRESIMS/MS analysis (Figs. S9 and S10). In all probability, additional esters are produced through the action of BrtB on the minor bartolosides E, F and H-K produced by S. salina LEGE 06099,15 but their detection and structural assignment is hampered by their low abundance and similar m/z values or retention times to more abundant bartoloside esters. Our findings reveal that the brt gene cluster generates a large diversity of natural products, not only through the incorporation of fatty acid derivatives of different chain length during dialkylresorcinol formation and different halogenation patterns,14,15 but also through the relaxed specificity of BrtB, which is able to alkylate a variety of endogenous fatty acids.
To conclude, we serendipitously discovered an unprecedented carboxylate alkylation reaction catalyzed by BrtB, a member of a poorly studied group of beta-propeller enzymes. Our work brings to light a new example, in biological chemistry, of halogenation as an intermediate step towards a non-halogenated end-product.22 Cyanobacterial secondary metabolism seems to be particularly rich
in such functionalization strategies (e.g. cyclophanes, curacins)13,23 and the co-localization of halogenases and BrtB/CylK homologs in a variety of cyanobacterial BGCs suggests that more are to be discovered. At this stage, we can only speculate about the stereoselectivity of BrtB, but it is highly likely that this reaction proceeds through an SN2 mechanism, akin to the reactions catalyzed
abun
danc
e
4 6 18108 12 14 16
0
38
(×107)
0
7.70
0.6
EIC m/z 705.3905 ± 5 ppm(1, [M-H+HCOOH]-)
EIC m/z 1145.9177 ± 5 ppm(8, [M-H+HCOOH]-)
EIC m/z 925.6541 ± 5 ppm(7a/7b, [M-H+HCOOH]-)
time (min)
a
1+C
16:0
(7a/
7b)
5+C
16:0
1+C
18:1
5+C
18:1
1+C
18:0
5+C
18:0
1+C
18:2
1+C
18:3
1+C
16:1
1+2×
C16
:0 (8
)
1+ac
etat
e
5+C
16:1
5+C
18:3
5+C
18:2
5 +
acet
ate
1+C
10:0
1+C
12:0
1+C
14:0
1+2×
acet
ate
1+C
8:0
Are
a(E
IC, [
M-H
+HC
OO
H]- )
d(×109)
1.0
0.5
0.0
c
O
O
OH
O
OHO
OH
HO
Cl
COSYHMBC
×3
200 250 300
MS/MS, HCD, 55 eV
O
Cl
OH
O
OHO
OH
HO
O
C15H31
A
B
C
-H-b
-H-
OH
OH
HO
HI
ED
F
G
F
G
F
G I
HD
E
m/z
247.
2071
1
319.
2283
3
289.
2177
2
205.
1591
8
191.
1072
5
225.
1858
4
301.
2173
730
7.22
813
7aA+B+C(in source)
Fig. 3 – Fatty acid-bartoloside esters are natural products. (a) Esters of
bartoloside A (1) with palmitic acid are found in an organic extract of S.
salina LEGE 06099, as confirmed by LC-HRESIMS/MS analysis (b) and key
HMBC and COSY correlations (c) obtained from 1D and 2D NMR analysis of
bartoloside A palmitate 7a purified from S. salina LEGE 06099 cells. (d)
Bartoloside esters found in S. salina LEGE 06099 cells and their relative
abundance, as determined by LC-HRESIMS and confirmed by HRESIMS/MS
analysis.

Reis et al. (2019) - 5 -
by CylK and haloalkane dehalogenases.12,13 The reactivity of BrtB might prove a useful alternative for ester biocatalysis, owing to the ubiquity of esters in industrial and pharmaceutical chemicals, the large number of alkyl halide building blocks available and the existing precedent of using biocatalysts to generate esters at the industrial scale.24 Our discovery of a new C-O bond forming reaction paved the way for identifying a series of new natural products, the bartoloside esters, which are, in all likelihood, the end-products of the brt biosynthetic gene cluster. The structures of bartoloside esters, with as many as 50 aliphatic methylenes, are reminiscent of certain bacterial long-chain membrane lipids (e.g. mycolic acids, heterocyst glycolipids).25,26 Considering also the relatively high cellular abundance of bartolosides,15 a structural role for these metabolites is likely. However, in light of the marked depletion of bartolosides in the presence of exogenously supplied free fatty acids, it is tempting to consider that bartoloside esters might represent a fatty acid storage or scavenging mechanism.
Methods
General Experimental Procedures Fatty acids used in feeding were obtained from Fluorochem (7-bromoheptanoic, 6-heptynoic and 5-hexynoic acids), Acros Organics (palmitic acid), Alfa Aesar (caprylic and butyric acids), Thermo Fisher Scientific (lauric acid). LC-MS solvents were obtained from Thermo Fisher Scientific, Fluka and Carlo Erba. All solvents were ACS grade, except for HPLC solvents (HPLC gradient grade) and LC-MS solvents (MS-grade). Deuterated solvents for NMR were acquired from Cambridge Isotope Laboratories or Alfa-Aesar.
Luria-Bertani Lennox (LB) medium was purchased from Thermo Fisher Scientific and IPTG from NZYTech. Oligonucleotides were synthesized by StabVida. PCR reactions were carried in Veriti 96-well thermal cycler (Applied Biosystems). DNA polymerases, restriction enzymes and T4 DNA ligase were purchased from Thermo Fisher Scientific. Gel extractions of DNA fragments and restriction reactions clean ups were performed using Illustra GFX PCR DNA and Gel Band Purification kit (GE Healthcare). Plasmid purifications were performed using NZYMiniprep (NZYTech). DNA sequencing was performed by Eurofins Scientific. The Strep-Tag II kit was obtained from Novagen.
LC-HRESIMS and LC-HRESIMS/MS (HCD, Higher energy collisional dissociation) analyses were performed on an UltiMate 3000 UHPLC (Thermo Fisher Scientific) system composed of a LPG-3400SD pump, WPS-3000SL autosampler and VWD-3100 UV/VIS detector coupled to a Q Exactive Focus Hybrid Quadrupole-Orbitrap Mass Spectrometer controlled by Q Exactive Focus Tune 2.9 and Xcalibur 4.1 (Thermo Fisher Scientific). LC-HRESIMS data was obtained in Full Scan mode, with a capillary voltage of HESI set to -3.8 kV and the capillary temperature to 300 ºC. Sheath gas flow rate was set to 35 units.
One- and two-dimensional NMR spectra were obtained on a Bruker Avance III, 400 MHz, in the Materials Center of the University of Porto (CEMUP). Chemical shifts are reported in parts per million (ppm) and using the residual solvent resonances as reference for 1H (CDCl3, H= 7.26 ppm) and 13C (CDCl3, C= 77.16 ppm).
DNA and protein concentrations were determined using a DS-11 FX Spectrophotometer/Fluorometer (DeNovix). Optical densities (600
nm) of E. coli cultures were determined by using a Ultrospec 10 Spectrophotometer (GE Healthcare).
Plasmids, Strains and culture conditions pET-51b was acquired from Novagen. Escherichia coli TOP10 (Life Technologies) was used for cloning and E. coli BL21 DE3 Rosetta (Novagen) was used for recombinant protein expression.
The cyanobacterium Synechocystis salina LEGE 06099 was obtained from the LEGEcc.27 Cultures were grown in Z8 medium supplemented with 25 g L-1 sea salt (Tropic Marin), at 25 ºC, under a 14:10 h light/dark cycle and constant aeration.15 For the feeding studies with 5-hexynoic and 6-heptynoic acids, small-scale cultures were inoculated to a final OD750nm of 0.04 ~0.1 while large scale cultures (20 L) were inoculated using 1.5 L of stationary phase cultures. Feeding experiments with other fatty acids used a 3:50 inoculum of stationary phase cultures.
Feeding experiments Supplementation of S. salina LEGE 06099 cultures (in Z8 medium, see above) with 5-hexynoic acid or 6-heptynoic acid was performed using a final concentration of 50 mg L-1 from a 1000´ concentrated solution of each acid in DMSO. The experiments were carried out in 100 mL cultures in Erlenmeyer flasks and cells were harvested after 30 days by centrifugation at 4500 ´g, 10 min, 4 °C, rinsed with deionized H2O and centrifuged again. The resulting biomass pellets were lyophilized prior to extraction with CH2Cl2/MeOH (2:1, v/v) at room temperature.15 Crude extracts were analyzed by LC-HRESIMS and LC-HRESIMS/MS.
A similar procedure was used for supplementation with 7-bromoheptanoic, caprylic, butyric, lauric and palmitic acids, but a final concentration of each substrate of 0.4 mM was used. Cells were harvested after three days of exposure, and were extracted with CH2Cl2/MeOH (2:1, v/v) at room temperature, without prior lyophilization. The resulting crude extracts were analyzed by LC-HRESIMS.
In order to obtain sufficient biomass to isolate bartoloside esters formed upon supplementation, a 20 L culture of S. salina LEGE 06099 was prepared in Z8 medium supplemented with 6-heptynoic acid (50 mg L-1), as described above. After a 45 days growth period, the biomass was harvested by centrifugation (4500 ´g, 10 min, 4 °C), washed with deionized water and centrifuged again. The corresponding pellet was freeze-dried and stored at -20 °C until further use.
LC-HRESIMS analysis For LC-HRESIMS analyses, separation was performed in a Luna C18 column (100 ´ 3 mm, 3 µm, 100 Å, Phenomenex). Mixtures of MeOH/H2O 1:1 (v/v) with 0.1% formic acid (eluent A) and IPA with 0.1% formic acid (eluent B) were used as mobile phase, with a flow rate of 0.4 mL min-1. Depending on the sample to be analyzed, different elution programs and injection volumes/concentrations were used, as detailed below.
Crude extracts and flash chromatography fractions obtained from the initial feeding experiments were separated (10 µL of a 1 mg mL-1 solution were injected) using a gradient from 9:1 to 3:7 eluent A/eluent B in 10 min and held for 7 min before returning to the initial conditions.
Crude extracts obtained from feeding with 7-bromoheptanoic, caprylic, butyric, lauric and palmitic acids were separated using a
Reis et al. (2019) - 6 -
gradient from 9:1 to 3:7 eluent A/eluent B in 10 min and held for 12 min before returning to the initial conditions.
Crude extracts of biomass from cultures that were not supplemented with fatty acids were analyzed by LC-HRESIMS using a gradient from at 9:1 to 1:4 eluent A/eluent B in 3 min and held for 28 min before returning to initial conditions. Fractions obtained from semipreparative HPLC during purification of natural bartoloside esters were analyzed (10 µL at 1 mg mL-1 per injection) using a similar program, but with an isocratic step of only 24 min. Semipreparative HPLC subfractions that were analyzed by LC-HRESIMS/MS were separated (10 µL at 0.5 mg mL-1 injected) using a gradient from 9:1 to 7:13 eluent A/eluent B in 5 min, increasing to 3:7 eluent A/eluent B over 15 min and holding the isocratic for additional 5 min before returning to initial conditions.
Analysis of enzymatic reaction samples was carried out by injecting 10 µL of supernatant from the methanol/acetonitrile-quenched reaction mixture (see Enzymatic assays). Separation involved an isocratic step of 9:1 eluent A/eluent B over 2 min, followed by a linear gradient to 7:13 eluent A/eluent B over 3 min and held for 10 min before returning to the initial conditions.
MS/MS analysis MS/MS parameters for the LC-HRESIMS/MS analysis of crude extracts, HPLC fractions and enzymatic assays were: resolution of 35000, with a 1 m/z isolation window, a loop count of 3, AGC target of 5´104 and collision energy of 35 eV.
HRESIMS/MS analysis of purified compounds 3 and 4 was performed by direct injection (0.1 mg mL-1 solutions) into the spectrometer, using a resolution of 35000, a 1 m/z isolation window, a loop count of 3 and an AGC target of 5 ´ 104. Stepped collision energies of 35, 40 and 45 eV were applied. To obtain structural information regarding the dialkylresorcinol moiety, isolation of in-source-formed species were selected for ddMS2 events15. For purified compounds 3 and 4, the in-source collision induced dissociation (CID) energy was set to 90 and 65 eV, respectively (to isolate species corresponding to loss of xylosyl, one C7H9O and C7H9O2 for 3 as well as loss of xylosyl and C7H9O for 4), resolution of 35000, with 1 m/z isolation window, loop count of 1 and AGC target of 5 ´ 104. CID energy was set to 55 eV. For purified compound 7a the in-source collision energy was set to 90 eV (to isolate a species corresponding to the loss of xylosyl and HCl).
Isolation of bartoloside esters 3 and 4 The freeze-dried biomass (5.6 g, d.w.) from a 20 L culture of S. salina LEGE 06099 in Z8 medium supplemented with 6-heptynoic acid (details in Feeding Experiments section) was extracted by repeated percolation using a mixture of CH2Cl2/MeOH (2:1, v/v) at room temperature. The resulting crude extract (754.6 mg) was fractionated by normal phase flash chromatography (Si gel 60, 0.040-0.063 mm, Macherey Nagel) using a gradient of increasing polarity gradient from hexane to EtOAc to MeOH, yielding eight fractions (1-8). Fraction 5 (102.2 mg), eluting with a 2:3 mixture of EtOAc/hexane was further separated by RP-semipreparative HPLC with a ACE C18 column (100 Å pore size, 250 ´ 10 mm, 5 µm) (ACE). Mobile phase A was ddH2O and mobile phase B was MeCN (aq). The LC method used a constant flow rate of 3 mL min-1 with an isocratic step 8% A, 92% B over 25 min followed by a gradient to 100% B over 2 min and held for 15 minutes before returning to the initial conditions. This procedure afforded 10 subfractions. Fractions 5.6 (compound 3, 48.0 mg, tR = 13.5 -15.0 min) and 5.10
(compound 4, 4.3 mg, tR = 24.0 – 25.0 min) were spectroscopically pure (>95%, 1H NMR), showing signals characteristic of bartolosides.15
bartoloside A-17,29-diyl bis(hept-6-ynoate) (3) (orange oil): [α] 25D
-5.0 (c 0.60, MeOH); IR (thin film) υmax 3398, 3308, 2923, 2857, 1726, 1703, 1590, 1428, 1052, 1033, 1017, 627 cm-1; UV (MeOH) λmax (log ε) 217 (3.2), 221 (3.2), 273 (3.0); 1H and 13C NMR data, Table S1; HRESIMS m/z 839.5676 [M-H]- (calcd for C50H79O10, 839.5679).
bartoloside G-17-yl hept-6-ynoate (4) (light orange oil): [α] 25D -4.6
(c 0.65, MeOH); IR (thin film) υmax 3410, 3313, 2923, 2855, 1731, 1704, 1590, 1428, 1054, 1033, 1014, 627 cm-1; UV (MeOH) λmax (log ε) 216 (3.1), 221 (3.1), 273 (2.8); 1H and 13C NMR data, Table S2; HRESIMS m/z 715.5153 [M-H]- (calcd for C43H71O8, 715.5154).
Isolation of bartoloside A-17-yl palmitate (7a) Freeze-dried biomass (5.3 g, d.w.) from a 30-day old, 20 L culture of S. salina LEGE 06099 in Z8 medium that was not supplemented with any fatty acid (instead, 0.5% DMSO was added) was extracted as detailed above for the isolation of compounds 3 and 4. The resulting organic extract (574.3 mg) was fractionated by normal phase flash chromatography (Si gel 60, 0.040-0.063 mm, Macherey-Nagel). An increasing polarity gradient from hexane to EtOAc to MeOH was used for elution. The collected fractions were pooled according to their TLC profiles, affording 23 sub-fractions (1-23). Sub-fraction 15, eluting with 2:3 and 1:1 EtOAc/hexane, contained m/z 879.648 (7a/7b, [M-H]-), as verified by LC-HRESIMS analysis, and was further fractionated by RP-semipreparative HPLC (ACE C18, 250 ´ 10 mm, 5 µm, , 100 Å, ACE), using 98% MeOH (aq) isocratically over 65 minutes and with a flow rate of 3 mL min-1. 1H NMR analysis showed that a minor bartoloside co-eluted (likely compound 7b), and thus further separation was necessary. Fraction 15.7 (tR
= 32.1 – 34.5 min) was reinjected into the RP-semipreparative system using the above-mentioned column and further separated with 98% MeCN (aq) to yield metabolite 7a (3.1 mg, tR
~122 min). 1H NMR analysis indicated that the compound was pure (>95%) and showed characteristic resonances for bartolosides.15
bartoloside A-17-yl palmitate (7a) (white glassy solid): [α] 25D -9.2
(c 0.42, MeOH); IR (thin film) υmax 3417, 2923, 2854, 2360, 2340, 1730, 1704, 1592, 1463, 1455, 1430, 1159, 1048, 1033 cm-1; UV (MeOH) λmax (log ε) 217 (3.3), 222 (3.3), 273 (2.9); 1H and 13C NMR data, Table S3; HRESIMS m/z 879.6499 [M-H]- (calcd for C50H92O8, 879.6486).
Cloning, expression and purification of NStrep-BrtB Genomic DNA from S. salina LEGE 06099 was extracted using the PureLink™ Genomic DNA Mini Kit (Invitrogen) and was used for the PCR amplification of brtB using primers BrtB-NStrep-SalI-F (5´ AATGTCGACATGGCCAATCCCTTCG 3´, forward) and BrtB-NStrep-SacI-R (5´ ATATGAGCTCCTAGTAGCCGTACCCG 3´, reverse), which contained restriction sites for SalI and SacI, respectively (underlined in the sequences). The reaction was prepared in a volume of 20 µL, containing 1´ Phusion HF Buffer, 400 µM dNTPs, 0.5 µM of each primer, 0.4U Phusion polymerase (Thermo Scientific) and 2 µL of template gDNA. The PCR cycling program consisted in a two-step protocol with extension at 72 oC for 1.5 min. PCR products were gel purified, restriction digested using SalI and SacI (Thermo Scientific) for 1.5 h at 37 oC and gel purified again. Digests were ligated into linearized StrepTag-containing

Reis et al. (2019) - 7 -
pET-51b (+), using T4 DNA Ligase at 16 oC overnight. This affinity tag was chosen because functional, StrepTag-fused CylK had been successfully purified by Balskus and co-workers.13,16 Competent E. coli TOP10 cells were transformed with a 5 µL ligation sample by incubating the mixture on ice for 30 min, heat shocking at 42 oC for 45 s and recovering on ice for 2 min. Then, 250 µL of warm S.O.C. medium was added, the mixture was incubated at 37 oC for 1 h and 100 µL of cells was plated on LB agar supplemented with 100 µg mL-1 ampicillin. The plate was incubated overnight at 37 oC. Individual colonies were inoculated into 5 mL of LB supplemented with 100 µg mL-1 ampicillin and grown overnight at 37 oC with 175 rpm shaking. The purified plasmids were sequenced to verify construct identity and amplification fidelity. pET-51b-NStrep-brtB was transformed into chemically competent E. coli BL21 Rosetta (DE3) by incubating the plasmid and cells on ice for 5 min, applying a heat-shock at 42 oC for 45 s and recovering for 2 min on ice. Then, 80 µL of warm S.O.C. medium was added, the mixture was incubated at 37 oC for 1 h and 70 µL of cells was plated on LB agar supplemented with 100 µg mL-1 ampicillin and 34 µg mL-1 chloramphenicol. Individual colonies were inoculated into 5 mL of LB supplemented with 100 µg mL-1 ampicillin and 34 µg mL-1 chloramphenicol and grown overnight at 37 oC with 175 rpm shaking. The resulting transformants were frozen in LB/glycerol 1:1 (v/v) stocks and stored at -80 oC.
A glycerol stock of E. coli BL21 Rosetta (DE3) harboring the pET-51b-NStrep-brtB plasmid was used to prepare a 50 mL starter culture in LB medium supplemented with 100 µg mL-1 ampicillin and 34 µg mL-1 chloramphenicol. The starter culture was incubated overnight at 37 oC with 175 rpm shaking. The overnight culture was used to inoculate (1:100 dilution) 2 L of LB medium supplemented with 100 µg mL-1 ampicillin and 34 µg mL-1 chloramphenicol. The culture was incubated at 37 ºC with 190 rpm shaking. At OD600 = 0.4-0.5 the culture was transferred to 15 oC and orbital shaking decreased to 175 rpm. Once the culture reached OD600 = 0.8-0.9, protein expression was induced with 500 µM IPTG and the culture supplemented with 5 mM CaCl2.16 After four additional hours of incubation at 15 ºC with 175 rpm shaking, the cells were harvested by centrifugation (3000 ´g, 10 min, 4 oC), washed with Phosphate-buffered saline (PBS) and re-centrifuged. The pellet was flash frozen in liquid nitrogen and stored at -80 oC until it was resuspended in lysis buffer (50 mM Tris-HCl, 500 mM NaCl, 20 mM CaCl2, 10 mM MgCl2, 1 mM EDTA, pH 8.0) to which Pierce Protease Inhibitor Mini Tablets EDTA-free were added according to the manufacturer’s instructions (Thermo Scientific). The cells were lysed in a cell disruptor (CF Range, Constant Sytems Ltd) by a single cycle at 20000 psi and the lysate was clarified by centrifugation (19500 ´g, 30 min, 4 oC). A pre-packed 1 mL StrepTactin Superflow column (Novagen) was equilibrated with 2 mL of lysis buffer at 4 oC for 45 min and the clarified lysate was transferred to the column, discarding the flow-through. The column was washed with 5 mL lysis buffer and the protein was eluted in multiple 500 µL fractions using elution buffer (100 mM Tris-HCl, 500 mM NaCl, 20 mM CaCl2, 10 mM MgCl2, 1 mM EDTA, 2.5 mM desthiobiotin, pH 8.0). The collected fractions were analyzed by SDS-PAGE (4-20% Mini-PROTEAN TGX precast gel, BIO-RAD). Fractions containing the desired protein (~91.4 kDa) were pooled and desalted using PD-10 desalting columns (GE Healthcare). The columns were equilibrated with storage buffer (50 mM Tris-HCl, 50 mM NaCl, 10 mM MgCl2, 10 mM CaCl2 and 10% glycerol, pH 8.0) and the protein sample was loaded into the columns (up to 2.5 mL per column) and eluted with
3.5 mL storage buffer. The sample was concentrated to 34.6 µM using Pierce™ Protein Concentrator tubes, 10K MWCO (Thermo Scientific) through two consecutive 15 min centrifugations (8000 ´g, 4 oC). The concentrated protein was frozen in liquid nitrogen as pellets and stored at –80 oC. This procedure yielded 0.3 mg of NStrep-BrtB per L of E. coli culture (Fig. S11).
Enzymatic assays In vitro enzymatic assays were carried out in Eppendorf tubes to a final volume of 100 µL in reaction buffer (50 mM Tris-HCl, 50 mM NaCl, 10 mM MgCl2, 5 mM CaCl2, pH = 8.0). Final concentrations of each substrate were 1 µM for NStrep-BrtB, 100 µM for bartoloside A (1) and 200 µM for both 6-heptynoic (2) and palmitic acids and the reactions were incubated at 37 °C with 180 rpm shaking. Aliquots (30 µL) were collected at 0, 6 and 24h and quenched with 60 µL of a cold mixture of MeOH/MeCN (1:1, v/v), vortexed immediately and incubated in ice for 10 min. Quenched reactions were then centrifuged at 17 000 ´g, 4 °C) and analyzed by LC-HRESIMS/MS.
Phylogenetic analysis Amino acid sequences of the BrtB homologs with lowest e-value (BlastP) were retrieved from the NCBI database (232 homologs retrieved). Their amino acidic sequences were aligned, together with those of a set of the distantly related virginiamycin lyases and alginate C5-epimerases and with the sequence of BrtB, using MUSCLE, from within Geneious R11 (Biomatters). The resulting alignment (with a total of 239 sequences) was trimmed to its core region and contained 1558 positions. FastTree 2.1.528 (from within Geneious R11) was used to compute an approximately-maximum-likelihood phylogenetic tree, using pseudocounts and 1000 rate categories of sites.
Acknowledgments
The authors acknowledge funding by the European Research Council, through a Starting Grant (Grant Agreement 759840) to PNL, and by Fundação para a Ciência e Tecnologia (FCT) through project PTDC/BIA-BQM/29710/2017 and grant IF/01358/2014 to PNL. The work was also partially supported by Strategic Funding UID/Multi/04423/2013 by FCT and the European Regional Development Fund, as part of the program PT2020. We thank Emily Balskus (Department of Chemistry and Chemical Biology, Harvard University, Cambridge, MA, USA) for helpful discussions.
Author contributions
JPAR and PNL conceived the project, JPAR and SACF performed experimental work, JPAR and PNL wrote the manuscript with input from SACF.
References 1. Riemenschneider, W. & Bolt, H. M. Esters, Organic. in Ullmann’s
Encyclopedia of Industrial Chemistry (American Cancer Society, 2005). doi:10.1002/14356007.a09_565.pub2
2. Lortie, R. Esterification - Biological. in Encyclopedia of Catalysis (American Cancer Society, 2010). doi:10.1002/0471227617.eoc088
3. Otera, J. & Nishikido, J. Esterification: Methods, Reactions, and Applications. (Wiley, 2009). doi:10.1002/9783527627622
4. Fischer, E. & Speier, A. Darstellung der Ester. Berichte der deutschen chemischen Gesellschaft 28, 3252–3258 (1895).

Reis et al. (2019) - 8 -
5. Conversion of Carboxylic Acids into Esters without Use of Alcohols. in Esterification 173–192 (John Wiley & Sons, Ltd, 2010). doi:10.1002/9783527627622.ch3
6. Fischbach, M. A. & Walsh, C. T. Assembly-line enzymology for polyketide and nonribosomal peptide antibiotics: Logic, machinery, and mechanisms. Chem. Rev. 106, 3468–3496 (2006).
7. Magarvey, N. A., Ehling-Schulz, M. & Walsh, C. T. Characterization of the Cereulide NRPS α-Hydroxy Acid Specifying Modules: Activation of α-Keto Acids and Chiral Reduction on the Assembly Line. J. Am. Chem. Soc. 128, 10698–10699 (2006).
8. Hisanaga, Y. et al. Structural Basis of the Substrate-specific Two-step Catalysis of Long Chain Fatty Acyl-CoA Synthetase Dimer. J. Biol. Chem. 279, 31717–31726 (2004).
9. Arora, P. et al. Mechanistic and functional insights into fatty acid activation in Mycobacterium tuberculosis. Nat. Chem. Biol. 5, 166–173 (2009).
10. Leisch, H., Morley, K. & Lau, P. C. K. Baeyer−Villiger Monooxygenases: More Than Just Green Chemistry. Chem. Rev. 111, 4165–4222 (2011).
11. LaMattina, J. W. et al. NosN, a Radical S-Adenosylmethionine Methylase, Catalyzes Both C1 Transfer and Formation of the Ester Linkage of the Side-Ring System during the Biosynthesis of Nosiheptide. J. Am. Chem. Soc. 139, 17438–17445 (2017).
12. O’Hagan, D. & Schmidberger, J. W. Enzymes that catalyse SN2 reaction mechanisms. Nat. Prod. Rep. 27, 900–918 (2010).
13. Nakamura, H., Schultz, E. E. & Balskus, E. P. A new strategy for aromatic ring alkylation in cylindrocyclophane biosynthesis. Nat. Chem. Biol. 13, 916–921 (2017).
14. Leão, P. N. et al. Biosynthesis-Assisted Structural Elucidation of the Bartolosides, Chlorinated Aromatic Glycolipids from Cyanobacteria. Angew. Chem. Int. Ed. 54, 11063–11067 (2015).
15. Afonso, T. B. et al. Bartolosides E–K from a Marine Coccoid Cyanobacterium. J. Nat. Prod. 79, 2504–2513 (2016).
16. Schultz, E. E., Braffman, N. R., Luescher, M. U., Hager, H. H. & Balskus, E. P. Biocatalytic Friedel–Crafts Alkylation Using a
Promiscuous Biosynthetic Enzyme. Angew. Chem. Int. Ed. 58, 3151–3155 (2019).
17. Luo, X. et al. Complete biosynthesis of cannabinoids and their unnatural analogues in yeast. Nature 567, 123 (2019).
18. Buchinger, E. et al. Structural and Functional Characterization of the R-modules in Alginate C-5 Epimerases AlgE4 and AlgE6 from Azotobacter vinelandii. J. Biol. Chem. 289, 31382–31396 (2014).
19. Lipka, M., Filipek, R. & Bochtler, M. Crystal Structure and Mechanism of the Staphylococcus cohnii Virginiamycin B Lyase (Vgb). Biochemistry 47, 4257–4265 (2008).
20. Nakamura, H. Discovery and Characterization of the Cylindrocyclophane Biosynthetic Pathway. (Harvard University, 2016).
21. Los, D. A. & Mironov, K. S. Modes of Fatty Acid Desaturation in Cyanobacteria: An Update. Life 5, 554–567 (2015).
22. Agarwal, V. et al. Enzymatic Halogenation and Dehalogenation Reactions: Pervasive and Mechanistically Diverse. Chem. Rev. 117, 5619–5674 (2017).
23. Gu, L. et al. Metamorphic enzyme assembly in polyketide diversification. Nature 459, 731–735 (2009).
24. Ansorge-Schumacher, M. B. & Thum, O. Immobilised lipases in the cosmetics industry. Chem. Soc. Rev. 42, 6475–6490 (2013).
25. Marrakchi, H., Lanéelle, M.-A. & Daffé, M. Mycolic Acids: Structures, Biosynthesis, and Beyond. Chem. Biol. 21, 67–85 (2014).
26. Bauersachs, T. et al. Distribution of heterocyst glycolipids in cyanobacteria. Phytochemistry 70, 2034–2039 (2009).
27. Ramos, V. et al. Cyanobacterial diversity held in microbial biological resource centers as a biotechnological asset: the case study of the newly established LEGE culture collection. J. Appl. Phycol. 30, 1437–1451 (2018).
28. Price, M. N., Dehal, P. S. & Arkin, A. P. FastTree 2 – Approximately Maximum-Likelihood Trees for Large Alignments. PLOS ONE 5, e9490 (2010).

download fileview on ChemRxivPreprint_Reis_et_al_2019.pdf (2.43 MiB)

SI-1
Supplementary information
BrtB is a novel O-alkylating enzyme that generates fatty acid-bartoloside
esters
João P. A. Reis,1 Sandra A. C. Figueiredo1 and Pedro N. Leão1,*
1Interdisciplinary Centre of Marine and Environmental Research (CIIMAR/CIMAR), University of Porto, Avenida General Norton de Matos, s/n, 4450-208 Matosinhos, Portugal. *Author to whom correspondence should be addressed; E-Mail: [email protected].

SI-2
Contents
page Figure S1 – Depletion of bartolosides in Synechocystis salina LEGE 06099 cells supplemented with fatty acids.
SI-3
Figure S2 – Formation of bartoloside esters upon supplementation of S. salina LEGE 06099 with (a) 5-hexynoic and (b) 6-heptynoic (2) acids.
SI-4
Text S1 – Structural elucidation of esterified bartolosides 3, 4 and 7a. SI-5 Figure S3 – Structural elucidation of 3 and 4. SI-8 Figure S4 – Bartoloside esters are formed in S. salina LEGE 06099 cells upon supplementation with fatty acids of different lengths and with the halogenated fatty acid 7-bromoheptanoate.
SI-9
Figure S5 – BrtB converts bartoloside A (1) and 6-heptynoic acid (2) into bartoloside esters in vitro. SI-10 Figure S6 – BrtB converts bartoloside A (1) and palmitic acid into bartoloside esters in vitro. SI-11 Figure S7 – Phylogeny of BrtB homologs and diversity of their associated biosynthetic gene clusters. SI-12 Figure S8 – 1H NMR-based assignment of which alkyl chain in 7a is esterified with palmitic acid. SI-13 Figure S9 – Detection and HRESIMS/MS based structural assignment of natural fatty acid bartoloside monoesters produced by S. salina LEGE 06099.
SI-14
Figure S10 – Detection and HRESIMS/MS based structural assignment of natural fatty acid bartoloside esters produced by S. salina LEGE 06099.
SI-15
Text S2 – Protein and DNA sequences. S-16
Figure S11 – SDS-PAGE analysis of the Strep-NBrtB protein preparation, following purification and concentration.
S-17
NMR spectroscopy data
Table S1 – NMR Spectroscopic Data (1H 400 MHz, 13C 100 MHz, CDCl3) for bartoloside A-17,29-diyl bis(hept-6-ynoate) (3).
SI-18
Figure S12 – 1H NMR (CDCl3, 400 MHz) spectrum of compound 3. SI-19 Figure S13 – 13C NMR (CDCl3, 100 MHz) spectrum of compound 3. SI-20 Figure S14 –HSQC (CDCl3, 400 MHz) spectrum of compound 3. SI-21 Figure S15 –HMBC (CDCl3, 400 MHz) spectrum of compound 3. SI-22 Figure S16 –COSY (CDCl3, 400 MHz) spectrum of compound 3. SI-23 Table S2 – NMR Spectroscopic Data (1H 400 MHz, 13C 100 MHz, CDCl3) for bartoloside G-17-yl hept-6-ynoate (4).
SI-24
Figure S17 – 1H NMR (CDCl3, 400 MHz) spectrum of compound 4. SI-25 Figure S18 – 13C NMR (APT, CDCl3, 100 MHz) spectrum of compound 4. SI-26 Figure S19 – HSQC (CDCl3, 400 MHz) spectrum of compound 4. SI-27 Figure S20 – HMBC (CDCl3, 400 MHz) spectrum of compound 4. SI-28 Figure S21 – COSY (CDCl3, 400 MHz) spectrum of compound 4. SI-29 Table S3 – NMR Spectroscopic Data (1H 400 MHz, 13C 100 MHz, CDCl3) for bartoloside A-17-yl palmitate (7a).
SI-30
Figure S22 – 1H NMR (CDCl3, 400 MHz) spectrum of compound 7a. SI-31 Figure S23 – 13C NMR (APT, CDCl3, 100 MHz) spectrum of compound 7a. SI-32 Figure S24 – HSQC (CDCl3, 400 MHz) spectrum of compound 7a. SI-33 Figure S25 – HMBC (CDCl3, 400 MHz) spectrum of compound 7a. SI-34 Figure S26 – COSY (CDCl3, 400 MHz) spectrum of compound 7a. SI-35

SI-3
Fig. S1 – Depletion of bartolosides in Synechocystis salina LEGE 06099 cells supplemented with fatty acids. LC-HRESIMS analysis of crude extracts from S. salina LEGE 06099 cells shows that supplementation of cultures of this cyanobacterium with 5-hexynoic (a) or 6-heptynoic (2) (b) acids, at 50 mg L-1, leads to cellular depletion of bartolosides.
Z8 mediumZ8 medium + 2 (50 mg L-1)
Z8 mediumZ8 medium + 5 hexynoic acid (50 mg L-1)
-
-
-
-
-
-
-
-
10 12 14 16Time (min)
7.5×10⁷
0
0
0
0
0
0
0
0
EICs (± 5 ppm)
m/z 687.4164bartoloside H [M-H]
m/z 673.4007bartoloside F [M-H]
m/z 645.3694bartoloside K [M-H]
m/z 659.3851bartoloside A [1, M-H]
m/z 625.4240bartoloside G [5, M-H]
m/z 597.3927bartoloside J [M-H]
m/z 631.3538bartoloside E [M-H]
m/z 693.3461bartoloside I [M-H]
6.6×10⁶
2.0×10⁶
1.2×10⁷
7.6×10⁶
8.7×10⁵
3.5×10⁶
1.2×10⁶
a b
1 2 3 4 5 6 7 8 910 12 14 16 17 18 19
Time (min)
0
0
0
0
0
0
0
0
EICs (± 5 ppm)
m/z 687.4164bartoloside H [M-H]-
m/z 673.4007bartoloside F [M-H]-
m/z 645.3694bartoloside K [M-H]-
m/z 659.3851bartoloside A [1, M-H]-
m/z 625.4240bartoloside G [5, M-H]-
m/z 597.3927bartoloside J [M-H]-
m/z 631.3538bartoloside E [M-H]-
m/z 693.3461bartoloside I [M-H]-
7.5×10⁷
6.6×10⁶
2.0×10⁶
1.2×10⁷
7.6×10⁶
8.7×10⁵
3.5×10⁶
1.2×10⁶

SI-4
Fig. S2 – Formation of bartoloside esters upon supplementation of S. salina LEGE 06099 with (a) 5-hexynoic and (b) 6-heptynoic (2) acids. Shown are proposed structures and respective extracted ion chromatograms (EICs) for the esters produced after supplementation with each of the fatty acids, as well as the annotated LC-HRESIMS/MS data for compounds s1a/s1b, s2, s3, 3 and 4.
a
b
5-hexynoic acid
R1
R2
OH
O
OHO
OHHO
S. salinaLEGE 06099
HO
O
2HO
O
R1
R2
OH
O
OHO
OHHO
S. salinaLEGE 06099
O
OR1 = R2 = , 3 O
OR1 = , R2 = H, 4
O
OR1 = R2 = , s2 R1 = , R2 = H, s3
R1 = Cl, R2 = , s1bR1 = , R2 = Cl, s1a
O
O
O
O
O
O
O
O
HO
OH
OH
HOO
O
-H-
BC
AD
100 200 300 400 500 600m/z
569.4553111.0432
457.4034
475.4135
A
(A+D)
(A+B)
C
rela
tive
abun
danc
e
ddMS2 , m/z 701.4998 (s3, [M-H]-) ± 5 ppm
O
O
HO
OH
OH
HOO
OBC
D
A
-H-
100 200 300 400 500 600 700m/z
679.4913111.0432
567.4395585.4500
473.3980455.3876 721.5017
O
O
HO
OH
OH
HOO
O
O
O
-H-
BC B CD
D
A
AC
(A+B+B) (A+B+D)
(A+B)(A+D)
rela
tive
abun
danc
e
ddMS2 , m/z 811.5366 (s2, [M-H]-) ± 5 ppm
O
O
HO
OH
OH
HOO
O
O
OBC B C
D
D
A
-H-
100 200 300 400 500 600m/z
567.4421
557.4496
603.4197111.0437
455.3896
C
(A+B)-HCl
A-HCl
A
rela
tive
abun
danc
e
ddMS2 , m/z 735.4608 (s1a/s1b, [M-H]-) ± 5 ppm
O
O
HO
OH
OH
HOO
O
Cl
-H-
BC
A
1 2 3 4 5 6 7 8 9
10 12 14
15 16 17 18 19 20 21
Time (min)
1 2 3 4 5 6 7 8 9 15 16 17 18 19 20 21
EICs (± 5 ppm)
m/z 735.4608
s1a/s1b, [M-H]-
Z8 mediumZ8 medium + 5 hexynoic acid (50 mg L-1)
Z8 medium
Z8 medium + 2 (50 mg L-1)
0
0
0
4.3×10⁵
3.3×10⁷
6.4×10⁶
m/z 811.5366
s2, [M-H]-
m/z 701.4998
s3, [M-H]-
10 12 14Time (min)
0
0
7.8×10⁶
5.3×10⁵
m/z 839.5679
3, [M-H]-
m/z 715.5154
4, [M-H]-
EICs (± 5 ppm)
ddMS2 , m/z 715.5154 (4, [M-H]-) ± 5 ppm
200 400 600 800m/z
707.5264
125.0595
581.4583599.4685
473.4003455.3898
100 300 500 700
(A+D)(A+B)
(A+B+D)(A+B+B)
AC
rela
tive
abun
danc
e
ddMS2 , m/z 839.5679 (3, [M-H]-) ± 5 ppm
rela
tive
abun
danc
e
A
(A+B)
(A+D)
C
100 200 300 400 500 600 700m/z
583.4731
125.0594
457.4050
475.4152715.4174

SI-5
Text S1 – Structural elucidation of esterified bartolosides 3, 4 and 7a.
bartoloside A-17,29-diyl bis(hept-6-ynoate) (3)
HRESIMS analysis of compound 3 showed a [M-H]- peak at m/z 839.5685, compatible with a molecular formula
of C50H80O10 (calcd for C50H79O10-, m/z 839.56867) and 11.5 degrees of unsaturation. The 1H and 13C NMR spectra
showed typical bartoloside resonances, namely for the aromatic ring (δC 155.8, 154.6, 141.9, 116.3, 110.4 and
107.8) and xylosyl (δC 101.4, 72.6, 74.9, 69.7 and 64.5) (Table S1). Characteristic resonances for two ester/acid
carbonyls (δC 174.1 and 173.9) and two alkyne moities (δC 68.8, δH 1.95) were also observed. The HRESIMS-
derived molecular formula and isotope pattern of 3 dictated the absence of halogens in the molecule. The molecular
formula had an additional C14H18O4 when compared to the major bartoloside 1 produced by S. salina LEGE 06099
(bartoloside A) consistent with the incorporation of two 6-heptynoic acid moieties. This initial analysis strongly
suggested that compound 3 could correspond to a bartoloside derivative where the chlorinated positions in 1 were
substituted by the supplemented 6-heptynoic acid (2). To obtain further insights regarding the structure of 3, we
performed 2D NMR experiments (HSQC, HMBC, COSY). Correlational data for the glycosylated
dialkylresorcinol moiety were highly similar to those of the bartolosides and it was also possible to deduce the
structures of two intact 6-heptynoate spin systems from COSY and HMBC (Fig. S3). Notably, two conspicuous
protons resonating at δH 4.87 (H-17 and H-29) in 3 are not found in any of the previously reported bartolosides.
Each of these protons was positioned in the middle of an alkyl chain (Fig. S3) and showed HMBC correlations to
the carbonyls C-1’ (δC 174.1) and C-1’’ (δC 173.9). Strong deshielding indicated that these were oxymethine
protons and established the directionality of the ester linkages. HRESIMS/MS data, which show fragments
corresponding to 6-heptynoate (m/z 125.05 [M-H]-, Fig. S2) are in accordance with this observation. Additionally,
the resonances for the chlorinated carbons in bartoloside A (δC 64.9, δH 4.01)1,2 are not present in 3, further
implying ester linkages in positions 17 and 29. While it was not possible to fully connect the oxymethines to the
dialkylresorcinol rings, the HRESIMS/MS data of in-source fragments of 3 (Fig. S3) matches the data for
bartoloside A (1) and other bartolosides in our previous structural elucidation efforts.1,2 As such, we propose that
the esterified positions in 3 correspond to the chlorinated positions in 1.

SI-6
bartoloside G-17-yl hept-6-ynoate (4)
HRESIMS data of compound 4 showed a prominent peak at m/z 715.5161 [M-H]- which was compatible with a
molecular formula of C43H72O8 (calcd for C43H71O8-, m/z 715.5162) and 8.5 degrees of unsaturation. The 1H and
13C NMR data (Table S2) were highly similar to those from compound 3, notably featuring a carbonyl resonance
(δC 174.1) and an alkyne moiety signal (δC 68.8, δH 1.95). Additionally, the typical bartoloside resonances for the
aromatic ring (δC 155.7, 154.3, 142.5, 116.1, 110.4, 108.1) and xylosyl group (δC 101.4, 72.6, 74.9, 69.7 and 64.5)
were present. The HRESIMS-derived molecular formula and isotope pattern of 4 indicated the absence of halogens
in the molecule and an additional C7H9O2 when compared to another bartoloside produced by S. salina LEGE
06099 (bartoloside G, 5). This would be consistent with 4 resulting from the incorporation of one 6-heptynoic acid
moiety into 5. Two-dimensional NMR experiments (HSQC, HMBC and COSY) showed the presence of an intact
6-heptynoate-derived spin system from COSY and HMBC correlations (Fig. S3). The HMBC correlations for H-
17 (δH 4.88) with C-1’ (δC 174.1) indicated an identical ester linkage to that of 3, at the C-17 (δC 74.7) position
(Fig. S3). In line with these observations, the HRESIMS/MS data for 4 showed a 6-heptynoate-derived fragment
(m/z 125.05 [M-H]-, Fig. S2). By isolating and carrying out HRESIMS/MS analysis on an in-source fragment of
4, we obtained diagnostic fragments indicating a fully aliphatic alkyl chain with 13 carbons (m/z 249.22 and m/z
291.23, Fig. S3), as well as fragments consistent with an alcohol group in the C12 alkyl chain (e.g. m/z 225.18 and
m/z 319.23, Fig. S3). We thus propose that metabolite 4 is a derivative of the naturally occurring 5, in which the
chlorinated position is substituted by a 6-heptynoate moiety.

SI-7
bartoloside A-17-yl palmitate (7a)
HRESIMS performed for compound 7a presented a peak with m/z 879.6504 [M-H]- (calcd for C52H92O8Cl-
879.6499), compatible with a molecular formula of C52H93O8Cl and 6.5 degrees of unsaturation. The 1H and 13C
NMR data indicated the presence of the characteristic aromatic resorcinol ring and xylosyl group observed in
bartolosides from S. salina LEGE 060992 (Table S3). A carbonyl resonance was also present (δC 174.7) as observed
for bartoloside esters 3 and 4. The additional C16H31O2 (compared to 1) was consistent with the esterification of
one palmitic acid moiety with bartoloside A (1) and the concomitant loss of one chlorine atom (as seen for 3 and
4). Support to this hypothesis was gained from HRESIMS/MS analysis of the in-source-formed species with m/z
473.40032, which showed diagnostic fragments that are consistent with a backbone similar to that of 1 (Fig. 3), as
well as from 2D NMR experiments: an HSQC correlation between δH 3.88 and δC 64.5, likely corresponding to a
chlorinated methine, was part of a spin system that expanded, on both directions into degenerate CH2 resonances,
indicated that this corresponded to a mid-chain chlorination, characteristic of the bartolosides. HRESIMS/MS data
was consistent with the presence of a palmitate-derived fragment (m/z 255.23 [M-H]-, Fig. 3). The 1D and 2D
NMR data showed an additional methyl group (compared to 1) at the terminal position of an alkyl chain, as well
as a bigger CH2 envelope, both in line with the presence of a palmitate moiety in compound 7a. The oxymethine
proton resonating at δH 4.88 presented HMBC correlations to C-1’ (δC 174.7) in the palmitate moiety and was itself
part of another spin system that degenerated into CH2 envelopes; hence it was likely positioned in the middle of
the non-chlorinated alkyl chain. All these observations supported our proposal of 7a being a palmitate ester of 1.
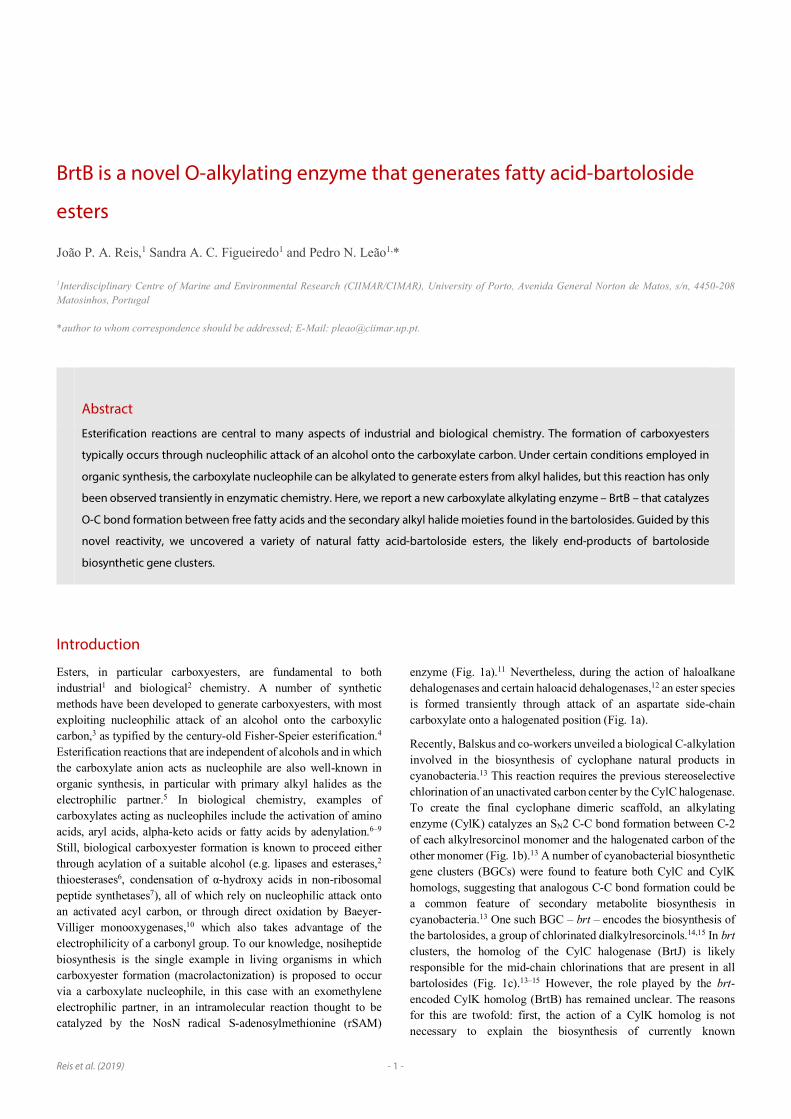
Because 1 has two halogenated methine moieties, to clarify which chain contained the esterification in 7a, we
compared the 1H NMR spectra for 7a with the previously reported2 data for 1. Interestingly, we found that the
multiplicity of H2-12 (δH 2.58) changed from a complex multiplet in bartoloside A to a triplet in 7a, while the
multiplicity of H2-24 (δH 2.50) remained unaffected (Fig. S8). As such, we propose that position 17, in the same
alkyl chain as the H2-12 benzylic protons, is esterified in 7a. HRESIMS/MS analysis is consistent with this
assignment (Fig. 3).

SI-8
Fig. S3 – Structural elucidation of 3 and 4. Key HMBC and COSY correlations for compounds 3 (a) and 4 (b) and annotated HRESIMS/MS spectra for an in-source generated fragment of 3 (c) and 4 (d), providing structural insight into the alkyl substitution pattern of the resorcinol ring.
O
O
HO
OH
HOO
O
H
COSYHMBC
OH
HO
OH
OH
HG
CDF
F
E
E
m/z
249.
2225
6
291.
2334
4
225.
1858
7
303.
2336
4
191.
1072
2
307.
2288
2
319.
2286
4
205.
1228
0
300250200
E
F
D
C
G H
MS/MS, 55 eV
O
O
OH
O
OHO
OH
HO
O
O
H
H
COSYHMBC
3
A+B+C(in source)
O
O
HOOH
OH
HO
O
O
O
O
AB
C
HO
OH
OH
I
H
E
GG
F
F
D
HO
OH
OH
D
HI
K
EJ
or
O
O
HOOH
HO
O
OB
A
OH
DE
200 250 300 m/z
247.
2065
3
319.
2271
4
307.
2274
5
191.
1070
1
207.
1747
3
289.
2176
5
235.
1337
1
301.
2171
3
333.
2420
0
225.
1853
0
254.
0967
3
348.
9762
6
G
262.
3236
1
F
H
I
J
K
MS/MS, 55 eV
a b
c d
4
A+B(in source)
3 4

SI-9
Fig. S4 – Bartoloside esters are formed in S. salina LEGE 06099 cells upon supplementation with fatty acids of different lengths and with the halogenated fatty acid 7-bromoheptanoate. Depticted are LC-HRESIMS extracted ion chromatograms (EICs), in non-supplemented (left panel) and supplemented (right panel) cultures of the cyanobacterium, for the [M-H+HCOOH]- adduct of the proposed bartoloside A esters.
-H + HCOOH-
O
O
HOOH
OH
HO
R1
R2
R1 =R2 = C16:0R1 = C16:0, R2 = Cl / R1 = Cl, R2 = C16:0
Time (min)
rela
tive
abun
danc
e
rela
tive
abun
danc
e
+ fatty acid
(×108)
R1 = R2 = C12:0R1 = C12:0, R2 = Cl / R1 = Cl, R2 = C12:0
R1 = R2 = C18:0R1 = C8:0, R2 = Cl / R1 = Cl, R2 = C8:0
R1 =R2 = C4:0R1 = C4:0, R2 = Cl / R1 = Cl, R2 = C4:0
R1 =R2 = 7-bromoheptanoateR1 = 7-bromoheptanoate, R2 = Cl / R1 = Cl, R2 = 7-bromoheptanoate
1 1(×107)
- fatty acid
R1 = R2 = Cl (1)

SI-10
Fig. S5 – BrtB converts bartoloside A (1) and 6-heptynoic acid (2) into bartoloside esters in vitro. a) Extracted Ion Chromatograms (EICs) obtained from LC-HRESIMS analysis of a full assay with NStrep-BrtB, and control assays without either NStrep-BrtB or fatty acid 2. b) LC-HRESIMS/MS analysis of the monoester(s) and diester formed in the full assay.
1 + 2NStrep-BrtB
50 mM Tris-HCl,50 mM NaCl,10 mM MgCl2,5 mM CaCl2,
pH= 8.0
R1
R2
OH
O
OHO
OHHO
O
OR1 = R2 = , 3
O
OR1 = Cl, R2 = , 6bO
OR1 = , R2 = Cl, 6a
8 10 120
Time (min)
0h
6h
24h
0h
6h
24h
0h
6h
24h
0
0
rela
tive
abun
danc
e
1, m/z 705.3905
6a/6b, m/z 795.48193, m/z 885.5734
EICs (± 5 ppm) [M-H+HCOOH]-:
+ 2+ 1
+1+ NStrep-BrtB
+ 1+ 2+ NStrep-BrtB
assay components:
2.6×10⁸
2.6×10⁸
2.6×10⁸
100 200 300 400 500 600 700m/z
581.4576
617.4340
125.0594623.4685455.3895
473.3997
100 200 300 400 500 600 700m/z
707.5262
125.0595
581.4583599.4685
473.4002
ddMS2 , m/z 749.4765 (6a/6b, [M-H]-) ± 5 ppm
rela
tive
abun
dace
C(A+B)-HCl
(A+D)-HCl
A
A-HCl
O
O
HOOH
OH
HOO
OCl
BC
A
-H -
O
O
HOOH
OH
HO
Cl
O
OB C
A
-H -or
455.3895
O
O
HOOH
OH
HOO
O
O
OBC B C
D
D
A
-H -
C
(A+B+B) (A+B+D)
ddMS2 , m/z 839.5679 (3, [M-H]-) ± 5 ppm
D
D
rela
tive
abun
dace
A
(A+B)(A+D)
a
b

SI-11
Fig. S6 – BrtB converts bartoloside A (1) and palmitic acid into bartoloside esters in vitro. a) Extracted Ion Chromatograms (EICs) obtained from LC-HRESIMS analysis of a full assay with NStrep-BrtB, and control assays without either NStrep-BrtB or palmitic acid. b) LC-HRESIMS/MS analysis of the bartoloside ester 7a products formed in the full assay (it was not possible to fragment the diester 8 due to low abundance of the precursor ion).
22 240
2 4 6
8 10 12 14 16 18 20
22 24 26 28 30
0
0
0
0
0
1, m/z 705.3905
8, m/z 1145.9177
7a/7b, m/z 925.6541
EICs (± 5 ppm) [M-H+HCOOH]-:
2.6×10⁸
2.6×10⁸
2.6×10⁸
5.7×10⁴
5.7×10⁴
5.7×10⁴
Time (min) Time (min)
0h
6h
24h
0h
6h
24h
0h
6h
24h
+ 2+ 1
+1+ NStrep-BrtB
+ 1+ 2+ NStrep-BrtB
assay components:
palmitic acid
R1
R2
OH
O
OHO
OHHO
1 + C15H31
O
HO
R1 = , R2 = Cl, 7aO
O
C15H31 R1 = Cl, R2 = , 7bO
O
C15H31 R1 = R2 = , 8O
O
C15H31
NStrep-BrtB
50 mM Tris-HCl,50 mM NaCl,10 mM MgCl2,5 mM CaCl2,
pH= 8.0
300 400 500 600 700 800m/z
747.6070
711.6301
255.2329 455.3897 491.3673
C (A+B)-HCl (A+B)
A
A-HCl
-H -
O
O
HOOH
OH
HOO
OCl
B
A
or
O
O
HOOH
OH
HO
O
OB
A
Cl
-H -
rela
tive
abun
dace
ddMS2 , m/z 879.6486 (7a/7b, [M-H]-) ± 5 ppm
a
b

SI-12
Fig. S7 – Phylogeny of BrtB homologs and diversity of their associated biosynthetic gene clusters. An approximately-maximum-likeihood tree was built from an alignment of BrtB with its closest homologs, as well as with the more distantly related virginiamycin lyase (VgbA) and alginate C5-epimerases (left panel). The thickness of the tree branches corresponds to bootstrap support (thicker branches have at least 60% support). Selected biosynthetic gene clusters that contain BrtB homologs (right panel). Annotation of the genomic context of brtB homologs was carried out using blastP using the translation of the surrounding genes as queries.
Fischerella sp. PCC 9431~26.3 kb
Moorea producens PAL-8-15-08-1~23.9 kb
BrtB/CylK homolog
DAR formation
glycosyltransferase
BrtJ/CylC-like halogenase
type I PKS
transport//other
tailoring
Fatty acid activation/transfer
hypothetical
halogenase (other)
NRPS
Nostoc punctiforme PCC 73102~43.6 kb
Anabaena cylindrica PCC 7122~27 kb
Aliterella atlantica CENA595~23.5 kb
Nostoc commune NIES-4072cluster 1 ~24.1 kb
cluster 2 ~41.4 kb
~23.3 kbPleurocapsa sp. PCC 7319
Hydrococcus rivularis NIES-593~24.2 kb
Fischerella major NIES-592~26.2 kb
Cyanothece sp. PCC 7822~24.7 kb
Leptolyngbya sp. IPPAS B-1204~20.7 kb
Thiovulum sp. ES
0.3 substitutions/site
WP_051470317.1
WP_012409773.1
WP_081431122.1
AMB48443.1
WP_083305077.1
WP_019489587.1
BAZ29714.1
WP_120118445
WP_073601359.1
WP_102204468.1
WP_053455401.1
OKH20554.1
WP_096674811.1
OKH22125.1
OLT59171.1
WP_006527112.1
WP_015189204.1
WP_073601326.1
AFV96145.1
TAG94906.1
WP_100897596.1
WP_073556465.1
PMB08752.1
WP_016864402.1
ELS00287.1
WP_054469159.1
RNJ65943.1
WP_102175163.1
EJF07193.1
WP_015142025.1
OLC09245.1
AOW99678.1
WP_016870032.1
WP_009459339.1
WP_105222333.1
RCJ29610.1
WP_109009601.1
WP_096684232.1
WP_094345160.1
WP_006527113.1
WP_096554462.1
WP_127056374.1
WP_106173296.1
WP_035999513.1
WP_012703557
RCJ29606.1
WP_106921689.1
WP_052672355.1
WP_102221602.1
WP_133487641
WP_084544420.1
WP_109009602.1WP_100897597.1
WP_131300617
AKV71847.1
WP_102173220.1
WP_015144884.1
WP_084047365.1
WP_084544454.1
WP_102166111.1
WP_104546381.1
AOH72618.1
ELR97711.1
WP_079205559.1
CCI23897.1
WP_019504293.1
WP_026719276.1
WP_006530025.1
WP_071103576.1
WP_032489636
RNJ69819.1
AQA28567.1
WP_102149228.1
REJ42170.1
WP_017320689.1
WP_087538347.1
PZO17591.1WP_013334454.1
WP_102176677.1
WP_015217164.1
KST62481.1
WP_090937208
ARU81125.1
WP_006527879.1
WP_102207046.1
WP_015207394.1
WP_080603267.1
WP_015215108.1
AUB35336.1
PSB62325.1
SI-13
Fig. S8 – 1H NMR-based assignment of which alkyl chain in 7a is esterified with palmitic acid. Shown are the structures and regions of the benzylic proton resonances for bartoloside A (1, top) and 7a (bottom).
2.252.302.352.402.452.502.552.602.652.702.75f1 (ppm)
bartoloside A (1)
compound 7a
H2-12 H2-24
ClCl
OH
O
OHO
OHHO
H H
H H
12
24
17
29
1
OCl
OH
O
OHO
OHHO
H H
H H
12
24
17
29
O
C15H31
H2-2’
7a

SI-14
Fig. S9 – Detection and HRESIMS/MS based structural assignment of natural fatty acid bartoloside monoesters produced by S. salina LEGE 06099. a) Reference for the structures of fatty acid bartoloside monoesters and for their annotated MS/MS data. b-l) Extracted Ion Chromatograms (EICs, top) for the [M-HCOOH]- ion and MS/MS spectra for the [M-H]- ion of each of the detected esters.
AA-HCl
(A+B)-HClC
200 400 600 800m/z
627.5371
617.5437
171.1383 455.3903112.9843 220.1465
473.4006
663.5138
(A+B)+OH-HClR= C10:0ddMS2 , m/z 795.5547 [M-H]-
00 2 4 6 8 10 12 14 16
Time (min)
3.2�106
m/z 841.5602 [M-H+HCOOH]-EIC (± 5 ppm):
0
1.1�106
0 2 4 6 8 10 12 14 16Time (min)
m/z 813.5289 [M-H+HCOOH]- EIC (± 5 ppm):
200 400 600m/z
599.5059
635.4824
143.1068 553.3593455.3907
473.4003
(A+B)-HClC
A
A-HCl
R= C8:0ddMS2 , m/z 767.5234 [M-H]-
00 2 4 6 8 10 12 14 16
Time (min)
7.4�106m/z 729.4350 [M-H+HCOOH]- EIC (± 5 ppm):
A
C
50 200 400 600m/z
515.4115
551.3886
469.369359.0123 505.3475255.2332 601.4123
455.3904
A-HCl
(A+B)-HCl
R= C2:0ddMS2 , m/z 683.4295 [M-H]-
0
1.0�107
0 2 4 6 8 10 12 14 16Time (min)
m/z 923.6385 [M-H+HCOOH]- EIC (± 5 ppm):
400 600m/z
719.5763
683.5994
673.6061
255.2333 427.3584
227.2004
455.3899
C
A-HCl
A
ddMS2 , m/z 851.6173 [M-H]- R= C14:0
(A+B)-HCl
200 400 600 800m/z
691.5452655.5687
645.5755
475.4163158.9746115.9195 199.1699 455.3903
AA-HCl
C (A+B)-HCl(A+B)+OH-HCl
R= C12:0ddMS2 , m/z 823.5860 [M-H]-
00 2 4 6 8 10 12 14 16
Time (min)
3.0�106
m/z 897.6228 [M-H+HCOOH]- EIC (± 5 ppm):
0 2 4 6 8 10 12 14 16Time (min)
0
2.2�106
m/z 869.5915 [M-H+HCOOH]- EIC (± 5 ppm):
200 400 600 800m/z
745.5910
709.6143
699.6292253.2172 455.3898 491.3665
C (A+B)-HCl (A+B)
A
A-HClR= C16:1ddMS2 , m/z 877.6330 [M-H]-
0
1.3�107
0 2 4 6 8 10 12 14 16Time (min)
m/z 953.6854 [M-H+HCOOH]- EIC (± 5 ppm):
00 2 4 6 8 10 12 14 16
Time (min)
2.6�107
m/z 951.6698 [M-H+HCOOH]- EIC (± 5 ppm):
200 400 600 800m/z
775.6374
739.6611
729.6695283.2643 455.3895 491.3661
A
C(A+B)
A-HCl
(A+B)-HCl
R= C18:0ddMS2 , m/z 907.6799 [M-H]-
200 400 600 800m/z
773.6229
737.6462
727.6550281.2487 455.3901 491.3659C (A+B)-HCl (A+B)
A
A-HCl
R= C18:1ddMS2 , m/z 905.6643 [M-H]-
0 2 4 6 8 10 12 14 16Time (min)
0
9.8�106
m/z 949.6541 [M-H+HCOOH]- EIC (± 5 ppm):
200 400 600 800m/z
771.6061
735.6302
279.2330 725.6364455.3895 689.5882491.3664
A
C(A+B)
A-HCl
(A+B)-HCl
R= C18:2ddMS2 , m/z 903.6486 [M-H]-
BC
A
-H -
O
O
HOOH
OH
HO
RCl
B C
A
-H -
O
O
HOOH
OH
HO
ClR
or
a
b c
d
00 2 4 6 8 10 12 14 16
Time (min)
m/z 947.6385 [M-H+HCOOH]- EIC (± 5 ppm):
9.5�106
200 400 600 800m/z
769.5913
733.6145
277.2174 723.6275455.3897 685.6059491.3665
A
C(A+B)(A+B)-HCl
A-HClR= C18:3ddMS2 , m/z 901.6330 [M-H]-
e
00 2 4 6 8 10 12 14 16
Time (min)
m/z 925.6541 [M-H+HCOOH]- EIC (± 5 ppm):
7.7�107
200 400 600 800m/z
747.6069
711.6302
255.2330 455.3897 701.6375
A
C(A+B)
491.3665(A+B)-HCl
A-HClR= C16:0ddMS2 , m/z 879.6486 [M-H]-
f
g h i
j k l
(A+B)+OH-HCl

SI-15
Fig. S10 – Detection and HRESIMS/MS based structural assignment of natural fatty acid bartoloside esters produced by S. salina LEGE 06099. a) Reference for the structures of fatty acid bartoloside A diesters and for their annotated MS/MS data. b-c) Extracted Ion Chromatograms (EICs, top) for the [M-HCOOH]- ion and MS/MS spectra for the [M-H]- species of each of the detected bartoloside A diesters. d) Reference for the structures of bartoloside G esters or, potentially, esters of a hypothetical structural isomer of bartoloside G that, for example, contains a single halogenation in the opposite chain of the halogenated chain in bartoloside G. e-k) Extracted Ion Chromatograms (EICs, top) and MS/MS spectra for the [M-H]- ion of each of the detected bartoloside G (or hypothetical structural isomer).
200 400 600m/z
711.6304
729.6413
255.2329
455.3912 473.4015
ddMS2 , m/z 1099.9122 ± 5 ppm R = C16:0
1000
967.8716
1099.9126
A
(A+B)+OH
(A+B)
C
(A+B+B) (A+B+B)+OH
BC
A
-H-
O
O
HO
OH
OH
HO
R
RB C
m/z
575.4327
515.4111
533.421959.0120
473.4003
455.3897
A
(A+B)+OHC (A+B+B)
(A+B+B)+OH
(A+B)
ddMS2 , m/z 707.4740 ± 5 ppm R = C2:0
100 300 500
0 2 4 6 8 10 12 14 16Time (min)
0
1.8×10⁶
m/z 753.4795 [M-H+HCOOH]- EIC (± 5 ppm):
16 18 20 22 24 26 28 30 32 34
200 400 600 800m/z
739.6622
281.2489 457.4056475.4158
A
C (A+B)(A+B)+OH
ddMS2 , m/z 871.7032
200 400 600m/z
735.6313
277.2175457.4057 475.4160
A
C(A+B)
ddMS2 , m/z 867.6719
(A+B)+OH
200 400 600m/z
711.6308
253.2175 457.4059475.4162
A
C (A+B)(A+B)+OH
ddMS2 , m/z 843.6719
200 400 600 800m/z
741.6780
457.4058283.2646475.4161
C (A+B)(A+B)+OH
A
ddMS2 , m/z 873.7189 R = C18:0
m/z200 400 600
737.6466
279.2333457.4059
475.4163
A
C (A+B)(A+B)+OH
ddMS2 , m/z 869.6876
16 18 20 22 24 26 28 30 32 34Time (min)
16 18 30 32 34Time (min)
Time (min)0 2 4 6 8 10 12 14
0
m/z 695.4740 [M-H+HCOOH]-
4.2 106×
EIC (± 5 ppm):
200 400 600 800m/z
713.6453
457.4054255.2329475.4156
ddMS2 , m/z 845.6876 ± 5 ppm
C (A+B) (A+B)+OH
A
0
m/z 889.6774 [M-H+HCOOH]-
0 2 4 6 8 10 12 14
EIC (± 5 ppm):
5.4 106×
Time (min)
00 2 4 6 8 10 12 14
4.9 107×
m/z 891.6931 [M-H+HCOOH]- EIC (± 5 ppm):
Time (min)
0
m/z 919.7244 [M-H+HCOOH]- EIC (± 5 ppm):
1.1 107×
0 2 4 6 8 10 12 14Time (min)
0
1.5 107×
0 2 4 6 8 10 12 14Time (min)
m/z 917.7087 [M-H+HCOOH]- EIC (± 5 ppm):
0
3.2 106×
Time (min)
m/z 915.6931 [M-H+HCOOH]- EIC (± 5 ppm):
0
0 2 4 6 8 10 12 14Time (min)
5.1 106×
m/z 913.6774 [M-H+HCOOH]- EIC (± 5 ppm):
m/z200 400
517.4269
457.4059
475.4163
59.0123C
(A+B)
(A+B)+OH
A
ddMS2 , m/z 649.4685
50
a
b c
e f
g h i
j k
bartoloside G ester
ester of putative bartoloside
bartoloside A diester
R = C18:1
R = C16:0R = C18:3R = C18:2
R = C16:1 R = C2:0
BC
A
-H-
O
O
HO
OH
OH
HO
R
d
A
-H-
O
O
HO
OH
OH
HO
R
00 2 4 6 8 10 12 14 16
Time (min)
5.5×10⁶
m/z 1145.9177 [M-H+HCOOH]-
EIC (± 5 ppm):
B C
or

SI-16
Text S2 – Protein and DNA sequences
Protein Sequence (NStrep-BrtB, 91.4 kDa)
MASWSHPQFEKGADDDDKVPDPTSVDMANPFDVALTNLNSLYSGIPDVPVLQTYNSLNPYDISLTNLNNLSNFVIEPAVLPTAAGTYGPQISEIAFALGGGIITGALADLLSTELGIEIENEALITKFLSFWTPGSDYAFGQDYVEFIQGREGFDTIIGYDPGFNSALAPVQIDFVLGGPRQDFNFFAPLDEPARYVLGDWRTPYYVDNDIQSEGLNEFMYVSLFTLNPDEFSPDNAENHRIQLYGSLDNYYFVPTTVVIDGSALDPSLPSIPVPGTEIYYKTGQVFADLIAIVPFQDPNDPNLISAWIDFEGYLPPEQADLSGQTANPLLSGSPLLQLGYEGIDMGTATALAPDGDIYVAGSTSSLLGPFPRGGSDNFIARYNDDGSLEWIVQFGSTEFDIITDIVSDSAGNVYATGWTRGNVETGFGLAPGVQDNWVAKFDANGSQLWVEQFTIDGYLDRSMGIALDEVNGRIHLTGHSNTDGSVADTNDPAIVPNGNVVTWIAGFDANTGAEDYRNVFEVAQTSNSRGRIDEGFGIDVDDAGNVFSTGWAGENAYDVYLVKSDTDGAVLWTKSFGTGSNATQSYAWDVASDGTNAYILGWTQGELNTFRDQIPPTDEFAGNATAPLTPQNAYQGGTFDAFVAAYDTDGTELWTWHVGGTGDDGTFFGKIVAAGDFVYATGYTDGFIGTLGGSNAGDYDAWIGKFDKLTGQTAWIQQIGSTKLDYATGISVDGDDIFVTGFTEGSLGGLNGGASDAWVAKLNQDGALEAFNVSAPIAPPAPFAPPAPLTPPAPPAPDLSSLQSLGSTPQPTYPALGDSYGTNPFGTQPTQPTYDLSSMYQNAYYGGFGGYSGYGY
DNA sequence (NStrep-brtB)
ATGGCAAGCTGGAGCCACCCGCAGTTCGAAAAGGGTGCAGATGACGACGACAAGGTACCGGATCCGACGTCGGTCGACATGGCCAATCCCTTCGACGTCGCTTTAACTAATCTTAACAGTCTTTACAGCGGTATCCCTGATGTTCCCGTTCTTCAGACGTACAACTCTCTTAACCCCTACGACATTTCTTTAACTAATCTTAACAATCTTAGCAACTTCGTCATTGAGCCAGCCGTGCTCCCTACAGCGGCAGGTACCTACGGCCCTCAAATCAGTGAAATTGCTTTTGCGTTGGGGGGTGGGATCATAACAGGGGCACTAGCTGATCTGCTATCCACTGAGTTGGGGATCGAGATCGAGAACGAAGCTCTGATAACTAAGTTCCTTTCCTTCTGGACTCCCGGTTCCGATTACGCCTTCGGTCAGGATTATGTTGAATTTATTCAAGGTCGGGAAGGCTTTGACACCATCATCGGTTACGACCCCGGATTCAACAGTGCATTAGCTCCCGTACAAATTGACTTTGTCCTTGGCGGCCCCAGGCAGGACTTTAACTTCTTTGCCCCCTTAGATGAGCCAGCACGCTACGTTTTGGGTGATTGGCGGACCCCCTATTATGTGGATAACGATATCCAGAGTGAGGGGCTGAACGAGTTTATGTATGTTTCGCTCTTCACACTTAACCCGGATGAATTTTCGCCAGACAATGCAGAAAATCATCGTATCCAGCTCTACGGCAGTCTGGACAATTACTACTTTGTACCAACGACAGTTGTAATTGATGGAAGCGCCCTAGATCCAAGTCTTCCATCAATTCCCGTCCCAGGCACAGAAATTTACTATAAAACCGGGCAGGTTTTTGCAGATCTGATTGCCATTGTGCCTTTCCAGGATCCTAACGACCCAAATCTTATTTCCGCCTGGATTGATTTTGAGGGCTATCTGCCCCCGGAACAGGCCGACCTGAGTGGCCAGACCGCGAACCCCTTGCTCTCCGGTTCTCCCCTCCTTCAATTGGGCTACGAAGGCATCGATATGGGTACGGCAACGGCCCTCGCCCCGGATGGTGATATCTACGTCGCTGGCTCCACTAGCAGTCTTTTGGGACCTTTTCCCCGTGGAGGTTCAGACAACTTCATCGCCCGCTACAACGACGATGGTAGCTTGGAATGGATTGTTCAATTTGGTAGCACTGAGTTCGACATAATCACCGACATTGTCAGCGACAGCGCTGGTAACGTTTATGCCACCGGTTGGACCCGGGGCAATGTGGAGACGGGTTTTGGCCTGGCCCCAGGTGTTCAAGACAATTGGGTAGCCAAATTTGATGCCAATGGCAGCCAACTCTGGGTAGAGCAATTTACCATTGATGGCTACCTCGACCGTTCCATGGGCATTGCCCTCGATGAAGTCAATGGGAGAATTCACCTGACAGGGCACTCCAACACGGATGGCTCCGTTGCGGATACAAACGACCCCGCCATTGTCCCCAATGGTAATGTGGTCACCTGGATTGCTGGTTTTGATGCTAACACTGGAGCAGAAGACTATCGCAATGTCTTTGAAGTCGCCCAAACCTCTAACAGCCGGGGACGCATTGATGAAGGTTTTGGCATAGATGTTGACGATGCTGGCAATGTGTTCTCCACCGGTTGGGCCGGAGAAAACGCCTACGACGTCTATCTGGTTAAATCCGATACGGATGGCGCTGTACTCTGGACCAAGAGCTTCGGAACTGGGTCTAATGCCACCCAAAGTTATGCCTGGGATGTTGCTAGTGATGGCACCAATGCCTATATCCTAGGTTGGACCCAGGGCGAACTCAACACATTCCGCGATCAAATTCCTCCCACGGATGAATTTGCGGGTAATGCGACGGCTCCACTTACTCCGCAAAATGCTTACCAAGGTGGTACCTTCGATGCCTTTGTTGCCGCCTATGACACCGATGGTACTGAACTCTGGACTTGGCATGTAGGTGGAACAGGGGATGATGGAACCTTCTTCGGTAAAATTGTCGCTGCTGGGGACTTTGTTTACGCCACAGGCTATACCGATGGCTTTATTGGCACCCTAGGTGGCAGTAACGCTGGTGACTACGATGCCTGGATCGGTAAGTTTGATAAGTTAACCGGTCAGACTGCATGGATCCAGCAGATTGGTAGCACCAAGCTAGACTACGCCACTGGTATTTCCGTTGATGGCGATGACATTTTCGTAACAGGCTTTACGGAAGGTTCCTTGGGCGGCTTGAACGGTGGTGCTTCCGACGCCTGGGTTGCTAAGTTAAATCAAGATGGCGCTTTAGAAGCTTTTAATGTTTCTGCCCCTATTGCTCCCCCAGCTCCTTTTGCTCCCCCAGCCCCTCTTACTCCTCCAGCTCCCCCGGCTCCTGATCTCAGTAGCTTGCAGTCATTGGGTAGCACCCCTCAGCCGACCTACCCGGCCCTTGGGGACAGCTATGGCACTAACCCCTTTGGTACTCAGCCTACTCAACCTACCTATGACCTCAGCAGCATGTACCAAAATGCTTACTATGGCGGCTTCGGAGGTTATTCCGGGTACGGCTACTAG

SI-17
Fig. S11 – SDS-PAGE analysis of the Strep-NBrtB protein preparation, following purification and concentration. Seven microliters of protein sample were loaded into the SDS-PAGE gel.
250
130
100
70
55
35
20
15
10
kDa
MW
mar
ker
NS
trep-
BrtB
prep
arat
ion

SI-18
Table S1 – NMR Spectroscopic Data (1H 400 MHz, 13C 100 MHz, CDCl3) for bartoloside A-17,29-diyl bis(hept-6-ynoate) (3).
position δc type δHa mult, J (Hz) HMBCb COSY 1 155.8 C 2 116.3 C 3 154.6 C-OH 4 110.4 CH 6.36 d, 1.4 154.6, 116.3, 107.8, 35.6 6.47, 2.48 5 141.9 C 6 107.8 CH 6.47 d, 1.4 155.8, 116.3, 110.4, 35.6 6.36, 2.48 7 101.4 CH 4.99 d, 5.6 155.8, 74.9, 64.5 3.71, 3.70 8 72.6 CH-OH 3.71 m 101.4, 74.9 4.99, 3.80 9 74.9 CH-OH 3.70 m 72.6, 69.7 4.99, 3.80 10 69.7 CH-OH 3.80 m 74.9 4.10, 3.71, 3.70, 3.45 11 64.5 CH2 4.10/3.45 dd, 11.9, 4.4/12.0, 8.2 101.4, 74.9, 69.7 3.80, 3.45/4.10, 3.80 12 23.3 CH2 2.58 t, 7.8 155.8, 154.6, 116.3, 29.3 1.51-1.49, 1.50 13 29.3 CH2 1.50 m 2.58 14, 20, 26, 32, 33 29.6-29.0 5 × CH2 1.32-1.28 m 31.9, 31.8, 29.6-29.0, 14.2, 14.1 1.51-1.49, 0.87 15a, 19a, 27a, 31a 25.4-25.1 4 × CH2 1.51-1.49 m 74.8, 74-6, 31.9, 31.8, 29.6-29.0 4.87, 2.58, 1.32-1.28, 1.27-1.24 15b, 19b, 27b, 31b 1.27-1.24 m 31.9, 31.8, 29.6-29.0 1.51-1.49 16a, 18a, 28a, 30a 34.3-34.1 4 × CH2 1.51-1.49 m 74.8, 74.6, 31.9, 31.8, 29.6-29.0, 25.4-25.1 4.87, 1.32-1.28, 1.27-1.24 16b, 18b, 28b, 30b 1.27-1.24 m 29.6-29.0, 25.4-25.1 1.51-1.49 17/29 74.8/74.6 2 × CH 4.87 m 174.1, 173.9, 34.3-34.1, 25.4-25.1 1.51-1.49 21/34 31.9/31.8 2 × CH2 1.27-1.24 m 29.6-29.0, 25.4-25.1, 14.2, 14.1 1.51-1.49, 0.87 22/35 22.7 2 × CH2 1.27-1.24 m 31.9, 31.8, 29.6-29.0, 25.4-25.1, 14.2, 14.1 1.51-1.49, 0.87 23/36 14.2/14.1 2 × CH3 0.87 m 31.9, 31.8, 22.7 1.32-1.28, 1.27-1.24 24 35.6 CH2 2.48 t, 7.5 141.9, 110.4, 107.8, 34.3-34.1, 30.9, 29.6-29.0 6.47, 6.36, 1.55 25 30.9 CH2 1.55 m 141.9, 29.6-29.0 2.48 1'/ 1'' 174.1/173.9 2 × C 2'/ 2'' 34.3/34.3 2 × CH2 2.32 dt, 7.4, 2.2 174.1, 173.9, 28.0, 24.3 1.73 3'/3'' 24.3 2 × CH2 1.73 m 174.1, 173.9, 34.3, 28.0, 18.3, 18.2 2.32, 1.55 4'/ 4'' 28.0 2 × CH2 1.55 m 84.1, 34.3, 24.3, 18.3, 18.2 2.20, 1.73 5'/ 5'' 18.3/18.2 2 × CH2 2.20 tt, 7.0, 2.7 84.1, 68.8, 28.0, 24.3 1.95, 1.55 6'/ 6'' 84.1 2 × C 7'/ 7'' 68.8 2 × CH 1.95 m 84.1, 18.2, 18.3 2.20
afrom HSQC; bfrom proton to indicated carbon.
O
O
HOOH
OH
HO
O
O
1
23
4
5
678
9
1011
12
13
14
15
16
17
18
19
20
21
2223
24
25
26
27
28
29
30
31
32
33
34
35
361'
2'
3'
4'
5'6'
7'
3
O
O1''
2''
3''
4''
5''6''
7''

SI-19
Fig. S12 – 1H NMR (CDCl3, 400 MHz) spectrum of compound 3.
0.00.51.01.52.02.53.03.54.04.55.05.56.06.57.07.58.08.5f1 (ppm)
6.1
4
27
.14
16
.65
4.2
6
1.9
6
4.0
74
.09
2.0
62
.00
1.2
11
.90
1.9
8
0.9
8
0.9
9
2.0
6
1.0
0
1.0
1
1.0
0

SI-20
Fig. S13 – 13C NMR (CDCl3, 100 MHz) spectrum of compound 3.
0102030405060708090100110120130140150160170180190200210f1 (ppm)
14
.13
14
.19
18
.24
18
.25
22
.66
22
.70
23
.29
24
.29
24
.31
25
.11
25
.28
25
.31
25
.41
27
.96
27
.99
28
.95
29
.10
29
.17
29
.21
29
.31
29
.58
30
.93
31
.81
31
.86
34
.11
34
.23
34
.24
34
.29
34
.32
34
.34
35
.58
64
.54
68
.77
68
.82
69
.70
72
.61
74
.59
74
.80
74
.86
84
.10
84
.12
10
1.3
9
10
7.8
1
11
0.4
1
11
6.3
3
14
1.9
2
15
4.5
81
55
.75
17
3.9
01
74
.12
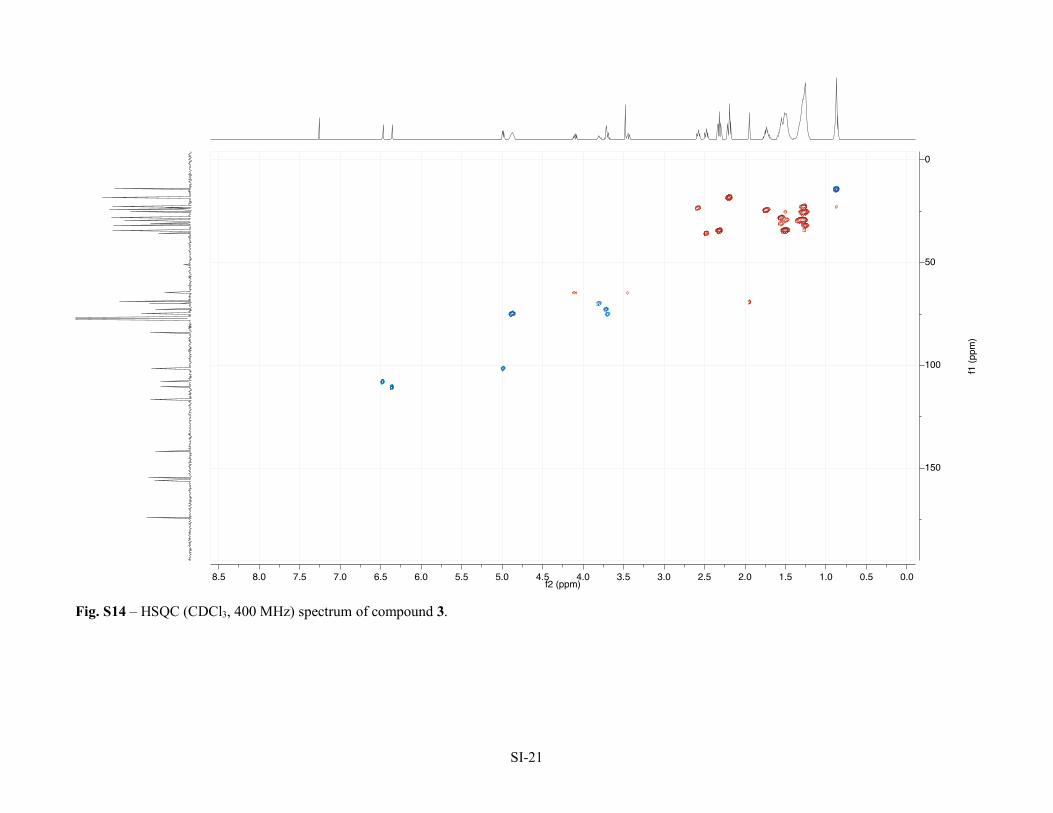
SI-21
Fig. S14 – HSQC (CDCl3, 400 MHz) spectrum of compound 3.
0.00.51.01.52.02.53.03.54.04.55.05.56.06.57.07.58.08.5f2 (ppm)
0
50
100
150
f1 (
ppm
)
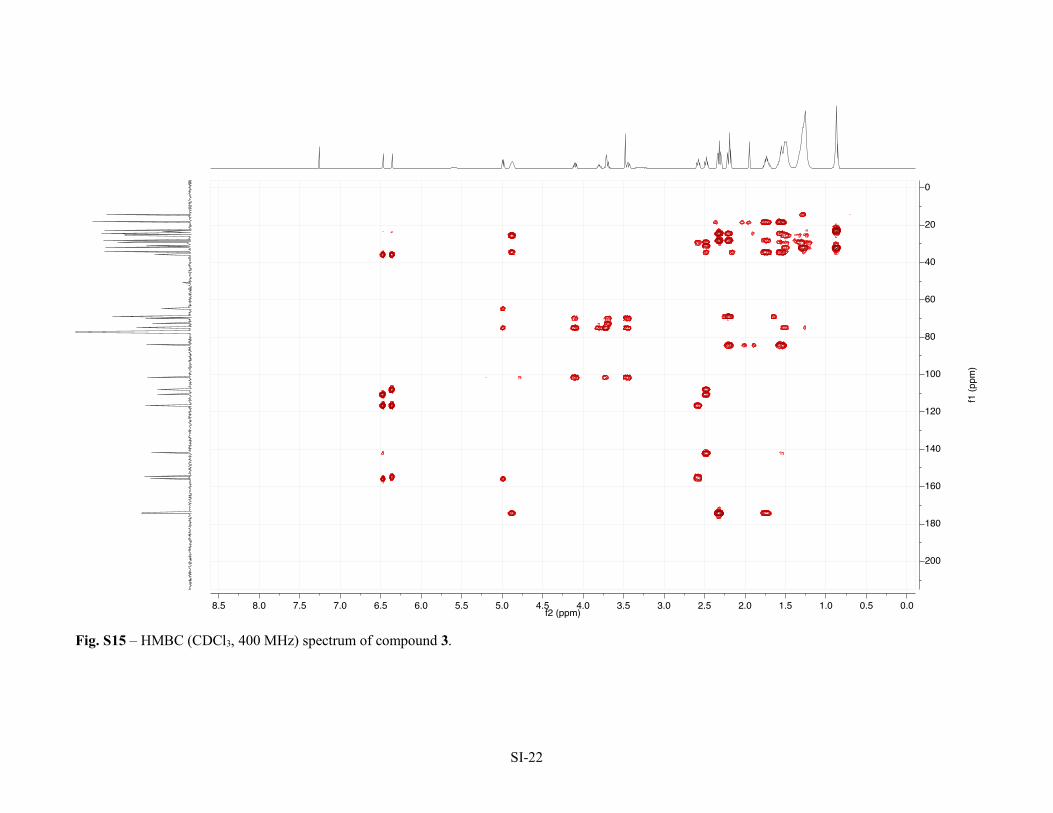
SI-22
Fig. S15 – HMBC (CDCl3, 400 MHz) spectrum of compound 3.
0.00.51.01.52.02.53.03.54.04.55.05.56.06.57.07.58.08.5f2 (ppm)
0
20
40
60
80
100
120
140
160
180
200
f1 (
ppm
)

SI-23
Fig. S16 – COSY (CDCl3, 400 MHz) spectrum of compound 3.
0.00.51.01.52.02.53.03.54.04.55.05.56.06.57.07.58.08.5f2 (ppm)
0
1
2
3
4
5
6
7
8
f1 (
ppm
)

SI-24
Table S2 – NMR Spectroscopic Data (1H 400 MHz, 13C 100 MHz, CDCl3) for bartoloside G-17-yl hept-6-ynoate (4)
position δc type δHa mult, J (Hz) HMBCb COSY 1 155.7 C 2 116.1 C 3 154.3 C-OH 4 110.4 CH 6.36 d, 1.5 154.3, 116.1, 108.1, 36.0 6.51, 2,49 5 142.5 C 6 108.1 CH 6.51 d, 1.5 155.7, 116.1, 110.4, 36.0 6.36, 2.49 7 101.4 CH 5.00 d, 5.7 155.7, 74.9, 64.5 3.71 8 72.6 CH-OH 3.72 m 5.00, 3.83 9 74.9 CH-OH 3.70 m 5.00, 3.83 10 69.7 CH-OH 3.83 m 4.12, 3.72, 3.70, 3.47 11 64.5 CH2 4.12/3.47 dd, 11.9, 4.4/11.9, 8.1 101.4, 74.9/101.4, 74.9, 69.7 3.83, 3.47/4.12, 3.83 12 23.3 CH2 2.58 t, 7.8 155.7, 154.3, 116.1, 29.1 1.51-1.50, 1.50 13 29.1 CH2 1.50 m 2.58 14/20, 26-33 29.9-29.0 10 × CH2 1.27-1.24 m 32.1, 31.8, 29.9-29.0, 22.8, 22.7, 14.3, 14.2 1.51-1.50, 0.87 15a, 19a 25.3/25.2 2 × CH2 1.51-1.50 m 32.1, 31.8 4.88, 2.58, 1.30-1.28 15b, 19b
1.30-1.28 m 32.1, 31.8, 29.9-29.5 1.51-1.50
16a, 18a 34.3 2 × CH2 1.51-1.50 m 32.1, 31.8, 25.3, 25.2 4.88, 1.30-1.28, 1.27-1.24 16b, 18b
1.27-1.24 m 29.9-29.0 1.51-1.50
17 74.7 CH 4.88 p, 6.2 174.1, 34.3, 25.3, 25.2 1.51-1.50 21/34 32.1/31.8 2 × CH2 1.27-1.24 m 29.9-29.0, 22.8, 22.7, 14.3, 14.2 1.51-1.50, 0.87 22/35 22.8/22.7 2 × CH2 1.27-1.24 m 32.1, 31.8, 29.85-29.51, 14.3, 14.2 1.51-1.50, 0.87 23/36 14.3/14.2 2 × CH3 0.87 m 32.1, 31.8, 22.8, 22.7 1.30-1.28, 1.27-1.24 24 36.0 CH2 2.49 t, 7.7 142.5, 110.4, 108.1, 31.4, 29.9-29.0 6.51, 6.36, 1.56 25 31.4 CH2 1.56 m 29.9-29.0 2.49 1' 174.1 C 2' 34.4 CH2 2.32 t, 7.4 174.1, 28.0, 24.3 1.74 3' 24.3 CH2 1.74 m 174.1, 34.4, 28.0, 18.3 2.32, 1.55 4' 28.0 CH2 1.55 m 84.1, 34.4, 24.3, 18.3 2.20, 1.74 5' 18.3 CH2 2.2 td, 7.0, 2.6 84.1, 68.8, 28.0, 24.3 1.95, 1.55 6' 84.1 C 7' 68.8 CH 1.95 t, 2.7 2.20
afrom HSQC; bfrom proton to indicated carbon.
O
O
HOOH
OH
HO
O
O
1
23
4
5
678
9
1011
12
13
14
15
16
17
18
19
20
21
2223
24
25
26
27
28
29
30
31
32
33
34
35
361'
2'
3'
4'
5'6'
7'
4

SI-25
Fig. S17 – 1H NMR (CDCl3, 400 MHz) spectrum of compound 4.
0.00.51.01.52.02.53.03.54.04.55.05.56.06.57.07.58.08.5f1 (ppm)
6.4
6
35
.41
14
.83
2.4
6
1.0
3
2.2
3
2.0
7
2.0
5
3.0
1
1.9
7
1.0
0
2.0
2
1.0
3
1.0
1
0.8
41
.10
1.0
0
1.0
0
1.0
0
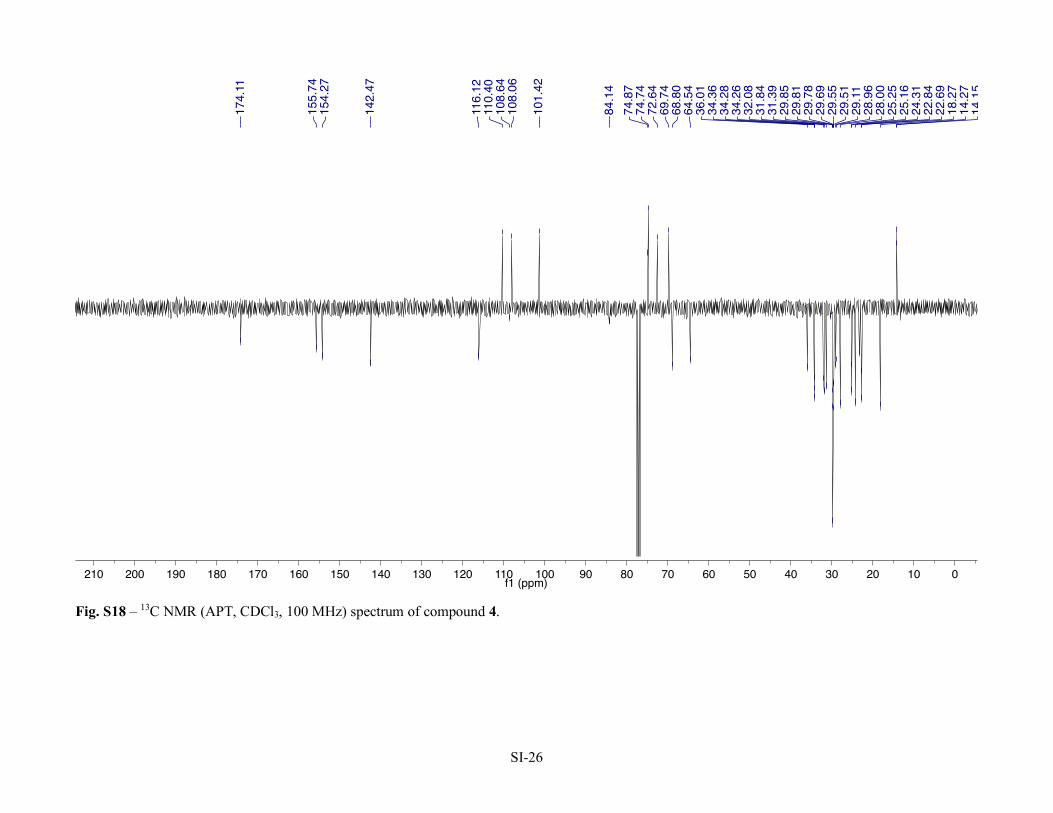
SI-26
Fig. S18 – 13C NMR (APT, CDCl3, 100 MHz) spectrum of compound 4.
0102030405060708090100110120130140150160170180190200210f1 (ppm)
14
.15
14
.27
18
.27
22
.69
22
.84
24
.31
25
.16
25
.25
28
.00
28
.96
29
.11
29
.51
29
.55
29
.69
29
.78
29
.81
29
.85
31
.39
31
.84
32
.08
34
.26
34
.28
34
.36
36
.01
64
.54
68
.80
69
.74
72
.64
74
.74
74
.87
84
.14
10
1.4
2
10
8.0
61
08
.64
11
0.4
011
6.1
2
14
2.4
7
15
4.2
71
55
.74
17
4.1
1

SI-27
Fig. S19 – HSQC (CDCl3, 400 MHz) spectrum of compound 4.
0.00.51.01.52.02.53.03.54.04.55.05.56.06.57.07.58.08.5f2 (ppm)
0
50
100
150
f1 (
ppm
)
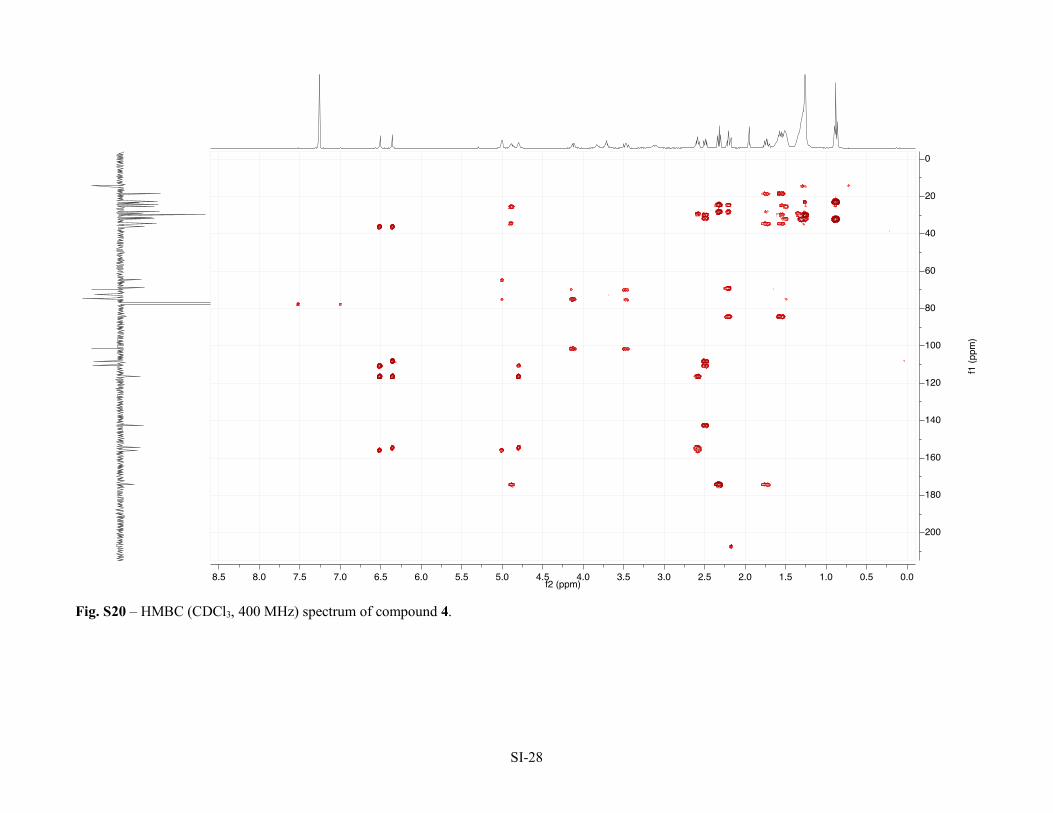
SI-28
Fig. S20 – HMBC (CDCl3, 400 MHz) spectrum of compound 4.
0.00.51.01.52.02.53.03.54.04.55.05.56.06.57.07.58.08.5f2 (ppm)
0
20
40
60
80
100
120
140
160
180
200
f1 (
ppm
)
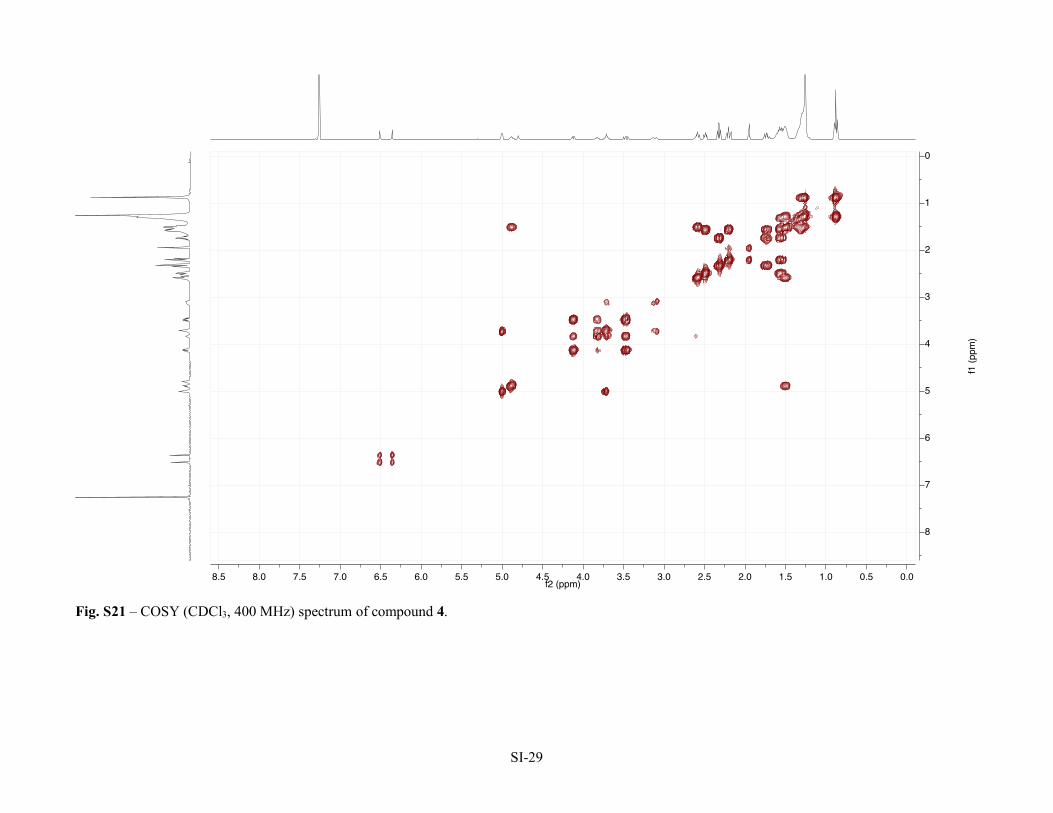
SI-29
Fig. S21 – COSY (CDCl3, 400 MHz) spectrum of compound 4.
0.00.51.01.52.02.53.03.54.04.55.05.56.06.57.07.58.08.5f2 (ppm)
0
1
2
3
4
5
6
7
8
f1 (
ppm
)

SI-30
Table S3 – NMR Spectroscopic Data (1H 400 MHz, 13C 100 MHz, CDCl3) for bartoloside A-17-yl palmitate (7a).
position δc type δHa mult, J (Hz) HMBCb COSY 1 155.8 C 2 116.2 C 3 154.3 C-OH 4 110.4 CH 6.36 s 154.3, 116.2, 108.1, 35.9 6.51 5 142.3 C 6 108.1 CH 6.51 s 155.8, 116.2, 110.4, 35.9 6.36 7 101.4 CH 5.01 d, 5.7 155.8 3.72, 3.70 8 72.6 CH-OH 3.72 m 101.4, 74.9 5.01, 3.83 9 74.9 CH-OH 3.70 m 72.6, 69.8 5.01, 3.83 10 69.8 CH-OH 3.83 m 4.13, 3.72, 3.70, 3.48 11 64.6 CH2 4.13/3.48 dd, 11.9, 4.4/dd, 11.9, 8.0 101.4, 74.9/101.4, 69.8 3.83, 3.48/4.13, 3.83 12 23.2 CH2 2.58 t, 7.7 155.8, 154.3, 116.2, 29.2 1.51, 1.51-1.50 13 29.2 CH2 1.51 m 2.58 14, 20, 26, 32, 33, 4'-13' 29.9-28.9 15 × CH2 1.27-1.24 m 29.9-28.9, 22.8-22.7 1.51-1.50, 0.88 15a, 19a 25.2 2 × CH2 1.61-1.60 29.9-28.9 2.28, 1.30-1.28 15b, 19b 1.30-1.28 32.1-31.9, 29.9-28.9, 22.8-22.7 1.61-1.60, 1.51-1.50 16a, 18a 34.3 2 × CH2 1.51-1.50 m 4.88, 1.30-1.28, 1.41-1.40 16b, 18b 1.27-1.24 m 29.9-28.9 1.51-1.50 17 74.5 CH 4.88 p, 6.4 174.7, 25.2 1.51-1.50 21, 34, 14' 32.1-31.9 3 × CH2 1.27-1.24 m 29.9-28.9, 22.8-22.7 1.51-1.50, 0.88 22, 35, 15' 22.8-22.7 3 × CH2 1.30-1.28 m 32.1-31.9, 29.9-28.9, 22.8-22.7 1.61-1.60, 0.88 23, 36, 16' 14.3-14.2 3 × CH3 0.88 m 32.1-31.9, 22.8-22.7 1.30-1.28 24 35.9 CH2 2.50 t, 7.7 142.3, 110.4, 108.1, 31.2 1.58 25 31.2 CH2 1.58 m 2.50 27a, 31a 26.6 2 × CH2 1.51-1.50 m 1.7, 1.41-1.40 27b, 31b 1.41-1.40 m 1.51-1.50 28/30 38.7 2 × CH2 1.70 m 64.5 3.88, 1.51-1.50 29 64.5 CH-Cl 3.88 m 26.6 1.70 1' 174.7 C 2' 35.0 CH2 2.28 t, 7.5 174.7, 29.9-28.9, 25.3 1.61-1.60 3' 25.3 CH2 1.61-1.60 m 29.9-28.9 2.28
afrom HSQC; bfrom proton to indicated carbon.
O
O
HOOH
OH
HO
O
O
Cl1
23
4
5
678
9
1011
12
13
14
15
16
17
18
19
20
21
22
23
24
25
26
27
28
29
30
31
32
33
34
35
361'
2'
3'
4'
5'
6'
7'
8'
9'
10'
11'
12'
13'
14'
15'
16'
7a

SI-31
Fig. S22 – 1H NMR (CDCl3, 400 MHz) spectrum of compound 7a.
0.00.51.01.52.02.53.03.54.04.55.05.56.06.57.07.58.08.5f1 (ppm)
9.5
3
52
.66
15
.93
4.8
2
2.1
2
2.2
02
.14
1.0
0
2.0
8
1.9
5
0.9
7
0.7
41
.05
0.8
6
0.9
1
0.9
6

SI-32
Fig. S23 – 13C NMR (APT, CDCl3, 100 MHz) spectrum of compound 7a.
0102030405060708090100110120130140150160170180190200210f1 (ppm)
14
.15
14
.21
22
.70
22
.74
22
.84
23
.22
25
.16
25
.24
25
.32
26
.58
26
.63
28
.89
29
.01
29
.05
29
.19
29
.33
29
.34
29
.44
29
.46
29
.51
29
.66
29
.78
29
.82
29
.86
31
.22
31
.85
31
.87
32
.08
34
.31
34
.99
35
.93
38
.65
38
.71
69
.76
72
.63
74
.54
74
.88
10
1.4
4
10
8.0
711
0.4
011
6.1
9
14
2.2
6
15
4.2
81
55
.78
17
4.7
1

SI-33
Fig. S24 – HSQC ( CDCl3, 400 MHz) spectrum of compound 7a.
0.00.51.01.52.02.53.03.54.04.55.05.56.06.57.07.58.0f2 (ppm)
0
50
100
150
f1 (
ppm
)
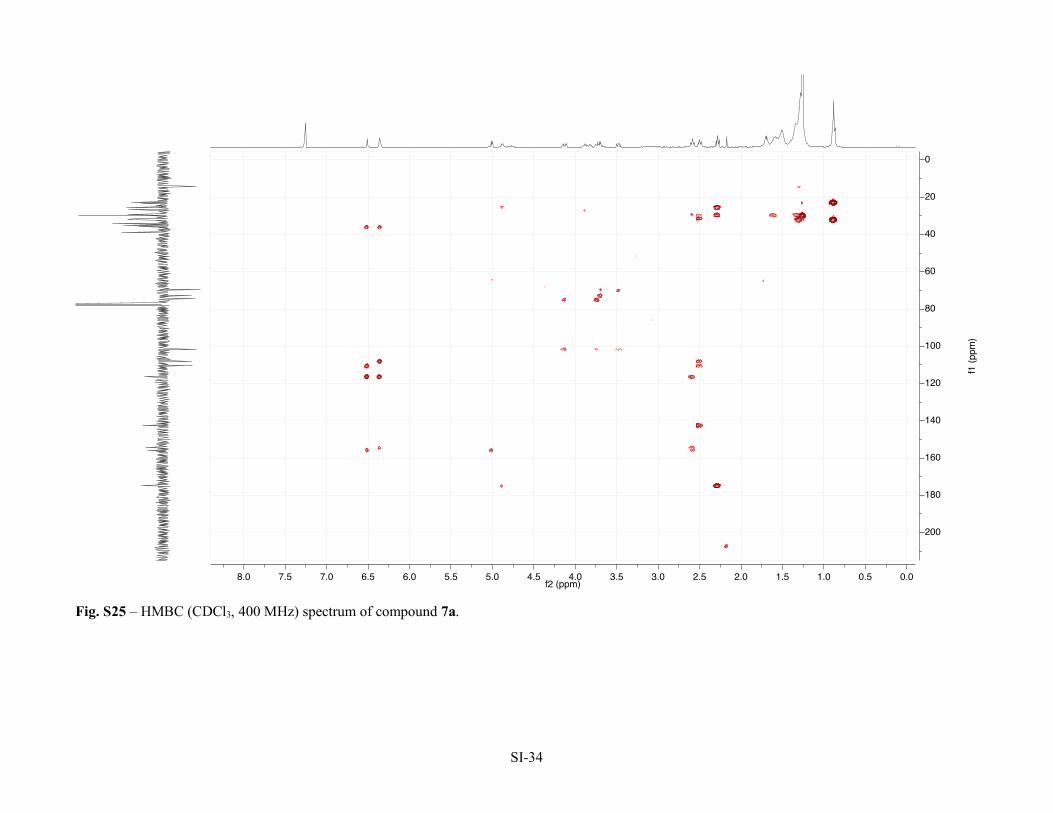
SI-34
Fig. S25 – HMBC (CDCl3, 400 MHz) spectrum of compound 7a.
0.00.51.01.52.02.53.03.54.04.55.05.56.06.57.07.58.0f2 (ppm)
0
20
40
60
80
100
120
140
160
180
200
f1 (
ppm
)
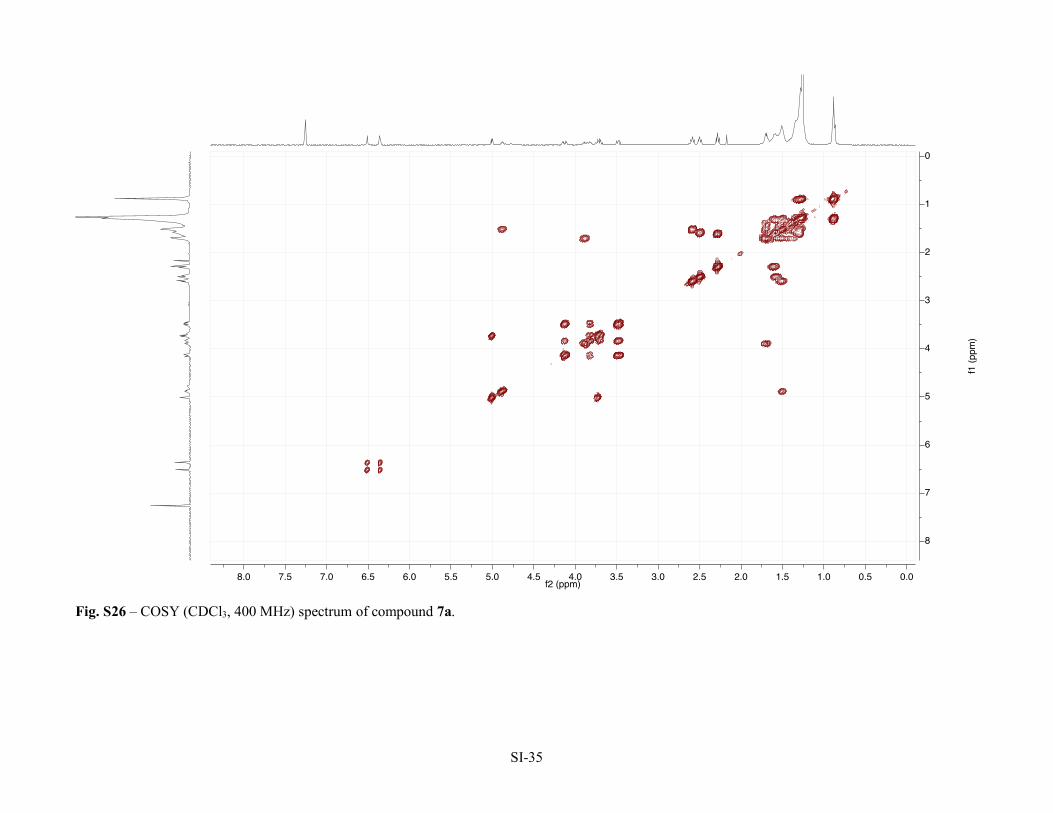
SI-35
Fig. S26 – COSY (CDCl3, 400 MHz) spectrum of compound 7a.
0.00.51.01.52.02.53.03.54.04.55.05.56.06.57.07.58.0f2 (ppm)
0
1
2
3
4
5
6
7
8
f1 (
ppm
)

download fileview on ChemRxivPreprint_Reis_et_al_2019_SI.pdf (3.91 MiB)