brown university · brown university . auditors’ reports as required by office of management and...
TRANSCRIPT

BROWN UNIVERSITY
Auditors’ Reports as Required by Office of
Management and Budget (OMB) Circular A-133 and
Government Auditing Standards and Related Information
Year ended June 30, 2014
BROWN UNIVERSITY
Auditors’ Reports as Required by Office of
Management and Budget (OMB) Circular A-133 and
Government Auditing Standards and Related Information
Year ended June 30, 2014
Table of Contents
Page
Financial Statements and Schedule of Expenditures of Federal Awards
Independent Auditors’ Report 1
Financial Statements and Related Notes 3
Supplementary Schedule of Expenditures of Federal Awards and Related Notes 29
Reports on Compliance and Internal Control
Independent Auditors’ Report on Internal Control Over Financial Reporting and on Compliance
and Other Matters Based on an Audit of Financial Statements Performed in Accordance with
Government Auditing Standards 38
Independent Auditors’ Reports on Compliance for Each Major Federal Program and Report on
Internal Control Over Compliance Required OMB Circular A-133, Audits of States, Local
Governments, and Non-Profit Organizations 40
Findings and Questioned Costs
Schedule of Findings and Questioned Costs 42
Independent Auditors’ Report
The President and Corporation
Brown University:
Report on the Financial Statements
We have audited the accompanying financial statements of Brown University (the University), which
comprise the balance sheets as of June 30, 2014 and 2013, the related statements of activities and cash
flows for the years then ended, and the related notes to the financial statements.
Management’s Responsibility for the Financial Statements
Management is responsible for the preparation and fair presentation of these financial statements in
accordance with U.S. generally accepted accounting principles; this includes the design, implementation,
and maintenance of internal control relevant to the preparation and fair presentation of financial statements
that are free from material misstatement, whether due to fraud or error.
Auditors’ Responsibility
Our responsibility is to express an opinion on these financial statements based on our audit. We conducted
our audit in accordance with auditing standards generally accepted in the United States of America and the
standards applicable to financial audits contained in Government Auditing Standards, issued by the
Comptroller General of the United States. Those standards require that we plan and perform the audit to
obtain reasonable assurance about whether the financial statements are free from material misstatement.
An audit involves performing procedures to obtain audit evidence about the amounts and disclosures in the
financial statements. The procedures selected depend on the auditors’ judgment, including the assessment
of the risks of material misstatement of the financial statements, whether due to fraud or error. In making
those risk assessments, the auditor considers internal control relevant to the entity’s preparation and fair
presentation of the financial statements in order to design audit procedures that are appropriate in the
circumstances, but not for the purpose of expressing an opinion on the effectiveness of the entity’s internal
control. Accordingly, we express no such opinion. An audit also includes evaluating the appropriateness of
accounting policies used and the reasonableness of significant accounting estimates made by management,
as well as evaluating the overall presentation of the financial statements.
We believe that the audit evidence we have obtained is sufficient and appropriate to provide a basis for our
audit opinion.
Opinion
In our opinion, the financial statements referred to above present fairly, in all material respects, the
financial position of Brown University as of June 30, 2014 and 2013, and the changes in its net assets and
its cash flows for the years then ended in accordance with U.S. generally accepted accounting principles.
KPMG LLP 6th Floor, Suite A 100 Westminster Street Providence, RI 02903-2321
KPMG LLP is a Delaware limited liability partnership, the U.S. member firm of KPMG International Cooperative (“KPMG International”), a Swiss entity.
2
Other Matter – Supplementary Information
Our audit was conducted for the purpose of forming an opinion on the financial statements as a whole. The
accompanying supplementary schedule of expenditures of federal awards is presented for purposes of
additional analysis, as required by Office of Management and Budget Circular A-133, Audits of States,
Local Governments, and Non-Profit Organizations, and is not a required part of the financial statements.
Such information is the responsibility of management and was derived from and relates directly to the
underlying accounting and other records used to prepare the financial statements. The information has been
subjected to the auditing procedures applied in the audit of the financial statements and certain additional
procedures, including comparing and reconciling such information directly to the underlying accounting
and other records used to prepare the financial statements or to the financial statements themselves, and
other additional procedures in accordance with auditing standards generally accepted in the United States
of America. In our opinion, the supplementary schedule of expenditure of federal awards is fairly stated, in
all material respects, in relation to the financial statements as a whole.
Other Reporting Required by Government Auditing Standards
In accordance with Government Auditing Standards, we have also issued our report dated October 24,
2014 on our consideration of the University’s internal control over financial reporting and on our tests of
its compliance with certain provisions of laws, regulations, contracts, and grant agreements and other
matters. The purpose of that report is to describe the scope of our testing of internal control over financial
reporting and compliance and the results of that testing, and not to provide an opinion on internal control
over financial reporting or on compliance. That report is an integral part of an audit performed in
accordance with Government Auditing Standards in considering the University’s internal control over
financial reporting and compliance.
October 24, 2014, except as to the supplementary schedule of expenditures of federal awards, which is as
of February 20, 2015

3
BROWN UNIVERSITY
Balance Sheets
June 30, 2014 and 2013
(Dollars in thousands)
Assets 2014 2013
Cash and cash equivalents $ 25,546 14,009 Receivables for investments sold 12,232 21,287 Accounts receivable and other assets 47,697 38,535 Contributions receivable, net 159,998 146,051 Notes receivable, net 32,133 32,960 Funds held in trust by others 114,239 66,463 Investments 3,485,789 3,076,163 Land, buildings and equipment, net 1,048,118 1,019,875
Total assets $ 4,925,752 4,415,343
Liabilities and Net Assets
Liabilities:Accounts payable and accrued liabilities $ 56,724 46,182 Liabilities associated with investments 8,056 7,276 Student deposits and grant advances 58,767 52,913 Federal student loan advances 24,428 24,590 Split-interest obligations 18,737 26,640 Other long-term obligations 54,205 54,242 Bonds, loans and notes payable 852,088 751,335
Total liabilities 1,073,005 963,178
Net assets:Unrestricted 1,002,498 934,271 Temporarily restricted 1,516,971 1,262,860 Permanently restricted 1,333,278 1,255,034
Total net assets 3,852,747 3,452,165 Total liabilities and net assets $ 4,925,752 4,415,343
See accompanying notes to financial statements.
4
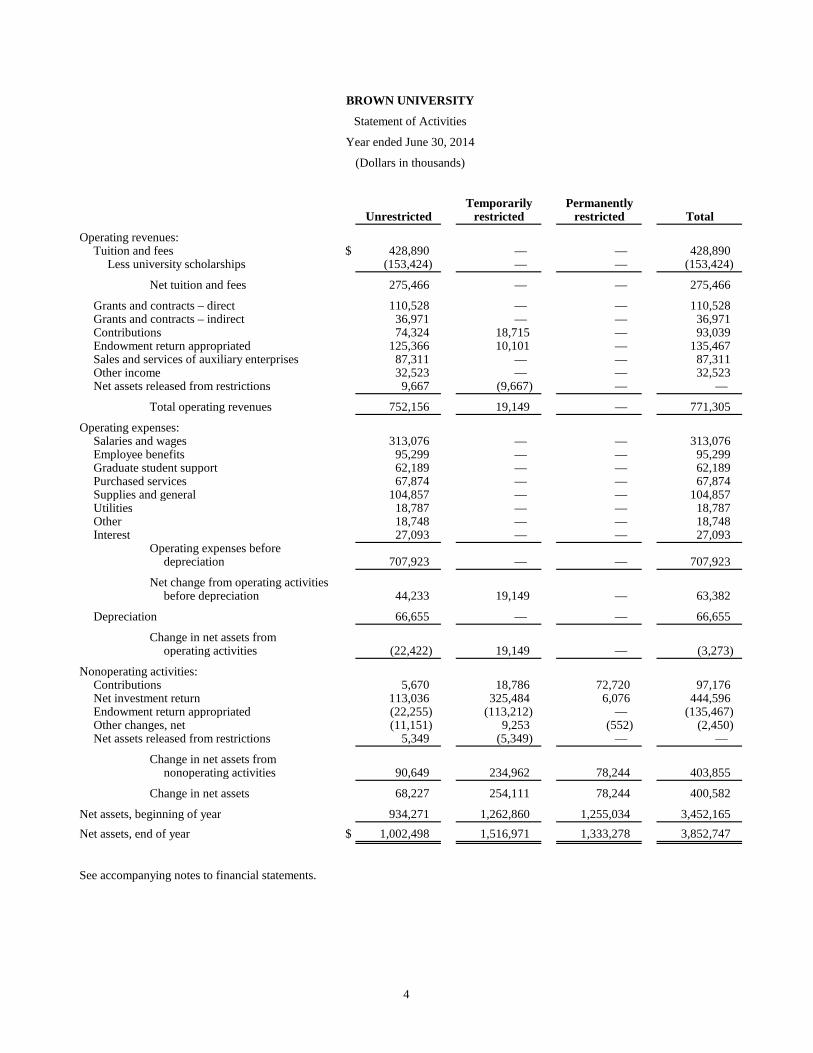
BROWN UNIVERSITY
Statement of Activities
Year ended June 30, 2014
(Dollars in thousands)
Temporarily PermanentlyUnrestricted restricted restricted Total
Operating revenues:Tuition and fees $ 428,890 — — 428,890
Less university scholarships (153,424) — — (153,424)
Net tuition and fees 275,466 — — 275,466
Grants and contracts – direct 110,528 — — 110,528 Grants and contracts – indirect 36,971 — — 36,971 Contributions 74,324 18,715 — 93,039 Endowment return appropriated 125,366 10,101 — 135,467 Sales and services of auxiliary enterprises 87,311 — — 87,311 Other income 32,523 — — 32,523 Net assets released from restrictions 9,667 (9,667) — —
Total operating revenues 752,156 19,149 — 771,305
Operating expenses:Salaries and wages 313,076 — — 313,076 Employee benefits 95,299 — — 95,299 Graduate student support 62,189 — — 62,189 Purchased services 67,874 — — 67,874 Supplies and general 104,857 — — 104,857 Utilities 18,787 — — 18,787 Other 18,748 — — 18,748 Interest 27,093 — — 27,093
Operating expenses beforedepreciation 707,923 — — 707,923
Net change from operating activitiesbefore depreciation 44,233 19,149 — 63,382
Depreciation 66,655 — — 66,655
Change in net assets fromoperating activities (22,422) 19,149 — (3,273)
Nonoperating activities:Contributions 5,670 18,786 72,720 97,176 Net investment return 113,036 325,484 6,076 444,596 Endowment return appropriated (22,255) (113,212) — (135,467) Other changes, net (11,151) 9,253 (552) (2,450) Net assets released from restrictions 5,349 (5,349) — —
Change in net assets fromnonoperating activities 90,649 234,962 78,244 403,855
Change in net assets 68,227 254,111 78,244 400,582
Net assets, beginning of year 934,271 1,262,860 1,255,034 3,452,165 Net assets, end of year $ 1,002,498 1,516,971 1,333,278 3,852,747
See accompanying notes to financial statements.

5
BROWN UNIVERSITY
Statement of Activities
Year ended June 30, 2013
(Dollars in thousands)
Temporarily PermanentlyUnrestricted restricted restricted Total
Operating revenues:Tuition and fees $ 400,020 — — 400,020
Less university scholarships (138,398) — — (138,398)
Net tuition and fees 261,622 — — 261,622
Grants and contracts – direct 121,931 — — 121,931 Grants and contracts – indirect 40,355 — — 40,355 Contributions 55,527 14,978 — 70,505 Endowment return appropriated 119,966 5,892 — 125,858 Sales and services of auxiliary enterprises 84,947 — — 84,947 Other income 31,752 — — 31,752 Net assets released from restrictions 3,137 (3,137) — —
Total operating revenues 719,237 17,733 — 736,970
Operating expenses:Salaries and wages 297,094 — — 297,094 Employee benefits 92,268 — — 92,268 Graduate student support 58,869 — — 58,869 Purchased services 63,320 — — 63,320 Supplies and general 95,355 — — 95,355 Utilities 17,567 — — 17,567 Other 18,797 — — 18,797 Interest 22,495 — — 22,495
Operating expenses beforedepreciation 665,765 — — 665,765
Net change from operating activitiesbefore depreciation 53,472 17,733 — 71,205
Depreciation 66,597 — — 66,597
Change in net assets fromoperating activities (13,125) 17,733 — 4,608
Nonoperating activities:Contributions 50,966 9,065 64,185 124,216 Net investment return 72,772 212,013 4,592 289,377 Endowment return appropriated (21,867) (103,991) — (125,858) Other changes, net 125,173 (132,145) 4,195 (2,777) Net assets released from restrictions 2,611 (2,611) — —
Change in net assets fromnonoperating activities 229,655 (17,669) 72,972 284,958
Change in net assets 216,530 64 72,972 289,566
Net assets, beginning of year 717,741 1,262,796 1,182,062 3,162,599 Net assets, end of year $ 934,271 1,262,860 1,255,034 3,452,165
See accompanying notes to financial statements.
6
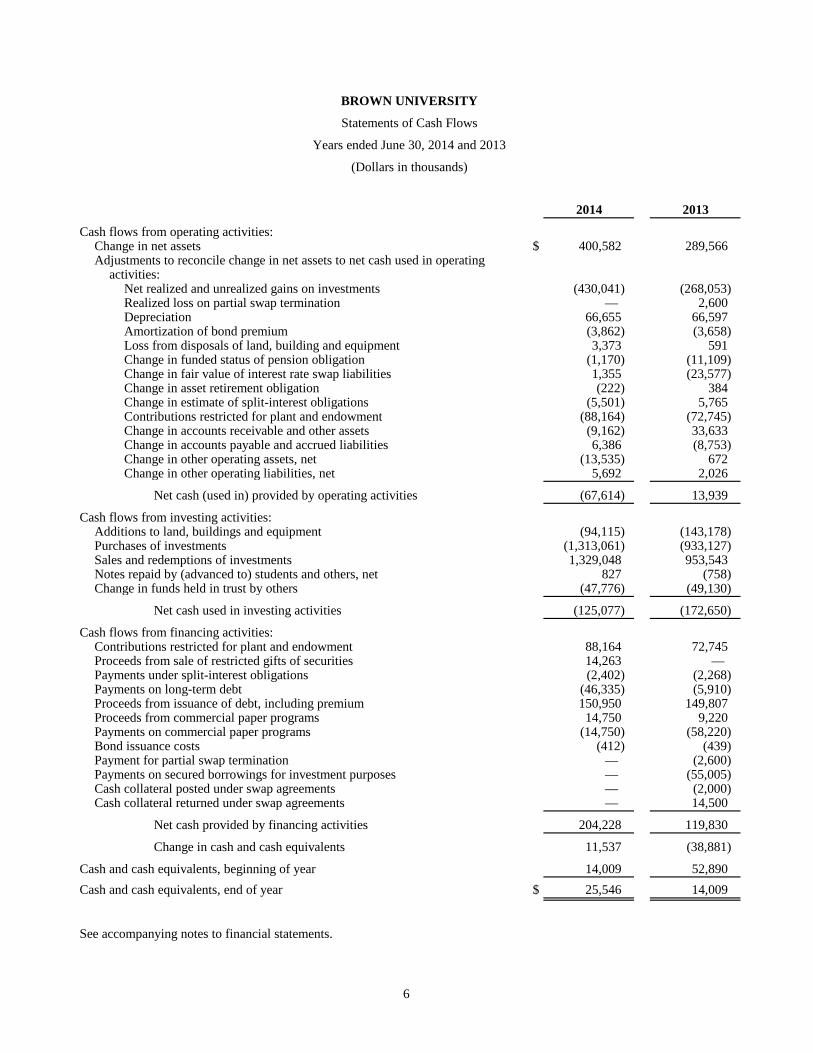
BROWN UNIVERSITY
Statements of Cash Flows
Years ended June 30, 2014 and 2013
(Dollars in thousands)
2014 2013
Cash flows from operating activities:Change in net assets $ 400,582 289,566 Adjustments to reconcile change in net assets to net cash used in operating
activities:Net realized and unrealized gains on investments (430,041) (268,053) Realized loss on partial swap termination — 2,600 Depreciation 66,655 66,597 Amortization of bond premium (3,862) (3,658) Loss from disposals of land, building and equipment 3,373 591 Change in funded status of pension obligation (1,170) (11,109) Change in fair value of interest rate swap liabilities 1,355 (23,577) Change in asset retirement obligation (222) 384 Change in estimate of split-interest obligations (5,501) 5,765 Contributions restricted for plant and endowment (88,164) (72,745) Change in accounts receivable and other assets (9,162) 33,633 Change in accounts payable and accrued liabilities 6,386 (8,753) Change in other operating assets, net (13,535) 672 Change in other operating liabilities, net 5,692 2,026
Net cash (used in) provided by operating activities (67,614) 13,939
Cash flows from investing activities:Additions to land, buildings and equipment (94,115) (143,178) Purchases of investments (1,313,061) (933,127) Sales and redemptions of investments 1,329,048 953,543 Notes repaid by (advanced to) students and others, net 827 (758) Change in funds held in trust by others (47,776) (49,130)
Net cash used in investing activities (125,077) (172,650)
Cash flows from financing activities:Contributions restricted for plant and endowment 88,164 72,745 Proceeds from sale of restricted gifts of securities 14,263 — Payments under split-interest obligations (2,402) (2,268) Payments on long-term debt (46,335) (5,910) Proceeds from issuance of debt, including premium 150,950 149,807 Proceeds from commercial paper programs 14,750 9,220 Payments on commercial paper programs (14,750) (58,220) Bond issuance costs (412) (439) Payment for partial swap termination — (2,600) Payments on secured borrowings for investment purposes — (55,005) Cash collateral posted under swap agreements — (2,000) Cash collateral returned under swap agreements — 14,500
Net cash provided by financing activities 204,228 119,830
Change in cash and cash equivalents 11,537 (38,881)
Cash and cash equivalents, beginning of year 14,009 52,890 Cash and cash equivalents, end of year $ 25,546 14,009
See accompanying notes to financial statements.

BROWN UNIVERSITY
Notes to Financial Statements
June 30, 2014 and 2013
(Dollars in thousands)
7 (Continued)
(1) Summary of Significant Accounting Policies
(a) Organization
Brown University is a private, not-for-profit, nonsectarian, co-educational institution of higher
education with approximately 6,400 undergraduate students and 2,400 graduate and medical
students. Established in 1764, Brown University offers educational programs for undergraduates in
liberal arts and engineering, professional training for students pursuing a career in medicine, and
graduate education and training in the arts and sciences, engineering and medicine.
(b) Basis of Presentation and Tax Status
The accompanying financial statements are presented on the accrual basis of accounting in
accordance with U.S. generally accepted accounting principles (GAAP) and present balances and
transactions according to the existence or absence of donor-imposed restrictions.
The John Nicholas Brown Center for the Study of American Civilization; Fairview Incorporated, a
real estate holding company; KARING, a Rhode Island not-for-profit corporation that holds certain
property of the Warren Alpert Medical School; and Brown Cayman I, a Cayman Islands corporation
that holds certain investment funds, are all separate legal entities that are consolidated in the
financial statements. Brown University and these consolidated entities are collectively referred to
herein as the University. All significant inter-entity transactions and balances have been eliminated.
The University is a not-for-profit organization as described in Section 501(c)(3) of the Internal
Revenue Code, as amended, and is generally exempt from income taxes. The University assesses
uncertain tax positions and determined that there are no such positions that have a material effect on
the financial statements.
(c) Classification of Net Assets
The University is incorporated in and subject to the laws of Rhode Island, which contain the
provisions outlined in the Uniform Prudent Management of Institutional Funds Act (UPMIFA).
Under UPMIFA, the net assets of a donor-restricted endowment fund may be appropriated for
expenditure by the Corporation of the University (the Corporation) in accordance with the standard
of prudence prescribed by UPMIFA. The University has classified its net assets as follows:
Permanently restricted net assets contain donor-imposed stipulations that neither expire with
the passage of time nor can be fulfilled or otherwise removed by actions of the University and
primarily consist of the historic dollar value of contributions to establish or add to
donor-restricted endowment funds.
Temporarily restricted net assets contain donor-imposed stipulations as to the timing of their
availability or use for a particular purpose. These net assets are released from restrictions when
the specified time elapses or actions have been taken to meet the restrictions. Net assets of
donor-restricted endowment funds in excess of their historic dollar value are classified as
temporarily restricted net assets until appropriated by the Corporation and spent in accordance
with the standard of prudence imposed by UPMIFA.

BROWN UNIVERSITY
Notes to Financial Statements
June 30, 2014 and 2013
(Dollars in thousands)
8 (Continued)
Unrestricted net assets contain no donor-imposed restrictions and are available for the general
operations of the University. Such net assets may be designated by the Corporation for specific
purposes, including to function as endowment funds.
(d) Fair Value Measurements
Investments, funds held in trust by others, and interest rate swaps are reported at fair value in the
University’s financial statements. Fair value represents the price that would be received upon the sale
of an asset or paid upon the transfer of a liability in an orderly transaction between market
participants as of the measurement date. The University uses a three-tiered hierarchy to categorize
those assets and liabilities based on the valuation methodologies employed. In addition, classification
of certain alternative investments within the fair value hierarchy is based on the University’s ability
to timely redeem its interest rather than the valuation inputs. The hierarchy is defined as follows:
Level 1 – Valuation based on quoted prices (unadjusted) in active markets that are accessible
at the measurement date for assets or liabilities;
Level 2 – Valuations based on inputs other than quoted prices that are observable for the asset
or liability either directly or indirectly, and also includes alternative investments redeemable
on or near the measurement date; and
Level 3 – Valuation based on unobservable inputs used in situations in which little or no
market data is available, and also includes alternative investments not redeemable near the
measurement date.
The fair value hierarchy gives the highest priority to Level 1 inputs and the lowest priority to Level 3
inputs. The University utilizes valuation techniques that maximize the use of observable inputs and
minimize the use of unobservable inputs to the extent possible. Transfers between categories occur
when there is an event that changes the inputs used to measure the fair value of an asset or liability,
or when alternative investments become more or less redeemable because of term or other changes.
Transfers between fair value categories are recognized at the end of the reporting period.
(e) Statements of Activities
The statements of activities separately report changes in net assets from operating and nonoperating
activities. Operating activities consist principally of revenues and expenses related to ongoing
educational and research programs, including endowment return appropriated by the Corporation to
support those programs. Nonoperating activities consist of net investment return, an offset for
endowment return appropriated for operating activities, changes in fair values of interest rate swaps
and early termination thereof, change in pension plan and other long-term obligations, contributions
for long-term purposes and other programs, net assets released from donor restrictions for property
placed in service, and other activities not in direct support of annual operations.
BROWN UNIVERSITY
Notes to Financial Statements
June 30, 2014 and 2013
(Dollars in thousands)
9 (Continued)
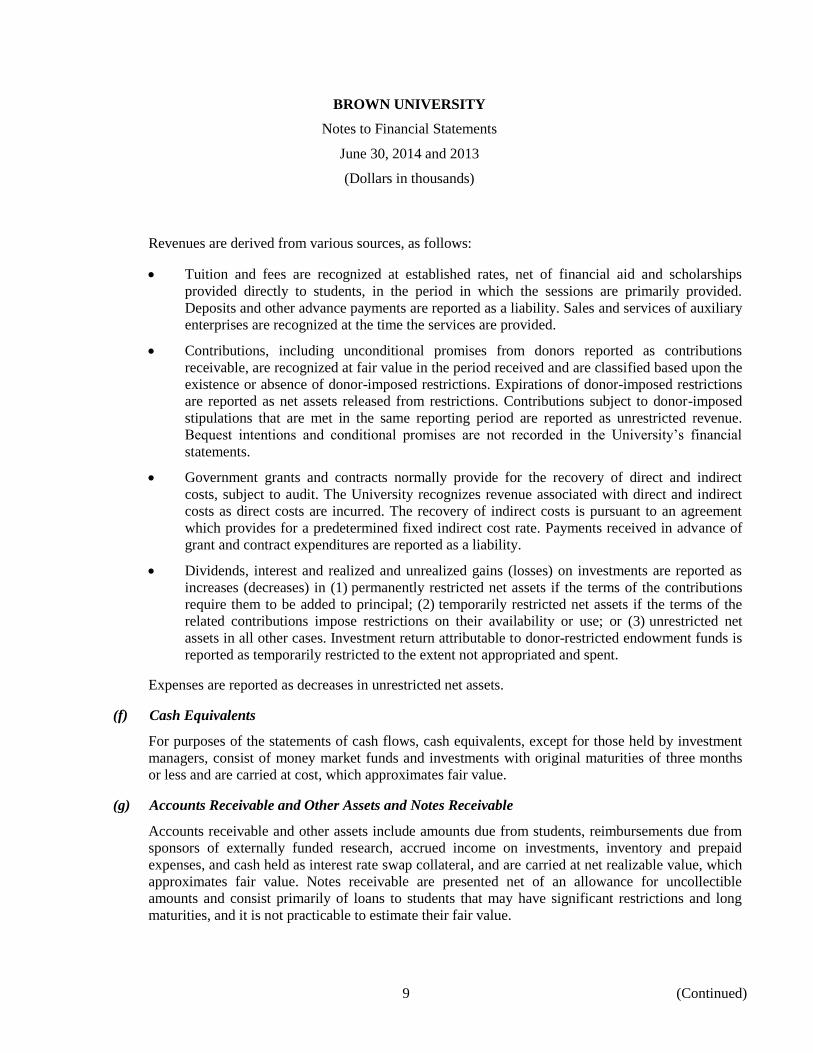
Revenues are derived from various sources, as follows:
Tuition and fees are recognized at established rates, net of financial aid and scholarships
provided directly to students, in the period in which the sessions are primarily provided.
Deposits and other advance payments are reported as a liability. Sales and services of auxiliary
enterprises are recognized at the time the services are provided.
Contributions, including unconditional promises from donors reported as contributions
receivable, are recognized at fair value in the period received and are classified based upon the
existence or absence of donor-imposed restrictions. Expirations of donor-imposed restrictions
are reported as net assets released from restrictions. Contributions subject to donor-imposed
stipulations that are met in the same reporting period are reported as unrestricted revenue.
Bequest intentions and conditional promises are not recorded in the University’s financial
statements.
Government grants and contracts normally provide for the recovery of direct and indirect
costs, subject to audit. The University recognizes revenue associated with direct and indirect
costs as direct costs are incurred. The recovery of indirect costs is pursuant to an agreement
which provides for a predetermined fixed indirect cost rate. Payments received in advance of
grant and contract expenditures are reported as a liability.
Dividends, interest and realized and unrealized gains (losses) on investments are reported as
increases (decreases) in (1) permanently restricted net assets if the terms of the contributions
require them to be added to principal; (2) temporarily restricted net assets if the terms of the
related contributions impose restrictions on their availability or use; or (3) unrestricted net
assets in all other cases. Investment return attributable to donor-restricted endowment funds is
reported as temporarily restricted to the extent not appropriated and spent.
Expenses are reported as decreases in unrestricted net assets.
(f) Cash Equivalents
For purposes of the statements of cash flows, cash equivalents, except for those held by investment
managers, consist of money market funds and investments with original maturities of three months
or less and are carried at cost, which approximates fair value.
(g) Accounts Receivable and Other Assets and Notes Receivable
Accounts receivable and other assets include amounts due from students, reimbursements due from
sponsors of externally funded research, accrued income on investments, inventory and prepaid
expenses, and cash held as interest rate swap collateral, and are carried at net realizable value, which
approximates fair value. Notes receivable are presented net of an allowance for uncollectible
amounts and consist primarily of loans to students that may have significant restrictions and long
maturities, and it is not practicable to estimate their fair value.

BROWN UNIVERSITY
Notes to Financial Statements
June 30, 2014 and 2013
(Dollars in thousands)
10 (Continued)
(h) Land, Buildings and Equipment
Land, buildings and equipment are stated at cost of acquisition or construction (including capitalized
interest) or, to the extent received as a gift, at estimated fair value at the time of receipt, and are
presented net of accumulated depreciation. All other expenditures for maintenance and repairs are
charged to operating activities as incurred.
Depreciation is calculated using the straight-line method with estimated useful lives of
30-to-40 years for buildings, 20-to-30 years for building improvements, and 3-to-15 years for
equipment, depending upon asset class.
(i) Fund Held in Trust by Others
Funds held in trust by others represent funds that are held and administered by outside trustees,
including perpetual trusts established by donors of $13,988 and $12,848 at June 30, 2014 and 2013,
respectively. The University receives all or a specified portion of the return on the underlying assets
of such trusts, which is primarily restricted for scholarships. The University will never receive the
assets held in trust. These are classified in Level 3 in the fair value hierarchy because they are held
by the trustees in perpetuity. Other trusteed funds of $100,251 and $53,615 at June 30, 2014 and
2013, respectively, represent debt proceeds to be utilized for construction projects or otherwise
required to be held in reserve in accordance with debt or similar agreements. These are classified in
Level 1 in the fair value hierarchy because the underlying securities held by the trustee are based on
quoted market prices.
(j) Federal Student Loan Advances
The University holds certain amounts advanced by the U.S. government under the Federal Perkins
Loan Program and the Health Professions Student Loan Program (the Programs). Such amounts may
be re-loaned by the University after collection; however, in the event that the University no longer
participates in the Programs, the amounts are generally refundable to the U.S. government.
(k) Collections
The University’s collections include works of art, historical treasures, and artifacts that are
maintained in the University’s libraries and museums. These collections are protected and preserved
for education and research purposes. The collections are not recognized as assets in the financial
statements of the University.
(l) Liabilities Associated with Investments
Liabilities associated with investments include the fair value of credit default swaps in 2014 and
payables for securities purchased in 2013.

BROWN UNIVERSITY
Notes to Financial Statements
June 30, 2014 and 2013
(Dollars in thousands)
11 (Continued)
(m) Other Long-Term Obligations
Other long-term obligations include the funded status of the defined benefit pension plan of $12,800
and $13,970 at June 30, 2014 and 2013, respectively; the interest-rate swap liability of $29,170 and
$27,815 at June 30, 2014 and 2013, respectively; and the asset retirement obligation of $12,235 and
$12,457 at June 30, 2014 and 2013, respectively.
(n) Use of Estimates
The preparation of financial statements requires management to make estimates and assumptions that
affect the reported amounts of assets and liabilities and disclosures of contingent assets and liabilities
at the dates of the financial statements, and the reported amounts of revenues and expenses during
the reporting periods. Actual results could differ from those estimates.
(o) Reclassifications
Certain 2013 financial information has been reclassified to conform to the 2014 presentation.
(2) Contributions Receivable
The University’s contributions receivable are recognized net of discounts at rates commensurate with the
risks involved and after allowance for uncollectibles are reported at net realizable value, which
approximates fair value. Contributions receivable were as follows at June 30:
2014 2013
Contributions expected to be received in:Less than one year $ 50,689 57,596 Between one and five years 122,448 101,819 More than five years 9,665 9,818
Gross contributions receivable 182,802 169,233
Unamortized discount (at rates ranging from 0.1% to 2.5%)and allowance for uncollectibles (22,804) (23,182)
Contributions receivable, net $ 159,998 146,051
(3) Investments
Investment Strategy
In addition to traditional stocks and fixed-income securities, the University may also hold shares or units in
institutional funds as well as in alternative investment funds involving hedged, private equity and real asset
strategies. Hedged strategies involve funds whose managers have the authority to invest in various asset
classes at their discretion, including the ability to invest long and short. Funds with hedged strategies
generally hold securities or other financial instruments for which a ready market exists and may include
stocks, bonds, put or call options, swaps, currency hedges and other instruments, and are valued
accordingly. Private equity funds employ buyout and venture capital strategies and may focus on

BROWN UNIVERSITY
Notes to Financial Statements
June 30, 2014 and 2013
(Dollars in thousands)
12 (Continued)
investments in turn-around situations. Real asset funds generally hold interests in public real estate
investment trusts (REITs), commercial properties or commodities, or oil and gas, generally through
commingled funds. Private equity and real asset strategies therefore often require the estimation of fair
values by fund managers in the absence of readily determinable market values.
Investments also include assets related to donor annuities, pooled income funds, and charitable remainder
trusts. Certain of these funds are held in trust by the University for one or more beneficiaries who are
generally paid lifetime income, after which the principal is made available to the University in accordance
with donor restrictions, if any. The assets are reported at fair value and related liabilities, which are
reported as split-interest obligations, represent the present value of estimated future payments to
beneficiaries.
Basis of Reporting
Investments are reported at estimated fair value. If an investment is held directly by the University and an
active market with quoted prices exists, the market price of an identical security is used to report fair value.
Fair values for shares in registered mutual funds are based on published share prices. The University’s
interests in alternative investment funds are generally reported at the net asset value (NAV) reported by the
fund managers and assessed as reasonable by the University, which is used as a practical expedient to
estimate the fair value of the University’s interest therein, unless it is probable that all or a portion of the
investment will be sold for an amount different from NAV. At June 30, 2014, the sale of 21 private real
assets fund interests was in negotiation. The purchase and sale agreement was signed on July 29, 2014 to
sell the interests at a price other than NAV. Accordingly, at June 30, 2014, the fair value of such funds has
been reflected at the final negotiated sale price. As of June 30, 2013, the University had no plans or
intentions to sell investments at amounts different from NAV.
Because of the inherent uncertainties of valuation, these estimated fair values may differ significantly from
values that would have been used had a ready market existed, and the differences could be material. Such
valuations are determined by fund managers and generally consider variables such as operating results,
comparable earnings multiples, projected cash flows, recent sales prices, and other pertinent information,
and may reflect discounts for the illiquid nature of certain investments held.

BROWN UNIVERSITY
Notes to Financial Statements
June 30, 2014 and 2013
(Dollars in thousands)
13 (Continued)
The following tables summarize the University’s investments within the fair value hierarchy by strategy
type as of June 30, 2014 and 2013:
June 30, 2014
Level 1 Level 2 Level 3 Total
Investments:
Equities:
U.S. equities $ 27,025 135,321 70,485 232,831
Non-U.S. equity funds 210,933 243,301 7,719 461,953
Fixed income:
Domestic 6,427 131,517 196,754 334,698
U.S. Treasury inflation-protected — 7,546 15,093 22,639
Hedged strategies:
General arbitrage funds 39,629 125,636 80,951 246,216
Distressed funds — — 18,675 18,675
Global/Non-U.S. funds — 48,534 714,316 762,850
Private equity:
Buy-out funds — — 419,697 419,697
Venture funds — — 245,296 245,296
Real assets:
Real estate and timber 1,806 92,232 102,547 196,585
Commodities, oil and gas — 86,079 87,021 173,100
Cash and cash equivalents 371,249 — — 371,249
Total $ 657,069 870,166 1,958,554 3,485,789
BROWN UNIVERSITY
Notes to Financial Statements
June 30, 2014 and 2013
(Dollars in thousands)
14 (Continued)
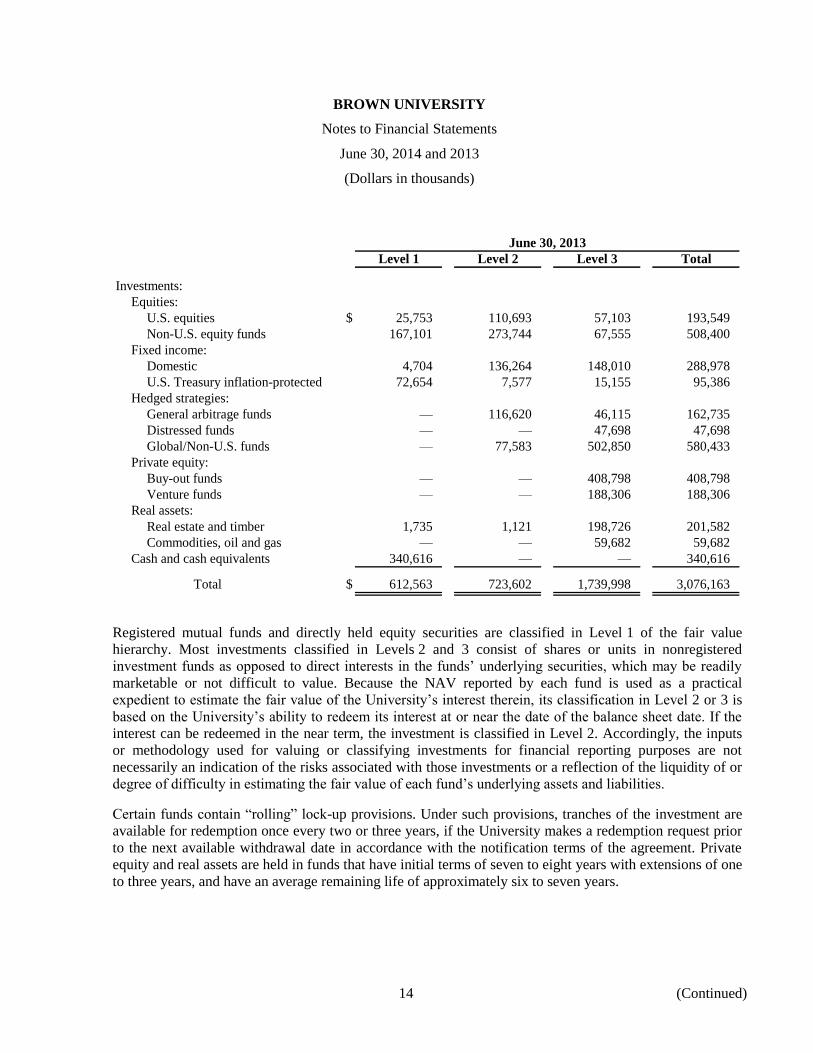
June 30, 2013
Level 1 Level 2 Level 3 Total
Investments:
Equities:
U.S. equities $ 25,753 110,693 57,103 193,549
Non-U.S. equity funds 167,101 273,744 67,555 508,400
Fixed income:
Domestic 4,704 136,264 148,010 288,978
U.S. Treasury inflation-protected 72,654 7,577 15,155 95,386
Hedged strategies:
General arbitrage funds — 116,620 46,115 162,735
Distressed funds — — 47,698 47,698
Global/Non-U.S. funds — 77,583 502,850 580,433
Private equity:
Buy-out funds — — 408,798 408,798
Venture funds — — 188,306 188,306
Real assets:
Real estate and timber 1,735 1,121 198,726 201,582
Commodities, oil and gas — — 59,682 59,682
Cash and cash equivalents 340,616 — — 340,616
Total $ 612,563 723,602 1,739,998 3,076,163
Registered mutual funds and directly held equity securities are classified in Level 1 of the fair value
hierarchy. Most investments classified in Levels 2 and 3 consist of shares or units in nonregistered
investment funds as opposed to direct interests in the funds’ underlying securities, which may be readily
marketable or not difficult to value. Because the NAV reported by each fund is used as a practical
expedient to estimate the fair value of the University’s interest therein, its classification in Level 2 or 3 is
based on the University’s ability to redeem its interest at or near the date of the balance sheet date. If the
interest can be redeemed in the near term, the investment is classified in Level 2. Accordingly, the inputs
or methodology used for valuing or classifying investments for financial reporting purposes are not
necessarily an indication of the risks associated with those investments or a reflection of the liquidity of or
degree of difficulty in estimating the fair value of each fund’s underlying assets and liabilities.
Certain funds contain “rolling” lock-up provisions. Under such provisions, tranches of the investment are
available for redemption once every two or three years, if the University makes a redemption request prior
to the next available withdrawal date in accordance with the notification terms of the agreement. Private
equity and real assets are held in funds that have initial terms of seven to eight years with extensions of one
to three years, and have an average remaining life of approximately six to seven years.
BROWN UNIVERSITY
Notes to Financial Statements
June 30, 2014 and 2013
(Dollars in thousands)
15 (Continued)
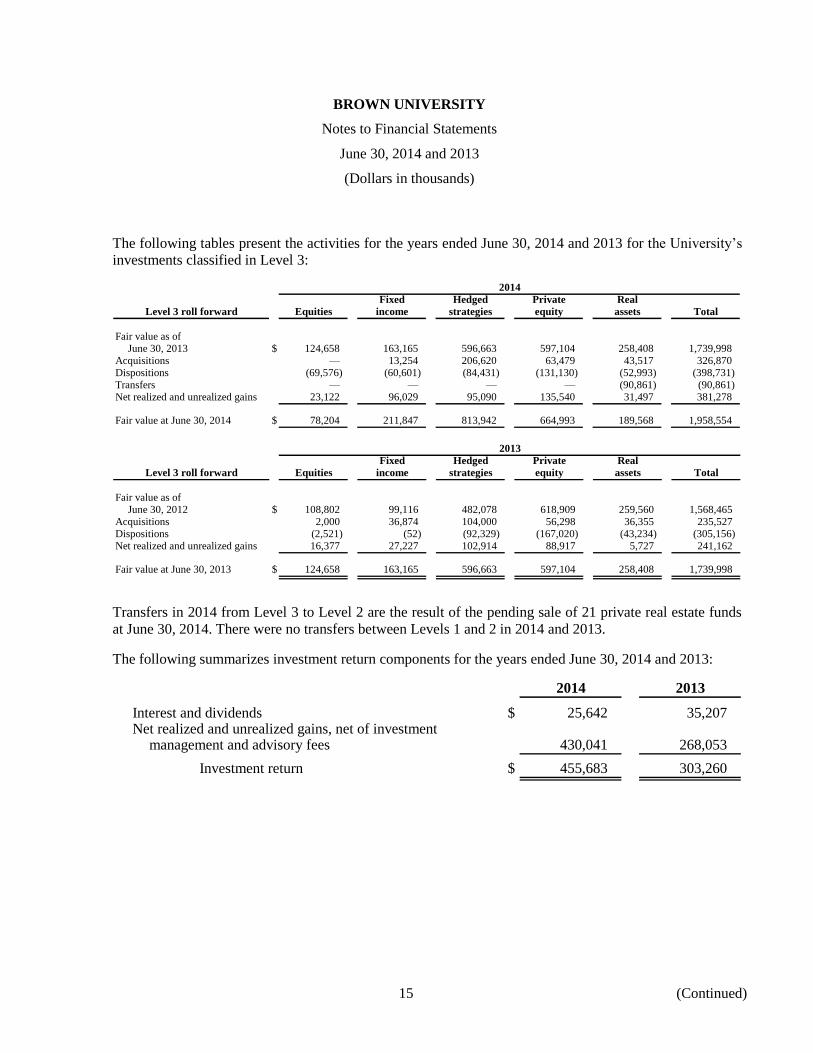
The following tables present the activities for the years ended June 30, 2014 and 2013 for the University’s
investments classified in Level 3:
2014
Fixed Hedged Private Real
Level 3 roll forward Equities income strategies equity assets Total
Fair value as ofJune 30, 2013 $ 124,658 163,165 596,663 597,104 258,408 1,739,998
Acquisitions — 13,254 206,620 63,479 43,517 326,870 Dispositions (69,576) (60,601) (84,431) (131,130) (52,993) (398,731)
Transfers — — — — (90,861) (90,861) Net realized and unrealized gains 23,122 96,029 95,090 135,540 31,497 381,278
Fair value at June 30, 2014 $ 78,204 211,847 813,942 664,993 189,568 1,958,554
2013
Fixed Hedged Private Real
Level 3 roll forward Equities income strategies equity assets Total
Fair value as ofJune 30, 2012 $ 108,802 99,116 482,078 618,909 259,560 1,568,465
Acquisitions 2,000 36,874 104,000 56,298 36,355 235,527 Dispositions (2,521) (52) (92,329) (167,020) (43,234) (305,156)
Net realized and unrealized gains 16,377 27,227 102,914 88,917 5,727 241,162
Fair value at June 30, 2013 $ 124,658 163,165 596,663 597,104 258,408 1,739,998
Transfers in 2014 from Level 3 to Level 2 are the result of the pending sale of 21 private real estate funds
at June 30, 2014. There were no transfers between Levels 1 and 2 in 2014 and 2013.
The following summarizes investment return components for the years ended June 30, 2014 and 2013:
2014 2013
Interest and dividends $ 25,642 35,207 Net realized and unrealized gains, net of investment
management and advisory fees 430,041 268,053
Investment return $ 455,683 303,260

BROWN UNIVERSITY
Notes to Financial Statements
June 30, 2014 and 2013
(Dollars in thousands)
16 (Continued)
Total investment return is included in the statements of activities as follows for the years ended June 30:
2014 2013
Operating:Endowment return appropriated $ 135,467 125,858 Included in other income 11,087 13,883
Nonoperating activities:Net investment return 444,596 289,377 Endowment return appropriated (135,467) (125,858)
Total return $ 455,683 303,260
Total investment management and advisory expenses, including internal costs, were $17,324 and $16,817
for the years ended June 30, 2014 and 2013, respectively, and have been netted against the total return.
(a) Liquidity
Investment liquidity as of June 30, 2014 is aggregated below based on redemption or sale period:
Semi- Subject to
annually to rolling
Daily Monthly Quarterly annually lock-ups Illiquid Total
Equities $ 244,665 — 233,620 69,957 138,295 8,247 694,784 Fixed income 129,627 117,207 — — 78,402 32,101 357,337 Hedged strategies 39,629 166,813 — 184,337 557,600 79,362 1,027,741
Private equity — — — — — 664,993 664,993 Real assets 3,177 86,079 90,861 — — 189,568 369,685
Cash and cash equivalents 371,249 — — — — — 371,249
Total $ 788,347 370,099 324,481 254,294 774,297 974,271 3,485,789
Investments with daily liquidity generally do not require advance notice prior to withdrawal.
Investments with monthly, quarterly, semi-annual, and annual redemption frequency typically
require notice periods, ranging from 7 to 180 days.
(b) Commitments
Private equity and real asset investments are generally made through limited partnerships. Under the
terms of these agreements, the University is obligated to remit additional funding periodically as
capital or liquidity calls are exercised by the manager. These partnerships have a limited existence,
generally ten years, and such agreements may provide for annual extensions for the purpose of
disposing portfolio positions and returning capital to investors. However, depending on market
conditions, the inability to execute the fund’s strategy, and other factors, a manager may extend the
terms of a fund beyond its originally anticipated existence or may wind the fund down prematurely.
As a result, the timing and amount of future capital or liquidity calls expected to be exercised in any
particular future year is uncertain. The aggregate amount of unfunded commitments associated with

BROWN UNIVERSITY
Notes to Financial Statements
June 30, 2014 and 2013
(Dollars in thousands)
17 (Continued)
private equity and real asset investments as of June 30, 2014 was $215,780 and $76,420,
respectively.
(c) Investment Derivatives
The University’s endowment investment portfolio includes derivative financial instruments that have
been entered to reduce overall portfolio risk by hedging exposure to certain assets held in the
portfolio. The endowment also employs certain derivative financial instruments to replicate long or
short asset positions more cost effectively than through purchases or sales of the underlying assets.
The University has established policies, procedures, and internal controls governing the use of
derivatives.
At June 30, 2014 and 2013, the University held swaption contracts principally as hedges against
market concentration risks in certain segments of its investment portfolio. These contracts had total
asset fair values of $814 and $5,036 at June 30, 2014 and 2013, respectively. The University
recognized a net unrealized (loss) gain of ($4,222) and $240 for the years ended June 30, 2014 and
2013, respectively, pertaining to swaption contracts held. The University is obligated to pledge to the
appropriate broker cash or securities to be held as collateral, as determined by margin requirements
for swaption contracts held. The University was not required to post any collateral at June 30, 2014
and 2013.
Beginning in fiscal 2014, credit default swaps were entered to simulate long or short positions or to
reduce credit risk where exposure exists. The buyer of a credit default swap is obligated to pay to the
seller a periodic stream of payments over the term of the contract in return for a contingent payment
upon occurrence of a contracted credit event. As of June 30, 2014, the total notional amount of credit
default swap contracts for buyer protection was $210,000. The fair value of these contracts as of
June 30, 2014 was $8,056 and is included in investments in liabilities associated with investments on
the balance sheet. The unrealized loss on these contracts as of June 30, 2014 was $362 and is
included in net investment return on the statement of activities. The University had posted collateral
of $7,924 as of June 30, 2014, which is included in domestic fixed income investments in the 2014
fair value hierarchy table in note 3.
(4) Endowment
The University’s endowment consists of approximately 2,700 individual funds established for a variety of
purposes, including both donor-restricted endowment funds and funds designated by the Corporation to
function as endowments. Net assets associated with the endowment are classified and reported based upon
the existence or absence of donor-imposed restrictions. In 2013, upon further analysis of the endowment,
$97,143 associated primarily with accumulated returns on Corporation-designated funds was reclassified
from temporarily restricted to unrestricted net assets and is included in other changes, net on the 2013
statement of activities. This change had no impact on total expendable net assets or the total endowment.
BROWN UNIVERSITY
Notes to Financial Statements
June 30, 2014 and 2013
(Dollars in thousands)
18 (Continued)
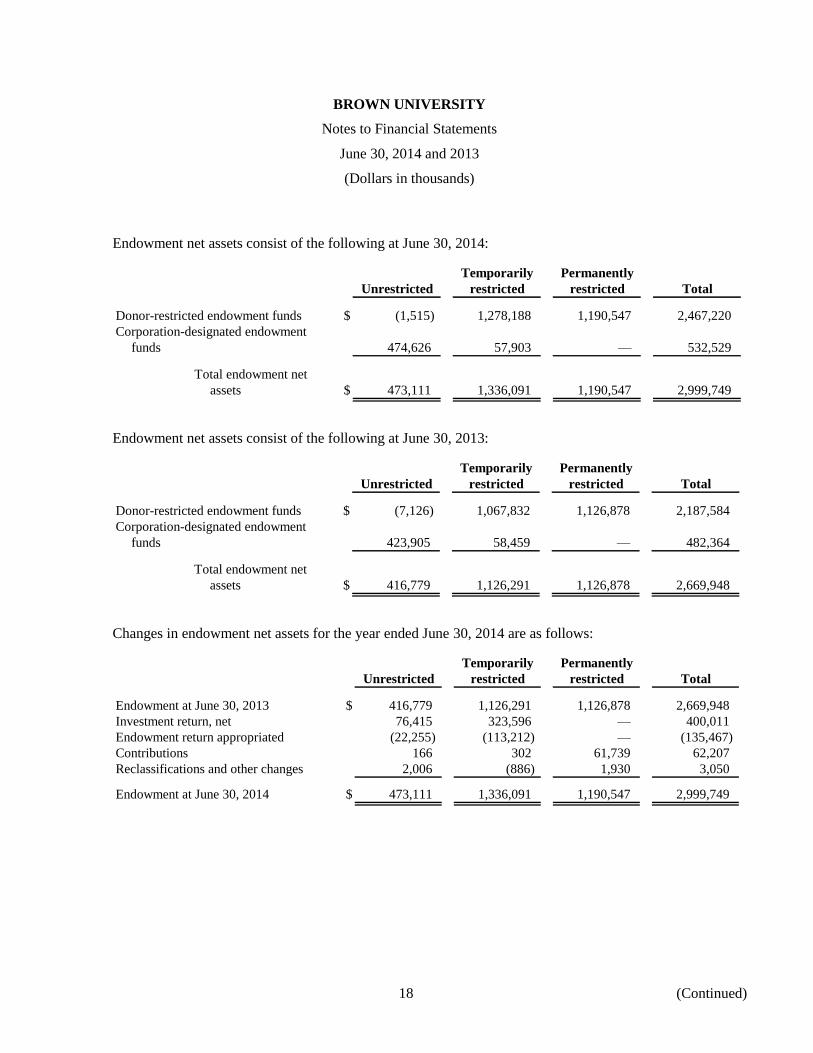
Endowment net assets consist of the following at June 30, 2014:
Temporarily Permanently
Unrestricted restricted restricted Total
Donor-restricted endowment funds $ (1,515) 1,278,188 1,190,547 2,467,220
Corporation-designated endowment
funds 474,626 57,903 — 532,529
Total endowment net
assets $ 473,111 1,336,091 1,190,547 2,999,749
Endowment net assets consist of the following at June 30, 2013:
Temporarily Permanently
Unrestricted restricted restricted Total
Donor-restricted endowment funds $ (7,126) 1,067,832 1,126,878 2,187,584
Corporation-designated endowment
funds 423,905 58,459 — 482,364
Total endowment net
assets $ 416,779 1,126,291 1,126,878 2,669,948
Changes in endowment net assets for the year ended June 30, 2014 are as follows:
Temporarily Permanently
Unrestricted restricted restricted Total
Endowment at June 30, 2013 $ 416,779 1,126,291 1,126,878 2,669,948
Investment return, net 76,415 323,596 — 400,011
Endowment return appropriated (22,255) (113,212) — (135,467)
Contributions 166 302 61,739 62,207
Reclassifications and other changes 2,006 (886) 1,930 3,050
Endowment at June 30, 2014 $ 473,111 1,336,091 1,190,547 2,999,749
BROWN UNIVERSITY
Notes to Financial Statements
June 30, 2014 and 2013
(Dollars in thousands)
19 (Continued)
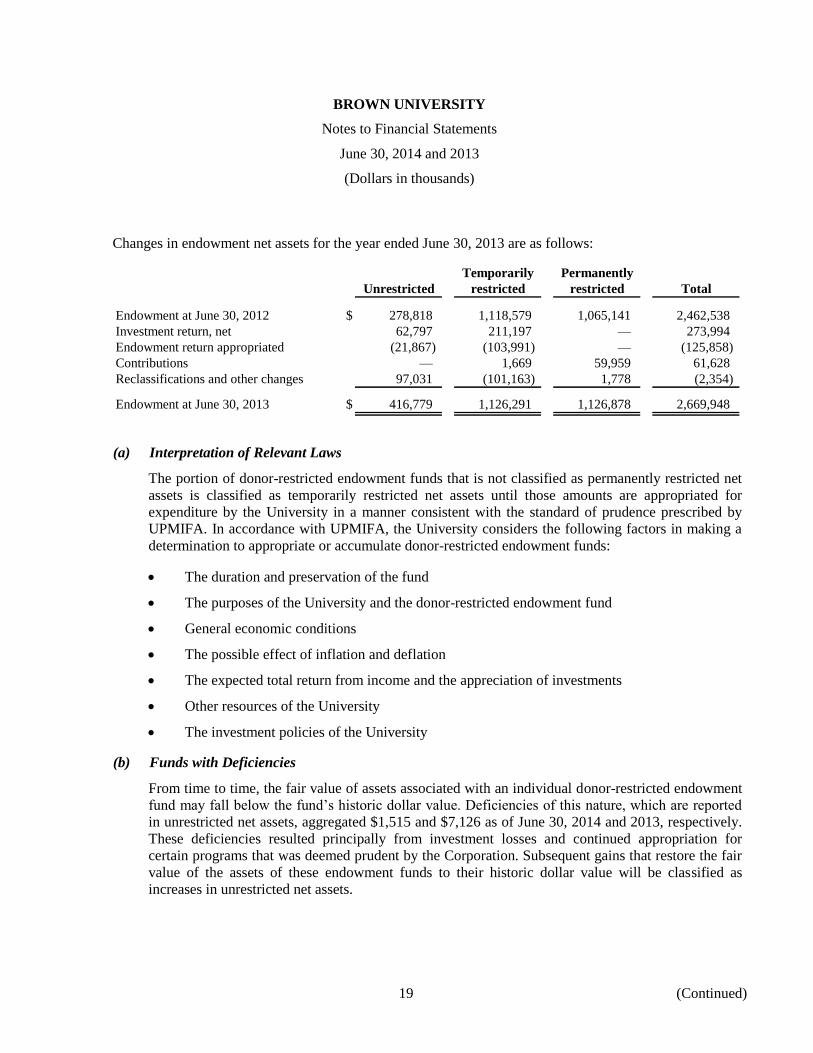
Changes in endowment net assets for the year ended June 30, 2013 are as follows:
Temporarily Permanently
Unrestricted restricted restricted Total
Endowment at June 30, 2012 $ 278,818 1,118,579 1,065,141 2,462,538
Investment return, net 62,797 211,197 — 273,994
Endowment return appropriated (21,867) (103,991) — (125,858)
Contributions — 1,669 59,959 61,628
Reclassifications and other changes 97,031 (101,163) 1,778 (2,354)
Endowment at June 30, 2013 $ 416,779 1,126,291 1,126,878 2,669,948
(a) Interpretation of Relevant Laws
The portion of donor-restricted endowment funds that is not classified as permanently restricted net
assets is classified as temporarily restricted net assets until those amounts are appropriated for
expenditure by the University in a manner consistent with the standard of prudence prescribed by
UPMIFA. In accordance with UPMIFA, the University considers the following factors in making a
determination to appropriate or accumulate donor-restricted endowment funds:
The duration and preservation of the fund
The purposes of the University and the donor-restricted endowment fund
General economic conditions
The possible effect of inflation and deflation
The expected total return from income and the appreciation of investments
Other resources of the University
The investment policies of the University
(b) Funds with Deficiencies
From time to time, the fair value of assets associated with an individual donor-restricted endowment
fund may fall below the fund’s historic dollar value. Deficiencies of this nature, which are reported
in unrestricted net assets, aggregated $1,515 and $7,126 as of June 30, 2014 and 2013, respectively.
These deficiencies resulted principally from investment losses and continued appropriation for
certain programs that was deemed prudent by the Corporation. Subsequent gains that restore the fair
value of the assets of these endowment funds to their historic dollar value will be classified as
increases in unrestricted net assets.
BROWN UNIVERSITY
Notes to Financial Statements
June 30, 2014 and 2013
(Dollars in thousands)
20 (Continued)
(c) Return Objectives and Risk Parameters
The University has adopted investment and spending policies for endowment assets that attempt to
provide a predictable stream of funding to programs supported by its endowment while seeking to
maintain the purchasing power of the endowment assets, including both donor-restricted and
designated funds. The long-term investment return objective is formulated to maintain purchasing
power after accounting for both inflation and spending. The Corporation has set a long-term return
goal at 5.5% above the higher education price index. Actual returns in any given year or period of
years may vary from this amount.
(d) Strategies Employed for Achieving Objectives
To satisfy its long-term rate-of-return objectives, the University relies on a total return strategy in
which investment returns are achieved through both capital appreciation (realized and unrealized)
and current yield (interest and dividends). The University targets a diversified asset allocation to
achieve its long-term return objectives within prudent risk constraints.
(e) Spending Policy and How the Investment Objectives Relate to Spending Policy
The University invests its endowment funds and allocates the related return for expenditure in
accordance with the total return concept. The endowment utilization is determined in accordance
with the policy adopted by the Corporation. This policy fixes the spending range between 4.5% and
5.5% of the average fair value of applicable endowments over the prior twelve quarters, with the
objective being to hold the spending rate to no more than a 5% average over time. Applicable
endowments include Corporation-designated and donor-designated endowment funds.
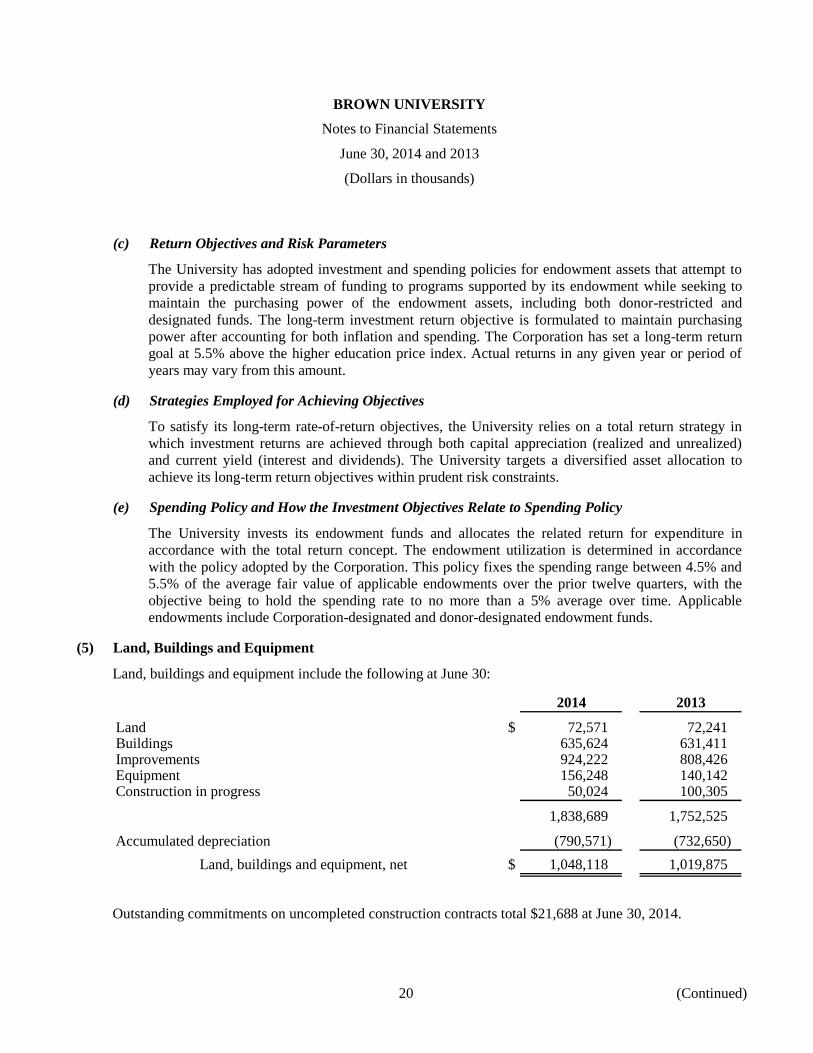
(5) Land, Buildings and Equipment
Land, buildings and equipment include the following at June 30:
2014 2013
Land $ 72,571 72,241 Buildings 635,624 631,411 Improvements 924,222 808,426 Equipment 156,248 140,142 Construction in progress 50,024 100,305
1,838,689 1,752,525
Accumulated depreciation (790,571) (732,650)
Land, buildings and equipment, net $ 1,048,118 1,019,875
Outstanding commitments on uncompleted construction contracts total $21,688 at June 30, 2014.
BROWN UNIVERSITY
Notes to Financial Statements
June 30, 2014 and 2013
(Dollars in thousands)
21 (Continued)
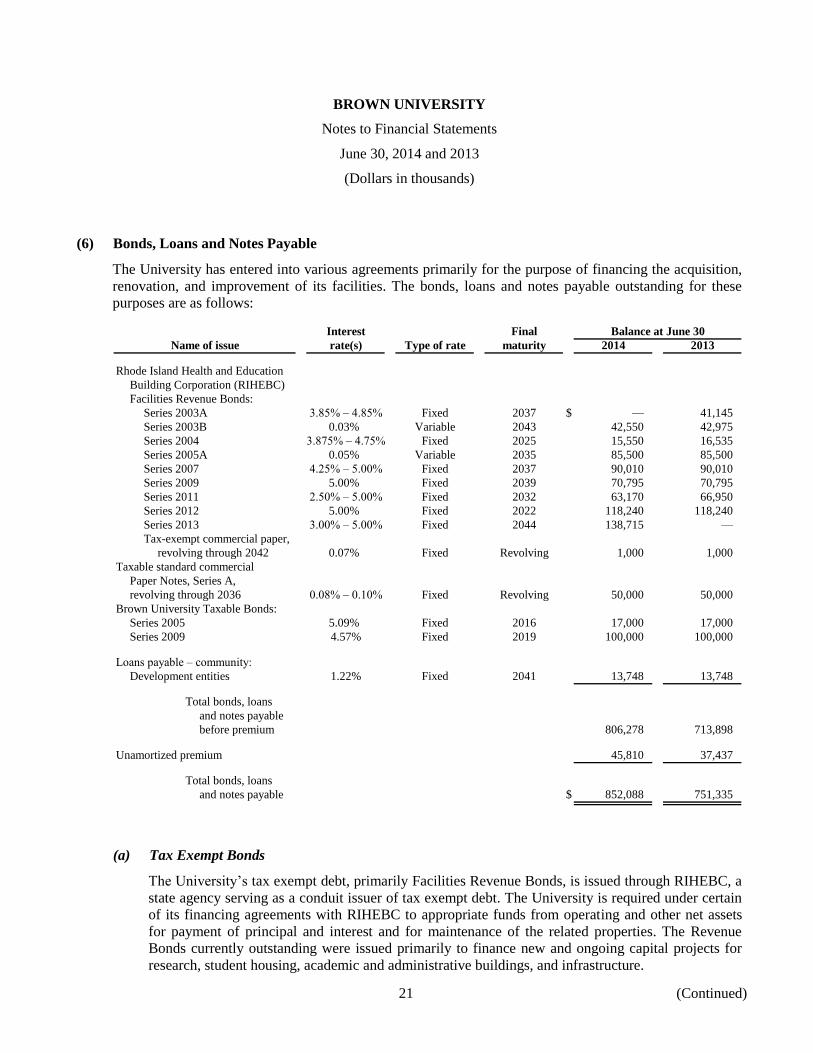
(6) Bonds, Loans and Notes Payable
The University has entered into various agreements primarily for the purpose of financing the acquisition,
renovation, and improvement of its facilities. The bonds, loans and notes payable outstanding for these
purposes are as follows:
Interest Final Balance at June 30
Name of issue rate(s) Type of rate maturity 2014 2013
Rhode Island Health and Education
Building Corporation (RIHEBC)
Facilities Revenue Bonds:
Series 2003A 3.85% – 4.85% Fixed 2037 $ — 41,145
Series 2003B 0.03% Variable 2043 42,550 42,975
Series 2004 3.875% – 4.75% Fixed 2025 15,550 16,535
Series 2005A 0.05% Variable 2035 85,500 85,500
Series 2007 4.25% – 5.00% Fixed 2037 90,010 90,010
Series 2009 5.00% Fixed 2039 70,795 70,795
Series 2011 2.50% – 5.00% Fixed 2032 63,170 66,950
Series 2012 5.00% Fixed 2022 118,240 118,240
Series 2013 3.00% – 5.00% Fixed 2044 138,715 —
Tax-exempt commercial paper,
revolving through 2042 0.07% Fixed Revolving 1,000 1,000
Taxable standard commercial
Paper Notes, Series A,
revolving through 2036 0.08% – 0.10% Fixed Revolving 50,000 50,000
Brown University Taxable Bonds:
Series 2005 5.09% Fixed 2016 17,000 17,000
Series 2009 4.57% Fixed 2019 100,000 100,000
Loans payable – community:
Development entities 1.22% Fixed 2041 13,748 13,748
Total bonds, loans
and notes payable
before premium 806,278 713,898
Unamortized premium 45,810 37,437
Total bonds, loans
and notes payable $ 852,088 751,335
(a) Tax Exempt Bonds
The University’s tax exempt debt, primarily Facilities Revenue Bonds, is issued through RIHEBC, a
state agency serving as a conduit issuer of tax exempt debt. The University is required under certain
of its financing agreements with RIHEBC to appropriate funds from operating and other net assets
for payment of principal and interest and for maintenance of the related properties. The Revenue
Bonds currently outstanding were issued primarily to finance new and ongoing capital projects for
research, student housing, academic and administrative buildings, and infrastructure.
BROWN UNIVERSITY
Notes to Financial Statements
June 30, 2014 and 2013
(Dollars in thousands)
22 (Continued)
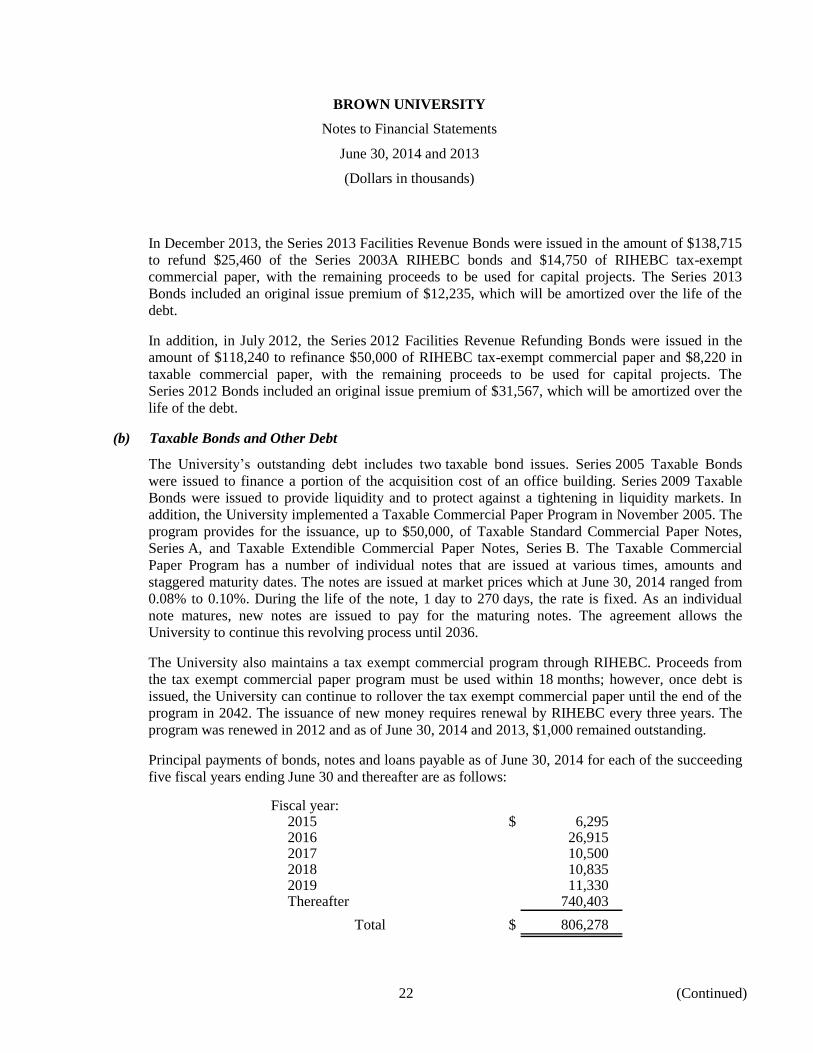
In December 2013, the Series 2013 Facilities Revenue Bonds were issued in the amount of $138,715
to refund $25,460 of the Series 2003A RIHEBC bonds and $14,750 of RIHEBC tax-exempt
commercial paper, with the remaining proceeds to be used for capital projects. The Series 2013
Bonds included an original issue premium of $12,235, which will be amortized over the life of the
debt.
In addition, in July 2012, the Series 2012 Facilities Revenue Refunding Bonds were issued in the
amount of $118,240 to refinance $50,000 of RIHEBC tax-exempt commercial paper and $8,220 in
taxable commercial paper, with the remaining proceeds to be used for capital projects. The
Series 2012 Bonds included an original issue premium of $31,567, which will be amortized over the
life of the debt.
(b) Taxable Bonds and Other Debt
The University’s outstanding debt includes two taxable bond issues. Series 2005 Taxable Bonds
were issued to finance a portion of the acquisition cost of an office building. Series 2009 Taxable
Bonds were issued to provide liquidity and to protect against a tightening in liquidity markets. In
addition, the University implemented a Taxable Commercial Paper Program in November 2005. The
program provides for the issuance, up to $50,000, of Taxable Standard Commercial Paper Notes,
Series A, and Taxable Extendible Commercial Paper Notes, Series B. The Taxable Commercial
Paper Program has a number of individual notes that are issued at various times, amounts and
staggered maturity dates. The notes are issued at market prices which at June 30, 2014 ranged from
0.08% to 0.10%. During the life of the note, 1 day to 270 days, the rate is fixed. As an individual
note matures, new notes are issued to pay for the maturing notes. The agreement allows the
University to continue this revolving process until 2036.
The University also maintains a tax exempt commercial program through RIHEBC. Proceeds from
the tax exempt commercial paper program must be used within 18 months; however, once debt is
issued, the University can continue to rollover the tax exempt commercial paper until the end of the
program in 2042. The issuance of new money requires renewal by RIHEBC every three years. The
program was renewed in 2012 and as of June 30, 2014 and 2013, $1,000 remained outstanding.
Principal payments of bonds, notes and loans payable as of June 30, 2014 for each of the succeeding
five fiscal years ending June 30 and thereafter are as follows:
Fiscal year:2015 $ 6,295 2016 26,915 2017 10,500 2018 10,835 2019 11,330 Thereafter 740,403
Total $ 806,278
BROWN UNIVERSITY
Notes to Financial Statements
June 30, 2014 and 2013
(Dollars in thousands)
23 (Continued)
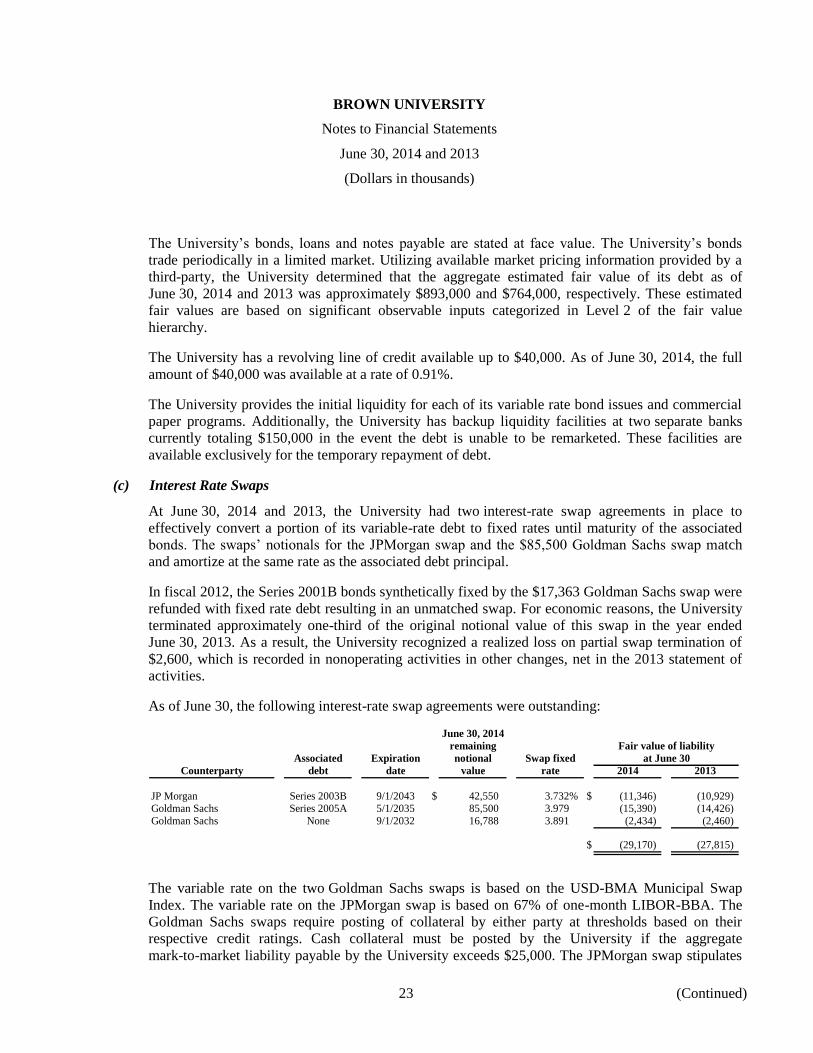
The University’s bonds, loans and notes payable are stated at face value. The University’s bonds
trade periodically in a limited market. Utilizing available market pricing information provided by a
third-party, the University determined that the aggregate estimated fair value of its debt as of
June 30, 2014 and 2013 was approximately $893,000 and $764,000, respectively. These estimated
fair values are based on significant observable inputs categorized in Level 2 of the fair value
hierarchy.
The University has a revolving line of credit available up to $40,000. As of June 30, 2014, the full
amount of $40,000 was available at a rate of 0.91%.
The University provides the initial liquidity for each of its variable rate bond issues and commercial
paper programs. Additionally, the University has backup liquidity facilities at two separate banks
currently totaling $150,000 in the event the debt is unable to be remarketed. These facilities are
available exclusively for the temporary repayment of debt.
(c) Interest Rate Swaps
At June 30, 2014 and 2013, the University had two interest-rate swap agreements in place to
effectively convert a portion of its variable-rate debt to fixed rates until maturity of the associated
bonds. The swaps’ notionals for the JPMorgan swap and the $85,500 Goldman Sachs swap match
and amortize at the same rate as the associated debt principal.
In fiscal 2012, the Series 2001B bonds synthetically fixed by the $17,363 Goldman Sachs swap were
refunded with fixed rate debt resulting in an unmatched swap. For economic reasons, the University
terminated approximately one-third of the original notional value of this swap in the year ended
June 30, 2013. As a result, the University recognized a realized loss on partial swap termination of
$2,600, which is recorded in nonoperating activities in other changes, net in the 2013 statement of
activities.
As of June 30, the following interest-rate swap agreements were outstanding:
June 30, 2014
remaining Fair value of liability
Associated Expiration notional Swap fixed at June 30
Counterparty debt date value rate 2014 2013
JP Morgan Series 2003B 9/1/2043 $ 42,550 3.732% $ (11,346) (10,929) Goldman Sachs Series 2005A 5/1/2035 85,500 3.979 (15,390) (14,426)
Goldman Sachs None 9/1/2032 16,788 3.891 (2,434) (2,460)
$ (29,170) (27,815)
The variable rate on the two Goldman Sachs swaps is based on the USD-BMA Municipal Swap
Index. The variable rate on the JPMorgan swap is based on 67% of one-month LIBOR-BBA. The
Goldman Sachs swaps require posting of collateral by either party at thresholds based on their
respective credit ratings. Cash collateral must be posted by the University if the aggregate
mark-to-market liability payable by the University exceeds $25,000. The JPMorgan swap stipulates
BROWN UNIVERSITY
Notes to Financial Statements
June 30, 2014 and 2013
(Dollars in thousands)
24 (Continued)
that if the University meets a minimum credit rating there are no collateral posting requirements.
This rating was maintained by the University at June 30, 2014 and 2013.
Interest rate volatility, remaining outstanding notional value and time to maturity will affect each
swap’s fair value at subsequent reporting dates. To the extent the University holds a swap through its
expiration date, the swap’s fair value will reach zero. Because the swap fair values are based
predominantly on observable inputs corroborated by market data, they are classified in Level 2 of the
GAAP fair value hierarchy.
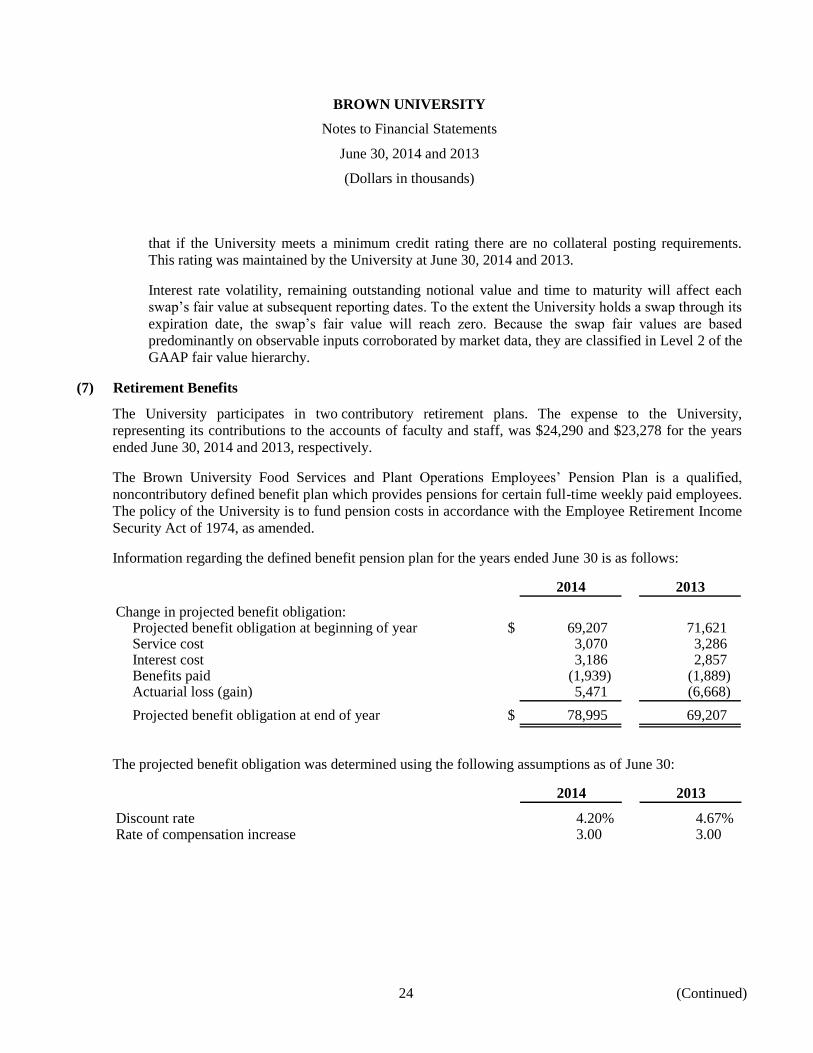
(7) Retirement Benefits
The University participates in two contributory retirement plans. The expense to the University,
representing its contributions to the accounts of faculty and staff, was $24,290 and $23,278 for the years
ended June 30, 2014 and 2013, respectively.
The Brown University Food Services and Plant Operations Employees’ Pension Plan is a qualified,
noncontributory defined benefit plan which provides pensions for certain full-time weekly paid employees.
The policy of the University is to fund pension costs in accordance with the Employee Retirement Income
Security Act of 1974, as amended.
Information regarding the defined benefit pension plan for the years ended June 30 is as follows:
2014 2013
Change in projected benefit obligation:Projected benefit obligation at beginning of year $ 69,207 71,621 Service cost 3,070 3,286 Interest cost 3,186 2,857 Benefits paid (1,939) (1,889) Actuarial loss (gain) 5,471 (6,668)
Projected benefit obligation at end of year $ 78,995 69,207
The projected benefit obligation was determined using the following assumptions as of June 30:
2014 2013
Discount rate 4.20% 4.67%Rate of compensation increase 3.00 3.00

BROWN UNIVERSITY
Notes to Financial Statements
June 30, 2014 and 2013
(Dollars in thousands)
25 (Continued)
The following is a summary of activity under the plan for the years ended June 30:
2014 2013
Change in plan assets:Fair value of plan assets at beginning of year $ 55,237 46,542 Actual return on plan assets 8,897 4,714 Contributions 4,000 5,870 Benefits paid (1,939) (1,889)
Fair value of plan assets at end of year 66,195 55,237
Projected benefit obligation at end of year (78,995) (69,207)
Funded status included in other long-termobligations $ (12,800) (13,970)
2014 2013
Net periodic pension cost:Service cost $ 3,070 3,286 Interest cost 3,186 2,857 Expected return on assets (3,940) (3,540) Amortization of unrecognized loss and prior service cost 817 1,637
Net periodic pension cost $ 3,133 4,240
Net periodic pension cost was determined using the following assumptions for the years ended June 30:
2014 2013
Discount rate 4.67% 4.01%Rate of compensation increase 3.00 3.00Expected long-term rate of return 7.00 7.50
The expected rate of return on plan assets was derived based upon assumptions of inflation, real returns,
anticipated value added by the investment manager and expected asset class allocations.
Net periodic pension cost is reflected in operating activities on the statements of activities. As of June 30,
2014 and 2013, items not yet recognized as components of net periodic pension cost are unrecognized prior
service cost of $854 and $709, respectively, and a net unrecognized actuarial gain of $14,700 and an
actuarial loss of $15,147, respectively. These changes affecting the funded status of the plan are included
in other changes, net in nonoperating activities in the statements of activities.

BROWN UNIVERSITY
Notes to Financial Statements
June 30, 2014 and 2013
(Dollars in thousands)
26 (Continued)
The plan assets at June 30, 2014 and 2013 consist of variable annuity investments with various equity and
fixed income focuses measured at NAV and are classified in Level 2 in the GAAP fair value hierarchy
because of the plan’s ability to redeem its interests at or near the balance sheet date.
The investment strategy for the Plan takes into account several factors consistent with the characteristics of
an employee pension plan. As such, the strategy recognizes a long-term time horizon where a substantial
allocation to equities is appropriate and will help to maximize returns; broad diversification in order to
increase return and reduce risk; and investment in institutional retirement annuities that serves to reduce
administrative costs.
The actual asset allocation for the pension plan as of June 30, 2014 and 2013, and the weighted average
asset targeted allocation are as follows:
ActualTarget 2014 2013
Equity funds 75% 77% 65%Fixed income funds 25 23 35
Total 100% 100% 100%
The University’s estimated contribution for 2014 is $3,000.
Estimated future benefit payments as of June 30, 2014 are as follows:
Fiscal year:2015 $ 2,445 2016 2,612 2017 2,789 2018 3,046 2019 3,283 2020 – 2024 20,371
BROWN UNIVERSITY
Notes to Financial Statements
June 30, 2014 and 2013
(Dollars in thousands)
27 (Continued)
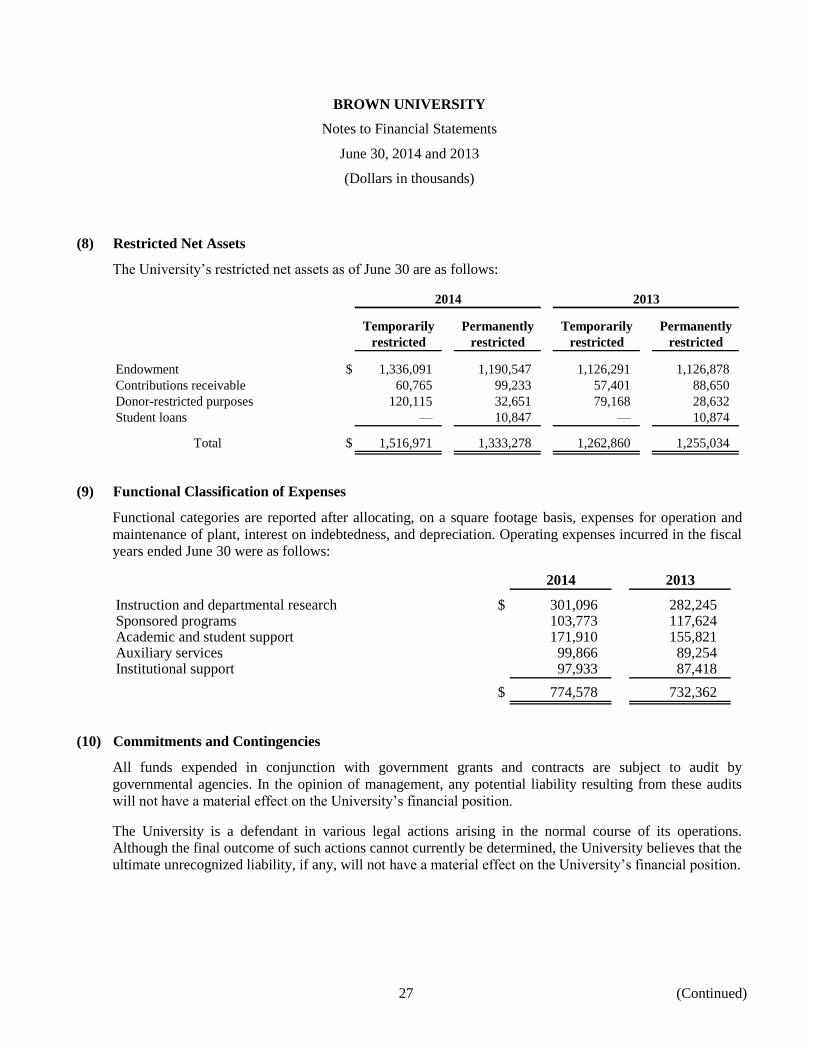
(8) Restricted Net Assets
The University’s restricted net assets as of June 30 are as follows:
2014 2013
Temporarily Permanently Temporarily Permanently
restricted restricted restricted restricted
Endowment $ 1,336,091 1,190,547 1,126,291 1,126,878
Contributions receivable 60,765 99,233 57,401 88,650
Donor-restricted purposes 120,115 32,651 79,168 28,632
Student loans — 10,847 — 10,874
Total $ 1,516,971 1,333,278 1,262,860 1,255,034
(9) Functional Classification of Expenses
Functional categories are reported after allocating, on a square footage basis, expenses for operation and
maintenance of plant, interest on indebtedness, and depreciation. Operating expenses incurred in the fiscal
years ended June 30 were as follows:
2014 2013
Instruction and departmental research $ 301,096 282,245 Sponsored programs 103,773 117,624 Academic and student support 171,910 155,821 Auxiliary services 99,866 89,254 Institutional support 97,933 87,418
$ 774,578 732,362
(10) Commitments and Contingencies
All funds expended in conjunction with government grants and contracts are subject to audit by
governmental agencies. In the opinion of management, any potential liability resulting from these audits
will not have a material effect on the University’s financial position.
The University is a defendant in various legal actions arising in the normal course of its operations.
Although the final outcome of such actions cannot currently be determined, the University believes that the
ultimate unrecognized liability, if any, will not have a material effect on the University’s financial position.
BROWN UNIVERSITY
Notes to Financial Statements
June 30, 2014 and 2013
(Dollars in thousands)
28
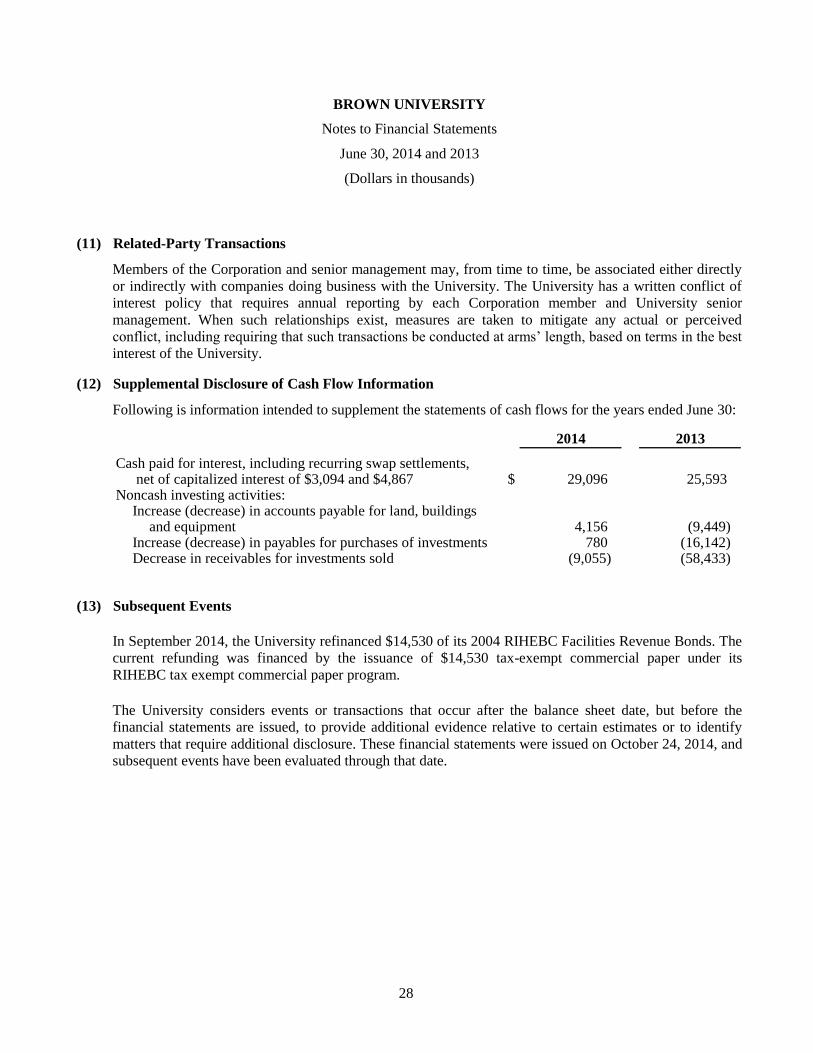
(11) Related-Party Transactions
Members of the Corporation and senior management may, from time to time, be associated either directly
or indirectly with companies doing business with the University. The University has a written conflict of
interest policy that requires annual reporting by each Corporation member and University senior
management. When such relationships exist, measures are taken to mitigate any actual or perceived
conflict, including requiring that such transactions be conducted at arms’ length, based on terms in the best
interest of the University.
(12) Supplemental Disclosure of Cash Flow Information
Following is information intended to supplement the statements of cash flows for the years ended June 30:
2014 2013
Cash paid for interest, including recurring swap settlements, net of capitalized interest of $3,094 and $4,867 $ 29,096 25,593
Noncash investing activities:Increase (decrease) in accounts payable for land, buildings
and equipment 4,156 (9,449) Increase (decrease) in payables for purchases of investments 780 (16,142) Decrease in receivables for investments sold (9,055) (58,433)
(13) Subsequent Events
In September 2014, the University refinanced $14,530 of its 2004 RIHEBC Facilities Revenue Bonds. The
current refunding was financed by the issuance of $14,530 tax-exempt commercial paper under its
RIHEBC tax exempt commercial paper program.
The University considers events or transactions that occur after the balance sheet date, but before the
financial statements are issued, to provide additional evidence relative to certain estimates or to identify
matters that require additional disclosure. These financial statements were issued on October 24, 2014, and
subsequent events have been evaluated through that date.
See accompanying notes to supplementary schedule of expenditures of federal awards. 29 (Continued)
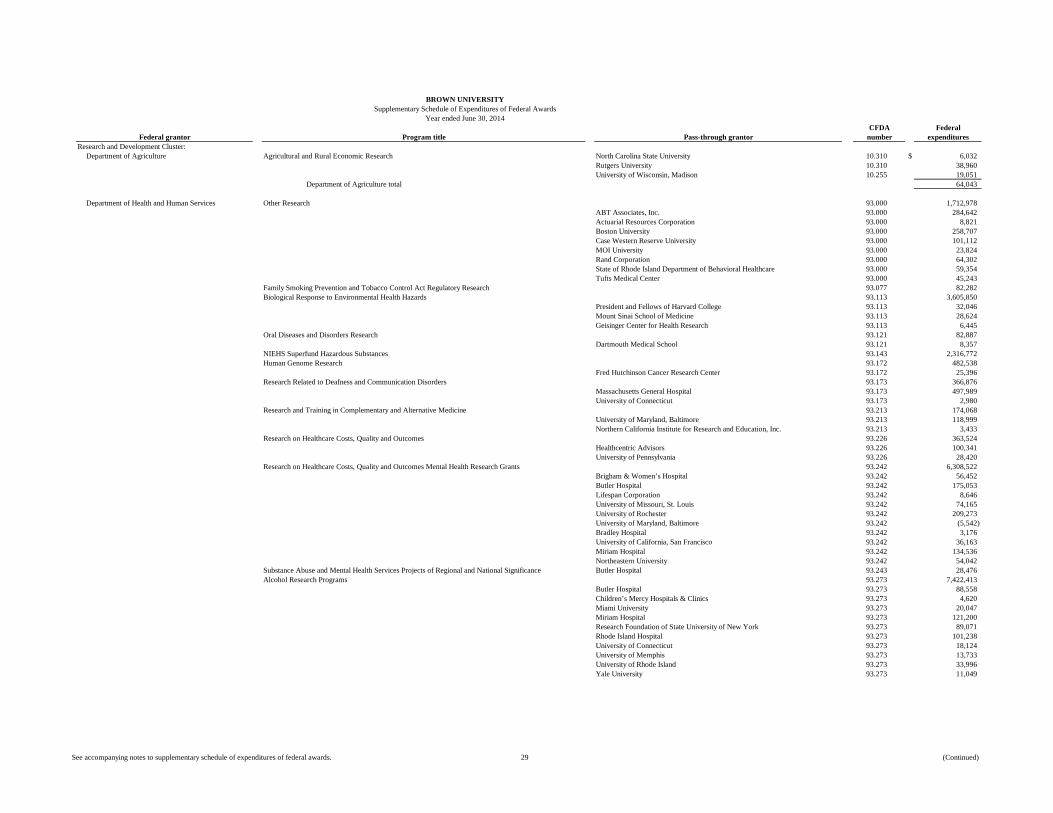
BROWN UNIVERSITYSupplementary Schedule of Expenditures of Federal Awards
Year ended June 30, 2014CFDA Federal
Federal grantor Program title Pass-through grantor number expendituresResearch and Development Cluster:
Department of Agriculture Agricultural and Rural Economic Research North Carolina State University 10.310 $ 6,032Rutgers University 10.310 38,960University of Wisconsin, Madison 10.255 19,051
Department of Agriculture total 64,043
Department of Health and Human Services Other Research 93.000 1,712,978ABT Associates, Inc. 93.000 284,642Actuarial Resources Corporation 93.000 8,821Boston University 93.000 258,707Case Western Reserve University 93.000 101,112MOI University 93.000 23,824Rand Corporation 93.000 64,302State of Rhode Island Department of Behavioral Healthcare 93.000 59,354Tufts Medical Center 93.000 45,243
Family Smoking Prevention and Tobacco Control Act Regulatory Research 93.077 82,282Biological Response to Environmental Health Hazards 93.113 3,605,850
President and Fellows of Harvard College 93.113 32,046Mount Sinai School of Medicine 93.113 28,624Geisinger Center for Health Research 93.113 6,445
Oral Diseases and Disorders Research 93.121 82,887Dartmouth Medical School 93.121 8,357
NIEHS Superfund Hazardous Substances 93.143 2,316,772Human Genome Research 93.172 482,538
Fred Hutchinson Cancer Research Center 93.172 25,396Research Related to Deafness and Communication Disorders 93.173 366,876
Massachusetts General Hospital 93.173 497,989University of Connecticut 93.173 2,980
Research and Training in Complementary and Alternative Medicine 93.213 174,068University of Maryland, Baltimore 93.213 118,999Northern California Institute for Research and Education, Inc. 93.213 3,433
Research on Healthcare Costs, Quality and Outcomes 93.226 363,524Healthcentric Advisors 93.226 100,341University of Pennsylvania 93.226 28,420
Research on Healthcare Costs, Quality and Outcomes Mental Health Research Grants 93.242 6,308,522Brigham & Women’s Hospital 93.242 56,452Butler Hospital 93.242 175,053Lifespan Corporation 93.242 8,646University of Missouri, St. Louis 93.242 74,165University of Rochester 93.242 209,273University of Maryland, Baltimore 93.242 (5,542)Bradley Hospital 93.242 3,176University of California, San Francisco 93.242 36,163Miriam Hospital 93.242 134,536Northeastern University 93.242 54,042
Substance Abuse and Mental Health Services Projects of Regional and National Significance Butler Hospital 93.243 28,476Alcohol Research Programs 93.273 7,422,413
Butler Hospital 93.273 88,558Children’s Mercy Hospitals & Clinics 93.273 4,620Miami University 93.273 20,047Miriam Hospital 93.273 121,200Research Foundation of State University of New York 93.273 89,071Rhode Island Hospital 93.273 101,238University of Connecticut 93.273 18,124University of Memphis 93.273 13,733University of Rhode Island 93.273 33,996Yale University 93.273 11,049

See accompanying notes to supplementary schedule of expenditures of federal awards. 30 (Continued)
BROWN UNIVERSITYSupplementary Schedule of Expenditures of Federal Awards
Year ended June 30, 2014CFDA Federal
Federal grantor Program title Pass-through grantor number expendituresResearch and Development Cluster (cont'd):
Department of Health and Human Services (cont'd) Drug Abuse and Addiction Research Programs 93.279 $ 2,058,230Bradley Hospital 93.279 4,522Butler Hospital 93.279 56,430Dartmouth College 93.279 139,896The Miriam Hospital 93.279 108,621Tufts University 93.279 14,142Rhode Island Hospital 93.279 109,847University of California, San Francisco 93.279 130,905University of Pittsburgh 93.279 567,224University of Rhode Island 93.279 62,694Women and Infants Hospital 93.279 49,133
Mental Health Research Career/Scientist Development Awards 93.281 557,084Mental Health National Research Service Awards for Research Training 93.282 41,983Centers for Disease Control and Prevention Investigations and Technical Assistance Women’s and Infants 93.283 33,138Discovery and Applied Research for Technological Innovations to Improve Human Health 93.286 86,084Trans-NIH Research Support 93.310 357,439
Johns Hopkins University 93.310 158,125Sloan-Kettering Institute 93.310 14,138
Nursing Research Butler Hospital 93.361 25,463Rhode Island Hospital 93.361 (75)The Regents of the University of California 93.361 94,538
National Center for Research Resources 93.389 360,230Rhode Island Hospital 93.389 297,493Women & Infants Hospital 93.389 10,256
Cancer Cause and Prevention Research 93.393 1,219,183Legacy for Health Foundation 93.393 39,594Miriam Hospital 93.393 8,532
Cancer Detection and Diagnosis Research 93.394 4,185,767The Miriam Hospital 93.394 16,185University of California, San Diego 93.394 13,343
Cancer Treatment Research American College of Radiology 93.395 (1)State University of New York-Environmental Science & Forestry 93.395 14,212
Cancer Biology Research 93.396 70,082Cancer Control 93.399 404,317
Drexel University 93.399 (36,228)The Affordable Care Act - Medicaid Adult Quality Grants 93.609 64,258Heart and Vascular Diseases Research 93.837 957,587
Rhode Island Hospital 93.837 55,142Columbia University 93.837 17,164Mount Sinai School of Medicine 93.837 45,469Yale University 93.837 180,730
Lung Diseases Research 93.838 308,038Blood Diseases and Resource Research 93.839 690,676Arthritis, Musculoskeletal and Skin Diseases Research 93.846 865,721
University of Washington 93.846 41,720Lifespan, Inc. 93.846 72,520
Diabetes, Endocrinology and Metabolism Research 93.847 361,317Memorial Hospital 93.847 228,211The Miriam Hospital 93.847 175,837Virginia Polytechnic Institute and State University 93.847 2,852University of California, Los Angeles 93.847 9,223
Extramural Research Programs in the Neurosciences and Neurological Disorders 93.853 3,875,926President and Fellows of Harvard College 93.853 403,949Miriam Hospital 93.853 12,984University of Washington 93.853 20,641Stanford University 93.853 4,439University of Missouri, St. Louis 93.853 112,300
See accompanying notes to supplementary schedule of expenditures of federal awards. 31 (Continued)
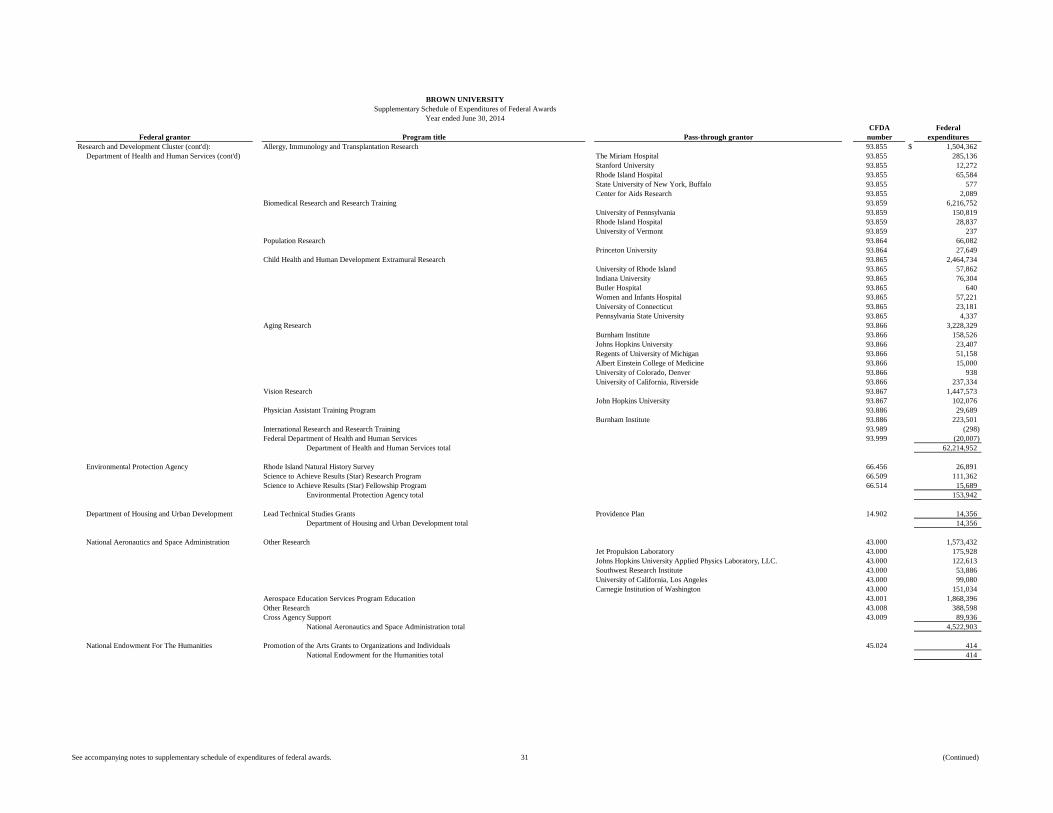
BROWN UNIVERSITYSupplementary Schedule of Expenditures of Federal Awards
Year ended June 30, 2014CFDA Federal
Federal grantor Program title Pass-through grantor number expendituresResearch and Development Cluster (cont'd): Allergy, Immunology and Transplantation Research 93.855 $ 1,504,362
Department of Health and Human Services (cont'd) The Miriam Hospital 93.855 285,136Stanford University 93.855 12,272Rhode Island Hospital 93.855 65,584State University of New York, Buffalo 93.855 577Center for Aids Research 93.855 2,089
Biomedical Research and Research Training 93.859 6,216,752University of Pennsylvania 93.859 150,819Rhode Island Hospital 93.859 28,837University of Vermont 93.859 237
Population Research 93.864 66,082Princeton University 93.864 27,649
Child Health and Human Development Extramural Research 93.865 2,464,734University of Rhode Island 93.865 57,862Indiana University 93.865 76,304Butler Hospital 93.865 640Women and Infants Hospital 93.865 57,221University of Connecticut 93.865 23,181Pennsylvania State University 93.865 4,337
Aging Research 93.866 3,228,329Burnham Institute 93.866 158,526Johns Hopkins University 93.866 23,407Regents of University of Michigan 93.866 51,158Albert Einstein College of Medicine 93.866 15,000University of Colorado, Denver 93.866 938University of California, Riverside 93.866 237,334
Vision Research 93.867 1,447,573John Hopkins University 93.867 102,076
Physician Assistant Training Program 93.886 29,689Burnham Institute 93.886 223,501
International Research and Research Training 93.989 (298)Federal Department of Health and Human Services 93.999 (20,007)
Department of Health and Human Services total 62,214,952
Environmental Protection Agency Rhode Island Natural History Survey 66.456 26,891Science to Achieve Results (Star) Research Program 66.509 111,362Science to Achieve Results (Star) Fellowship Program 66.514 15,689
Environmental Protection Agency total 153,942
Department of Housing and Urban Development Lead Technical Studies Grants Providence Plan 14.902 14,356Department of Housing and Urban Development total 14,356
National Aeronautics and Space Administration Other Research 43.000 1,573,432Jet Propulsion Laboratory 43.000 175,928Johns Hopkins University Applied Physics Laboratory, LLC. 43.000 122,613Southwest Research Institute 43.000 53,886University of California, Los Angeles 43.000 99,080Carnegie Institution of Washington 43.000 151,034
Aerospace Education Services Program Education 43.001 1,868,396Other Research 43.008 388,598Cross Agency Support 43.009 89,936
National Aeronautics and Space Administration total 4,522,903
National Endowment For The Humanities Promotion of the Arts Grants to Organizations and Individuals 45.024 414National Endowment for the Humanities total 414

See accompanying notes to supplementary schedule of expenditures of federal awards. 32 (Continued)
BROWN UNIVERSITYSupplementary Schedule of Expenditures of Federal Awards
Year ended June 30, 2014CFDA Federal
Federal grantor Program title Pass-through grantor number expendituresResearch and Development Cluster (cont'd):
Department of CommerceNational Institute of Standards and Technology Education Quality Award Ambassadorship 11.013 $ 13,578
Measurement and Engineering Research & Standards 11.609 8,602Internet 2 11.609 82,223
National Institute of Standards and Technology total 104,403
National Ocean and Atmospheric Costal Zone Management Estuarine Research Reserves 11.420 7,524Center for Sponsored Coastal Ocean Research University of Rhode Island 11.478 12,828
National Ocean and Atmospheric Agency total 20,352
Department of Commerce total 124,755
Department of State Program for Study of Eastern Europe and Independent States of the Former Soviet Union National Council for Eurasian and Eastern European Research 19.300 9,379Department of State total 9,379
National Science Foundation Other Research 47.000 165,715University of Notre Dame 47.000 19,620University of Georgia 47.024 3,048
Engineering Grants 47.041 2,460,462Learning Sites, Inc. 47.041 7,370Ohio State University 47.041 (28,690)University of Pennsylvania 47.041 38,777
Mathematical and Physical Sciences 47.049 8,511,514University of Notre Dame 47.049 4,000Johns Hopkins University 47.049 22,265Case Western Reserve University 47.049 74,190Boston University 47.049 110,273Brandeis University 47.049 35,139
Geosciences 47.050 2,513,608Consortium for Ocean Leadership 47.050 49,194University of Southern California 47.050 45,238University of California, Riverside 47.050 51,804University of Colorado, Boulder 47.050 19,160University of Arizona 47.050 3,754
Computer and Information Science and Engineering 47.070 3,549,605Southern Methodist University 47.070 25,401Washington University in Saint Louis 47.070 5,290Worcester Polytechnic Institute 47.070 161,348
Biological Sciences 47.074 3,086,182Social, Behavioral, and Economic Sciences 47.075 803,115
University of California 47.075 65,767Education and Human Resources: 47.076 2,732,238
Council of Graduate Schools 47.076 2,297National Science Foundation 47.076 13,957University of Rhode Island 47.076 147,791
Polar Programs 47.078 385,084Boston University 47.078 16,951
International Science and Engineering (OISE) 47.079 312,784Office of Cyberinfrastructure 47.080 20,595Office of Experimental Program to Stimulate Competitive Research Tool Roger Williams University 47.081 880,798
University of Rhode Island 47.081 5,104National Science Foundation total 26,320,748
Department of Defense Basic and Applied Scientific Research 12.300 2,376,069University of California - Los Angeles 12.300 90,025North Carolina State University 12.300 19,193
Basic Scientific Research 12.351 403,960Military Medical Research and Development 12.420 496,955
I2S Micro Implantable Systems, Inc. 12.420 (5,964)Boston University 12.420 161,616Yale University 12.420 16,861
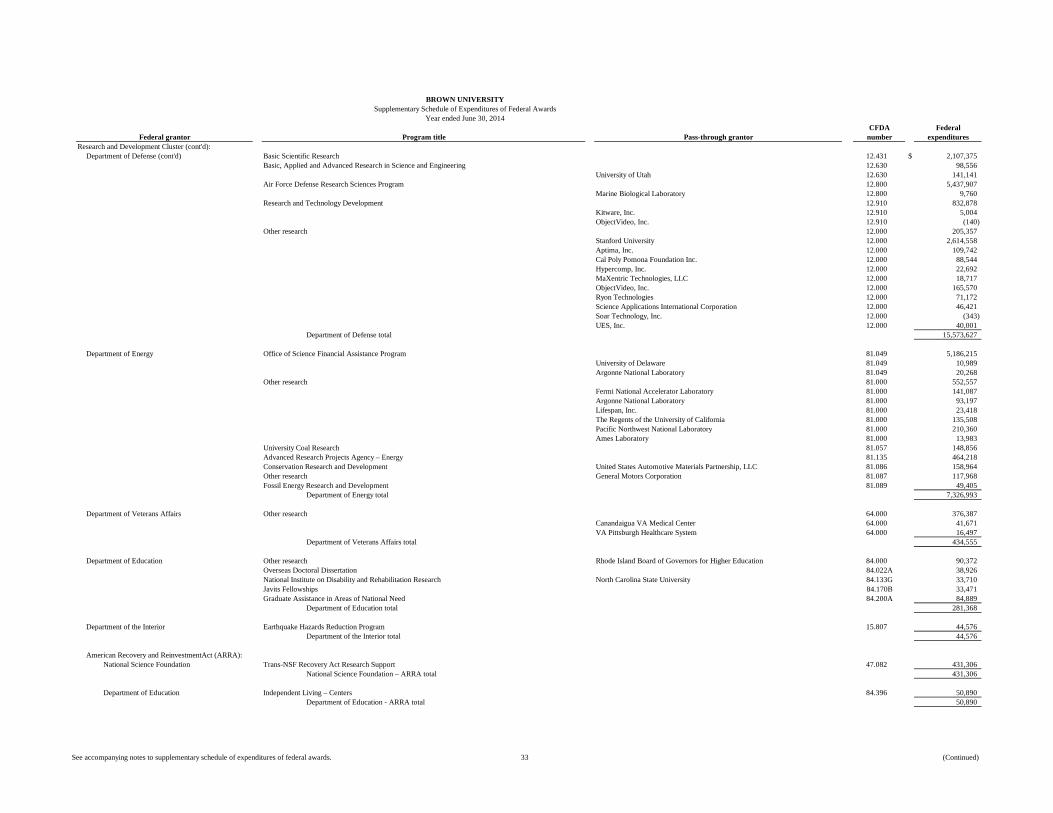
See accompanying notes to supplementary schedule of expenditures of federal awards. 33 (Continued)
BROWN UNIVERSITYSupplementary Schedule of Expenditures of Federal Awards
Year ended June 30, 2014CFDA Federal
Federal grantor Program title Pass-through grantor number expendituresResearch and Development Cluster (cont'd):
Department of Defense (cont'd) Basic Scientific Research 12.431 $ 2,107,375Basic, Applied and Advanced Research in Science and Engineering 12.630 98,556
University of Utah 12.630 141,141Air Force Defense Research Sciences Program 12.800 5,437,907
Marine Biological Laboratory 12.800 9,760Research and Technology Development 12.910 832,878
Kitware, Inc. 12.910 5,004ObjectVideo, Inc. 12.910 (140)
Other research 12.000 205,357Stanford University 12.000 2,614,558Aptima, Inc. 12.000 109,742Cal Poly Pomona Foundation Inc. 12.000 88,544Hypercomp, Inc. 12.000 22,692MaXentric Technologies, LLC 12.000 18,717ObjectVideo, Inc. 12.000 165,570Ryon Technologies 12.000 71,172Science Applications International Corporation 12.000 46,421Soar Technology, Inc. 12.000 (343)UES, Inc. 12.000 40,001
Department of Defense total 15,573,627
Department of Energy Office of Science Financial Assistance Program 81.049 5,186,215University of Delaware 81.049 10,989Argonne National Laboratory 81.049 20,268
Other research 81.000 552,557Fermi National Accelerator Laboratory 81.000 141,087Argonne National Laboratory 81.000 93,197Lifespan, Inc. 81.000 23,418The Regents of the University of California 81.000 135,508Pacific Northwest National Laboratory 81.000 210,360Ames Laboratory 81.000 13,983
University Coal Research 81.057 148,856Advanced Research Projects Agency – Energy 81.135 464,218Conservation Research and Development United States Automotive Materials Partnership, LLC 81.086 158,964Other research General Motors Corporation 81.087 117,968Fossil Energy Research and Development 81.089 49,405
Department of Energy total 7,326,993
Department of Veterans Affairs Other research 64.000 376,387Canandaigua VA Medical Center 64.000 41,671VA Pittsburgh Healthcare System 64.000 16,497
Department of Veterans Affairs total 434,555
Department of Education Other research Rhode Island Board of Governors for Higher Education 84.000 90,372Overseas Doctoral Dissertation 84.022A 38,926National Institute on Disability and Rehabilitation Research North Carolina State University 84.133G 33,710Javits Fellowships 84.170B 33,471Graduate Assistance in Areas of National Need 84.200A 84,889
Department of Education total 281,368
Department of the Interior Earthquake Hazards Reduction Program 15.807 44,576Department of the Interior total 44,576
American Recovery and ReinvestmentAct (ARRA):National Science Foundation Trans-NSF Recovery Act Research Support 47.082 431,306
National Science Foundation – ARRA total 431,306
Department of Education Independent Living – Centers 84.396 50,890Department of Education - ARRA total 50,890

See accompanying notes to supplementary schedule of expenditures of federal awards. 34 (Continued)
BROWN UNIVERSITYSupplementary Schedule of Expenditures of Federal Awards
Year ended June 30, 2014CFDA Federal
Federal grantor Program title Pass-through grantor number expendituresResearch and Development Cluster (cont'd):
American Recovery and ReinvestmentAct (ARRA) (cont'd):
Department of Health and Human Services Other Research - ARRA America College of Radiology 93.000 $ 158,178Trans-NIH Recovery Act Research Support 93.701 225,614
Dartmouth College 93.701 1Massachusetts General Hospital 93.701 178
Recovery Act – Comparative Effectiveness Research – AHRQ 93.715 12,537Department of Health and Human Services – ARRA total 396,508
Research and Development Cluster total 117,965,315
Student Financial Assistance Cluster:Department of Education Federal Perkins Loan Program (note 4) 84.038 3,876,150
Federal Direct Student Loans (note 4) 84.268 29,283,382Federal Work-study Program 84.033 1,316,126Federal Pell Grant Program 84.063 4,503,237Federal Supplemental Educational Opportunity Grants 84.007 816,187
Department of Education total 39,795,082
Department of Health and Human Services Health Professions Student Loans, Including Primary CareLoans/Loans for Disadvantaged Students (note 4) 93.342 59,700
Department of Health and Human Services total 59,700
Student Financial Assistance Cluster total 39,854,782
Other Federal Awards:United States Institute of Peace Annual Senior Fellowship Competition 91.003 (80)
United States Institute of Peace total (80)
Department of Defense Basic and Applied Scientific Research - Other 12.300 5,104Basic Scientific Research - Other 12.431 13,239Air Force Defense Research Sciences Program - Other 12.800 (2,982)Mathematical Sciences Grants Program 12.901 27,787
Department of Defense total 43,148
National Aeronautics and Space Administration Other Research 43.000 62,970National Aeronautics and Space Administration total 62,970
National Endowment For The Humanities Promotion of the Arts Grants to Organizations and Individuals 45.024 9,999 Promotion of the Humanities - Federal/State Partnership Rhode Island Council For the Humanities 45.129 4,816 Promotion of the Humanities - Division of Preservation and Access University of Tulsa 45.149 53,571 Promotion of the Humanities - Office of Digital Humanities University of Maryland - College Park 45.169 1,524 National Leadership Grants 45.312 47,119
National Endowment For The Humanities total 117,029
National Science Foundation Engineering Grants 47.041 18,226Mathematical and Physical Sciences 47.049 357,511
American Institute of Mathematics 47.049 15,478Mathematical Sciences Research Institute 47.049 38,127
Geosciences 47.050 56,822Computer and Information Science and Engineering 47.070 36,272Biological Sciences Council on Undergraduate Research 47.074 28,041Education and Human Resources 47.076 4,963
National Science Foundation total 555,440
U.S. Department of Veterans Affairs Other Research 64.000 12,046Canandaigua VA Medical Center 64.000 111,914
U.S. Department of Veterans Affairs total 123,960
Corporation for National and Community Service AmeriCorps Serve Rhode Island 94.006 188,539Corporation for National and Community total 188,539

See accompanying notes to supplementary schedule of expenditures of federal awards. 35 (Continued)
BROWN UNIVERSITYSupplementary Schedule of Expenditures of Federal Awards
Year ended June 30, 2014CFDA Federal
Federal grantor Program title Pass-through grantor number expendituresOther Federal Awards (cont'd):
Department of Education Other Northwest Regional Educational Laboratory 84.UNK $ 9,521Civil Rights Training and Advisory Services 84.004 501,627Other 84.165A 231,538Bilingual Education Professional Development 84.195 11,638National Professional Development Program 84.365Z 1,287,450The Investing in Innovation Fund City of Central Falls School District 84.411C 105,722Graduate Assistance in Areas of National Need 84.200A 16,043
Department of Education total 2,163,539
Department of Health and Human Services Other 93.UNK 187,280Healthcentric Advisors 93.UNK 5,005MOI University 93.UNK 146,672State of Rhode Island Department of Health 93.UNK 8,139
Model – State supported area 93.107 223,057Biological Response to Environmental Health Hazards 93.113 382,426Aids Education and Training Centers University of Massachusetts Medical Center 93.145 1,512
Butler Hospital 93.156 12,321National Research Service Awards Health Services Research Training 93.225 330,905Mental Health Research Grants - Instruction Miriam Hospital 93.242 47,062Substance Abuse and Mental Health Services Projects of Regional and National Significance 93.243 568,032Public Health Training Centers Grants Yale University 93.249 28,825Alcohol Research Programs - Instruction 93.273 618,539Drug Abuse and Addiction Research Programs - Instruction 93.279 205,116Mental Health National Research Service Awards for Research Training - Instruction 93.282 520,337Mental Health and Health Disparities Research - Instruction 93.307 112,332Research Infrastructure Programs 93.351 637,098Geriatric Training for Physicians, Dentists and Behavioral/Mental Health Professionals Office of Research Infrastructure Programs 93.351 13,078 Cell Biology and Biophysics Research - Instruction 93.821 367,778Heart and Vascular Diseases Research - Instruction 93.837 30,264Extramural Research Programs in the Neurosciences - Instruction 93.853 19,829Biomedical Research and Research Training - Instruction 93.859 1,143,608Population Research - Instruction 93.864 19,315Child Health and Human Development Extramural Research - Instruction 93.865 238,525
Albert Einstein College of Medicine 93.865 72,605Aging Research - Instruction 93.866 302,284Vision Research - Instruction 93.867 136,287Grants for Training in Primary Care Medicine and Dentistry - Instruction 93.884 638,571International Research and Research Training - Instruction 93.989 786,865
Department of Health and Human Services Total 7,803,667
U.S. Agency for International Development USAID Foreign Assistance for programs Overseas Development Indiana University 98.000 126,999USAID Development Partnerships for University Cooperation Higher Education for Development 98.012 23,091
U.S. Agency for International Development Total 150,090
Total Other Programs 11,208,302
Total Expenditures of Federal Awards $ 169,028,399

BROWN UNIVERSITY
Notes to Supplementary Schedule of Expenditures of Federal Awards
Year ended June 30, 2014
36 (Continued)
(1) Basis of Presentation
The accompanying supplementary schedule of expenditures of federal awards (the Schedule) summarizes
the expenditures of Brown University (the University) under programs of the federal government for the
year ended June 30, 2014. Negative amounts on the Schedule represent adjustments to expenditures
reported in a prior year.
For purposes of the Schedule, federal awards include grants, contracts, and similar agreements entered into
directly between the University and agencies and departments of the federal government and all subawards
to the University by nonfederal organizations pursuant to federal grants, contracts, and similar agreements.
The awards are categorized in accordance with the provisions of Office of Management and Budget
(OMB) Circular A-133, Audits of States, Local Governments, and Non-Profit Organizations. Because the
Schedule presents only a selected portion of the operations of the University, it is not intended to and does
not present the financial position, changes in net assets or cash flows of the University.
(2) Summary of Significant Accounting Policies
For purposes of the Schedule, expenditures for federal award programs are recognized as incurred using
the accrual method of accounting and the cost accounting principles contained in OMB Circular A-21,
Cost Principles for Educational Institutions. Under those cost principles, certain types of expenditures are
not allowable or are limited as to reimbursement.
Expenditures under the research and development cluster include facilities and administrative (F&A) cost
recoveries, relating primarily to facilities operation and maintenance; facilities and equipment depreciation;
and general, divisional, and departmental administration services, which are charged to applicable federal
grants under negotiated rates agreed to with DHHS, the University’s federal cognizant agency.
(3) Subrecipients
During fiscal year 2014, the University provided $12,999,834 to subrecipients under its research and
development cluster and $1,071,032 to subrecipients under other programs.

BROWN UNIVERSITY
Notes to Supplementary Schedule of Expenditures of Federal Awards
Year ended June 30, 2014
37
(4) Federal Student Loan Programs
Loans made by the University to eligible students under federal student loan programs and federally
guaranteed loans issued to students by the University during the year ended June 30, 2014 are summarized
as follows:
Campus-based loan programs:Federal Perkins Loan Program $ 3,569,966 Health Professions Student Loan Program 59,700
Total campus-based loans programs $ 3,629,666
Federal Direct Student Loans:Subsidized Stafford Loan Program $ 5,659,611 Unsubsidized Stafford Loan Program 13,431,550 PLUS Loan Program 10,192,221
Total Federal Direct Student Loan programs $ 29,283,382
The Federal Perkins Loan and Health Professional Student Loan programs are administered directly by the
University and balances and transactions relating to these programs are included in the University’s
financial statements. The balances of loans outstanding at June 30, 2014 under these programs consist of:
Federal Perkins Loan Program $ 24,893,525 Health Professions Student Loans 619,043
Total $ 25,512,568
For the year ended June 30, 2014, the University recovered an administrative cost allowance of $306,184
under the Federal Perkins Loan Program.
The University is responsible only for the performance of certain administrative duties relating to Federal
Direct Loans and, accordingly, these loans are not included in the University’s financial statements. It is
not practical to determine the balances of loans outstanding to students of the University under this
program as of June 30, 2014.
38
Independent Auditors’ Report on Internal Control Over Financial Reporting and on Compliance
and Other Matters Based on an Audit of Financial Statements Performed in Accordance With
Government Auditing Standards
The President and Corporation
Brown University:
We have audited, in accordance with the auditing standards generally accepted in the United States of
America and the standards applicable to financial audits contained in Government Auditing Standards,
issued by the Comptroller General of the United States, the financial statements of Brown University (the
University), which comprise the balance sheet as of June 30, 2014, the related statements of activities and
cash flows for the year then ended, and the related notes to the financial statements, and have issued our
report thereon dated October 24, 2014.
Internal Control Over Financial Reporting
In planning and performing our audit of the financial statements, we considered the University’s internal
control over financial reporting (internal control) to determine the audit procedures that are appropriate in
the circumstances for the purpose of expressing our opinion on the financial statements, but not for the
purpose of expressing an opinion on the effectiveness of the University’s internal control. Accordingly, we
do not express an opinion on the effectiveness of the University’s internal control.
A deficiency in internal control exists when the design or operation of a control does not allow
management or employees, in the normal course of performing their assigned functions, to prevent, or
detect and correct, misstatements on a timely basis. A material weakness is a deficiency, or combination of
deficiencies, in internal control, such that there is a reasonable possibility that a material misstatement of
the entity’s financial statements will not be prevented, or detected and corrected on a timely basis. A
significant deficiency is a deficiency, or a combination of deficiencies, in internal control that is less severe
than a material weakness, yet important enough to merit attention by those charged with governance.
Our consideration of internal control was for the limited purpose described in the first paragraph of this
section and was not designed to identify all deficiencies in internal control that might be material
weaknesses or significant deficiencies. Given these limitations, during our audit we did not identify any
deficiencies in internal control that we consider to be material weaknesses. However, material weaknesses
may exist that have not been identified.
KPMG LLP 6th Floor, Suite A 100 Westminster Street Providence, RI 02903-2321
KPMG LLP is a Delaware limited liability partnership, the U.S. member firm of KPMG International Cooperative (“KPMG International”), a Swiss entity.
39
Compliance and Other Matters
As part of obtaining reasonable assurance about whether the University’s financial statements are free from
material misstatement, we performed tests of its compliance with certain provisions of laws, regulations,
contracts, and grant agreements, noncompliance with which could have a direct and material effect on the
determination of financial statement amounts. However, providing an opinion on compliance with those
provisions was not an objective of our audit, and accordingly, we do not express such an opinion. The
results of our tests disclosed no instances of noncompliance or other matters that are required to be
reported under Government Auditing Standards.
Purpose of this Report
The purpose of this report is solely to describe the scope of our testing of internal control and compliance
and the results of that testing, and not to provide an opinion on the effectiveness of the University’s
internal control or on compliance. This report is an integral part of an audit performed in accordance with
Government Auditing Standards in considering the University’s internal control and compliance.
Accordingly, this communication is not suitable for any other purpose.
October 24, 2014

40
Independent Auditors’ Reports on Compliance for Each Major Federal Program and Report on
Internal Control Over Compliance Required OMB Circular A-133, Audits of States, Local
Governments, and Non-Profit Organizations
The President and Corporation
Brown University:
Report on Compliance for Each Major Federal Program
We have audited Brown University’s (the University’s) compliance with the types of compliance
requirements described in the OMB Circular A-133 Compliance Supplement that could have a direct and
material effect on the University’s major federal program for the year ended June 30, 2014. Brown
University’s major federal program is identified in the summary of auditors’ results section of the
accompanying schedule of findings and questioned costs.
Management’s Responsibility
Management is responsible for compliance with the requirements of laws, regulations, contracts, and grants
applicable to its federal programs.
Auditors’ Responsibility
Our responsibility is to express an opinion on compliance for the University’s major federal program based
on our audit of the types of compliance requirements referred to above. We conducted our audit of
compliance in accordance with auditing standards generally accepted in the United States of America; the
standards applicable to financial audits contained in Government Auditing Standards, issued by the
Comptroller General of the United States; and OMB Circular A-133, Audits of States, Local Governments,
and Non-Profit Organizations. Those standards and OMB Circular A-133 require that we plan and perform
the audit to obtain reasonable assurance about whether noncompliance with the types of compliance
requirements referred to above that could have a direct and material effect on a major federal program
occurred. An audit includes examining, on a test basis, evidence about the University’s compliance with
those requirements and performing such other procedures as we considered necessary in the circumstances.
We believe that our audit provides a reasonable basis for our opinion on compliance for the major federal
program. However, our audit does not provide a legal determination of the University’s compliance.
Opinion on Each Major Federal Program
In our opinion, the University complied, in all material respects, with the types of compliance requirements
referred to above that could have a direct and material effect on its major federal programs for the year
ended June 30, 2014.
KPMG LLP 6th Floor, Suite A 100 Westminster Street Providence, RI 02903-2321
KPMG LLP is a Delaware limited liability partnership, the U.S. member firm of KPMG International Cooperative (“KPMG International”), a Swiss entity.

41
Report on Internal Control over Compliance
Management of the University is responsible for establishing and maintaining effective internal control
over compliance with the types of compliance requirements referred to above. In planning and performing
our audit of compliance, we considered the University’s internal control over compliance with the types of
requirements that could have a direct and material effect on each major federal program to determine the
auditing procedures that are appropriate in the circumstances for the purpose of expressing an opinion on
compliance for each major federal program and to test and report on internal control over compliance in
accordance with OMB Circular A-133, but not for the purpose of expressing an opinion on the
effectiveness of internal control over compliance. Accordingly, we do not express an opinion on the
effectiveness of University’s internal control over compliance.
A deficiency in internal control over compliance exists when the design or operation of a control over
compliance does not allow management or employees, in the normal course of performing their assigned
functions, to prevent, or detect and correct, noncompliance with a type of compliance requirement of a
federal program on a timely basis. A material weakness in internal control over compliance is a deficiency,
or combination of deficiencies, in internal control over compliance, such that there is a reasonable
possibility that material noncompliance with a type of compliance requirement of a federal program will
not be prevented, or detected and corrected, on a timely basis. A significant deficiency in internal control
over compliance is a deficiency, or a combination of deficiencies, in internal control over compliance with
a type of compliance requirement of a federal program that is less severe than a material weakness in
internal control over compliance, yet important enough to merit attention by those charged with
governance.
Our consideration of internal control over compliance was for the limited purpose described in the first
paragraph of this section and was not designed to identify all deficiencies in internal control over
compliance that might be material weaknesses or significant deficiencies. We did not identify any
deficiencies in internal control over compliance that we consider to be material weaknesses. However,
material weaknesses may exist that have not been identified.
The purpose of this report on internal control over compliance is solely to describe the scope of our testing
of internal control over compliance and the results of that testing based on the requirements of OMB
Circular A-133. Accordingly, this report is not suitable for any other purpose.
Report on Schedule of Expenditures of Federal Awards Required by OMB Circular A-133
We have audited the financial statements of the University as of and for the year ended June 30, 2014, and
have issued our report thereon dated October 24, 2014, which contained an unmodified opinion on those
financial statements. Our audit was conducted for the purpose of forming an opinion on the financial
statements as a whole. The accompanying schedule of expenditures of federal awards is presented for
purposes of additional analysis as required by OMB Circular A-133 and is not a required part of the
financial statements. Such information is the responsibility of management and was derived from and
relates directly to the underlying accounting and other records used to prepare the financial statements. The
information has been subjected to the auditing procedures applied in the audit of the financial statements
and certain additional procedures, including comparing and reconciling such information directly to the
underlying accounting and other records used to prepare the financial statements or to the financial
statements themselves, and other additional procedures in accordance with auditing standards generally
accepted in the United States of America. In our opinion, the schedule of expenditures of federal awards is
fairly stated in all material respects in relation to the financial statements as a whole.
February 20, 2015
BROWN UNIVERSITY
Schedule of Findings and Questioned Costs
Year ended June 30, 2014
42
(1) Summary of Auditors’ Results
Financial Statements
Type of auditors’ report issued: Unmodified
Internal control over financial reporting:
Material weakness(es) identified? yes x no
Significant deficiency(ies) identified that are
not considered to be material weakness(es)? yes x none reported
Noncompliance material to the financial
statements noted? yes x no
Federal Awards
Internal control over major programs:
Material weakness(es) identified? yes x no
Significant deficiency(ies) identified that are
not considered to be material weaknesses? yes x none reported
Type of auditors’ report issued on compliance
for major programs: Unmodified
Any audit findings disclosed that are required to be
reported in accordance with section 510(a)
of OMB Circular A-133? yes x no
Identification of Major Program
Name of federal program or cluster: CFDA Numbers:
Research and Development Cluster Various
Dollar threshold used to distinguish between
type A and type B programs: $3,000,000
Auditee qualified as low-risk auditee? x yes no
(2) Findings Relating to Financial Statements Reported in Accordance with Government Auditing
Standards
None.
(3) Findings and Questioned Costs Relating to Federal Awards
None.