brook trout thermal tolerance analyses - juvenile and ... · pdf filebrook trout thermal...
TRANSCRIPT
Brook Trout Thermal Tolerance Analysis – Juvenile and Adult, Summer Page 1
May 2017
Brook Trout (Salvelinus fontinalis) Thermal Tolerance Analyses – Juvenile and Adult, Summer
May 2017
Introduction
Recommended summer chronic and acute thermal tolerance values for juvenile and adult brook trout and
their justification are discussed below. The recommended tolerance values were developed in accordance
with the “Methodology for Developing Summer Thermal Tolerance Thresholds for Various Juvenile and
Adult Fish in Nevada” (March 2017).
Chronic Thermal Tolerance Thresholds
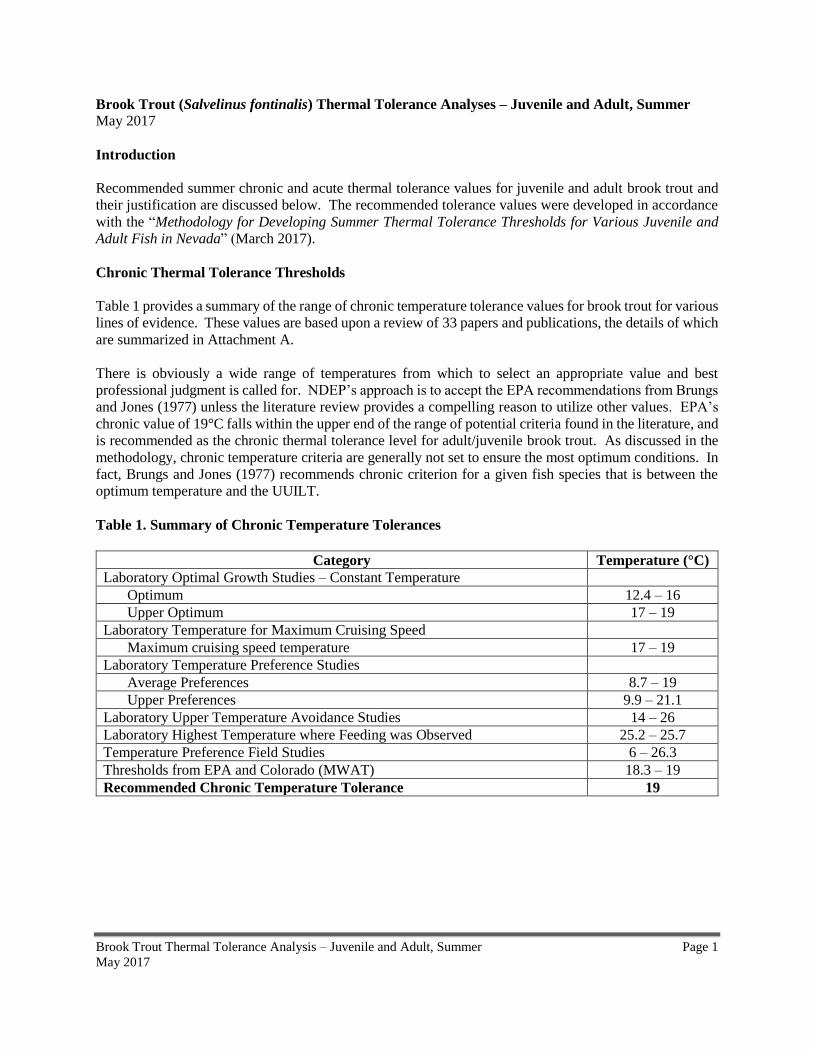
Table 1 provides a summary of the range of chronic temperature tolerance values for brook trout for various
lines of evidence. These values are based upon a review of 33 papers and publications, the details of which
are summarized in Attachment A.
There is obviously a wide range of temperatures from which to select an appropriate value and best
professional judgment is called for. NDEP’s approach is to accept the EPA recommendations from Brungs
and Jones (1977) unless the literature review provides a compelling reason to utilize other values. EPA’s
chronic value of 19°C falls within the upper end of the range of potential criteria found in the literature, and
is recommended as the chronic thermal tolerance level for adult/juvenile brook trout. As discussed in the
methodology, chronic temperature criteria are generally not set to ensure the most optimum conditions. In
fact, Brungs and Jones (1977) recommends chronic criterion for a given fish species that is between the
optimum temperature and the UUILT.
Table 1. Summary of Chronic Temperature Tolerances
Category Temperature (°C)
Laboratory Optimal Growth Studies – Constant Temperature
Optimum 12.4 – 16
Upper Optimum 17 – 19
Laboratory Temperature for Maximum Cruising Speed
Maximum cruising speed temperature 17 – 19
Laboratory Temperature Preference Studies
Average Preferences 8.7 – 19
Upper Preferences 9.9 – 21.1
Laboratory Upper Temperature Avoidance Studies 14 – 26
Laboratory Highest Temperature where Feeding was Observed 25.2 – 25.7
Temperature Preference Field Studies 6 – 26.3
Thresholds from EPA and Colorado (MWAT) 18.3 – 19
Recommended Chronic Temperature Tolerance 19

Brook Trout Thermal Tolerance Analysis – Juvenile and Adult, Summer Page 2
May 2017
Acute Thermal Tolerance Thresholds
Table 2 provides a summary of the range of acute temperature tolerance values for brook trout for various
lines of evidence. These values are based upon a review of 26 papers and publications, the details of which
are summarized in Attachment B.
For ease of presentation, the UILT and CTM values have been summarized by acclimation temperature
ranges. However as discussed in the methodology document, only the UILT and CTM values for
acclimation temperature near the recommended chronic criterion (19°C) are to be included in the acute
criterion development process. For brook trout, UILT and CTM values for acclimation temperatures 15 –
20°C are utilized for criterion development.
Table 2. Summary of Acute Temperature Tolerances
Category Temperature
Tolerances (°C)
Potential Acute
Criteria (°C)
Laboratory Lethal Studies – UILT/UUILT
UILT
Acclim. = 1 – 5°C 20.4 – 23.4
Acclim. = 5 – 10°C 19.4 – 23.7
Acclim. = 10 – 15°C 20.2 – 24.8
Acclim. = 15 – 20°C 24.3 – 25.3 22.3 – 23.31
Acclim. = 20 – 25°C 25.3 – 26.1
UUILT 20.1 – 25.3 18.1 – 23.31
Laboratory Lethal Studies – CTM
Acclim. = 5 – 10°C 28.0 – 29.0
Acclim. = 10 – 15°C 27.5 – 29.0
Acclim. = 15 – 20°C 28.0 – 30.8 21.3 – 24.12
Field Studies 15.8 – 28.5
Thresholds from EPA and Colorado 21.7 – 24
Recommended Acute Temperature Tolerance 24
1UILT and UUILT values reduced by 2°C to provide 100% survival (See Methodology) 2CTM values reduced by 4.7°C to estimate quasi-UILT values, and reduced by 2°C to provide 100% survival (See
Methodology)
A review of laboratory studies suggest that an appropriate acute criteria should fall between 18.1 and
24.1°C, while field studies suggest a wider range of 15.8 to 28.5°C. This is obviously a wide range from
which to select an appropriate value and best professional judgment is called for. NDEP’s approach is to
accept the EPA recommendations from Brungs and Jones (1977) unless the literature review provides a
compelling reason to utilize another value. EPA’s acute value of 24°C falls within the upper end of the
range of potential criteria found in the literature, and is recommended as the acute thermal tolerance level
for adult/juvenile brook trout.

Brook Trout Thermal Tolerance Analysis – Juvenile and Adult, Summer Page 3
May 2017
References
Baird, O.E., Krueger, C.C. 2003. Behavioral thermoregulation of brook and rainbow trout: comparison
of summer habitat use in an Adirondack river, New York. Transactions of the American Fisheries
Society 132:1194-1206.
Baldwin, N.W. 1957. Food consumption and growth of brook trout at different temperatures. Trans. Am.
Fish. Soc. 86:323-328.
Barton, D.R., W.D. Taylor, and R.M. Biette. 1985. Dimensions of riparian buffer strips required to
maintain trout habitat in southern Ontario streams. North American Journal of Fisheries Management
5:364-378.
Benfey, T.J., McCabe, L.E., Pepin, P., 1997. Critical thermal maxima of diploid and triploid brook charr,
Salvelinus fontinalis. Environ. Bioi. Fishes 49:259-264.
Benjamin, J. R., Dunham, J. B., & Dare, M. R. 2007. Invasion by nonnative brook trout in Panther Creek,
Idaho: roles of local habitat quality, biotic resistance, and connectivity to source habitats. Transactions of
the American Fisheries Society, 136(4):875-888.
Binns, N. A., and F. M. Eiserman. 1979. Quantification of fluvial trout habitat in Wyoming. Transactions
of the American Fisheries Society 108:215–228.
Biro, P.A. 1998. Staying cool: behavioral thermoregulation during summer by young-of-year brook trout
in a lake. T Am Fish Soc 127:212–222.
Bowlby, J. N., & Roff, J. C. 1986. Trout biomass and habitat relationships in southern Ontario streams.
Transactions of the American Fisheries Society, 115(4):503-514.
Brett, J. R. 1944. Some lethal temperature relations of Algonquin Park fishes. University of Toronto
Press.
Brungs, W.A. and B.R. Jones. 1977. Temperature Criteria for Freshwater Fish: Protocol and Procedures.
EPA-600/3-77-061. Environmental Research Laboratory, Duluth, Minnesota.
Carline, R.F. and J.F. Machung. 2001. Critical thermal maxima of wild and domestic strains of trout.
Trans. Amer. Fish. Soc. 130:1211-1216.
Chadwick, J. G., Nislow, K. H., & McCormick, S. D. 2015. Thermal onset of cellular and endocrine
stress responses correspond to ecological limits in brook trout, an iconic cold-water fish. Conservation
Physiology, 3(1), cov017.
Cherry, D.S., K.L. Dickson, and J. Cairns. 1975. Temperature selected and avoided by fish at various
acclimation temperatures. Jour. Of the Fish. Res. Board of Canada 32:485-491.
Cherry, D.S., K.L. Dickson, J. Carns, Jr., and J.R. Stauffer. 1977. Preferred, avoided, and lethal
temperatures of fish during rising temperature conditions. Jour. Of the Fish. Research Board of Canada
34:239-246
Brook Trout Thermal Tolerance Analysis – Juvenile and Adult, Summer Page 4
May 2017
Colorado Water Quality Control Division. 2007. Colorado temperature database.
Creaser, C. W. 1930. Relative importance of hydrogen ion concentration, temperature, dissolved oxygen,
and carbon dioxide tension on habitat selection by brook trout. Ecology 11:246–262.
Cunjak, R. A., D. Caissie, N. El-Jabi, P. Hardie, J. H. Conlon, T. L. Pollock, D. J. Gibson, and S.
Komadina-Douthwright. 1993. The Catamaran Brook (New Brunswick) habitat research project:
biological, physical, and chemical conditions (1990–1992). Canadian Technical Report of Fisheries and
Aquatic Sciences 1914.
De Staso, J. and F.J. Rahel. 1994. Influence of Water Temperature on Interactions between Juvenile
Colorado River Cutthroat Trout and Brook Trout in a Laboratory Stream, Transactions of the American
Fisheries Society, 123(3):289-297.
Dwyer, W. P., Piper, R. G., & Smith, C. E. 1983. Brook trout growth efficiency as affected by
temperature. The Progressive Fish-Culturist, 45(3):161-163.
Eaton, J.G., J.H. McCormick, B.E. Goodno, D.G. O’Brien, H.G. Stefan, M. Hondzo, and R.M. Scheller.
1995. A field information-based system for estimating fish temperature tolerances. Fisheries 20(4):10-18.
Elson, P. F. 1942. Effect of temperature on activity of Salvelinus fontinalis. Jour. Fish Res. Bd. Canada,
5:461-70.
Embody, G.C. 1921. Concerning high water temperatures and trout. Transactions of the American
Fisheries Society 51: 58-64.
Fisher, K. C. and Elson, P. F. 1950. The selected temperature of Atlantic salmon and speckled trout and
the effect of temperature on the response to an electrical stimulus. Physiological zoology, 27-34.
Fry, F. E. J., Hart, J. S., & Walker, K. F. 1946. Lethal temperature relations for a sample of young
speckled trout. Salvelinus fontinalis, 1-47.
Galbreath, P. F., Adams, N. D., & Martin, T. H. 2004. Influence of heating rate on measurement of time
to thermal maximum in trout. Aquaculture, 241(1):587-599.
Galbreath, P. F., Adams, N. D., Sherrill III, L. W., and Martin, T. H. 2006. Thermal tolerance of diploid
versus triploid rainbow trout and brook trout assessed by time to chronic lethal maximum. Environmental
Biology of Fishes, 75(2):183-193.
Grande, M. and S. Andersen. 1991. Critical thermal maxima for young salmonids. Journal of Freshwater
Ecology 6:275-279.
Hokanson, K. E., McCormick, J. H., Jones, B. R., & Tucker, J. H. 1973. Thermal requirements for
maturation, spawning, and embryo survival of the brook trout, Salvelinus fontinalis. Journal of the
Fisheries Board of Canada, 30(7):975-984.

Brook Trout Thermal Tolerance Analysis – Juvenile and Adult, Summer Page 5
May 2017
Huff, D.D., S.L. Hubler, and A.N. Borisenko. 2005. Using field data to estimate the realized thermal
niche of aquatic vertebrates. North American Journal of Fisheries Management 25:346-360.
Kilgour, D.M., R.W. McCauley, and W. Kwain. 1985. Modeling the Lethal Effects of High Temperature
on Fish. Canadian Journal of Fisheries and Aquatic Sciense Vol. 42, p. 947-951.
Javaid, M.Y. and J.M. Anderson. 1967. Influence of starvation on selected temperature of some
salmonids. Jour. Of the Fish. Research Board of Canada 24:1515-1519.
Lee, R.M. and J.N. Rinne. 1980. Critical thermal maxima of five trout species in the southwestern United
States. Trans. Am. Fish. Soc. 109:632-635.
McCauley, R.W. 1958. Thermal relations of geographic races of Salvelinus. Can. J. Zool. 36(5):655-662.
McCormick, J. H., Hokanson, K. E., and Jones, B. R. 1972. Effects of temperature on growth and survival
of young brook trout, Salvelinus fontinalis. Journal of the Fisheries Board of Canada, 29(8):1107-1112.
McMahon, T. E., Zale, A. V., Barrows, F. T., Selong, J. H., and Danehy, R. J. 2007. Temperature and
competition between bull trout and brook trout: a test of the elevation refuge hypothesis. Transactions of
the American Fisheries Society, 136(5):1313-1326.
Mebane, C.A. 2002. Stream Fish Indexes. Pages 4-1 to 4-65 in C. S. Grafe, editor. Idaho Small Stream
Ecological Assessment Framework: an Integrated Approach. Idaho Department of Environmental
Quality, Boise.
Meisner, J. D. 1990. Potential loss of thermal habitat for brook trout, due to climatic warming, in two
southern Ontario streams. Transactions of the American Fisheries Society, 119(2):282-291.
Müller, R. 1977. Temperature selection of goldfish (Carassius auratus L.) and brook trout (Salvelinus
fontinalis Mitch.) after heterogeneous temperature acclimation. Journal of Thermal Biology, 2(1):5-7.
Nevada Division of Environmental Protection. March 2017. Methodology for Developing Summer
Thermal Tolerance Thresholds for Various Juvenile and Adult Fish in Nevada.
Peterson, R.H. 1973. Temperature selection of Atlantic salmon (Salmo salar) and brook trout (Salvelinus
fontinalis) as influenced by various chlorinated hydrocarbons. J. Fish. Res. Board Can. 30:1091-1097.
Peterson, R.H., A.M. Sutterlin, and J.L. Metcalfe. 1979. Temperature preference of several species of
Salmo and Salvelinus and some of their hybrids. J. Fish. Res. Board Can. 36:1137-1140.
Picard, C. R., Bozek, M. A., & Momot, W. T. 2003. Effectiveness of using summer thermal indices to
classify and protect brook trout streams in northern Ontario. North American Journal of Fisheries
Management, 23(1):206-215.
Ricker, W. E. 1934. An ecological classification of certain Ontario streams. Ontario Fisheries Research
Laboratory 49:7–114.

Brook Trout Thermal Tolerance Analysis – Juvenile and Adult, Summer Page 6
May 2017
Robinson J.M., D.C. Josephson, B.C. Weidel, and C.E. Kraft. 2010. Influence of variable interannual
summer water temperatures on brook trout growth, consumption, reproduction, and mortality in an
unstratified Adirondack lake. T Am Fish Soc 139: 685–699.
Selong, J. H., T. E. McMahon, A. V. Zale, and F. T. Barrows. 2001. Effect of temperature on the growth
and survival of bull trout, with application of an improved method of determining thermal tolerance in
fishes. Transactions of the American Fisheries Society 130:1026–1037.
Stitt, B.C., G. Burness, K.A. Burgomaster, S. Currie, J.L. McDermid, and C.C. Wilson. 2014.
Intraspecific variation in thermal tolerance and acclimation capacity in brook trout (Salvelinus fontinalis):
physiological implications for climate change. Physiol Biochem Zool 87: 15–29.
Sullivan, C. M., and K. C. Fisher. 1953. Seasonal fluctuations in the selected temperature of speckled
trout, Salvelinus fontinalis (Mitchell). J. Fish. Res. Board Can. 10: 187-195.
Taniguchi, Y., F.J. Rahel, D.C. Novinger, and K.G. Gerow. 1998. Temperature mediation of competitive
interactions among three fish species that replace each other along longitudinal stream gradients.
Canadian Journal of Fisheries and Aquatic Sciences 55:1894-1901.
Wehrly, K.E., M.J. Wiley, and P.W. Seelbach. 2003. Classifying regional variation in thermal regime
based on stream fish community patterns. Transactions of the American Fisheries Society 132:18–38.
Wehrly, K. E., Wang, L., & Mitro, M. 2007. Field-based estimates of thermal tolerance limits for trout:
incorporating exposure time and temperature fluctuation. Transactions of the American Fisheries Society,
136(2):365-374.

ATTACHMENT A
Detailed Summary of Chronic Thermal Tolerance Values for Brook Trout, Juvenile and Adult, Summer

Attachment A
Brook Trout Thermal Tolerance Analysis – Juvenile and Adult, Summer Page A-1
May 2017
Table A-1. Chronic Temperature Tolerances – Laboratory Optimal Growth Studies
1After four weeks at one temperature (9, 13, 17, and 21°C) the brook trout were transferred to the next highest or lowest temperature depending on
whether it was ascending or descending the temperature series.
2Water temperatures were gradually adjusted over a 1-week period until the desired test temperature was reached. Fish were held at that
temperature for 1 week before the test was begun. 3Fish were held in test tanks for 2 weeks at 8°C before a temperature adjustment of 1.0°C per day to reach the treatment temperature; constant
temperatures were then maintained for 60 days.
Reference Age or Size Acclim.
Temp. (°C)
Optimum Growth Temperature Upper Optimum Growth Temperature
Temp. (°C) Comment Temp. (°C) Comment
Baldwin (1957) Yearling 91 13 17 At 17°C feeding decreased.
Dwyer et al.
(1983) 0.6 g
Test
Temperature2 13 - 16 19
The decrease in growth rate of
fish held at 19°C was the result
of a temperature stress.
Hokanson et al.
(1973) Yearling 9 16 19
10 – 19°C is the optimum
range for growth (unrestricted
rations) and relative condition
factor.
McCormick et
al. (1972) ≤ 8 week 2.5 – 15 12.4 – 15.4 17.9
9.8 – 17.9°C provided suitable
conditions for brook trout
growth.
McMahon et al.
(2007)
8 months
posthatch 83 14
Attachment A
Brook Trout Thermal Tolerance Analysis – Juvenile and Adult, Summer Page A-2
May 2017
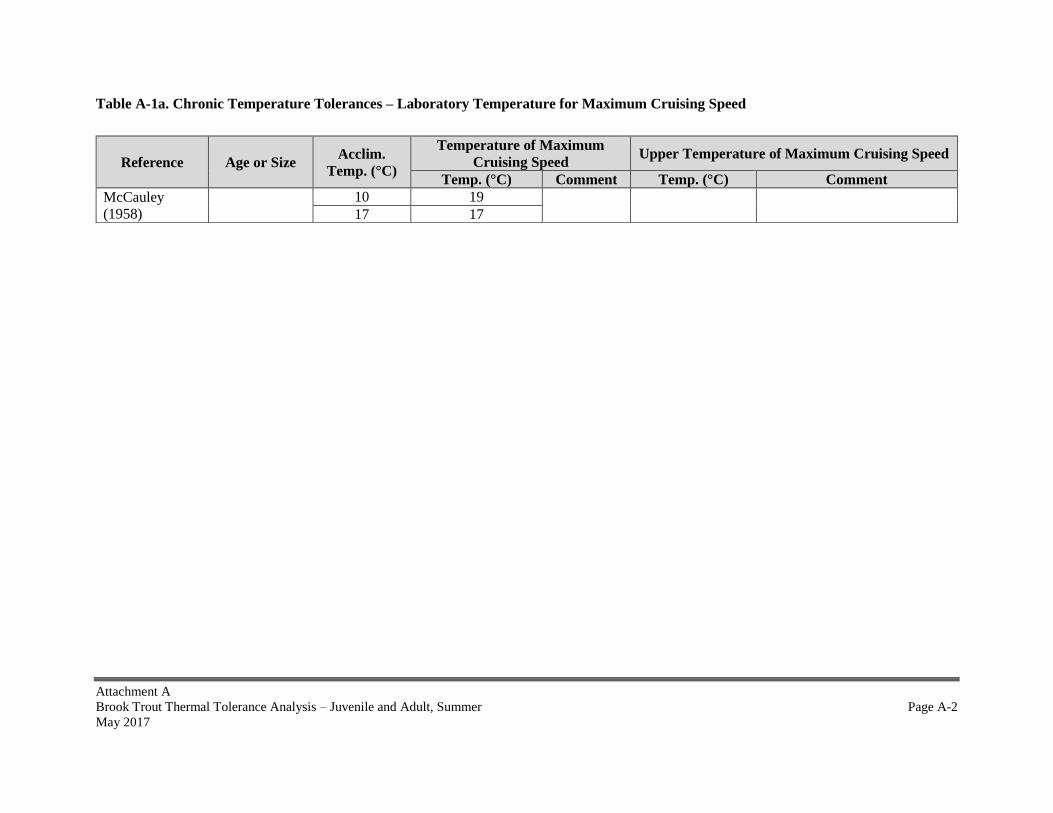
Table A-1a. Chronic Temperature Tolerances – Laboratory Temperature for Maximum Cruising Speed
Reference Age or Size Acclim.
Temp. (°C)
Temperature of Maximum
Cruising Speed Upper Temperature of Maximum Cruising Speed
Temp. (°C) Comment Temp. (°C) Comment
McCauley
(1958)
10 19
17 17

Attachment A
Brook Trout Thermal Tolerance Analysis – Juvenile and Adult, Summer Page A-3
May 2017
Table A-2. Chronic Temperature Tolerances – Laboratory Preference Studies
Reference Age or Size
Acclim.
Temp.
(°C)
Average Preference
Temperature Upper Preference Temperature Final Preferendum
Temp.
(°C) Comment Temp. (°C) Comment Temp. (°C) Comment
Cherry et al.
(1975) <1 year
6.0 11.2
12.2
Upper 95%
confidence limits
on averages
9.0 11.3 13.4
12.0 13.7 14.6
15.0 15.2 16.0
18.0 18.0 17.6
21.0 18.3 19.3
24.0 19 21.1
Cherry et al.
(1977) <1 year
12.0 13.7
15.0
Upper 95%
confidence limits
on averages
15.5 – 16.8
15.0 15.2 16.1
18.0 17.2 17.3
21.0 18.3 18.8
24.0 19 20.5
Fisher and
Elson (1950) 1 year 4 10
Javaid and
Anderson
(1967)
Fingerlings 20
16 Average for
fasted fish
18 Average for fed
fish
Müller (1977)2 4.5 – 7.0 g 10 16.8
17.3 95% confidence
interval of mean
18 18.0 18.6
Peterson
(1973) Underyearling 13 12.4 – 15.3 13.5 – 18.5

Attachment A
Brook Trout Thermal Tolerance Analysis – Juvenile and Adult, Summer Page A-4
May 2017
Table A-2. Chronic Temperature Tolerances – Laboratory Preference Studies (cont’d)
Reference Age or Size
Acclim.
Temp.
(°C)
Average Preference
Temperature Upper Preference Temperature Final Preferendum
Temp.
(°C) Comment Temp. (°C) Comment Temp. (°C) Comment
Peterson et al.
(1979)
Fry 10.6 8.7 9.9 Upper extent
preferences based
upon 1 stand. dev.
above avg.
12.7 11.5
12.6
Fingerling 12.1 17.5 19.5
Sullivan and
Fisher (1953) 2 – 3 inches
2 – 8.5 8 – 16.5
4 9 – 12

Attachment A
Brook Trout Thermal Tolerance Analysis – Juvenile and Adult, Summer Page A-5
May 2017
Table A-3. Chronic Temperature Tolerances – Laboratory Upper Temperature Avoidance Studies
Reference Age or Size Acclim. Temp. (°C) Temperature (°C) Comment
Cherry et al. (1975) <1 year 6 – 241 14 – 25
Cherry et al. (1977) <1 year 12 – 241 15 – 26
Elson (1942) 12 cm 10 25 – 26 1Attempts to acclimate to levels above 24°C caused some mortality
Table A-4. Chronic Temperature Tolerances – Other Laboratory Studies
Reference Age or Size Acclim. Temp. (°C) Temperature (°C) Comment
Chadwick et al. (2015) Juvenile 0+ (11.7 – 29.0
g) 16 20.7 – 21.21
Taniguchi et al. (1998) 107 – 165 mm fork length 3 – 262 243 1Laboratory experiments to show that the temperature thresholds in brook trout for increased gill heat shock protein-70 (20.7°C) and plasma
glucose (21.2°C) are similar to their proposed thermal ecological limit of 21.0°C. 2During acclimation to 24°C, 2 of 10 brook trout died. During acclimation to 26°C, all 10 brook trout died. 3For brook trout, there was a significant increase in food consumption at temperatures below 24°C. This indicates that the presence of other fish
species, not loss of appetite, was the reason for low food consumption in trials where brook trout was not the dominant species in the stream.
However, at 24 °C, there was no significant increase in food consumption and in three of five replicates brook trout consumed no food items even
when they were the only species present. Therefore, at 24°C, lack of appetite, not behavioral interactions, was the likely reason that brook trout did
not eat in the presence of other species.
Table A-5. Chronic Temperature Tolerances – Highest Temperature where feeding was observed
Reference Temperature (°C) Comment
Grande and Anderson
(1991) 25.2 – 25.7 Highest temperature where feeding was observed

Attachment A
Brook Trout Thermal Tolerance Analysis – Juvenile and Adult, Summer Page A-6
May 2017
Table A-6. Chronic Temperature Tolerances – Field Studies
Reference Temperature (°C) Comment
Barton et al. (1985) <22 Streams with a trimean weekly maxima less than 22°C had trout; warmer streams had, at
best, only marginal trout populations.
Baird and Krueger (2003) 11.8 – 26.3 Brook trout presence in the higher end of this range was limited to brief excursions from
coolwater refugia to feed.
Benjamin et al. (2007) 11 – 19 Occurrence of small and large brook trout in Panther Creek, a tributary to the Salmon River
in Idaho
Biro (1998) 15 – 20 In July, when ambient water temperatures ranged from 23°C to 27°C, trout lay on the
bottom in the coldest water available (18–20°C).
Chadwick et al. (2015) <21 Field assays demonstrated increased plasma glucose, cortisol, and heat shock protein-70
concentrations at field site where mean daily temperature exceeded 21.0°C.
Creaser and Brown (1927)
as cited in Creaser 1930 <18 Brook trout certainly tolerate and probably prefer waters below 18°C.
Eaton et al. (1995) 22.3 Based upon 95th percentile of 5% highest weekly average temperatures
Elson (1939) as cited in
Elson (1942) <21
When Lake Ainslie reached temperatures above 21°C, brook trout moved to a brook that
was generally 4°C to 6°C cooler than the lake.
Mebane (2002)
6 – 22 1.5 times the interquartile value
11 – 15.5 Lower to upper quartile
13 Median
Ott and Maret (2003) 13.5 – 18.5 Maximum weekly stream temperature range
Picard et al. (2003)
14.8 Mean summer temperature of brook trout streams in northern Ontario.
17.1 Estimated MWAT value using Standardization conversion discussed in Methodology
document (MDMT = 1.05 x Summer Average + 1.6)
Robinson et al. (2010) ≤20 The growth of older, larger brook trout (age ≥ 2) is negatively impacted by warm summer
water temperatures (>20°C).
Wehrly et al. (2003) 10 – 22 Mean temperatures at sites where brook trout were present at average or above-average
standing stocks ranged from 10°C to 22°C.

Attachment A
Brook Trout Thermal Tolerance Analysis – Juvenile and Adult, Summer Page A-7
May 2017
Table A-6. Chronic Temperature Tolerances – Field Studies (cont’d)
Reference Temperature (°C) Comment
Wehrly et al. (2007)1
25.3 (MEANT) 1 d Maximum daily mean temperature (MEANT)
22.5 (MEANT) 14 d Maximum daily mean temperature (MEANT)
22.1 (MEANT) 21 d Maximum daily mean temperature (MEANT)
21.0 (MEANT) 63 d Maximum daily mean temperature (MEANT)
23.3 (MEANT) 7-d Maximum daily mean temperature (MEANT)
Taniguchi et al. (1998) 9 – 23 Occurrence of brook trout in the Horse Creek drainage of southern Wyoming. 1Results based upon field observations of both brook and brown trout.
Table A-7. Chronic Temperature Tolerances – EPA and Colorado
Reference Temperature (°C) Comments
EPA (1977) 19 Recommended level as MWAT
Colorado WQCD (2007) 18.3 Recommended level as MWAT

ATTACHMENT B
Detailed Summary of Acute Thermal Tolerance Values for Brook Trout, Juvenile and Adult, Summer

Attachment B
Brook Trout Thermal Tolerance Analysis – Juvenile and Adult, Summer Page B-1
May 2017
Table B-1. Acute Temperature Tolerances – Laboratory Lethal Temperatures, UILT/UUILT
Reference Size or Age Acclim. Temp.
(°C) Test Duration
UILT UUILT
Temp. (°C) Comment Temp. (°C) Comment
Brett (1944) 5.69 inches Unknown 1-d 26.1
Fry et al. (1946) Yearling
3
Various
23.4
25.3 11 24.5
20 25.3
24 25.3
Kilgour et al.
(1985) Unknown 14 Unknown 23.8
McCormick et
al. (1972)
Newly hatched
alevin (0.04 –
0.05 g)
2.5
7-d
20.4
20.1
Ultimate
Upper 7-d
TL50
7 19.4
9.5 20.4
12 20.2
12 1-d 22.5
Swim-up
alevin (0.1 –
0.2 g)
7.5
7-d
22.2
24.5 9.5 23.7
12 24.8
15 24.3

Attachment B
Brook Trout Thermal Tolerance Analysis – Juvenile and Adult, Summer Page B-2
May 2017
Table B-2. Acute Temperature Tolerances – Laboratory Lethal Temperatures, Critical Thermal Maximum
Reference Size or Age Acclim. Temp.
(°C)
Rate
Temperature
(°C) Endpoint
Benfey et al. (1997)1
Underyearling (25 g)
Unknown
0.033°C/min
(2°C/hour)
Trial 1 = 29.1 Loss of equilibrium
Trial 2 = 28.3
Underyearling (25 g) 0.25°C/min
(15°C/hour)
Trial 1 = 29.5 Loss of equilibrium
Trial 2 = 29.8
Yearling (668g) 0.033°C/min
(2°C/hour)
Trial 1 & 2 =
27.7 Loss of equilibrium
Yearling (668g) 0.25°C/min
(15°C/hour)
Trial 1 & 2 =
29.3 Loss of equilibrium
Carline and Machung
(2001) Unknown 10.6 0.3°C/min (18°C/hour)
Domestic = 28.2 Loss of equilibrium
Wild = 28.72
De Staso and Rahel
(1994) 97-182 mm 10 0.2°C/min (12°C/hour) 29 Loss of equilibrium
Galbreath et al. (2004) Juvenile 15
2, 4, 8, 24°C/day
(0.08,0.17, 0.33,
1°C/hour)
28.0 – 28.9 Loss of equilibrium
Galbreath et al. (2006) Juvenile 12.5 – 16.53 2°C/day (0.08°C/hour) 27.5 - 28.1 Loss of equilibrium
Grande and Anderson
(1991) 2-3 months post-hatch 17
1°C/day (0.04°C/hour) 26.2 Death4
2°C/day (0.08°C/hour) 27.2
Lee and Rinne (1980) 15-20 cm
10 0.02°C/min (1.2°C/hour)
28.7
Loss of equilibrium
20 29.8
10
Daily fluctuation of 6°C;
increased 1°C every 48
hours (0.02°C/hour)
285
Selong et al. (2001)6 Unknown 8 0.17°C/min
(10.2°C/hour)
28.3 Unknown
20 30.8
Stitt et al. (2014) 10.9 – 13.1 cm
12.1 – 24.8 g 8 – 20
0.33°C/min
(19.8°C/hour) 27.5 Loss of equilibrium

Attachment B
Brook Trout Thermal Tolerance Analysis – Juvenile and Adult, Summer Page B-3
May 2017
1Tested both diploid and triploid brook trout. No effect of ploidy on CTM was found. Underyearlings had higher CTM values than yearlings (29.2
± 0.1°C versus 28.5 ± 0.1°C, p < 0.05). Female yearlings, which were immature, had higher CTM values than males, which had previously
matured as one-year-olds (28.8 ± 0.1° C versus 28.3 ± 0.1° C, p < 0.001). 2The mean CTMax for wild brook trout was 0.5°C higher than that of domestic brook trout. 3Only a range of acclimation temperatures is reported in paper 4Critical thermal maxima LT50 (temperature giving 50% mortality). 5Maximum daily temperature with temperatures varying from 22 to 28°C. 6These results are from unpublished data generated by Selong et al. as reported in Selong et al. (2001).
Table B-1. Acute Temperature Tolerances – Other Laboratory Studies
Reference Size or Age Acclim. Temp.
(°C) Comment
Taniguchi et al.
(1998)
107-165 mm
fork length 10
During acclimation to 26°C, all 10 brook trout died. Fish were held at 10°C at least 2
weeks prior to the onset of thermal acclimation for each experiment.

Attachment B
Brook Trout Thermal Tolerance Analysis – Juvenile and Adult, Summer Page B-4
May 2017
Table B-3. Acute Temperature Tolerances – Field Studies
Reference Temperature (°C) Comments
Cunjak et al. (1993) 23 – 26
Elson (1942) 21 When Lake Ainslie reached temperatures above 21°C, brook trout
moved to a brook that was generally 4°C to 6°C cooler than the lake.
Embody (1921) 28.5
The brook trout passed through a temperature of 28.5 C without loss,
but with evident distress and failure of appetite. They apparently
recovered on a drop of nine degrees overnight and a maximum of 26.5
C the following day. They lived through five succeeding days with the
maximal temperatures ranging from 26 to 27 C., but began to die at 29
(mortality 20 percent). None died the following day, July 4, at 28; but
on July 5 at a temperature of 28.4 C., the mortality was 100 percent.
Huff et al. (2005)
15.2 (MWMT) Value is upper limit of Realized Thermal Niche
15.8 (MDMT) Estimated MDMT value using Standardization conversion discussed in
Methodology document (MDMT = 1.04 x MWMT)
Meisner (1990) 24
Picard et al. (2003)
19.8 Maximum summer temperature of brook trout streams in northern
Ontario.
18.4 Mean maximum summer temperature of brook trout streams in northern
Ontario.
Robinson et al. (2010) 20 The growth of older, larger brook trout (age ≥ 2) is negatively impacted
by warm summer water temperatures (>20°C)
Wehrly et al. (2007)1
27.6 1 d Maximum daily maximum temperature (MAXT)
24.6 14 d Maximum daily maximum temperature (MAXT)
24.2 21 d Maximum daily maximum temperature (MAXT)
22.9 63 d Maximum daily maximum temperature (MAXT)
25.4 7-d Maximum daily maximum temperature (MAXT) 1Results based upon field observations of both brook and brown trout

Attachment B
Brook Trout Thermal Tolerance Analysis – Juvenile and Adult, Summer Page B-5
May 2017
Table B-4. Acute Temperature Tolerances – EPA and Colorado
Reference Temperature (°C) Comments
EPA (1977) 24 No metric (DM, MWMT, etc.) recommended
Colorado WQCD (2007) 21.7 Recommended level as DM