broadway center phoenix partners, llc david hansen (development) amy merritt (finance) thacher...
TRANSCRIPT

Broadway Center
Phoenix Partners, LLC
David Hansen (Development)
Amy Merritt (Finance)
Thacher Tiffany (Planning)
Yew Chin Tan (Legal)
Phoenix Partners, LLC
Team Objectiveso Create financially viable retail developmento Improve retail shopping options for residents in
underserved areao Understand the New Market Tax Credits program
Development Team

Broadway Center
Development Team
Site OverviewMarket StudyDesign and ProgramNew Market Tax CreditsFinance
A grocery-anchored neighborhood shopping center
BR
OA
DW
AY

Site Overview
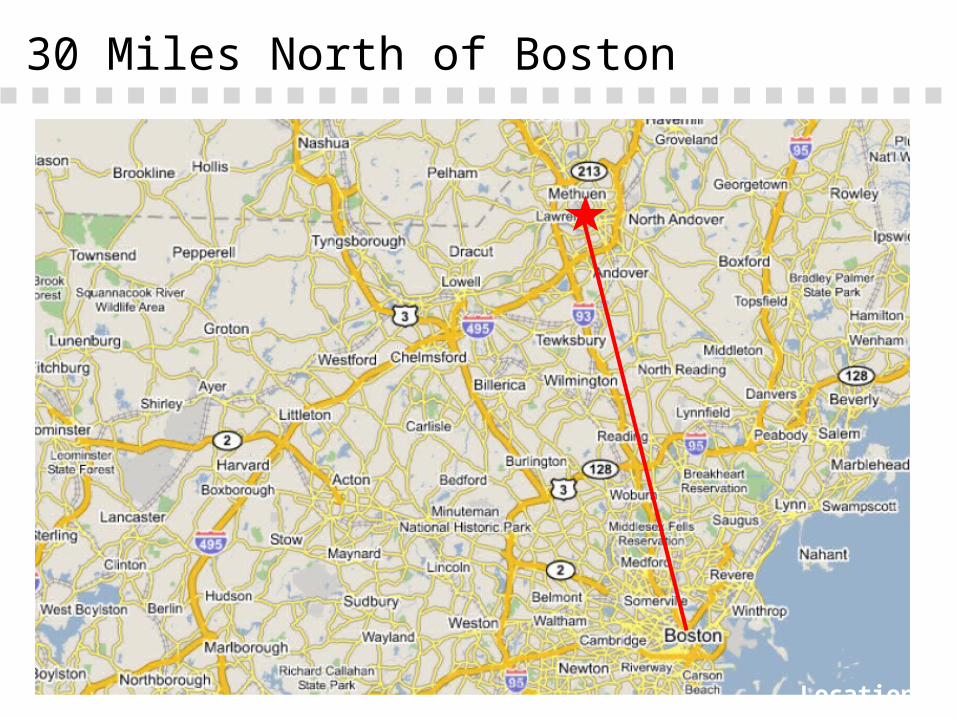
30 Miles North of Boston
Location & Context
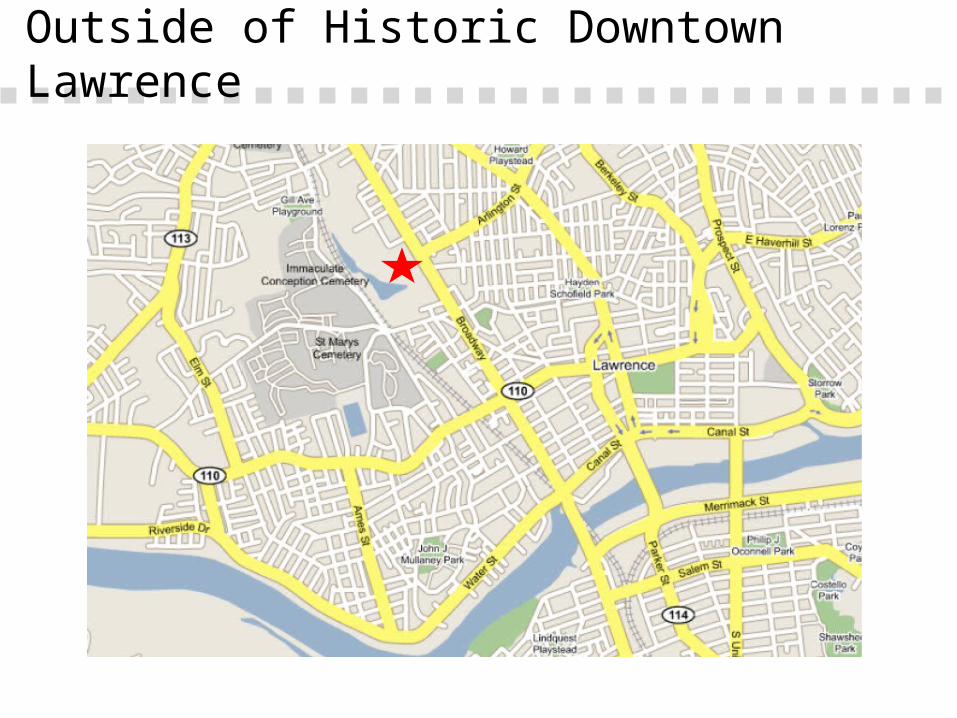
Outside of Historic Downtown Lawrence
Location & Context

Sit
e
METHUEN
LAWRENCE

Str
eets
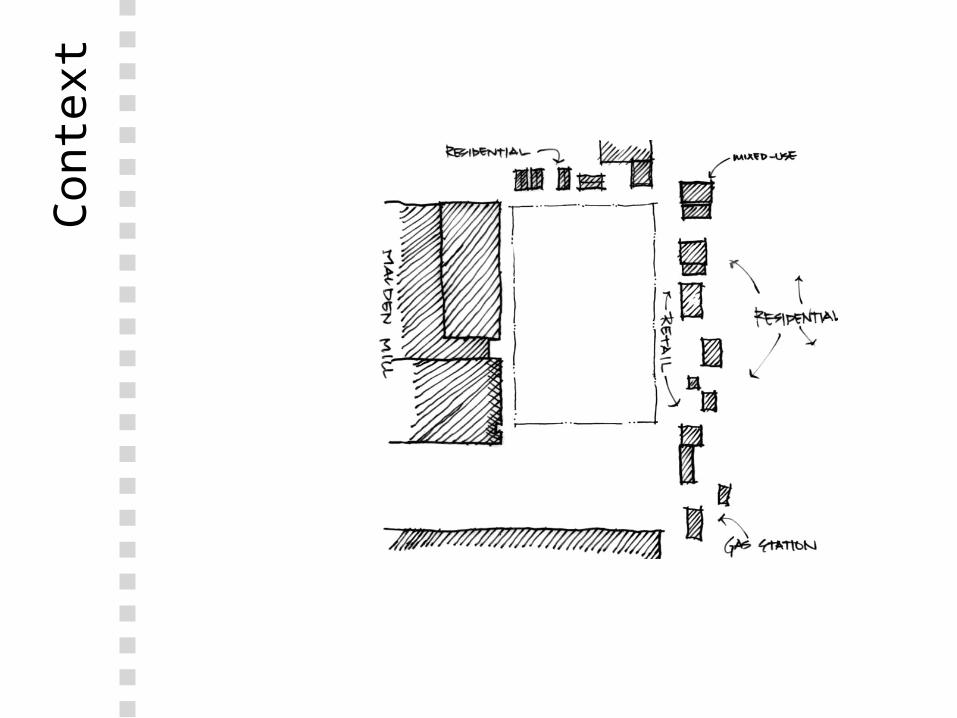
Conte
xt

Views from the site
Location & Context

Malden Mills Facility
Location & Context

Zoning
Site Analysis: Zoning
*overlay district under development
Lawrence Methuen% Land Area per City 15% 85%
Permissible as of right No* No
Timeline to obtain permits 12 mos. 9-12 mos.
Special permit required No Yes
Site Plan Review Yes Yes
Public Approval No Yes
Parking Req’d 3.3 / 1,000 4.0 / 1,000 +

Market Study

Primary Trade Area
Market Analysis

o 12,500 Householdso 70% Latinoo 25% Single Mother Familieso $28,500 Median Household Incomeo 13,200 Average Daily Traffic
o Center of Latino business sectoro Neighborhood based on geography and relationships
What this means . . .
Market Analysis
Trade Area Profile
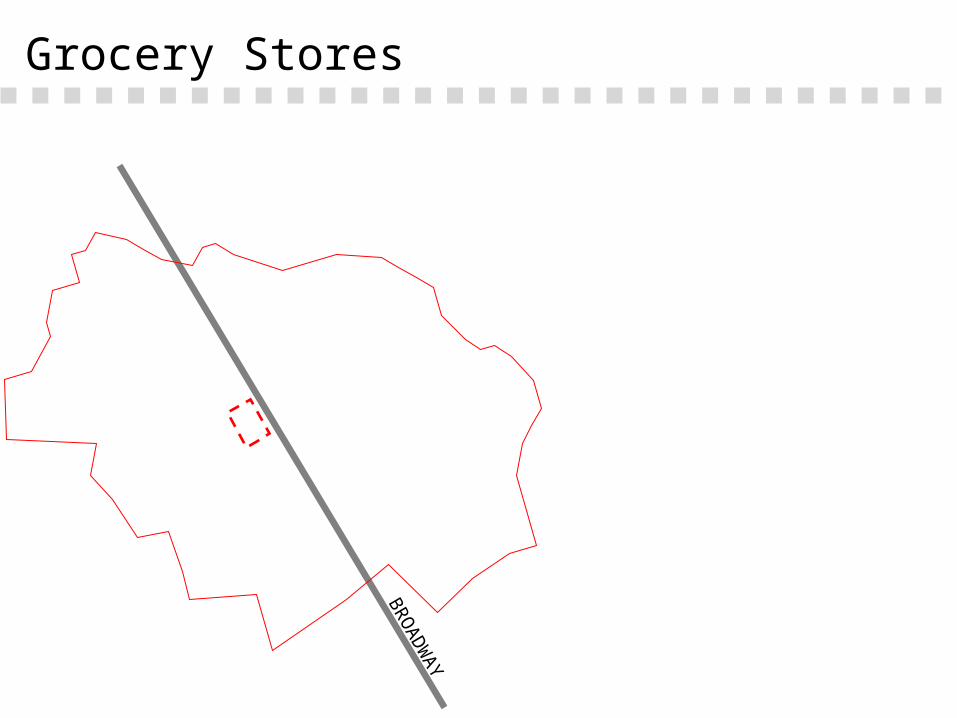
Grocery Stores
BRO
AD
WAY

Grocery Stores
One mile
Grocery Store
BRO
AD
WAY
Super Stop & Shop (2.5miles)
Market Basket (2.5miles)
DeMoula’s (1.8miles)
Market Basket (1.3miles)

Grocery Store Absorption
CAPTURE RATE (Reilly Factor-based)Capture Rate(Reilly Factor / Actual)
Market Basket (on Pleasant Valley) 2.5 1.3 54%Super Stop & Shop 2.5 1.4 55%Market Basket (on Essex) 1.3 0.6 49%De Moula's (on Haverhill) 1.8 1 55%Average 2 1.1 53%
Miles to Competitor
Reilly Distance Factor
Trade Area Sales 34,000,000 Grocery Store Sales 89,180,000 Capture Rate 38%
CAPTURE RATE (Traffic-Based)

Grocery Store Absorption
Traffic Based Reilly FactorTotal Food Spent at Home 71,952,000 50,894,000 Capture Rate 38% 53%Estimate Store Sales 27,432,000 27,135,000
Current Store Average
CAPTURE RATE ANALYSIS
22,295,000
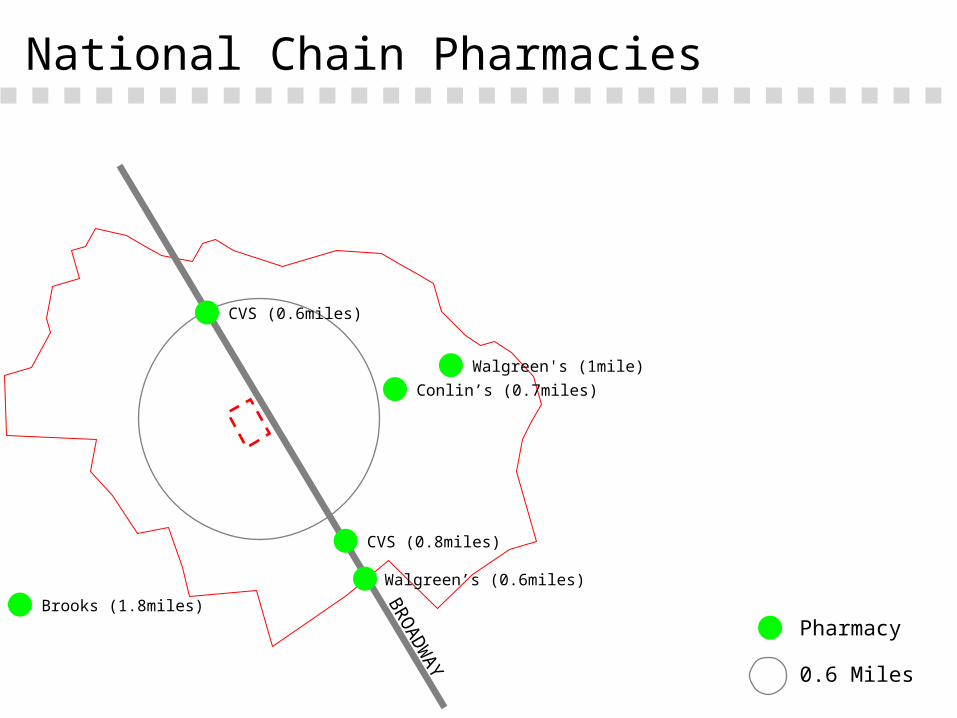
National Chain Pharmacies
0.6 Miles
Pharmacy
BRO
AD
WAY
Walgreen's (1mile)
CVS (0.6miles)
CVS (0.8miles)
Brooks (1.8miles)
Conlin’s (0.7miles)
Walgreen’s (0.6miles)
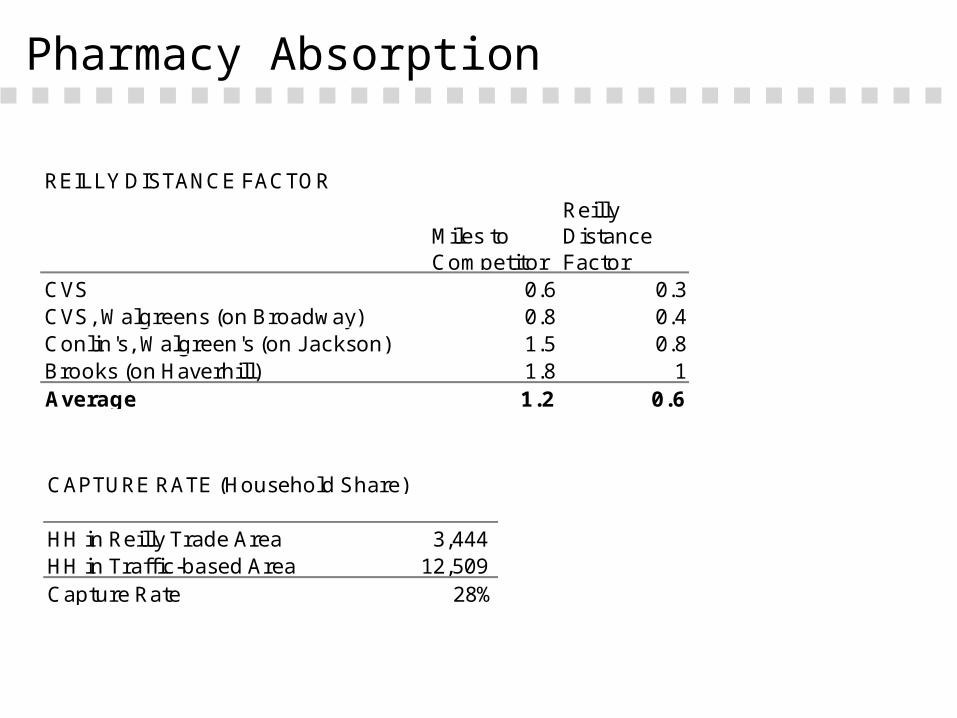
Pharmacy Absorption
REILLY DISTANCE FACTOR
CVS 0.6 0.3CVS, Walgreens (on Broadway) 0.8 0.4Conlin's, Walgreen's (on J ackson) 1.5 0.8Brooks (on Haverhill) 1.8 1Average 1.2 0.6
Miles to Competitor
Reilly Distance Factor
HH in Reilly Trade Area 3,444 HH in Traffic-based Area 12,509 Capture Rate 28%
CAPTURE RATE (Household Share)

Pharmacy Absorption
CAPTURE RATE ANALYSIS
Total Pharmacy Sales 25,620,000 Capture Rate 28%Estimate Store Sales 7,054,000
Current Store Average 4,270,000
Design and Program

Center Alternatives
Site Planning
Base case 2nd Story 3 Pads Hybrid
3rd 4th 1st 2ndLand Residual

Sit
e P
lan
40’
Anchor45,000 sf
Phar
mac
y13
,440
sf
Inlin
e22
,760
sf
BR
OA
DW
AY
\

Project Timeline
Months0 6 12 18 24 30 36
Due Dil / Negotiations
Permiting / Planning
Sitework
Construction
Leaseup
4
126
1212
New Market Tax Credit
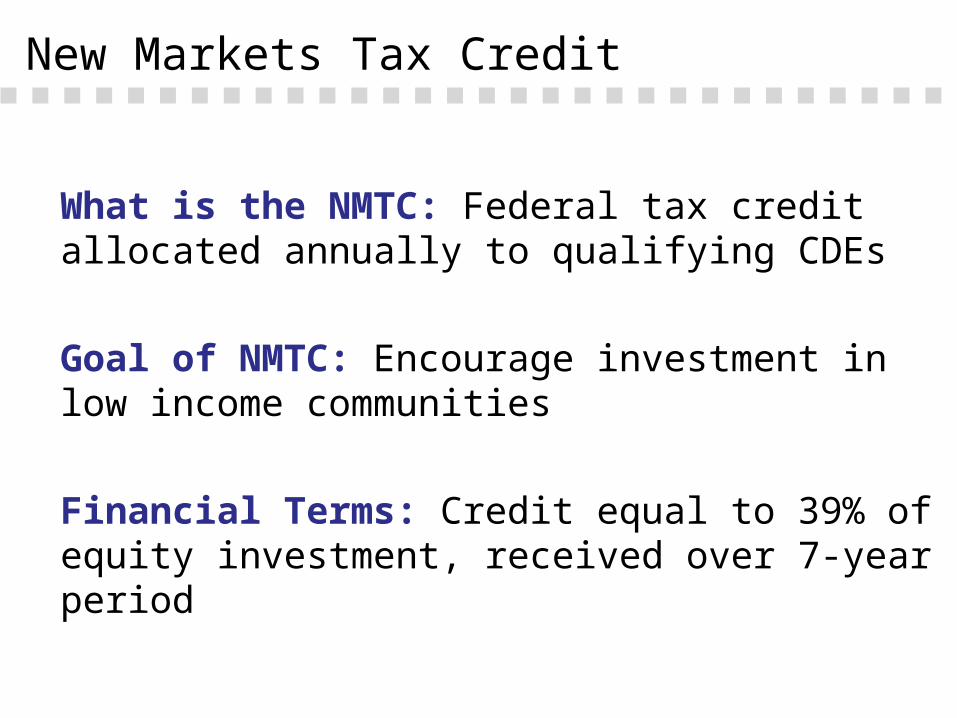
What is the NMTC: Federal tax credit allocated annually to qualifying CDEs
Goal of NMTC: Encourage investment in low income communities
Financial Terms: Credit equal to 39% of equity investment, received over 7-year period
New Markets Tax Credit
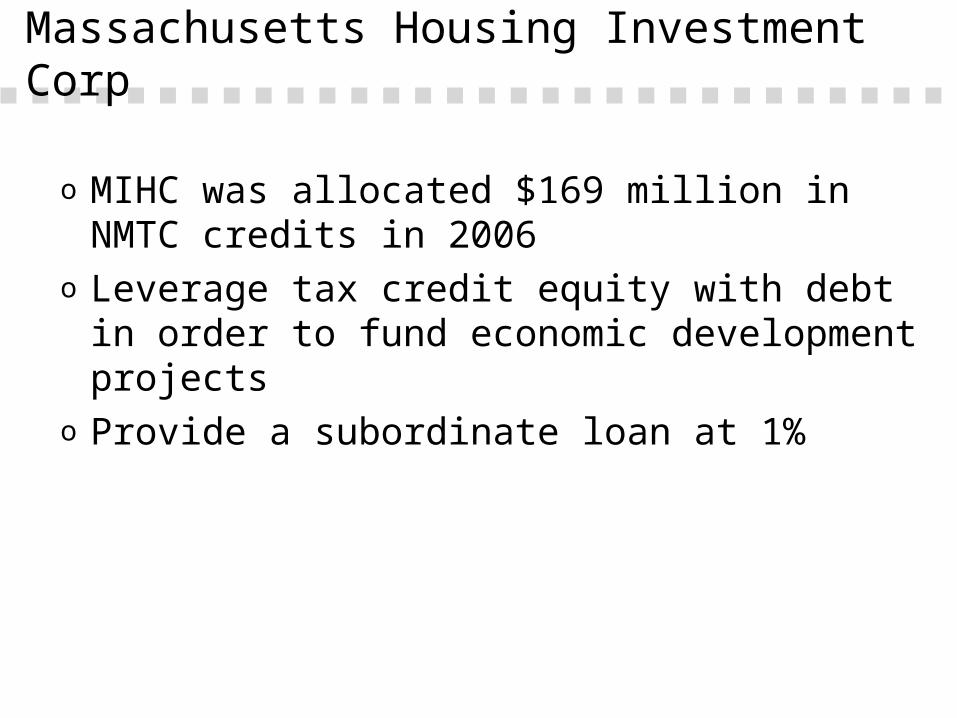
o MIHC was allocated $169 million in NMTC credits in 2006
o Leverage tax credit equity with debt in order to fund economic development projects
o Provide a subordinate loan at 1%
Massachusetts Housing Investment Corp

NMTC Structure
Project Finance
CDE
Phoenix Properties LLC
NMTC Fund I
MH
IC
equity
subordinate loan
CDFI Fund (US Treasury)
credits
debt equity
Lender Investor

NMTC Structure
Project Finance
Lender Investor
CDE
Phoenix Properties LLC
NMTC Fund I
MH
IC
$ and credits
$
CDFI Fund (US Treasury)
$ $ and credits

NMTC Structure
Project Finance
CDE
Phoenix Properties LLC
NMTC Fund I
MH
IC
equity
subordinate loan
CDFI Fund (US Treasury)
credits
debt equity
Lender Investor
Investor equity

o $15 billion between 2002 and 2007o 2006 and 2007’s authorization will each
equal $3.5 billiono Applications for 2007 funding are due in
September of 2006o Congressional reauthorization in 2008 is
likely
Future of the NMTC
Project Finance

Finance
Project Finance
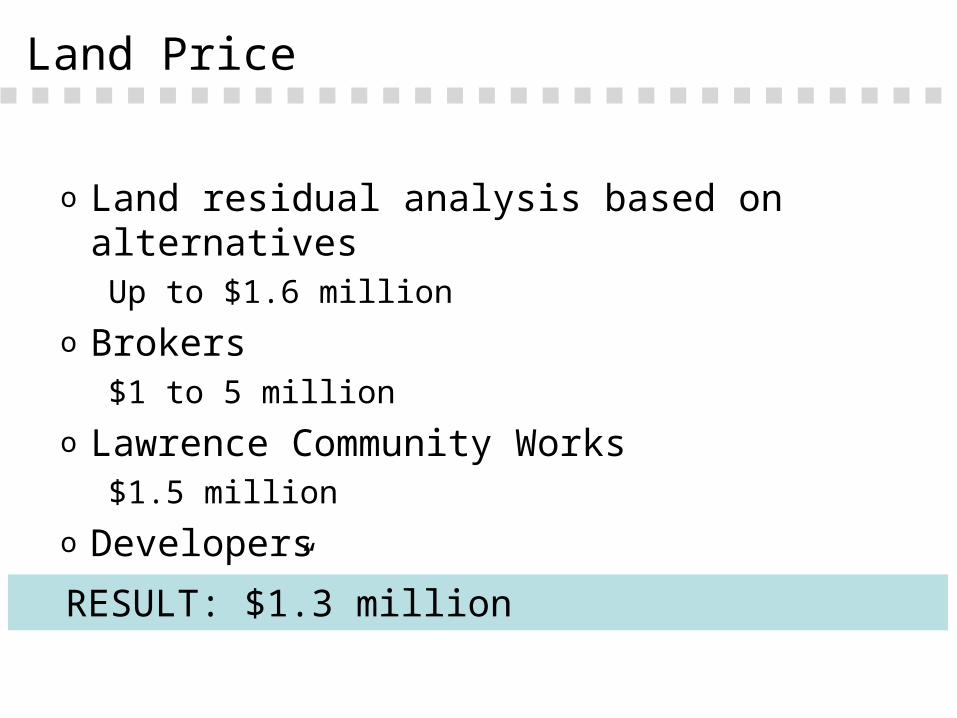
Land Price
o Land residual analysis based on alternativesUp to $1.6 million
o Brokers$1 to 5 million
o Lawrence Community Works$1.5 million
o Developers“not much”
RESULT: $1.3 million

Project Finance
Development Cost
Cost Summary Total Cost Cost PSFLand Cost 1,333,000 16 Hard Cost 10,869,845 134 Soft Cost 894,656 11 Developer Fee 326,095 4 Loan Guarantee Fee 147,045 2 Construction Loan Interest 594,345 7 NMTC Loan Interest 46,963 1 Total Development Cost 14,211,950 175

Project Finance
Retail Rents
Rental Rates Summary Rent PSF Annual TotalAnchor Rent 9 405,000 Inline Rent 12 273,120 Pharmacy Rent 24 322,560 TOTAL GROSS ANNUAL RENT 1,000,680$

Project Finance
Capital Structure
Capital Structure Total % of Total RateNMTC Loan 2,985,541 22.0% 1.0%Construction Loan 7,870,972 58.0% 7.0%Permanent Loan (25 Year Amort.) 7,870,972 58.0% 7.5%Equity - Partner (90%) 2,442,715 18.0% N/AEquity - Developer (10%) 271,413 2.0% N/A

Project Finance
Assumptions
DCF Analysis AssumptionsGrocery vacancy 5%Pharmacy vacancy 5%Inline vacancy 10%Inline lease term 5 yearsInline renewal prob. 67%6 months vacancy if no renewal, All leases NNNOperating Expenses (5.90) psfCapital Expenditures (0.30) psfCap rate for reversion event 7.75%Annual rent growth - Anchor 1.0%Annual rent growth - Inline 3.0%Annual expense growth 2.5%Sources: Eastern Development, Linear Retail, Commercial Real Estate Listing Service, Urban Land Institute, Meredith and Grew, COSTAR, Black’s Guide, LoopNet
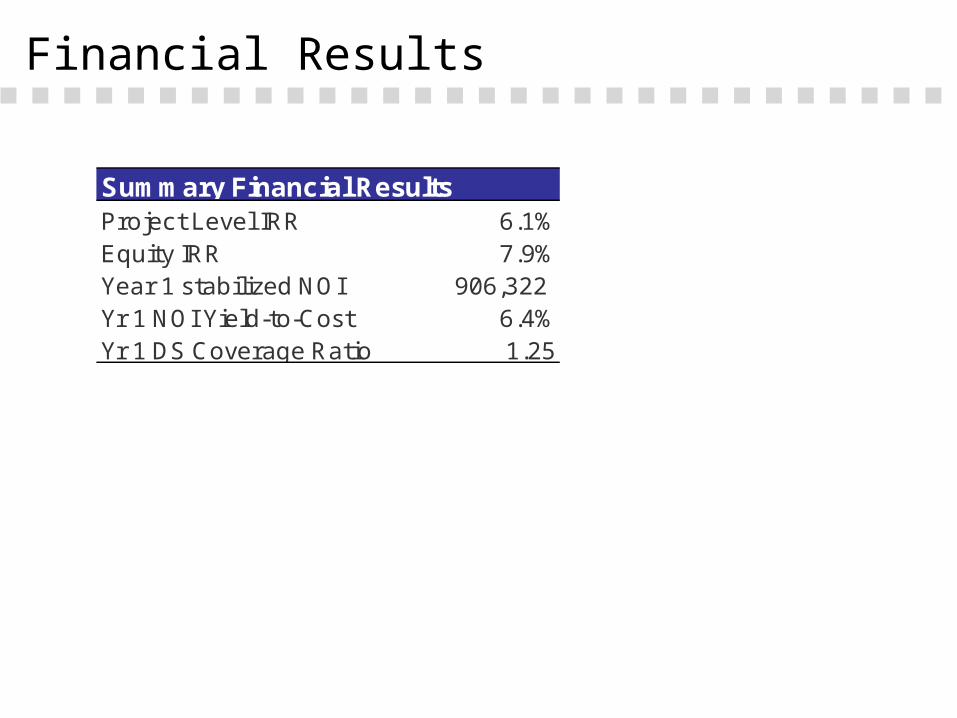
Project Finance
Financial Results
Summary Financial ResultsProject Level IRR 6.1%Equity IRR 7.9%Year 1 stabilized NOI 906,322 Yr 1 NOI Yield-to-Cost 6.4%Yr 1 DS Coverage Ratio 1.25
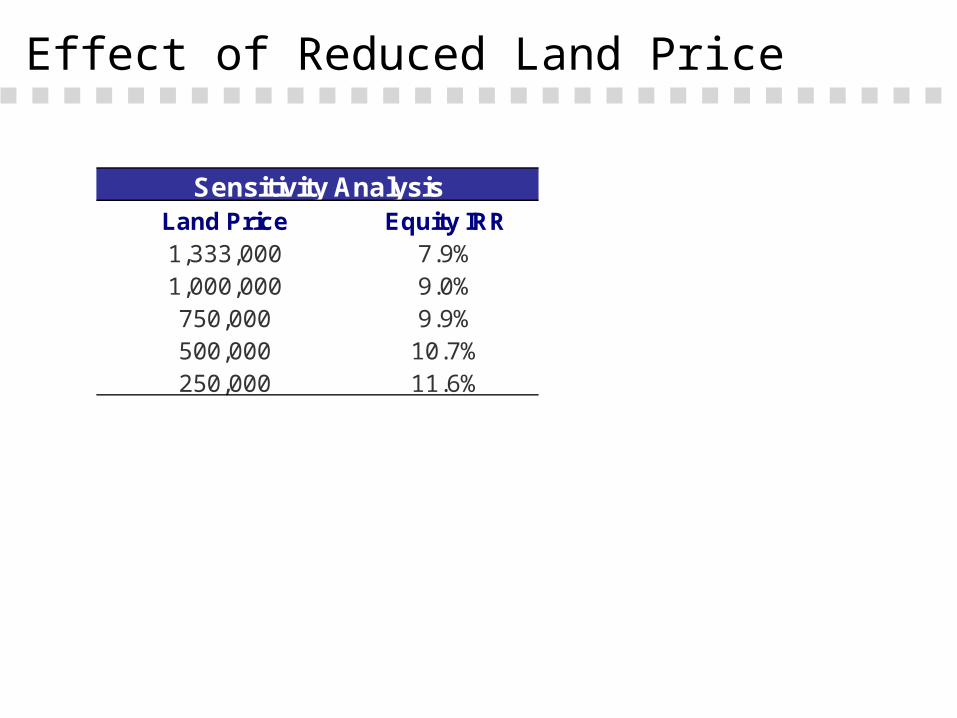
Project Finance
Effect of Reduced Land Price
Land Price Equity IRR1,333,000 7.9%1,000,000 9.0%750,000 9.9%500,000 10.7%250,000 11.6%
Year 1 Inline IRR to EquityRetail Rental Rate Investors
12 7.9%14 10.0%16 11.9%18 13.6%
Sensitivity Analysis

Project Finance
Effect of Higher Inline Rents
Land Price Equity IRR1,333,000 7.9%1,000,000 9.0%750,000 9.9%500,000 10.7%250,000 11.6%
Year 1 Inline IRR to EquityRetail Rental Rate Investors
12 7.9%14 10.0%16 11.9%18 13.6%
Sensitivity Analysis

Project Finance
CONCLUSION

o Proposal benefits from large vacant parcelo Site plan fits within urban contexto Capital structure includes application of
NMTCo Tenant mix addresses unmet demand
However…o Insufficient returns to attract private capital
Broadway Center

Broadway Center

Project Finance
Construction Budget Total Cost Cost PSFLand Acquisition 1,333,000 6
Site Work and Landscaping 962,500 12 Anchor Cost 4,500,000 100 Inline Cost 2,503,600 110 Pharmacy Cost 1,612,800 120 Tenant Improvments 812,000 10 Hard Contingency 478,945 5.9
Construction Mgmt 32,256 0.4 Architectural 150,000 1.8 Engineering 50,000 0.6 Legal 100,000 1.2 Entitlements & Permitting 162,400 2.0 Leasing Commissions 100,000 1.2 Construction Loan Fees 100,000 1.2 Permanent Loan Fees 100,000 1.2 Soft Contingency 100,000 1.2
Developer Fee 326,095 4.0 Loan Guarantee Fee 147,045 1.8 Construction Loan Interest 598,907 7.4 NMTC Loan Interest 46,963 0.6
Total Costs 14,216,512 175
Project Finance
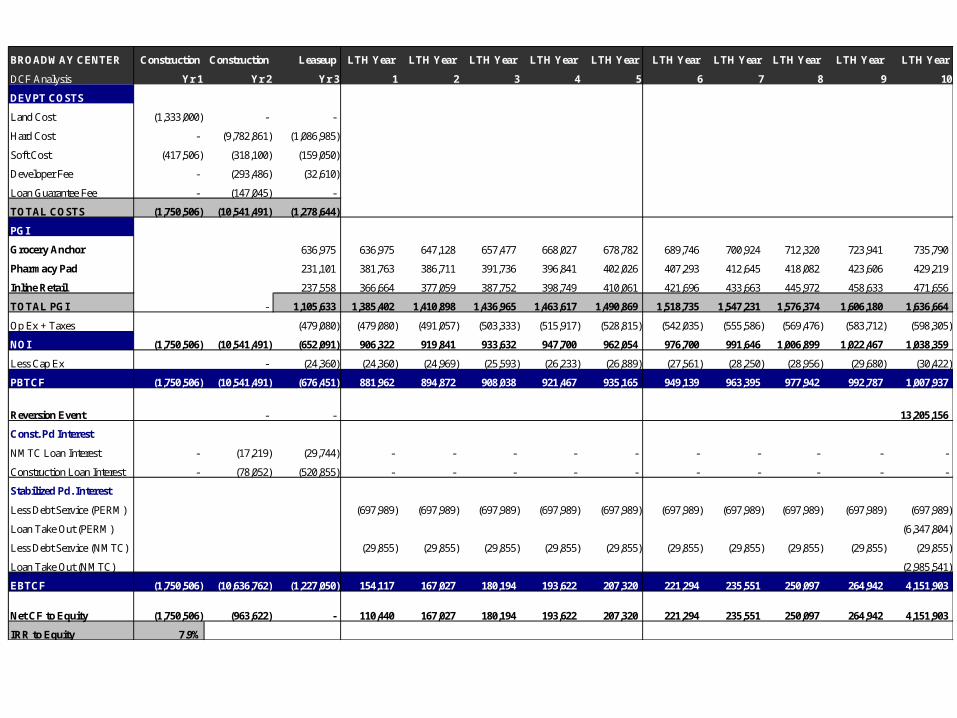
BROADWAY CENTER Construction Construction Leaseup LTH Year LTH Year LTH Year LTH Year LTH Year LTH Year LTH Year LTH Year LTH Year LTH Year
DCF Analysis Yr 1 Yr 2 Yr 3 1 2 3 4 5 6 7 8 9 10
DEVPT COSTS
Land Cost (1,333,000) - -
Hard Cost - (9,782,861) (1,086,985)
Soft Cost (417,506) (318,100) (159,050)
Developer Fee - (293,486) (32,610)
Loan Guarantee Fee - (147,045) -
TOTAL COSTS (1,750,506) (10,541,491) (1,278,644)
PGI
Grocery Anchor 636,975 636,975 647,128 657,477 668,027 678,782 689,746 700,924 712,320 723,941 735,790
Pharmacy Pad 231,101 381,763 386,711 391,736 396,841 402,026 407,293 412,645 418,082 423,606 429,219
Inline Retail 237,558 366,664 377,059 387,752 398,749 410,061 421,696 433,663 445,972 458,633 471,656
TOTAL PGI - 1,105,633 1,385,402 1,410,898 1,436,965 1,463,617 1,490,869 1,518,735 1,547,231 1,576,374 1,606,180 1,636,664
Op Ex + Taxes (479,080) (479,080) (491,057) (503,333) (515,917) (528,815) (542,035) (555,586) (569,476) (583,712) (598,305)
NOI (1,750,506) (10,541,491) (652,091) 906,322 919,841 933,632 947,700 962,054 976,700 991,646 1,006,899 1,022,467 1,038,359
Less Cap Ex - (24,360) (24,360) (24,969) (25,593) (26,233) (26,889) (27,561) (28,250) (28,956) (29,680) (30,422)
PBTCF (1,750,506) (10,541,491) (676,451) 881,962 894,872 908,038 921,467 935,165 949,139 963,395 977,942 992,787 1,007,937
Reversion Event - - 13,205,156
Const. Pd Interest
NMTC Loan Interest - (17,219) (29,744) - - - - - - - - - -
Construction Loan Interest - (78,052) (520,855) - - - - - - - - - -
Stabilized Pd. Interest
Less Debt Service (PERM) (697,989) (697,989) (697,989) (697,989) (697,989) (697,989) (697,989) (697,989) (697,989) (697,989)
Loan Take Out (PERM) (6,347,804)
Less Debt Service (NMTC) (29,855) (29,855) (29,855) (29,855) (29,855) (29,855) (29,855) (29,855) (29,855) (29,855)
Loan Take Out (NMTC) (2,985,541)
EBTCF (1,750,506) (10,636,762) (1,227,050) 154,117 167,027 180,194 193,622 207,320 221,294 235,551 250,097 264,942 4,151,903
Net CF to Equity (1,750,506) (963,622) - 110,440 167,027 180,194 193,622 207,320 221,294 235,551 250,097 264,942 4,151,903
IRR to Equity 7.9%