british columbia's revenue-neutral carbon tax
TRANSCRIPT

British Columbia’s Revenue-Neutral Carbon Tax: A Review of the Latest “Grand Experiment” in Environmental Policy
www.nicholasinstitute.duke.edu
Working Paper NI WP 15-04
May 2015
Author Affiliations*Nicholas Institute for Environmental Policy Solutions, Duke University; University of Ottawa (2015)**University of Ottawa
CitationB. Murray and N. Rivers. 2015. “British Columbia’s Revenue-Neutral Carbon Tax: A Review of the Latest ‘Grand Experiment’ in Environmental Policy.” NI WP 15-04. Durham, NC: Duke University. http://nicholasinstitute.duke.edu/publications.
DisclaimerWorking papers present preliminary analysis and are intended to stimu-late discussion and inform debate on emerging issues. Working papers may be eventually published in another form, and their content may be revised.
CONTENTS
Introduction 2History of the Tax 3Key Design Features 4Effect on BC Emissions 7Effect on BC Economy 10Conclusion and Policy Implications 17References 19
SUMMARY In 2008, British Columbia implemented the firstcomprehensive and substantial carbon tax in NorthAmerica. By 2012, the tax had reached a level of C$30/tCO2, and covered approximately three-quarters ofall greenhouse gas emissions in the province. Thispaper reviews existing evidence on the effect of the taxon greenhouse emissions, the economy, and incomedistribution as well as provides new evidence on publicperceptions of the tax.
Empirical and simulation models suggest that thetax has reduced emissions in the province by 5–15%.At the same time, models show that the tax has hadnegligible effects on aggregate economic performance,though certain emissions-intensive sectors have facedchallenges. Studies differ on the effects of the policy onincome distribution but agree that they are relativelysmall. Finally, polling data show that the publicinitially opposed the tax but now generally supports it.
The carbon tax was originally implemented as a“textbook” policy, with wide coverage, few exemptions,and use of revenue for low-income tax credits andbroad-based tax cuts. But the recent use of some taxrevenues to support particular industries rather thanto deliver those broad-based tax cuts may reduce itsoverall cost-effectiveness.
Brian C. Murray* and Nicholas Rivers**

2
Introduction In a 1998 article in the Journal of Economic Perspectives, “What Can We Learn from the Grand Policy Experiment?” Robert Stavins examined the performance of the SO2 allowance (“acid rain”) trading program in the United States in its first several years (Stavins 1998). Stavins’ interest was motivated by the fact that the SO2 trading program was by far the world’s most ambitious application of emissions trading, representing a textbook policy approach that economists had been prescribing for decades as an alternative to “command-and-control” regulation, yet it had little uptake from environmental regulators. Stavins examined the policy’s application from several angles, providing insights into its cost-effectiveness, the political economy forces that led to its selection, and normative prescriptions for policy design.1 In the economist’s environmental policy playbook, nothing competes with emissions permit trading for space more than environmental taxation (Weitzman 1974). And no contemporary environmental issue has emphasized the choice between these two instruments more than climate change (Goulder and Schein 2013). Putting a price on carbon dioxide (CO2) and other greenhouse gas (GHG) emissions has long been the foundation of economists’ prescription for the climate change problem. And regulators have taken notice. Carbon-pricing has firmly taken root over the last decade; mandatory pricing systems (existing or planned) are found on every continent except Antarctica (World Bank 2014). From an emissions coverage standpoint, emissions trading systems (ETS), or cap-and-trade programs, are the most prevalent carbon-pricing approach. Some of the historic preference for an ETS over a tax may be due to the political economy factors referenced by Stavins (1998) and addressed through a political science lens by Paterson (2012), but an exploration of the reasoning behind those choices is beyond the scope of this paper. Although ETS predominates in climate policy, several jurisdictions either have or are considering a tax alone or in combination with an ETS. Some countries (e.g., Sweden) have had a carbon tax since the 1990s, and Ireland and other European Union (EU) countries have recently implemented them, but these tax systems have often been part of larger energy and excise tax reform efforts rather than focused on GHG emissions. Those European tax systems also have different scopes of coverage and rates and are coupled with the EU ETS. Thus it is difficult to assess the effectiveness of the tax in isolation. In contrast, the Canadian province of British Columbia (BC) instituted in 2008 a stand-alone carbon tax that covered about three-quarters of all emissions sources in the province at a levy rate that was as high as or higher than carbon prices emerging from ETS throughout the world. Among the unique elements of the BC carbon tax is its goal of revenue-neutrality, meaning that all revenues raised by the tax are to be recycled to BC households and businesses, largely in the form of tax cuts. As discussed below, economists often favor revenue-neutral carbon taxation because it has the potential to enhance economic growth by lowering distortions from the current tax system. As such, it may provide the purest example of the economist’s carbon tax prescription in practice. Thus the BC carbon tax can be viewed as another grand policy experiment—much as Stavins viewed SO2 allowance trading in the 1990s—that we can now assess for effectiveness in achieving environmental, economic, and political objectives. The BC carbon tax’s effect on emissions, economic indicators, and political acceptance has been the subject of some targeted empirical work. However, no papers have broadly gauged its performance across the policy’s multiple outcomes of interest. This paper seeks to do that by drawing from the small but
1 Fifteen years later, Stavins and Richard Schmalensee revisited the grand policy experiment in the pages of the same journal, highlighting what they referred to as an “ironic” history of the policy, including policy design choices that “worked” despite their flaws, rejection of emissions trading by some of the political constituencies that initially argued on its behalf, and a massive change in the regulation underlying the market that caused the market to collapse (Schmalensee and Stavins 2013).

3
growing empirical literature to distill evidence on the tax’s effectiveness across many dimensions: emissions, economy, equity, and public acceptance. The paper provides a brief history of the BC carbon tax, focusing on political and economic factors underlying its introduction and briefly summarizes its key design elements of the tax: coverage base, levy rate, and use of revenues. In addition, the paper reviews the studies that have estimated the effect of the tax on British Columbia’s emissions profile and synthesizes the research on the tax’s economic effects, exploring whether the tax has impeded or enhanced economic growth, given theoretical priors that it could go either way with judicious recycling of the revenues. The paper concludes with an exploration of the distributional consequences of these economic effects across the BC population, a review of the evidence on public acceptance of the tax, and a summary of findings. History of the Tax The BC carbon tax was implemented on July 1, 2008. It was borne of a unique confluence of social, political, and economic forces. Public concern over climate change risks surged in Canada and elsewhere during the first decade of the 21st century as a result of mounting scientific evidence of human influence on the climate system (IPCC 2007), increased attention in the press and in popular culture to climate change with a call for political action (Gore 2006), and emerging expectations that all major emitting countries were poised to take serious action to reduce GHG emissions under the United Nations Framework Convention on Climate Change (UNFCCC). These concerns and expectations were coupled with the evolution of carbon-pricing mechanisms as the recommended policy instrument to address climate change. These factors driving global action coincided with five developments in British Columbia that Harrison (2013) attributes to passage of the BC carbon tax: (1) the prevalence of hydro power as the source of electricity generation; (2) intense voter interest in the issue of climate change from an electorate with strong environmental views; (3) the presence of a right-center majority government with bona fide support in the business community that could perhaps push an environmental agenda further than a government considered hostile to business interests; (4) strong commitment by BC Premier Gordon Campbell, who essentially staked his political career on passage of the carbon tax; and (5) a political institutional structure that gives great power to the leader of the party that holds a majority of seats in the legislature, as was the case with Campbell and his party. Even with this favorable combination of factors, passage of the tax was not easy. To capture the support of the business community, the tax was made revenue-neutral—that is, revenues would be countered by tax cuts elsewhere—and was applied to both businesses and households (Harrison 2013). These features created political backlash in some corners due to concern that low-income and rural (especially northern) communities would be unfairly burdened (Beck, Rivers, and Yonezawa 2015). Ultimately, the tax was designed to direct some of the proceeds as payments and tax reductions for northern rural households and low-income groups. Some observers viewed the 2009 provincial election as a referendum on the BC carbon tax, and the opposition party called for its abolition as part of an “Axe the Tax” campaign.2 However, the state of the economy in the midst of the global recession was foremost in voters’ minds, and voters viewed the ruling party more favorably than the opposition on economic issues (Harrison 2013). Perhaps for this reason, more than the carbon tax itself, the ruling party survived the 2009 election, as did the carbon tax.
2 The opposition party in British Columbia at the time was the New Democratic Party or NDP, generally regarded as a left-center party. The party in power was the Liberal Party, which is regarded as representing right-center interests.
4
The BC government is entitled to review the progress of the carbon tax toward its stated goals, and it chose to do so as part of its 2012–13 annual budget process (BC Ministry of Finance 2013). The review covered key aspects of the carbon tax, including revenue neutrality, and the impact of the tax on the competitiveness of BC businesses. The review largely confirmed that the tax was achieving its goals and recommended no major changes to the program. Key Design Features Table 1 summarizes the key provisions of the BC carbon tax. As the first comprehensive carbon tax in North America, it is relatively simple in its design and application. Table 1. Key provisions of British Columbia carbon tax Provisions Description GHG emission sources covered Fossil fuels used within the province, accounting for 70-‐75% of all GHG
emissions in the province. Greenhouse gases are converted to carbon dioxide equivalents using 100-‐year global warming potentials.
Notable exemptions • Fuels exported from BC • Fuel use by planes and ships travelling to or from BC • Greenhouse operations and fuel used in agriculture (starting in
2012 and 2013, respectively) • All non-‐fossil fuel GHG emissions including those from industrial
processes, landfills, forestry and agriculture. • Fugitive emissions of methane (CH4) from production and
transmission of fossil fuels.
Tax rate Started at C$10/ton CO2 in 2008, rising to $30/ton by 2012. This tax per ton CO2 is then transformed to the units of sale (e.g., $ per litre of gasoline) for assessment at the point of purchase. See Table 2 for respective tax rate per unit of the most common fuels.
Use of tax revenues Tax aspires to revenue-‐neutrality, meaning all revenues are redistributed back to households in the form of tax reductions or directed transfers rather than used to increase government spending. Actual experience has revealed tax cuts and targeted payments in excess of the revenue raised by the carbon tax and some movement from general household and business tax reductions to expenditures targeted for specific purposes.
Transparency provisions BC Ministry of Finance is required each year to prepare a three-‐year plan for recycling carbon tax revenues through tax reductions. The plan is presented to the Legislative Assembly for review and approval.
Coverage The tax covers GHG emissions resulting from the combustion of all fossil fuels used within the province, with some minor exceptions. The taxed fuels include liquid transportation fuels such as gasoline and diesel as well as natural gas or coal used to power electric plants, along with other types of fuels. It covers 70–75% of the province’s GHG emissions; the uncovered remaining emissions include non-combustion CO2 in industrial processes (e.g., lime production in cement manufacture), methane (CH4) emissions from natural gas extraction and transmission, methane and nitrous oxide (N2O) emissions from agriculture and CO2 emissions from forestry (British Columbia Ministry of Finance 2015).

5
The tax as originally implemented offered no exemptions for particular sectors and used the same tax rate for all covered sectors, which distinguished it from other carbon-pricing efforts worldwide. However, in 2012, responding to concerns raised by greenhouse growers that the carbon tax was rendering their operations uncompetitive with California and Mexico, government offered a one-time exemption (worth $7.6 million) from the carbon tax. This exemption was followed in the 2013 budget with an ongoing 80% exemption for greenhouse growers. In the 2014 budget, government announced that gasoline and diesel used for agriculture would be exempt from the carbon tax (Rivers and Schaufele 2015). Tax Rate: Absolute and Relative The tax started at C$10 (Canadian dollar) per ton of carbon dioxide equivalent when introduced in 2008. It then rose C$5 per ton each year until in 2012 it reached C$30 per ton, at which it remains today. Because different fuels have different carbon contents, the tax rate per unit of fuel differs, as does the impact on final price, as shown for selected fuels in Table 2. The carbon tax translates to a set price per unit of fuel output rather than fixed percentage; however, it is useful to see how much the tax contributes to the final price of different fuels. The carbon tax accounts for a relatively modest share of the final price for gasoline, diesel, and propane, but it can account for a very large share of the price of natural gas and coal. The differences in relative price impact are due primarily to the fact that raw fossil fuel costs are a small portion of total retail fuel cost for refined fuels such as gasoline, diesel, and propane than they are of primary energy fuels such as coal and natural gas. These differences do suggest that the carbon tax has, for instance, a higher potential effect on coal and gas use than on transportation fuel use; however, virtually all of the coal mined in British Columbia is used elsewhere and is not subject to the BC carbon tax. Table 2. Selected carbon tax rates by fuel
Fuel type Tax unit Tax rate (in 2015)
Tax % of final fuel price (2014)
Gasoline C¢/liter 6.67 4.4% Diesel (light fuel oil) C¢/liter 7.67 5.1% Natural Gas C¢/cubic
meter 5.7
33.9% Propane ¢/liter 4.62 7.1% Coal high-‐heat value C$/ton 62.31 54.7% Coal low-‐heat value C$/ton 53.31 46.8% Sources: For tax data—British Columbia Ministry of Finance (2015); for price data—Natural Resources Canada (2015) (gasoline and diesel for Vancouver, British Columbia), Natural Resources Canada (2014) (natural gas and propane for Canada), and British Columbia Ministry of Metals and Mines (2013) (coal). Note: See http://www.sbr.gov.bc.ca/documents_library/bulletins/mft-‐ct_005.pdf for the full list of tax on all covered fuels. To place the BC carbon tax in context, Table 3 compares it to carbon prices found in several other programs in North America and the European Union. To facilitate comparisons, prices are converted from their domestic currency and units into U.S. dollars (US$) per (metric) ton CO2e. British Columbia has the highest price of the cohort, twice as high, for instance, as the carbon tax in France and the fee paid in Alberta for entities that exceed the emissions intensity target. The exceedance fee in Alberta, however, is only paid on the amount that the realized emissions rate exceeds the intensity target, whereas the BC carbon tax is paid on all covered emissions, so the carbon cost difference between British Columbia and Alberta is even more pronounced than Table 3 implies. All other carbon-pricing systems in Table 3 emanate from cap-and-trade programs, making the price comparison a bit more fluid. Whereas a carbon tax sets a fixed price, a cap-and-trade program sets a fixed emissions cap that is met by parties trading

6
emissions allowance permits at a market price. This price will vary constantly in response to shifts in market demand for emissions allowances caused by macroeconomic, energy market, and policy shocks (Murray and Maniloff 2015). Table 3. British Columbia carbon tax level compared to other carbon prices Region Program Domestic price (2015)a US$/tonb
British Columbia Carbon tax C$ 30/ton 24.00 Alberta Emission intensity target (fee for
exceedance) C$ 15/ton 12.00
California-‐Quebec Cap and trade (economywide) US$12.21/tonc 12.21 Northeastern United States
Cap and trade (electric power sector)
US$ 5.41/short tond
6.06
European Union Cap and trade (economywide) € 6.80/tone 7.34 France Carbon tax on transport fuels and
domestic heating fuels € 14.50/ton (rising to €22 in 2016)
15.66
a Nearest quote to April 8, 2015. b Exchange rates between Canadian dollar and U.S. dollar (0.80) and the euro and U.S. dollar (1.08), quoted on April 8, 2015, XE Currency Converter (http://www.xe.com/currencyconverter/). c U.S. Energy Information Administration. 2015. "California and Quebec Complete Second Joint Carbon Dioxide Emissions Allowance Auction." 2015. http://www.eia.gov/todayinenergy/detail.cfm?id=20312. d RGGI Incorporated. 2015. Market Monitor Report for Auction 27. http://www.rggi.org/docs/Auctions/27/Auction_27_Market_Monitor_Report.pdf. Note: a short ton is equal to 2000 pounds, which is 0.9072 tons (metric ton). e Bloomberg Professional Services data base. Downloaded April 14, 2015. Use of Revenues One key aspect of the BC carbon tax is its revenue neutrality. Rather than raise taxes and increase government expenditure, it operates as a tax shift, wherein carbon tax revenues are countered by cuts in other taxes or direct transfers to households. These shifts include business tax cuts, personal income tax cuts (targeted at lower-income categories), low-income tax credits, and direct grants to rural households. To address potential skepticism that the BC government might not follow up on promises to keep the tax revenue neutral, the BC Ministry of Finance must file a report each year showing how the tax proceeds are being used.3 The report is subject to review and approval by the BC Legislative Assembly as part of the broad annual budget review process. Between its inception in 2008 and 2015, the BC carbon tax has generated C$6.1 billion in revenue, yet corresponding tax cuts have been more than C$7.1 billion. Thus the tax has not truly been revenue neutral to date, a point considered below. Slightly more than half the tax cuts have been directed to businesses and the remainder, to households. Figure 1 illustrates the distribution of actual and planned uses of the carbon tax revenue from the tax’s inception in Fiscal Year 2008–09 through 2017–18. From implementation to 2012, virtually all tax revenues were recycled through tax rate cuts and credits in personal and business tax rates, many targeting low-income households. Starting in 2012–13, when the tax rate reached its target rate of C$30 and revenues climbed accordingly, some of the revenue started to be targeted for specific business purposes. For example, in that year, a portion of the carbon tax revenue was directed to an “interactive
3 A true assessment of revenue neutrality requires knowledge of what government would have done in the absence of the tax. It is possible, for example, that some of the tax cuts that were made concurrently with the tax would have been made even without implementation of the tax.

7
digital media tax credit.” The dynamic began to change considerably from 2013–14 onward, first with certain exemptions (to greenhouse growers and then to the broader agricultural sector (Rivers and Schaufele (2015)), which slightly lowered the tax base, and a partial reversal of the corporate income tax rate cut, which reduced those broad business tax cuts as a use of revenues. After that point, virtually all the tax’s revenue growth has been targeted to corporate tax credits in certain sectors, in particular the motion picture industry. What began as use of carbon tax revenues for general tax reform to reduce distortions and promote economic growth (straight out of the economist’s playbook) appears to have evolved into a system with some “industrial policy” objectives of promoting certain sectors. Figure 1. Distribution of uses of BC carbon tax revenues, 2008–2018
Source: BC Budget and Fiscal Plans, 2008–09 to 2015–16; www.gov.bc.ca/fin/. Notes: The solid line represents revenue from the carbon tax; the bars represent expenditures of carbon tax revenue. Values for FY2015–16 and beyond are forecasts from the most recent budget. Effect on BC Emissions British Columbia’s carbon tax was implemented with the aim of reducing GHG emissions. Determining the success of the policy in this regard requires comparing actual GHG emissions in the province after the policy was implemented with a counterfactual scenario estimating emissions in the province in the absence of the tax. As with other evaluation studies, constructing the counterfactual scenario is the key to successfully identifying the effect of the policy. Empirical studies of the carbon tax have taken either a numerical simulation modeling approach or an econometric approach (Table 4). In the former approach, models (e.g. computable general equilibrium) are simulated with and without the carbon tax, and the effect of the carbon tax is the difference in these two scenarios. The challenge with

8
this approach is that the models require a large number of functional form and parametric assumptions. Moreover, these assumptions are typically not validated against empirical data. When the literature takes an econometric approach, it typically uses a difference-in-difference approach by comparing British Columbia before and after implementation of the tax and to other provinces. The challenge with econometric studies is accounting for unobserved variables that are correlated with the tax. These variables include other policies or economic conditions. Table 4. Summary of studies that estimate the effect of British Columbia’s carbon tax on GHG emissions and fuel consumption Source Method Results British Columbia (2008) Numerical simulation model with
technological detail 5% reduction in GHG emissions
Beck et al. (2015) Computable general equilibrium model
8.5% reduction in GHG gas emissions
Elgie and McClay (2013) Difference-‐in-‐difference with no additional controls
18.8% reduction in per capita sales of petroleum fuels subject to the tax
Elgie and McClay (2013) Difference-‐in-‐difference with no additional controls
9% reduction in per capita GHG emissions (data to 2011 only)
Rivers and Schaufele (2012) Difference-‐in-‐difference with controls
11–17% reduction in per capita gasoline sales
Gulati and Gholami (2015) Difference-‐in-‐difference with controls
15% reduction in residential natural gas demand; 67% reduction in commercial natural gas demand
Bernard, Guenther, and Kichian (2014)
Time series analysis 7% reduction in per capita gasoline sales
In the original Climate Action Plan that accompanied introduction of the tax, modeling work using the CIMS energy-economy model suggested that the tax would reduce GHG emissions by about 3 Mt CO2 annually by the year 2020 in the absence of any other policies (British Columbia 2008, 20), or by roughly 5% compared to the reference case (counterfactual) forecast. Beck et al. (2015) conduct a similar analysis using a computable general equilibrium model and estimate that the tax is likely to reduce GHG emissions by 8.5% relative to the counterfactual scenario. Recent work uses data on fuel consumption and GHG emissions from after the tax’s introduction to estimate the effect of the tax on emissions. Most studies use a difference-in-difference approach, comparing fuel sales in British Columbia to those in other provinces, and comparing periods before and after the tax’s introduction, as in Figure 2. Elgie and McClay (2013) conduct such a study, comparing trends before and after the tax’s introduction in British Columbia and other provinces. They find roughly a 19% reduction in per capita sales of fuels subject to the tax over the 2008–2012 period relative to fuel sales in other Canadian provinces. Importantly, they find that for fuels not subject to the carbon tax, such as aviation fuel, there was no emissions reduction. In the same study, they use a different data set on aggregate GHG emissions and find a 9% reduction in per capita GHG emissions. Notably, their analysis does not control for any other factors affecting petroleum sales, so although their analysis is suggestive of a strong effect from the tax, it is not possible to interpret that effect as causal evidence.

9
Figure 2. Trends in gasoline and diesel fuel oil sales in British Columbia and the rest of Canada, 2005–2012
Source: Data from Statistics Canada, Tables 134-‐0004 and 0051-‐0001. Note: The vertical black line indicates introduction of the carbon tax.
Rivers and Schaufele (2012) estimate the effect of the BC carbon tax on gasoline sales. They conduct a difference-in-difference-type analysis as above but include controls for other covariates that could affect gasoline sales, such as income, prices, the business cycle, and public transit investments. Their coefficients suggest that at $30/t CO2, the carbon tax caused a reduction of 11–17% in gasoline sales. They note that this effect is much larger than would be expected if consumers responded to the carbon tax in the same way that they responded to other changes in gasoline price. Gulati and Gholami (2015) analyze residential and commercial natural gas sales using a similar difference-in-difference approach. Like Rivers and Schaufele (2012), they find that the carbon tax appears to have reduced commercial natural gas consumption by a larger amount than would be expected on the basis of the normal response to changing commercial natural gas prices. In the case of residential natural gas consumption, however, they find no such amplified response to the tax relative to the natural gas price; for residential consumption, their estimates suggest that the carbon tax likely reduced consumption by about 15%. Bernard, Guenther, and Kichian (2014) conduct a time series analysis of the effect of the carbon tax on gasoline sales in British Columbia, using monthly data on sales, excise taxes, the carbon tax, and gasoline price. They find that both carbon taxes and excise taxes cause a much larger reduction in gasoline sales than other price movements, and overall they estimate a reduction in per capita gasoline sales due to the carbon tax of some 7%. The estimates reported in Table 4 use quite different methods but reflect overall effects that are of roughly the same magnitude, providing analysts with some confidence in them. On the basis of these results, it is reasonable to claim that the effect of the tax was to reduce fuel consumption and GHG emissions 5–15% in British Columbia.

10
Effect on the BC Economy A carbon tax will induce taxed parties to reduce emissions up to the point that the marginal cost of the reduction just equals the tax. If the tax is set commensurately with the marginal benefit from emissions reduction, an economically efficient outcome can be achieved. Because the marginal damage or “social cost of carbon” can be difficult to estimate (Pizer et al. 2014), the carbon tax may not be set at the social optimum. Nevertheless, any tax rate should achieve a given level of emissions reduction at the lowest cost possible because it equalizes the marginal cost of reductions across all parties subject to the policy. Despite assurances from economists that carbon taxes represent a cost-effective approach to reducing emissions, many policy makers and public citizens fear that they might impose a large burden on the economy. Such a burden might arise by raising prices for particular goods and by causing firms to reduce output and consumers to reduce demand in response. These economically depressing actions generate discomfort about the broader impacts of the tax on overall economic activity. Particular concern is often focused on how the tax might affect employment. These public concerns about the negative economic impact of carbon taxes are cast against a number of economic studies suggesting that modest carbon taxes are unlikely to cause significant negative impacts and in some cases may have a positive effect on economic output (Anderson et al. 2007). The idea that a carbon tax could lead to economic growth is known as the double dividend hypothesis. The critical factor here is that the BC carbon tax is revenue neutral and used to reduce income taxes on BC households, as discussed above. Because income taxes introduce price distortions that reduce economic output, lowering income taxes through the introduction of a carbon tax can produce a double-dividend effect, wherein the tax not only reduces GHG pollution, but also raises total economic output (Pearce 1991; Tullock 1967). This double dividend suggests that the net economic effect of a carbon tax could be positive under some circumstances.4 Some researchers have offered a challenge to the robustness of the double dividend on theoretical grounds (Bovenberg and Goulder 2000; Fullerton and Metcalf 1998), a challenge the BC carbon tax can put to the test given its size and use of revenues to directly reduce other taxes.5 British Columbia’s Economic Growth under the Carbon Tax: Descriptive Statistics An analysis whether the carbon tax has modified economic performance in British Columbia can start with simple observations of GDP per capita relative to the rest of Canada, which suggest either a slightly higher performance—Elgie and McClay (2013) comparing growth rates after the introduction of the tax in 2008—or slightly lower performance—Metcalf (2015) comparing relative growth rates of British Columbia before and after the tax was imposed. For instance, the real annual GDP growth rate from 2008–13 was 0.5% in BC and 0.4% in the rest of Canada.6 But the more important key point, acknowledged by both studies, is that no defensible conclusions can be drawn without a statistically rigorous assessment that controls for the wide range of factors other than the carbon price that may have affected economic performance in British Columbia and the other Canadian provinces to which that price is being compared.
4 Of course, the full economic impact of the tax is intended to be positive once the reduced environmental damages from climate change are taken into account. The reversed negative impact referenced here speaks to the cost side of the equation, wherein the costs to the economy could be negative if the carbon tax is used to reduce distortionary taxes, as they are in British Columbia. 5 As mentioned above, the BC government has reduced other taxes by more than the revenues taken in by the carbon tax, by amounts ranging from 2% to 35% per year (Metcalf 2015). Thus the tax has not been strictly revenue neutral, and any economic growth benefit that does accrue to tax reduction cannot entirely be attributed to the carbon tax. 6 Data from Statistics Canada, 2015. Table 384-0038.
11
Evidence from Economic Modeling and Econometric Studies In its first comprehensive review of the carbon tax (British Columbia Ministry of Finance 2013), the government conducted a numerical modeling study to estimate the effect of the tax on economic indicators. The review states that, “Economic analysis conducted for the carbon tax review indicates that BC’s carbon tax has had, and will continue to have, a small negative impact on gross domestic product (GDP) in the province.” However, details of the analysis were not provided in the review, and subsequent efforts to obtain the results of this analysis from the government were unsuccessful. Beck et al. (2015) use a computable general equilibrium model of the Canadian economy to simulate the expected macroeconomic consequences of the BC carbon tax. Their simulations show a drop in household welfare of 0.08%, which is affected by the recycling of carbon tax revenues, and a decline in welfare of 0.13% if tax revenues were not used to offset tax breaks. These findings support the “weak” double dividend hypothesis that revenue recycling can mitigate economic losses from a carbon tax but not the “strong” double dividend hypothesis that the tax generates net economic growth on net. Beck et al. (2015) and the British Columbia Ministry of Finance (2013) develop estimates of the impact of the carbon tax with model simulations of the policy with and without the tax. This approach contrasts with econometric studies, described below, that estimate observed economic outcomes against counterfactual statistical estimates of the outcomes without the policy. As with estimating the effect of the tax on emissions, these two approaches embody different assumptions, making a comparison of the approaches useful. Metcalf (2015) uses econometric analysis to test whether growth rates in British Columbia differed from the rest of Canada after imposition of the carbon tax. He does so using difference-in-difference regressions of provincial GDP from 1999 to 2013, while controlling for other factors. He finds no statistically significant effect of the carbon tax on the province’s economic growth. Metcalf asserts this finding is unsurprising, given the relative size of the tax burden, which accounts for only 5–6% of all tax revenue. He also suggests that the economic benefits of the tax cuts may have counter-balanced the direct negative effects of higher energy prices, which is the intention of an environmental fiscal reform such as a revenue-neutral carbon tax. Yamazaki (2015) explores labor market effects of the BC carbon tax. He develops a partial equilibrium demand model for labor as a function of the carbon tax. With data from 2001 to 2013, he employs econometric methods to estimate a labor demand function using industry-level data on employment across provinces, controlling for industry, province, and time-fixed effects as well as the emissions intensity and trade intensity of an industry. His results indicate negative employment effects for emissions-intensive and trade-exposed (EITE) sectors in British Columbia but positive effects for non-EITE sectors and for the labor market overall. For instance, he estimates a 30% drop in employment in basic chemical manufacturing but gains in other sectors that more than make up for it. Yamazaki tests whether this effect is purely a demand effect or how much of it is due to supply shift—for instance, labor induced into the market by pro-growth tax cuts. He finds evidence that the supply effect is stronger than the demand effect, suggesting that the policy caused new labor to enter into the market. This shift also created a decline in the wage rate, which is expected if the labor supply shift dominates the demand shift. This result appears to imply that the tax created additional lower-wage jobs and thus may have nuanced distributional consequences, though these issues were not directly addressed in the paper. The studies just referenced examine economic effects across all economic sectors, some of which may be considered more exposed to economic hardship than others. One sector with the potential for disproportionate impact is agriculture; British Columbia has an active flow of agricultural exports and imports to and from other countries, including the United States, whose producers do not face a carbon price. BC agriculture was subject to the tax from 2008 to 2011, but as described above, the BC
12
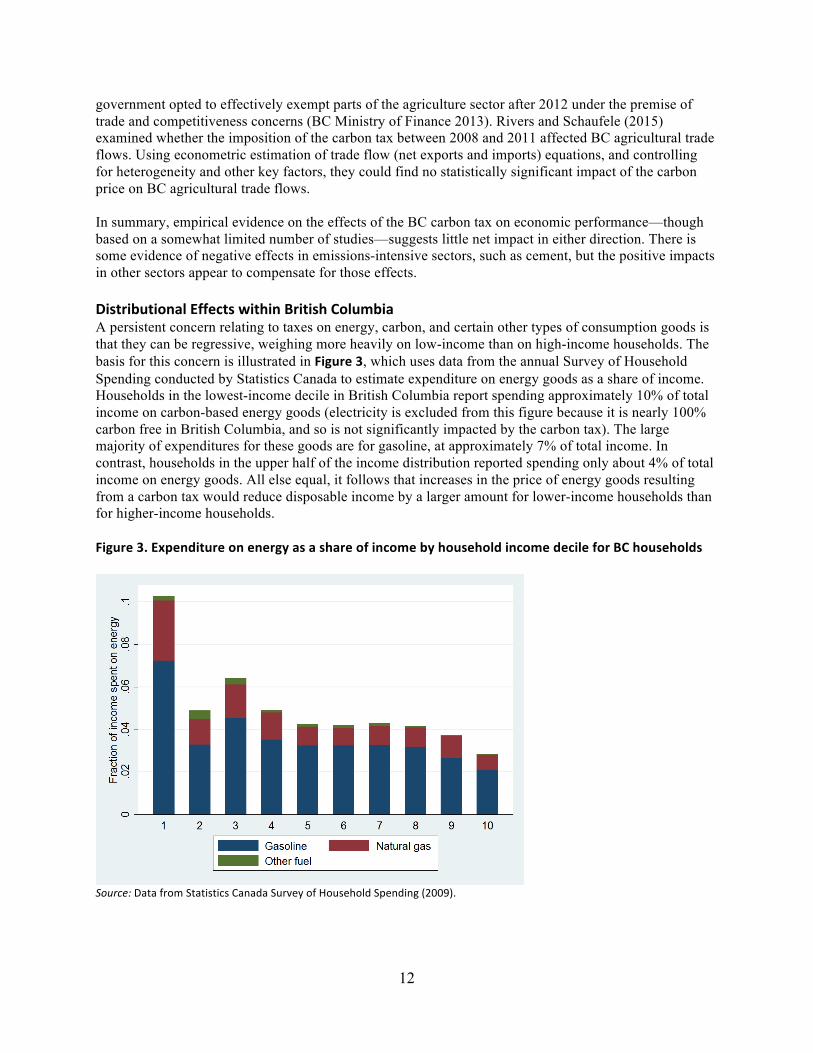
government opted to effectively exempt parts of the agriculture sector after 2012 under the premise of trade and competitiveness concerns (BC Ministry of Finance 2013). Rivers and Schaufele (2015) examined whether the imposition of the carbon tax between 2008 and 2011 affected BC agricultural trade flows. Using econometric estimation of trade flow (net exports and imports) equations, and controlling for heterogeneity and other key factors, they could find no statistically significant impact of the carbon price on BC agricultural trade flows. In summary, empirical evidence on the effects of the BC carbon tax on economic performance—though based on a somewhat limited number of studies—suggests little net impact in either direction. There is some evidence of negative effects in emissions-intensive sectors, such as cement, but the positive impacts in other sectors appear to compensate for those effects. Distributional Effects within British Columbia A persistent concern relating to taxes on energy, carbon, and certain other types of consumption goods is that they can be regressive, weighing more heavily on low-income than on high-income households. The basis for this concern is illustrated in Figure 3, which uses data from the annual Survey of Household Spending conducted by Statistics Canada to estimate expenditure on energy goods as a share of income. Households in the lowest-income decile in British Columbia report spending approximately 10% of total income on carbon-based energy goods (electricity is excluded from this figure because it is nearly 100% carbon free in British Columbia, and so is not significantly impacted by the carbon tax). The large majority of expenditures for these goods are for gasoline, at approximately 7% of total income. In contrast, households in the upper half of the income distribution reported spending only about 4% of total income on energy goods. All else equal, it follows that increases in the price of energy goods resulting from a carbon tax would reduce disposable income by a larger amount for lower-income households than for higher-income households.
Figure 3. Expenditure on energy as a share of income by household income decile for BC households
Source: Data from Statistics Canada Survey of Household Spending (2009).

13
Implementation of the carbon tax was sensitive to this issue. The revenue recycling system that accompanied the tax’s introduction allocated a substantial portion of the total revenue that was collected by the tax to low-income households, with the goal of alleviating concerns related to its distributional incidence. The revenue recycling mechanisms include the Low Income Climate Action Tax Credit, which (in 2011) returns as much as $115.50 per adult and $34.50 per child to households with incomes of less than $31,700 (for singles) or $37,000 (for couples). In addition, reductions in the personal income tax rate were implemented on the first two income tax brackets (a 5% reduction in the tax rate for households with income up to about $75,000), resulting in a larger reduction in the average tax rate for low-income individuals compared with high-income individuals. Some analysis has been conducted to determine the ultimate incidence of the tax, accounting for the revenue-recycling mechanisms that target low-income households. The original government document that accompanied the tax’s introduction presented many simulations of the tax’s impact on different types of households (British Columbia 2008). The model used for these simulations was very simple in that it did not account for changes in behavior following the tax, assumed 100% pass-through of the tax, and did not account for price changes other than energy goods. It suggested that, in 2008 and 2009, the tax would result in an increase in disposable income for three prototypical low-income households with incomes of $30,000 (a single mother, a senior couple, and a senior single). Overall, said the government, “Low income families are protected… most will be better off” (British Columbia 2008, 14). Lee and Sanger (2008) use a similar static model to examine distributional incidence, but they also included indirect expenditures on carbon by assuming a carbon content for non-energy expenditures. Like the government’s analysis, their analysis uses a simple micro-simulation model and assumes no behavioral response on the part of households to the tax. It also assumes that the entire incidence of the tax is passed forward to consumers. Lee and Sanger project that the carbon tax would be “moderately progressive” in the first year of its introduction. However, they find that the schedule of carbon tax increases from 2008 to 2012 is more aggressive than the accompanying measures targeting low-income households, such that the tax is forecast to be “moderately regressive” without further increases in the low-income tax credit. Figure 1 supports this conclusion, showing the steadily declining fraction of total tax revenues that are used to support low-income households. More precisely, by 2011–2012 they find that the tax and coupled revenue recycling mechanisms would result in a 0.3% reduction in income for households in the lowest-income quintile, and a 0.2% increase in income for households in the highest-income quintile. Beck et al. (2015) conduct an analysis of the distribution of the tax using a computable general equilibrium model, which allows them to estimate the impact of the tax on both expenditures as well as on sources of income (i.e., they do not assume complete pass-through of the tax to consumer prices but instead estimate the incidence of the tax on the basis of the model’s properties). They find that even before the revenue recycling measures are considered, the BC carbon tax is “highly progressive.” They suggest that this finding is a result of the tax incidence falling partly on wages (and partly on the prices of energy goods). Because low-income households derive most income from government transfers, they are insulated from falling real wages. In contrast, high-income households derive most income from wages and so bear most of the incidence of the tax. Beck et al. (2015) also report that the revenue recycling measures make the tax more progressive. Beck, Rivers, and Yonezawa (2015) use a similar model to estimate the differential impacts of the tax on urban and rural households, a key point of contention related to introduction of the tax. They find that rural households were initially disadvantaged by the tax, but that the introduction of a northern and rural homeowner tax credit was sufficient to make these households net beneficiaries, on average, from the tax.

14
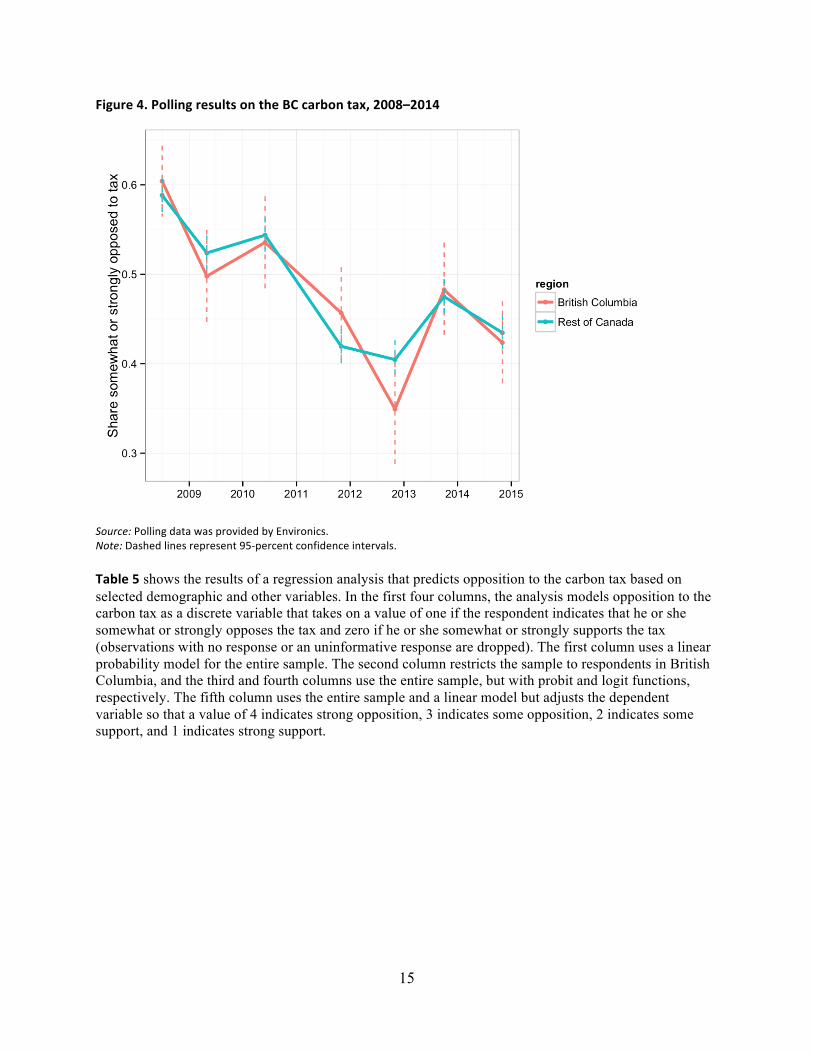
Public Perception of the Tax Although carbon taxes have long been supported by economists and other policy analysts advocating for cost-effective reduction of GHG emissions, their implementation has been limited by a concern that public support for such measures lags significantly behind support by economists. Implementation of the tax in British Columbia allows decision makers to understand how public support for a carbon tax unfolds after the tax has been implemented. Residents of British Columbia have been polled regularly regarding their support for or opposition to the carbon tax. The polling firm Environics has conducted polls roughly annually since the tax was introduced. These polls use a standard survey methodology, sampling between 1,000 and 2,000 randomly selected residents by telephone in each survey wave. Respondents both in and outside the province have been asked about their perception of the tax; residents in British Columbia have been asked whether they support the tax, and those outside the province, whether they would support introduction of a similar tax in their province. Responses are categorized as strongly support, somewhat support, somewhat oppose, and strongly oppose. In the following results, the two categories of opposition are aggregated as are the two categories of support to summarize the overall level of opposition to the tax as well as to explain opposition to the tax as a function of demographic and other variables.7 Figure 4 shows the main results of this polling over time. Over all waves of the survey in the figure, the carbon tax was strongly or somewhat supported by 50.5% of BC respondents and strongly or somewhat supported by 51.4% of respondents in other provinces. Support for the policy generally improves over time, although unevenly. In particular, respondents appear more favorable to the tax in polls taken in the November 2011 and later waves of the survey (support for the carbon tax in November 2011 and later polls was 57.7 compared with 46.2% prior to November 2011).
7 This analysis is based on the Environics Institute for Survey Research Microdata files, which contain anonymized data collected for Focus Canada. All computations on these microdata were prepared by the authors, who bear responsibility for the interpretation presented here.
15
Figure 4. Polling results on the BC carbon tax, 2008–2014
Source: Polling data was provided by Environics. Note: Dashed lines represent 95-‐percent confidence intervals. Table 5 shows the results of a regression analysis that predicts opposition to the carbon tax based on selected demographic and other variables. In the first four columns, the analysis models opposition to the carbon tax as a discrete variable that takes on a value of one if the respondent indicates that he or she somewhat or strongly opposes the tax and zero if he or she somewhat or strongly supports the tax (observations with no response or an uninformative response are dropped). The first column uses a linear probability model for the entire sample. The second column restricts the sample to respondents in British Columbia, and the third and fourth columns use the entire sample, but with probit and logit functions, respectively. The fifth column uses the entire sample and a linear model but adjusts the dependent variable so that a value of 4 indicates strong opposition, 3 indicates some opposition, 2 indicates some support, and 1 indicates strong support.

16
Table 5. Regression results for the determinants of opposition to the BC carbon tax
Note: The first column is a linear probability model on all survey respondents wherein the dependent variable is a dummy that takes on a value of 1 if the respondent opposes (somewhat or strongly) the carbon tax. The second column restricts the sample to BC residents. The third and fourth columns are similar to the first but with probit and logit specifications, respectively. The
oppose(1-4)
OLS OLS probit logistic OLS
(1) (2) (3) (4) (5)
Age: 55 or more 0.007 0.028 0.019 0.03 0.027
-0.011 -0.03 -0.028 -0.044 -0.023
Age: less than 30 -0.113*** -0.074 -0.294*** -0.475*** -0.238***
-0.018 -0.053 -0.046 -0.075 -0.038
Income: 30,000 to 60,000 0.035** 0.052 0.090** 0.145** 0.053*
-0.014 -0.038 -0.035 -0.057 -0.03
Income: 60,000 to 80,000 0.039** 0.06 0.100** 0.160** 0.094***
-0.016 -0.045 -0.042 -0.068 -0.035
Income: 80,000 to 100,000 0.014 0.02 0.035 0.057 0.025
-0.017 -0.045 -0.043 -0.069 -0.036
Income: less than 30,000 0.044*** 0.011 0.114*** 0.184*** 0.062*
-0.015 -0.044 -0.04 -0.064 -0.033
Community: Small 0.064*** 0.038 0.163*** 0.262*** 0.165***
-0.01 -0.027 -0.025 -0.041 -0.021
Region: Rest of Canada -0.009 -0.024 -0.039 -0.008
-0.014 -0.037 -0.059 -0.031
Gender: Female -0.068*** -0.077*** -0.176*** -0.282*** -0.146***
-0.01 -0.027 -0.025 -0.04 -0.021
Year: 2009 -0.073*** -0.071 -0.187*** -0.300*** -0.173***
-0.018 -0.047 -0.046 -0.074 -0.039
Year: 2010 -0.051*** -0.045 -0.132*** -0.212*** -0.117***
-0.018 -0.047 -0.046 -0.074 -0.039
Year: 2011 -0.161*** -0.143*** -0.411*** -0.658*** -0.387***
-0.018 -0.046 -0.045 -0.073 -0.038
Year: 2012 -0.181*** -0.228*** -0.465*** -0.747*** -0.404***
-0.019 -0.052 -0.048 -0.078 -0.04
Year: 2013 -0.126*** -0.113** -0.323*** -0.517*** -0.298***
-0.018 -0.047 -0.046 -0.074 -0.039
Year: 2014 -0.147*** -0.167*** -0.376*** -0.603*** -0.398***
-0.019 -0.046 -0.048 -0.077 -0.04
Constant 0.574*** 0.577*** 0.189*** 0.304*** 2.812***
-0.021 -0.042 -0.053 -0.085 -0.044
Observations 10,339 1,357 10,339 10,339 10,339
Dependent variable: opposetax(0-1)

17
fourth column uses a numerical dependent variable that takes on a value of 4 if the respondent strongly opposes the tax and 1 if the respondent strongly supports the tax (with 2 and 3 for somewhat support and oppose).
Coefficient estimates in all models are similar in sign and meaning. In particular, young people (under 30) are much less likely to oppose the tax than others. On average, being young reduces the probability that a respondent states opposition to the tax by 11 percentage points. Given that the average level of support for the policy is about 50%, this finding implies that young people are more than 20% more likely to support a carbon tax than older people. Likewise, people in high-income households (more than $100,000 per year) are significantly less likely to oppose the tax than others. In fact, opposition to the tax increases smoothly with reductions in household income and is highest for the lowest-income households. Specifically, households with an income of less than $30,000 per year have a probability of supporting the tax that is about 4.4 percentage points lower than households with incomes greater than $100,000. Households in small communities (fewer than 100,000 people) are also significantly more likely to oppose the tax. The analysis suggests that households in small communities have a 6.5% greater probability of opposing the tax than residents of large cities. Likewise, males are much more likely (by 7 percentage points) to state opposition to the tax than females. Support for the tax does not appear to be different in British Columbia than in other parts of Canada, as suggested in Figure 4. Finally, opposition to the tax appears to have declined substantially over time, consistent with the trends in Figure 4. The model can be used to construct a profile of respondents who are most likely to support the tax and those who are more likely to oppose the tax. For example, a middle-aged male, with low or middle income, living in a small community has roughly a 70% chance of opposing the tax. On the other side, a young female with high income living in a large urban area has less than a 40% chance of opposing the tax (i.e., more than 60% probability of supporting the tax). In addition to survey responses from telephone polls, elections provide another useful point of evidence relating to public support for the carbon tax. British Columbia has fixed election dates, and elections were held within one year of the tax’s introduction (in May 2009). Polling from this period suggests that BC residents were roughly evenly divided on the carbon tax, which was certainly a key issue for voters at the time of the election. As mentioned above, the main opposition New Democratic Party ran an “Axe the tax” campaign, promising to replace the tax with a cap-and-trade system if elected (Harrison 2013). The incumbent Liberal party, which introduced the tax, won both the popular vote and seat shares, which changed little compared with share after the 2005 election. Importantly, environmental NGOs were strong supporters of the carbon tax and active during the election; they likely played a role in the election outcome, in particular by encouraging some environmentally motivated voters to support the Liberals, normally considered the business-friendly party in British Columbia. By the time of the 2013 election, the New Democratic Party had changed its position on the carbon tax, such that the tax was no longer an important election issue. Conclusion and Policy Implications British Columbia has given the world perhaps the closest example of an economist’s textbook prescription for the use of a carbon tax to reduce GHG emissions. The tax covers a wide base, started low to ease the transition, and rose to a more substantive level, roughly in line with recent mid-range estimates of the marginal damages per ton or the “social cost of carbon” (Pizer et al. 2014) and the highest broad-based carbon price in practice today (2015). The intended use of tax revenues is to lower preexisting distortionary income taxes on businesses and households as well as to target transfers to presumptively disadvantaged low-income households. Reporting of the sources and uses of carbon tax funds is subject to a highly transparent process, under which politicians and their constituencies can track how the revenues are used each year. Given these features, the BC carbon tax provides an excellent field test of a widely prescribed policy.

18
This analysis has assembled and reviewed existing studies of the BC carbon tax’s effect on emissions, economic performance, distributional outcomes across household-income levels, and public acceptance. It also presented an original statistical analysis of household perceptions of the tax in British Columbia or a hypothetical similar tax in other Canadian provinces. Although the published work in this area is fairly thin in quantity, findings are fairly consistent across studies within a category and are consistent with economic and demographic theory. Key messages from this assembled body of work follow. Signals of Success The primary objective of the BC carbon tax is to reduce GHG emissions, and essentially all studies show it is doing just that, with reductions 5–15% below the counterfactual reference level. Some studies suggest that the tax has an amplified effect on fuel-consuming (emitting) behavior above that produced by an equivalent change in fuel price. Those studies provide a range of explanations, and also find consistency with results on other taxes and policy interventions that produce outsize responses. A secondary goal of the carbon tax is fiscal reform—to enable the use of a tax on “bads” (pollution) to displace a tax on “goods” (labor and capital), with the attendant possibility that a double dividend— pollution reductions and economic growth—might be produced. The evidence, although not decidedly pointing to a strong form of double dividend, tends to show no statistically significant effect at all on net growth for the province. At minimum, this finding suggests any negative economic effects are minimal. Studies do not estimate the economic benefits from avoided climate change, which would also contribute to policy success. A main concern regarding implementation of a carbon tax (shared with other consumption taxes) is that the incidence of the tax may fall especially on lower-income households. This concern was addressed by dedicating a portion of revenues to low-income tax credits and to cuts in the lowest-income tax brackets. Existing analysis confirms that this measure mitigated any regressive impact of the tax when it was implemented. However, there is debate about the incidence of the tax as it was scaled up, because tax rebates for low-income households were not increased proportionately to the tax rate. The body of research does agree that the overall effects on distribution of income are likely to be small. Although economists often prescribe carbon taxes, implementation is rare because of limited public support. Implementation of the carbon tax in British Columbia provides a case study of support for a carbon tax post-implementation. Using multiple waves of polling data, the analysis presented here finds that support for the carbon tax in British Columbia has increased, such that three years after implementation it has achieved majority support. Shortcomings Although the tax appears to be a success on many fronts, it has some potential shortcomings. First, although the empirical literature suggests that the tax has reduced emissions from covered fuels in British Columbia, no one knows if it has led to emissions “leakage”—that is, whether some observed emissions reductions in British Columbia are associated with emissions increases elsewhere.8 No studies are known to have attempted to quantify the magnitude of this effect. Second, although the carbon tax in British Columbia was originally implemented as a “textbook” policy, with wide coverage, no exemptions, and use of revenue for broad-based tax cuts and low-income tax credits, deviations from the policy have occurred in recent years. Exemptions from the tax were granted starting in 2012 to some agricultural sub-sectors and in 2014 to liquid fuel use for the entire agricultural sector. Rather than attempting to increase the (already wide) coverage of the tax, coverage has been slightly narrowed over time. In addition, broad-based tax cuts that accompanied the tax in its original 8 For an analysis of leakage from the California cap-and-trade program, see Caron et al. (2015).

19
implementation have more recently been used to support particular industries (especially the film production industry) through targeted tax credits. These trends likely reduce the cost-effectiveness of the tax overall. Finally, although the tax is now supported by more than half of the BC population, it remains a politically difficult policy to implement, because support and opposition are concentrated in particular groups. Opposition to the tax remains high in middle- and low-income, older, male, and rural groups, which are important electoral demographics. References Andersen, M.S., et al. 2007. Competitiveness Effects of Environmental Tax Reforms. Final Report to the European Commission, http://www2.dmu.dk/cometr/.
Beck, M, N. Rivers, R. Wigle, and H. Yonezowa. 2015. “Carbon Tax and Revenue Recycling: Impacts on Households in British Columbia.” Resource and Energy Economics (forthcoming).
Beck, M., N. Rivers, and H. Yonezawa. 2015. “A Rural Myth? The Perceived Unfairness of Carbon Taxes in Rural Communities.” Manuscript.
Bernard, J.-T., G. Guenther, and M. Kichian. 2014. “Price and Carbon Tax Effects on Gasoline and Diesel Demand.” Manuscript.
Bovenberg, A. Lans, and Lawrence H. Goulder. 2000. “Environmental Taxation and Regulation in a Second-Best Setting.” In Handbook of Public Economics, Second Edition, edited by A.Auerbach and M. Feldstein. New York: North Holland.
British Columbia Ministry of Finance. 2013. Carbon Tax Review. http://www.fin.gov.bc.ca/tbs/tp/climate/Carbon_Tax_Review_Topic_Box.pdf.
British Columbia Ministry of Finance. 2015. How the Carbon Tax Works. http://www.fin.gov.bc.ca/tbs/tp/climate/A4.htm .
British Columbia Ministry of Metals and Mines. 2013. Weekly Metal and Coal Prices. http://www.empr.gov.bc.ca/Mining/MineralStatistics/Market/WeeklyMetalandCoalPrices/Pages/default.aspx.
British Columbia. 2008. “Climate Action Plan.” www.gov.bc.ca/premier/attachments/climate_action_plan.pdf
Caron, J., S. Rauch, and N. Winchester. 2015. “Leakage from sub-National Climate Policy: The Case of California’s Cap and Trade Program.” Energy Journal 36(2).
Elgie, Stewart, and Jessica McClay. 2013. “BC’s Carbon Tax Shift Is Working Well after Four Years (Attention Ottawa).” Canadian Public Policy 39(2):1–10.
Fullerton, Don, and Gilbert Metcalf. 1998. “Environmental Taxes and the Double-Dividend Hypothesis: Did You Really Expect Something for Nothing?” Chicago-Kent Law Review 73: 221–256.
Gore, A. 2006. An Inconvenient Truth: The Planetary Emergency of Global Warming and What We Can Do About It. New York: Rodale Press.
Goulder, L.H., and A. Schein. 2013. “Carbon Taxes vs. Cap and Trade: A Critical Review.” Climate Change Economics 4(3).
Gulati, S., and Z. Gholami. 2015. “Estimating the Impact of Carbon Tax on Natural Gas Demand in British Columbia.” Sustainable Prosperity.

20
Harrison, K. 2013. “The Political Economy of British Columbia's Carbon Tax.” OECD Environment Working Papers No. 63, OECD Publishing. http://dx.doi.org/10.1787/5k3z04gkkhkg-en.
IPCC (intergovernmental Panel on Climate Change). 2007. “Climate Change 2007: The Physical Science Basis.” In Fourth Assessment Report of the Intergovernmental Panel on Climate Change, edited by S. Solomon, D. Qin, M. Manning, Z. Chen, M. Marquis, K.B. Averyt, M.Tignor, and H.L. Miller. Cambridge and New York: Cambridge University Press.
Lee, Marc, and Toby Sanger. 2008. “Is BC’s Carbon Tax Fair?” Vancouver: Canadian Centre for Policy Alternatives.
Metcalf, Gilbert E. 2015. “A Conceptual Framework for Measuring the Effectiveness of Green Fiscal Reforms.” Prepared for the Green Growth Knowledge Platform Third Annual Conference on "Fiscal Policies and the Green Economy Transition: Generating Knowledge – Creating Impact" in Venice, Italy, January 29–30.
Murray, B.C., and P.T. Maniloff. 2015. “Why Have Greenhouse Emissions in RGGI States Declined? An Econometric Attribution to Economic, Energy Market, and Policy Factors.” In review.
Natural Resources Canada. 2014. Energy Markets Fact Book: 2014–15. http://www.nrcan.gc.ca/sites/www.nrcan.gc.ca/files/energy/files/pdf/2014/14-0173EnergyMarketFacts_e.pdf.
Natural Resources Canada. 2015. Average Retail Prices (for regular gasoline and diesel in Vancouver).
Paterson, M. 2012. “Who and What Are Carbon Markets For? Politics and the Development of Climate Policy.” Climate Policy 12(1):82–97.
Pearce, David. 1991. “The Role of Carbon Taxes in Adjusting to Global Warming.” The Economic Journal 101 (407):938-48.
Pizer, W., M.J. Adler, J. Aldy, D. Anthoff, M. Cropper, K. Gillingham, M. Greenstone, B. Murray, R. Newell, W. Pizer, R. Richels, A. Rowell, S. Waldhoff, and J. Wiener. 2014. “Using and Improving the Social Cost of Carbon.” Science 346(6214):1189–1190.
Rivers, Nicholas, and Brandon Schaufele. 2012. “Carbon Tax Salience and Gasoline Demand.” University of Ottawa, Department of Economics Working Paper 1211E.
Rivers, N.J., and B. Schaufele. 2015. “The Effect of Carbon Taxes on Agricultural Trade.” Canadian Journal of Agricultural Economics 63(2).
Schmalensee, R., and R.N. Stavins. 2013. “The SO2 Allowance Trading System: The Ironic History of a Grand Policy Experiment. Journal of Economic Perspectives 27(1):103–1.22
Stavins, Robert N. 1998. “What Can We Learn from the Grand Policy Experiment? Lessons from SO2 Allowance Trading.” Journal of Economic Perspectives 12(3):69 – 88.
Tullock, Gordon. 1967. “Excess Benefit.” Water Resources Research 3(2):643.
Weitzman, M. L. 1974. “Prices vs. Quantities.” Review of Economic Studies 41(4):477–491.
World Bank. 2014. States and Trends of Carbon Pricing. http://www.worldbank.org/content/dam/Worldbank/Highlights%20&%20Features/Climate%20Change/carbon-pricing-map-900x476-c.jpg
Yamazaki, A. 2015. “On the Employment Effects of Climate Policy: The Evidence from Carbon Tax in British Columbia.” Manuscript in review.
AcknowledgmentsBrian Murray wrote this article while on a Fulbright fellowship at University of Ottawa’s Institute of the Environment and affiliated think tank, Sustainable Prosperity. Nicholas Rivers acknowledges support from the Social Sciences and Humanities Research Council Canada Research Chairs Program.
Nicholas Institute for Environmental Policy SolutionsThe Nicholas Institute for Environmental Policy Solutions at Duke University is a nonpartisan institute founded in 2005 to help decision makers in government, the private sector, and the nonprofit community address critical environmental challenges. The Nicholas Institute responds to the demand for high-quality and timely data and acts as an “honest broker” in policy debates by convening and fostering open, ongoing dialogue between stakeholders on all sides of the issues and providing policy-relevant analysis based on academic research. The Nicholas Institute’s leadership and staff leverage the broad expertise of Duke University as well as public and
copyright (c) 2015 Nicholas Institute for Environmental Policy Solutions
private partners worldwide. Since its inception, the Nicholas Institute has earned a distinguished reputation for its innovative approach to developing multilateral, nonpartisan, and economically viable solutions to pressing environmental challenges..
ContactNicholas Institute, Duke UniversityP.O. Box 90335Durham, North Carolina 27708
1201 New York Avenue NWSuite 1110Washington, D.C. 20005
Duke Marine Lab RoadBeaufort, North Carolina 28516
919.613.8709 phone919.613.8712 [email protected]