british columbia institute of technology columbia institute of technology 3700 willingdon avenue,...
TRANSCRIPT

British Columbia Institute of Technology 3700 Willingdon Avenue, Burnaby, British Columbia
EENNEERRGGYY MMAANNAAGGEEMMEENNTT AACCTTIIOONN PPLLAANN
For the Natural Resources Canada’s Energy Innovators Initiative and Canada’s Climate Change Voluntary Challenge and Registry Inc.

BCIT Energy Management Action Plan
Page 2
Date August 24, 2001

BCIT Energy Management Action Plan
Page 1
Table of Contents
Table of Contents Page 1
Section 1 – Institute Profile Page 2 1.1 Key Personnel Page 3 1.2 Institute Survey Page 3 1.3 Background Description Page 4
Section 2 - Energy Management Policy Page 9 2.1 Commitment by Institute Page 9 2.2 Energy Management Goals and Targets Page 9 2.3 Energy Management Objectives Page 9 2.4 Key Personnel Involved (Planning Team) Page 11 2.5 Additional Policy Information Page 12
Section 3 - Energy Use and Costs Page 13 3.1 Energy Consumption and Costs Page 14 3.1.1 Determination of Baseline Consumption and Cost Data Page 17 3.1.2 Determination of Forecasted Consumption and Cost Page 17 3.2 Special Events and Other Variables Page 17
Section 4 - Energy Management Projects and Actions Page 20 4.1 Past and Currently Undergoing Projects and Actions Page 21 4.2 Proposed Actions and Projects Page 22 4.3 Training, Communication and Awareness Programs Page 24
Section 5 – Reporting and Evaluation Page 25 5.1 Reporting, Verifying and Updating the Action Plan and Targets Page 26
Section 6 - Appendix Page 27

BCIT Energy Management Action Plan
Page 2
SSeeccttiioonn 11
IINNSSTTIITTUUTTEE PPRROOFFIILLEE
BCIT Energy Management Action Plan
Page 3
Section 1 – Institute Profile
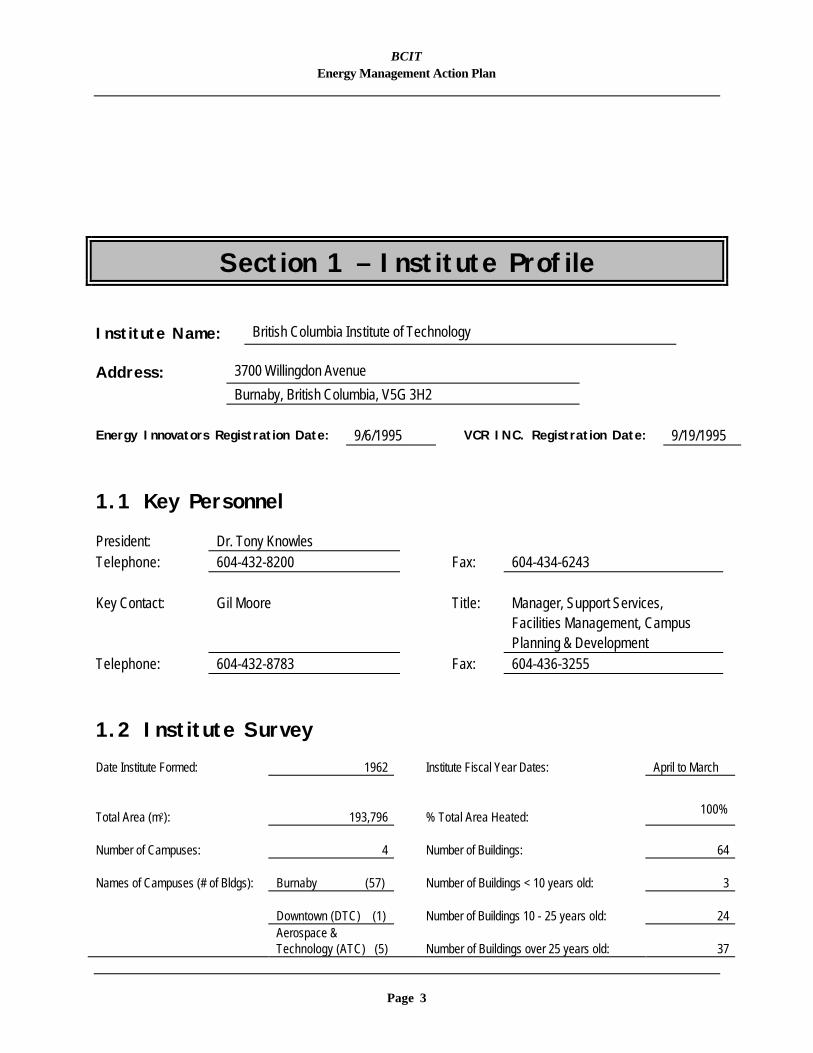
Institute Name: British Columbia Institute of Technology
Address: 3700 Willingdon Avenue
Burnaby, British Columbia, V5G 3H2 Energy Innovators Registration Date: 9/6/1995 VCR INC. Registration Date: 9/19/1995
1.1 Key Personnel
President: Dr. Tony Knowles Telephone: 604-432-8200 Fax: 604-434-6243 Key Contact: Gil Moore Title: Manager, Support Services,
Facilities Management, Campus Planning & Development
Telephone: 604-432-8783 Fax: 604-436-3255
1.2 Institute Survey Date Institute Formed: 1962 Institute Fiscal Year Dates: April to March
Total Area (m2): 193,796 % Total Area Heated: 100%
Number of Campuses:
4
Number of Buildings:
64
Names of Campuses (# of Bldgs):
Burnaby (57)
Number of Buildings < 10 years old:
3
Downtown (DTC) (1)
Number of Buildings 10 - 25 years old:
24
Aerospace & Technology (ATC) (5)
Number of Buildings over 25 years old:
37

BCIT Energy Management Action Plan
Page 4
Pacific Marine Training (PMTC) (1)
Number of Full Time Employees:
1300
Number of Full Time Students:
15,000
Number of Part Time Employees:
700
Number of Part Time Students:
33,000
Full Time Equivalents (FTE):
11,221

BCIT Energy Management Action Plan
Page 5
1.3 Background Description
The British Columbia Institute Technology (BCIT) opened in 1962 as the first Institute of Technology in the province, providing primarily engineering technology programmes. Initially the campus, which is nestled in the heart of Burnaby, B.C., just south of Highway 401, consisted of one main academic and administrative building (part of the current SW1). Soon after, other buildings were constructed including further academic complexes, the Library and the Athletic Complex. In the late 1970’s, success of the technology programmes offered, necessitated the construction of on-campus student residences, which were expanded in the early 1980’s. The nature of the programmes also expanded to include Health, Computer Sciences and Business related studies. In addition, a modest Downtown Vancouver operation was opened, in leased facilities, to provide much needed Part-Time studies to the downtown core. In the mid-1980’s a government initiative amalgamated the adjacent Pacific Vocational Institute into the BCIT framework. Adding considerable size and programming diversity to the overall BCIT mandate, including a campus for Aerospace & Technology Training at the Vancouver International Airport. With this addition, BCIT became the premier post secondary school in the B.C. for a wide range of Technology and Trades Training opportunities. During the 1990’s, another government initiative further broadened the range of programmes provided by BCIT. By incorporating the Pacific Marine Training operation, which added a campus located on the North Vancouver waterfront. In addition, with the completion of a Campus Master Plan, along with further programme expansion and specialization, some significant building construction, renovation and retrofitting was completed at the main Burnaby Campus. During this expansion period the Campus Centre was opened in 1995, which provided a focal point for the campus community at the heart of the Campus. All phases of this expansion utilized the opportunities provided by Power Smart to improve the energy efficiency of the facilities included. In another bold venture, which was primarily self funded, the construction of a new Downtown Vancouver Campus for business & high-tech training, was successfully completed in 1996, consisting of an eight level high rise and a four level underground parking facility. Using high technical standards for occupant comfort and energy efficiency, the new Downtown Campus received the Power Smart Award for Energy Efficiency, as well as the BOMA Toby award for buildings in a similar category. BCIT now operates on the four campus sites, and continues to expand via various property acquisitions immediately adjacent to the Burnaby Campus. The most recent being the addition of the Royal Oak College property, which will house the BCIT International operations, Interior Design programmes, and other part-time studies activities. The primary technology training operations at the Burnaby Campus span the months of September through May, with increasing expansion of related programmes into the summer months. Burnaby Campus Trades training related operations span all months of the year, with very minimal breaks during the summer months. The Aerospace & Technology Campus operates year round with the exception of three summer weeks, and the Pacific Marine Training & Downtown Campuses now utilized all twelve months of the year for training. Over the years, the Part-time studies operations have continued to expand (between 5 and 10% annually), increasing the operating hours of facilities, which range from 7 am to 10:30 pm on all campuses, with ever increasing demand for

BCIT Energy Management Action Plan
Page 6
programmes offered on Saturdays and Sundays. It is expected that this trend towards increased facility usage will continue to match the demand for unique methods of training delivery, as well as the need for BCIT to forge specialized and flexible relationships and partnerships with business and industry.

BCIT Energy Management Action Plan
Page 7
The utilities for the Institution are the responsibility of, and are coordinated by the Facilities Management, Campus Planning & Development Department. The utilities provided are:
?? Electrical: Electricity is purchased from BC Hydro and metered as follows; two primary meters at the Burnaby Campus, one each for the north & south sectors, one meter for the Student Residence, and one meter for the newly acquired property (formerly Royal Oak College). One primary meter for the Downtown Vancouver Campus, one for the Pacific Marine Training Campus in North Vancouver, and two for the Aerospace & Technology Campus at the Vancouver International Airport. Rates have remained constant at approx. $0.05/kwh, since 1993.
?? Natural Gas: BCIT purchases most of its natural gas commodity direct via Premstar Pacific, and BC Gas provides transportation of all gas to BCIT. Interruptible supply is used for the main heating plant boilers, which serve the south sector of the Burnaby Campus. Firm supply is required for the remainder of the satellite boiler systems in the north sector of the Burnaby Campus, the Aerospace & Technology Campus and the Pacific Marine Training Campus.
?? Fuel Oil Heating Oil is utilized as an alternate fuel in the main heating plant hot water heating boilers, for use when transportation curtailment is implemented by BC Gas for interruptible natural gas.
?? Diesel: Diesel is supplied as a back up energy source for emergency generators.
?? Steam: Steam is purchased from Central Steam in Vancouver for heating at the Downtown Campus.
?? Propane: Very small quantities of Propane are used to fuel a small furnace and a hot water tank for the Daycare building at Burnaby, and small furnaces for three portable buildings at the Aerospace & Technology Campus.
?? Domestic Water: Water and sewer is billed by the City of Burnaby at a total rate (2000/2001) of $0.331 and $0.501 per cubic meter (m3) respectively.
A monitoring and tracking system is in place in spreadsheet form with reports utilized for annual utility budget planning.

BCIT Energy Management Action Plan
Page 8
BCIT Building Listing: AREA BUILDING DESCRIPTION (SQ.M.) AGE Burnaby Campus NE 1 JW INGLIS – Classroom/Lab/Trades Shop/AdminOffices/Cafeteria 18,792.50 1973 NE 2 BENCHWORK SHOP 1,972.90 1959 NE 3 TECHNOLOGY CENTRE 484.30 1971 NE 4 CARPENTRY SHOP 1,853.10 1959 NE 6 PLUMBING SHOP/CLASSROOM 2,443.30 1960 NE7 FACILITIES MANAGEMENT SHOPS 412.52 1964 NE 8 WELDING SHOP 1,961.30 1982 NE 9 FACILITIES MANAGEMENT ADMIN./TENANT 2,436.95 1964 NE10 AUTO COLLISION SHOP/CLASSROOMS 1,670.20 1964 NE12 SHEET METAL SHOP/CLASSROOMS 2,680.20 1971 NE16 HEAVY DUTY SHOP 2,227.70 1957 NE18 AUTOMOTIVE SHOP 1,897.20 1957 NE20 SMALL ENGINES SHOP 3,261.20 1957 NE21 LEARNING RESOURCES 565.70 1959 NE22 SMALL ENGINES RESOURCE 580.70 1959 NE23 CARPENTRY CLASSROOM 615.10 1959 NE24 AUTOMOTIVE CLASSROOM 615.30 1959 NE25 APPLIED TRAINING & TECNOLOGY CENTRE 2,606.90 1982 NE26 AUTOMOTIVE RESOURCE CENTRE 591.40 1959 NE27 INDUSTRIAL INSTRUMENTATION – Demo. Plant 706.40 1960 NE28 HEAVY DUTY CLASSROOM 615.30 1959 NW 1 MARKETING/BCIT INTERNATIONAL 1,426.30 1962 NW 3 PAINTING 2,702.30 1961 NW5 R2000 DEMONSTRATION BUILDING 461.02 1987 NW 6 MACHINE SHOP 2,958.00 1964 SE 1 ELECTRICAL TRAINING CENTRE 6,612.80 1979 5A FORESTRY FIELD HOUSE 60.40 1968 SE 2 FOOD PAVILLION – Main Cafeteria/Conference Rooms/Cafe 2,701.10 1961 SE 2 STUDENT ASSOCIATION CAMPUS CENTRE 4,646.00 1995 SE 4 CLASSROOM 705.90 1968 SE 6 IBM TECHNOLOGY - Classroom/Computer Labs/Faculty Offices 4,681.20 1991 SE 8 CENTRAL HEATING PLANT/AUTOMOTIVE SHOP 2,882.80 1964 SE 8.1 PORTABLE 1N – OFFICES 35.10 1981 SE 8.2 PORTABLE 1M - OFFICES 81.40 1981 SE 8.3 PORTABLE 1L - OFFICES 88.70 1981 SE10 BROADCAST – RADIO/TV TRAINING 1,766.70 1982 SE12 1976 BUILDING CLASSROOM OFFICE 8,889.70 1976 SE9 TELEPHONE EXCHANGE/Central Meeting 148.10 1968 SE14 LIBRARY 6,004.40 1969 AREA BUILDING DESCRIPTION (SQ.M.) AGE

BCIT Energy Management Action Plan
Page 9
SE16 STUDENT ACTIVITY CENTRE - Gymnasium 5,009.90 1970 SE30 WAREHOUSE 669.60 1980 SW 1 1962 BUILDING MAIN CLASSROOM BLOCK 15,483.10 1962 SW 2 CONNECTOR - Faculty Offices 2,142.00 1994 SW 3 1967 BUILDING CLASSROOM BLOCK 16,803.20 1967 SW 5 THEATRE BUILDING 896.60 1967 SW 7 DAYCARE 626.60 1989 SW 9 MECHANICAL/INDUSTRIAL ED. 6,530.30 1969 SW10 MAQUINNA RESIDENCE - NOOTKA 1,041.90 1978 SW11 MAQUINNA RESIDENCE - SALISH 1,143.90 1978 SW12 MAQUINNA RESIDENCE - CHILCOTIN 989.40 1978 SW13 MAQUINNA RESIDENCE - CARRIER 991.10 1978 SW14 MAQUINNA RESIDENCE - KOOTENAY 991.10 1978 SW15 MAQUINNA RESIDENCE - NISHKA 1,071.10 1983 SW16 MAQUINNA RESIDENCE - HAIDA 951.00 1983 TOTAL AREA BURNABY 151,182.89 TOTAL BUILDINGS BURNABY 54 SE40 ex -Royal Oak - aquired 2001 1989 SE41 ex -Royal Oak - aquired 2001 1989 SE42 ex -Royal Oak - aquired 2001 1989 57 Aerospace & Technology Campus SI02 HANGAR 6,505.67 1955 SI03 ADMIN/CLASSROOM 3,062.44 1955 A Portable Classroom 150.00 1980 B Portable Classroom 150.00 1980 E Portable Classroom/shop 150.00 1980 TOTAL AREA SEA ISLAND 10,018.11 TOTAL BUILDINGS SEA ISLAND 5 Pacific Marine Training Campus PM01001 Marine Training 6,465.80 1978 TOTAL AREA PMTC 6,465.80 TOTAL BUILDINGS PMTC 1 AREA BUILDING DESCRIPTION (SQ.M.) AGE Downtown Campus 1 ADMIN/CLASSROOM/TENANT/PARKING 26,129.60 1996

BCIT Energy Management Action Plan
Page 10
TOTAL AREA DTC 26,129.60 TOTAL BUILDINGS DTC 1 TOTAL BCIT BUILDING AREA 193,796.40

BCIT Energy Management Action Plan
Page 11
SSeeccttiioonn 22
EENNEERRGGYY MMAANNAAGGEEMMEENNTT PPOOLLIICCYY

BCIT Energy Management Action Plan
Page 12
Section 2 - Energy Management Policy
2.1 Commitment by Institute In an attempt to reduce operating costs, while assisting Canadian governments in meeting Canada’s international commitment to stabilize greenhouse gas emissions, the BCIT President, Dr. Tony Knowles, and the BCIT Board of Governors, is pleased to acknowledge that our Institute is committed to continuing the undertaking of economic measures to increase our organization’s energy efficiency as a means of limiting the production of greenhouse gas emissions. BCIT has been registered with the Voluntary Challenge and Registry (VCR) and the Energy Innovators since 1995.
2.2 Energy Management Goals and Targets
BCIT has actively pursued and implemented measures to curtail the increase in energy consumption and related greenhouse gas emissions since 1990, during a period in which there has been a significant increase in student population, operating hours, and campus expansion. BCIT now plans to focus it’s efforts on implementing all remaining economically viable energy efficiency opportunities, with the following targets established:
?? It is projected that by 2005/2006 cost savings or cost avoidances of 20% can be achieved for the combined campus operations, by implementing cost-effective measures in all areas.
?? It is projected that by 2005/2006 a reduction in energy consumption of 20% over the 2000/01 levels can be achieved.
?? BCIT is a participant in the Voluntary Challenge & Registry and the Energy Innovators Initiative, hence it is projected that the measures implemented will reduce greenhouse gas emissions by 20% over a five year period from 2000/01 to 2005/2006.
Appropriate adjustments to the above targets will be made in consideration of changes to the various campus areas.
2.3 Energy Management Objectives
BCIT ‘s commitment to effective energy and environmental management is guided by the following objectives:
?? To improve the efficiency of energy use through low-cost opportunities by implementing:

BCIT Energy Management Action Plan
Page 13
?? sound operating and maintenance practices; ?? employee training, along with occupant, staff and student awareness; ?? utilizing existing, and improving upon “green” purchasing policies; and ?? utilizing an effective monitoring and tracking system.
?? To promote awareness of climate change and greenhouse gas emissions reductions, within the BCIT staff & student population.
?? To reduce energy operating costs through the initiation of an energy retrofit program, which in turn, will
help reduce greenhouse gas emissions.
?? To improve the efficiency of energy use through specific capital upgrades or in conjunction with capital renovation or construction projects.
?? To consider the option of energy performance contracting as a potential method of implementing energy efficiency strategies, where capital or other funding may not be available.
2.4 Key Personnel Involved (Planning Team)
To achieve the goals and objectives, BCIT has formed the following planning team:
Name Title Roles/Responsibility John Wong Director, Facilities
Management, Campus Planning & Development
Energy Champion
Gil Moore Manager, Support Services, Facilities Management, Campus Planning & Development
Project Manager
Graham Beckett Mechanic Foreman, Facilities Management, Campus Planning & Development
Mechanical system data collection, verification & operations.
Michael Taylor Electrical Foreman, Facilities Management, Campus Planning & Development
Electrical system data collection, verification & operations.
Janice Baldry Educational Operations Manager Representative
Educational Planning/Operations data, project information and awareness source for staff.
TBA Technology Programme Representative (Faculty)
Teaching staff issues/input.
TBA Trades Programme Teaching staff issues/input.

BCIT Energy Management Action Plan
Page 14
Representative (Faculty) Steve Erdman Student Association
Representative Student feedback, project promotion
and awareness. Ian McLeod Computer Resources
Representative IT Network & Computer Work Station
and lab. data and planning.

BCIT Energy Management Action Plan
Page 15
2.5 Additional Policy Information 1. BCIT Environmental Philosophy
The British Columbia Institute of Technology believes that a healthy environment is essential and we will strive to be exemplary in our environmental performance. We will integrate economic and environmental decision- making in all aspects of our operations.
2. BCIT Policy
It is the policy of BCIT to plan and manage our operations to promote environmental protection in ways which meet the needs of the present without compromising the ability of future generations to meet their own needs. Our commitment is to: ?? responsibly manage all aspects of our operation to ensure that recognized environmental standards
and legal requirements are met and exceeded. ?? manage our operations to promote environmental protection in all feasible ways. ?? work with industry, government and public groups to help determine environmental priorities. ?? communicate with relevant stakeholder groups, in a timely and candid fashion, on the environmental
aspects of our policies and operations. ?? encourage all employees, to be conscious of environmental considerations and be protective of the
environment. ?? establish an Environment Committee which develops, implements and monitors the Institute's
environmental policy and initiatives. 3. BCIT Guidelines
Following are examples of how the policy will be applied at BCIT:
?? minimize the use or application of chemicals that are toxic or otherwise harmful to people or the environment.
?? minimize and strive to eliminate the release of any pollutants that may cause environmental damage to the air, water, or earth or its inhabitants.
?? minimize waste by practicing the three "R"s, reduce, reuse, and recycle. ?? assess the environmental impacts of any new project or activity that BCIT undertakes. ?? participate in Powersmart and other recognized public environmental programs. ?? purchase recycled products such as paper, envelopes, file folders, plastic binders etc., whenever
possible. ?? purchase on a preferential basis, those goods certified by the Environmental Choice Board. ?? evaluate all purchases based on life cycle costs including final disposal. ?? promote the adoption of these principles to BCIT's contractors and suppliers. ?? incorporate environmental concerns in educational promotion development.

BCIT Energy Management Action Plan
Page 16
SSeeccttiioonn 33
EENNEERRGGYY UUSSEE AANNDD CCOOSSTTSS

BCIT Energy Management Action Plan
Page 17
BCIT Energy Management Action Plan
Page 18
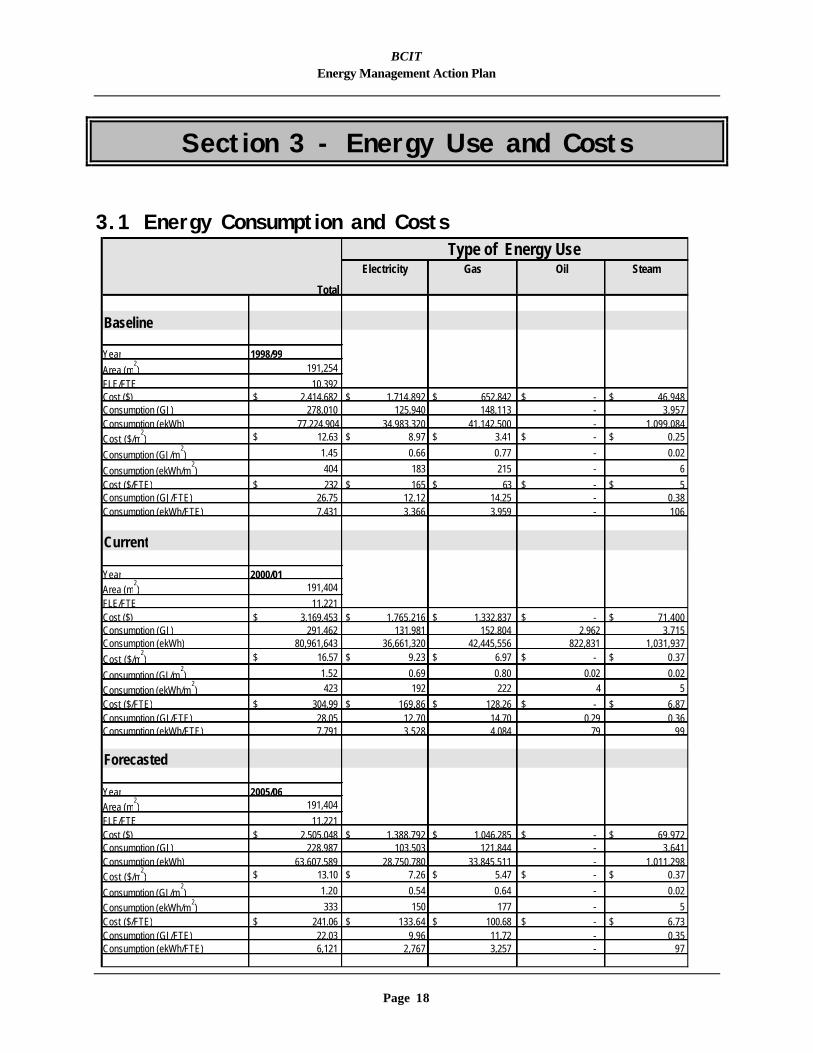
Section 3 - Energy Use and Costs
3.1 Energy Consumption and Costs
Electricity Gas Oil Steam
Baseline
Year 1998/99
Area (m2) 191,254
FLE/FTE 10,392 Cost ($) $ 2,414,682 $ 1,714,892 $ 652,842 $ - $ 46,948 Consumption (GJ) 278,010 125,940 148,113 - 3,957 Consumption (ekWh) 77,224,904 34,983,320 41,142,500 - 1,099,084 Cost ($/m
2) $ 12.63 $ 8.97 $ 3.41 $ - $ 0.25
Consumption (GJ/m2) 1.45 0.66 0.77 - 0.02
Consumption (ekWh/m2) 404 183 215 - 6
Cost ($/FTE) $ 232 $ 165 $ 63 $ - $ 5 Consumption (GJ/FTE) 26.75 12.12 14.25 - 0.38 Consumption (ekWh/FTE) 7,431 3,366 3,959 - 106
Current
Year 2000/01Area (m
2) 191,404
FLE/FTE 11,221 Cost ($) $ 3,169,453 $ 1,765,216 $ 1,332,837 $ - $ 71,400 Consumption (GJ) 291,462 131,981 152,804 2,962 3,715 Consumption (ekWh) 80,961,643 36,661,320 42,445,556 822,831 1,031,937
Cost ($/m2) $ 16.57 $ 9.23 $ 6.97 $ - $ 0.37
Consumption (GJ/m2) 1.52 0.69 0.80 0.02 0.02
Consumption (ekWh/m2) 423 192 222 4 5
Cost ($/FTE) $ 304.99 $ 169.86 $ 128.26 $ - $ 6.87 Consumption (GJ/FTE) 28.05 12.70 14.70 0.29 0.36 Consumption (ekWh/FTE) 7,791 3,528 4,084 79 99
Forecasted
Year 2005/06Area (m
2) 191,404
FLE/FTE 11,221 Cost ($) $ 2,505,048 $ 1,388,792 $ 1,046,285 $ - $ 69,972 Consumption (GJ) 228,987 103,503 121,844 - 3,641 Consumption (ekWh) 63,607,589 28,750,780 33,845,511 - 1,011,298 Cost ($/m
2) $ 13.10 $ 7.26 $ 5.47 $ - $ 0.37
Consumption (GJ/m2) 1.20 0.54 0.64 - 0.02
Consumption (ekWh/m2) 333 150 177 - 5
Cost ($/FTE) $ 241.06 $ 133.64 $ 100.68 $ - $ 6.73 Consumption (GJ/FTE) 22.03 9.96 11.72 - 0.35 Consumption (ekWh/FTE) 6,121 2,767 3,257 - 97
Type of Energy Use
Total

BCIT Energy Management Action Plan
Page 19
Energy Consumption and Cost Intensity This table provides more detailed information for past and future years.
Year Area FTE Electricity Consumption
Electricity Consumption
Gas Consumption
Oil Consumption
Steam Consumption
Total Consumption
Total Energy Cost
Energy Intensity
Cost Intensity
Energy Intensity
Cost Intensity
(m2) (KWh) (GJ) (GJ) (GJ) (GJ) (GJ) ($) (GJ/m2) ($/m2) (GJ/FTE) ($/FTE)1998/99 191,254 10,392 34,983,320 125,940 148,113 0 3,957 278,010 2,414,682 1.45 12.63 26.8 232.36 1999/00 191,404 10,981 36,291,736 130,650 167,796 0 4,404 302,851 2,615,616 1.58 13.67 27.6 238.19 2000/01 191,404 11,221 36,661,320 131,981 152,804 2,962 3,715 291,462 3,169,453 1.52 16.56 26.0 282.46 2001/02 191,404 11,221 36,661,320 131,981 155,304 0 3,715 291,000 3,169,453 1.52 16.56 25.9 282.46 2002/03 191,404 11,221 34,683,685 124,861 146,939 0 3,696 275,497 3,003,352 1.44 15.69 24.6 267.65 2003/04 191,404 11,221 32,706,050 117,742 138,574 0 3,678 259,994 2,837,251 1.36 14.82 23.2 252.85 2004/05 191,404 11,221 30,728,415 110,622 130,209 0 3,659 244,490 2,671,150 1.28 13.96 21.8 238.05 2005/06 191,404 11,221 28,750,780 103,503 121,844 0 3,641 228,987 2,505,048 1.20 13.09 20.4 223.25 2006/07 191,404 11,221 28,750,780 103,503 121,844 0 3,641 228,987 2,505,048 1.20 13.09 20.4 223.25 2007/08 191,404 11,221 28,750,780 103,503 121,844 0 3,641 228,987 2,505,048 1.20 13.09 20.4 223.25 2008/09 191,404 11,221 28,750,780 103,503 121,844 0 3,641 228,987 2,505,048 1.20 13.09 20.4 223.25 2009/10 191,404 11,221 28,750,780 103,503 121,844 0 3,641 228,987 2,505,048 1.20 13.09 20.4 223.25

BCIT Energy Management Action Plan
Page 20
Energy Cost Intensity
$0
$500,000
$1,000,000
$1,500,000
$2,000,000
$2,500,000
$3,000,000
$3,500,000
1998/9
9
1999/0
0
2000
/01
2001
/02
2002
/03
2003/0
4
2004/0
5
2005/0
6
2006/0
7
2007
/08
2008
/09
2009/1
0
Year
Ene
rgy
Cos
t
0
2
4
6
8
10
12
14
16
18
Inte
nsi
ty ($
/m2 )
Total Energy Cost
Cost Intensity ($/m2)
Energy Consumption Intensity
0
50,000
100,000
150,000
200,000
250,000
300,000
350,000
1998
/99
1999/0
0
2000
/01
2001/0
2
2002/0
3
2003
/04
2004/0
5
2005
/06
2006/0
7
2007
/08
2008
/09
2009/1
0
Year
Ene
rgy
Con
sum
ptio
n (G
J)
0.0
0.2
0.4
0.6
0.8
1.0
1.2
1.4
1.6
1.8
Inte
nsi
ty (
GJ/
m2 )
Total Energy Consumption
Consumption Intensity (GJ/m2)

BCIT Energy Management Action Plan
Page 21
3.1.1 Determination of Baseline Consumption and Cost Data The following is a description of how the baseline was selecting, including why the baseline year was selected any other assumptions that were made. Sample calculations are also provided in the Annex.
1998/99 was chosen as the base year due to it being the most current year for comparison purposes that is relevant to the current operating conditions, including the downtown campus. 1998/99 was the last available year with complete energy records available
3.1.2 Determination of Forecasted Consumption and Cost The following are assumptions made in determining forecasted consumption intensity, CO2 productions and savings. Sample calculations are provided in the Appendix.
?? Year 2005/2006 was selected as the Target Year. The management goal is to reduce electricity and gas
use by the following percentages in its campuses. 1-DTC: 2% for electricity and gas 2-ATC: 20% for electricity and gas 3-PMTC: 16% for electricity and gas 4-Burnaby Campus: 24% for electricity and 22% for gas
A five-year reduction period was selected to correspond with BCIT’s long range planning cycle.
3.2 Special Events and Other Variables The following are variables, which have influenced energy consumption and costs over the past few years:
?? Increase in building areas, via new construction or property acquisitions. ?? Increase in operating hours due to FTE increases, particularly Part-time studies. ?? Changes in building uses involving more energy driven teaching equipment, including computers and
trades machinery. ?? Significant increases in the cost for the supply of Natural Gas.

BCIT Energy Management Action Plan
Page 22
3.3 Greenhouse Gas Information Production of Greenhouse Gas Emissions
Energy Consumption Type of Gas Emission Energy Use
Equivalent Energy Use
(GJ)
CO2
(tonnes)
N2O Equivalent CO2
(tonnes)
CH4 Equivalent CO2
(tonnes)
Total Equivalent CO2
(tonnes) Baseline (Year: 1998/1999)
Electricity 34,983,320 (kWh) 125,940 932.0 4.03 0.07 936.1 Natural Gas 148,113 (GJ) 148,113 7,358.3 23.88 3.42 7385.6 Oil - - - - - - Steam 3,750,430 (lb) 3,957 196.6 0.64 0.09 197.3
Total 278,010 8,519 Current (Year: 2000/2001) Electricity 36,661,320 (kWh) 131,981 976.7 4.22 0.08 981.0 Natural Gas 152,804 (GJ) 152,804 7,591.3 24.63 3.53 7,619.5 Oil 76,582 (liters) 2,962 216.73 0.31 0.04 217.1 Steam 3,521,300 (lb) 3,715 184.6 0.60 0.09 185.2
Total 291,462 9,003 Forecasted (Year: 2005/2006) Electricity 28,750,780 (kWh) 103,503 765.9 3.31 0.06 769.3 Natural Gas 121,844 (GJ) 121,844 6,053.2 19.64 2.81 6,075.7 Oil - - - - - - Steam 3,450,874 (lb) 3,641 180.9 0.59 0.08 181.5
Total 228,987 7,026

BCIT Energy Management Action Plan
Page 23
CO2 Emissions Intensity
0
2,000
4,000
6,000
8,000
10,000
12,000
1998/9
919
99/00
2000
/01
2001
/02
2002/0
3200
3/04
2004/0
520
05/06
2006
/07
2007/0
8
2008/0
9200
9/10
Year
To
tal
CO
2 E
mis
sion
s (t
onne
s)
0.000
0.010
0.020
0.030
0.040
0.050
0.060
Inte
nsi
ty (
ton
nes
/m2 )
Total CO2 Emissions
CO2 Intensity (tonnes/m2)

BCIT Energy Management Action Plan
Page 24
SSeeccttiioonn 44
EENNEERRGGYY MMAANNAAGGEEMMEENNTT PPRROOJJEECCTTSS AANNDD AACCTTIIOONNSS

BCIT Energy Management Action Plan
Page 25

BCIT Energy Management Action Plan
Page 26
Section 4 - Energy Management Projects and Actions
4.1 Past and Currently Undergoing Projects and Actions
Energy Lighting Phase I BIP NE1, NW1 1991/92 $143,000 $30,000 600,000 16.1 Food Pavilion Phase I NBD SE2 - RIX & Conf A/B 1991/92 N/A $4,350 87,000 2.3 Food Pavilion Phase II NBD SE2 - Cafe & Conf C/D 1993/94 N/A $3,850 77,000 2.1 IBM Technology Building NBD SE6 1993/94 N/A $10,800 216,000 5.8 SW1 Seismic Upgrading BIP SW1 - Main Block 1993/94 $110,300 $22,150 443,000 11.9 Connector Building NBD SW2 1994/95 N/A $4,100 82,000 2.2 Exit Lamp Retrofit BIP SW1 1994/95 $31,750 $2,470 49,406 1.3 Maquinna Lighting Upgrade BIP SW10-SW16 1994/95 $13,500 $4,293 85,860 2.3 Trade Shop Lighting I BIP NE2 1995/96 $34,450 $4,935 98,700 2.6 Trade Shop Lighting II BIP NE4 1995/96 $16,700 $4,490 89,800 2.4 Trade Shop Lighting III BIP NE16 1995/96 $27,140 $6,120 122,400 3.3 SA Campus Center NBD SE2 - SA Campus Center 1995/96 $100,000 $6,115 122,300 3.3 New Downtown Campus NBD 555 Seymour, Vancouver 1996/97 N/A $11,445 228,900 6.1
Total
$115,118 2,302,366 (kWh) 61.6
BIP - Building Improvement Program NBD - New Building Design
Project/ Action
Power smart
program
Details of Project
Date
Completed
Project Team
(ESCO, in-house)
Capital
Invested
Cost
Savings
Energy
Consumption Savings (kWh)**
CO2
Savings (tonnes)
Cost
Avoidance, benefits, offsets
BCIT Energy Management Action Plan
Page 27
N/A - Costs for measures imbedded in overall construction project. ** Estimated annual kWh savings, via BC Hydro Power Smart

BCIT Energy Management Action Plan
Page 28
4.2 Proposed Actions and Projects
Proposed Action/ Project
Expected Start and End Dates
Project Team
(ESCO, in-house)
Potential Capital
Cost
Potential
Annual Cost Savings
Potential
Consumption Savings
Simple
Payback (years)
Potential CO2
Savings (tonnes)
Burnaby Campus Lighting Retrofit 2001-05 In-house
$1,157,000 $144,000 3,044,000 (kWh)
700 (kW) 8.0 81
PC Controls 2001-05 TBA $98,000 $13,000 412,000 (kWh) 7.5 11 Vending Machines 2001-05 TBA $16,000 $2,000 72,000(kWh) 8.0 2 Education and Awareness 2001-05 TBA $35,000 $86,000 1,470,000(kWh)
4,100(GJ) 0.4 244
HVAC Modification, Controls and Scheduling 2001-05 TBA $788,000 $173,000 1,596,000(kWh) 12,400(GJ)
4.6 661
Central Plant Boiler Upgrade 2001-05 TBA $188,000 $47,000 4,700(GJ) 3.9 229 Decentralized Boiler Plant Upgrade 2001-05 TBA $171,000 $26,000 2,600(GJ) 6.6 135 Improved Control of Infrared Heaters 2001-05 TBA $133,000 $23,000 2,300(GJ) 5.8 115 Compressed Air Improvements 2001-05 TBA $60,000 $10,000 310,000(kWh) 6.0 8 Refrigeration/Cooling/HP/Pumps Improvements 2001-05 TBA $114,000 $19,000 620,000(kWh) 6.0 17 Implement Central Plant Summer Shutdown 2001-05 TBA $300,000 $40,000 4,000(GJ) 7.5 199 Implementation Costs (Engineering & Admin.) $500,000 Burnaby Campus Total $3,560,000 $583,000 700 (kW)
7,524,000 (kWh) 30,100 (GJ)
6.1 1,702
PMTC
Install DDC controls on the boiler, chiller and main air handling unit (#6)
2001-05 TBA $50,000 $10,000 86,988(kWh) 850(GJ)
5.0
Improve control and operation of the Multi-purpose and Seamanship rooms
2001-05 TBA $15,000 $1,500 13,084(kWh) 127(GJ)
10.0
Water Safety Tank – Install Air Handling Unit controls, install a pool cover
2001-05 TBA $35,000 $4,000 34,808(kWh) 340(GJ)
8.8

BCIT Energy Management Action Plan
Page 29
Proposed Action/ Project
Expected Start and End Dates
Project Team
(ESCO, in-house)
Potential Capital
Cost
Potential
Annual Cost Savings
Potential
Consumption Savings
Simple
Payback (years)
Potential CO2
Savings (tonnes)
PMTC Total
$100,000 $15,500 134,880 (kWh) 1,318 (GJ)
6.5 69
ATC
Lighting Upgrade Hanger SIO2 2001-05 TBA Hot Water Heating Line Insulation 2001-05 TBA Improved HVAC Controls 2001-05 TBA Occupancy Control of Lighting 2001-05 TBA Upgrade Cooling system in Admin Bldg. SIO3 (efficiency improvement and control)
2001-05 TBA
ATC Total $260,000 $35,750 262,264 (kWh) 2,124 (GJ)
7.3 113
DTC
Education and Awareness 2001-05 TBA $2,000 $5,140 69,850(kWh) 74 (GJ)
0.4 6
Total Institute $3,922,000 $640,000 7,991,000 (kWh)
700 (kW) 33,616 (GJ)
6.1 1,890

BCIT Energy Management Action Plan
Page 30
4.3 Training, Communication and Awareness Programs
The following is a description of staff training on energy management, climate change, or environmental protection:
At BCIT, we are continually upgrading the technical knowledge of our staff on energy management issues. Our staff will be encouraged to attend other workshops through NRCan and other organizations. BCIT also will implement a process where staff will receive ongoing feedback on progress with energy management and savings.
The following is a description of the Institute’s response to climate change or greenhouse emissions issues:
BCIT has committed to improve energy performance and greenhouse gas reduction by registering with NRCan as an Energy Innovator.
The following is a description of the planned staff and student communication and awareness program:
Creating an Energy Management team. Use of lighting occupancy sensors. Stickers on light switches reminding to turn OFF. Stickers on light switches informing that the lighting is controlled by occupancy sensor. Web site section and Institute newsletter section with energy savings tips. BCIT is planning to increase the staff and student exposure to the regional environmental initiatives through various means such as internal newsletters, its web page and various meetings.

BCIT Energy Management Action Plan
Page 31
SSeeccttiioonn 55
RREEPPOORRTTIINNGG aanndd EEvvaalluuaattiioonn

BCIT Energy Management Action Plan
Page 32

BCIT Energy Management Action Plan
Page 33
Section 5 – Reporting and Evaluation As part of BCIT’s commitment to energy management and to its membership to the Energy Innovators Initiative, the Institute will submit a progress report annually to the Office of Energy Efficiency (OEE), Natural Resources Canada (NRCan) and to the Canada’s Climate Change Voluntary Challenge and Registry (VCR Inc.). The report will include at minimum:
?? Updated Institute Profile ?? Updated Energy Management Policy ?? Updated Energy Use and Costs ?? Energy Management Projects Completed, Undergoing, and Proposed
In addition, BCIT will assist the Association of Canadian Community Colleges (ACCC) and Office of Energy Efficiency (OEE) meet their objectives by committing to the contents of the Institute’s energy management action plan and by providing the above information.
5.1 Reporting, Verifying and Updating the Action Plan and Targets
As part of the reporting, BCIT will review and verify the targets, including total CO2 produced. If discrepancies arise, modifications to the data will be made and initiatives will be recommended to resolve the issues. The review team will include the personnel listed in Section 2.4.

BCIT Energy Management Action Plan
Page 34
SSeeccttiioonn 66
AAppppeennddiixx

BCIT Energy Management Action Plan
Page 35
Methodology for Calculations and Sample Calculations Calculations The followings are some sample calculations used to determine the baseline and forecasted costs, consumption, and CO2 emissions: Consumption Conversion Calculations: Total consumption for electricity was in kWh. It was converted to equivalent GJ by multiplying it by 0.0036 . Cost & Consumption Calculations for forecasted years: The following formulae was used to calculate cost and consumption for forecasted years: (Current year cost or consumption) x [1-difference between forecasted and current year x (total potential saving factor/ years to implement cost and consumption reduction)]=(forecasted year cost or consumption) Example: An organization’s electric bill for year 1999 is $100,000. The organization has a plan to implement cost saving management equally over the next 5 years. The potential for this saving is 15% for the whole period. Calculate the electric bill for year 2001 and 2003. ($100,000) x [1-2 x (0.15/ 5)]= $94,000 (for 2 years after current year)(2001) and ($100,000) x [1-4 x (0.15/ 5)]= $88,000 (for 4 years after current year)(2003) Direct CO2 Emissions - Greenhouse Gas Emissions from Gas The required conversion factors can be found at the NRCan CO2 Spreadsheet, which was used to calculate CO2 emissions. The numbers for natural gas are 49.68 (tonnes CO2/TJ), 0.52 (kg N2O/TJ) and 1.1 (kg CH4/TJ). Also required is the Global Warming Potential (GWP) index for N2O and CH4 , which is 310 and 21 respectively. Indirect CO2 Emissions - Greenhouse Gas Emissions from Electricity The same procedure as above is used for electricity with the following numbers (from the same source): 7.4 (tonnes CO2/TJ); 0.1032 (kg N2O/TJ); and 0.0273 (kg CH4/TJ)