brisk heart rate and eeg changes during execution and ... · brisk heart rate and eeg changes...
TRANSCRIPT

ORIGINAL RESEARCH ARTICLEpublished: 30 July 2013
doi: 10.3389/fnhum.2013.00379
Brisk heart rate and EEG changes during execution andwithholding of cue-paced foot motor imageryGert Pfurtscheller1*, Teodoro Solis-Escalante1, Robert J. Barry2, Daniela S. Klobassa1,Christa Neuper1,3 and Gernot R. Müller-Putz1
1 Faculty of Computer Sciences, Laboratory of Brain-Computer Interfaced, Institute for Knowledge Discovery, Graz University of Technology, Graz, Austria2 Faculty of Social Sciences, School of Psychology, Brain & Behavior Research Institute, University of Wollongong, Wollongong, Australia3 Department of Psychology, Neuropsychology, University of Graz Austria, Graz, Austria
Edited by:
Elisabeth V. C. Friedrich, Universityof Graz, Austria
Reviewed by:
Pierre Megevand, Hofstra NorthShore-LIJ School of Medicine, USAJaime A. Pineda, University ofCalifornia, San Diego, USA
*Correspondence:
Gert Pfurtscheller, Faculty ofComputer Sciences, Laboratory ofBrain-Computer Interfaces, Institutefor Knowledge Discovery, GrazUniversity of Technology,Inffeldgasse 13/IV, 8010 Graz, Austriae-mail: [email protected]
Cue-paced motor imagery (MI) is a frequently used mental strategy to realize aBrain-Computer Interface (BCI). Recently it has been reported that two MI tasks canbe separated with a high accuracy within the first second after cue presentation onset.To investigate this phenomenon in detail we studied the dynamics of motor cortex betaoscillations in EEG and the changes in heart rate (HR) during visual cue-paced foot MIusing a go (execution of imagery) vs. nogo (withholding of imagery) paradigm in 16 healthysubjects. Both execution and withholding of MI resulted in a brisk centrally localized betaevent-related desynchronization (ERD) with a maximum at ∼400 ms and a concomitantHR deceleration. We found that response patterns within the first second after stimulationdiffered between conditions. The ERD was significantly larger in go as compared to nogo.In contrast the HR deceleration was somewhat smaller and followed by an acceleration ingo as compared to nogo. These findings suggest that the early beta ERD reflects visuallyinduced preparatory activity in motor cortex networks. Both the early beta ERD and theHR deceleration are the result of automatic operating processes that are likely part ofthe orienting reflex (OR). Of interest, however, is that the preparatory cortical activityis strengthened and the HR modulated already within the first second after stimulationduring the execution of MI. The subtraction of the HR time course of the nogo from thego condition revealed a slight HR acceleration in the first seconds most likely due to theincreased mental effort associated with the imagery process.
Keywords: motor imagery, beta ERD, HR response, orienting reflex
INTRODUCTIONCue-paced motor imagery (MI) is one of the most frequently usedmental strategies in brain-computer interface (BCI) applications(Pfurtscheller and Neuper, 2001; Wolpaw et al., 2002; Faller et al.,2012) for severely handicapped patients (Neuper et al., 2003;Müller-Putz and Pfurtscheller, 2008; Pichiorri et al., 2011) andrehabilitation after stroke (Birbaumer et al., 2008; Kaiser et al.,2012). The major benefit of such a strategy is that the subjecthas to pay no attention to any externally presented stimuli dur-ing self-paced operation at free will. A prerequisite for a goodperformance, however, is that the subject experience some cue-paced training sessions without or with feedback. Such trainingconsists of a cue stimulus presentation in slightly varying inter-vals of a few seconds (Pfurtscheller et al., 2008b; Fazli et al., 2012).The location, color or the form of cue indicates either the type ofMI (e.g., right vs. left hand) or whether MI has to be performedor withheld (Solis-Escalante et al., 2012). This procedure resultsin a number of cortical and subcortical processing steps startingwith the stimulus perception and decision making and endingwith the requested execution of the MI task, whereby the userfocuses attention to visually presented cue stimuli. Recently it hasbeen reported that visually cued imagination of left/right hand
revealed the highest classification accuracy ∼1 s after cue-onset(Fazli et al., 2012). A similar early classification peak during dis-crimination between visually cued hand and foot MI was reportedby Pfurtscheller et al. (2008b). Remarkable in these studies is notonly that the highest classification accuracy was found so earlyafter visual stimulation, but also that this early classification peakwas observed in nearly every subject. This stability of the early MIclassification within and between subjects is of interest and needsfurther investigation not only in the cerebral (EEG) but also inthe autonomic system (heart rate, HR), because both systems areclosely linked together. The first who emphasized the close inter-action between brain and heart was Claude Bernard (1867), wherehe especially pointed to the mutual interaction between the twomost important body organs (Darwin, 1872/1999; pp. 71–72).Recently, Thayer and Lane (2009) made an extensive review onthe cortical control of cardiac activity and about the pathways bywhich the prefrontal cortex might influence the control of HR.The prefrontal cortex plays a dominant role in the temporal orga-nization of action (Fuster et al., 2000; Haggard, 2005; Soon et al.,2008) whether physically executed or imagined.
Each externally presented stimulus results in a complex totalbody response, the orienting reflex (OR), first described by
Frontiers in Human Neuroscience www.frontiersin.org July 2013 | Volume 7 | Article 379 | 1
HUMAN NEUROSCIENCE

Pfurtscheller et al. ECG/EEG changes during motor imagery
Pavlov in 1910 (see Pavlov, 1927) and developed in termsof psychophysiological measures by Sokolov (1960). The ORis an organismic reflex resulting in a range of changes (fordetails see Barry, 2006) such as EEG alpha desynchronization,cephalic vasodilatation, short-lasting HR deceleration and vaso-constriction in the periphery. The basis of this short-lasting HRdeceleration over some seconds was identified in the brief pro-longation of the cardiac cycle following stimulation reportedby Lacey and Lacey (1978, 1980). Barry (1983) noted thatthe Laceys’ vagally-mediated “primary bradycardia” was thebeginning of the HR deceleration observed in the OR con-text, and suggested that this HR deceleration is an obligatoryresponse marking the initial detection of the stimulus onsettransient. Another response to external stimuli is the brisk, short-lasting (∼500 ms) beta event-related desynchronization (ERD;Pfurtscheller and Lopes da Silva, 1999) after action-coded visualstimuli - a frequently reported phenomenon (Doyle et al., 2005;Pfurtscheller et al., 2008b; Zhang et al., 2008; Tzagarakis et al.,2010; Wang et al., 2010; Solis-Escalante et al., 2012) related tomotor planning, response preparation, response inhibition, andresponse uncertainty.
The fact that only a minority of people are able to con-trol a BCI properly, without extensive training, depends notonly on factors like motivation, mental effort, and mood, butalso on automatic operating processes, such as the fast inter-action between brain and heart. The aim of this paper isfirst, to report in detail the brisk reaction of central betaoscillations originating in sensorimotor areas and the HRresponse after cue-paced movement imagination using a go-nogo paradigm (execution vs. withholding of motor imagery).While the MIgo task was clearly defined, the mental state dur-ing the MInogo trials is unknown. Participants were instructednot to move and to relax. Second, this paper aims to discusshow coupled phasic EEG desynchronization and HR decelera-tion can be interpreted, and provides an understanding of whythe classification accuracy in a MI-based BCI can be highestearly after the visual cue stimulus. Third, this paper under-lines the importance of common EEG and HR changes inBCI research.
MATERIALS AND METHODSSUBJECTS AND EXPERIMENTAL PARADIGMThe data of 16 healthy subjects (8 males and 8 females, age23.6 ± 3.5 years) were recorded. Initially 20 subjects participatedin this study; the data from four subjects were discarded becauseof EEG artifacts and recorded muscle contractions in the EMGduring MI. All subjects were seated in a comfortable armchair onemeter in front of a computer screen. The computer screen showedcues (duration 2 s) for a go (green circle) and nogo experiment(red circle). The interval between the cues was varied between 11and 14 s.
The experimental paradigm consisted of two runs with cue-paced motor execution (ME) and three runs with cue-paced MI.The data were recorded in two blocks. In the first block, all par-ticipants completed two runs of motor execution. Then, after apause of about 10 min, all participants completed three runs ofMI. For the second block, the participants were instructed to
perform kinesthetic MI, i.e., to imagine the sensation of movingtheir legs in response to the cue. Since none of the partici-pants had previous experience with MI, the first experimentalblock was included to let the participants pay attention to thekinesthetic aspect of the task. Each run consisted of 40 tri-als with a go/nogo class probability of 50%. The participants’task was to execute or imagine a brisk movement (dorsiflex-ion) of both feet following a green circle (MEgo, MIgo), orto withhold the motor task (MEnogo, MInogo) if a red circleappeared.
The order of the blocks did not affect the “baseline” activ-ity of the sensorimotor cortex, meaning that motor executiondid not pre-activate the cortex, affecting the estimation of rela-tive changes (ERD/ERS). Evidence against a possible effect of theblock order comes from an analysis described in Solis-Escalanteet al. (2012), in which the baseline activity preceding nogo trials inthe conditions ME vs. MI was compared. No statistically signifi-cant differences were found. For further details, e.g., the frequencybands under analysis, see Solis-Escalante et al. (2012).
In this work only data from the MI sessions are reported. Theprotocol was approved by the Ethics committee of the MedicalUniversity of Graz and the subjects gave informed written consentbefore the experiments.
SIGNAL RECORDINGThe EEG was recorded with fifteen Ag-AgCl electrodes, arrangedin three Laplacian derivations around electrode positions C3, Cz,and C4; overlaying the left hand, foot, and right hand sensori-motor cortex. Inter-electrode distance was 2.5 cm. Reference andground electrodes were attached to the left and right mastoid,respectively. In addition to the EEG, the EMG was recorded fromthe tibialis anterior muscles in both legs using bipolar deriva-tions. The ground electrode for EMG was attached to the righthip. The EMG was pre-processed before recording. Raw EMGsignals were band-pass filtered between 1–1000 Hz, baseline-corrected, full-wave rectified, and integrated with a time constantof 100 ms. EEG and the integrated EMG were recorded witha biosignal amplifier (g.BSamp, Guger Technologies, Austria).Sampling rate was 250 Hz, with filters set between 0.5 and100 Hz, and a notch filter (50 Hz), for both EEG and integratedEMG. The electrocardiogram (ECG) was recorded from a sin-gle bipolar derivation. The negative lead was attached to thechest at the left (mid) clavicular line and the 2nd intercostalspace, and the positive lead was attached to the chest at theleft midaxilar line and the 6th intercostal space. The groundelectrode was placed on the right hip. Self-adhesive Ag-AgCl elec-trodes were used for these recordings. ECG was recorded witha band-pass filter between 2 and 100 Hz and also sampled at250 Hz.
EEG PROCESSINGThe monopolar EEG data recorded with respect to the left mas-toid were transformed with a Laplacian filter to improve the SNRof the signal. The inter-trial variance method (Pfurtscheller andLopes da Silva, 1999) was used for quantification of the event-related (de)synchronization (ERD/ERS). Time-frequency repre-sentations were calculated to visualize the ERD/ERS patterns;
Frontiers in Human Neuroscience www.frontiersin.org July 2013 | Volume 7 | Article 379 | 2

Pfurtscheller et al. ECG/EEG changes during motor imagery
only significant ERD/ERS values are displayed (Graimann et al.,2002). ERD/ERS quantification and visualization was managed bythe BioSig toolbox (Schlögl and Brunner, 2008; available onlinehttp://biosig.sourceforge.net/).
The data were analyzed between 8 and 45 Hz in intervals of2 Hz. Trials were filtered with a 5th order Butterworth filter, andthe ensemble average was subtracted from individual trials. Thisoperation reduces the contribution of phase-locked responses tothe ERD/ERS quantification (Kalcher and Pfurtscheller, 1995).The trials were squared and averaged. A moving average win-dow of 250 ms smoothed the ERD/ERS estimation. Significanceintervals (p = 0.05) were computed with a Box-Cox transforma-tion (Box and Cox, 1964). The reference interval for the relativepower changes was 2–4 s prior to cue-onset. For the determi-nation of the most reactive subject-specific beta bands we usedthe ERD/ERS maps computed from the motor execution task(MEgo) and the discriminability (Cohen’s kappa) calculation(Cohen, 1960) between the beta rebound and the reference inter-val. The beta rebound is much larger during physical executionof movement compared to imagination of the same movement(Solis-Escalante et al., 2012). Hence, to obtain a reliable estima-tion of the beta band, we used the MEgo trials instead of the MIgotrials. User-specific bands were defined according to the strongestERS response following the movement execution in MEgo trials.Details on selection of a user-specific band are given elsewhere(Solis-Escalante et al., 2012).
CALCULATION OF THE HEART RATE (HR) CHANGESThe first step in ECG processing is to detect the QRS complexesin the ECG signal. The interval between consecutive QRS-complexes marks the time from one heart contraction to the next(RR interval; RRI). The QRS-complex was detected automaticallybased on an algorithm using a filter bank to decompose the ECGsignal into various sub-bands (Afonso et al., 1999; implementedin the Biosig toolbox). After detecting every QRS-complex, theRRI is estimated from every pair of successive complexes. TheHR value during an RRI equals the inverse of the RRI concerned,and (in beats per minute) is linearly interpolated between twocomplexes; the resultant time series is averaged across trials fromthe same class. To obtain HR changes the individual HR signalswere synchronously averaged relative to cue-onset (Pfurtschelleret al., 2007).
ARTIFACT REJECTIONTrials were rejected if the EMG from the left or right leg exceededa threshold. For MInogo trials, this threshold was equal to themean plus three times the standard deviation of the EMG at rest.For MIgo trials, the threshold was equal to the mean plus fivetimes the standard deviation of the EMG at rest, since imaginedmovements can increase the tonus of the target muscles (Guillotet al., 2007). The “EMG at rest” period was defined as a 5 s intervalbefore cue onset.
After computing the HR, additional trials were rejected byidentification of extreme HR changes, i.e., outliers. The firstderivative of the HR from each trial was computed, and the abso-lute value was analyzed using descriptive statistics. Trials wererejected in an iterative fashion: (i) compute the first and third
quartile and the interquartile distance from all trials available(class-wise, e.g., separately for MIgo and MInogo); (ii) reject trialsif any value of the HR’s first derivative was: (1) less than the firstquartile minus 1.5 times the interquartile distance, or (2) greaterthan the third quartile plus 1.5 times the interquartile distance;(iii) repeat until all outliers have been removed.
STATISTICAL ANALYSISThe statistical significance of EEG band power changes (ERD,ERS) and HR changes was evaluated with a t-percentile bootstrapalgorithm, using the implementation of the BioSig toolbox. Upperand lower confidence intervals were obtained from 500 resamplerepetitions, at confidence levels of 0.05 and 0.01.
Statistical analysis comprised a paired t-test for evaluating dif-ferences in beta ERD and HR between MIgo and MInogo anda Pearson’s product moment correlation for evaluating possiblerelations between beta ERD and HR deceleration. Comparisonsbetween MIgo and MInogo were analyzed for significant differ-ences with a t-percentile bootstrap algorithm (as described above)for every sample in the time series.
RESULTSEEG TIME-FREQUENCY MAPS DURING go AND nogo CONDITIONSTo obtain an overview of the dynamics of sensorimotor rhythmsin the go (MI) and nogo condition (withholding of MI), time-frequency maps were calculated separately for each condition.Examples from three characteristic subjects (A–C) are shown inFigure 1. The maps in Figures 1A,B (left panels) display the clas-sical response in the beta band during imagined dorsiflexions ofboth feet (MIgo) namely a long-lasting (∼1–2 s), midcentrallylocalized, peri-imagery ERD during execution of the imagery pro-cess and a post-imagery ERS (beta rebound) after terminationof this process. But subjects can also show an early beta ERDwithout following beta ERS during MIgo (example see Figure 1C,left panel), similar to the early ERD in the nogo condition(Figures 1A–C, right panels). Because of the variable duration ofeach imagery task and the alignment of the averaging process tocue-onset and not to the exact end of MI, the beta ERS (betapower increase) in the go condition is relatively long-lasting. Inthe nogo condition (Figure 1 right panels) the early beta ERDstarts immediately after cue-onset, has a duration of ∼500 ms andis terminated by a brisk beta ERS with a maximum ∼1 s aftercue-onset (panels A–C).
The subject-specific beta band (mean ± SD) determinedfrom the time-frequency maps and used for further analyseswas between 18.8 ± 4.7 and 28.4 ± 4.8 Hz. The magnitudes andlatencies of beta power minima (largest ERD magnitude) andHR minima measured within the first second after stimulationonset are summarized in Table 1 for both the go and nogoconditions.
The beta ERD was significantly (paired t-test) larger (39.82vs. 32.00%; t = 5.37, p < 0.001) during MIgo compared toMInogo, but its peak latency was not significantly longer (471 vs.397 ms; t = 1.05, ns). In contrast, HR deceleration was somewhatsmaller in MIgo vs. MInogo (1.00 vs. 1.94 %, t = 2.03, p = 0.06);again, peak latencies (640 vs. 652 ms) did not differ significantly(t = 0.18, ns).
Frontiers in Human Neuroscience www.frontiersin.org July 2013 | Volume 7 | Article 379 | 3

Pfurtscheller et al. ECG/EEG changes during motor imagery
FIGURE 1 | Time-frequency maps for MIgo and MInogo from three
characteristic subjects (A–C) illustrating different reactivity patterns
during execution and withholding of MI. Common for all threesubjects is only the early beta ERD during MInogo (marked by stippledcircles). Significant ERD values are displayed in “red” and significant ERS
values in “blue.” The vertical line at second 5 indicates cue-onset. (A)
Early beta ERD and beta ERS during MIgo and MInogo. (B) Early betaERD and beta ERS during MIgo, and early ERD and weak beta ERSduring MInogo. (C) Early beta ERD during MIgo and early beta ERD withbeta ERS during MInogo.
Table 1 | Mean ± SD (16 subjects) for latency (ms) and magnitude (%) of early beta power minimum (beta ERD) and change of HR for go and
no conditions.
ERD HR
Latency (ms) Amplitude (%) Latency (ms) Amplitude (%)
Mean SD Mean SD Mean SD Mean SD
MI go 471 211 −39.82* 20.56 640 224 −1.00 1.84MI nogo 397 139 −32.00* 23.78 652 276 −1.94* 1.28
*indicate statistical significance (p < 0.01, see Figure 2).
CHANGES OF BETA POWER AND HR DURING EXECUTION (go) ANDWITHHOLDING (nogo) OF MOTOR IMAGERYGrand averages of changes in percentage HR (upper panels) andEEG beta power (lower panels) for both conditions are displayedin Figure 2. Reference interval is 2–4 s before cue presentation.Beside the mean ± SE also significant changes (bootstrap p =0.01) are indicated. Excepting the HR changes in the go con-dition, all other HR and EEG changes (HR deceleration andEEG beta desynchronization) were significant in the first sec-ond after cue presentation in go and nogo conditions (p < 0.01).While in the go condition the HR showed a significant (p < 0.01)acceleration after the brisk deceleration, no further significantHR changes were observed after the deceleration in the nogocondition.
For a direct comparison of the beta power decrease duringmotor planning in the go/nogo conditions after visual cue pre-sentation with a similar 248-channel MEG study (Tzagarakiset al., 2010) the reference interval was changed to 0–1 s priorto cue onset [the standard reference interval for the processingof all EEG and HR data (Figure 2) was 2–4 s prior to cue onsetin accordance with the work of Solis-Escalante et al. (2012)].
Common for both studies (Figures 3A,B) is the early beta powerdecrease from cue onset (Tzagarakis et al., 2010 reported a delayof 120 ms) not dependent on the type of information provided bythe visual stimulus but rather determined by a constant visuo-motor delay. The different behavior of the beta ERD betweenexecution and withholding of MI starts between 200 and 300 msafter cue onset, indicating on the one hand that the cue stimulus-induced early beta ERD peaks at ∼400 ms, and on the other handthat the cognitive task (execution of MI) is able to modulate thisdesychronization.
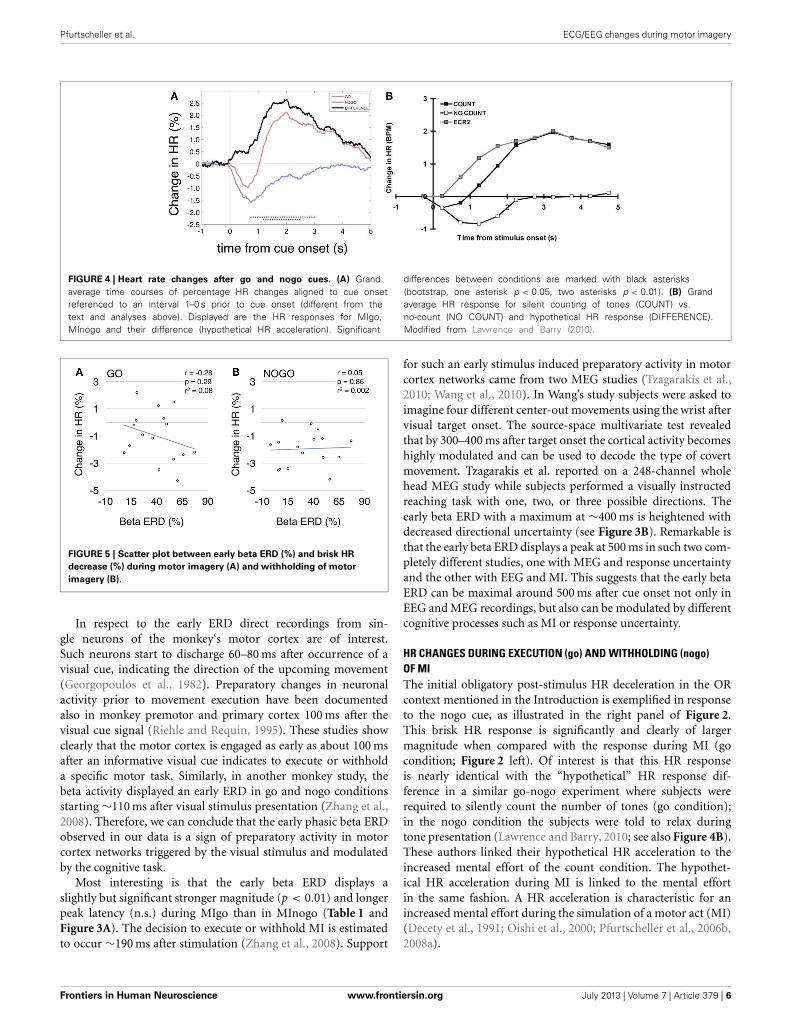
When searching for possible interpretations of the HRresponses in the go and nogo condition we subtracted the nogoHR response from the go response (MIgo minus MInogo) andachieved a new response pattern termed “hypothetical” HRresponse (Figure 4A) with a HR acceleration starting immedi-ately at cue onset and a maximum at ∼2 s latter. Remarkable is thesimilarity between the “hypothetical” HR response in Figure 4Aand the HR responses in a similar no/go study without anymotor preparation displayed in Figure 4B (Lawrence and Barry,2010). The brisk HR deceleration is the dominant feature in bothstudies.
Frontiers in Human Neuroscience www.frontiersin.org July 2013 | Volume 7 | Article 379 | 4

Pfurtscheller et al. ECG/EEG changes during motor imagery
INTERDEPENDENCY BETWEEN EARLY ERD AND BRISK HRDECELERATIONWhen testing linear inter-subject correlations between betaERD and HR deceleration within the first second after cue-onset, no significant correlation was found for MInogo (Pearsoncorrelation coefficient r = 0.05, p = 0.86; see Figure 5B); thecorrelation for MIgo was in the expected direction (greaterdeceleration with greater ERD) but failed to reach significance(r = − 0.28, p = 0.29; see Figure 5A).
FIGURE 2 | Grand averages of percentage HR and beta power
(ERD/ERS) changes for execution (MIgo) and withholding (MInogo) of
foot motor imagery. In addition to the mean and the standard error(stippled lines) also the significant changes (bootstrap) are displayed (oneasterisk vertically p < 0.05, and two asterisks vertically p < 0.01). Data of16 subjects. Note the significant HR decrease in the nogo condition and thesignificant early beta ERD in both the go and nogo conditions.
DISCUSSIONThe following findings need special attention: (i) the slightlydifferent reactivity patterns in the EEG during go and nogo con-ditions within the first second in the form of an early beta ERD,(ii) the different magnitudes of brisk HR decelerations in bothconditions and (iii) that no significant correlation was foundbetween early ERD and HR deceleration.
EEG CHANGES DURING EXECUTION (go) AND WITHHOLDING (nogo)OF MIIn the EEG rhythms, various phenomena have to be differenti-ated during execution and withholding of MI. First the early betaERD with a peak ∼400 ms after cue-onset observed in both con-ditions, second the longer-lasting beta ERD associated with theconscious intention of MI (peri-imagery ERD) in the go condi-tion, and third the beta rebound (post-imagery ERS) terminatingthe beta ERD. In the go condition the peri-imagery ERD becomeseither superimposed on the early beta ERD within the first second(see Figures 1A,B) or the early beta ERD remains in the go con-dition (Figure 1C). Whether the absence of a longer-lasting betaERD acts as indicator for a not correctly performed imagery taskcan only be speculated. The ERD represents a process to enablefocal attention so that information processing may be optimized(Lopes da Silva, 1991) or, in other words, the ERD indicates a stateof cortical activation (Gerloff et al., 1998; Pfurtscheller and Lopesda Silva, 1999; Leocani et al., 2001; Doyle et al., 2005). The betaERS corresponds to a state of deactivation of the motor cortex cir-cuitry and signifies active immobilization (Salmelin et al., 1995).In the nogo condition the beta ERD begins to recover 400 ms aftercue onset and reaches its peak ERS at 1000 ms (see Figure 2 rightlower panel and Figures 1A,C). Support for an activation of thefoot representation area during MIgo came from fMRI studies.Physical execution but also mental simulation of foot/toe move-ment is not only accompanied by peri-imagery and mid-centrallylocalized beta ERD (Pfurtscheller et al., 2006a) but also by a pos-itive fMRI BOLD signal localized to the foot representation area(Ehrsson et al., 2003).
FIGURE 3 | (A) Details of the grand average beta power time courses(ERD/ERS) of 16 subjects within the first second after cue onset for MIgo(dashed line) and MInogo (continuous line). Beta power was comparedbetween MI go and MInogo (bootstrap, one asterisk p < 0.05, two asterisksp < 0.01) and revealed significant differences starting at 250 ms after cue
onset. (B) Time courses of relative beta power changes after a visuallyinstructed reaching task with one, two, or three possible target directions(with permission modified from Tzagarakis et al., 2010). Note the similar earlybeta ERD with a maximal magnitude at ∼400 ms in EEG (A) and MEG (B)
recordings during different motor tasks.
Frontiers in Human Neuroscience www.frontiersin.org July 2013 | Volume 7 | Article 379 | 5
Pfurtscheller et al. ECG/EEG changes during motor imagery
FIGURE 4 | Heart rate changes after go and nogo cues. (A) Grandaverage time courses of percentage HR changes aligned to cue onsetreferenced to an interval 1–0 s prior to cue onset (different from thetext and analyses above). Displayed are the HR responses for MIgo,MInogo and their difference (hypothetical HR acceleration). Significant
differences between conditions are marked with black asterisks(bootstrap, one asterisk p < 0.05, two asterisks p < 0.01). (B) Grandaverage HR response for silent counting of tones (COUNT) vs.no-count (NO COUNT) and hypothetical HR response (DIFFERENCE).Modified from Lawrence and Barry (2010).
FIGURE 5 | Scatter plot between early beta ERD (%) and brisk HR
decrease (%) during motor imagery (A) and withholding of motor
imagery (B).
In respect to the early ERD direct recordings from sin-gle neurons of the monkey‘s motor cortex are of interest.Such neurons start to discharge 60–80 ms after occurrence of avisual cue, indicating the direction of the upcoming movement(Georgopoulos et al., 1982). Preparatory changes in neuronalactivity prior to movement execution have been documentedalso in monkey premotor and primary cortex 100 ms after thevisual cue signal (Riehle and Requin, 1995). These studies showclearly that the motor cortex is engaged as early as about 100 msafter an informative visual cue indicates to execute or withholda specific motor task. Similarly, in another monkey study, thebeta activity displayed an early ERD in go and nogo conditionsstarting ∼110 ms after visual stimulus presentation (Zhang et al.,2008). Therefore, we can conclude that the early phasic beta ERDobserved in our data is a sign of preparatory activity in motorcortex networks triggered by the visual stimulus and modulatedby the cognitive task.
Most interesting is that the early beta ERD displays aslightly but significant stronger magnitude (p < 0.01) and longerpeak latency (n.s.) during MIgo than in MInogo (Table 1 andFigure 3A). The decision to execute or withhold MI is estimatedto occur ∼190 ms after stimulation (Zhang et al., 2008). Support
for such an early stimulus induced preparatory activity in motorcortex networks came from two MEG studies (Tzagarakis et al.,2010; Wang et al., 2010). In Wang’s study subjects were asked toimagine four different center-out movements using the wrist aftervisual target onset. The source-space multivariate test revealedthat by 300–400 ms after target onset the cortical activity becomeshighly modulated and can be used to decode the type of covertmovement. Tzagarakis et al. reported on a 248-channel wholehead MEG study while subjects performed a visually instructedreaching task with one, two, or three possible directions. Theearly beta ERD with a maximum at ∼400 ms is heightened withdecreased directional uncertainty (see Figure 3B). Remarkable isthat the early beta ERD displays a peak at 500 ms in such two com-pletely different studies, one with MEG and response uncertaintyand the other with EEG and MI. This suggests that the early betaERD can be maximal around 500 ms after cue onset not only inEEG and MEG recordings, but also can be modulated by differentcognitive processes such as MI or response uncertainty.
HR CHANGES DURING EXECUTION (go) AND WITHHOLDING (nogo)OF MIThe initial obligatory post-stimulus HR deceleration in the ORcontext mentioned in the Introduction is exemplified in responseto the nogo cue, as illustrated in the right panel of Figure 2.This brisk HR response is significantly and clearly of largermagnitude when compared with the response during MI (gocondition; Figure 2 left). Of interest is that this HR responseis nearly identical with the “hypothetical” HR response dif-ference in a similar go-nogo experiment where subjects wererequired to silently count the number of tones (go condition);in the nogo condition the subjects were told to relax duringtone presentation (Lawrence and Barry, 2010; see also Figure 4B).These authors linked their hypothetical HR acceleration to theincreased mental effort of the count condition. The hypothet-ical HR acceleration during MI is linked to the mental effortin the same fashion. A HR acceleration is characteristic for anincreased mental effort during the simulation of a motor act (MI)(Decety et al., 1991; Oishi et al., 2000; Pfurtscheller et al., 2006b,2008a).
Frontiers in Human Neuroscience www.frontiersin.org July 2013 | Volume 7 | Article 379 | 6

Pfurtscheller et al. ECG/EEG changes during motor imagery
COUPLING BETWEEN EARLY BETA ERD AND BRISK HR DECELERATIONThe beta ERD and concomitant HR deceleration after stimulationis not an isolated phenomenon but is also found during prepa-ration for movement or even in the resting brain. The pre-movement beta ERD and the pre-movement HR decelerationare well documented phenomena (Damen and Brunia, 1987;Papakostopoulos et al., 1990; Florian et al., 1998; Pfurtschellerand Lopes da Silva, 1999). A slow cyclic (in intervals of ∼10 s)central beta (alpha) power decrease and a nearly simultaneous HRdecrease (beat-to-beat increase) in the resting state was reportedrecently (Pfurtscheller et al., 2012a,b). If the desynchronization ofsensorimotor rhythms prior to movement can be interpreted asa correlate of preparatory activity then also the early beta ERDafter cue presentation can be seen as stimulus triggered prepara-tory activity in the sensorimotor system. This preparatory activity,and also the HR deceleration, very likely result from routine pro-cesses operating automatically and unconsciously (Koch, 2003;Haggard, 2005). The EEG-HR coupling prior to voluntary move-ment, during rest and after visual stimulation can be seen as anexample of the fast interaction between brain and heart mediatedby pathways most likely from the prefrontal cortex to cardiovas-cular nuclei in the brain stem and vagally via the sino-atrial (SA)node to the heart (Thayer and Lane, 2009). The SA node respondsvery quickly to vagal (∼150 ms latency) in contrast to sympathetic(∼1–2 s) influences (Smyth et al., 1969).
Visual information is not only mediated by the lateral genic-ulate body, but also by the superior colliculus. The superiorcolliculus is important for the control of saccadic eye movements(Krauzlis et al., 2004), and is believed to be responsible for a tran-sient increase in blood pressure and HR by drive of sympatheticactivity (Iigaya et al., 2012) Electrical stimulation of the optictract also increases blood pressure and HR, and inhibits barore-flex vagal bradycardia, mediated by the superior colliculus (Chenget al., 2001). The participation of the superior colliculus in reflex-ive vagal mediated primary bradycardia (Lacey and Lacey, 1980;Barry, 1986) is therefore very unlikely.
That no significant correlation was found between earlybeta ERD and HR deceleration during MIgo (see Figure 5A)might be explained by different reasons. While the MIgo car-diac response can be conceptualized as an additional cardiacacceleration reflecting mental effort, superimposed on the reflexbradycardia triggered by the cue (see Figure 4A), a comparativeexamination of the corresponding beta power response profilesgives a more complex picture (see Figure 3A). Here the reflex-ive early beta ERD (peaking at ∼400 ms) is superimposed on theperi-imagery beta ERD induced by the conscious mental simu-lation of foot movement. Although the early beta ERD with thefollowing beta ERS in the nogo condition is an automaticallyinduced response, only the early beta ERD can be consideredas a component of the OR. The relationship between these dif-ferences in the EEG and HR response profiles during MIgo iscomplex and needs further exploration, possibly going beyondthe linear correlation of responses in the short interval testedhere. Another reason for the non-significant correlation could bethat in all subjects the EEG was recorded at the vertex only (Cz:Laplacian derivation) although it is known from multichannelMEG recordings that the source of the beta band ERD can vary in
the peri-Rolandic region across subjects (Tzagarakis et al., 2010).Beside the EEG also the ECG can induce some variability. TheHR displays two preferential rhythms, one around 0.25 Hz (respi-ration) and one around 0.1 Hz (blood pressure or Mayer waves)(De Boer et al., 1985) as well as fluctuations induced by “cen-tral commands” (see review Benarroch, 1993; Thayer and Lane,2009). Slow intrinsic HR fluctuations during rest can be as highas ∼10 % of the mean HR (Pfurtscheller et al., 2012a) and maskthe relatively small (∼2%) brisk HR deceleration induced afterstimulation.
CONCLUSIONThe early beta ERD with the largest magnitude at ∼400 msis slightly, but significantly (p < 0.01) larger during execution(go) as compared to withholding of MI (nogo). At the sametime the HR displays a significant (p < 0.01) brisk decelera-tion only during withholding of MI. Both the early beta ERDand the HR deceleration are the result of an automatic oper-ating process and probably part of the OR (Barry, 2006). Ofinterest, however, is that both automatic reactions in brain andheart can be modulated by the increased mental effort associ-ated with execution of MI. The calculation of the “hypothetical”HR acceleration introduced by Barry (1984) offers a new wayto explore the mental effort during motor imagery early afterstimulation. A high mental effort during imagined movementsis accompanied by a HR increase (Decety et al., 1991; Oishiet al., 2000). Such indicator of mental effort could be used in aBCI to improve its performance (Pfurtscheller et al., 2010). Foronline monitoring of the mental effort in a cue-paced MI task,the averaged HR response of the MInogo condition obtained ina pre-experiment has to be subtracted from each ongoing HRresponse (calculation of the “hypothetical” HR). By this way themental effort can be supervised and an intervention made ifnecessary.
The early beta ERD is an important brain feature that might beresponsible for the early classification peak in imagery-based BCIsbecause of its somatotopic organization as demonstrated recently(Pfurtscheller et al., 2008b). The close relationship between earlyERD and action-coded visual stimulation also was discussed else-where (Waldert et al., 2008; Wang et al., 2010). If the visualstimulus indicates only one specific type of MI the attention isfocused on this specific imagery task and results in an early betaERD in both conditions (go/nogo). The results suggest that theearly classification peak in cue-paced BCIs is very likely the resultof an automatic operating process induced by the preparatoryvisual cue stimulus. This hypothesis, however, needs to be furthertested, possibly with an auditory cue stimulus.
The fast interaction between brain and heart is a basic fac-tor in BCI research. HR slowing and concomitant pericentralEEG desynchronization is not only characteristic for the plan-ning and/or preparation of a motor task (e.g., ME or MI), butalso a dominant feature immediately after visual cue presentation.Still open for research and discussion is the link between slow(∼0.1 Hz) spontaneous HR and EEG oscillations during awakerest (Pfurtscheller et al., 2012a,b). In this respect, the finding thatthe relation between early beta ERD and brisk HR decelerationis very likely the result of an automatic process, operating after
Frontiers in Human Neuroscience www.frontiersin.org July 2013 | Volume 7 | Article 379 | 7

Pfurtscheller et al. ECG/EEG changes during motor imagery
visual cue presentation, is a small step to improve the success ratein BCI research and focus research attention on the importanceof intrinsic HR and blood pressure oscillations at a frequency ofaround 0.1 Hz.
ACKNOWLEDGMENTSThis work was partly supported by the European Union researchproject BETTER (ICT-2009.7.2-247935) and Neuro Center Styria(NCS).
REFERENCESAfonso, V., Tompkins, W., Nguyen,
T., and Luo, S. (1999). ECG beatdetection using filter banks. IEEETrans. Biomed. Eng. 46, 192–202.doi: 10.1109/10.740882
Barry, R. J. (1983). Primary bradycardiaand the evoked cardiac response inthe OR context. Physiol. Psychol. 11,135–140.
Barry, R. J. (1984). The evoked cardiacresponse under processing load.Physiol. Psychol. 12, 35–40.
Barry, R. J. (1986). Heart rate decelera-tion to innocuous stimuli: an indexof the orienting response or stimu-lus registration? Physiol. Psychol. 14,42–48.
Barry, R. J. (2006). Promise versus real-ity in relation to the unitary ori-enting reflex: a case study exam-ining the role of theory in psy-chophysiology. Int. J. Psychophysiol.62, 353–366. doi: 10.1016/j.ijpsycho.2006.01.004
Benarroch, E. E. (1993). The centralautonomic network: functionalorganization, dysfunction, andperspective. Mayo Clin. Proc. 68,988–1001. doi: 10.1016/S0025-6196(12)62272-1
Birbaumer, N., Murguialday, A. R., andCohen, L. (2008). Brain-computerinterface in paralysis. Curr. Opin.Neurol. 21, 634–638. doi: 10.1097/WCO.0b013e328315ee2d
Box, G. E. P., and Cox, D. R. (1964). Ananalysis of transformations. J. Roy.Statist. Soc. B 26, 211–252
Cheng, Z. B., Kobayashi, M., andNosaka, S. (2001). Effects of optictract stimulation on baroreflexvagal bradycardia in rats. Clin. Exp.Pharmacol. Physiol. 28, 721–728.doi: 10.1046/j.1440-1681.2001.03509.x
Cohen, J. (1960). A coefficient ofagreement for nominal scales. Educ.Psychol. Meas. 20, 37–46
Damen, E., and Brunia, C. (1987).Changes in heart rate and slowbrain potentials related to motorpreparation and stimulus antici-pation in a time estimation task.Psychophysiology 24, 700–713.doi: 10.1111/j.1469-8986.1987.tb00353.x
Darwin, C. (1872/1999). The Expressionof the Emotions in Man and Animals.London: Harper Collins.
De Boer, R., Karemaker, J., andStrackee, J. (1985). Relationships
between short-term blood-pressurefluctuations and heart-ratevariability in resting subjects.II: A simple model. Med. Biol. Eng.Comput. 23, 359–364. doi: 10.1007/BF02441590
Decety, J., Jeannerod, M., Germain, M.,and Pastene, J. (1991). Vegetativeresponse during imagined move-ment is proportional to mentaleffort. Behav. Brain Res. 42, 1–5. doi:10.1016/S0166-4328(05)80033-6
Doyle, L. M., Yarrow, K., and Brown,P. (2005). Lateralization of event-related beta desynchronization inthe EEG during pre-cued reactiontime tasks. Clin. Neurophysiol. 116,1879–1888. doi: 10.1016/j.clinph.2005.03.017
Ehrsson, H. H., Geyer, S., and Naito, E.(2003). Imagery of voluntary move-ment of fingers, toes, and tongueactivates corresponding body-part-specific motor representations.J. Neurophysiol. 90, 3304–3316. doi:10.1152/jn.01113.2002
Faller, J., Vidaurre, C., Solis Escalante,T., Neuper, C., and Scherer, R.(2012). Autocalibration and recur-rent adaptation: towards a plugand play online ERD-BCI. IEEETrans. Neural Syst. Rehabil. Eng. 20,313–319. doi: 10.1109/TNSRE.2012.2189584
Fazli, S., Mehnert, J., Steinbrink, J.,Curio, G., Villringer, A., Müller,K. R., et al. (2012). Enhancedperformance by a hybrid NIRS-EEG brain computer interface.Neuroimage 59, 519–529. doi:10.1016/j.neuroimage.2011.07.084
Florian, G., Andrew, C., andPfurtscheller, G. (1998). Dochanges in coherence alwaysreflect changes in functional cou-pling. Electroencephalogr. Clin.Neurophysiol. 106, 87–91. doi:10.1016/S0013-4694(97)00105-3
Fuster, J. M., Bodner, M., and Kroger,J. K. (2000). Cross-modal and cross-temporal association in neurons offrontal cortex. Nature 405, 347–351.doi: 10.1038/35012613
Graimann, B., Huggins, J. E., Levine, S.P., and Pfurtscheller, G. (2002).Visualization of significantERD/ERS patterns in multi-channel EEG and ECoG data. Clin.Neurophysiol. 113, 43–47. doi:10.1016/S1388-2457(01)00697-6
Georgopoulos, A. P., Kalaska, J. F.,Caminiti, R., and Massey, J. T.
(1982). On the relations between thedirection of two-dimensional armmovements and cell discharge inprimate motor cortex. J. Neurosci. 2,1527–1537.
Gerloff, C., Uenishi, N., and Hallett, M.(1998). Cortical activation duringfast repetitive finger movements inhumans: dipole sources of steady-state movement-related corticalpotentials. J. Clin. Neurophysiol. 15,502–513. doi: 10.1097/00004691-199811000-00009
Guillot, A., Lebon, F., Rouffet, D.,Champely, S., Doyon, J., and Collet,C. (2007). Muscular responses dur-ing motor imagery as a functionof muscle contraction types. Int.J. Psychophysiol. 66, 18–27. doi:10.1016/j.ijpsycho.2007.05.009
Haggard, P. (2005). Conscious inten-tion and motor cognition. TrendsCogn. Sci. 9, 290–295. doi: 10.1016/j.tics.2005.04.012
Iigaya, K., Mueller-Ribeiro, F. C.,Horiuchi, J., McDowall, L. M.,Nalivaiko, E., Fontes, M. A., et al.(2012). Synchronized activation ofsympathetic vasomotor, cardiac,and respiratory outputs by neuronsin the midbrain colliculi. Am. J.Physiol. Regul. Integr. Comp. Physiol.303, 599–610. doi: 10.1152/ajpregu.00205.2012
Kaiser, V., Daly, I., Pichiorri, F., Mattia,D., Müller-Putz, G. R., and Neuper,C. (2012). Relationship betweenelectrical brain responses to motorimagery and motor impairment instroke. Stroke 43, 2735–2740. doi:10.1161/STROKEAHA.112.665489
Kalcher, J., and Pfurtscheller, G.(1995). Discrimination betweenphase-locked and non-phase-locked event-related EEGactivity. Electroencephalogr. Clin.Neurophysiol. 94, 381–384. doi:10.1016/0013-4694(95)00040-6
Koch, C. (2003). The Quest forConsciousness: a NeurobiologicalApproach. Greenwood Village, CO:Roberts and Co Publishers.
Krauzlis, R. J., Liston, D., and Carello,C. D. (2004). Target selectionand the superior colliculus: goals,choices and hypotheseses. VisionRes. 44, 1445–1451. doi: 10.1016/j.visres.2004.01.005
Lacey, B. C., and Lacey, J. I. (1978).Two-way communication betweenthe heart and the brain. Significanceof time within the cardiac cycle. Am.
Psychol. 33, 99–113. doi: 10.1037/0003-066X.33.2.99
Lacey, B. C., and Lacey, J. I. (1980).Cognitive modulation of time-dependent primary bradycardia.Psychophysiology 17, 209–222.doi: 10.1111/j.1469-8986.1980.tb00137.x
Lawrence, C. A., and Barry, R. J.(2010). Cognitive processing effectson auditory event-related potentialsand the evoked cardiac response.Int. J. Psychophysiol. 78, 100–106.doi: 10.1016/j.ijpsycho.2010.06.027
Leocani, L., Toro, C., Zhuang, P.,Gerloff, C., and Hallett, M. (2001).Event-related desynchronization inreaction time paradigms: a com-parison with event-related poten-tials and corticospinal excitability.Clin. Neurophysiol. 112, 923–930.doi: 10.1016/S1388-2457(01)00530-2
Lopes da Silva, F. (1991). Neuralmechanisms underlying brainwaves: from neural membranesto networks. Electroencephalogr.Clin. Neurophysiol. 79, 81–93. doi:10.1016/0013-4694(91)90044-5
Müller-Putz, G., and Pfurtscheller, G.(2008). Control of an electricalprosthesis with an SSVEP-basedBCI. IEEE Trans. Biomed. Eng. 55,361–364. doi: 10.1109/TBME.2007.897815
Neuper, C., Müller, G., Kübler, A.,Birbaumer, N., and Pfurtscheller, G.(2003). Clinical application of anEEG-based brain-computer inter-face, a case study in a patient withsevere motor impairment. Clin.Neurophysiol. 114, 399–409. doi:10.1016/S1388-2457(02)00387-5
Oishi, K., Kasai, T., and Maeshima,T. (2000). Autonomic responsespecificity during motor imagery.J. Physiol. Anthropol. Appl. Hum.Sci. 19, 255–261. doi: 10.2114/jpa.19.255
Papakostopoulos, D., Banerji, N., andPocock, P. (1990). Performance,EMG, brain electrical potentials andheart rate change during a self-paced skilled motor task in parkin-son’s disease. J. Psychophysiol. 4,163–183.
Pavlov, I. P. (1927). ConditionedReflexes. New York, NY: Dover.
Pfurtscheller, G., Allison, B. Z.,Brunner, C., Bauernfeind, G.,Solis-Escalante, T., Scherer, R., et al.(2010). The hybrid BCI. Front.
Frontiers in Human Neuroscience www.frontiersin.org July 2013 | Volume 7 | Article 379 | 8

Pfurtscheller et al. ECG/EEG changes during motor imagery
Neurosci. 4:30. doi: 10.3389/fnpro.2010.00003
Pfurtscheller, G., Bauernfeind, G.,Neuper, C., and Lopes da Silva, F. H.(2012a). Does conscious intentionto perform a motor act depend onslow prefrontal (de)oxyhemoglobinoscillations in the resting brain.Neurosci. Lett. 508, 89–94. doi:10.1016/j.neulet.2011.12.025
Pfurtscheller, G., Daly, I., Bauernfeind,G., and Müller-Putz, G. (2012b).Coupling between intrinsic pre-frontal HbO2 and central EEG betapower oscillations in the restingbrain. PLoS ONE 7:e43640. doi:10.1371/journal.pone.0043640
Pfurtscheller, G., Brunner, C., Schlögl,A., and Lopes da Silva, F. H. (2006a).Mu rhythm (de)synchronizationand EEG single-trial classificationof different motor imagery tasks.Neuroimage 31, 153–159. doi:10.1016/j.neuroimage.2005.12.003
Pfurtscheller, G., Leeb, R., and Slater,M. (2006b). Cardiac responsesinduced during thought-basedcontrol of a virtual environment.Int. J. Psychophysiol. 62, 134–140.doi: 10.1016/j.ijpsycho.2006.03.001
Pfurtscheller, G., Grabner, R. H.,Brunner, C., and Neuper, C. (2007).Phasic heart rate changes dur-ing word translation of differentdifficulties. Psychophysiology 44,807–813. doi: 10.1111/j.1469-8986.2007.00553.x
Pfurtscheller, G., Leeb, R., Friedman,D., and Slater, M. (2008a). Centrallycontrolled heart rate changes duringmental practice in immersive vir-tual environment: a case study witha tetralegic. Int. J. Psychophysiol. 68,1–5. doi: 10.1016/j.ijpsycho.2007.11.003
Pfurtscheller, G., Scherer, R., Müller-Putz, G. R., and Lopes da Silva,
F. H. (2008b). Short-lived brainstate after cued motor imageryin naive subjects. Eur. J. Neurosci.28, 1419–1426. doi: 10.1111/j.1460-9568.2008.06441.x
Pfurtscheller, G., and Lopes da Silva, F.H. (1999). Event-related EEG/MEGsynchronization and desynchro-nization: basic principles. Clin.Neurophysiol. 110, 1842–1857. doi:10.1016/S1388-2457(99)00141-8
Pfurtscheller, G., and Neuper, C.(2001). Motor imagery and directbrain-computer communication(Invited paper). Proc. IEEE (SpecialIssue) Neural Eng. Merging Eng.Neurosci. 89, 1123–1134.
Pichiorri, F., De Vico Fallani, F.,Cincotti, F., Babiloni, F., Molinari,M., Kleih, S. C. et al. (2011).Sensorimotor rhythm-basedbrain-computer interface train-ing: the impact on motor corticalresponsiveness. J. Neural Eng.8:025020.
Riehle, A., and Requin, J. (1995).Neuronal correlates of the specifi-cation of movement direction andforce in four cortical areas of themonkey. Behav. Brain Res. 70, 1–13.doi: 10.1016/0166-4328(94)00180-N
Salmelin, R., Hämäläinen, M., Kajola,M., and Hari, R. (1995). Functionalsegregation of movement relatedrhythmic activity in the humanbrain. Neuroimage 2, 237–243. doi:10.1006/nimg.1995.1031
Schlögl, A., and Brunner, C. (2008).BioSig: a free and open sourcesoftware library for BCI research.Computer 41, 44–50. doi: 10.1109/MC.2008.407
Smyth, H. S., Sleight, P., and Pickering,G. W. (1969). Reflex regulationof arterial pressure during sleepin man. A quantitative method of
assessing baroreflex sensitivity. Circ.Res. 24, 109–121. doi: 10.1161/01.RES.24.1.109
Sokolov, E. N. (1960). “The cen-tral nervous system and behav-ior,” in Neuronal Models and theOrienting Reflex, ed Mary A. B.Brazier (New York, NY: Josiah Macy,Jr. Foundation), 187–276.
Solis-Escalante, T., Müller-Putz, G.R., Pfurtscheller, G., and Neuper,C. (2012). Cue-induced betarebound during withholding ofovert and covert foot movement.Clin. Neurophysiol. 123, 1182–1190.doi: 10.1016/j.clinph.2012.01.013
Soon, C. S., Brass, M., Heinze, H.J., and Haynes, J. D. (2008).Unconscious determinants of freedecisions in the human brain. Nat.Neurosci. 11, 543–545. doi: 10.1038/nn.2112
Thayer, J. F., and Lane, R. D. (2009).Claude Bernard and the heart-brain connection: further elabora-tion of a model of neurovisceralintegration. Neurosci. Biobehav. Rev.33, 81–88. doi: 10.1016/j.neubiorev.2008.08.004
Tzagarakis, C., Ince, N. F., Leuthold, A.C., and Pellizzer, G. (2010). Beta-band activity during motor plan-ning reflects response uncertainty.J. Neurosci. 30, 11270–11277. doi:10.1523/JNEUROSCI.6026-09.2010
Waldert, S., Preissl, H., Demandt, E.,Braun, C., Birbaumer, N., Aertsen,A., et al. (2008). Hand movementdirection decoded from MEG andEEG. J. Neurosci. 28, 1000–1008.doi: 10.1523/JNEUROSCI.5171-07.2008
Wang, J., Mordkoff, J. T., and Sainburg,R. L. (2010). Visuomotor learninggeneralizes between bilateral andunilateral conditions despite vary-ing degrees of bilateral interference.
J. Neurophysiol. 104, 2913–2921.doi: 10.1152/jn.00225.2010
Wolpaw, J. R., Birbaumer, N.,McFarland, D. J., Pfurtscheller,G., and Vaughan, T. M. (2002).Brain-computer interfaces forcommunication and control. Clin.Neurophysiol. 113, 767–791. doi:10.1016/S1388-2457(02)00057-3
Zhang, Y., Chen, Y., Bressler, S. L.,and Ding, M. (2008). Responsepreparation and inhibition: the roleof the cortical sensorimotor betarhythm. Neuroscience 156, 238–246.doi: 10.1016/j.neuroscience.2008.06.061
Conflict of Interest Statement: Theauthors declare that the researchwas conducted in the absence of anycommercial or financial relationshipsthat could be construed as a potentialconflict of interest.
Received: 10 March 2013; accepted: 01July 2013; published online: 30 July 2013.Citation: Pfurtscheller G, Solis-EscalanteT, Barry RJ, Klobassa DS, Neuper Cand Müller-Putz GR (2013) Brisk heartrate and EEG changes during executionand withholding of cue-paced foot motorimagery. Front. Hum. Neurosci. 7:379.doi: 10.3389/fnhum.2013.00379Copyright © 2013 Pfurtscheller, SolisEscalante, Barry, Klobassa, Neuper andMüller-Putz. This is an open-access arti-cle distributed under the terms of theCreative Commons Attribution License(CC BY). The use, distribution or repro-duction in other forums is permitted,provided the original author(s) or licen-sor are credited and that the originalpublication in this journal is cited, inaccordance with accepted academic prac-tice. No use, distribution or reproductionis permitted which does not comply withthese terms.
Frontiers in Human Neuroscience www.frontiersin.org July 2013 | Volume 7 | Article 379 | 9