brisbane long term infrastructure plan 2012-2031 · pdf filecouncil has prepared this second...
TRANSCRIPT

Brisbane Long Term Infrastructure Plan 2012-2031

INTENTIONALLY BLANK
1
FOREWORD
It is certainly an exciting time for Brisbane, Australia’s new world city.
As the centre of the fastest growing region in Australia, Brisbane is facing significant challenges. Brisbane is expecting a sustained period of growth over the next 20 years. Council is committed to the delivery of world-class infrastructure to cater for this growth while retaining our city’s unique character and ensuring Brisbane is well placed to prosper.
Council has prepared this second edition of the Brisbane Long Term Infrastructure Plan to build upon the strategic direction and coordinated approach to developing future infrastructure outlined in the first edition released in 2007.
The Brisbane Long Term Infrastructure Plan continues to strive for transparency and integration of infrastructure planning and delivery for Brisbane as a whole, incorporating Council projects with Federal and Queensland Government initiatives, and the private sector.
I look forward to the implementation of the Brisbane Long Term Infrastructure Plan. It will help Council ensure Brisbane’s infrastructure provision meets the community’s needs while enhancing the city’s capacity for long term economic development.
Graham Quirk Lord Mayor, Brisbane City

1
Brisbane Long Term Infrastructure Plan 2012-2031
1 INTRODUCTION 5
2 FORECASTS AND TRENDS 9
2.1 Population growth 9
2.2 Employment growth 11
2.3 Infrastructure class forecasts 17
2.4 Key infrastructure themes 18
3 INFRASTRUCTURE FOR BRISBANE 21
3.1 Objectives and key results 22
3.2 Strategy 1 – Transport 27
3.3 Strategy 2 – Water 35
3.4 Strategy 3 – Energy 40
3.5 Strategy 4 – Telecommunications 43
3.6 Strategy 5 – Waste management 46
3.7 Strategy 6 – Social infrastructure 47
3.8 Strategy 7 – Green space 53
3.9 Strategy 8 – Key districts 54
4 IMPLEMENTATION 65
4.1 Implementing Brisbane’s infrastructure strategy 65
4.2 Brisbane’s infrastructure program 65
5 REFERENCES 114
4
1
5
INTRODUCTION 1
Infrastructure delivers services that support active and healthy communities, cultural vibrancy, a strong economy, and a clean and green environment.
Providing efficient infrastructure solutions that meet anticipated demand for infrastructure will contribute to driving economic growth and will support the city’s regional role as a centre for commerce, tourism, education and cultural activity.
This Brisbane Long Term Infrastructure Plan (BLTIP) 2012-2031 is Council’s long term infrastructure policy for the city. The BLTIP aligns infrastructure delivery with Living in Brisbane 2026 – a shared vision for the future of Brisbane City. Implementing the BLTIP will contribute to the “triple bottom line” which may be summarised as:
•g rowing the economy – enhancing the city’s capacity for long term economic growth
•building communities – supporting a growing and diverse Brisbane population
• enhancing the environment – managing and mitigating the impact on the natural environment.
Based on forecasts which depict the future for the city in terms of population and economic activity, the BLTIP identifies actions to deliver infrastructure strategies for:
• transport
•water
•energy
• telecommunications
•waste management
•social infrastructure
•green space
•key districts – Greater Central Business District (CBD), Australia TradeCoast (ATC) and South West Industrial Gateway (SWIG).
The purpose of this plan is to:
•e nsure that infrastructure provision is consistent with the city’s economic, social and environmental aspirations
• guide the prioritisation and alignment of Brisbane’s infrastructure building and asset maintenance program
•ensure Brisbane receives an appropriate return on its infrastructure investments
• realise savings, synergies and complementarities that are available from simultaneous, comprehensive planning and delivery of different infrastructure classes
•provide a reference for other levels of government to consider their complementary roles in contributing to Brisbane’s infrastructure
• provide a reference for the private sector to consider its role in contributing to and investing in Brisbane’s infrastructure.
6
1
7
1
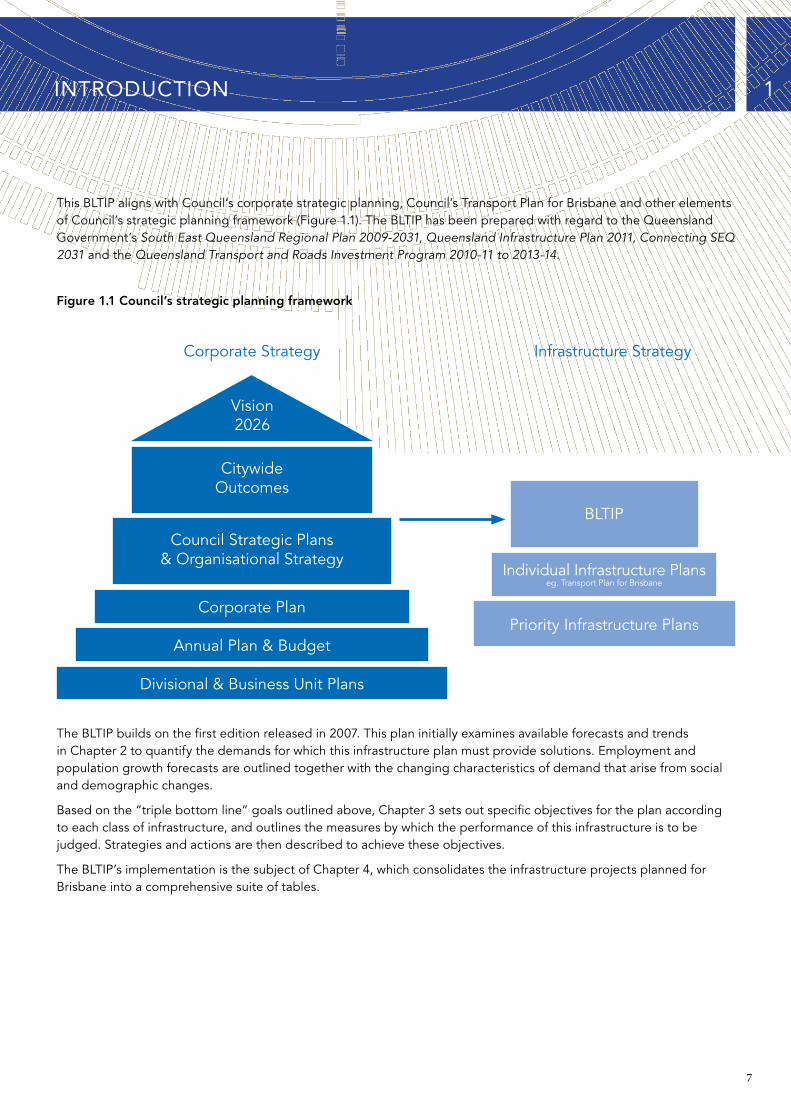
This BLTIP aligns with Council’s corporate strategic planning, Council’s Transport Plan for Brisbane and other elements of Council’s strategic planning framework (Figure 1.1). The BLTIP has been prepared with regard to the Queensland Government’s South East Queensland Regional Plan 2009-2031, Queensland Infrastructure Plan 2011, Connecting SEQ 2031 and the Queensland Transport and Roads Investment Program 2010-11 to 2013-14.
Figure 1.1 Council’s strategic planning framework
Corporate Strategy
Vision2026
Citywide Outcomes
Council Strategic Plans & Organisational Strategy
INTRODUCTION
Infrastructure Strategy
BLTIP
Individual Infrastructure Planseg. Transport Plan for Brisbane
Priority Infrastructure PlansCorporate Plan
Annual Plan & Budget
Divisional & Business Unit Plans
The BLTIP builds on the first edition released in 2007. This plan initially examines available forecasts and trends in Chapter 2 to quantify the demands for which this infrastructure plan must provide solutions. Employment and population growth forecasts are outlined together with the changing characteristics of demand that arise from social and demographic changes.
Based on the “triple bottom line” goals outlined above, Chapter 3 sets out specific objectives for the plan according to each class of infrastructure, and outlines the measures by which the performance of this infrastructure is to be judged. Strategies and actions are then described to achieve these objectives.
The BLTIP’s implementation is the subject of Chapter 4, which consolidates the infrastructure projects planned for Brisbane into a comprehensive suite of tables.

8
2
9
FORECASTS AND TRENDS2
Brisbane is at the centre of one of Australia’s fastest growing regions. Brisbane’s strong population and employment growth, coupled with changing trends in infrastructure demand, will have far-reaching implications for infrastructure provision over the next 20 years.
2.1 Population growth
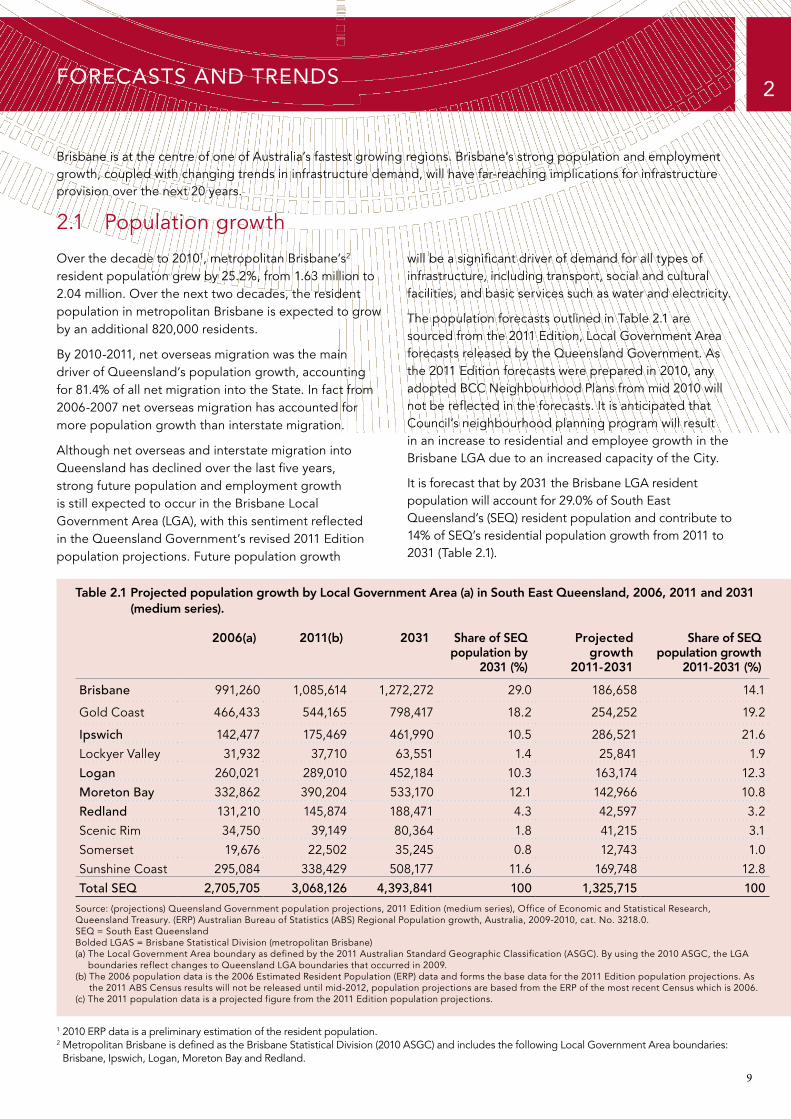
Over the decade to 20101, metropolitan Brisbane’s2 resident population grew by 25.2%, from 1.63 million to 2.04 million. Over the next two decades, the resident population in metropolitan Brisbane is expected to grow by an additional 820,000 residents.
By 2010-2011, net overseas migration was the main driver of Queensland’s population growth, accounting for 81.4% of all net migration into the State. In fact from 2006-2007 net overseas migration has accounted for more population growth than interstate migration.
Although net overseas and interstate migration into Queensland has declined over the last five years, strong future population and employment growth is still expected to occur in the Brisbane Local Government Area (LGA), with this sentiment reflected in the Queensland Government’s revised 2011 Edition population projections. Future population growth
will be a significant driver of demand for all types of infrastructure, including transport, social and cultural facilities, and basic services such as water and electricity.
The population forecasts outlined in Table 2.1 are sourced from the 2011 Edition, Local Government Area forecasts released by the Queensland Government. As the 2011 Edition forecasts were prepared in 2010, any adopted BCC Neighbourhood Plans from mid 2010 will not be reflected in the forecasts. It is anticipated that Council’s neighbourhood planning program will result in an increase to residential and employee growth in the Brisbane LGA due to an increased capacity of the City.
It is forecast that by 2031 the Brisbane LGA resident population will account for 29.0% of South East Queensland’s (SEQ) resident population and contribute to 14% of SEQ’s residential population growth from 2011 to 2031 (Table 2.1).
Table 2.1 Projected population growth by Local Government Area (a) in South East Queensland, 2006, 2011 and 2031 (medium series).
Brisbane
2006(a)
991,260
2011(b)
1,085,614
2031
1,272,272
Share of SEQ population by
2031 (%)
29.0
Projected growth
2011-2031
186,658
Share of SEQ population growth
2011-2031 (%)
14.1
Gold Coast 466,433 544,165 798,417 18.2 254,252 19.2
Ipswich 142,477 175,469 461,990 10.5 286,521 21.6
Lockyer Valley 31,932 37,710 63,551 1.4 25,841 1.9
Logan 260,021 289,010 452,184 10.3 163,174 12.3
Moreton Bay 332,862 390,204 533,170 12.1 142,966 10.8
Redland 131,210 145,874 188,471 4.3 42,597 3.2
Scenic Rim 34,750 39,149 80,364 1.8 41,215 3.1
Somerset 19,676 22,502 35,245 0.8 12,743 1.0
Sunshine Coast
Source: (projections) Queensland Government population projections, 2011 Edition (medium series), Office of Economic and Statistical Research, Queensland Treasury. (ERP) Australian Bureau of Statistics (ABS) Regional Population growth, Australia, 2009-2010, cat. No. 3218.0.SEQ = South East QueenslandBolded LGAS = Brisbane Statistical Division (metropolitan Brisbane)(a) T he Local Government Area boundary as defined by the 2011 Australian Standard Geographic Classification (ASGC). By using the 2010 ASGC, the LGA
boundaries reflect changes to Queensland LGA boundaries that occurred in 2009. (b) T he 2006 population data is the 2006 Estimated Resident Population (ERP) data and forms the base data for the 2011 Edition population projections. As
the 2011 ABS Census results will not be released until mid-2012, population projections are based from the ERP of the most recent Census which is 2006.(c) The 2011 population data is a projected figure from the 2011 Edition population projections.
1 2010 ERP data is a preliminary estimation of the resident population. 2 Metropolitan Brisbane is defined as the Brisbane Statistical Division (2010 ASGC) and includes the following Local Government Area boundaries:
Brisbane, Ipswich, Logan, Moreton Bay and Redland.
295,084 338,429 508,177 11.6 169,748 12.8
Total SEQ 2,705,705 3,068,126 4,393,841 100 1,325,715 100

10
2 FORECASTS AND TRENDS
Around 138,000 out of 156,000 new dwellings required in Brisbane City will be delivered through infill and redevelopment. Though already serviced with infrastructure, infill developments and redevelopments often require an upgrade to trunk infrastructure to meet increased levels of demand, or to deliver a higher quality service standard. Infill developments also provide opportunities to install the latest infrastructure technologies, such as fibre optic cable. Areas just outside Brisbane City, are expected to house the majority of the population growth forecast for metropolitan Brisbane.
This growth will also place additional demand on Brisbane’s infrastructure, most notably transport, tertiary services in health and education as well as cultural and recreational infrastructure. Infrastructure investment must also support residential populations outside of Brisbane City, commercial activities across the SEQ region and demand for visitors (such as tourists and students).
Infrastructure will need to cater for the needs of the Brisbane aged community including suitable access to services and encouraging participation in City life. The number of residents aged 65 years and over is projected to increase by 87% from 113,421 persons in 2006 to 212,486 persons in 2031. In particular, the number of residents aged 80 years and over is anticipated to nearly double over the timeframe (34,785 residents aged 80 years and over in 2006 to 66,151 residents aged 80 years and over by 2031).
The number of children aged less than 15 years living in Brisbane City is also expected to slightly increase from 175,000 children in 2006 to nearly 200,000 children by 2031. Additional schools in high population and employment growth areas will be needed to cater for demand.
11
2
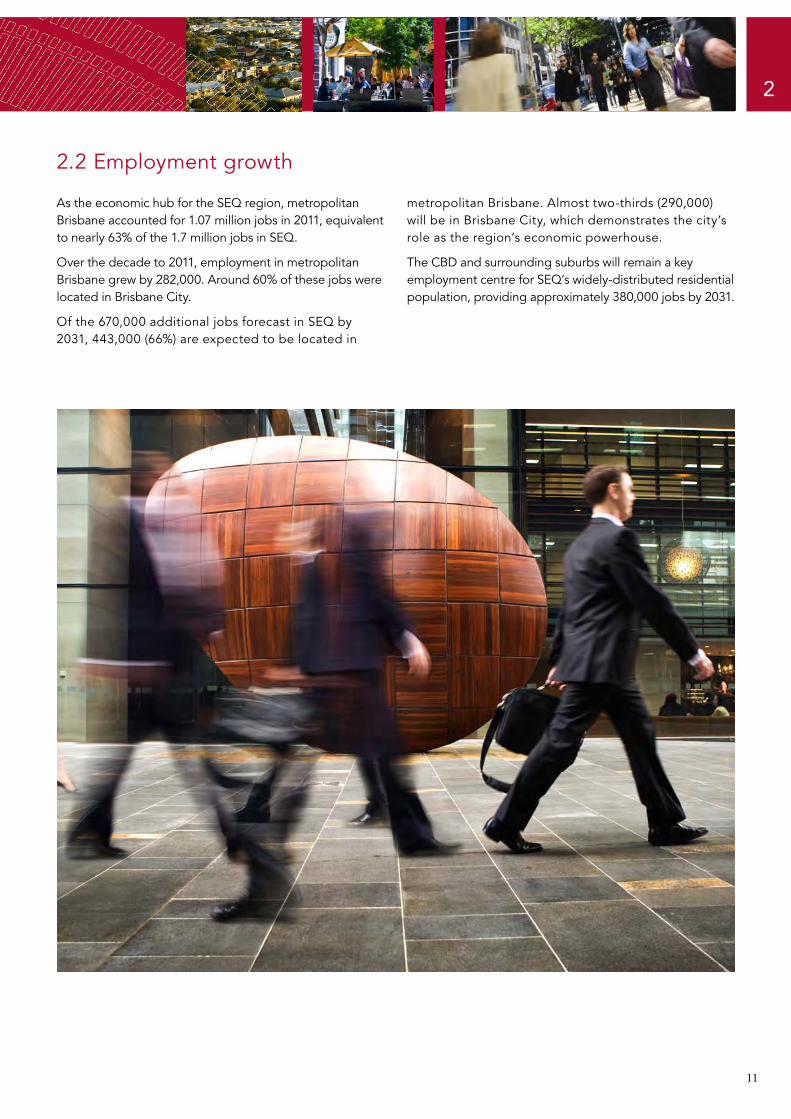
2.2 Employment growth
As the economic hub for the SEQ region, metropolitan Brisbane accounted for 1.07 million jobs in 2011, equivalent to nearly 63% of the 1.7 million jobs in SEQ.
Over the decade to 2011, employment in metropolitan Brisbane grew by 282,000. Around 60% of these jobs were located in Brisbane City.
Of the 670,000 additional jobs forecast in SEQ by 2031, 443,000 (66%) are expected to be located in
metropolitan Brisbane. Almost two-thirds (290,000) will be in Brisbane City, which demonstrates the city’s role as the region’s economic powerhouse.
The CBD and surrounding suburbs will remain a key employment centre for SEQ’s widely-distributed residential population, providing approximately 380,000 jobs by 2031.
12
2
13
2
Employment Growth (‘000s)
CBDSouth Brisbane
ATCWooloongabba
Bowen HillsFortitude ValleyMount Gravatt
St Lucia Herston
ChermsideMiltonWacol
Acacia RidgeRochedale
NathanToowongWest End
Spring HillMitchelton
Indooroopilly
0 10 20 30 40 50 60 70
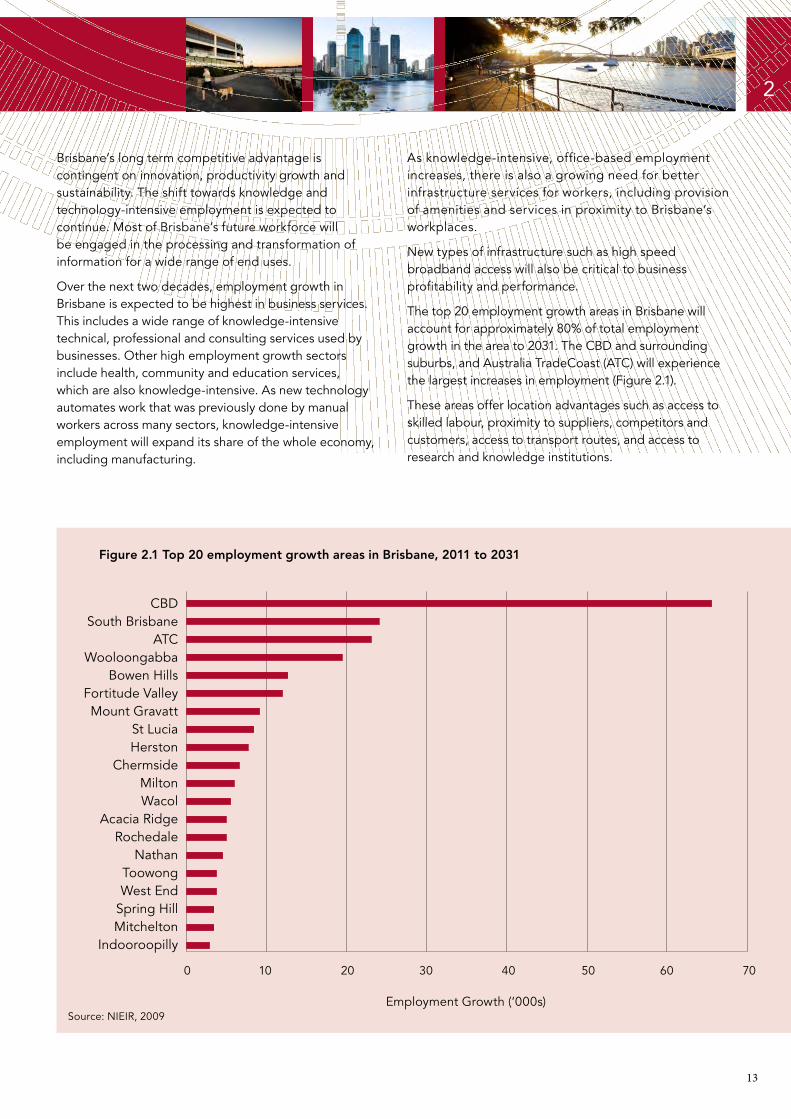
Brisbane’s long term competitive advantage is contingent on innovation, productivity growth and sustainability. The shift towards knowledge and technology-intensive employment is expected to continue. Most of Brisbane’s future workforce will be engaged in the processing and transformation of information for a wide range of end uses.
Over the next two decades, employment growth in Brisbane is expected to be highest in business services. This includes a wide range of knowledge-intensive technical, professional and consulting services used by businesses. Other high employment growth sectors include health, community and education services, which are also knowledge-intensive. As new technology automates work that was previously done by manual workers across many sectors, knowledge-intensive employment will expand its share of the whole economy, including manufacturing.
As knowledge-intensive, office-based employment increases, there is also a growing need for better infrastructure services for workers, including provision of amenities and services in proximity to Brisbane’s workplaces.
New types of infrastructure such as high speed broadband access will also be critical to business profitability and performance.
The top 20 employment growth areas in Brisbane will account for approximately 80% of total employment growth in the area to 2031. The CBD and surrounding suburbs, and Australia TradeCoast (ATC) will experience the largest increases in employment (Figure 2.1).
These areas offer location advantages such as access to skilled labour, proximity to suppliers, competitors and customers, access to transport routes, and access to research and knowledge institutions.
Figure 2.1 Top 20 employment growth areas in Brisbane, 2011 to 2031
Source: NIEIR, 2009
14
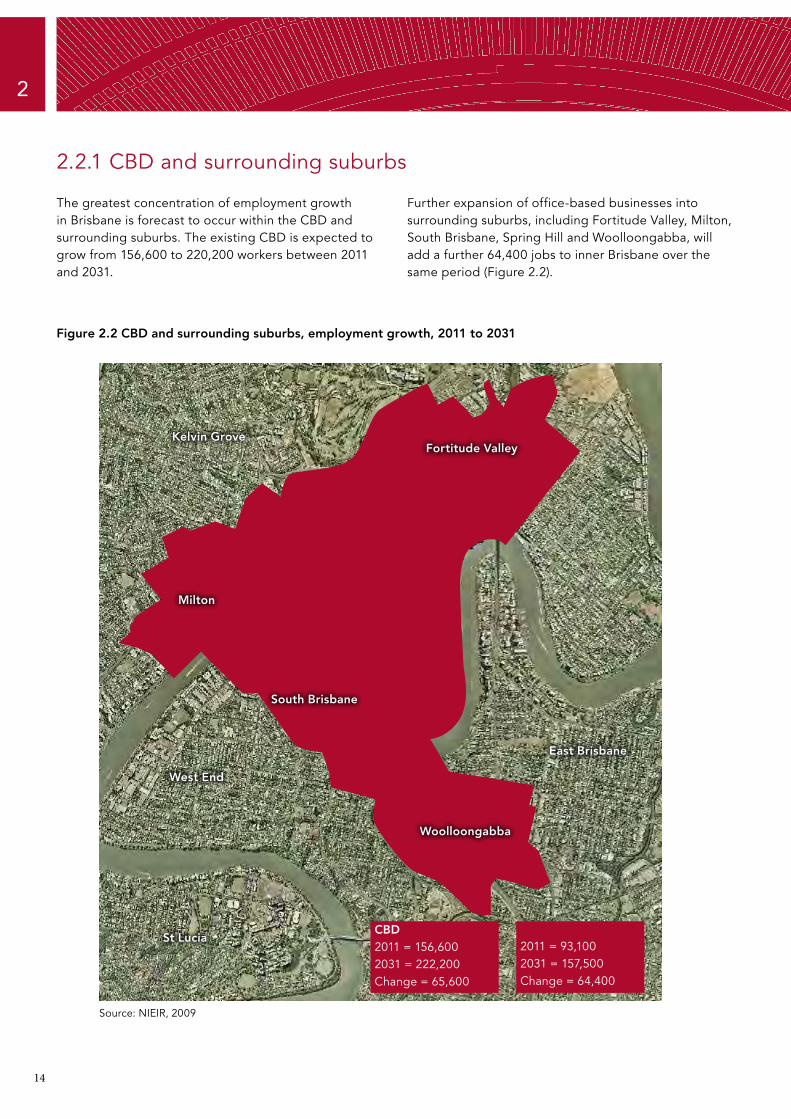
2.2.1 CBD and surrounding suburbs
The greatest concentration of employment growth in Brisbane is forecast to occur within the CBD and surrounding suburbs. The existing CBD is expected to grow from 156,600 to 220,200 workers between 2011 and 2031.
Further expansion of office-based businesses into surrounding suburbs, including Fortitude Valley, Milton, South Brisbane, Spring Hill and Woolloongabba, will add a further 64,400 jobs to inner Brisbane over the same period (Figure 2.2).
Figure 2.2 CBD and surrounding suburbs, employment growth, 2011 to 2031
Kelvin GroveFortitude Valley
East Brisbane
Woolloongabba
West End
St Lucia
Milton
South Brisbane
CBD 2011 = 156,600 2031 = 222,200 Change = 65,600
2
2011 = 93,100 2031 = 157,500 Change = 64,400
Source: NIEIR, 2009
15
2
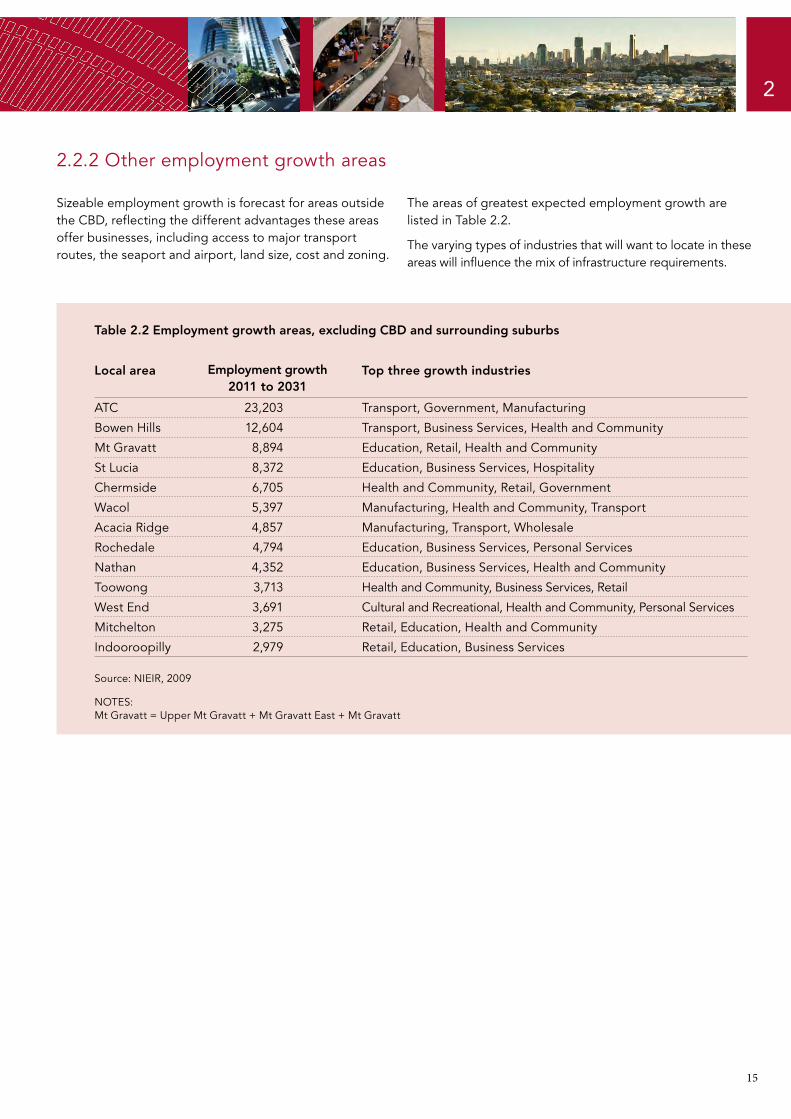
2.2.2 Other employment growth areas
Sizeable employment growth is forecast for areas outside the CBD, reflecting the different advantages these areas offer businesses, including access to major transport routes, the seaport and airport, land size, cost and zoning.
The areas of greatest expected employment growth are listed in Table 2.2.
The varying types of industries that will want to locate in these areas will influence the mix of infrastructure requirements.
Table 2.2 Employment growth areas, excluding CBD and surrounding suburbs
Local area
ATC
Employment gro wth2011 to 2031
23,203
Top three growth industries
Transport, Government, Manufacturing
Bowen Hills 12,604 Transport, Business Services, Health and Community
Mt Gravatt 8,894 Education, Retail, Health and Community
St Lucia 8,372 Education, Business Services, Hospitality
Chermside 6,705 Health and Community, Retail, Government
Wacol 5,397 M anufacturing, Health and Community, Transport
Acacia Ridge 4,857 Manufacturing, Transport, Wholesale
Rochedale 4,794 Education, Business Services, Personal Services
Nathan 4,352 E ducation, Business Services, Health and Community
Toowong 3,713 Health and Community, Business Services, Retail
West End 3,691 Cultural and Recreational, Health and Community, Personal Services
Mitchelton 3,275 Retail, Education, Health and Community
Indooroopilly 2,979 Retail, Education, Business Services
Source: NIEIR, 2009
NOTES: Mt Gravatt = Upper Mt Gravatt + Mt Gravatt East + Mt Gravatt
16
2
17
2
T
FORECASTS AND TRENDS
2.3 Infrastructure class forecasts
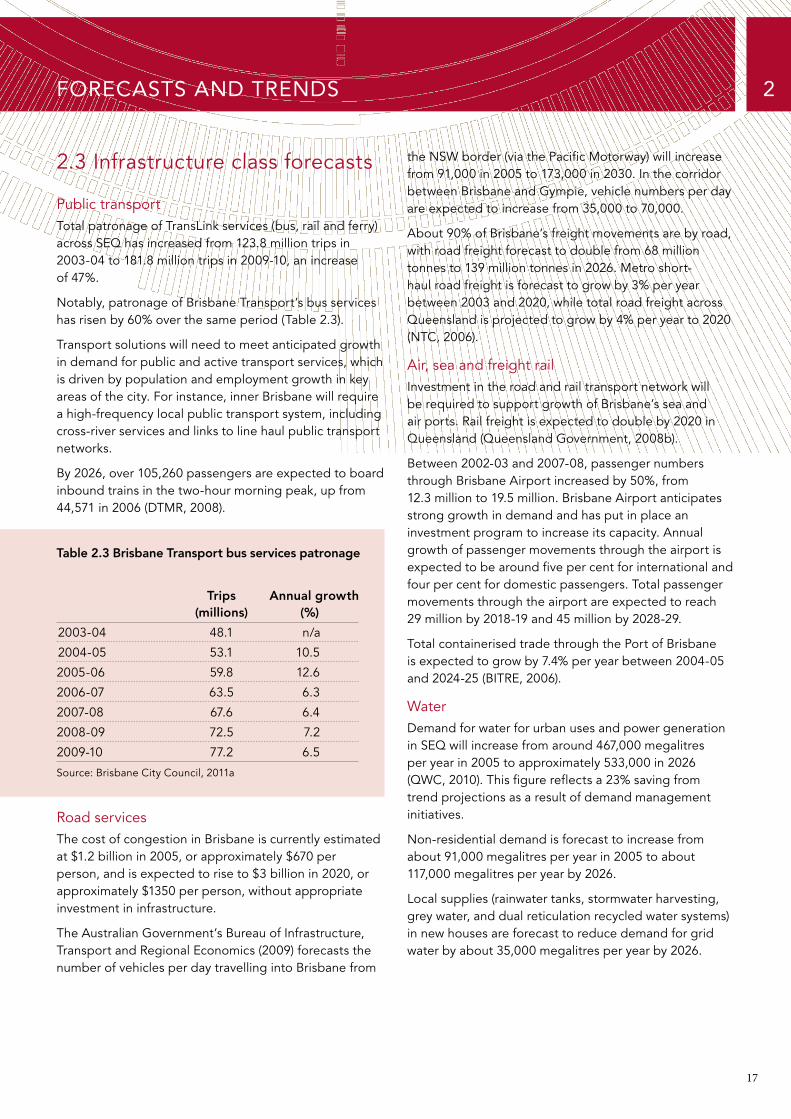
Public transportTotal patronage of TransLink services (bus, rail and ferry) across SEQ has increased from 123.8 million trips in 2003-04 to 181.8 million trips in 2009-10, an increase of 47%.
Notably, patronage of Brisbane Transport’s bus services has risen by 60% over the same period (Table 2.3).
Transport solutions will need to meet anticipated growth in demand for public and active transport services, which is driven by population and employment growth in key areas of the city. For instance, inner Brisbane will require a high-frequency local public transport system, including cross-river services and links to line haul public transport networks.
By 2026, over 105,260 passengers are expected to board inbound trains in the two-hour morning peak, up from 44,571 in 2006 (DTMR, 2008).
able 2.3 Brisbane Transport bus services patronage
2003-04
Trips (millions)
48.1
Annual growth (%)
n/a
2004-05 53.1 10.5
2005-06 59.8 12.6
2006-07 63.5 6.3
2007-08 67.6 6.4
2008-09 72.5 7.2
2009-10 77.2 6.5
Source: Brisbane City Council, 2011a
Road servicesThe cost of congestion in Brisbane is currently estimated at $1.2 billion in 2005, or approximately $670 per person, and is expected to rise to $3 billion in 2020, or approximately $1350 per person, without appropriate investment in infrastructure.
The Australian Government’s Bureau of Infrastructure, Transport and Regional Economics (2009) forecasts the number of vehicles per day travelling into Brisbane from
the NSW border (via the Pacific Motorway) will increase from 91,000 in 2005 to 173,000 in 2030. In the corridor between Brisbane and Gympie, vehicle numbers per day are expected to increase from 35,000 to 70,000.
About 90% of Brisbane’s freight movements are by road, with road freight forecast to double from 68 million tonnes to 139 million tonnes in 2026. Metro short-haul road freight is forecast to grow by 3% per year between 2003 and 2020, while total road freight across Queensland is projected to grow by 4% per year to 2020 (NTC, 2006).
Air, sea and freight railInvestment in the road and rail transport network will be required to support growth of Brisbane’s sea and air ports. Rail freight is expected to double by 2020 in Queensland (Queensland Government, 2008b).
Between 2002-03 and 2007-08, passenger numbers through Brisbane Airport increased by 50%, from 12.3 million to 19.5 million. Brisbane Airport anticipates strong growth in demand and has put in place an investment program to increase its capacity. Annual growth of passenger movements through the airport is expected to be around five per cent for international and four per cent for domestic passengers. Total passenger movements through the airport are expected to reach 29 million by 2018-19 and 45 million by 2028-29.
Total containerised trade through the Port of Brisbane is expected to grow by 7.4% per year between 2004-05 and 2024-25 (BITRE, 2006).
WaterDemand for water for urban uses and power generation in SEQ will increase from around 467,000 megalitres per year in 2005 to approximately 533,000 in 2026 (QWC, 2010). This figure reflects a 23% saving from trend projections as a result of demand management initiatives.
Non-residential demand is forecast to increase from about 91,000 megalitres per year in 2005 to about 117,000 megalitres per year by 2026.
Local supplies (rainwater tanks, stormwater harvesting, grey water, and dual reticulation recycled water systems) in new houses are forecast to reduce demand for grid water by about 35,000 megalitres per year by 2026.
18
2 FORECASTS AND TRENDS
TelecommunicationsThere has been strong growth in data downloaded over recent years, with an increase in broadband coverage and the uptake of new access technologies (for example, wireless 3G) has rapidly increased demand for bandwidth. Data downloads for Australia increased from 55,434 terabytes in June Quarter 2008 to 99,993 terabytes in June Quarter 2009 (ABS, 2009a). This trend is expected to continue.
EnergyTotal energy consumption is forecast to increase, through continued population growth and increasing energy consumption per person. At the national level, energy use per person is forecast to increase by 0.7% per year to 2029-30.
Peak summer demand for electricity in SEQ is forecast to increase by 4.1% per year over the next 10 years. Gas consumption in SEQ is forecast to increase by 3.8% per year to 2033 (Queensland Government, 2009a).
Energy intensity (energy per dollar of GDP) is expected to decline at 1% per year over the same period (ABARE, 2007).
WasteQueensland currently generates 1.9 tonnes of waste per person, of which 0.9 tonnes per person is recycled (Table 2.4).
Given current trends in disposal, it is anticipated Brisbane will run out of capacity at land fill sites before 2020.
Without changes in behaviour to reduce waste and encourage recycling, investment will be required in additional waste processing and disposal infrastructure.
Table 2.4 Waste per capita, 2006
Disposed
Queensland (tonnes)
1.0
Australia(tonnes)
1.0
Recycled 0.9 1.1
Total 1.9 2.1
Source: EPHC, 2008
2.4 Key infrastructure themes Brisbane’s infrastructure program needs to meet the service needs of the community and contribute to achieving the broader economic, social and environmental aspirations for the city.
Anticipated future demand for infrastructure services necessitates a policy and project response that will contribute to:
• regional employment outcomes
•export growth
• the knowledge economy
•culturally diverse and inclusive communities
•a smart and connected city
•higher density, public transport-oriented living
•providing an environment for a liveable city.
Ensuring that the city’s infrastructure contributes to addressing these key infrastructure themes (refer Figure 2.3), and to the infrastructure planning objectives discussed in Chapter 3, will maximise the benefits derived from investment in infrastructure.

19
2
Figure 2.3 Key infrastructure themes
Regional employment outcomesBrisbane’s economy supports residents who reside in Brisbane, but also residents who commute from surrounding regions to work in Brisbane (around 27% (net) of workers).
By 2031, Brisbane’s economy is expected to support over one million jobs, a 56% increase on 2010. Approximately 80% of this growth is expected to be located in only 20% of Brisbane suburbs. The greater CBD (including areas of West End and Fortitude Valley) is also expected to remain SEQ’s major employment and knowledge hub, supporting 380,000 jobs by 2031.
Transport services must provide a mix of express long-distance services, and provide a reliable service of a suitable frequency to commuters within Brisbane.
Environment for a liveable cityInfrastructure networks contribute to the liveability of the river city, with open space providing recreation and relaxation for residents, and supporting high levels of biodiversity in areas to support the city’s environmental health. As demand for scarce resources rise, residents will be encouraged to conserve energy and water which will help to reduce the investment required in networks, and will enhance the long term sustainability of these resources. Residents and businesses will be encouraged to continue to move towards zero waste.
The knowledge economyBrisbane’s competitive advantage will increasingly be as a diversified, knowledge based economy, fostering the development of industries with innovative practices. Co-location of knowledge industries supported by ultra high speed telecommunications infrastructure will enhance the competitiveness of Brisbane industries.
Export growthInfrastructure must support the continued growth of Brisbane’s export industries and particularly sales of high value-added exports. Facilitating the efficient operation of manufacturing supply chains, particularly through provision of adequate freight infrastructure, is critical to maximising export efficiency.
Education services and tourism exports will continue to be a key source of employment and export growth for the region. Investment in tourism infrastructure, affordable student accommodation and 24-hour transport services to major tourist facilities, such as Brisbane Airport, will support the growth of the export sector.
A smart and connected cityA connected community will benefit from enhanced access to health, education, welfare services and employment opportunities. Virtual and physical connectivity will become increasingly important in driving productivity improvements. Smart infrastructure solutions will be particularly important in the delivery of health and education services.
Culturally diverse and inclusive communitiesActive transport infrastructure, tailored and affordable public transport solutions, and engaging open spaces to support healthy and cohesive communities will support a growing population with diverse interests and needs.
Higher density, public transport-oriented livingInfrastructure solutions need to cater for higher residential densities to meet growth in demand for housing, while continuing to deliver premium transport services to get people to where they work and play, while also enabling access to essential services such as health and education.
20
3

21
INFRASTRUCTURE FOR BRISBANE 3
To meet the challenges in delivering the vision for the city, Living in Brisbane 2026, this infrastructure plan for Brisbane commits to achieving results that will better enable the city to grow the economy, build the community, and enhance the environment.
Council will pursue the following eight infrastructure strategies in conjunction with other levels of government and the private sector (Figure 3.1):
•Strategy 1 – Transport
• Strategy 2 – Water cycle
•Strategy 3 – Energy supply and distribution
•Strategy 4 – Telecommunications
•Strategy 5 – Waste management
• Strategy 6 – Social infrastructure
•Strategy 7 – Green space
•Strategy 8 – Key districts
These strategies are described in detail in subsequent sections along with the implementation roles of Council, agencies, other levels of government and the private sector. The strategies and actions reflect Council’s preferred outcomes, and do not necessarily reflect agreement or support from those organisations referred to in the strategies and actions.
Figure 3.1 Brisbane Long Term Infrastructure Plan
BrisbaneAustralia’s New World City
Vision 2026Grow the economy
Build the community
Enhance the environment
Implementation
Long term infrastructure
strategies
1
Transport
2
Water
3
Energy
4
Tele- communications
5
Wastemanagement
6
Socialinfrastructure
7
Greenspace
8
Key districts

22
3 INFRASTRUCTURE FOR BRISBANE
3.1 Objectives and key resultsAligning infrastructure strategies with broader goals and aspirations of the city will help to ensure that infrastructure policies and programs deliver the greatest benefits to the community. Table 3.1 outlines the desired key results from the eight strategies that make up Brisbane’s Long Term Infrastructure Plan.
These key results are aligned with the Living in Brisbane 2026 vision, which aims to grow the economy, build the community and enhance the environment. The measures identified for each key result area are long term targets to 2031, and will be used to track how the city is progressing in achieving its infrastructure planning objectives.
Table 3.1 Objectives and measures
Transport
INFRASTRUCTURE
Objectives
GROW THE ECONOMY
• Road and public transport networks provide efficient and reliable travel options for:
• workers to access jobs
• residents and visitors to access services
• business and industry to operate effectively and productively.
• Freight moves easily between industrial areas, major interstate routes and the seaport and airport.
• Transport networks and travel demand are effectively managed by Intelligent Transport Systems.
BUILD THE COMMUNITY
• The transport network delivers people to where they want to go.
• Safe, accessible transport options meet the needs of users, specifically:
• satisfying resident demand for active transport
• supporting needs of the aged, disabled and non-English speaking persons.
• The public transport network supports major events and access to key tourism destinations.
ENHANCE THE ENVIRONMENT
• Emissions from transportation are reduced with increased walking and cycling, and use of public transport.
Measures • More than 90% of Brisbane residents can get to work within 45 minutes.
• Public transport services are reliable and include support for visitors (e.g. tourists) and 24-hour services.
• Public transport accessibility – reasonable access every 15 minutes to key activity nodes, and every half an hour for rest of public transport network.
• 90% of residents live within 15 minutes walk of a public transit stop.
• Increase the morning peak mode share for active and public transport to 41%.
• Emissions from bus and vehicle fleets are carbon neutral through efficiency fuel switching and carbon offsets.
23
3
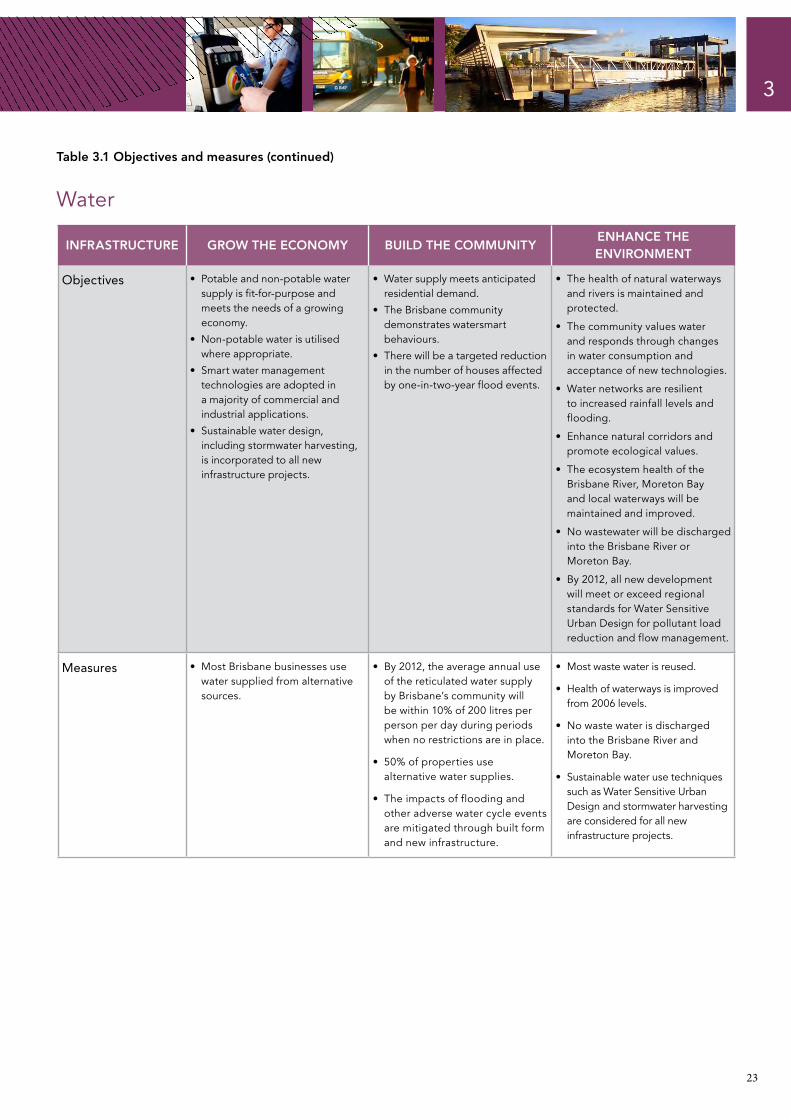
Table 3.1 Objectives and measures (continued)
Water
INFRASTRUCTURE
Objectives
GROW THE ECONOMY
• Potable and non-potable water supply is fit-for-purpose and meets the needs of a growing economy.
• Non-potable water is utilised where appropriate.
• Smart water management technologies are adopted in a majority of commercial and industrial applications.
• Sustainable water design, including stormwater harvesting, is incorporated to all new infrastructure projects.
BUILD THE COMMUNITY
• Water supply meets anticipated residential demand.
• The Brisbane community demonstrates watersmart behaviours.
• There will be a targeted reduction in the number of houses affected by one-in-two-year flood events.
ENHANCE THE ENVIRONMENT
• The health of natural waterways and rivers is maintained and protected.
• The community values water and responds through changes in water consumption and acceptance of new technologies.
• Water networks are resilient to increased rainfall levels and flooding.
• Enhance natural corridors and promote ecological values.
• The ecosystem health of the Brisbane River, Moreton Bay and local waterways will be maintained and improved.
• No wastewater will be discharged into the Brisbane River or Moreton Bay.
• By 2012, all new development will meet or exceed regional standards for Water Sensitive Urban Design for pollutant load reduction and flow management.
Measures • Most Brisbane businesses use water supplied from alternative sources.
• By 2012, the average annual use of the reticulated water supply by Brisbane’s community will be within 10% of 200 litres per person per day during periods when no restrictions are in place.
• 50% of properties use alternative water supplies.
• The impacts of flooding and other adverse water cycle events are mitigated through built form and new infrastructure.
• Most waste water is reused.
• Health of waterways is improved from 2006 levels.
• No waste water is discharged into the Brisbane River and Moreton Bay.
• Sustainable water use techniques such as Water Sensitive Urban Design and stormwater harvesting are considered for all new infrastructure projects.

24
3 INFRASTRUCTURE FOR BRISBANE
Table 3.1 Objectives and measures (continued)
Energy
INFRASTRUCTURE
Objectives
GROW THE ECONOMY
• Energy infrastructure delivers a reliable, high quality supply of energy at a competitive cost.
• Energy production, capacity, storage, management and distribution infrastructure is rapidly adapted to changing patterns of demand.
BUILD THE COMMUNITY
• Energy supply meets anticipated increase in demand for electricity.
• Reliable energy is available to all residents including in peak periods.
• Energy supply supports sustainable community lifestyle choices.
• Energy prices are affordable for residents.
ENHANCE THE ENVIRONMENT
• Widespread use of energy sourced from renewable energy generation, such as solar, wind, tidal and hydro.
• Increasingly, electricity used will be generated or redeployed through distributed energy resources and renewable energy resources.
• Increased investment to deliver more sustainable energy technologies.
• Brisbane businesses use energy efficiently and use low carbon emission sources.
Measures • Minimise days of disruption to energy supply.
• Electricity supply (transmission and distribution) keeps pace with expected growth in peak demand of 4.1% per annum over the next 10 years (this target includes forecast energy savings from demand management initiatives).
• Demand management initiatives will provide a 10% reduction in peak demand.
• Brisbane is a carbon-neutral city by 2026.
• Renewable power sources meet residential and industry demand.
• Energy efficiency initiatives are incorporated into all major infrastructure works.
Telecommunications
INFRASTRUCTURE
Objectives
GROW THE ECONOMY
• Telecommunications networks allow business and industry to operate more efficiently with increased connectivity between offices, and with remote locations.
• Business and industry throughout Brisbane embrace high speed, bi-directional broadband networks, and use the technology to become more productive and innovative.
BUILD THE COMMUNITY
• Reliable telecommunication networks provide access to learning and information opportunities in the home and workplace.
• Community services are deliveredusing telecommunications technology.
ENHANCE THE ENVIRONMENT
• High speed internet access supports the use of smart-grid technologies encouraging energy efficiency.
• Telecommunications networks facilitate telecommuting including teleconferencing and telemeeting.
Measures • 100% of businesses have easy access to business-grade bi-directional high speed broadband.
• 100% of households have easy access to high speed broadband.
• Most residents have access to a broadband service that supports high-quality telecommuting.
25
3
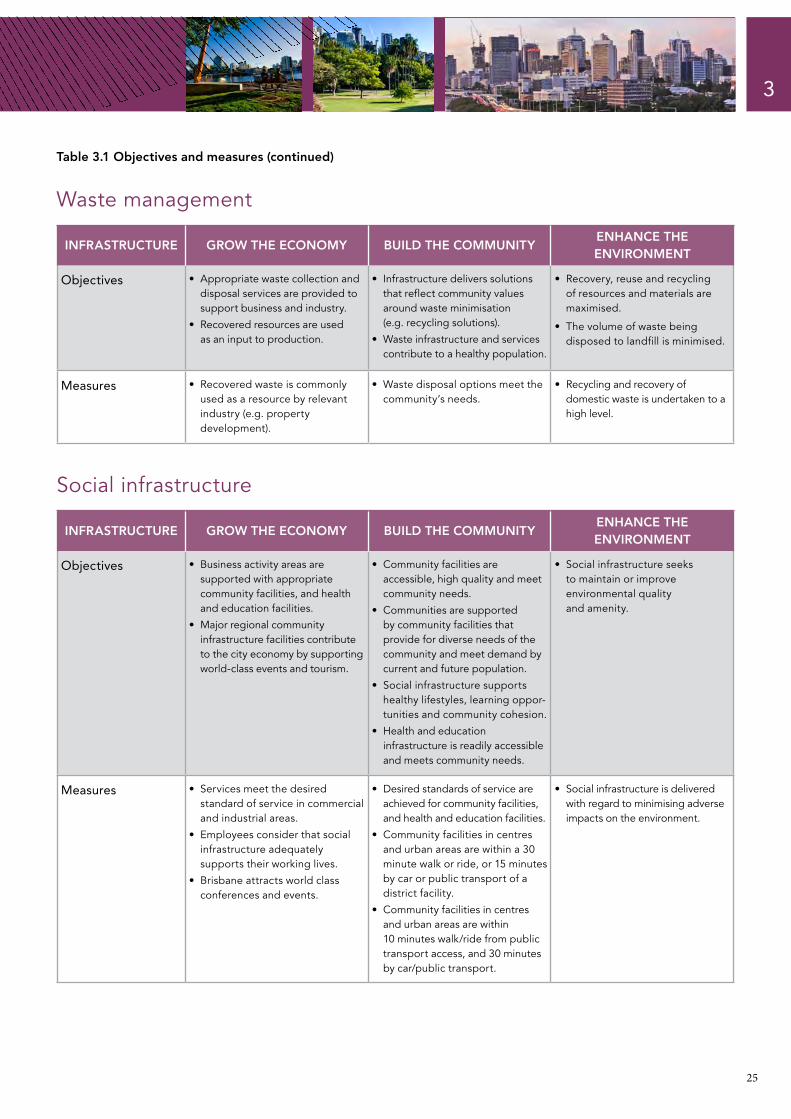
Table 3.1 Objectives and measures (continued)
Waste management
INFRASTRUCTURE
Objectives
GROW THE ECONOMY
• Appropriate waste collection and disposal services are provided to support business and industry.
• Recovered resources are used as an input to production.
BUILD THE COMMUNITY
• Infrastructure delivers solutions that reflect community values around waste minimisation (e.g. recycling solutions).
• Waste infrastructure and services contribute to a healthy population.
ENHANCE THE ENVIRONMENT
• Recovery, reuse and recycling of resources and materials are maximised.
• The volume of waste being disposed to landfill is minimised.
Measures • Recovered waste is commonly used as a resource by relevant industry (e.g. property development).
• Waste disposal options meet the community’s needs.
• Recycling and recovery of domestic waste is undertaken to a high level.
Social infrastructure
INFRASTRUCTURE
Objectives
GROW THE ECONOMY
• Business activity areas are supported with appropriate community facilities, and health and education facilities.
• Major regional community infrastructure facilities contribute to the city economy by supporting world-class events and tourism.
BUILD THE COMMUNITY
• Community facilities are accessible, high quality and meet community needs.
• Communities are supported by community facilities that provide for diverse needs of the community and meet demand by current and future population.
• Social infrastructure supports healthy lifestyles, learning oppor-tunities and community cohesion.
• Health and education infrastructure is readily accessible and meets community needs.
ENHANCE THE ENVIRONMENT
• Social infrastructure seeks to maintain or improve environmental quality and amenity.
Measures • Services meet the desired standard of service in commercial and industrial areas.
• Employees consider that social infrastructure adequately supports their working lives.
• Brisbane attracts world class conferences and events.
• Desired standards of service are achieved for community facilities, and health and education facilities.
• Community facilities in centres and urban areas are within a 30 minute walk or ride, or 15 minutes by car or public transport of a district facility.
• Community facilities in centres and urban areas are within 10 minutes walk/ride from public transport access, and 30 minutes by car/public transport.
• Social infrastructure is delivered with regard to minimising adverse impacts on the environment.
26
3
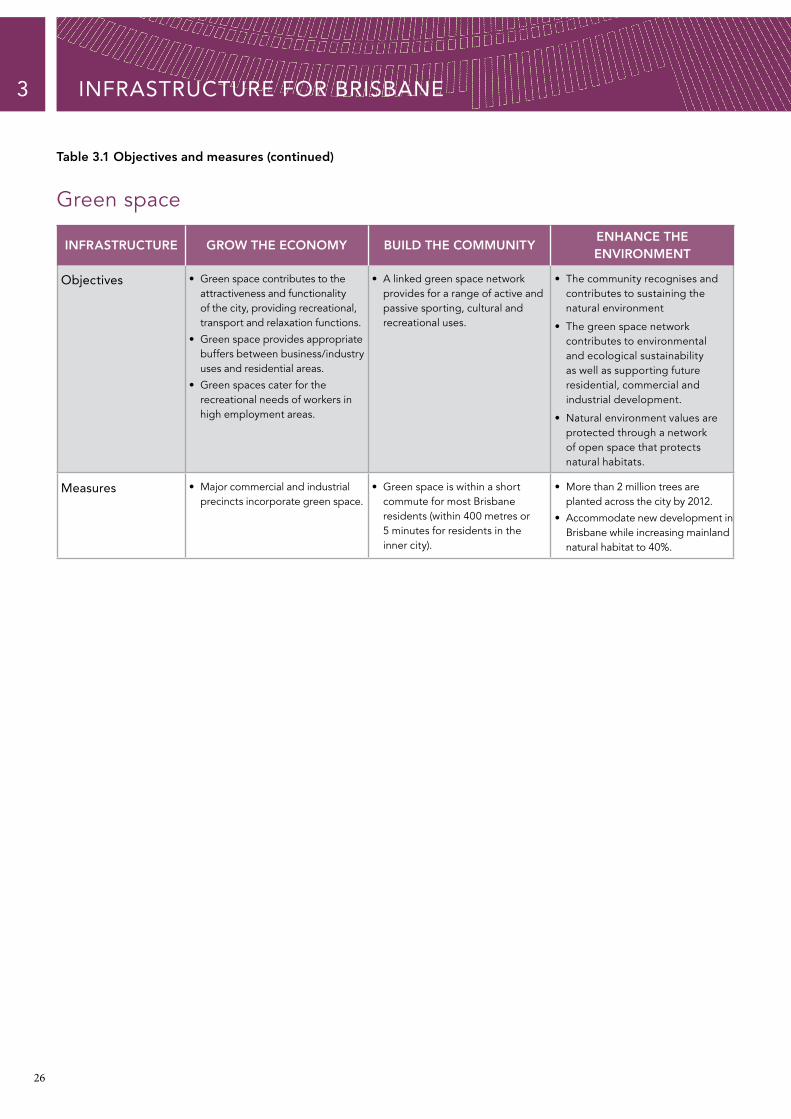
Table 3.1 Objectives and measures (continued)
INFRASTRUCTURE FOR BRISBANE
Green space
INFRASTRUCTURE
Objectives
GROW THE ECONOMY
• Green space contributes to the attractiveness and functionality of the city, providing recreational, transport and relaxation functions.
• Green space provides appropriate buffers between business/industry uses and residential areas.
• Green spaces cater for the recreational needs of workers in high employment areas.
BUILD THE COMMUNITY
• A linked green space network provides for a range of active and passive sporting, cultural and recreational uses.
ENHANCE THE ENVIRONMENT
• The community recognises and contributes to sustaining the natural environment
• The green space network contributes to environmental and ecological sustainability as well as supporting future residential, commercial and industrial development.
• Natural environment values are protected through a network of open space that protects natural habitats.
Measures • Major commercial and industrial precincts incorporate green space.
• Green space is within a short commute for most Brisbane residents (within 400 metres or 5 minutes for residents in the inner city).
• More than 2 million trees are planted across the city by 2012.
• Accommodate new development in Brisbane while increasing mainland natural habitat to 40%.
27
3
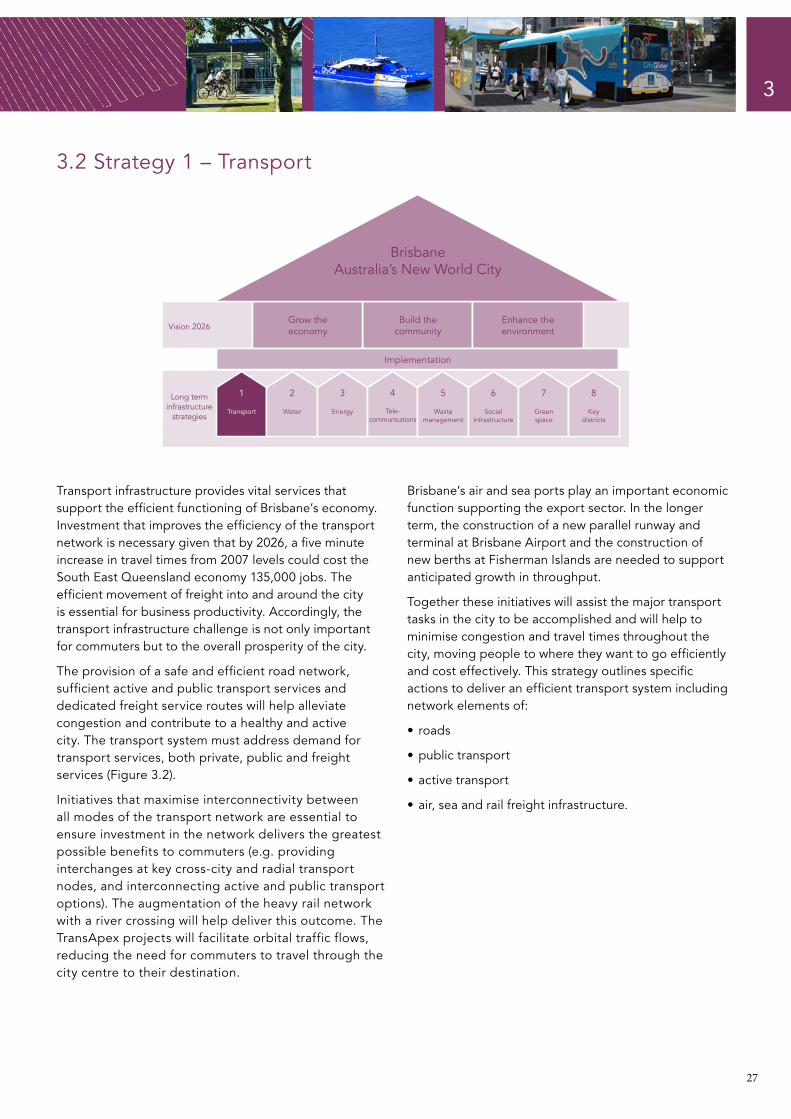
3.2 Strategy 1 – Transport
BrisbaneAustralia’s New World City
Implementation
Vision 2026Grow the economy
Build the community
Enhance the environment
Long term infrastructure
strategies
1
Transport
2
Water
3
Energy
4
Tele- communications
5
Wastemanagement
6
Socialinfrastructure
7
Greenspace
8
Key districts
Transport infrastructure provides vital services that support the efficient functioning of Brisbane’s economy. Investment that improves the efficiency of the transport network is necessary given that by 2026, a five minute increase in travel times from 2007 levels could cost the South East Queensland economy 135,000 jobs. The efficient movement of freight into and around the city is essential for business productivity. Accordingly, the transport infrastructure challenge is not only important for commuters but to the overall prosperity of the city.
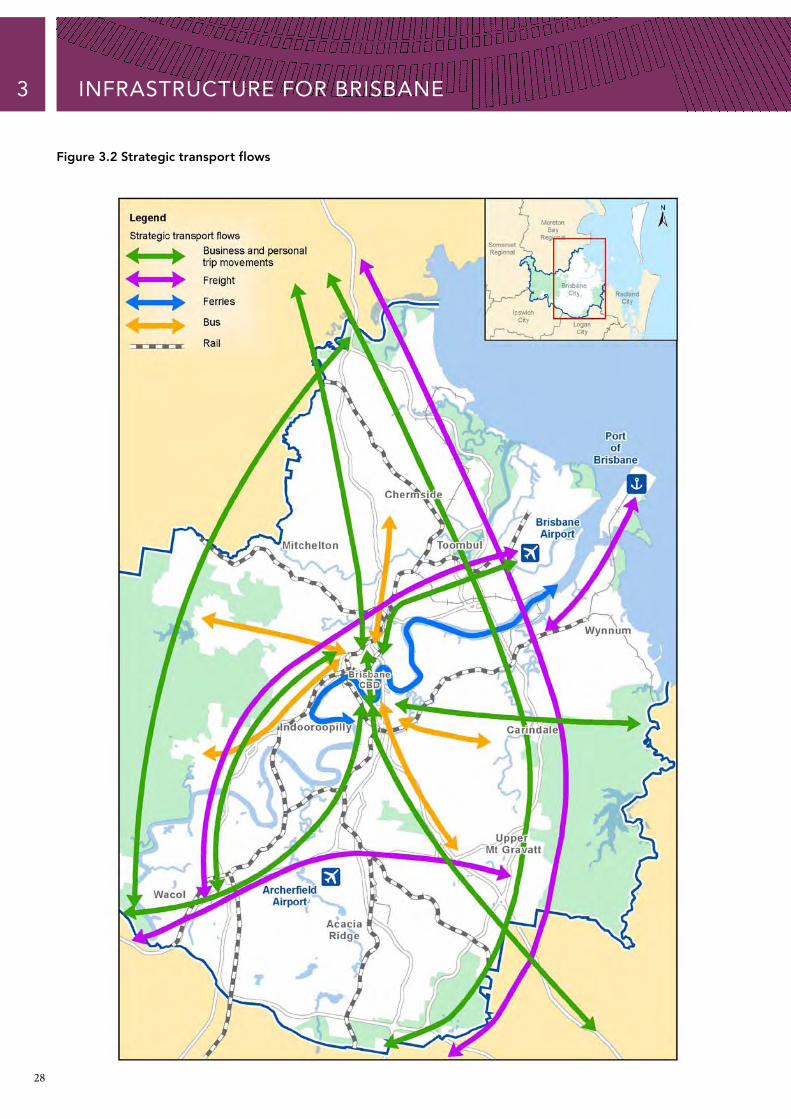
The provision of a safe and efficient road network, sufficient active and public transport services and dedicated freight service routes will help alleviate congestion and contribute to a healthy and active city. The transport system must address demand for transport services, both private, public and freight services (Figure 3.2).
Initiatives that maximise interconnectivity between all modes of the transport network are essential to ensure investment in the network delivers the greatest possible benefits to commuters (e.g. providing interchanges at key cross-city and radial transport nodes, and interconnecting active and public transport options). The augmentation of the heavy rail network with a river crossing will help deliver this outcome. The TransApex projects will facilitate orbital traffic flows, reducing the need for commuters to travel through the city centre to their destination.
Brisbane’s air and sea ports play an important economic function supporting the export sector. In the longer term, the construction of a new parallel runway and terminal at Brisbane Airport and the construction of new berths at Fisherman Islands are needed to support anticipated growth in throughput.
Together these initiatives will assist the major transport tasks in the city to be accomplished and will help to minimise congestion and travel times throughout the city, moving people to where they want to go efficiently and cost effectively. This strategy outlines specific actions to deliver an efficient transport system including network elements of:
• roads
•public transport
•active transport
•air, sea and rail freight infrastructure.
28
3
Figure 3.2 Strategic transport flows
INFRASTRUCTURE FOR BRISBANE

29
3.2.1 Roads
3
Brisbane’s major road network is a series of radial corridors focussed towards the CBD, with some orbital links providing for connections between major employment hubs and shopping locations.
Accordingly, further enhancement to the orbital road network will help reduce congestion in the CBD, redirecting unnecessary vehicle trips away from the city centre. Increasing the number of connections between the north and south of the river will help to alleviate congestion at key pinch points in inner city areas.
Council’s TransApex projects particularly Legacy Way and the completed Clem7 tunnel, will improve orbital connectivity. The recent completion of the Gateway Bridge duplication will help improve connectivity of the north and south of the Brisbane River.
Improving the quality and connectivity of the road network will also contribute to improving safety, congestion and access. Council is committed to tackling congestion in Brisbane in this way, and will not implement a congestion charge.
Technology is expected to play an important role in enhancing the operation of the road network. The continued evolution of Intelligent Transport Systems will provide real-time information to commuters, improving travel choices and enhancing the capacity of transport managers to respond to emerging network issues. The Brisbane Metropolitan Transport Management Centre currently provides real-time traffic information to Council and the Queensland Government on the network.
With most freight transported by road and the volume of freight set to double by 2026, the effective development and management of the freight network is critical to support the efficiency of Brisbane’s road network. Well established road freight routes with intermodal facilities at key interconnection points will help reduce pressure on the road network.
30
3
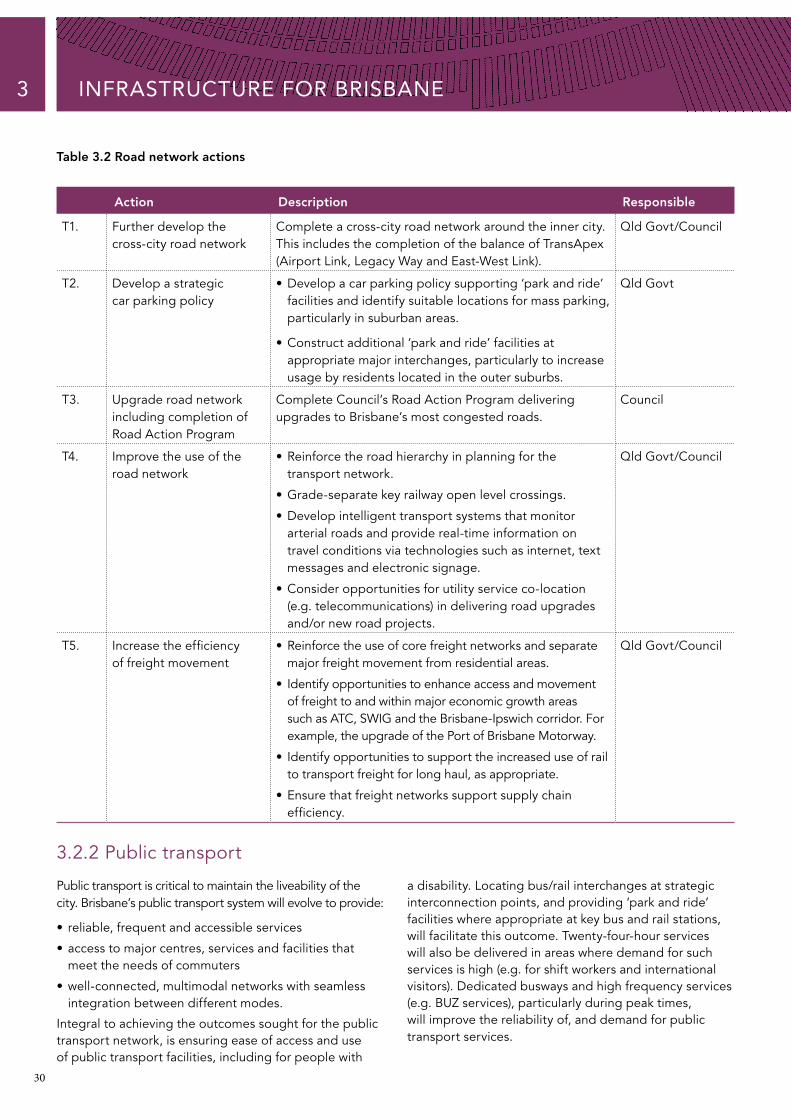
Table 3.2 Road network actions
INFRASTRUCTURE FOR BRISBANE
T1.
Action
Further develop the cross-city road network
Description
Complete a cross-city road network around the inner city. This includes the completion of the balance of TransApex (Airport Link, Legacy Way and East-West Link).
Responsible
Qld Govt/Council
T2. Develop a strategic car parking policy
•Develop a car parking policy supporting ‘park and ride’ facilities and identify suitable locations for mass parking, particularly in suburban areas.
•Construct additional ‘park and ride’ facilities at appropriate major interchanges, particularly to increase usage by residents located in the outer suburbs.
Qld Govt
T3. Upgrade road network including completion of Road Action Program
Complete Council’s Road Action Program delivering upgrades to Brisbane’s most congested roads.
Council
T4. Improve the use of the road network
•Reinforce the road hierarchy in planning for the transport network.
•Grade-separate key railway open level crossings.
• Develop intelligent transport systems that monitor arterial roads and provide real-time information on travel conditions via technologies such as internet, text messages and electronic signage.
•Consider opportunities for utility service co-location (e.g. telecommunications) in delivering road upgrades and/or new road projects.
Qld Govt/Council
T5. Increase the efficiency of freight movement
•Reinforce the use of core freight networks and separate major freight movement from residential areas.
• Identify opportunities to enhance access and movement of freight to and within major economic growth areas such as ATC, SWIG and the Brisbane-Ipswich corridor. For example, the upgrade of the Port of Brisbane Motorway.
• Identify opportunities to support the increased use of rail to transport freight for long haul, as appropriate.
•Ensure that freight networks support supply chain efficiency.
Qld Govt/Council
3.2.2 Public transport
Public transport is critical to maintain the liveability of the city. Brisbane’s public transport system will evolve to provide:
• reliable, frequent and accessible services
•a ccess to major centres, services and facilities that meet the needs of commuters
•well-connected, multimodal networks with seamless integration between different modes.
Integral to achieving the outcomes sought for the public transport network, is ensuring ease of access and use of public transport facilities, including for people with
a disability. Locating bus/rail interchanges at strategic interconnection points, and providing ‘park and ride’ facilities where appropriate at key bus and rail stations, will facilitate this outcome. Twenty-four-hour services will also be delivered in areas where demand for such services is high (e.g. for shift workers and international visitors). Dedicated busways and high frequency services (e.g. BUZ services), particularly during peak times, will improve the reliability of, and demand for public transport services.

31
3
Frequent and reliable services between areas of high population and employment growth will contribute to improved employment outcomes and boost economic activity. The CityGlider bus rapid transit service provides a fast and prioritised service between key commercial areas of the greater CBD. The Cross River Rail and subway projects outlined in the Queensland Government’s Connecting SEQ 2031 are intended to provide a longer term solution to rapid transit and expand capacity of the rail network with a second inner city river rail crossing. However, with the very high expected cost of Cross River Rail questions remain about the affordability and viability of the project. Council’s proposed Suburbs 2 City Buslink
aims to address bus capacity issues into the CBD. The 3.6km Suburbs 2 City Buslink will go from South Brisbane to Fortitude Valley through the CBD. It will provide a bus-only bridge across the Brisbane River, separating buses from other traffic, and will link up with the existing underground bus network.
Construction of the new Darra to Springfield rail line and subsequent extension to Ipswich will deliver improved public transport services to Richlands and Springfield. Australia TradeCoast should also be considered as a priority for public transport services (refer ATC strategy Section 3.9.2).
Table 3.3 Public transport actions
T6.
Action
Introduce a rapid transit service in the CBD
Description
Implement high frequency services linking major commercial precincts of the greater CBD. The CityGlider service is the first step in supporting this strategy, with longer term solutions including subway and heavy rail solutions outlined in Connecting SEQ 2031.
Responsible
Qld Govt/Council
T7. Increase the capacity of the bus network
Construct a segregated busway network as well as investigating opportunities for signal priority and quicker loading times. Increase inner city bus capacity through further river crossings for buses and providing inner city layovers. Future locations for bus depots also need to be identified.
Qld Govt/Council
T8. Increase the capacity of the rail network
• Implement the proposed Cross River Rail project, as outlined in Connecting SEQ 2031, to provide sufficient capacity to cater for anticipated demand for rail services.
• Investigate opportunities to increase capacity of passenger and freight rail infrastructure (e.g. using tailored rolling stock and network separation for different levels of service).
Qld Govt
T9. Enhance multimodal transport systems
• Integrate pedestrian and cyclist networks (including bike facilities) into public transport corridors and modal interchanges.
•Develop further intermodal passenger facilities to increase overall system capacity.
Qld Govt/Council
T10. Develop additional services to support future major employment and tourism centres
•Assess and implement solutions to deliver premium public transport options to support major future employment centres (e.g. ATC).
• Investigate the need for a major ferry terminal linking Brisbane CBD to Moreton Bay and Islands.
•Provide 24-hour public transport services to cater for increasing demand in areas such as Brisbane Airport and Australia TradeCoast.
Qld Govt/Council

32
3.2.3 Active transport
3
Brisbane’s growing active transport network provides a healthy and efficient transport service. Walking and cycling infrastructure provides an attractive, convenient and safe travel option, supported by readily accessible information, and mid-journey and end-of-trip facilities.
Active transport facilities will connect to major employment precincts, shopping areas, schools, universities, major recreation and cultural destinations. Providing good connections and facilities at major public transport nodes will also encourage active transport trips, particularly over short to medium distances.
Once complete, Brisbane’s ever-increasing network of bikeways will complement 4000km of footpath in the pedestrian network.
Promoting active transport through education, and creating walkable and cycle-friendly neighbourhoods around public transport nodes, will encourage use of the network. In key employment nodes where densities support such initiatives, prioritising pedestrian traffic and improving access to key public transport nodes will improve the travel experience and journey-to-work times.
Table 3.4 Active transport actions
INFRASTRUCTURE FOR BRISBANE
T11.
Action
Upgrade bus stop and ferry terminal infrastructure to be fully compliant with the Disability Standards for Accessible Public Transport (DSAPT)
Description
Improve accessibility of public transport infrastructure, particularly for those with disabilities or restricted mobility, by ensuring bus stops and ferry terminals meet DSAPT requirements.
Responsible
Council
T12. Promote active transport options
Promote the environmental, health and economic benefits of walking and cycling to transport and recreation (e.g. CityCycle bike hire scheme).
Qld Govt/Council
T13. Prioritise pedestrian traffic in high density, key employment nodes, particularly the CBD
Investigate opportunities to enhance pedestrian connectivity in the CBD.
Qld Govt/Council
T14. Integrated transport programs and projects
•Assess cycling and walking infrastructure options in the construction of transport infrastructure projects (e.g. opportunities for end of trip facilities).
• Identify corridors that can deliver active transport, open space and stormwater/overland flow mitigation solutions.
• I dentify opportunities for on-road bike lanes and/or shared zones in the delivery of road upgrades or new road projects.
Qld Govt/Council
T15. Improved integration with public transport
• Identify improved opportunities for integration between public transport and active transport solutions across the network.
Qld Govt/Council
T16. Provide mid-journey and end-of-trip facilities
•Provide dedicated bicycle and pedestrian storage and change facilities at major public transport nodes (including trains and busway stations) and in commercial buildings.
Qld Govt/ Council/private sector

33
3
Table 3.4 Active transport actions (continued)
T17.
Action
Enhance pedestrian and cyclist safety and personal security
Description
•Prioritise user safety and security through the implementation of Crime Prevention Through Environmental Design (CPTED) principles.
• Improve pedestrian and cyclist safety at traffic intersections.
Responsible
Qld Govt/Council
T18. Expand the city’s on and off-road bikeway network
•Develop an integrated commuter network.
•Develop local area networks to schools, shops and local community facilities.
•Develop bikeway lighting and wayfinding signage.
Qld Govt/Council
3.2.4 Air, sea and rail freight
Air, sea and rail freight infrastructure will facilitate the development of Brisbane as Australia’s premier east coast trade hub and will support the movement of international and interstate visitors to the region.
Major air, sea and rail freight infrastructure includes QR National’s rail freight network, Brisbane Airport, Archerfield Airport, Port of Brisbane and the Portside Wharf Cruise Ship Terminal.
RailThe capacity of Brisbane’s freight rail network will be increased with the construction of:
• a new rail crossing of the Brisbane River as part of the proposed Cross River Rail Project
•an upgrade to the railway connecting the Port of Brisbane with the Acacia Ridge intermodal terminal as outlined in the Queensland Government’s Connecting SEQ 2031
• new rail/truck intermodal facilities, complementing the capacity of the Acacia Ridge intermodal terminal in the longer term. The Queensland Government in Connecting SEQ 2031, notes that a number of sites have been proposed for this facility including the Bromelton State Development Area south of Brisbane and a new site north of the Brisbane River.
A supply chain approach to planning freight infrastructure will minimise the potential for inefficiencies and bottlenecks in parts of the distribution network. For instance, road networks providing access to the Acacia Ridge intermodal facility will be designed to complement anticipated growth and the continued efficient operation of the facility.
AirportThe continued efficient operation of Brisbane’s major passenger airport is essential to support growth in tourism and business services.
To support an anticipated increase in demand for services, Brisbane Airport Corporation plans to construct a new runway, parallel to the existing. The runway is expected to be operational by 2020.
A no-curfew status for the airport will continue to provide the necessary flexibility to deliver services that meet consumer needs and contribute to economic growth.
Premium public transport and private transport services to the airport will support an anticipated increase in passengers and goods.
The functioning of Archerfield Airport and the surrounding area also needs to be enhanced to maximise the value of the facility to Brisbane and surrounding regions.
SeaportThe Port of Brisbane Corporation will continue to reclaim land and construct additional berths to meet anticipated growth in throughput.
In the medium to long term, enhancing cruise ship facilities at the port, with appropriate public and private transport connections to the CBD, will contribute to supporting Brisbane’s expanding tourism sector.
Suitable access to the Port of Brisbane at Fisherman Islands by road and rail is critical to the continued efficient operation of the facility. An expansion of the Port of Brisbane Motorway will be required to accommodate an expected increase in vehicle traffic.
34
3 INFRASTRUCTURE FOR BRISBANE
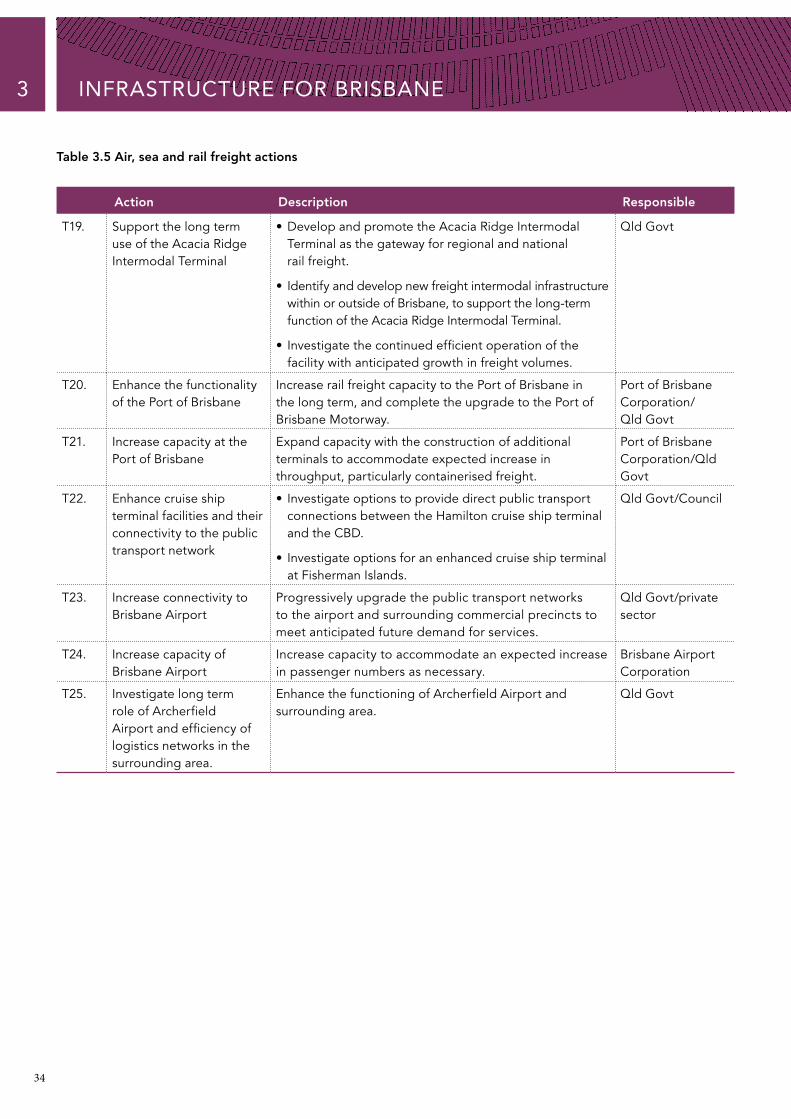
Table 3.5 Air, sea and rail freight actions
T19.
Action
Support the long term use of the Acacia Ridge Intermodal Terminal
Description
•Develop and promote the Acacia Ridge Intermodal Terminal as the gateway for regional and national rail freight.
• Identify and develop new freight intermodal infrastructure within or outside of Brisbane, to support the long-term function of the Acacia Ridge Intermodal Terminal.
• Investigate the continued efficient operation of the facility with anticipated growth in freight volumes.
Responsible
Qld Govt
T20. Enhance the functionality of the Port of Brisbane
Increase rail freight capacity to the Port of Brisbane in the long term, and complete the upgrade to the Port of Brisbane Motorway.
Port of Brisbane Corporation/ Qld Govt
T21. Increase capacity at the Port of Brisbane
Expand capacity with the construction of additional terminals to accommodate expected increase in throughput, particularly containerised freight.
Port of Brisbane Corporation/Qld Govt
T22. Enhance cruise ship terminal facilities and their connectivity to the public transport network
• Investigate options to provide direct public transport connections between the Hamilton cruise ship terminal and the CBD.
• I nvestigate options for an enhanced cruise ship terminal at Fisherman Islands.
Qld Govt/Council
T23. Increase connectivity to Brisbane Airport
Progressively upgrade the public transport networks to the airport and surrounding commercial precincts to meet anticipated future demand for services.
Qld Govt/private sector
T24. Increase capacity of Brisbane Airport
Increase capacity to accommodate an expected increase in passenger numbers as necessary.
Brisbane Airport Corporation
T25. Investigate long term role of Archerfield Airport and efficiency of logistics networks in the surrounding area.
Enhance the functioning of Archerfield Airport and surrounding area.
Qld Govt
35
3
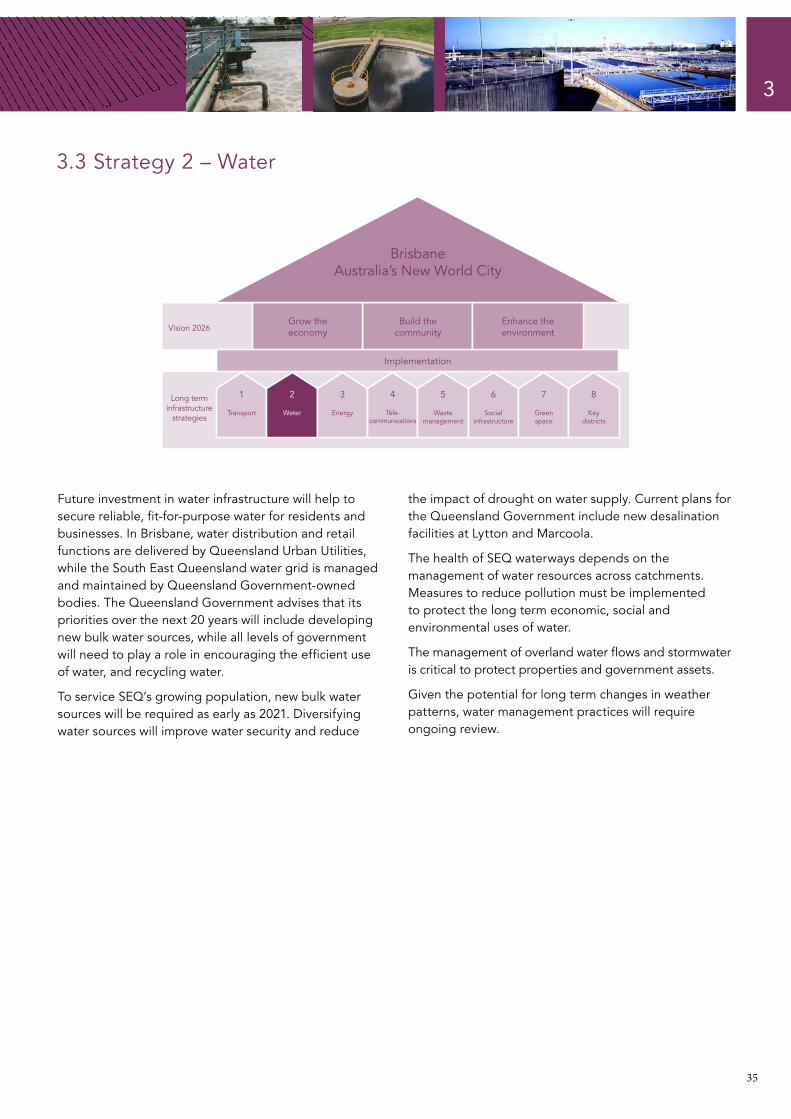
3.3 Strategy 2 – Water
BrisbaneAustralia’s New World City
Implementation
Vision 2026Grow the economy
Build the community
Enhance the environment
Long term infrastructure
strategies
1
Transport
2
Water
3
Energy
4
Tele- communication
5
Wastes management
6
Socialinfrastructure
7
Greenspace
8
Key districts
Future investment in water infrastructure will help to secure reliable, fit-for-purpose water for residents and businesses. In Brisbane, water distribution and retail functions are delivered by Queensland Urban Utilities, while the South East Queensland water grid is managed and maintained by Queensland Government-owned bodies. The Queensland Government advises that its priorities over the next 20 years will include developing new bulk water sources, while all levels of government will need to play a role in encouraging the efficient use of water, and recycling water.
To service SEQ’s growing population, new bulk water sources will be required as early as 2021. Diversifying water sources will improve water security and reduce
the impact of drought on water supply. Current plans for the Queensland Government include new desalination facilities at Lytton and Marcoola.
The health of SEQ waterways depends on the management of water resources across catchments. Measures to reduce pollution must be implemented to protect the long term economic, social and environmental uses of water.
The management of overland water flows and stormwater is critical to protect properties and government assets.
Given the potential for long term changes in weather patterns, water management practices will require ongoing review.
36
3
37
3INFRASTRUCTURE FOR BRISBANE
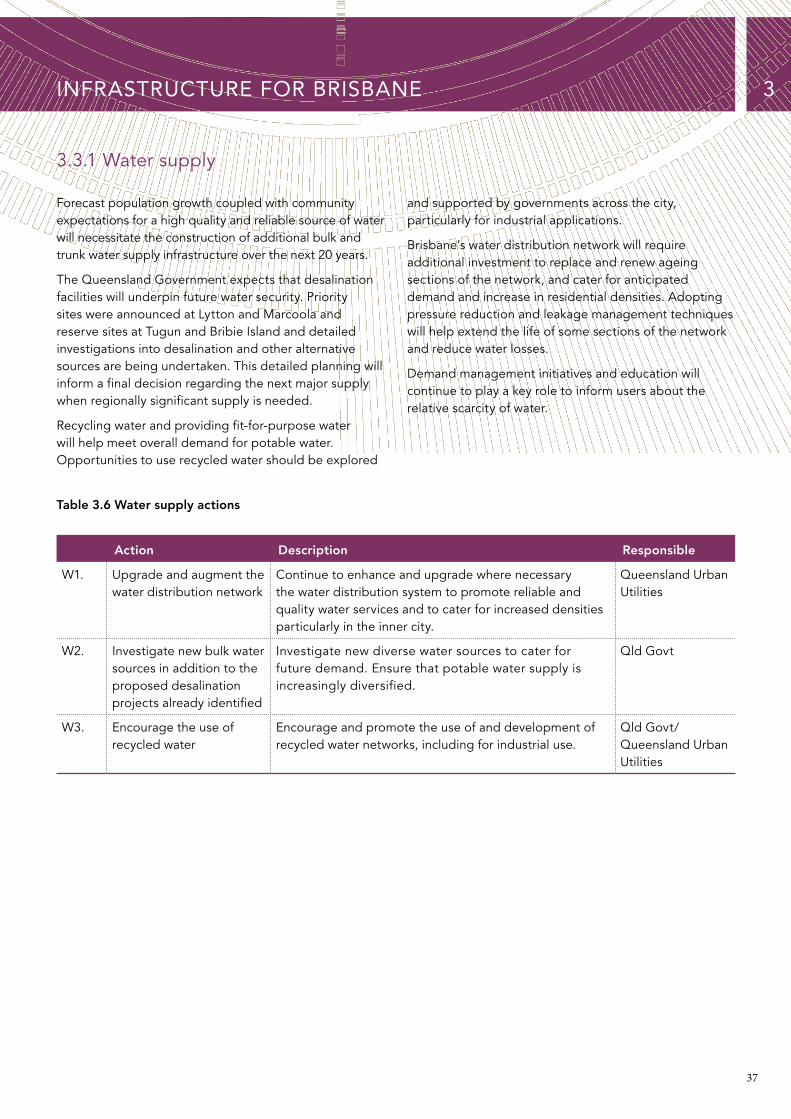
3.3.1 Water supply
Forecast population growth coupled with community expectations for a high quality and reliable source of water will necessitate the construction of additional bulk and trunk water supply infrastructure over the next 20 years.
The Queensland Government expects that desalination facilities will underpin future water security. Priority sites were announced at Lytton and Marcoola and reserve sites at Tugun and Bribie Island and detailed investigations into desalination and other alternative sources are being undertaken. This detailed planning will inform a final decision regarding the next major supply when regionally significant supply is needed.
Recycling water and providing fit-for-purpose water will help meet overall demand for potable water. Opportunities to use recycled water should be explored
and supported by governments across the city, particularly for industrial applications.
Brisbane’s water distribution network will require additional investment to replace and renew ageing sections of the network, and cater for anticipated demand and increase in residential densities. Adopting pressure reduction and leakage management techniques will help extend the life of some sections of the network and reduce water losses.
Demand management initiatives and education will continue to play a key role to inform users about the relative scarcity of water.
Table 3.6 Water supply actions
W1.
Action
Upgrade and augment the water distribution network
Description
Continue to enhance and upgrade where necessary the water distribution system to promote reliable and quality water services and to cater for increased densities particularly in the inner city.
Responsible
Queensland Urban Utilities
W2. Investigate new bulk water sources in addition to the proposed desalination projects already identified
Investigate new diverse water sources to cater for future demand. Ensure that potable water supply is increasingly diversified.
Qld Govt
W3. Encourage the use of recycled water
Encourage and promote the use of and development of recycled water networks, including for industrial use.
Qld Govt/ Queensland Urban Utilities
38
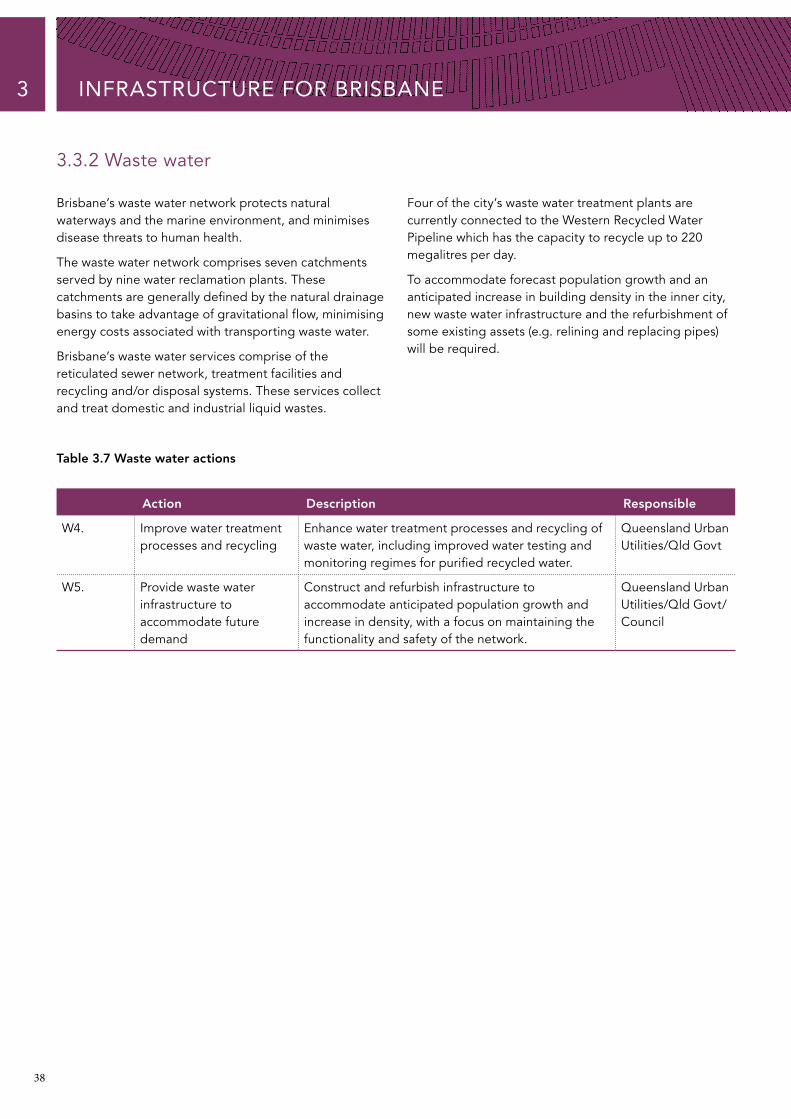
3.3.2 Waste water
3
Brisbane’s waste water network protects natural waterways and the marine environment, and minimises disease threats to human health.
The waste water network comprises seven catchments served by nine water reclamation plants. These catchments are generally defined by the natural drainage basins to take advantage of gravitational flow, minimising energy costs associated with transporting waste water.
Brisbane’s waste water services comprise of the reticulated sewer network, treatment facilities and recycling and/or disposal systems. These services collect and treat domestic and industrial liquid wastes.
Four of the city’s waste water treatment plants are currently connected to the Western Recycled Water Pipeline which has the capacity to recycle up to 220 megalitres per day.
To accommodate forecast population growth and an anticipated increase in building density in the inner city, new waste water infrastructure and the refurbishment of some existing assets (e.g. relining and replacing pipes) will be required.
Table 3.7 Waste water actions
INFRASTRUCTURE FOR BRISBANE
W4.
Action
Improve water treatment processes and recycling
Description
Enhance water treatment processes and recycling of waste water, including improved water testing and monitoring regimes for purified recycled water.
Responsible
Queensland Urban Utilities/Qld Govt
W5. Provide waste water infrastructure to accommodate future demand
Construct and refurbish infrastructure to accommodate anticipated population growth and increase in density, with a focus on maintaining the functionality and safety of the network.
Queensland Urban Utilities/Qld Govt/Council

39
3.3.3 Stormwater
3
Brisbane is a city built on a flood plain with a river that has a history of flooding. The stormwater network is critical in managing runoff from storm events, major flood events and avoiding pollution in our natural waterways and marine waters.
Brisbane’s stormwater system includes a mix of built (pipes, open drains, flow control facilities, stormwater quality improvement devices, etc.) and natural stormwater pathways (waterway corridors, overland flow paths, creeks, rivers and Moreton Bay).
Flood management strategies will respond to more frequent storm events, and improve catchment management to help the community become “flood wise”
and better cope with extreme weather events (e.g. including with the provision of real time information). Strategic infrastructure assets in low lying areas, which may be adversely impacted by extreme weather conditions and sea level rises, should be identified and protected as necessary.
The densification of urban areas will require retrofitting of part of the stormwater drainage network to manage an expected increase in water runoff from impervious areas. Alternative water sources such as stormwater harvesting will provide a water source for industrial and residential users, minimising the impact urban land uses have on the water cycle, protecting waterways from further degradation, and maintaining a good quality water supply.
Table 3.8 Stormwater actions
W6.
Action
Enhance flood management
Description
• Develop enhanced flood management strategies, including engineering and land management practices, to improve safety during flood events and reduce impacts of flooding on people and property.
•E nsuring stormwater drainage systems operate at optimal capacity and reduce the amount of stormwater pollutants entering waterways
• Identify ways to capture water runoff reducing the impact of flooding on highly impacted areas.
Responsible
Queensland Urban Utilities/Qld Govt/Council
W7. Expand stormwater retention and harvesting capabilities
• Identify and promote stormwater retention and harvesting projects in new and existing developments and infrastructure projects, particularly for large outdoor uses and other uses that do not require potable water.
• Invest in the research and development of stormwater harvesting technologies
•Maximise surface water infiltration and minimise stormwater runoff and pollutants from urban areas.
•Minimise changes to the natural hydrological or environmental flow regimes to mimic natural water cycles.
Council
W8. Examine the susceptibility to flood and sea level rise of strategic infrastructure assets
Conduct an assessment of the possible impact of a long term increase in storm frequency and sea level rises on the flood immunity of areas where key infrastructure is or is likely to be located in the long term across the city (e.g. ATC).
Council/Qld Govt/ Australian Govt
W9. Promote water sensitive urban design
Promote and support water sensitive urban design that minimises negative urban environment impacts on the water cycle in all built forms including infrastructure.
Council/Qld Govt
40
3
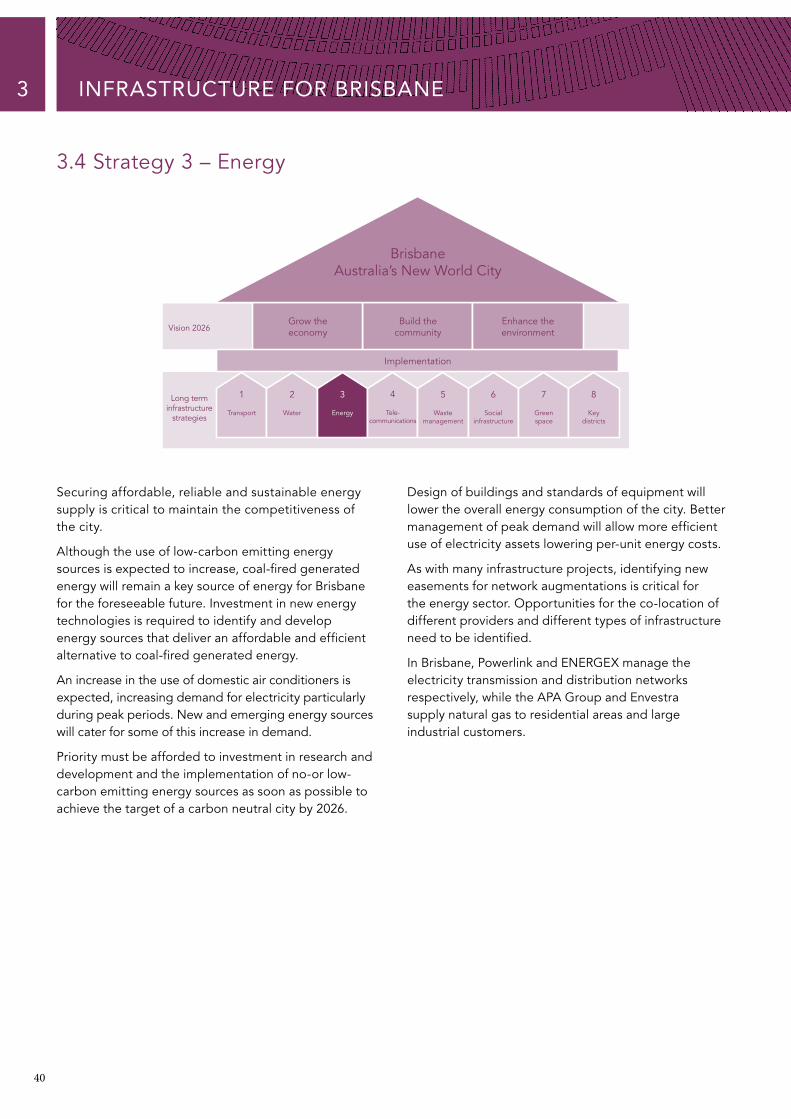
3.4 Strategy 3 – Energy
INFRASTRUCTURE FOR BRISBANE
c
BrisbaneAustralia’s New World City
Implementation
Vision 2026Grow the economy
Build the community
Enhance the environment
Long term infrastructure
strategies
1
Transport
2
Water
3
Energy
4
Tele- ommunications
5
Wastemanagement
6
Socialinfrastructure
7
Greenspace
8
Key districts
Securing affordable, reliable and sustainable energy supply is critical to maintain the competitiveness of the city.
Although the use of low-carbon emitting energy sources is expected to increase, coal-fired generated energy will remain a key source of energy for Brisbane for the foreseeable future. Investment in new energy technologies is required to identify and develop energy sources that deliver an affordable and efficient alternative to coal-fired generated energy.
An increase in the use of domestic air conditioners is expected, increasing demand for electricity particularly during peak periods. New and emerging energy sources will cater for some of this increase in demand.
Priority must be afforded to investment in research and development and the implementation of no-or low-carbon emitting energy sources as soon as possible to achieve the target of a carbon neutral city by 2026.
Design of buildings and standards of equipment will lower the overall energy consumption of the city. Better management of peak demand will allow more efficient use of electricity assets lowering per-unit energy costs.
As with many infrastructure projects, identifying new easements for network augmentations is critical for the energy sector. Opportunities for the co-location of different providers and different types of infrastructure need to be identified.
In Brisbane, Powerlink and ENERGEX manage the electricity transmission and distribution networks respectively, while the APA Group and Envestra supply natural gas to residential areas and large industrial customers.

41
3
3.4.1 Electricity
Growth in residential, commercial and industrial demand for energy is expected to result in an increase in demand for electricity over the next 20 years, particularly during peak periods. The need to cater for electricity demand in peak periods dictates the required capacity of the network.
Given current electricity demand forecasts, the existing 275kV transmission network that supplies Brisbane and the rest of SEQ is anticipated to reach maximum capacity by 2015.
An expansion to the existing transmission network will be required to accommodate forecast growth and an expected increase in peak demand. Powerlink plans
to build a 500kV transmission line to service Brisbane by 2014. In addition, future substation augmentation projects, including new substations and upgrades at existing substations and lines, will increase transmission capacity into Brisbane.
A program of renewal and investment in ageing electricity assets will also enhance network reliability and security.
Education will continue to play a key role in managing demand for electricity. Smart grid technology will improve the management of peak loads, deferring costly investment in the network required to accommodate demand during these periods.
Table 3.9 Electricity transmission and distribution actions
E1.
Action
Construct a new 500kV transmission line
Description
Construct a 500kV line by 2014.
Responsible
Powerlink
E2. Augment the electricity network to deliver reliable services to high employment growth and industrial areas
Augment the network to cater for anticipated demand and maintain service reliability, particularlto key employment growth and industrial areas anduring peak periods.
y d
Powerlink/ ENERGEX
E3. Asset replacement programs/network replacements
Maintain and/or replace the existing transmission and distribution assets to meet forecasted demand.
Powerlink/ ENERGEX
E4. Invest in smart meter technology
Invest in smart meter technology to enhance the management of peak load demand.
ENERGEX/ Qld Govt
42
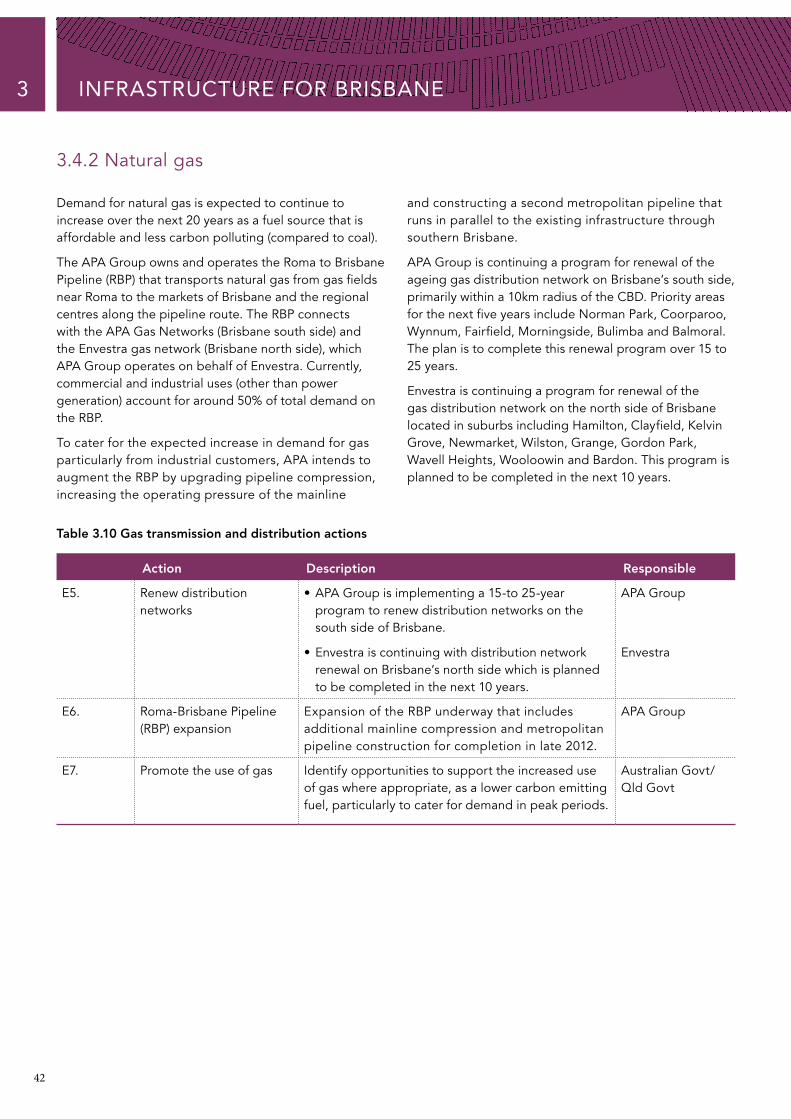
3.4.2 Natural gas
3
Demand for natural gas is expected to continue to increase over the next 20 years as a fuel source that is affordable and less carbon polluting (compared to coal).
The APA Group owns and operates the Roma to Brisbane Pipeline (RBP) that transports natural gas from gas fields near Roma to the markets of Brisbane and the regional centres along the pipeline route. The RBP connects with the APA Gas Networks (Brisbane south side) and the Envestra gas network (Brisbane north side), which APA Group operates on behalf of Envestra. Currently, commercial and industrial uses (other than power generation) account for around 50% of total demand on the RBP.
To cater for the expected increase in demand for gas particularly from industrial customers, APA intends to augment the RBP by upgrading pipeline compression, increasing the operating pressure of the mainline
and constructing a second metropolitan pipeline that runs in parallel to the existing infrastructure through southern Brisbane.
APA Group is continuing a program for renewal of the ageing gas distribution network on Brisbane’s south side, primarily within a 10km radius of the CBD. Priority areas for the next five years include Norman Park, Coorparoo, Wynnum, Fairfield, Morningside, Bulimba and Balmoral. The plan is to complete this renewal program over 15 to 25 years.
Envestra is continuing a program for renewal of the gas distribution network on the north side of Brisbane located in suburbs including Hamilton, Clayfield, Kelvin Grove, Newmarket, Wilston, Grange, Gordon Park, Wavell Heights, Wooloowin and Bardon. This program is planned to be completed in the next 10 years.
Table 3.10 Gas transmission and distribution actions
INFRASTRUCTURE FOR BRISBANE
E5.
Action
Renew distribution networks
Description
•APA Group is implementing a 15-to 25-year program to renew distribution networks on the south side of Brisbane.
•Envestra is continuing with distribution network renewal on Brisbane’s north side which is planned to be completed in the next 10 years.
Responsible
APA Group
Envestra
E6. Roma-Brisbane Pipeline (RBP) expansion
Expansion of the RBP underway that includes additional mainline compression and metropolitan pipeline construction for completion in late 2012.
APA Group
E7. Promote the use of gas Identify opportunities to support the increased use of gas where appropriate, as a lower carbon emitting fuel, particularly to cater for demand in peak periods.
Australian Govt/Qld Govt

43
3.5 Strategy 4 – Telecommunications
3
BrisbaneAustralia’s New World City
Vision 2026Grow the economy
Build the community
Enhance the environment
Implementation
Long term infrastructure
strategies
1
Transport
2
Water
3
Energy
4
Tele- communications
5
Wastemanagement
6
Socialinfrastructure
7
Greenspace
8
Key districts
Telecommunications services and information technology are critical to delivering services that will drive productivity and enhance Brisbane’s position as Australia’s New World City. Applications delivered over telecommunications networks will assist business operation, improve the management of infrastructure services and contribute to creating smart, connected and engaged communities.
It is important that, where appropriate, Brisbane’s telecommunications network utilises fibre optic technologies that are capable of providing the high bandwidth that is required by modern applications and that the network provides “open access” in commercial and technological terms.
The availability of a high speed fibre-to-the-premises (FTTP) network, particularly to large commercial precincts, is essential for the international competitiveness of Brisbane businesses. FTTP technology can combine telephone (VOIP), data transfer (including internet) and vision into one medium.
Businesses, workers and residents will need such infrastructure to telecommute and to support high bandwidth applications and services delivered across the network. This technology also has important implications for delivery of other infrastructure classes such as smart metering for energy. This integrated smart technology approach will help deliver inclusive communities and will lessen demand on a range of infrastructure services (e.g. transport, water and energy) in the longer term.
In April 2009, the Australian Government announced it would roll out a National Broadband Network (NBN). The program will be rolled out progressively across Australia in partnership with the private sector.
As part of the implementation of a NBN, the Australian Government requires the installation of conduit in greenfield estates and in some infill development in readiness for a fibre rollout. New developments, homes and office buildings will be designed to facilitate connection to FTTP networks. In certain locations, such as major roads and bus routes, additional conduit is required for future public community services and utility services including interactive bus stops, public safety CCTV and traffic measurements.
Infrastructure projects should be designed to ensure that in the future, enhanced methods for managing infrastructure can be employed, with the evolution of new technologies (e.g. intelligent transport systems that manage traffic flows and methods for monitoring and managing infrastructure condition).
Major infrastructure projects such as bridges, road widenings and tunnels, will be constructed with conduit to enable the deployment of fibre optic networks to facilitate these new technologies.
Fibre optic networks will be complemented by wireless technologies, providing users with mobile solutions. Mobile communication networks are essential for businesses and the community. This infrastructure is important for mobile voice communication, and increasingly for wireless broadband for smart phones, mobile devices and home computers. Council has a key planning and development approval role in ensuring mobile networks are developed to meet community expectations.
Wi-Fi hot spots in public spaces around Brisbane (e.g. parks) will provide visitors with information about the city.

3

45
3
3.5 Strategy 4 – Telecommunications (continued)
Table 3.11 Telecommunications actions
TC1.
Action
Support the rollout of high speed broadband
Description
Support the rollout of a high speed broadband by providing a supportive legislative and administrative framework.
Responsible
All government
TC2. Install fibre-ready conduit in new developments
Install a future-proof system of conduits in new developments, so all premises can be readily connected to optic fibre. Additional conduit in certain locations, such as major roads and bus routes, will be required.
Private sector/ all government
TC3. Install FTTP in new developments
Install fibre optic cable in new developments, as appropriate.
Private sector/all government
TC4. Install telecommunications conduit in all suitable works projects
Install conduit in all suitable works projects to accommodate future conduit requirements for the rollout of FTTP networks.
All government
TC5. Adopt technologies that enhance the management and use of infrastructure
Investigate emerging information technology applications (e.g. intelligent transport systems) to monitor the condition of infrastructure and optimise use.
All government
TC6. Promote building designs that support fibre networks
Ensure building design codes facilitate connection to FTTP networks.
Qld Govt
TC7. Promote investment in open-access fibre optic networks
Support the development of commercially and technologically open networks, particularly in areas with high commercial demand.
All government/ private sector

46
3
3.6 Strategy 5 – Waste management
INFRASTRUCTURE FOR BRISBANE
c
BrisbaneAustralia’s New World City
Vision 2026Grow the economy
Build the community
Enhance the environment
Implementation
Long term infrastructure
strategies
1
Transport
2
Water
3
Energy
4
Tele- ommunications
5
Wastemanagement
6
Socialinfrastructure
7
Greenspace
8
Key districts
Waste management maintains good public health and environmental outcomes. The focus of future waste management is based on resource recovery and beneficial reuse of resources.
Current waste management infrastructure includes the Brisbane landfill, four waste transfer stations and three material recycling facilities.
With a target to recycle or reuse 90% of waste by 2026, the following measures are required:
• reduce the volume of waste being disposed to landfill
•maximise the recovery, reuse and recycling of resources from Brisbane’s waste streams
•educate residents on how to avoid and minimise waste and prevent litter
•provide world class waste management infrastructure and services.
Brisbane will progressively move away from waste disposal to waste minimisation, beneficial reuse and resource recovery. To achieve this, alternate waste
technologies and resource recovery facilities will be needed with consideration to:
• the location of these facilities near access to major transport routes
• facility management (private and public operators)
•supporting high population growth areas
• the type of resources to be collected (e.g. organic waste, construction and demolition materials, electronics).
Brisbane will need to continue operation of a landfill, and the identification of a replacement for the existing landfill site must be a priority in the medium term. An upgrade of existing transfer stations is needed.
With population growth and limited land availability, it is evident that a regional approach to waste management is necessary to meet demand from Brisbane and surrounding areas. Council is working with other local governments in South East Queensland to identify opportunities for shared waste facilities. New sites should be protected with appropriate buffer zones from residential areas.
Table 3.12 Waste management actions
WM1.
Action
Identify and secure locations for regional waste management facilities
Description
Identify new locations for waste management facilities to service SEQ in conjunction with other local councils.
Responsible
Council
WM2. Develop and implement alternative waste technologies
Evaluate appropriate alternative waste management technologies and identify a preferred long term integrated management approach, with an emphasis on resource recovery and reuse.
Council

47
3
3.7 Strategy 6 – Social infrastructure
Social infrastructure provides essential services to maintain the liveability of the city, and support the health and cohesion of Brisbane’s communities.
Council is largely responsible for providing publicly-funded community infrastructure, including community service facilities (community centres, halls and libraries), sport and recreation hubs and art and cultural hubs. These facilities assist in creating community cohesion and attract workers to key areas. The Queensland Government provides major health and education facilities, major cultural venues including the Gallery of Modern Art, Queensland Museum, State Library, and major sporting facilities including Suncorp Stadium.
Future community facility planning needs to meet expectations and demand for services, with a focus on areas with rapidly increasingly populations, or where there may be an existing community need for a new or upgraded facility.
Council defines areas where significant new facilities will be located as ‘community hubs’ (refer Figure 3.3). Co-locating community infrastructure will realise synergies in delivery of community facilities, delivering enhanced outcomes for local areas. Community hubs can offer a range of facilities across the community service, arts, cultural, recreation and sports sectors.
Collaboration between different levels of government, community groups and the private sector ensures the effective and cost efficient delivery of community services. Development of facilities for multiple uses is to be encouraged (for example, school halls to provide a venue for community meetings).
Grow the economy
Build the community
Enhance the environment
1
Transport
2
Water
3
Energy
4
Tele- communications
5
Wastemanagement
6
Socialinfrastructure
7
Greenspace
BrisbaneAustralia’s New World City
Implementation
Vision 2026
Long term infrastructure
strategies
8
Key districts

48
3
Figure 3.3 Strategic community hubs
INFRASTRUCTURE FOR BRISBANE
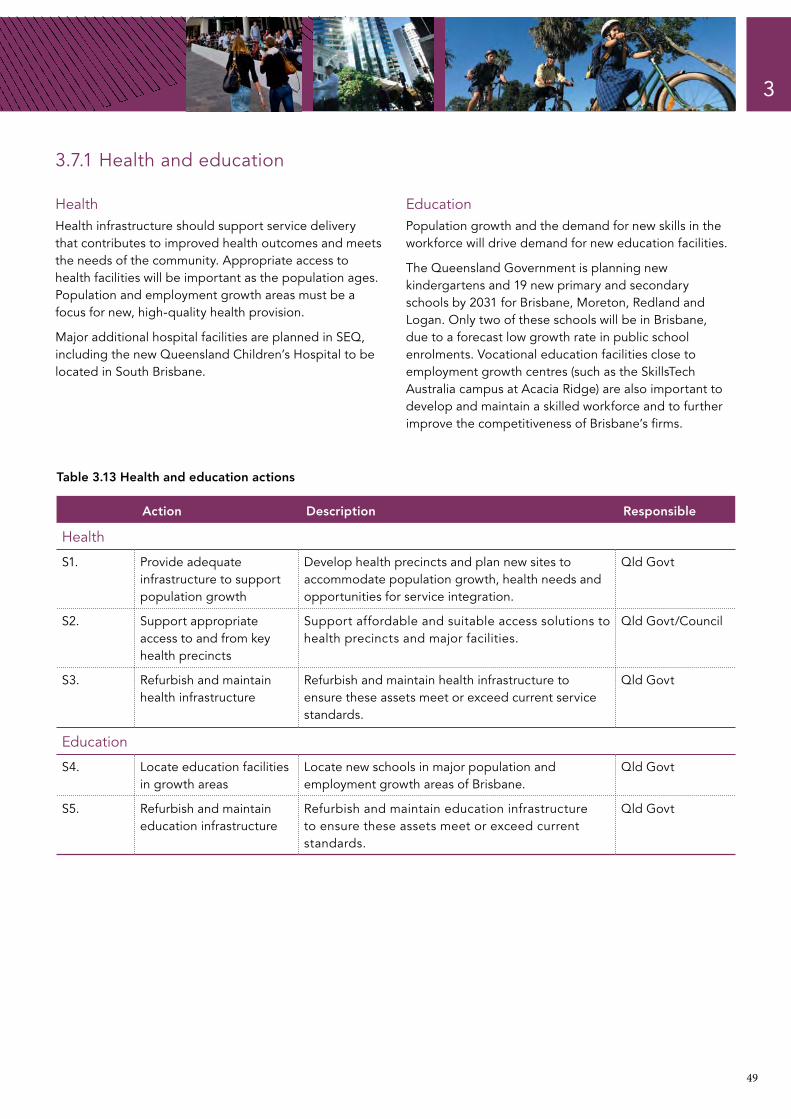
49
3
3.7.1 Health and education
HealthHealth infrastructure should support service delivery that contributes to improved health outcomes and meets the needs of the community. Appropriate access to health facilities will be important as the population ages. Population and employment growth areas must be a focus for new, high-quality health provision.
Major additional hospital facilities are planned in SEQ, including the new Queensland Children’s Hospital to be located in South Brisbane.
EducationPopulation growth and the demand for new skills in the workforce will drive demand for new education facilities.
The Queensland Government is planning new kindergartens and 19 new primary and secondary schools by 2031 for Brisbane, Moreton, Redland and Logan. Only two of these schools will be in Brisbane, due to a forecast low growth rate in public school enrolments. Vocational education facilities close to employment growth centres (such as the SkillsTech Australia campus at Acacia Ridge) are also important to develop and maintain a skilled workforce and to further improve the competitiveness of Brisbane’s firms.
Table 3.13 Health and education actions
Health
S1.
Action
Provide adequate infrastructure to support population growth
Description
Develop health precincts and plan new sites to accommodate population growth, health needs and opportunities for service integration.
Responsible
Qld Govt
S2. Support appropriate access to and from key health precincts
Support affordable and suitable access solutions to health precincts and major facilities.
Qld Govt/Council
S3. Refurbish and maintain health infrastructure
Refurbish and maintain health infrastructure to ensure these assets meet or exceed current service standards.
Qld Govt
Education
S4. Locate education facilities in growth areas
Locate new schools in major population and employment growth areas of Brisbane.
Qld Govt
S5. Refurbish and maintain education infrastructure
Refurbish and maintain education infrastructure to ensure these assets meet or exceed current standards.
Qld Govt
50
3
3.7.2 Community service infrastructure (community centres, community halls and libraries)
Demand for community services will continue to rise as the population grows and expectations increase.
Community facilities often form the nucleus of a wider district or regional community centre. The location and design of community facilities needs to provide ease of access to public and active transport, and proximity to other services and facilities.
Council currently provides 33 fixed location libraries, 24 community halls, and 78 community service centres, of varying size across the city. At community centres, a range of services are provided by Council,
the Queensland Government and private providers (including churches, schools and not-for-profit groups).
The priority is to further develop services in high population growth areas, or where there is an existing unmet need or deficiency in service level.
New innovative low-cost approaches and spaces for community services will be explored to minimise ongoing costs associated with maintaining these assets.
Table 3.14 Community centres, hall and library actions
INFRASTRUCTURE FOR BRISBANE
S6.
Action
Enhance the use of existing community facilities
Description
Identify and act on opportunities to improve the use of existing community facilities, including retrofitting to accommodate new use, or use for multiple purposes.
Responsible
Council/Qld Govt
S7. Invest in existing and new facilities
Expand existing facilities and invest in new facilities (of appropriate location, size, design and management) to cater for community needs.
Council/Qld Govt
S8. Develop partnerships for facility co-delivery
Develop partnerships with local schools, tertiary institutions and business for co-delivery of facilities.
Council/Qld Govt/ private sector

51
3
3.7.3 Art and cultural facilities
Major cultural facilities such as the Queensland Performing Arts Centre, Queensland Art Gallery/Museum, Gallery of Modern Art, Brisbane Entertainment Centre and Brisbane Convention and Exhibition Centre service national, state and regional markets and contribute significantly to supporting Brisbane’s growing convention, exhibition and events industry. Such facilities need to be located in central areas with good access to public transport and accommodation. They also benefit from co-location with similar and related activities to form a defined cultural precinct.
The protection and growth of major cultural precincts such as the Cultural Centre is important to Brisbane’s future economic and community development. Establishing appropriate suburban opportunities for local arts and cultural activities is important to ensure ease and equity of access to facilities, inspiring creativity and cultural pursuits in areas outside of the inner city. Facilities will also be provided to service the ethnic cultural interests of local areas.
Table 3.15 Cultural and art facility actions
S9.
Action
Provide facilities to support a diverse community
Description
Provide adequate cultural and arts facilities to meet the profile of communities throughout Brisbane, including areas with a high proportion of young people, seniors, people with disabilities and people with specific ethnic cultural needs.
Responsible
Council/Qld Govt
S10. Develop partnerships for facility co-delivery
Develop partnerships with local schools, tertiary institutions and business for co-delivery of facilities.
Council/Qld Govt/ private sector
52
3
3.7.4 Sport and recreation facilities
Brisbane has a long history of active participation in sport, both at the community and elite level.
Sporting infrastructure, outdoor and indoor facilities contribute to increasing participation rates in physical activity which delivers health benefits to the community. Increasing physical activity is important to combat obesity and diabetes, and to facilitate mobility in an ageing population.
The right mix of indoor and outdoor sporting facilities is critical to deliver this outcome. Council is primarily involved in providing sporting facilities for local clubs,
while the Queensland Government is responsible for significant stadiums and other major sporting facilities.
Where possible, sporting facilities should be designed to accommodate multiple uses and users, maximising the use of these facilities. For instance, community benefits can be enhanced by harnessing general purpose community facilities (e.g. community halls) for appropriate indoor sports, while grouping facilities for multiple sports can improve both accessibility for users and delivery of maintenance services.
Table 3.16 Sports facility actions
INFRASTRUCTURE FOR BRISBANE
S11.
Action
Support high-growth and emerging communities with sports facilities
Description
•Allocate land and development of sport facilities in high-growth areas and emerging communities.
•Develop new outdoor sport facilities in emerging community areas (including the outer southern suburbs).
Responsible
Council
S12. Enhance the use of existing sporting facilities
Maximise the use of existing sport facilities including identifying opportunities for compatible mixed uses.
Council
S13. Invest in infrastructure to attract major sporting events
Develop sporting facilities to attract major events, including international. Such sporting facilities should be serviced by high-frequency, high-volume transport services. Facilities may be within a short commute to major accommodation and entertainment precincts.
Qld Govt
S14. Develop partnerships to co-deliver sporting facilities
Develop partnerships with schools and tertiary institutions to support the co-delivery of community sport facilities.
Council

53
3.8 Strategy 7 – Green space
3
Brisbane’s green space network contributes to delivering a healthy environment and provides opportunities for residents to recreate and rest. Augmenting the green space network is therefore important to enhance social and environmental outcomes.
Parks, playgrounds, sports fields, natural areas, bushland, wildlife corridors, and some bikeways collectively comprise Brisbane’s green space network.
With anticipated increases in the density of living in the inner city, and anticipated increase in land prices, new and innovative approaches to identifying, protecting and using green spaces are necessary. For instance, there is opportunity to further integrate green spaces with the built environment.
By 2031, the city’s open space network will incorporate:
•a diverse and resilient network of green space while adopting a “no net loss” approach to the protection of existing space
• provide well-connected green spaces accommodating multiple purposes including recreation, transport and ecological processes
•provide spaces that communities can safely and actively enjoy through sporting, cultural and recreation facilities, programs and events.
Table 3.17 Green space actions
G1.
Action
Develop a multi-purpose, linked network of green spaces
Description
• Identify opportunities to develop a functional, multi-purpose and linked network of green spaces.
•Secure appropriate green space as part of new large-scale development projects (infill and greenfield) as appropriate.
Responsible
Council
G2. Support sustainable resource management and use in the development of green spaces
• Incorporate sustainable resource use in green space networks (e.g. stormwater capture, and water and energy conservation measures).
• Incorporate biodiversity, habitat and ecosystem protection into the planning and management of the green space network, where applicable.
Council
Grow the economy
Build the community
Enhance the environment
1
Transport
2
Water
3
Energy
4
Tele- communications
5
Wastemanagement
6
Socialinfrastructure
7
Greenspace
BrisbaneAustralia’s New World City
Implementation
Vision 2026
Long term infrastructure
strategies
8
Key districts
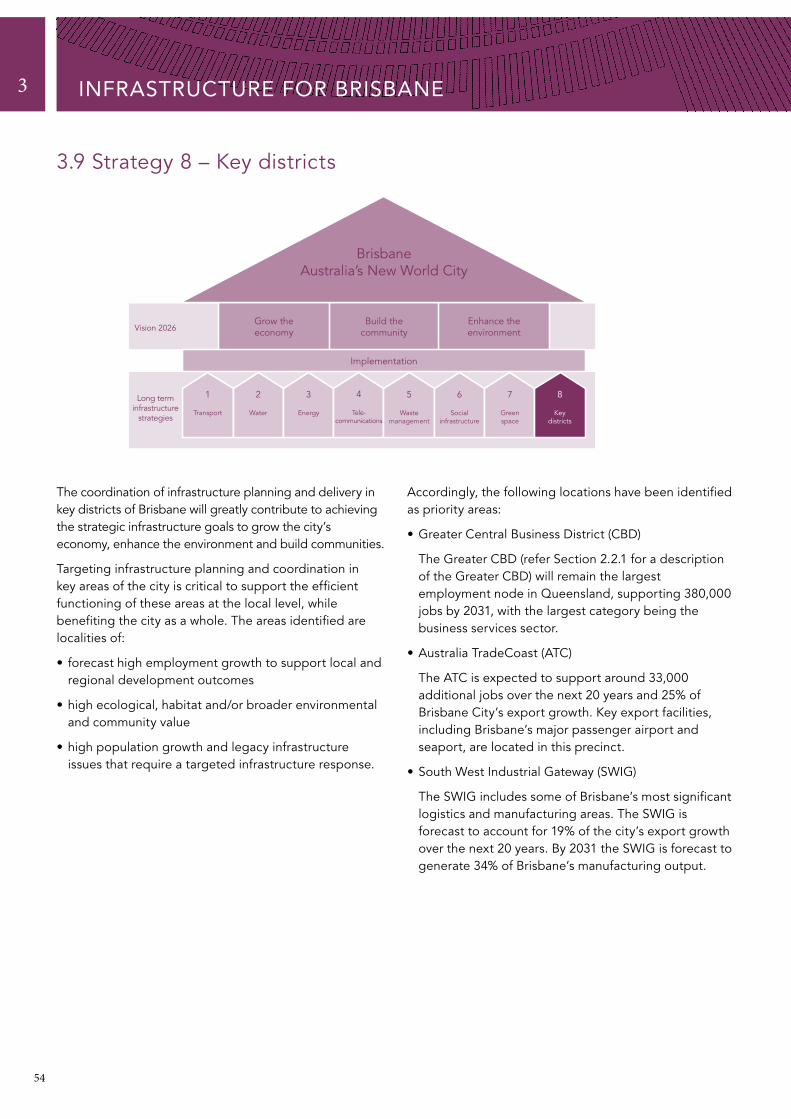
54
3
3.9 Strategy 8 – Key districts
Grow the economy
Build the community
Enhance the environment
1
Transport
2
Water
3
Energy
4
Tele- communications
5
Wastemanagement
6
Socialinfrastructure
7
Greenspace
BrisbaneAustralia’s New World City
Implementation
Vision 2026
Long term infrastructure
strategies
8
Key districts
INFRASTRUCTURE FOR BRISBANE
The coordination of infrastructure planning and delivery in key districts of Brisbane will greatly contribute to achieving the strategic infrastructure goals to grow the city’s economy, enhance the environment and build communities.
Targeting infrastructure planning and coordination in key areas of the city is critical to support the efficient functioning of these areas at the local level, while benefiting the city as a whole. The areas identified are localities of:
• forecast high employment growth to support local and regional development outcomes
•high ecological, habitat and/or broader environmental and community value
•high population growth and legacy infrastructure issues that require a targeted infrastructure response.
Accordingly, the following locations have been identified as priority areas:
•Greater Central Business District (CBD)
The Greater CBD (refer Section 2.2.1 for a description of the Greater CBD) will remain the largest employment node in Queensland, supporting 380,000 jobs by 2031, with the largest category being the business services sector.
• Australia TradeCoast (ATC)
The ATC is expected to support around 33,000 additional jobs over the next 20 years and 25% of Brisbane City’s export growth. Key export facilities, including Brisbane’s major passenger airport and seaport, are located in this precinct.
• South West Industrial Gateway (SWIG)
The SWIG includes some of Brisbane’s most significant logistics and manufacturing areas. The SWIG is forecast to account for 19% of the city’s export growth over the next 20 years. By 2031 the SWIG is forecast to generate 34% of Brisbane’s manufacturing output.

55
3
3.9.1 Greater CBD
Brisbane’s Greater CBD is a significant contributor to the Queensland economy. The challenge for the future is supporting anticipated jobs growth whilst maintaining the liveability of the city.
The Greater CBD includes the area known as the Central Business District, as well as Fortitude Valley, Spring Hill, Milton, South Brisbane, and Woolloongabba (Figure 3.4).
The Greater CBD is a location of diverse activity, as a commercial, retail, cultural and entertainment, education, and tourist centre for the state. Infrastructure solutions must support the diversity of activities in the Greater CBD.
For its effective function, the Greater CBD requires an integrated public transport system, pedestrian and cycle friendly streets and spaces, an orbital road network bypassing the heart of the CBD, and improved integration between the public domain, transport and private development.
Rapid transit solutions for the CBD area include the bus-based CityGlider, the proposed Suburbs 2 City Buslink project which will address bus capacity issues, and rail projects announced by the Queensland Government including Cross River Rail should funding be available.
Active transport will be increasingly used for short trips around the city centre.
The connectivity of the Greater CBD with other employment nodes in SEQ is of central importance, with the CBD providing business services to these areas. High- frequency public transport services to major population growth areas (such as Richlands and Rochedale) are also required, to cater for growing CBD businesses and to provide access to jobs for residents.
Sufficient energy and telecommunications infrastructure is important to continue to support the long-term efficiency and function of the Greater CBD. A high speed bi-directional telecommunications optic fibre network for the Greater CBD will enhance productivity and encourage telecommuting in the longer term as fibre optic cable is rolled out across the city. As the city is the centre for commerce, it is important that the CBD’s networks have significant redundancy to ensure the continued reliable supply of energy and telecommunications infrastructure when sections of the network fail.
Figure 3.4 Greater CBD

56
3
Table 3.18 Greater CBD actions
INFRASTRUCTURE FOR BRISBANE
GCBD1.
Action
Improve the public transport network servicing the Greater CBD
Description
• Identify and develop multi-modal transport hubs and interchanges on the frame of the CBD, including at Milton, Woolloongabba and Bowen Hills, which would be supported by the Cross River Rail project announced in Connecting SEQ 2031
• Identify bus marshalling areas and short-term parking for buses to improve service efficiency in peak periods and during significant events.
•Support the further development of a mass transit system (incorporating CityGlider service) connecting West End, the city centre and Fortitude Valley to support large scale and very-high-frequency passenger movement on bus and rail services.
• Investigate a possible extension of the public transport operating period to 24 hours, seven days a week where demand necessitates the service.
•Construct an inner city subway and support the implementation of the Cross River Rail project, as announced by the Queensland Government in Connecting SEQ 2031 to link key areas of the Greater CBD and provide additional river crossing and stations.
•Construct additional ferry terminals and/or undertake further upgrades to the CityCat fleet.
Responsible
Qld Govt/Council
GCBD2. Identify opportunities and implement policies to support pedestrian prioritisation, active transport and activation of public spaces in Greater CBD.
•Street improvements to be undertaken include:o improving footpathso increased shadingo prioritising pedestrian movement with
signalling and signage to promote wayfinding and route familiarisation, “scatter” crossings (all directions)
o extension of pedestrian-only access on laneways and streets.
• Identify open space corridors to improve pedestrian flow, and additional green and urban areas for recreational and passive uses.
•Extend the cycle network and invest in end-of-trip facilities to promote the take-up of active transport.
•Continue to deploy a bike hire scheme in the city to provide an active transport alternative for transiting the Greater CBD.
• Prioritised signalling and signage on crossings and intersections to increase connectivity and flow of active transport.
Council/Qld Govt
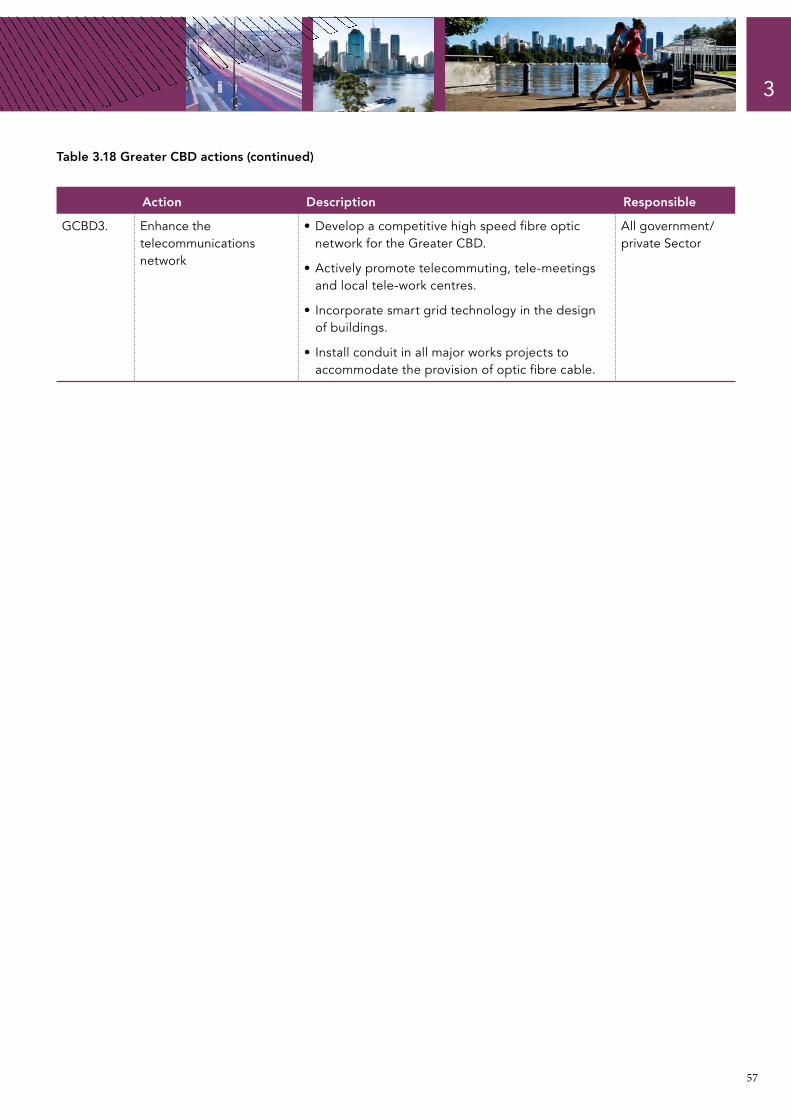
57
3
Table 3.18 Greater CBD actions (continued)
GCBD3.
Action
Enhance the telecommunications network
Description
•Develop a competitive high speed fibre optic network for the Greater CBD.
•Actively promote telecommuting, tele-meetings and local tele-work centres.
• Incorporate smart grid technology in the design of buildings.
• Install conduit in all major works projects to accommodate the provision of optic fibre cable.
Responsible
All government/ private Sector
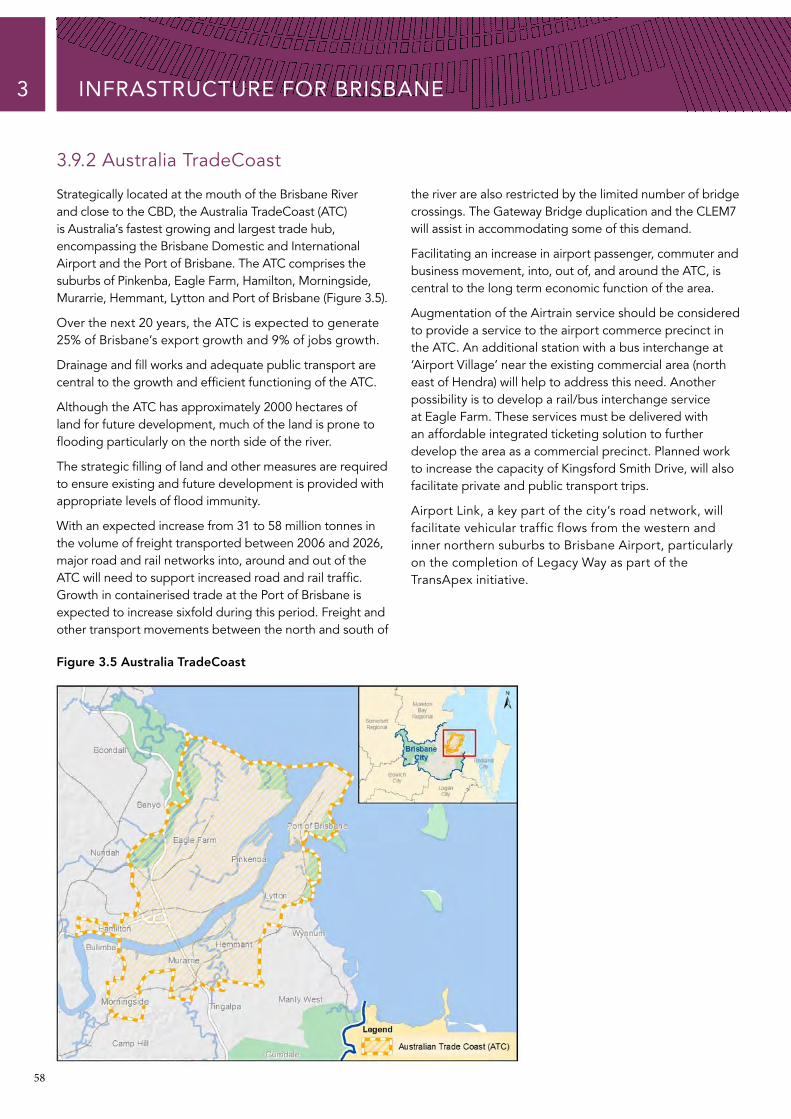
58
3
e
d
3.9.2 Australia TradeCoast
Strategically located at the mouth of the Brisbane River and close to the CBD, the Australia TradeCoast (ATC) is Australia’s fastest growing and largest trade hub, encompassing the Brisbane Domestic and International Airport and the Port of Brisbane. The ATC comprises the suburbs of Pinkenba, Eagle Farm, Hamilton, Morningside, Murarrie, Hemmant, Lytton and Port of Brisbane (Figure 3.5).
Over the next 20 years, the ATC is expected to generate 25% of Brisbane’s export growth and 9% of jobs growth.
Drainage and fill works and adequate public transport are central to the growth and efficient functioning of the ATC.
Although the ATC has approximately 2000 hectares of land for future development, much of the land is prone to flooding particularly on the north side of the river.
The strategic filling of land and other measures are required to ensure existing and future development is provided with appropriate levels of flood immunity.
With an expected increase from 31 to 58 million tonnes in the volume of freight transported between 2006 and 2026, major road and rail networks into, around and out of the ATC will need to support increased road and rail traffic. Growth in containerised trade at the Port of Brisbane is expected to increase sixfold during this period. Freight and other transport movements between the north and south of
the river are also restricted by the limited number of bridgcrossings. The Gateway Bridge duplication and the CLEM7will assist in accommodating some of this demand.
Facilitating an increase in airport passenger, commuter andbusiness movement, into, out of, and around the ATC, is central to the long term economic function of the area.
Augmentation of the Airtrain service should be considereto provide a service to the airport commerce precinct in the ATC. An additional station with a bus interchange at ‘Airport Village’ near the existing commercial area (north east of Hendra) will help to address this need. Another possibility is to develop a rail/bus interchange service at Eagle Farm. These services must be delivered with an affordable integrated ticketing solution to further develop the area as a commercial precinct. Planned work to increase the capacity of Kingsford Smith Drive, will also facilitate private and public transport trips.
Airport Link, a key part of the city’s road network, will facilitate vehicular traffic flows from the western and inner northern suburbs to Brisbane Airport, particularly on the completion of Legacy Way as part of the TransApex initiative.
Figure 3.5 Australia TradeCoast
INFRASTRUCTURE FOR BRISBANE

59
3
Table 3.19 Australia TradeCoast actions
ATC1.
Action
Facilitate increased traffic volumes
Description
•Upgrade Kingsford Smith Drive to six lanes
• Improve connections between the ATC and the South West Industrial Gateway to facilitate movement of freight and workers. The construction of Legacy Way and Airport Link projects will help to achieve this objective.
Responsible
Council/Qld Govt/Federal Govt
ATC2. Expand public and active transport services
• Investigate opportunities for the improved use of the existing rail network (Cleveland Line, disused portion of Pinkenba Line and Airtrain corridor) to provide access for workers to the ATC. Investigate the reinstatement of a full-time rail station at Eagle Farm with a bus interchange servicing the ATC.
•Encourage commuters to the ATC to use public transport.
• Investigate a rail and bus interchange at Airport Village to further enable the area’s operation as a commercial precinct.
• I ncrease affordable public transport options to and from the airport, including potential for a fast 24-hour service connecting the airport to the CBD.
• Increase CityCat services to Hamilton, particularly Northshore Hamilton to cater for anticipated increase in population and demand for services.
• Provide dedicated bus priority services to the region from key trip generator areas, including linking with workers in the southwestern suburbs.
Qld Govt/Council
ATC3. Develop a coordinated approach to energy supply
•Collaborate with energy utilities to ensure appropriate investment in energy infrastructure to support the forecast increase in energy-intensive heavy manufacturing. The ATC Strategic Infrastructure Plan has identified the need for a 275kV transmission line in the next 10-20 years.
• Promote the use of natural gas (southern ATC is adjacent to the Roma Brisbane Pipeline) and renewable energy. Install smart grid technologies to enhance energy demand management.
Qld Govt/ Council/ ENERGEX/ Powerlink/ATC
APA Group
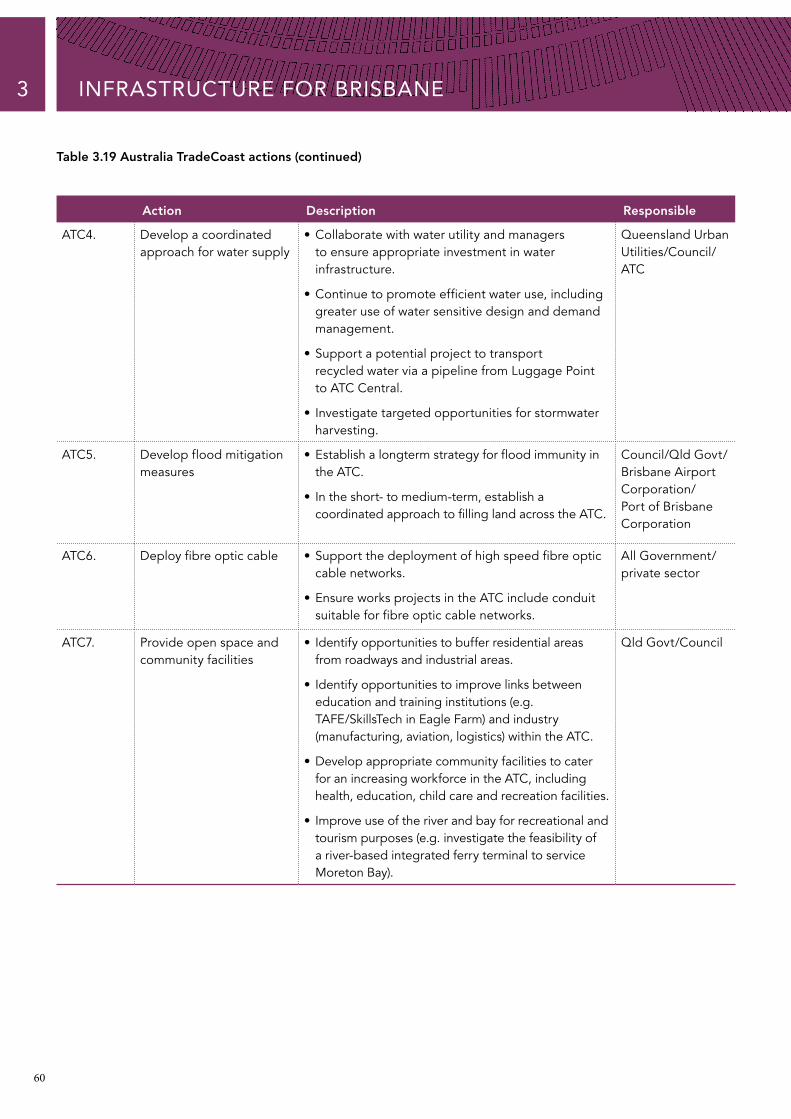
60
3
Table 3.19 Australia TradeCoast actions (continued)
INFRASTRUCTURE FOR BRISBANE
ATC4.
Action
Develop a coordinated approach for water supply
Description
• Collaborate with water utility and managers to ensure appropriate investment in water infrastructure.
•Continue to promote efficient water use, including greater use of water sensitive design and demand management.
•Support a potential project to transport recycled water via a pipeline from Luggage Point to ATC Central.
• Investigate targeted opportunities for stormwater harvesting.
Responsible
Queensland Urban Utilities/Council/ ATC
ATC5. Develop flood mitigation measures
•Establish a longterm strategy for flood immunity in the ATC.
• In the short- to medium-term, establish a coordinated approach to filling land across the ATC.
Council/Qld Govt/ Brisbane Airport Corporation/ Port of Brisbane Corporation
ATC6. Deploy fibre optic cable •Support the deployment of high speed fibre optic cable networks.
•Ensure works projects in the ATC include conduit suitable for fibre optic cable networks.
All Government/ private sector
ATC7. Provide open space and community facilities
• Identify opportunities to buffer residential areas from roadways and industrial areas.
• Identify opportunities to improve links between education and training institutions (e.g. TAFE/SkillsTech in Eagle Farm) and industry (manufacturing, aviation, logistics) within the ATC.
•Develop appropriate community facilities to cater for an increasing workforce in the ATC, including health, education, child care and recreation facilities.
• Improve use of the river and bay for recreational and tourism purposes (e.g. investigate the feasibility of a river-based integrated ferry terminal to service Moreton Bay).
Qld Govt/Council
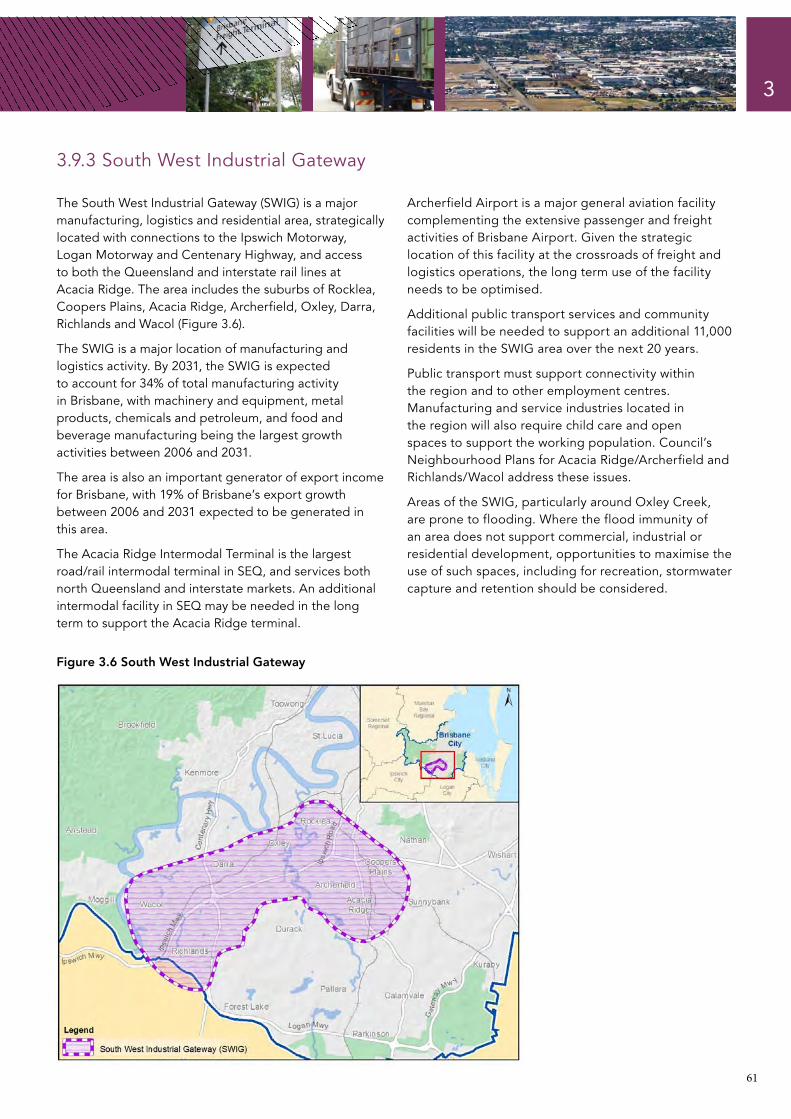
61
3.9.3 South West Industrial Gateway
3
The South West Industrial Gateway (SWIG) is a major manufacturing, logistics and residential area, strategically located with connections to the Ipswich Motorway, Logan Motorway and Centenary Highway, and access to both the Queensland and interstate rail lines at Acacia Ridge. The area includes the suburbs of Rocklea, Coopers Plains, Acacia Ridge, Archerfield, Oxley, Darra, Richlands and Wacol (Figure 3.6).
The SWIG is a major location of manufacturing and logistics activity. By 2031, the SWIG is expected to account for 34% of total manufacturing activity in Brisbane, with machinery and equipment, metal products, chemicals and petroleum, and food and beverage manufacturing being the largest growth activities between 2006 and 2031.
The area is also an important generator of export income for Brisbane, with 19% of Brisbane’s export growth between 2006 and 2031 expected to be generated in this area.
The Acacia Ridge Intermodal Terminal is the largest road/rail intermodal terminal in SEQ, and services both north Queensland and interstate markets. An additional intermodal facility in SEQ may be needed in the long term to support the Acacia Ridge terminal.
Archerfield Airport is a major general aviation facility complementing the extensive passenger and freight activities of Brisbane Airport. Given the strategic location of this facility at the crossroads of freight and logistics operations, the long term use of the facility needs to be optimised.
Additional public transport services and community facilities will be needed to support an additional 11,000 residents in the SWIG area over the next 20 years.
Public transport must support connectivity within the region and to other employment centres. Manufacturing and service industries located in the region will also require child care and open spaces to support the working population. Council’s Neighbourhood Plans for Acacia Ridge/Archerfield and Richlands/Wacol address these issues.
Areas of the SWIG, particularly around Oxley Creek, are prone to flooding. Where the flood immunity of an area does not support commercial, industrial or residential development, opportunities to maximise the use of such spaces, including for recreation, stormwater capture and retention should be considered.
Figure 3.6 South West Industrial Gateway
62
3
Table 3.20 South West Industrial Gateway actions
INFRASTRUCTURE FOR BRISBANE
SWIG1.
Action
Facilitate increased freight and private traffic movement
Description
• Investigate opportunities to improve links between the Ipswich Motorway and the Port of Brisbane to facilitate freight movement and movement of workers to and from the SWIG and the ATC.
• Investigate opportunities to expand the use of service roads on Ipswich Motorway to reduce congestion, removing local traffic from the Motorway.
Responsible
Qld Govt/Council
SWIG2. Expand public and active transport services for the SWIG
•Assess the need for major rail and bus interchanges incorporating active transport end-of-trip facilities, to support use of active and public transport options in the SWIG (including around Richlands).
• Public transport services to cater for shift workers, particularly in high-growth areas (e.g. Springfield).
• Incorporate bikeways into other infrastructure projects to link with existing networks.
Qld Govt/Council
SWIG3. Investigate the long term role of Archerfield Airport
Enhance the functioning of Archerfield Airport Qld Govt/Federal Govt
SWIG4. Invest in appropriate energy infrastructure to service demand
• Ensure appropriate investment in energy infrastructure to support the forecast increase in energy-intensive heavy manufacturing.
• Promote use of natural gas and renewable energy sources in manufacturing production.
Qld Govt/Council
SWIG5. Invest in appropriate water infrastructure to service demand
• Ensure appropriate investment in water infrastructure, including stormwater mitigation.
•Continue to promote efficient water use, including greater use of water sensitive design and demand management.
• Encourage use of recycled water from the nearby Western Recycled Water Pipeline and stormwater harvesting and storage to service industrial needs.
Qld Govt/Council
SWIG6. Improve flood mitigation Through the Development Assessment process and Council’s flood flag mapping, ensure that development takes account of the potential for flooding.
Council
SWIG7. Deploy fibre optic cable networks
• Encourage investment in the installation of high speed fibre optic cable networks to facilitate the connectivity of the SWIG to other areas of Brisbane, and the world.
• Install conduit to provide the right of way for fibre in areas as they develop to facilitate the rollout of a National Broadband Network.
All Government/ private sector
63
Table 3.20 South West Industrial Gateway actions (continued)
3
SWIG8.
Action
Provide open space
Description
•Buffering of residential areas from roadways and industrial areas with open space.
•Examine opportunities to develop an open space network along Oxley Creek addressing natural, recreational and active transport options.
Responsible
Council
SWIG9. Improve the provision of community facilities
• Investigate options to locate high-noise recreation activities, such as trail bikes, in industrial areas.
• Identify opportunities to improve linkages between education and training institutions (e.g. TAFE/SkillsTech) and industry (manufacturing, aviation, logistics) within the SWIG.
•Develop appropriate community facilities to support a growing workforce.
Qld Govt/Council
64
4

65
IMPLEMENTATION 4
Council’s long term infrastructure policy aligns infrastructure planning with the economic, social and environmental aspirations for the city.
The implementation of this Plan will contribute to ensuring that Brisbane’s infrastructure program aligns with the eight infrastructure strategies highlighted, enhancing Australia’s New World City and surrounding regions.
4.1 Implementing Brisbane’s infrastructure strategy This Plan outlines the infrastructure strategies and actions needed to deliver Council’s Living in Brisbane 2026.
The actions outlined for each strategy in Tables 3.2 to 3.20 in Chapter 3, are the investigations and initiatives required to deliver Brisbane’s long term infrastructure policy.
Council will work with infrastructure providers to implement the actions outlined in the Plan.
Council will seek to align infrastructure policy across a range of stakeholders (both public and private) to deliver the strategy articulated in this Plan.
As Brisbane grows, the strategies required to support the city will adapt, as new needs, priorities, initiatives and projects are identified.
4. 2 Brisbane’s infrastructure program
Brisbane’s current infrastructure program is listed in Tables 4.1 to 4.14.
This program highlights the projects which have been announced by different levels of government and major private sector infrastructure providers for the next 20 years.
Council will continually review its infrastructure program to ensure it is aligned to achieve the objectives and key result areas outlined in Table 3.1 in Chapter 3.
Council will continue to strive for transparency and integration of infrastructure planning information, through working with government agencies and private sector organisations involved in the planning and delivery of infrastructure.
Council will update this Plan every five years to ensure the strategies and actions deliver a progressive infrastructure approach and program for the city.
Council will continue to monitor changes in demand for different infrastructure services to deliver a program that meets the city’s future needs. The strategies and programs in this Plan will adapt to meet the changing needs of the community, delivering a strategy that not only provides the community with essential infrastructure services, but also enhances the liveability of the city.
Council will work with stakeholders to regularly update the project tables in Chapter 4, providing infrastructure providers with timely and up-to-date information on the status of major infrastructure projects in Brisbane.
This process will facilitate coordination in the delivery of infrastructure between providers and across different infrastructure classes. This will assist in realising cost savings between multiple projects which are planned for the same location in a similar timeframe.
Cost savings may be achieved through different projects sharing the cost of capital works, such as trenching. The identification of synergies between projects may also lead to the changing in the timing of the delivery of some projects.
Such an approach is also likely to minimise disturbance to Brisbane residents associated with construction, through reducing the delivery time for infrastructure projects.
This plan includes around $44 billion in infrastructure projects planned to support the growth of the city.
Financing this significant infrastructure program is a key concern for Council and other levels of government in delivering the infrastructure needs of the community.
66
4 IMPLEMENTATION
Council will continue to work with co-delivery agencies and funding providers, to identify innovative and lowest-cost options to finance projects.

67
4
Index to infrastructure project tables and figures
Infrastructure class
Brisbane’s major infrastructure projects, 2011-2031
Figure No.
Figure 4.1
Transport Major road network projects
Table No.
Table 4.1
Major public transport projects Table 4.2 Major active transport projects Table 4.3
Figure 4.2
Water Major water supply projects Table 4.4 Figure 4.3 Major waste water projects Table 4.5 Figure 4.4 Major stormwater projects Table 4.6 Figure 4.5
Energy Major electricity projects Table 4.7 Major gas projects Table 4.8
Figure 4.6
Social Major health, education and law enforcement projects Table 4.9 Figure 4.7 Major community hub and integrated facility projects Table 4.10 Figure 4.8 Major community centre, hall and library projects Table 4.11 Figure 4.9 Major cultural and art facility projects Table 4.12 Figure 4.10 Major sports facility projects Table 4.13 Figure 4.11
Green space Major green space projects Table 4.14 Figure 4.12
Key districts Greater CBD projects Table 4.15 Figure 4.13 Australia TradeCoast projects Table 4.16 Figure 4.14 South West Industrial Gateway projects Table 4.17 Figure 4.15
Note: – Information about Queensland Government projects has been sourced from the Queensland Infrastructure Plan
2011 (QIP), the Queensland Transport and Roads Investment Program 2010-11 to 2013-14 (QTRIP) and Connecting SEQ 2031
– Projects listed in Chapter 4 are projects which have been announced by the relevant sponsor. This does not mean that every project listed is fully funded. Projects are subject to changes in costing and timing.
– Not all projects listed in Chapter 4 are depicted on the maps
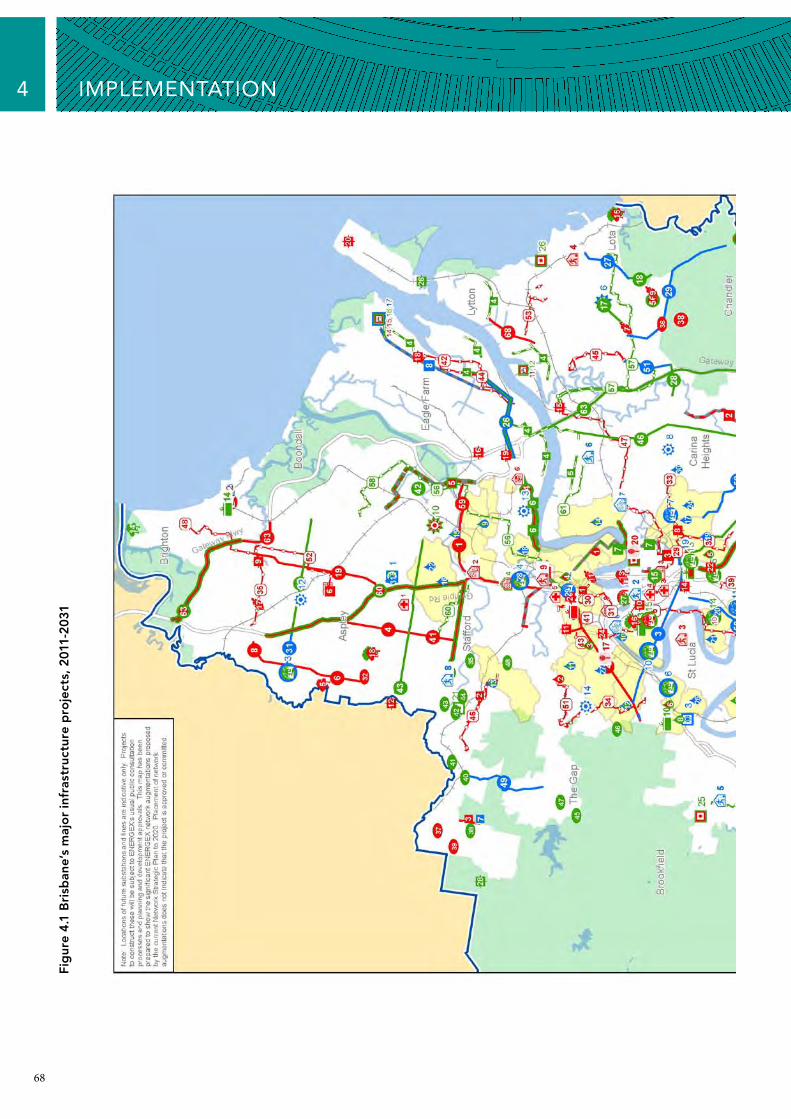
68
4Fi
gur
e 4
.1 B
risb
ane’
s m
ajo
r in
fras
truc
ture
pro
ject
s, 2
011-
203
1
IMPLEMENTATION
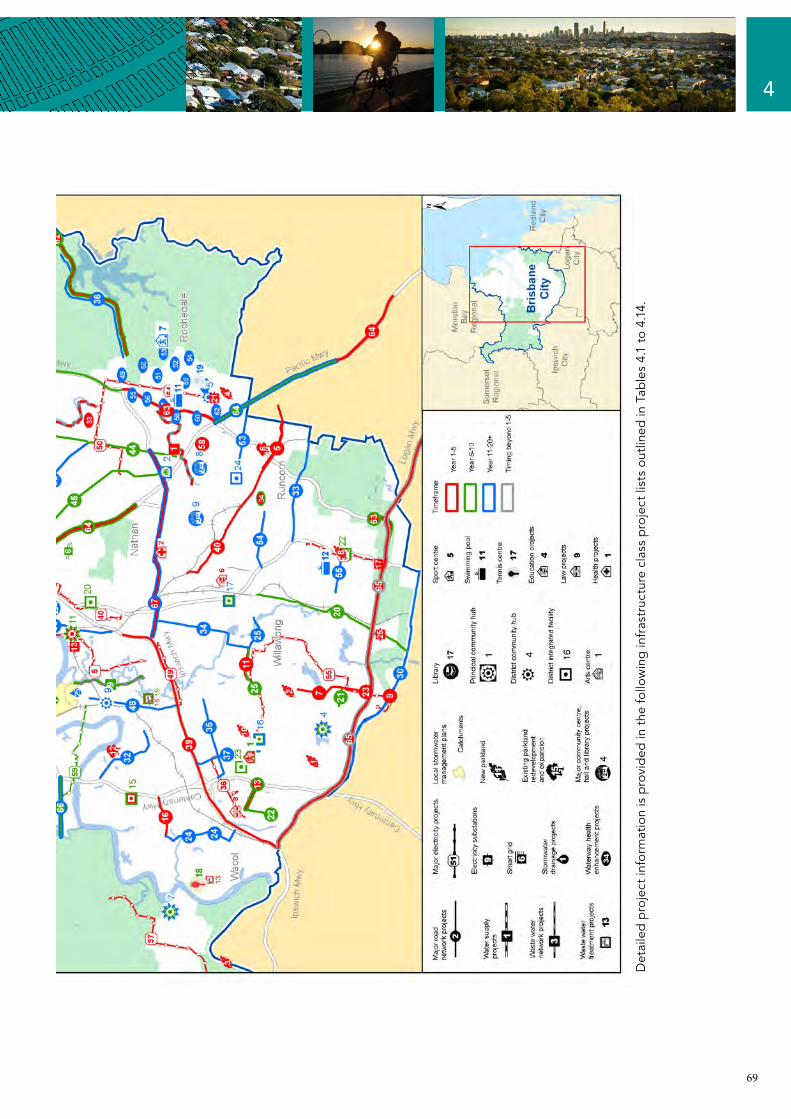
69
4
Det
aile
d p
roje
ct in
form
atio
n is
pro
vid
ed in
the
follo
win
g in
fras
truc
ture
cla
ss p
roje
ct li
sts
outli
ned
in T
able
s 4.
1 to
4.1
4.
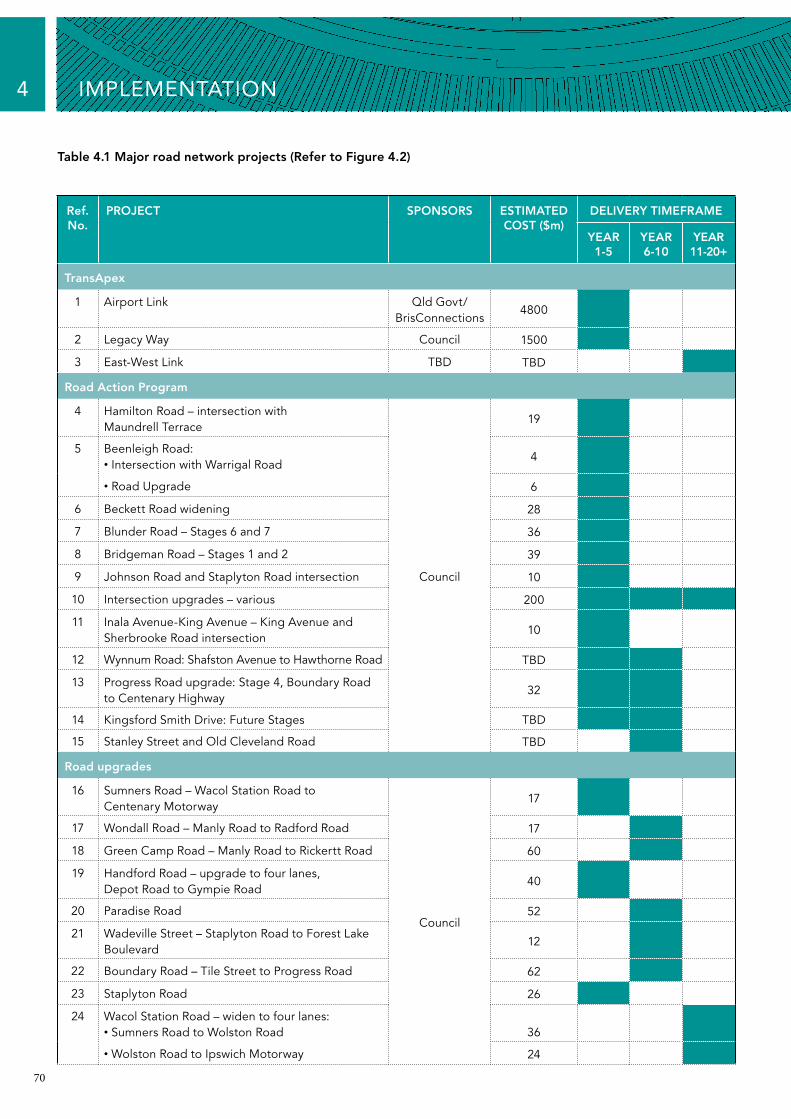
70
Table 4.1 Major road network projects (Refer to Figure 4.2)
4 IMPLEMENTATION
Ref. No.
PROJECT
TransApex
1 Airport Link
SPONSORS
Qld Govt/BrisConnections
ESTIMATED COST ($m)
4800
DELIVERY TIMEFRAME
YEAR 1-5
YEAR 6-10
YEAR 11-20+
2 Legacy Way Council 1500
3 East-West Link TBD TBD
Road Action Program
4 Hamilton Road – intersection with Maundrell Terrace
19
5 Beenleigh Road:• Intersection with Warrigal Road
4
• Road Upgrade 6
6 Beckett Road widening 28
7 Blunder Road – Stages 6 and 7 36
8 Bridgeman Road – Stages 1 and 2 39
9 Johnson Road and Staplyton Road intersection Council 10
10 Intersection upgrades – various 200
11 Inala Avenue-King Avenue – King Avenue and Sherbrooke Road intersection
10
12 Wynnum Road: Shafston Avenue to Hawthorne Road TBD
13 Progress Road upgrade: Stage 4, Boundary Road to Centenary Highway
32
14 Kingsford Smith Drive: Future Stages TBD
15 Stanley Street and Old Cleveland Road TBD
Road upgrades
16 Sumners Road – Wacol Station Road to Centenary Motorway
17
17 Wondall Road – Manly Road to Radford Road 17
18 Green Camp Road – Manly Road to Rickertt Road 60
19 Handford Road – upgrade to four lanes, Depot Road to Gympie Road
40
20 Paradise Road 52
21 Wadeville Street – Staplyton Road to Forest Lake Boulevard
Council
12
22 Boundary Road – Tile Street to Progress Road 62
23 Staplyton Road 26
24 Wacol Station Road – widen to four lanes: • Sumners Road to Wolston Road
36
• Wolston Road to Ipswich Motorway 24

71
4
•
DELIVERY TIMEFRAME
YEAR 1-5
YEAR 6-10
YEAR 11-20+
Table 4.1 Major road network projects (Refer to Figure 4.2) (continued)
Ref. No.
25
PROJECT
Inala Avenue/King Avenue – widen to four lanes: Blunder Road to Sherbrooke Road
SPONSORS
Council
ESTIMATED COST ($m)
34
• Sherbrooke Road to Watson Road 40
26 Kingsford Smith Drive/Eagle Farm Road – upgrade to six lanes, Gateway Motorway to Eagle Farm Road
35
27 Manly Road – Green Camp Road to Preston Road 60
28 Meadowlands Road – Belmont Road to Preston Road 19
29 New Cleveland Road – Manly Road, Green Camp Road, Old Cleveland Road
82
30 Johnson Road – Mount Lindesay Highway to Woogaroo Road
105
31 Beams Road West – Bridgeman Road to Gympie Road 15
32 Seventeen Mile Rocks Road 35
33 Compton Road – six lanes 17
34 Beatty/Sherbrooke Road – upgrade to four lanes, Granard Road to King Avenue
59
35 Freeman Road – Garden Road to Blunder Road 27
36 Mount Gravatt-Capalaba Road – widening to four lanes, Mount Cotton Road to Moreton Bay Road
42
37 Archerfield Road – Ipswich Road to Progress Road 15
38 Gumdale Traffic Plan – various projects 0.3
Corridor improvements
39 Ipswich Road 28
40 Beenleigh Road – Boundary Road to BCC Boundary 39
41 Appleby Road – Albany Creek Road to Stafford Road 22
42 Toombul Road – Nudgee Road to Melton Road 4
43 Rode Road – Old Northern Road to Edinburgh Castle Road
27
44 Newnham Road – Creek Road to Logan Road 21
45 Logan Road – Montague Street to Kessels Road Council 26
46 Creek Road 31
47 Beams Road East 20
48 Oxley Road – upgrade to four lanes, Ipswich Motorway to Sherwood Road
26
49 Settlement Road – Samford Road to Waterworks Road
13
50 Fairfield Road – Sherwood Road to Annerley Road 36
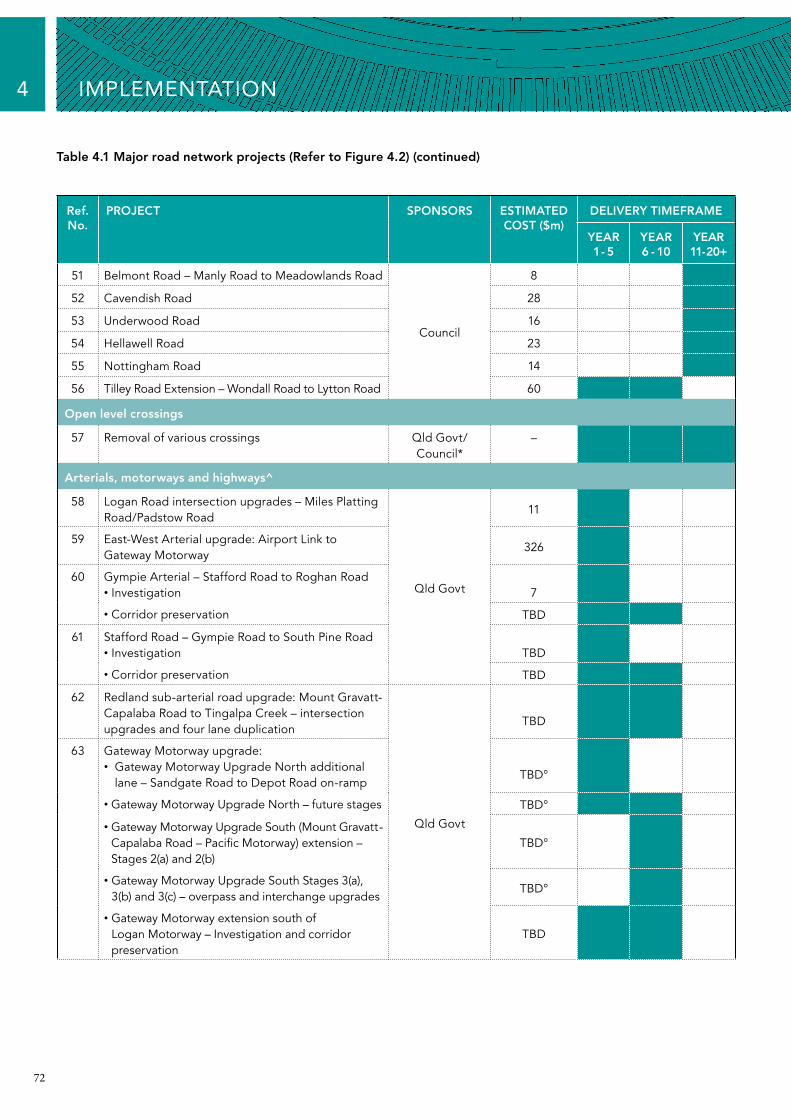
72
Table 4.1 Major road network projects (Refer to Figure 4.2) (continued)
4 IMPLEMENTATION
Ref. No.
51
PROJECT DELIVERY TIMEFRAME
YEAR 1- 5
YEAR 6 - 10
YEAR 11-20+
Belmont Road – Manly Road to Meadowlands Road
SPONSORS
Council
ESTIMATED COST ($m)
8
52 Cavendish Road 28
53 Underwood Road 16
54 Hellawell Road 23
55 Nottingham Road 14
56 Tilley Road Extension – Wondall Road to Lytton Road 60
Open level crossings
57 Removal of various crossings Qld Govt/ –Council*
Arterials, motorways and highways^
58 Logan Road intersection upgrades – Miles Platting Road/Padstow Road
11
59 East-West Arterial upgrade: Airport Link to Gateway Motorway
326
60 Gympie Arterial – Stafford Road to Roghan Road• Investigation
Qld Govt 7
• Corridor preservation TBD
61 Stafford Road – Gympie Road to South Pine Road • Investigation TBD
• Corridor preservation TBD
62 Redland sub-arterial road upgrade: Mount Gravatt-Capalaba Road to Tingalpa Creek – intersection upgrades and four lane duplication
TBD
63 Gateway Motorway upgrade:
• Gateway Motorway Upgrade North additional TBD°
lane – Sandgate Road to Depot Road on-ramp
• G ateway Motorway Upgrade North – future stages TBD°
• Gateway Motorway Upgrade South (Mount Gravatt-Capalaba Road – Pacific Motorway) extension – Stages 2(a) and 2(b)
Qld Govt
TBD°
• Gateway Motorway Upgrade South Stages 3(a), 3(b) and 3(c) – overpass and interchange upgrades
TBD°
• Gateway Motorway extension south of Logan Motorway – Investigation and corridor preservation
TBD
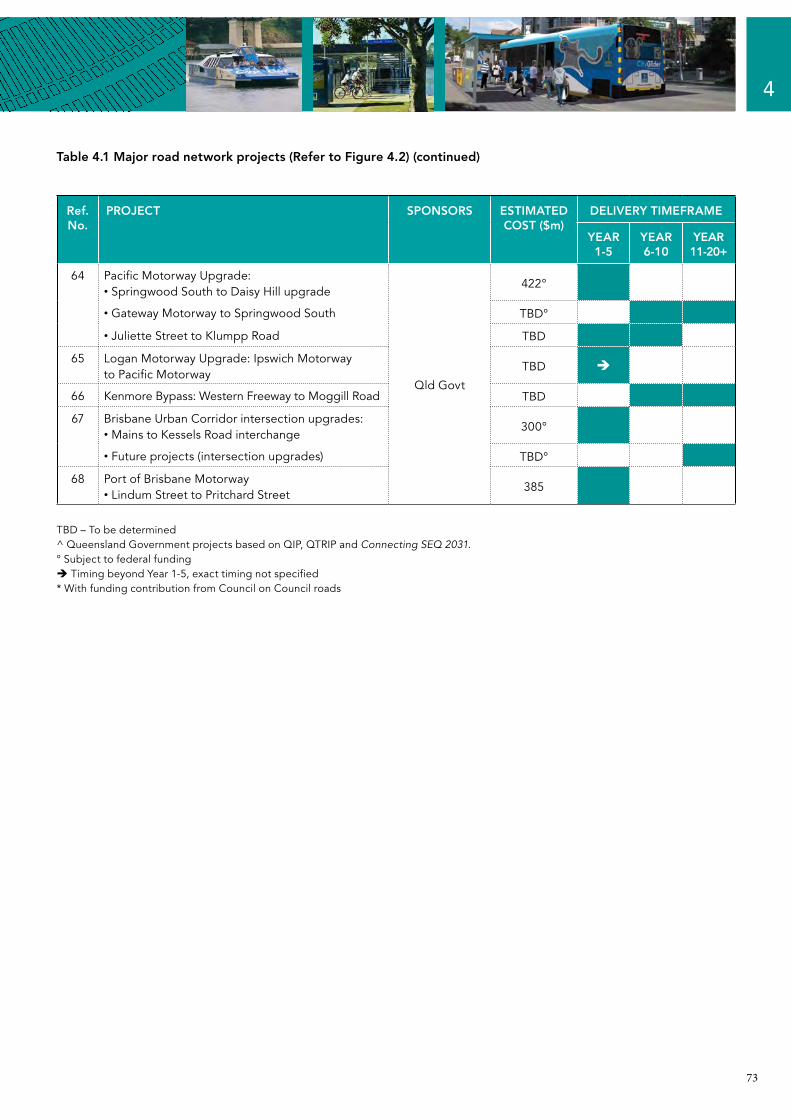
73
4
Table 4.1 Major road network projects (Refer to Figure 4.2) (continued)
Ref. No.
64
PROJECT DELIVERY TIMEFRAME
YEAR 1-5
YEAR 6-10
YEAR 11-20+
Pacific Motorway Upgrade:• Springwood South to Daisy Hill upgrade
SPONSORS
•
Qld Govt
ESTIMATED COST ($m)
422°
• Gateway Motorway to Springwood South TBD°
Juliette Street to Klumpp Road TBD
65 Logan Motorway Upgrade: Ipswich Motorway to Pacific Motorway
TBD
66 Kenmore Bypass: Western Freeway to Moggill Road TBD
67 Brisbane Urban Corridor intersection upgrades:• Mains to Kessels Road interchange
300°
• Future projects (intersection upgrades) TBD°
68 Port of Brisbane Motorway• Lindum Street to Pritchard Street
385
TBD – To be determined ^ Queensland Government projects based on QIP, QTRIP and Connecting SEQ 2031. ° Subject to federal funding Timing beyond Year 1-5, exact timing not specified * With funding contribution from Council on Council roads

74
4 IMPLEMENTATION
Figure 4.2 Major road network projects
Projects with defined locations have been mapped. Numbering may not be sequential.
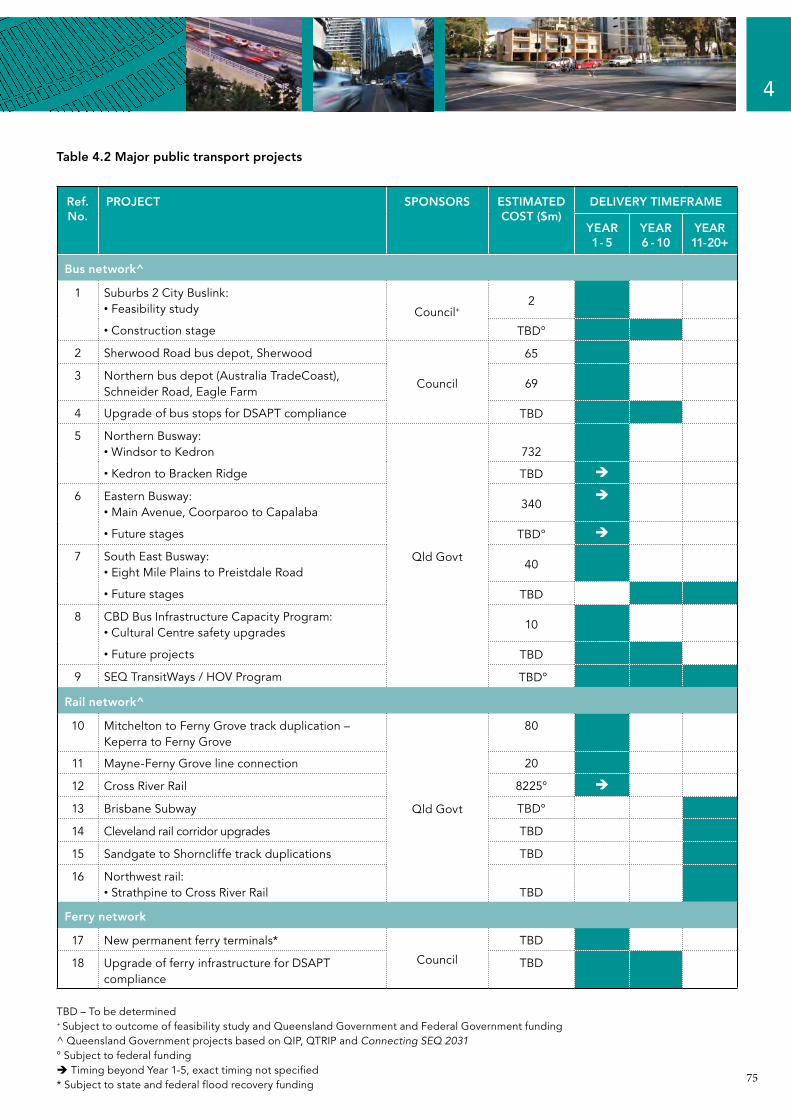
4
DELIVERY TIMEFRAME
YEAR 1- 5
YEAR 6 - 10
YEAR 11-20+
Table 4.2 Major public transport projects
Ref. No.
PROJECT
Bus network^
1 Suburbs 2 City Buslink:• Feasibility study
SPONSORS
Council+
ESTIMATED COST ($m)
2
• Construction stage TBD°
2 Sherwood Road bus depot, Sherwood 65
3 Northern bus depot (Australia TradeCoast), Schneider Road, Eagle Farm
Council 69
4 Upgrade of bus stops for DSAPT compliance TBD
5 Northern Busway: • Windsor to Kedron 732
• Kedron to Bracken Ridge TBD
6 Eastern Busway:340
• Main Avenue, Coorparoo to Capalaba
• Future stages TBD°
7 South East Busway: • Eight Mile Plains to Preistdale Road
Qld Govt40
• Future stages TBD
8 CBD Bus Infrastructure Capacity Program:• Cultural Centre safety upgrades
10
• Future projects TBD
9 SEQ TransitWays / HOV Program TBD°
Rail network^
10 Mitchelton to Ferny Grove track duplication – Keperra to Ferny Grove
80
11 Mayne-Ferny Grove line connection 20
12 Cross River Rail 8225°
13 Brisbane Subway Qld Govt TBD°
14 Cleveland rail corridor upgrades TBD
15 Sandgate to Shorncliffe track duplications TBD
16 Northwest rail:• Strathpine to Cross River Rail TBD
Ferry network
17 New permanent ferry terminals* TBD
Council18 Upgrade of ferry infrastructure for DSAPT compliance
TBD
TBD – To be determined + Subject to outcome of feasibility study and Queensland Government and Federal Government funding^ Queensland Government projects based on QIP, QTRIP and Connecting SEQ 2031 ° Subject to federal funding Timing beyond Year 1-5, exact timing not specified * Subject to state and federal flood recovery funding
75
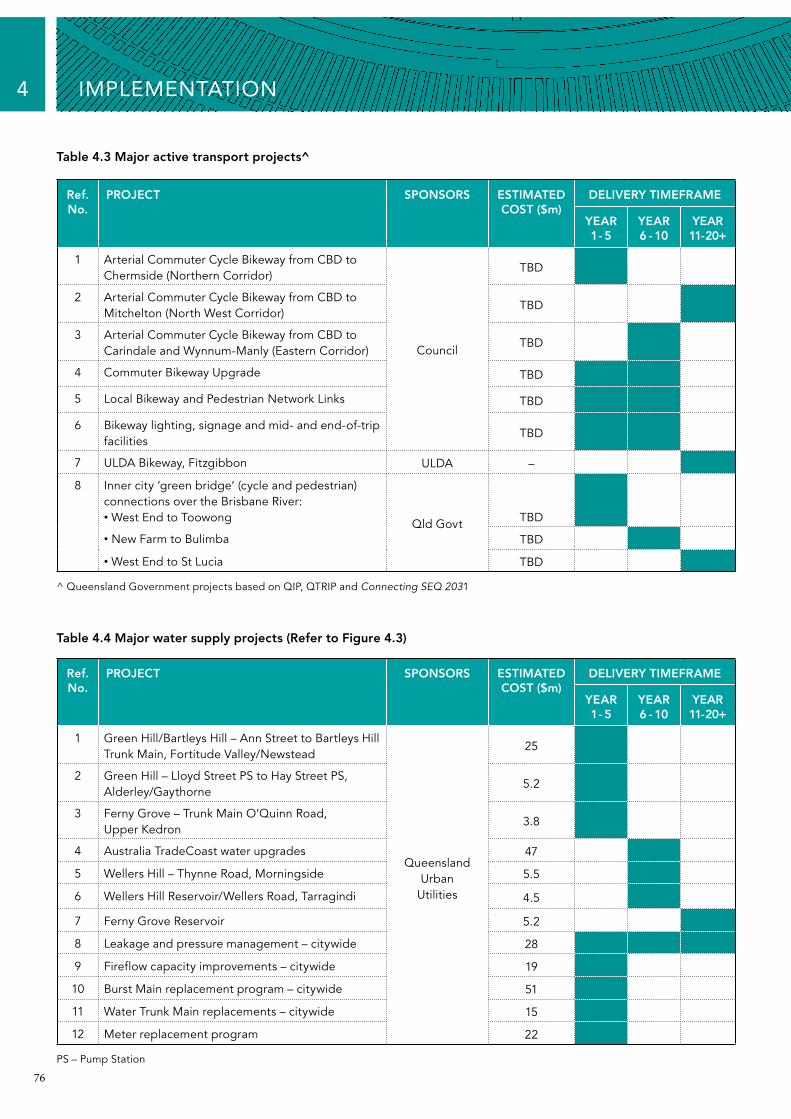
76
4 IMPLEMENTATION
DELIVERY TIMEFRAME
YEAR 1- 5
YEAR 6 - 10
YEAR 11-20+
Table 4.3 Major active transport projects^
Ref. No.
PROJECT
1 Arterial Commuter Cycle Bikeway from CBD to Chermside (Northern Corridor)
SPONSORS
Council
ESTIMATED COST ($m)
TBD
2 Arterial Commuter Cycle Bikeway from CBD to Mitchelton (North West Corridor)
TBD
3 Arterial Commuter Cycle Bikeway from CBD to Carindale and Wynnum-Manly (Eastern Corridor)
TBD
4 Commuter Bikeway Upgrade TBD
5 Local Bikeway and Pedestrian Network Links TBD
6 Bikeway lighting, signage and mid- and end-of-trip TBD
facilities
7 ULDA Bikeway, Fitzgibbon ULDA –
8 Inner city ‘green bridge’ (cycle and pedestrian) connections over the Brisbane River:• West End to Toowong Qld Govt TBD
• New Farm to Bulimba TBD
• West End to St Lucia TBD
^ Queensland Government projects based on QIP, QTRIP and Connecting SEQ 2031
Table 4.4 Major water supply projects (Refer to Figure 4.3)
Ref. No.
PROJECT DELIVERY TIMEFRAME
YEAR 1- 5
YEAR 6 - 10
YEAR 11-20+
1 Green Hill/Bartleys Hill – Ann Street to Bartleys Hill Trunk Main, Fortitude Valley/Newstead
SPONSORS
QueenslandUrban
Utilities
ESTIMATED COST ($m)
25
2 Green Hill – Lloyd Street PS to Hay Street PS, Alderley/Gaythorne
5.2
3 Ferny Grove – Trunk Main O’Quinn Road, Upper Kedron
3.8
4 Australia TradeCoast water upgrades 47
5 Wellers Hill – Thynne Road, Morningside 5.5
6 Wellers Hill Reservoir/Wellers Road, Tarragindi 4.5
7 Ferny Grove Reservoir 5.2
8 Leakage and pressure management – citywide 28
9 Fireflow capacity improvements – citywide 19
10 Burst Main replacement program – citywide 51
11 Water Trunk Main replacements – citywide 15
12 Meter replacement program 22
PS – Pump Station
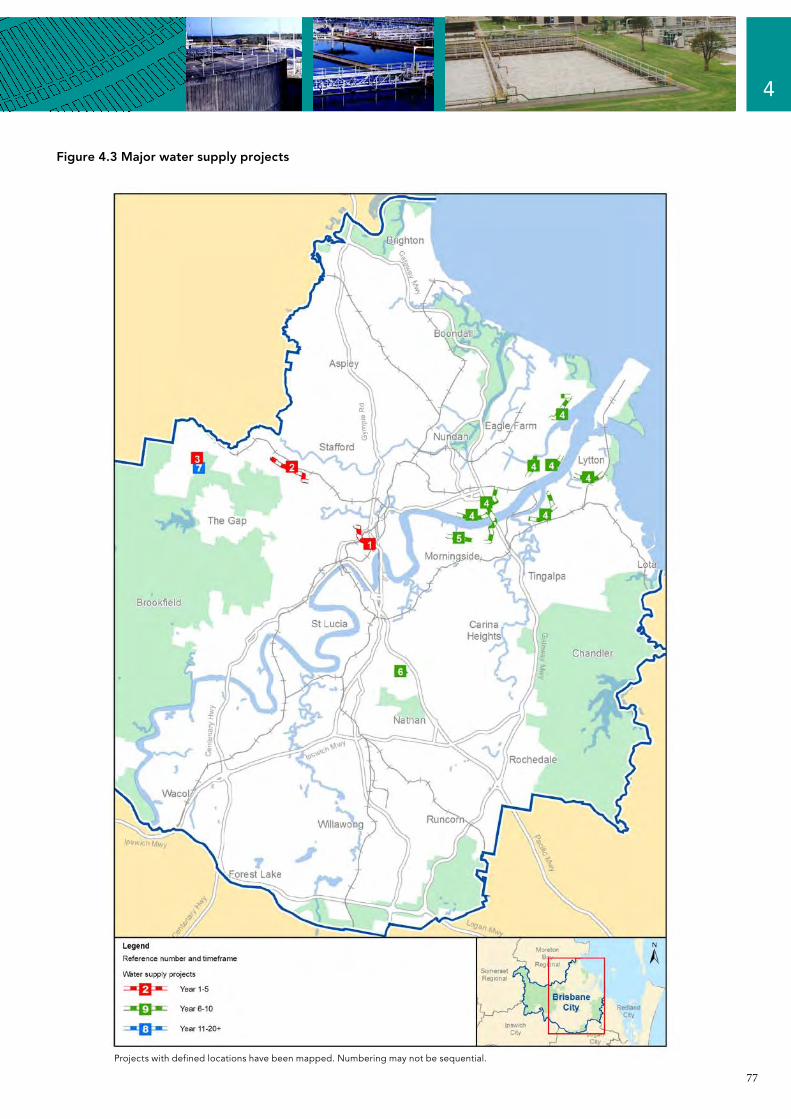
77
4
Figure 4.3 Major water supply projects
Projects with defined locations have been mapped. Numbering may not be sequential.
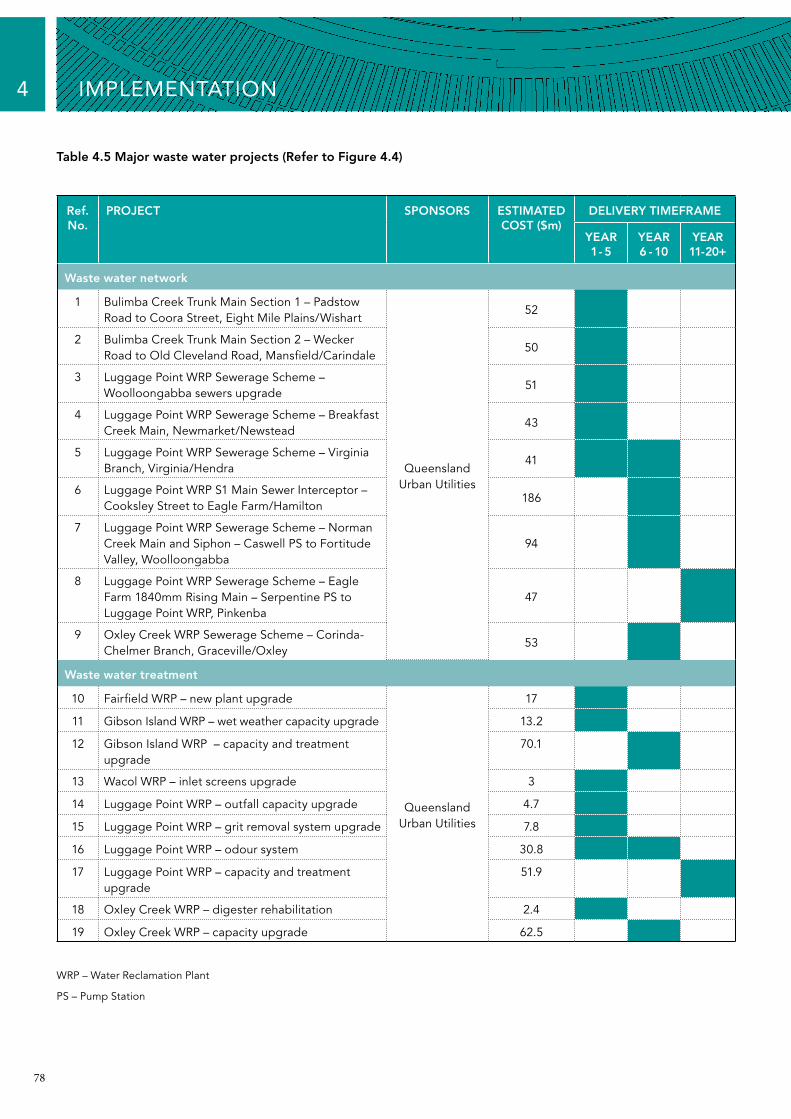
78
4 IMPLEMENTATION
Table 4.5 Major waste water projects (Refer to Figure 4.4)
Ref. No.
PROJECT DELIVERY TIMEFRAME
YEAR 1- 5
YEAR 6 - 10
YEAR 11-20+
Waste water network
1 Bulimba Creek Trunk Main Section 1 – Padstow Road to Coora Street, Eight Mile Plains/Wishart
SPONSORS
Queensland Urban Utilities
ESTIMATED COST ($m)
52
2 Bulimba Creek Trunk Main Section 2 – Wecker Road to Old Cleveland Road, Mansfield/Carindale
50
3 Luggage Point WRP Sewerage Scheme – Woolloongabba sewers upgrade
51
4 Luggage Point WRP Sewerage Scheme – Breakfast Creek Main, Newmarket/Newstead
43
5 Luggage Point WRP Sewerage Scheme – Virginia Branch, Virginia/Hendra
41
6 Luggage Point WRP S1 Main Sewer Interceptor – Cooksley Street to Eagle Farm/Hamilton
186
7 Luggage Point WRP Sewerage Scheme – Norman Creek Main and Siphon – Caswell PS to Fortitude Valley, Woolloongabba
94
8 Luggage Point WRP Sewerage Scheme – Eagle Farm 1840mm Rising Main – Serpentine PS to Luggage Point WRP, Pinkenba
47
9 Oxley Creek WRP Sewerage Scheme – Corinda-Chelmer Branch, Graceville/Oxley
53
Waste water treatment
10 Fairfield WRP – new plant upgrade 17
11 Gibson Island WRP – wet weather capacity upgrade 13.2
Queensland Urban Utilities
12 Gibson Island WRP – capacity and treatment upgrade
70.1
13 Wacol WRP – inlet screens upgrade 3
14 Luggage Point WRP – outfall capacity upgrade 4.7
15 Luggage Point WRP – grit removal system upgrade 7.8
16 Luggage Point WRP – odour system 30.8
17 Luggage Point WRP – capacity and treatment upgrade
51.9
18 Oxley Creek WRP – digester rehabilitation 2.4
19 Oxley Creek WRP – capacity upgrade 62.5
WRP – Water Reclamation Plant
PS – Pump Station

79
4
Figure 4.4 Major waste water projects
Projects with defined locations have been mapped. Numbering may not be sequential.
80

81
4
Table 4.6 Major stormwater projects
Ref. No.
PROJECT SPONSORS ESTIMATED COST ($m)
DELIVERY TIMEFRAME
YEAR 1- 5
YEAR 6 - 10
YEAR 11-20+
Stormwater drainage
1 New Farm-Teneriffe Catchment Study* 4
2 Woolcock Park Catchment Study – Scheme A* 3.5
3 Castlemaine-Caxton Streets Catchment Study* 12.4
4 Stratton Street Catchment Study* 12.5
5 Greenslopes LSMP North* 8.8
6 Westerham Street Catchment Study* 10.6
7 Faulkner Park Catchment Study – Network 1* 7.4
8 Sandy Creek LSMP 0.6
9 Ascot-Clayfield Drainage Study* 11.3
10 West End LSMP – Hockings Street Outlet 21* 16.3
11 Grove Street – Woolcock Park Catchment Study* 9.3
12 Langsville Creek Catchment Study* 16.8
13 Alderley North LSMP* 9.6
14 Pashen Creek Hawthorne Catchment Study* 31
15 Kemble Street – Hendra Catchment Study* 15.1
16 Ramsay Street – Kedron LSMP “B”* Council 8.3
17 Coorparoo Creek – Coorparoo Catchment* 25.2
18 Albion Catchment LSMP* 2.7
19 Greenslopes LSMP South* 4.5
20 Yeronga LSMP East* 9.2
21 Yeronga LSMP West* 4.6
22 Kedron LSMP – Section A* 12.8
23 Water-Campbell Street LSMP* 7.8
24 Bridgewater Creek Catchment* 37.3
25 Long Street East – Graceville Catchment Study 1.6
26 Sandy Creek Indooroopilly Piped Catchment Study* 15.1
27 Western Creek LSMP* 34
28 Bowen Street – Albion-Windsor Drainage* 5.2
29 Water Street, Spring Hill-Fortitude Valley* 17.3
30 Third Street, Camp Hill* 20
31 Playfield Street, Chermside* 5.3
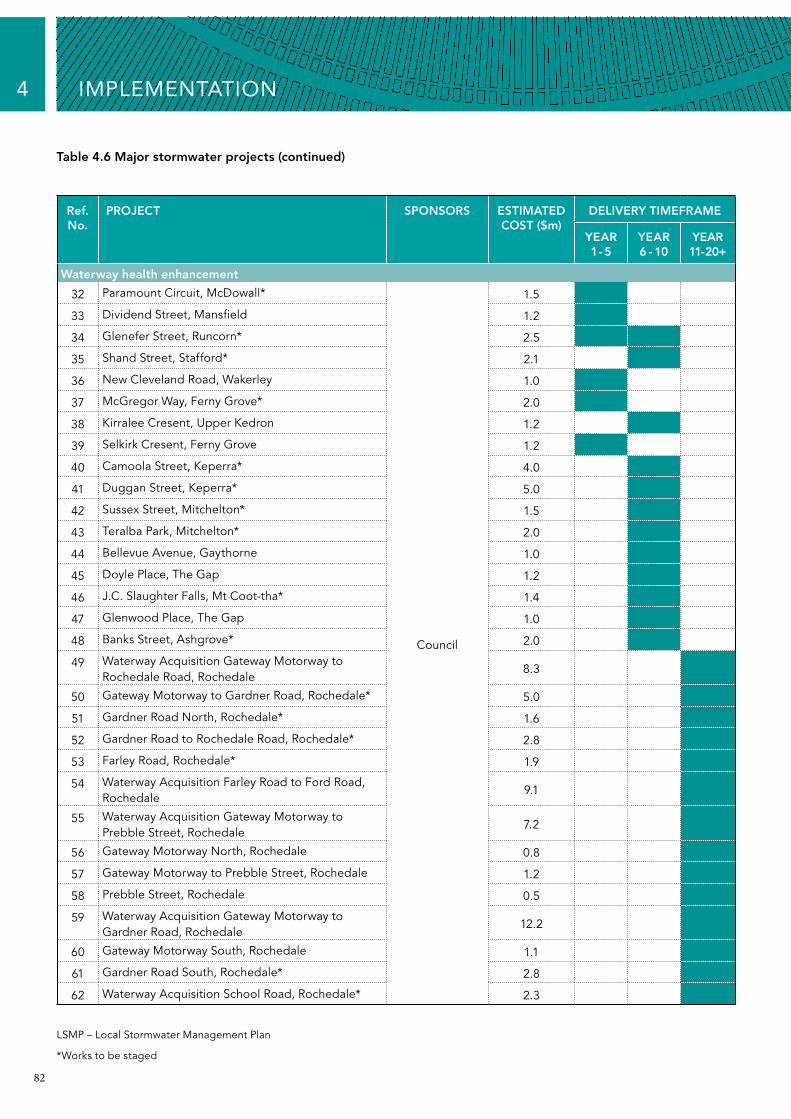
82
DELIVERY TIMEFRAME
YEAR 1- 5
YEAR 6 - 10
YEAR 11-20+
Table 4.6 Major stormwater projects (continued)
4 IMPLEMENTATION
Ref. No.
PROJECT SPONSORS ESTIMATED COST ($m)
Waterway health enhancement
32 Paramount Circuit, McDowall* 1.5
33 Dividend Street, Mansfield 1.2
34 Glenefer Street, Runcorn* 2.5
35 Shand Street, Stafford* 2.1
36 New Cleveland Road, Wakerley 1.0
37 McGregor Way, Ferny Grove* 2.0
38 Kirralee Cresent, Upper Kedron 1.2
39 Selkirk Cresent, Ferny Grove 1.2
40 Camoola Street, Keperra* 4.0
41 Duggan Street, Keperra* 5.0
42 Sussex Street, Mitchelton* 1.5
43 Teralba Park, Mitchelton* 2.0
44 Bellevue Avenue, Gaythorne 1.0
45 Doyle Place, The Gap 1.2
46 J.C. Slaughter Falls, Mt Coot-tha* 1.4
47 Glenwood Place, The Gap 1.0
48 Banks Street, Ashgrove* Council 2.0
49 Waterway Acquisition Gateway Motorway to Rochedale Road, Rochedale
8.3
50 Gateway Motorway to Gardner Road, Rochedale* 5.0
51 Gardner Road North, Rochedale* 1.6
52 Gardner Road to Rochedale Road, Rochedale* 2.8
53 Farley Road, Rochedale* 1.9
54 Waterway Acquisition Farley Road to Ford Road, Rochedale
9.1
55 Waterway Acquisition Gateway Motorway to Prebble Street, Rochedale
7.2
56 Gateway Motorway North, Rochedale 0.8
57 Gateway Motorway to Prebble Street, Rochedale 1.2
58 Prebble Street, Rochedale 0.5
59 Waterway Acquisition Gateway Motorway to Gardner Road, Rochedale
12.2
60 Gateway Motorway South, Rochedale 1.1
61 Gardner Road South, Rochedale* 2.8
62 Waterway Acquisition School Road, Rochedale* 2.3
LSMP – Local Stormwater Management Plan
*Works to be staged

83
Figure 4.5 Major stormwater projects
Projects with defined locations have been mapped. Numbering may not be sequential.
4
84
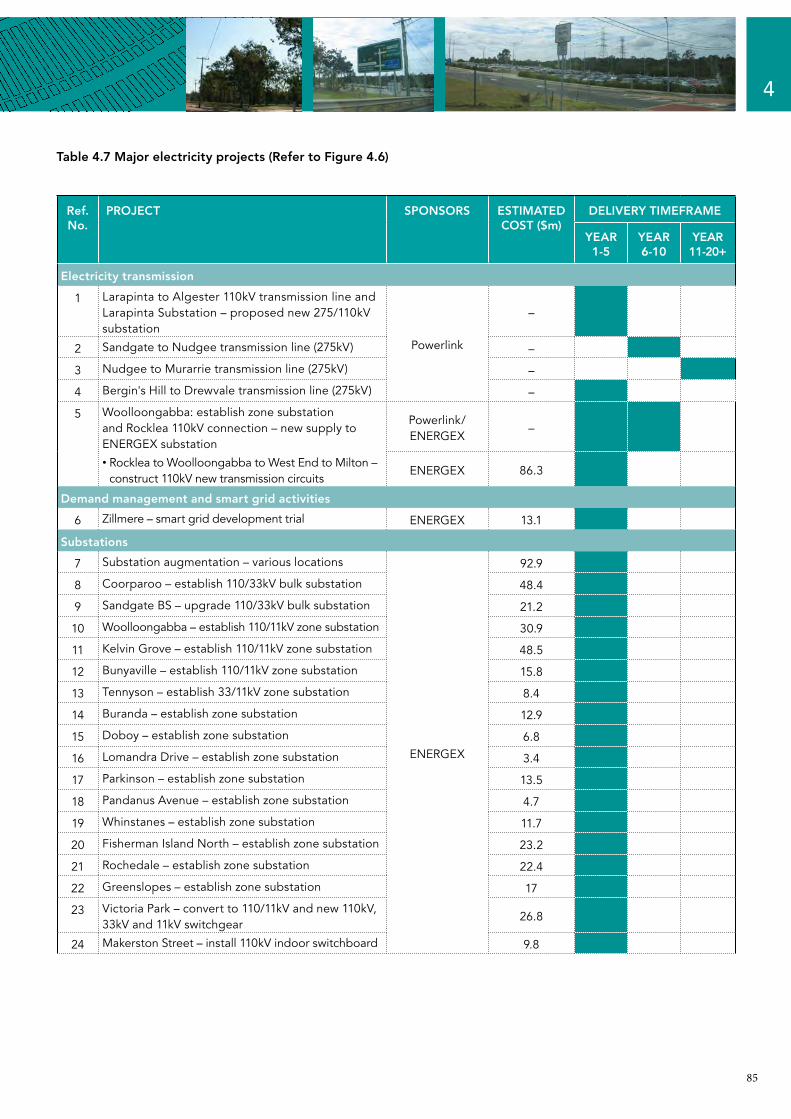
85
4
DELIVERY TIMEFRAME
YEAR 1-5
YEAR 6-10
YEAR 11-20+
–
–
–
24 9.8
Table 4.7 Major electricity projects (Refer to Figure 4.6)
Ref. No.
PROJECT
Electricity transmission
1 Larapinta to Algester 110kV transmission line and Larapinta Substation – proposed new 275/110kV substation
SPONSORS
Powerlink2 Sandgate to Nudgee transmission line (275kV)
3 Nudgee to Murarrie transmission line (275kV) –
4 Bergin's Hill to Drewvale transmission line (275kV) –
5 Woolloongabba: establish zone substation and Rocklea 110kV connection – new supply to ENERGEX substation
Powerlink/ENERGEX
• Rocklea to Woolloongabba to West End to Milton – construct 110kV new transmission circuits
ENERGEX
ESTIMATED COST ($m)
86.3
Demand management and smart grid activities
6 Zillmere – smart grid development trial ENERGEX 13.1
Substations
7 Substation augmentation – various locations 92.9
8 Coorparoo – establish 110/33kV bulk substation 48.4
9 Sandgate BS – upgrade 110/33kV bulk substation 21.2
10 Woolloongabba – establish 110/11kV zone substation 30.9
11 Kelvin Grove – establish 110/11kV zone substation 48.5
12 Bunyaville – establish 110/11kV zone substation 15.8
13 Tennyson – establish 33/11kV zone substation 8.4
14 Buranda – establish zone substation 12.9
15 Doboy – establish zone substation 6.8
Lomandra Drive – establish zone substation ENERGEX16 3.4
17 Parkinson – establish zone substation 13.5
18 Pandanus Avenue – establish zone substation 4.7
19 Whinstanes – establish zone substation 11.7
20 Fisherman Island North – establish zone substation 23.2
21 Rochedale – establish zone substation 22.4
22 Greenslopes – establish zone substation 17
23 Victoria Park – convert to 110/11kV and new 110kV, 26.8
33kV and 11kV switchgear
Makerston Street – install 110kV indoor switchboard

86
4 IMPLEMENTATION
DELIVERY TIMEFRAME
YEAR 1-5
YEAR 6-10
YEAR 11-20+
–
Table 4.7 Major electricity projects (Refer to Figure 4.6) (continued)
Ref. No.
25
PROJECT
Larapinta • establish 33/11kV zone substation
SPONSORS
ENERGEX
ESTIMATED COST ($m)
13.6
• establish 110/33kV bulk substation 2.1
26 Fisherman Island – establish 110/33kV bulk substation
7.4
27 Adelaide Street – establish 110/11kV zone substation
31.9
28 Upper Kedron – establish 110/11kV zone substation 11.5
Feeders
29 Wellington Road to Coorparoo – establish double circuit 110kV UG
ENERGEX
48.4
30 Victoria Park to Ann Street – establish new double circuit 110kV UG feeders
20.5
31 Ann Street to Adelaide Street to Makerston Street establish new double circuit 110kV UG feeders
11.2
32 Coorparoo BS to Holland Park to Greenslopes – construct double circuit 33kV UG feeders
12.1
33 Coorparoo BS to Camp Hill – construct double circuit 33kV UG to replace F612 and F613
6.7
34 Ashgrove West to Toowong – install new double circuit 33kV UG cables
13.7
35 Sandgate BS to Bald Hills to Zillmere – establish double circuit 33kV (SGT-BHL and SGT-ZMR)
9.9
36 Richlands to Wacol – establish single 33kV UG circuit (double circuit construction)
12.4
37 Ebbw Vale to Moggill – construct 33kV circuit 11.2
38 Calamvale to Parkinson – establish 33kV single circuit 13.5
39 Moorooka to Annerley – establish single circuit 33kV UG
3.9
40 Rocklea to Moorooka – construct single circuit 33kV UG cable to replace F517
8.6
41 Roma Street Rail yards to Makerston Street – establish 110kV supply to Queensland Rail 110/25kV
7.8
42 Myrtletown to Pandanus Avenue – establish 33kV DCCT feeders energised by 11kV
4.2
43 Kelvin Grove to Milton – feeder works from 110kV F782
48.5
44 Meeandah to Myrtletown – replace 4.1km of 33kV OH feeder F609
1.6
45 Hemmant to Tingalpa • replace 3.5km of 33kV OH feeder F558
1.3
• replace 3.3km of 33kV OH feeder with 33kV UG F560
5.1

87
4
DELIVERY TIMEFRAME
YEAR 1-5
YEAR 6-10
YEAR 11-20+
Table 4.7 Major electricity projects (Refer to Figure 4.6) (continued)
Ref. No.
46
PROJECT
Enoggera to Grovely – replace 33kV feeders F596 and F595
SPONSORS
ENERGEX
ESTIMATED COST ($m)
7.9
47 Wellington Road to Doboy BS – replace 33kV OH feeder F584
3.8
48 Sandgate to Brighton – replace 4.4km of 33kV OH feeder F656
1.7
49 Oxley to Archerfield – replace F625 and F626 33kV UG
7.5
50 Belmont BS to Mount Gravatt – replace F631 and F632 33kV UG
22.4
51 Ashgrove to Ashgrove West – replace F565A and F565B 33kV cable with single circuit UG
10.3
52 Sandgate to Zillmere – upgrade 33kV feeders (F505) 1.2
53 Doboy BS to Lota – upgrade 33k feeder F414, F558, F569 and F560, including new double circuit to Lota BS
10
54 Rochedale to Belmont BS – upgrade F647 and new single circuit UG
22.4
55 Inala to P28765 – upgrade feeder F543 between Inala and pole P28765
1.6
56 Nudgee to Hendra to Victoria Park – reinforce Brisbane CBD with additional 110kV UG
81.3
57 Doboy to Tingalpa – build new 110kV double circuit UG feeder joining F414 to F558/560 at 33kV
11.1
58 Nudgee to Geebung – new 33kV UG double circuit to replace F604 and F605
21.9
59 Kenmore to Sherwood – replace 4.9km of 33kV OH feeder F539
1.9
60 Stafford to Kedron – replace ageing 33kV UG feeders F567 and F568
9.5
61 Bulimba to Queensport – upgrade F443 by replacing UG tails and uprating OH component
2.5
BS – bulk supply
UG – underground
OH – overhead
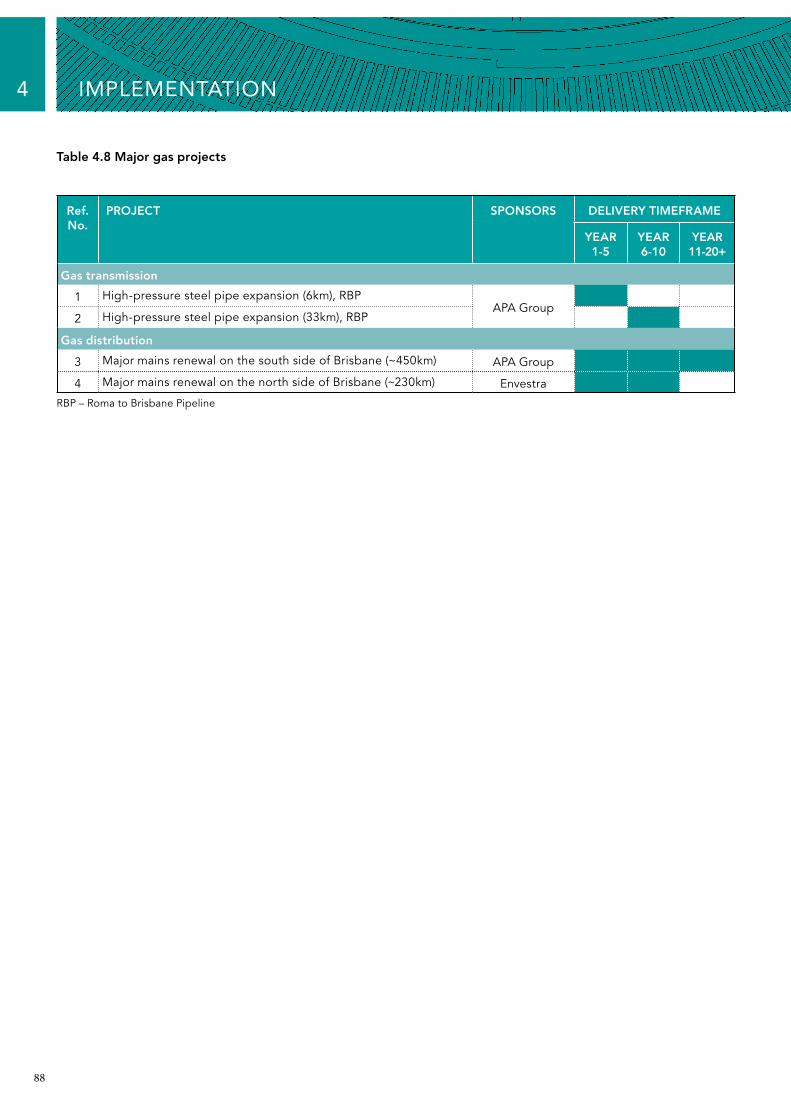
88
Table 4.8 Major gas projects
Ref. No.
PROJECT DELIVERY TIMEFRAME
YEAR 1-5
YEAR 6-10
YEAR 11-20+
Gas transmission
1 High-pressure steel pipe expansion (6km), RBP
2 High-pressure steel pipe expansion (33km), RBP
SPONSORS
APA Group
Gas distribution
3 Major mains renewal on the south side of Brisbane (~450km) APA Group
4 Major mains renewal on the north side of Brisbane (~230km) Envestra
4 IMPLEMENTATION
RBP – Roma to Brisbane Pipeline
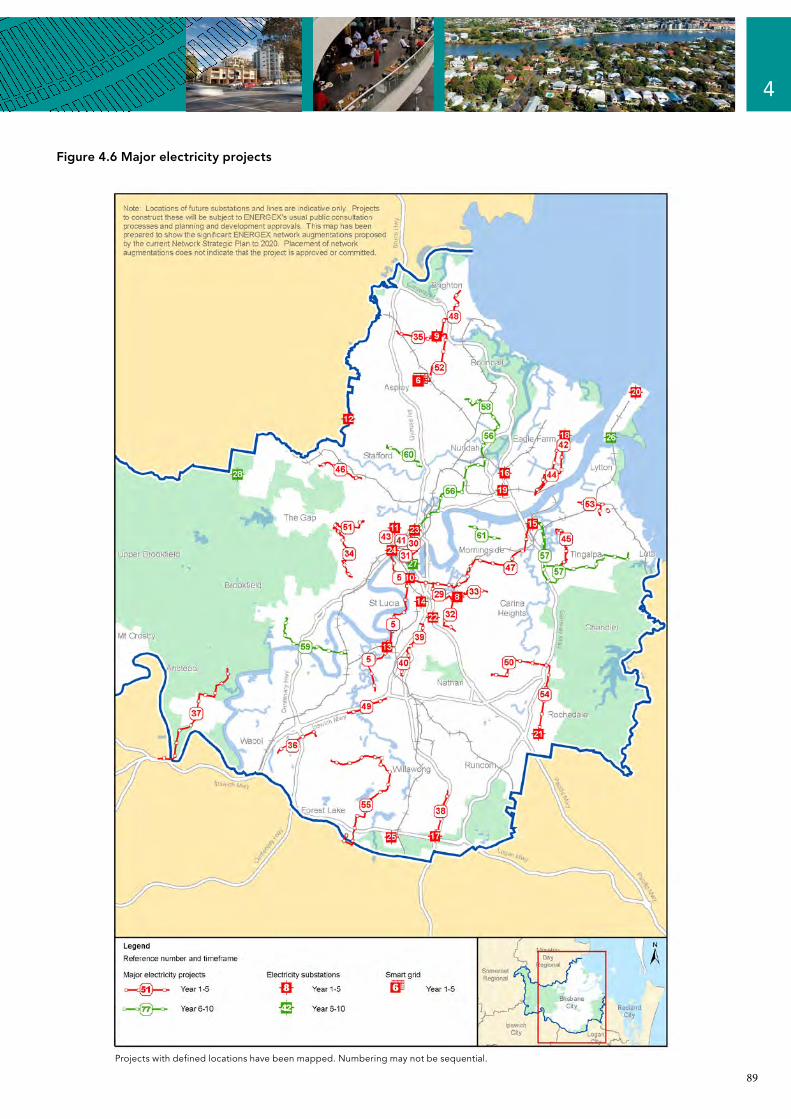
89
Figure 4.6 Major electricity projects
4
Projects with defined locations have been mapped. Numbering may not be sequential.
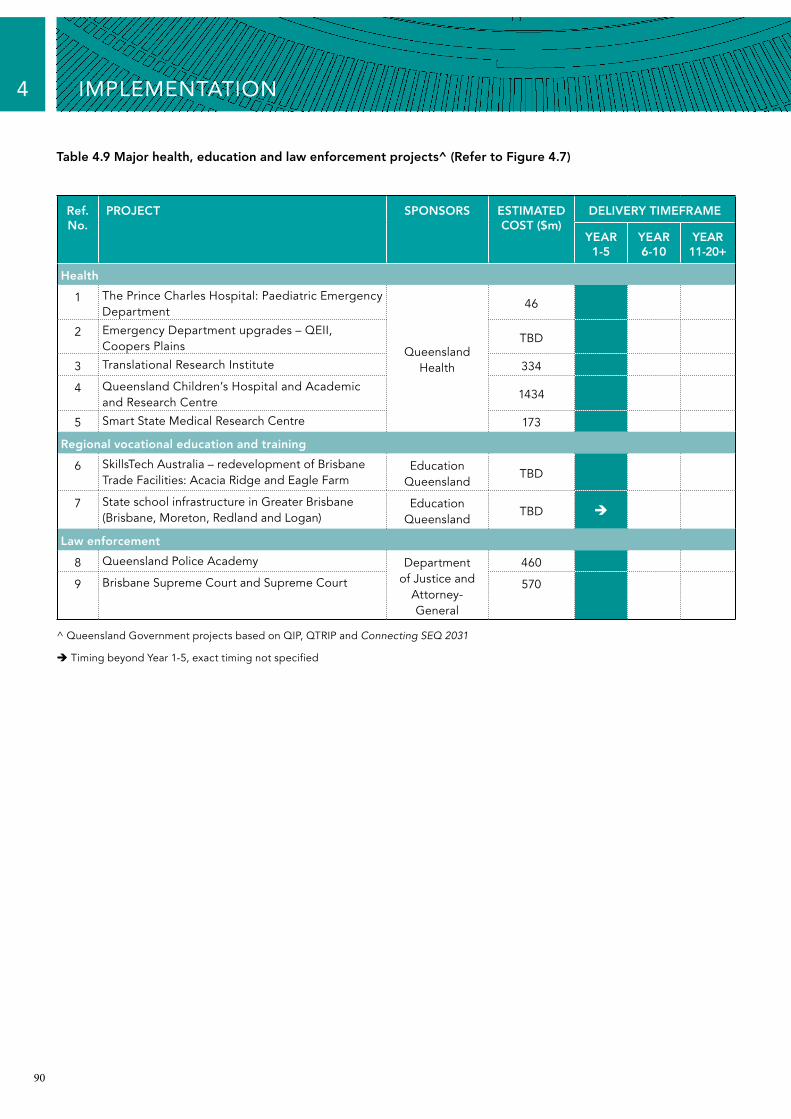
90
DELIVERY TIMEFRAME
YEAR 1-5
YEAR 6-10
YEAR 11-20+
4 IMPLEMENTATION
Table 4.9 Major health, education and law enforcement projects^ (Refer to Figure 4.7)
Ref. No.
PROJECT
Health
1 The Prince Charles Hospital: Paediatric Emergency Department
SPONSORS
Queensland Health
ESTIMATED COST ($m)
46
2 Emergency Department upgrades – QEII, Coopers Plains
TBD
3 Translational Research Institute 334
4 Queensland Children’s Hospital and Academic and Research Centre
1434
5 Smart State Medical Research Centre 173
Regional vocational education and training
6 SkillsTech Australia – redevelopment of Brisbane Trade Facilities: Acacia Ridge and Eagle Farm
Education Queensland
TBD
7 State school infrastructure in Greater Brisbane (Brisbane, Moreton, Redland and Logan)
Education Queensland
TBD
Law enforcement
8 Queensland Police Academy Department of Justice and
Attorney-General
460
9 Brisbane Supreme Court and Supreme Court 570
^ Queensland Government projects based on QIP, QTRIP and Connecting SEQ 2031
Timing beyond Year 1-5, exact timing not specified
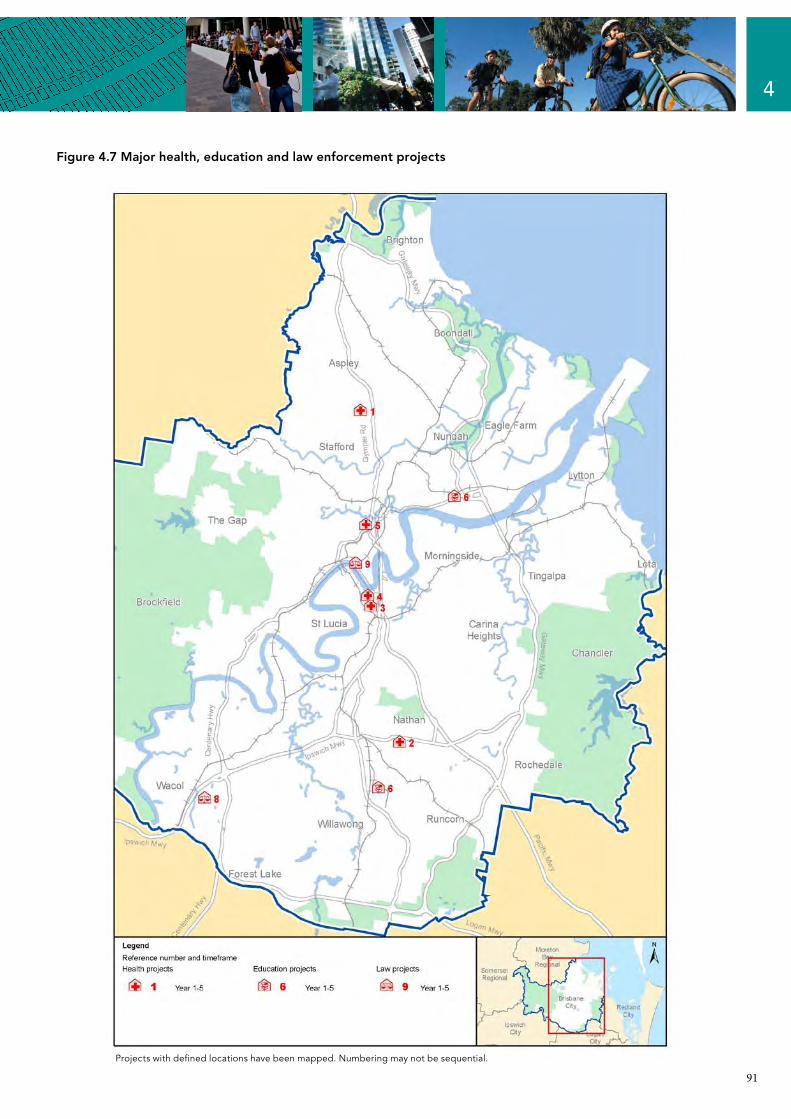
91
4
Figure 4.7 Major health, education and law enforcement projects
Projects with defined locations have been mapped. Numbering may not be sequential.

92
4 IMPLEMENTATION
Table 4.10 Major community hub and integrated facility projects (Refer to Figure 4.8)
Ref. No.
PROJECT DELIVERY TIMEFRAME
YEAR 1-5
YEAR 6-10
YEAR 11-20+
New principal community hub
1 Chermside
SPONSORS
Council/ Qld Govt
ESTIMATED COST ($m)
40
2 Upper Mount GravattCouncil
12.7
3 Indooroopilly 12.2
New district community hub
4 Forest Lake
Council
10.3
5 Rochedale 11.6
6 Wynnum West/Manly West/Tingalpa 10
7 Bellbowrie (including existing facility upgrade/expansion)
3.7
8 Carina/Carindale (including existing facility upgrade/expansion)
9.5
9 Corinda (including existing facility upgrade/expansion)
8.2
10 Nundah (including existing facility upgrade/expansion)
7.8
11 Yeerongpilly/Tennyson
Council/ Qld Govt
13.0
12 Carseldine/Fitzgibbon 24.1
13 Hamilton (including existing facility relocation/upgrade)
22.7
14 Bardon/Ashgrove/The Gap 11.6
New district integrated facility
15 Mt Ommaney
Council
3
16 Inala 8.3
17 Acacia Ridge 5.1
18 East Brisbane 2.9
19 Stones Corner 4.2
20 Moorooka 6.3
21 Mitchelton 6.1
22 Calamvale 5.9
23 Richlands 3.7
24 Runcorn 6.1
Major upgrade of existing district integrated facility
25 Kenmore Council
1.5
26 Wynnum 3.2
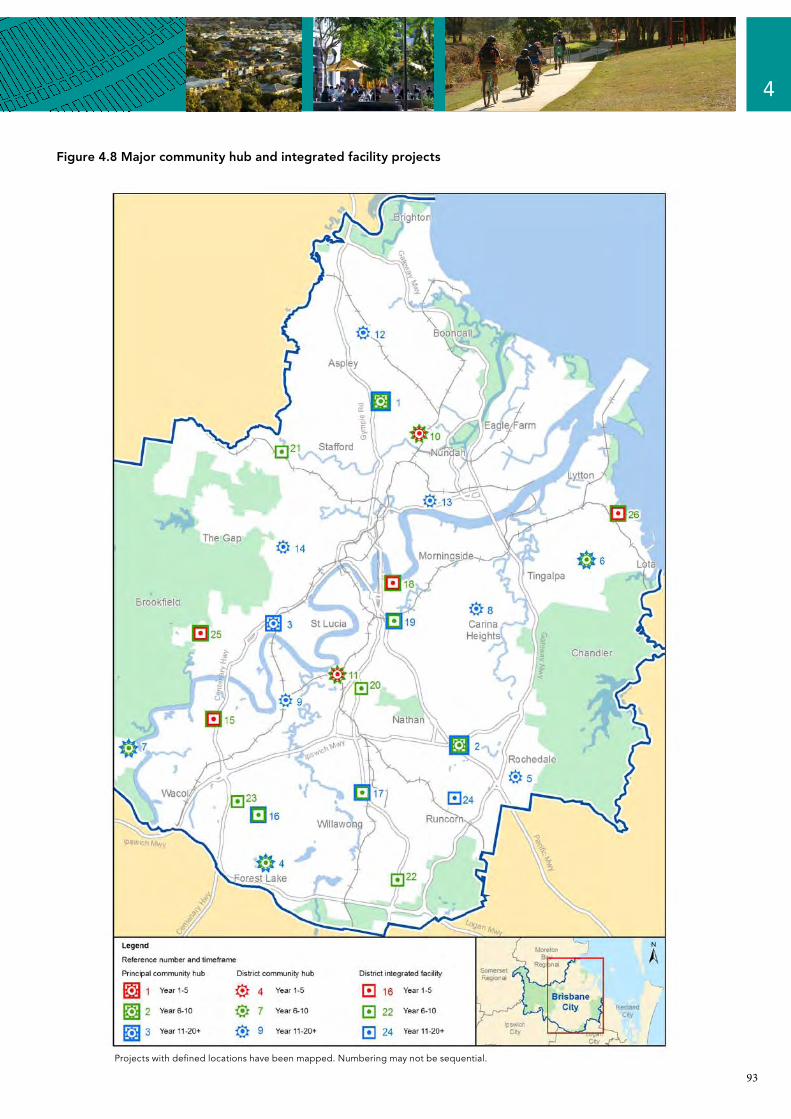
93
4
Figure 4.8 Major community hub and integrated facility projects
Projects with defined locations have been mapped. Numbering may not be sequential.
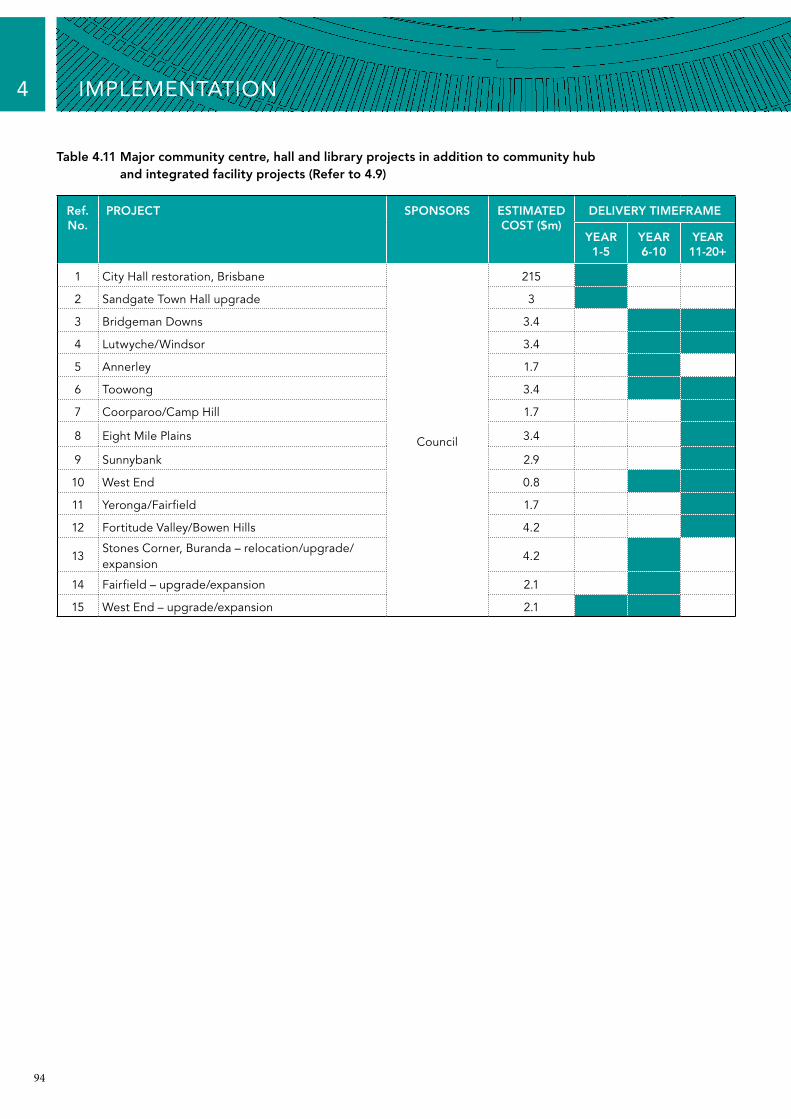
94
4 IMPLEMENTATION
Table 4.11 Major community centre, hall and library projects in addition to community hub and integrated facility projects (Refer to 4.9)
Ref. No.
1
PROJECT DELIVERY TIMEFRAME
YEAR 1-5
YEAR 6-10
YEAR 11-20+
City Hall restoration, Brisbane
SPONSORS
Council
ESTIMATED COST ($m)
215
2 Sandgate Town Hall upgrade 3
3 Bridgeman Downs 3.4
4 Lutwyche/Windsor 3.4
5 Annerley 1.7
6 Toowong 3.4
7 Coorparoo/Camp Hill 1.7
8 Eight Mile Plains 3.4
9 Sunnybank 2.9
10 West End 0.8
11 Yeronga/Fairfield 1.7
12 Fortitude Valley/Bowen Hills 4.2
Stones Corner, Buranda – relocation/upgrade/13 4.2
expansion
14 Fairfield – upgrade/expansion 2.1
15 West End – upgrade/expansion 2.1
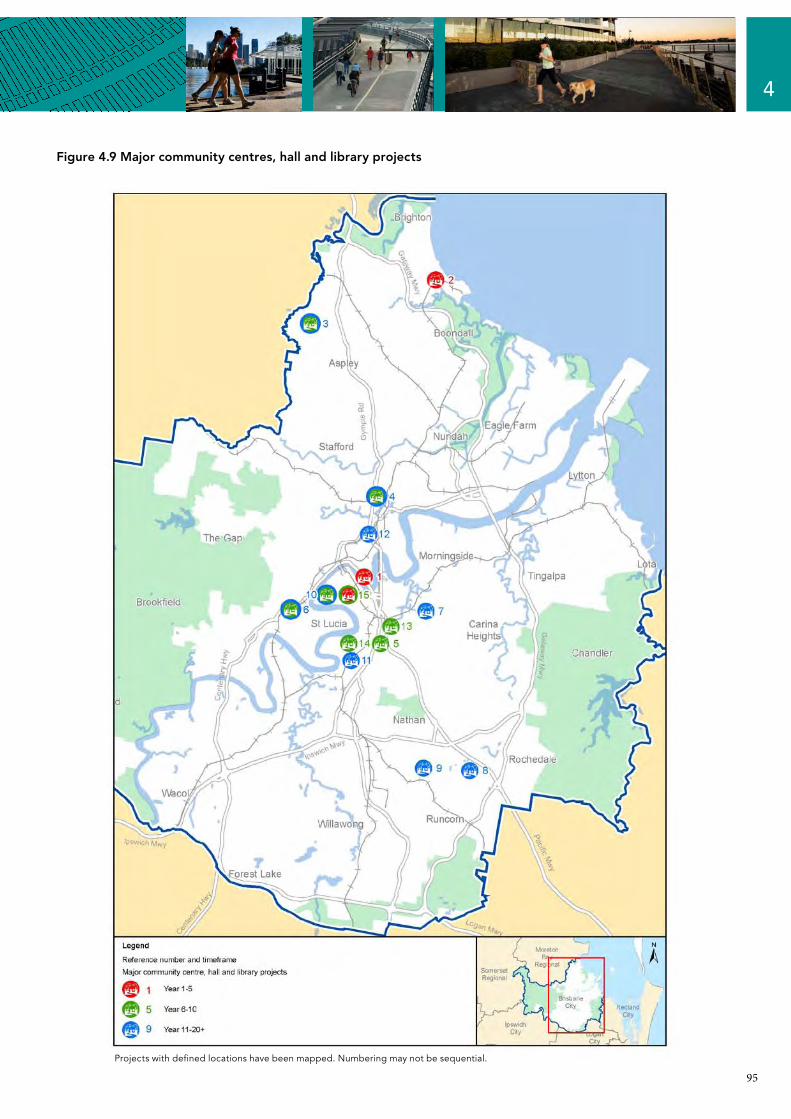
95
4
Figure 4.9 Major community centres, hall and library projects
Projects with defined locations have been mapped. Numbering may not be sequential.
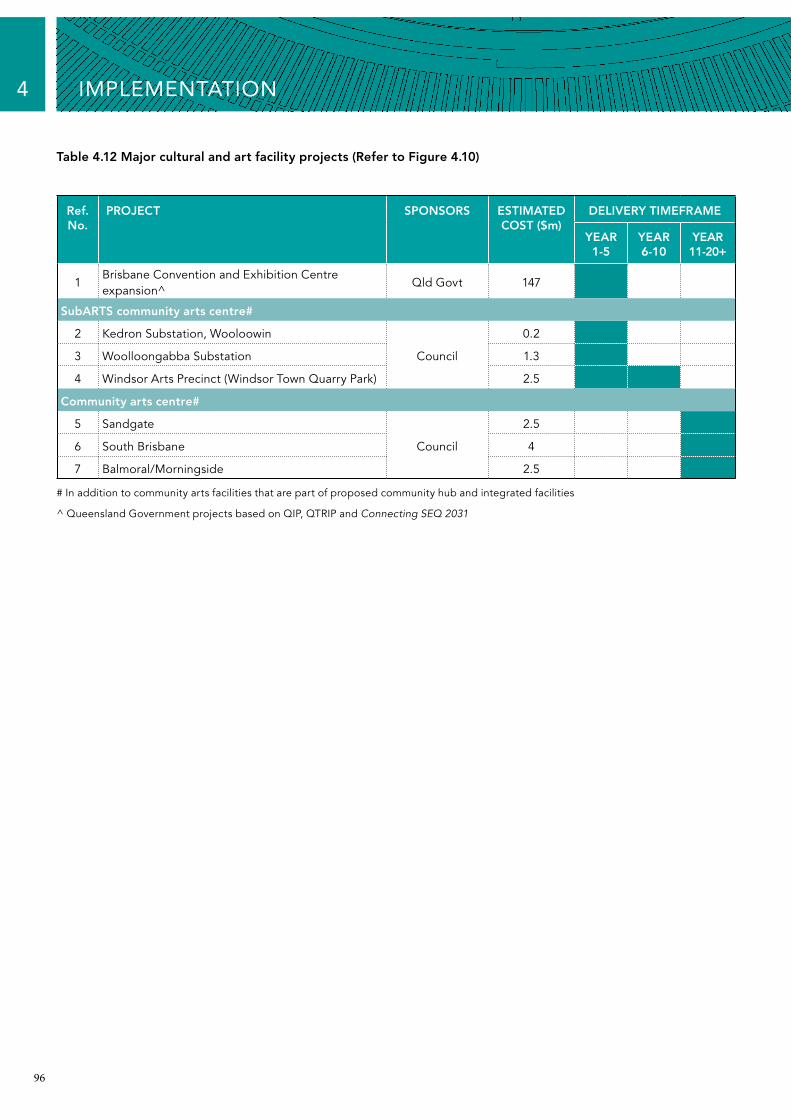
4 IMPLEMENTATION
96
DELIVERY TIMEFRAME
YEAR 1-5
YEAR 6-10
YEAR 11-20+
Table 4.12 Major cultural and art facility projects (Refer to Figure 4.10)
Ref. No.
1
PROJECT
Brisbane Convention and Exhibition Centre expansion^
SPONSORS
Qld Govt
ESTIMATED COST ($m)
147
SubARTS community arts centre#
2 Kedron Substation, Wooloowin
Council
0.2
3 Woolloongabba Substation 1.3
4 Windsor Arts Precinct (Windsor Town Quarry Park) 2.5
Community arts centre#
5 Sandgate
Council
2.5
6 South Brisbane 4
7 Balmoral/Morningside 2.5
# In addition to community arts facilities that are part of proposed community hub and integrated facilities
^ Queensland Government projects based on QIP, QTRIP and Connecting SEQ 2031
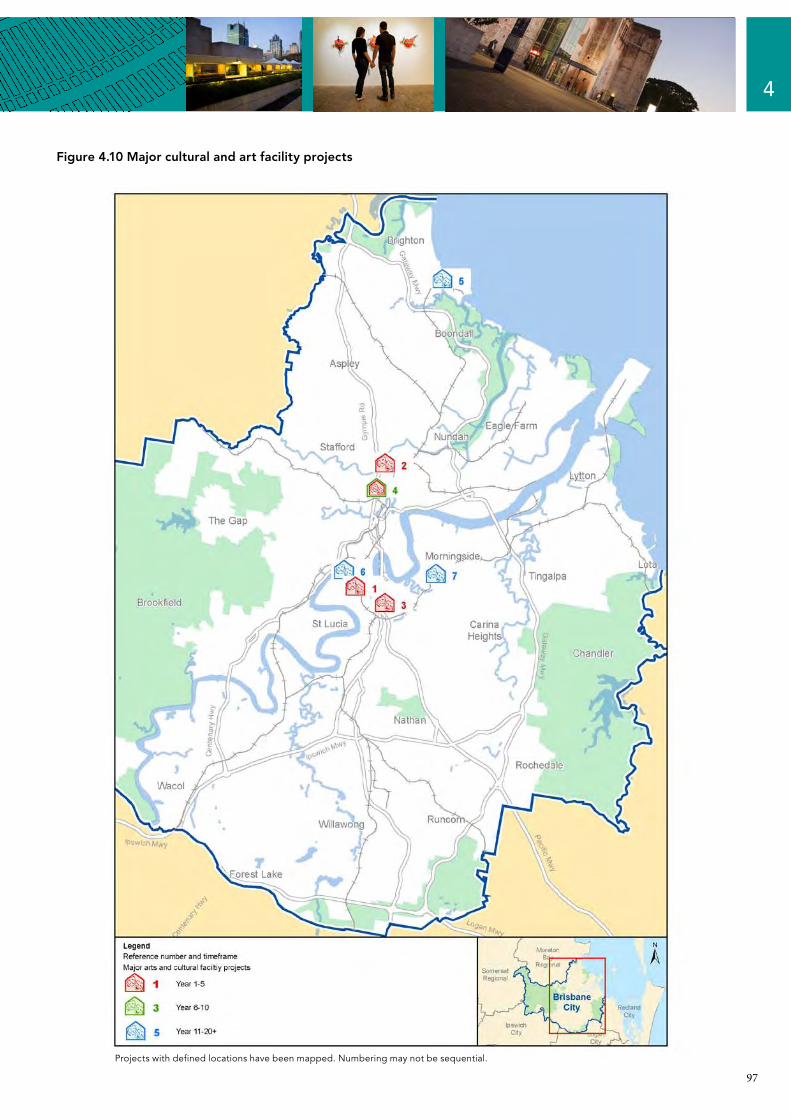
4
97
Figure 4.10 Major cultural and art facility projects
Projects with defined locations have been mapped. Numbering may not be sequential.
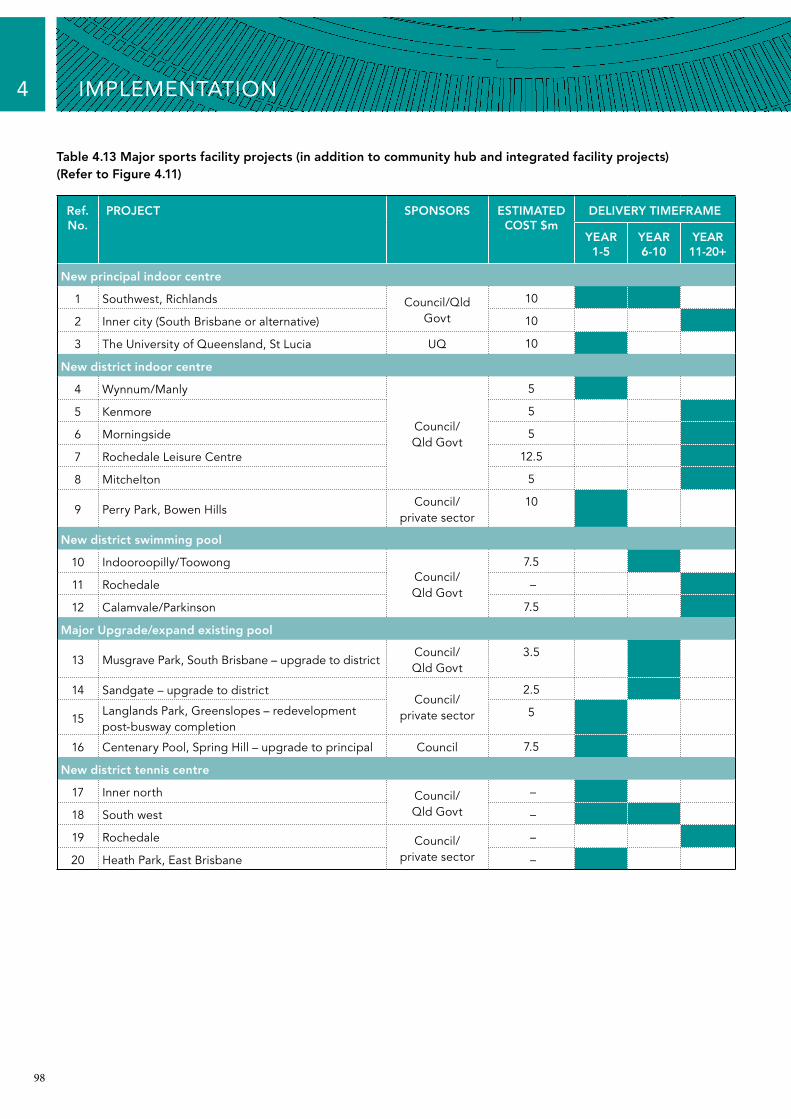
98
4 IMPLEMENTATION
Table 4.13 Major sports facility projects (in addition to community hub and integrated facility projects) (Refer to Figure 4.11)
Ref. No.
DELIVERY TIMEFRAME
YEAR 1-5
YEAR 6-10
YEAR 11-20+
PROJECT
New principal indoor centre
1 Southwest, Richlands
SPONSORS
Council/Qld Govt
ESTIMATED COST $m
10
2 Inner city (South Brisbane or alternative) 10
3 The University of Queensland, St Lucia UQ 10
New district indoor centre
4 Wynnum/Manly
Council/ Qld Govt
5
5 Kenmore 5
6 Morningside 5
7 Rochedale Leisure Centre 12.5
8 Mitchelton 5
9 Perry Park, Bowen HillsCouncil/
private sector10
New district swimming pool
10 Indooroopilly/ToowongCouncil/ Qld Govt
7.5
11 Rochedale –
12 Calamvale/Parkinson 7.5
Major Upgrade/expand existing pool
13 Musgrave Park, South Brisbane – upgrade to districtCouncil/ Qld Govt
3.5
14 Sandgate – upgrade to districtCouncil/
private sector
2.5
Langlands Park, Greenslopes – redevelopment 15
post-busway completion5
16 Centenary Pool, Spring Hill – upgrade to principal Council 7.5
New district tennis centre
17 Inner north –
18 South west –
Council/ Qld Govt
19 Rochedale –
20 Heath Park, East Brisbane –
Council/ private sector
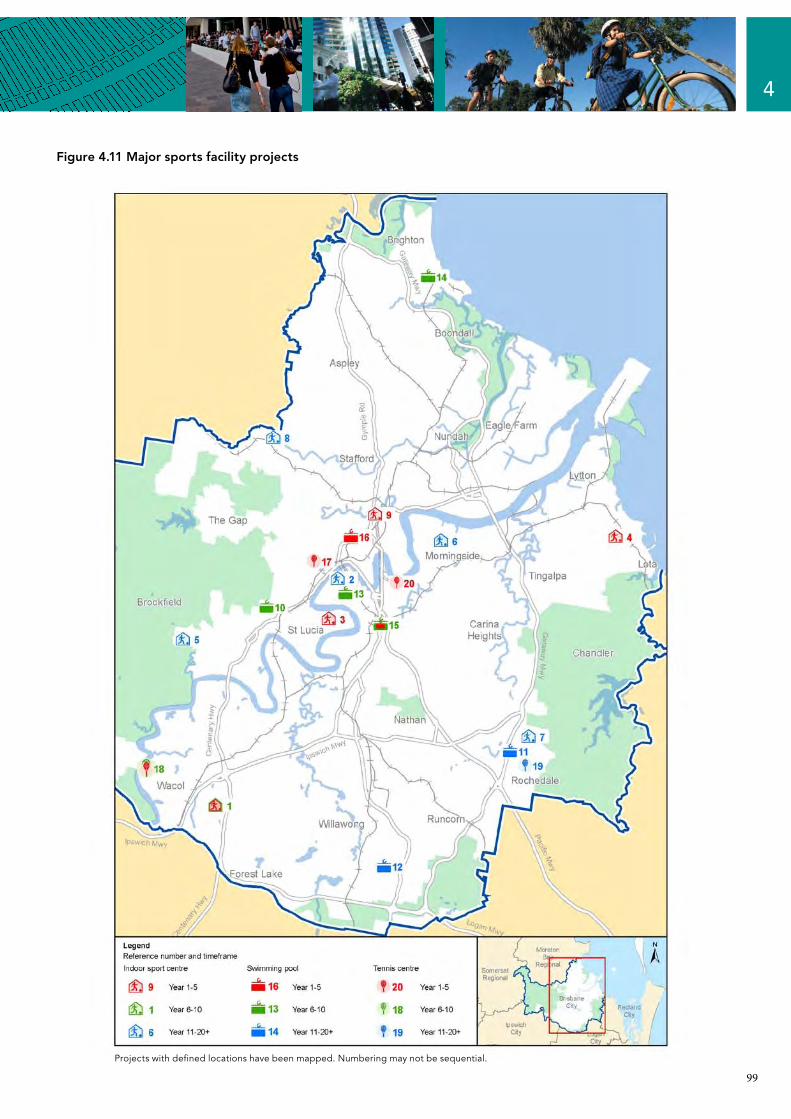
99
4
Figure 4.11 Major sports facility projects
Projects with defined locations have been mapped. Numbering may not be sequential.
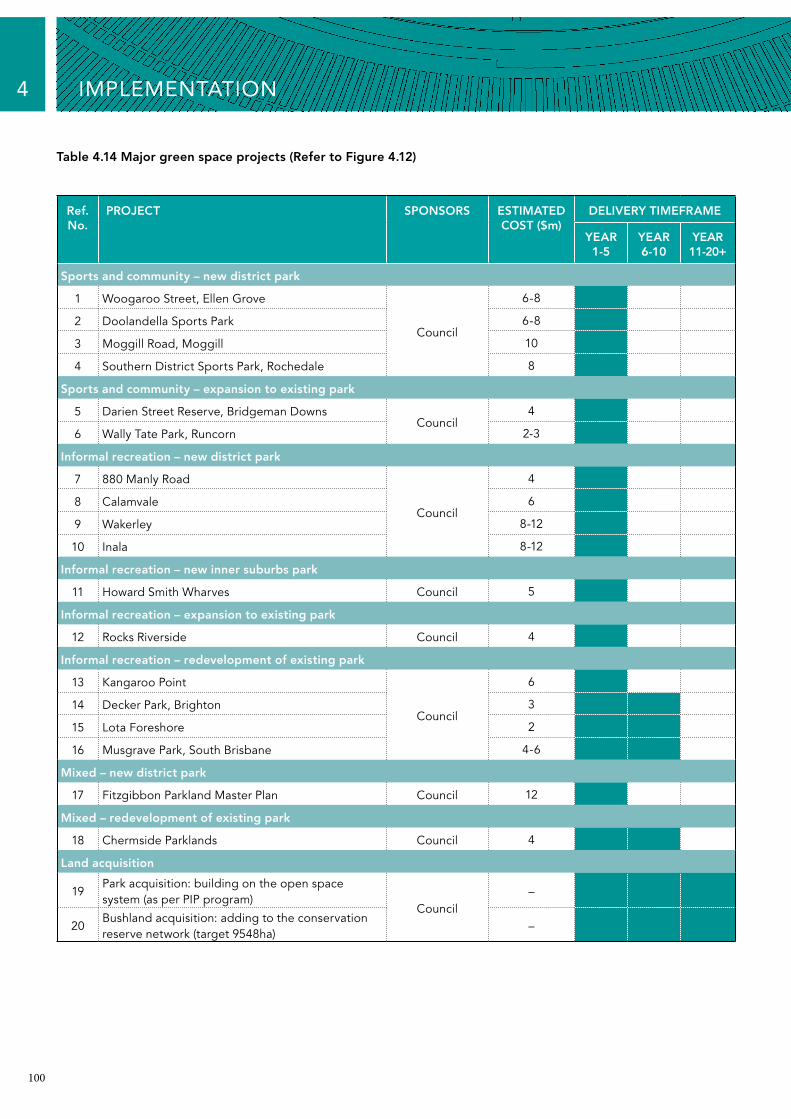
100
4 IMPLEMENTATION
Table 4.14 Major green space projects (Refer to Figure 4.12)
Ref. No.
PROJECT DELIVERY TIMEFRAME
YEAR 1-5
YEAR 6-10
YEAR 11-20+
Sports and community – new district park
1 Woogaroo Street, Ellen Grove
SPONSORS
Council
ESTIMATED COST ($m)
6-8
2 Doolandella Sports Park 6-8
3 Moggill Road, Moggill 10
4 Southern District Sports Park, Rochedale 8
Sports and community – expansion to existing park
5 Darien Street Reserve, Bridgeman DownsCouncil
4
6 Wally Tate Park, Runcorn 2-3
Informal recreation – new district park
7 880 Manly Road
Council
4
8 Calamvale 6
9 Wakerley 8-12
10 Inala 8-12
Informal recreation – new inner suburbs park
11 Howard Smith Wharves Council 5
Informal recreation – expansion to existing park
12 Rocks Riverside Council 4
Informal recreation – redevelopment of existing park
13 Kangaroo Point
Council
6
14 Decker Park, Brighton 3
15 Lota Foreshore 2
16 Musgrave Park, South Brisbane 4-6
Mixed – new district park
17 Fitzgibbon Parkland Master Plan Council 12
Mixed – redevelopment of existing park
18 Chermside Parklands Council 4
Land acquisition
Park acquisition: building on the open space 19
system (as per PIP program)–
Bushland acquisition: adding to the conservation 20
reserve network (target 9548ha)–
Council

101
4
Figure 4.12 Major green space projects
Projects with defined locations have been mapped. Numbering may not be sequential.
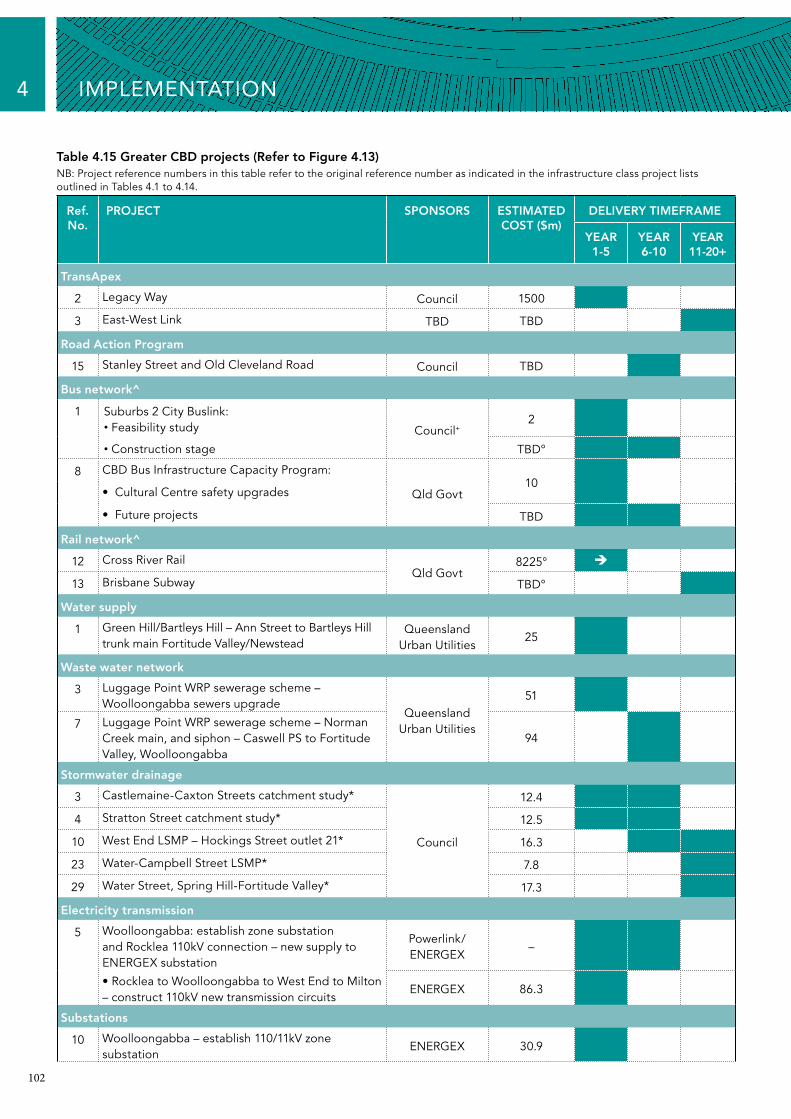
102
4 IMPLEMENTATION
Table 4.15 Greater CBD projects (Refer to Figure 4.13)NB: Project reference numbers in this table refer to the original reference number as indicated in the infrastructure class project lists outlined in Tables 4.1 to 4.14.
Ref. No.
PROJECT DELIVERY TIMEFRAME
YEAR 1-5
YEAR 6-10
YEAR 11-20+
TransApex
2 Legacy Way
SPONSORS
Council
ESTIMATED COST ($m)
1500
3 East-West Link TBD TBD
Road Action Program
15 Stanley Street and Old Cleveland Road Council TBD
Bus network^
1 Suburbs 2 City Buslink:• Feasibility study Council+
2
• Construction stage TBD°
8 CBD Bus Infrastructure Capacity Program:
•CulturalCentresafetyupgrades Qld Govt10
•Futureprojects TBD
Rail network^
12 Cross River RailQld Govt
8225°
13 Brisbane Subway TBD°
Water supply
1 Green Hill/Bartleys Hill – Ann Street to Bartleys Hill trunk main Fortitude Valley/Newstead
Queensland Urban Utilities
25
Waste water network
3 Luggage Point WRP sewerage scheme – Woolloongabba sewers upgrade
Queensland Urban Utilities
51
7 Luggage Point WRP sewerage scheme – Norman Creek main, and siphon – Caswell PS to Fortitude Valley, Woolloongabba
94
Stormwater drainage
3 Castlemaine-Caxton Streets catchment study*
Council
12.4
4 Stratton Street catchment study* 12.5
10 West End LSMP – Hockings Street outlet 21* 16.3
23 Water-Campbell Street LSMP* 7.8
29 Water Street, Spring Hill-Fortitude Valley* 17.3
Electricity transmission
5 Woolloongabba: establish zone substation and Rocklea 110kV connection – new supply to ENERGEX substation
Powerlink/–
ENERGEX
•RockleatoWoolloongabbatoWestEndtoMilton– construct 110kV new transmission circuits
ENERGEX 86.3
Substations
10 Woolloongabba – establish 110/11kV zone ENERGEX 30.9
substation

103
4
Table 4.15 Greater CBD projects (Refer to Figure 4.13) (continued)
Ref. No.
14
PROJECT DELIVERY TIMEFRAME
YEAR 1- 5
YEAR 6 - 10
YEAR 11-20+
Buranda – establish zone substation
SPONSORS
ENERGEX
ESTIMATED COST ($m)
12.9
23 Victoria Park – convert to 110/11kV and new 110kV, 33kV and 11kV switchgear
26.8
24 Makerston Street – install 110kV indoor switchboard
9.8
27 Adelaide Street – establish 110/11kV zone substation
31.9
Feeders
29 Wellington Road to Coorparoo – establish double circuit 110kV UG
ENERGEX
48.4
30 Victoria Park to Ann Street – establish new double circuit 110kV UG feeders
20.5
31 Ann Street to Adelaide Street to Makerston Street – establish new double circuit 110kV UG feeders
11.2
41 Roma Street Rail yards to Makerston Street – establish 110kV supply to Queensland Rail 110/25kV
7.8
43 Kelvin Grove to Milton – feeder works from 110kV F782
48.5
56 Nudgee to Hendra to Victoria Park – reinforce Brisbane CBD with additional 110kV UG
81.3
Health^
3 Translational Research InstituteQueensland
Health
334
4 Queensland Children’s Hospital and Academic and Research Centre
1434
Law enforcement^
9 Brisbane Supreme Court and District Court Department of Justice and
Attorney-General
570
New district integrated facility
19 Stones Corner Council 4.2
Major community centre/hall/library
1 City Hall restoration, Brisbane Council 215
12 Fortitude Valley/Bowen Hills 4.2Council
Major cultural and art facility projects^
1 Brisbane Convention and Exhibition Centre expansion
Qld Govt 147

104
4 IMPLEMENTATION
Table 4.15 Greater CBD projects (Refer to Figure 4.13) (continued)
Ref. No.
PROJECT DELIVERY TIMEFRAME
YEAR 1-5
YEAR 6-10
YEAR 11-20+
SubARTS community arts centre#
3 Woolloongabba Substation
SPONSORS
Council
ESTIMATED COST ($m)
1.3
New district community arts centre#
6 South Brisbane Council 4
New principal indoor sports centre
2 Inner City (South Brisbane or alternative) Council/ Qld Govt
10
Major upgrade/expand existing pool
13 Musgrave Park, South Brisbane – upgrade to district Council/ Qld Govt
3.5
15 Langlands Park, Greenslopes – redevelopment post-busway completion
Council/ private sector
5
16 Centenary Pool, Spring Hill – upgrade to principal Council 7.5
New district tennis centre
17 Inner north Council/ Qld Govt
–
Informal recreation – new inner suburbs park
11 Howard Smith Wharves Council 5
Informal recreation – redevelopment of existing park
16 Musgrave Park, South Brisbane Council 4-6
+ Subject to outcome of feasibility study and Queensland Government and Federal Government funding
^ Queensland Government projects based on QIP, QTRIP and Connectimg SEQ 2031
*Works to be staged
# In addition to proposed community hub and integrated facilities
TBD – To be decided
WRP – Water Reclamation Plant
PS – Pump station
LSMP – Local stormwater management plan
UG – underground
Timing beyond Year 1-5, exact timing not specified
° Subject to federal funding
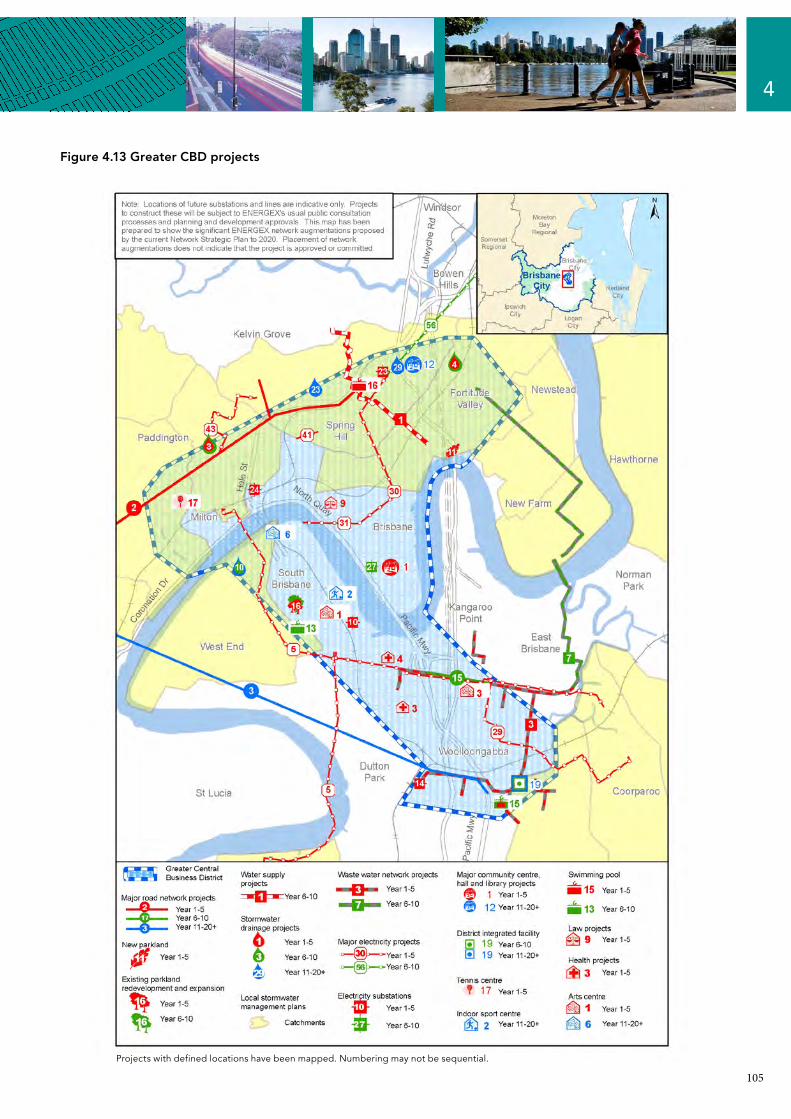
105
4
Figure 4.13 Greater CBD projects
Projects with defined locations have been mapped. Numbering may not be sequential.

106
4 IMPLEMENTATION
Table 4.16 Australia TradeCoast projects (Refer to Figure 4.14)NB: Project reference numbers in this table refer to the original reference number as indicated in the infrastructure class project lists outlined in Tables 4.1 to 4.14.
Ref. No.
PROJECT DELIVERY TIMEFRAME
YEAR 1-5
YEAR 6-10
YEAR 11-20+
TransApex
1 Airport Link
SPONSORS
Qld Govt/ BrisConnections
ESTIMATED COST ($m)
4800
Road Action Program
14 Kingsford Smith Drive: future stages Council TBD
Road upgrades
26 Kingsford Smith Drive/Eagle Farm Road – upgrade to six lanes, Gateway Motorway to Eagle Farm Road
Council 35
Corridor Improvements
46 Creek Road Council 31
Arterials, motorways and highways^
59 East-West Arterial upgrade: Airport Link to Gateway Motorway
Qld Govt
326
63 Gateway Motorway upgrade North: future stages TBD°
68 Port of Brisbane Motorway upgrade•LindumStreettoPritchardStreet
385°
Bus network^
3 Northern bus depot (Australia TradeCoast), Schneider Road, Eagle Farm
Council 69
Major air, sea and rail freight projects^
1 Port of Brisbane infrastructure – including Berth and Wharf 11 and 12 Hamilton site redevelopment
Port of Brisbane 2265
Water supply
4 Australia TradeCoast water upgrades Queensland Urban Utilities
47
5 Wellers Hill – Thynne Road, Morningside 5.5
Waste water network
5 Luggage Point WRP Sewerage Scheme – Virginia Branch, Virginia/Hendra
Queensland Urban Utilities
41
6 Luggage Point WRP S1 Main Sewer Interceptor – Cooksley Street to Eagle Farm/Hamilton
186
8 Luggage Point WRP Sewerage Scheme – Eagle Farm 1840mm Rising Main – Serpentine PS to Luggage Point WRP, Pinkenba
47

Table 4.16 Australia TradeCoast projects (Refer to Figure 4.14) (continued)
107
4
Ref. No.
PROJECT DELIVERY TIMEFRAME
YEAR 1-5
YEAR 6-10
YEAR 11-20+
Waste water treatment
11 Gibson Island WRP – wet weather capacity upgrade
SPONSORS
Queensland Urban Utilities
ESTIMATED COST ($m)
13.2
12 Gibson Island WRP – capacity and treatment upgrade
70.1
14 Luggage Point WRP – outfall capacity upgrade 4.7
15 Luggage Point WRP – grit removal system upgrade 7.8
16 Luggage Point WRP – odour system 30.8
17 Luggage Point WRP – capacity and treatment upgrade
51.9
Electricity transmission
3 Nudgee to Murarrie transmission line (275kV) Powerlink –
Substations
15 Doboy – establish zone substation
ENERGEX
6.8
16 Lomandra Drive – establish zone substation 3.4
18 Pandanus Avenue – establish zone substation 4.7
19 Whinstanes – establish zone substation 11.7
20 Fisherman Island North – establish zone substation 23.2
26 Fisherman Island – establish 110/33kV bulk substation
7.4
Feeders
42 Myrtletown to Pandanus Avenue – establish 33kV DCCT feeders energised by 11kV
ENERGEX
4.2
44 Meeandah to Myrtletown – replace 4.1km of 33kV OH feeder F609
1.6
45 Hemmant to Tingalpa•replace3.5kmof33kVOHfeederF558
1.3
•replace3.3kmof33kVOHfeederwith 33kV UG F560
5.1
47 Wellington Road to Doboy BS – replace 33kV OH feeder F584
3.8
53 Doboy BS to Lota – uprate 33k feeder F414, F558, F569 and F560, including new double circuit to Lota BS
10
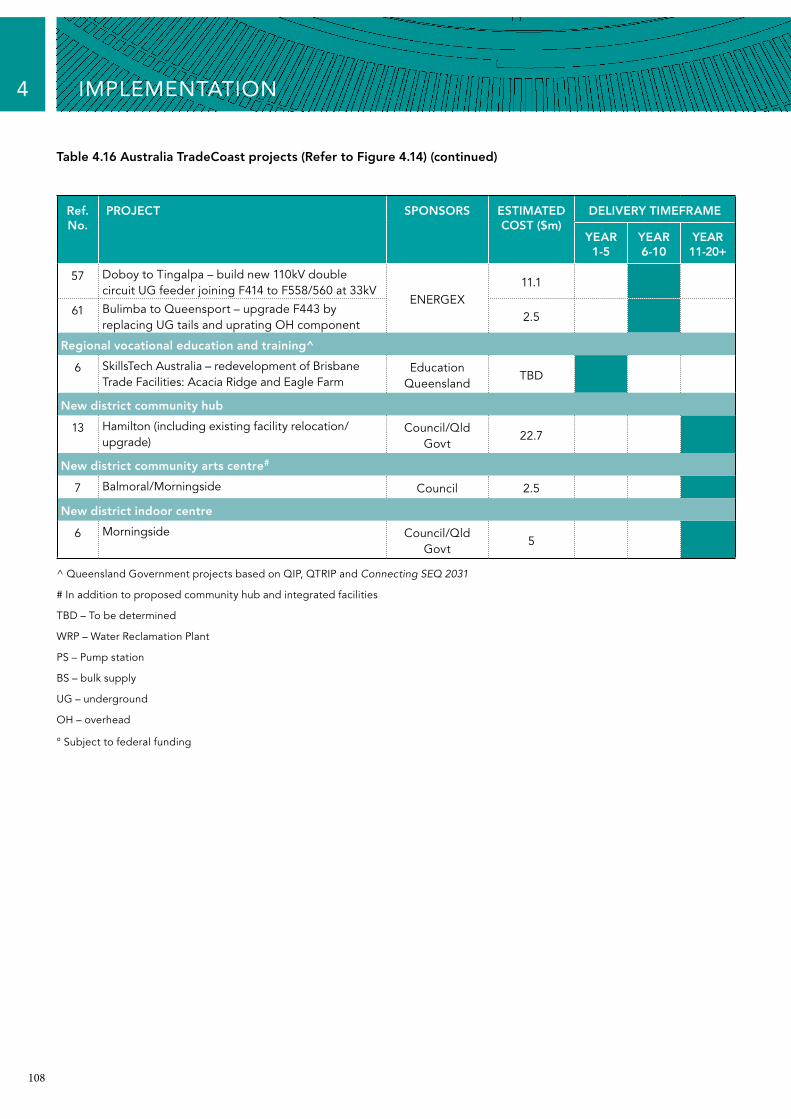
108
4 IMPLEMENTATION
Table 4.16 Australia TradeCoast projects (Refer to Figure 4.14) (continued)
Ref. No.
57
PROJECT DELIVERY TIMEFRAME
YEAR 1-5
YEAR 6-10
YEAR 11-20+
Doboy to Tingalpa – build new 110kV double circuit UG feeder joining F414 to F558/560 at 33kV
SPONSORS
ENERGEX
ESTIMATED COST ($m)
11.1
61 Bulimba to Queensport – upgrade F443 by replacing UG tails and uprating OH component
2.5
Regional vocational education and training^
6 SkillsTech Australia – redevelopment of Brisbane Trade Facilities: Acacia Ridge and Eagle Farm
Education Queensland
TBD
New district community hub
13 Hamilton (including existing facility relocation/upgrade)
Council/Qld Govt
22.7
New district community arts centre#
7 Balmoral/Morningside Council 2.5
New district indoor centre
6 Morningside Council/Qld Govt
5
^ Queensland Government projects based on QIP, QTRIP and Connecting SEQ 2031
# In addition to proposed community hub and integrated facilities
TBD – To be determined
WRP – Water Reclamation Plant
PS – Pump station
BS – bulk supply
UG – underground
OH – overhead
° Subject to federal funding
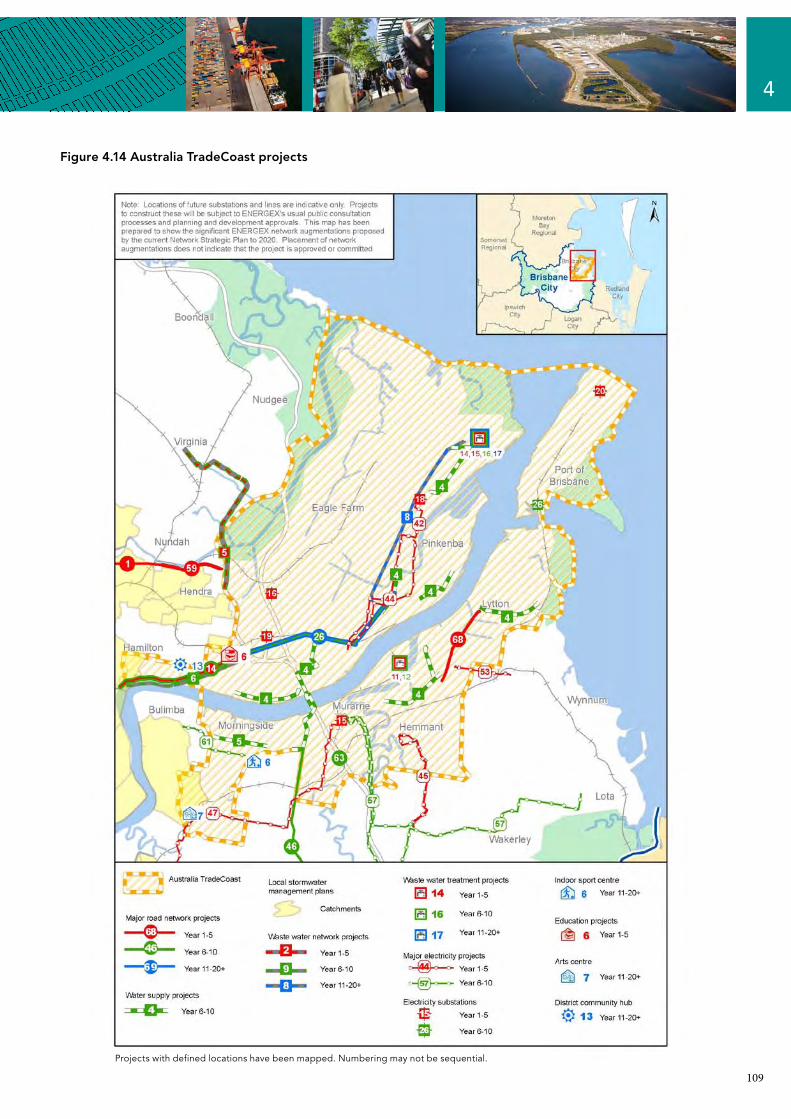
109
4
Figure 4.14 Australia TradeCoast projects
Projects with defined locations have been mapped. Numbering may not be sequential.
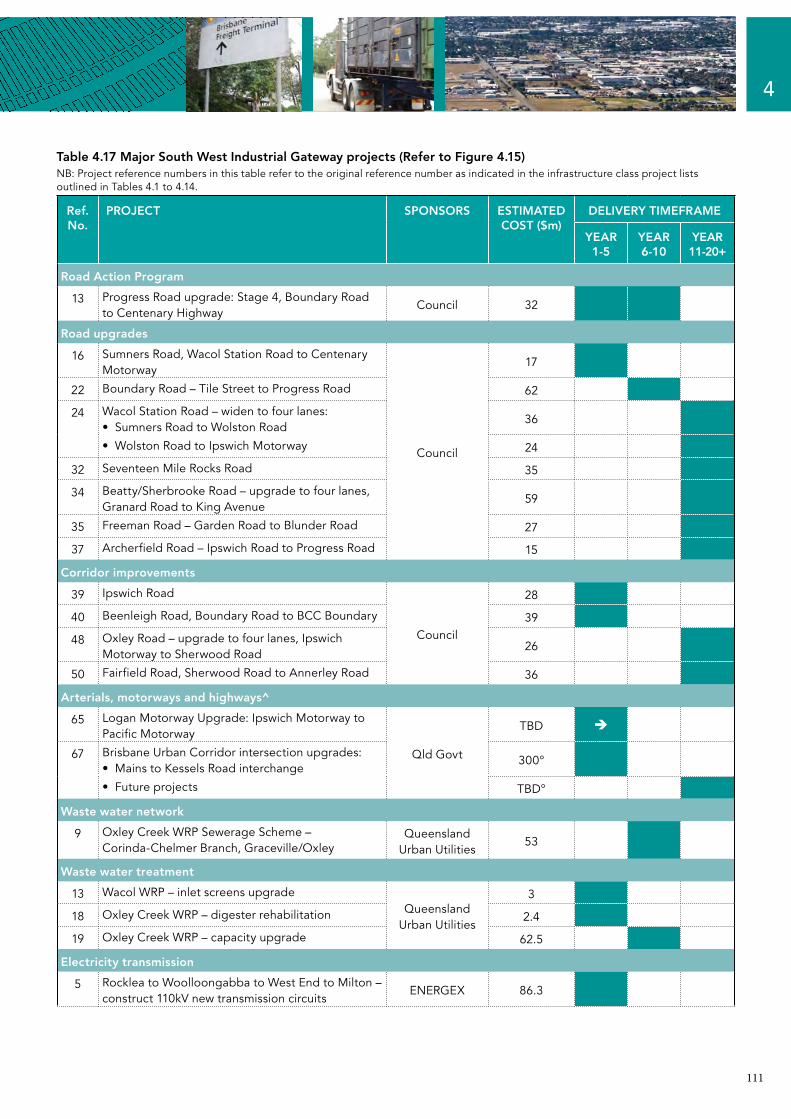
111
4
Table 4.17 Major South West Industrial Gateway projects (Refer to Figure 4.15)NB: Project reference numbers in this table refer to the original reference number as indicated in the infrastructure class project lists outlined in Tables 4.1 to 4.14.
Ref. No.
PROJECT DELIVERY TIMEFRAME
YEAR 1-5
YEAR 6-10
YEAR 11-20+
Road Action Program
13 Progress Road upgrade: Stage 4, Boundary Road to Centenary Highway
SPONSORS
Council
ESTIMATED COST ($m)
32
Road upgrades
16 Sumners Road, Wacol Station Road to Centenary Motorway
Council
17
22 Boundary Road – Tile Street to Progress Road 62
24 Wacol Station Road – widen to four lanes:•SumnersRoadtoWolstonRoad
36
•WolstonRoadtoIpswichMotorway 24
32 Seventeen Mile Rocks Road 35
34 Beatty/Sherbrooke Road – upgrade to four lanes, Granard Road to King Avenue
59
35 Freeman Road – Garden Road to Blunder Road 27
37 Archerfield Road – Ipswich Road to Progress Road 15
Corridor improvements
39 Ipswich Road
Council
28
40 Beenleigh Road, Boundary Road to BCC Boundary 39
48 Oxley Road – upgrade to four lanes, Ipswich Motorway to Sherwood Road
26
50 Fairfield Road, Sherwood Road to Annerley Road 36
Arterials, motorways and highways^
65 Logan Motorway Upgrade: Ipswich Motorway to Pacific Motorway
Qld Govt
TBD
67 Brisbane Urban Corridor intersection upgrades:•MainstoKesselsRoadinterchange
300°
•Futureprojects TBD°
Waste water network
9 Oxley Creek WRP Sewerage Scheme – Corinda-Chelmer Branch, Graceville/Oxley
Queensland Urban Utilities
53
Waste water treatment
13 Wacol WRP – inlet screens upgradeQueensland
Urban Utilities
3
18 Oxley Creek WRP – digester rehabilitation 2.4
19 Oxley Creek WRP – capacity upgrade 62.5
Electricity transmission
5 Rocklea to Woolloongabba to West End to Milton – construct 110kV new transmission circuits
ENERGEX 86.3

112
Table 4.17 South West Industrial Gateway projects (Refer to Figure 4.15) (continued)
Ref. No.
PROJECT DELIVERY TIMEFRAME
YEAR 1-5
YEAR 6-10
YEAR 11-20+
Feeders
36 Richlands to Wacol – establish single 33kV UG circuit (double circuit construction)
SPONSORS
ENERGEX
ESTIMATED COST ($m)
12.4
40 Rocklea to Moorooka – construct single circuit 33kV UG cable to replace F517
8.6
49 Oxley to Archerfield – replace F625 and F626 33kV UG
7.5
Regional vocational education and training^
6 SkillsTech Australia redevelopment of Brisbane Trade Facilities: Acacia Ridge and Eagle Farm
Education Queensland TBD
Law enforcement
8 Queensland Police Academy Department of Justice and
Attorney General
460
New district integrated facility
17 Acacia RidgeCouncil
5.1
23 Richlands 3.7
New principal indoor sports centre
1 Southwest, Richlands Council/Qld Govt 10
New district tennis centre
18 Southwest Council/Qld Govt –
^ Queensland Government projects based on QIP, QTRIP and Connecting SEQ 2031
WRP – Water Reclamation Plant
UG – underground
Timing beyond Year 1-5, exact timing not specified
° Subject to federal funding
4 IMPLEMENTATION

Figure 4.15 South West Industrial Gateway projects
Projects with defined locations have been mapped. Numbering may not be sequential.
4
113

114
5 REFERENCES
Australia TradeCoast (2007), Strategic Infrastructure Plan
Australian Bureau of Agricultural and Resource Economics (2007), Australian Energy: National and State Projections to 2029-2030.
Australian Bureau of Statistics (2009), Category No. 8153.0 – Internet Activity, Australia.
Australian Bureau of Statistics (2007-08), 5512.0 Government Finance Statistics, Australia.
Australian Government Bureau of Infrastructure, Transport and Regional Economics (BITRE) (2009), Working Paper 75: National Road Network Intercity Traffic Projections to 2030.
Australian Government Bureau of Infrastructure, Transport and Regional Economics (BITRE) (2006), Working Paper 65 Container and Ship Movements Through Australian Ports, 2004-05 to 2024-25.
Brisbane Airport Corporation (2009), Brisbane Airport Master Plan.
Brisbane City Council (2011a), Brisbane Transport bus patronage data, unpublished.
Brisbane City Council (2011b), Council Budget 2011-2012.
Brisbane City Council (2009a), Brisbane City Council Corporate Plan 2008-12.
Brisbane City Council (2009c), Brisbane City Plan 2000.
Brisbane City Council (2009d), Neighbourhood Plans (various).
Brisbane City Council (2008a), Brisbane City Council Annual Report 2008-09.
Brisbane City Council (2010a), WaterSmart Strategy
Brisbane City Council (2008c), Open Space Strategy.
Brisbane City Council (2008d), Transport Plan for Brisbane 2008-2026.
Brisbane City Council (2007), Brisbane Long Term Infrastructure Plan.
Brisbane City Council (2006a), Brisbane Active Transport Strategy – Walking and Cycling Plan 2005-2010.
Brisbane City Council (2006b), Brisbane City Centre Master Plan 2006.
Brisbane City Council (2006c), Brisbane Economic Development Plan 2006-2011.
Brisbane City Council (2006d), Living in Brisbane 2026.
Brisbane City Council (2006e), The Draft Brisbane CityShape 2026.
Brisbane City Council (2006f), West End River Parks Master Plan.
Brisbane City Council (2004), Brisbane Air Quality Strategy.
Brisbane City Council (2002), Brisbane Sport and Recreation Strategy 2002-2005.
115
5
Environment Protection and Heritage Council (2009), National Waste Overview 2009.
National Institute of Economic and Industry Research (2009), Economic Activity and Employment Forecasts, 2006 to 2031.
National Transport Commission (NTC) (2006), Twice the Task – A review of Australia’s freight transport tasks.
Queensland Government Department of Employment, Economic Development and Innovation (DEEDI) (2009a), Demand for Coal Seam Gas in Queensland.
Queensland Government Department of Infrastructure and Planning (2010a), South East Queensland Infrastructure Plan and Program 2010-2031.
Queensland Government Department of Infrastructure and Planning (2009b), South East Queensland Regional Plan 2009-2031.
Queensland Government (Department of Infrastructure and Planning) (2009c), Statistical Local Area Population Projections (2008 edition – medium series).
Queensland Government (Queensland Water Commission) (2010b), South East Queensland Water Strategy
Queensland Government (Department of Transport) (2008a), Inner City Rail Capacity Study: Pre-Feasibility Report.
Queensland Government (Department of Transport) (2008b), South East Queensland Intermodal Freight Terminal Study.
Queensland Government (Department of Transport and Main Roads) (2010c), Queensland Transport and Roads Investment Program 2010-11 to 2013-14 (QTRIP)
Queensland Government and Brisbane City Council (2008), Brisbane Regional Tourism Investment and Infrastructure Plan.

Brisbane City CouncilInformation
GPO Box 1434Brisbane Qld 4001
For more informationvisit www.brisbane.qld.gov.auor call (07) 3403 8888
N2012-02877© Brisbane City Council 2012
Printed on recycled paper