brimstone symposium september 11, 2014 vail colorado … · page 1 of 27 . brimstone symposium ....
TRANSCRIPT

Page 1 of 27
Brimstone Symposium September 11, 2014 Vail Colorado SRU WHB Tube Rupture Modeling Insights Learned @ BP Cherry Point
by Steve Crockett—BP
Andy Moore—Windward Engineering Gerald Jacobs—VMG
Abstract Conceptualizing the impact of a Claus Unit Waste Heat Boiler (WHB) tube rupture on a sulfur recovery system is difficult. Predicting the pressure rise in a particular sulfur recovery system configuration when a tube ruptures is Herculean. Determining the open area geometry of a failed WHB tube—well, stay tuned as this is a hot topic at the 2014 Brimstone Symposium! Our paper describes how a particular sulfur recovery complex (2 SRUs, 2 TGUs, 1 incinerator) was modeled in order to predict the system pressure profile when a WHB tube ruptured. VMGSim Dynamic software was used as the engine for the model that predicted the impact of a tube rupture. The model was validated by tuning system parameters to match a complete set of BP Cherry Point sulfur recovery complex operating conditions. An event scheduler was used to initiate WHB tube rupture, block-in blowers, shut down acid gas flows, and perform other time, pressure, or temperature sensitive operations. Tube ruptures including both API 521 (tubesheet orifice plus tube stub) and tubesheet orifice only failures were evaluated. Dynamic model results of a tube rupture illustrated some unexpected results. The type and size of the tube rupture may not have as much an impact on the maximum system pressure as other unit characteristics such as main reaction furnace refractory heat transfer, flow path, or extent and timing of safety instrumented system (SIS) response. Ongoing work includes using the validated model to predict the effectiveness of various overpressure protection approaches as well as the impact of various WHB tube failure geometries. Summary How do you predict the outcome of a highly unlikely but potentially devastating Claus unit waste heat boiler (WHB) tube rupture? Isn’t there an industry best practice that addresses this issue? Aren’t sulfur recovery complex hydraulics as simple as modeling pressure drop through a pipe segment? Complexities abound!
• How will the tube rupture? (tubesheet orifice plus tube stub, tubesheet orifice only, fishmouth, pinhole, multiple tube-tubesheet weld cracks, etc.)
Page 2 of 27
• What is the flow path for the steam / boiler feed water (BFW) mix if a tube ruptures? (unit configuration of which Claus unit flows through which tail gas treating unit (TGTU), does the flow path include seal legs or sulfur traps, air blower check valves)
• How will our equipment / instrumentation / SIS respond? (diverter valves, unit feeds {air, acid gas, oxygen}, reheaters, steam non-return valve, etc. )
The key to addressing these questions is to evaluate those parameters that have a significant impact on accumulated equipment overpressure and not become paralyzed by analyzing all the other elements surrounding the impact of a WHB tube rupture. After all, isn’t the goal to predict an accurate maximum pressure if the tube ruptures? "Preconceived notions are the locks on the door to wisdom." -- Merry Browne Background The direction of the API committee investigating SRU WHB failures was described by Mike. Our industry experiences and a potential code-based approach to a solution was illustrated by Lon and Dennis. Alan addressed the fundamental design parameters of WHB steam pressure, tube size, unit capacity, sulfur seal technology, and their impact on accumulated equipment pressure in the event of a tube rupture. Our focus in this paper is on a specific sulfur recovery complex—what happens when the design is completed, the units constructed, and now they’re in operation? Most of the influential factors we learned about from Alan are no longer knobs we can adjust to minimize the impact of a tube rupture. This paper will examine the effects of a WHB tube rupture on the equipment in BP’s Cherry Point Refinery Sulfur Recovery Complex. Features of the complex include:
• Nominal unit capacity of 120 LTPD in each of two Parsons designed Claus units • Oxygen enrichment and SO2 recycle expand capacity to 140 LTPD in each unit • Direct fired reheaters using refinery hydrogen as fuel • SRU WHB:
o operating pressure—140 psig o tube diameter—2.5 inch o.d. / 2.26 inch i.d.
• TGTUs—one SCOT style unit with a booster blower and one Cansolv unit • One natural draft incinerator downstream of the SCOT unit • With the exception of the Cansolv unit, all units were designed and constructed in the
early 70’s. No design considerations for deflagration were included in these units. The primary driving force for this evaluation originated from a PHA revalidation of the sulfur recovery complex. Several of the PHA action items involved reducing the risk of a WHB tube rupture overpressure. …and how do we quantify the risk? How should we reduce the risk?

Page 3 of 27
Specifics Approach BP elected to evaluate the potential SRU overpressure profile using dynamic modeling techniques. This approach insures consistent heat and material balanced results as well as a unit specific platform for evaluating overpressure reduction measures. VMGSim software was used to construct the model. This software is the first commercially available engineering grade package that supports both steady state and dynamic simulation of SRUs. VMGSim uses specialized thermodynamic models specifically developed for SRUs, as well as tailored unit operation models, such as reaction furnaces, converters, condensers, and reheat exchangers that run natively whether operating in steady state or dynamic mode. The model encompasses a transient mass and energy balance. For this project, hydraulic modeling was a key aspect of the study. This was accomplished using the pressure flow network solver in VMGSim. Having a tuned dynamic model in hand, the same simulation can be used for a wide range of additional studies, such as benchmarking performance of existing operations, unit debottlenecking, control system evaluation, and review / development of operating procedures and training. A significant amount of as-operated sulfur complex information was required to construct an accurate model. This information included process and mechanical data sheets, blower curves, control valve Cv data, and interconnecting piping isometric drawings. Once the model was constructed and a few preliminary runs made with BP supplied feed rate and analytical data, we then compared the model results with actual oeprations. Model inputs such as feed rates, feed compositions and reactor inlet temperatures were set to the values extracted from BP’s SRU complex DCS screen shots. Simulation results showed that the system pressure drop from the operating data was noticeably higher than the model predicted. Fortunately, the operating data was sufficiently detailed so that individual equipment item pressure drops could be compared with model results. Within the software, there are pressure drop tuning parameters similar to the k factor in the equation: 𝑚𝑚𝑚𝑚𝑚𝑚𝑚𝑚 𝑓𝑓𝑓𝑓𝑓𝑓𝑓𝑓 = k * �𝜌𝜌 ∗ ∆𝑃𝑃 that were used to match operating equipment pressure drop data. Web meetings were set up with BP operators, engineers, and supervisors so that they could review comparisons of operating data and model results on a real time basis. Once the tuning phase was completed and all parties satisfied that the model results were a reasonable representation of reality, we moved on to the tube rupture evaluation phase. As we looked at the differences between the tuned and un-tuned model, we realized that areas for sulfur complex performance improvement were highlighted by those differences. However, the

Page 4 of 27
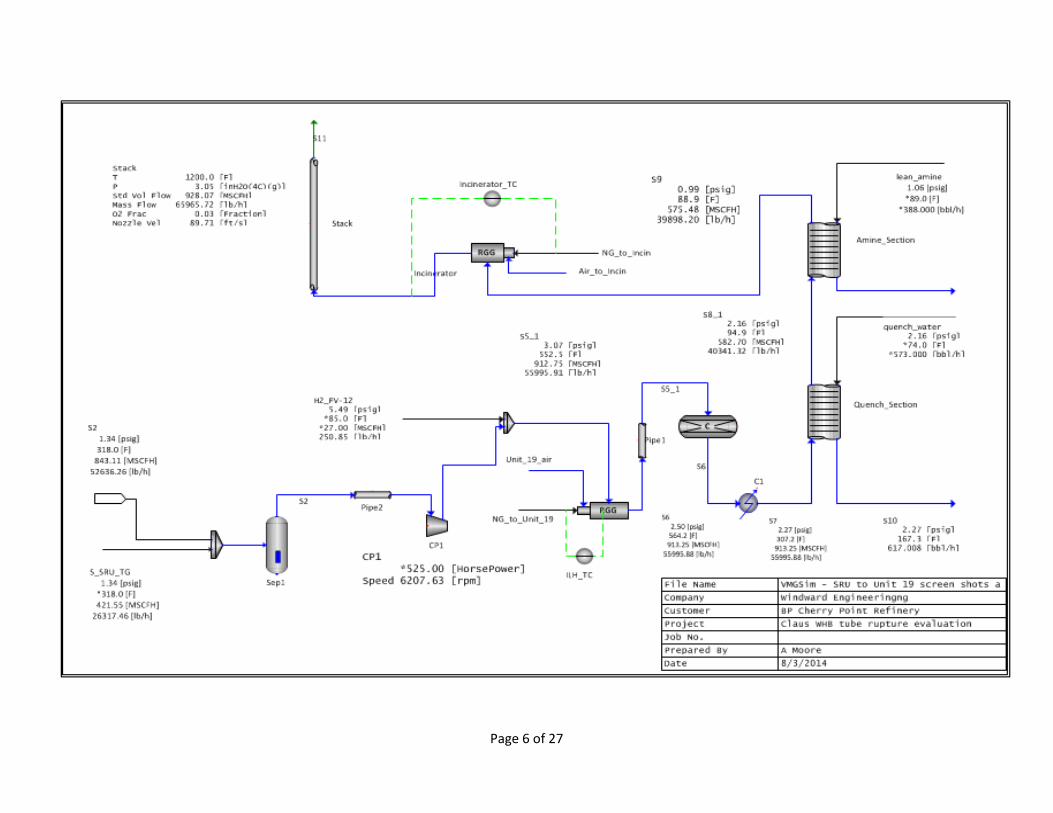
purpose of our evaluation wasn’t to benchmark sulfur recovery complex performance. (Stay on task Andy!) The following is what the tuned VMG model looked like before we began our evaluation runs.

Page 5 of 27
Page 6 of 27

Page 7 of 27
Cherry Point’s sulfur complex operating data screen shots used to tune the model are included as Appendix A. Initial WHB Tube Rupture Evaluations Evaluation Limits Once the model was tuned, we focused on defining limits for the tube rupture evaluation. The evaluation team prepared a truly worst case scenario by not allowing any SIS engagement during the initial WHB tube rupture simulations! In making that decision, the following limits were imposed on the model:
• The WHB steam non-return valve did not close when the tube ruptured. • SO2 recycle from the Cansolv TGTU stopped flowing at the dead-head pressure of the
recycle blower—25 psig. • The air blowers stopped flowing when they reached their dead-head pressure of 30 psig.
This action also shut down the direct-fired reheat exchangers. • Amine acid gas flow stopped when the SRU burner pressure reached the amine
regenerator relief valve set pressure of 50 psig • Sour water stripper acid gas flow stopped when the SRU burner pressure reached the
stripper relief valve set pressure of 65 psig • No flow was allowed through the existing sulfur seal legs • The tail gas diverter valves remained in their normal operating positions • Oxygen, SCOT quench water and amine, Cansolv diamine flows continued at normal
flow rates • The SCOT booster blower continued to operate up to its driver limit of 525 hp • The incinerator continued to operate and maintain temperature—limited by fuel gas flow
The actions that occurred at the SRU burner pressures listed above were incorporated into the model as a series of event triggers in VMGSim’s scheduler unit operation. Using event triggers facilitated evaluating the effects of how the sulfur recovery complex responded to changes in unit limits and trip pressures. Initial event triggers in the scheduler looked like the following:

Page 8 of 27
Failure Cases Evaluated In developing the evaluation cases, the team reviewed the unit line-up within the sulfur recovery complex and decided that there were two configurations of interest; both Claus units flowing into the SCOT unit and one Claus unit flowing into the Cansolv unit. The tube rupture scenarios included the usual suspects:
• Rupture a bottom-of-the-bundle tube with a clean break at the hot tubesheet. This was a full cross-section break and assumed that the tube stub end was pinched closed by a combination of tube wall thinning and steam pressure.
• Rupture a top-of-the-bundle tube break at the hot tubesheet as described above • Rupture a bottom-of-the-bundle tube in an API-521 defined break with flow into the
process from both a clean hot tubesheet break as described above plus flow through an open-ended tube stub
At the end of the team’s definition efforts, four cases evolved. Those cases were:
• Case 1—Both North and South SRUs (280 LTPD total sulfur feed) flowed through the SCOT tail gas treating unit and into the incinerator. A WHB bottom tube rupture (orifice only) in the North SRU was evaluated
• Case 2—The South SRU (122.7 LTPD sulfur feed) flowed through the Cansolv tail gas treating unit and vented to atmosphere. A WHB bottom tube rupture (orifice only) in the South SRU was evaluated
• Case 3—Worst case of 1 or 2 above replacing a WHB bottom tube rupture with a WHB top tube rupture (orifice only)
• Case 4—Worst case of 1 or 2 above replacing orifice-only tube rupture with an API RP-521 tubesheet orifice plus open tube stub rupture
Page 9 of 27
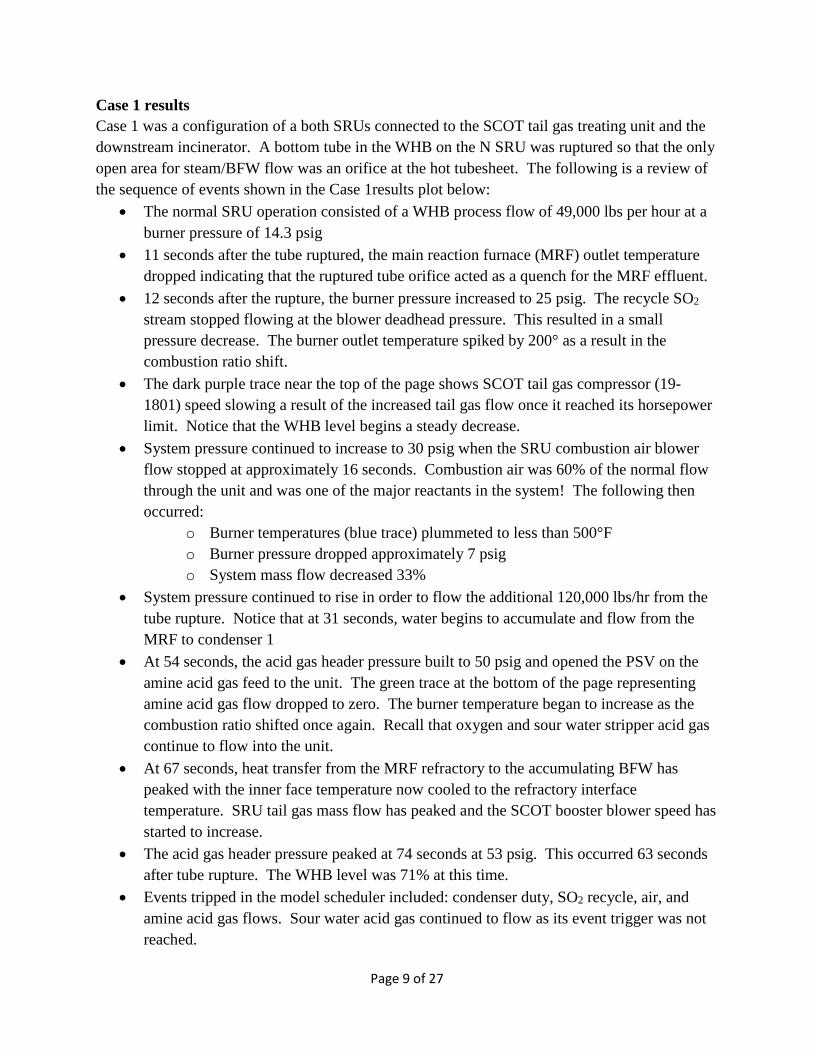
Case 1 results Case 1 was a configuration of a both SRUs connected to the SCOT tail gas treating unit and the downstream incinerator. A bottom tube in the WHB on the N SRU was ruptured so that the only open area for steam/BFW flow was an orifice at the hot tubesheet. The following is a review of the sequence of events shown in the Case 1results plot below:
• The normal SRU operation consisted of a WHB process flow of 49,000 lbs per hour at a burner pressure of 14.3 psig
• 11 seconds after the tube ruptured, the main reaction furnace (MRF) outlet temperature dropped indicating that the ruptured tube orifice acted as a quench for the MRF effluent.
• 12 seconds after the rupture, the burner pressure increased to 25 psig. The recycle SO2 stream stopped flowing at the blower deadhead pressure. This resulted in a small pressure decrease. The burner outlet temperature spiked by 200° as a result in the combustion ratio shift.
• The dark purple trace near the top of the page shows SCOT tail gas compressor (19-1801) speed slowing a result of the increased tail gas flow once it reached its horsepower limit. Notice that the WHB level begins a steady decrease.
• System pressure continued to increase to 30 psig when the SRU combustion air blower flow stopped at approximately 16 seconds. Combustion air was 60% of the normal flow through the unit and was one of the major reactants in the system! The following then occurred:
o Burner temperatures (blue trace) plummeted to less than 500°F o Burner pressure dropped approximately 7 psig o System mass flow decreased 33%
• System pressure continued to rise in order to flow the additional 120,000 lbs/hr from the tube rupture. Notice that at 31 seconds, water begins to accumulate and flow from the MRF to condenser 1
• At 54 seconds, the acid gas header pressure built to 50 psig and opened the PSV on the amine acid gas feed to the unit. The green trace at the bottom of the page representing amine acid gas flow dropped to zero. The burner temperature began to increase as the combustion ratio shifted once again. Recall that oxygen and sour water stripper acid gas continue to flow into the unit.
• At 67 seconds, heat transfer from the MRF refractory to the accumulating BFW has peaked with the inner face temperature now cooled to the refractory interface temperature. SRU tail gas mass flow has peaked and the SCOT booster blower speed has started to increase.
• The acid gas header pressure peaked at 74 seconds at 53 psig. This occurred 63 seconds after tube rupture. The WHB level was 71% at this time.
• Events tripped in the model scheduler included: condenser duty, SO2 recycle, air, and amine acid gas flows. Sour water acid gas continued to flow as its event trigger was not reached.

Page 10 of 27
Case 1 Simulation Results

Page 11 of 27
Location Max Pressure, psig Burner 53.3 RH1 inlet 49.2 RH2 inlet 41.6 RH3 inlet 34.0 Unit 19 inlet 24.1 Unit 19 compressor outlet 26.3
Case 2 results The flow scheme for Case 2 differs from that in Case 1. The SRU in this case operated at a lower feed rate and flowed through the Cansolv unit. Similar to Case 1, a bottom WHB tube was ruptured in an “orifice-only” configuration for this case. The following is a detailed review of the sequence of events shown in the Case 2 results plot shown below that differ from the Case 1 evaluation:
• The normal SRU operation consisted of a WHB process flow of 37,000 lbs per hour at a burner pressure of 9 psig
• The acid gas header pressure peaked at 62 seconds at 49 psig. This occurred 51 seconds after tube rupture.
• Events tripped in the model scheduler included: condenser duty, SO2 recycle, and air flows. Amine and sour water acid gases continued to flow as their event triggers were not reached.
0
10
20
30
40
50
60
Burner RH1 inlet RH2 inlet RH3 inlet Unit 19 inlet Unit 19compressor
outlet
BP Cherry Point WHB tube rupture evaluationCase 1--Both SRUs flow through Unit 19
Maximum pressure profile, psig

Page 12 of 27
Case 2 Simulation Results
•

Page 13 of 27
Location Max Pressure, psig Burner 48.7
RH1 inlet 40.6 RH2 inlet 32.6 RH3 inlet 23.6
Cond 4 outlet 12.0 Case 3 results Case 3 used Case 1 as a basis but ruptured a top tube in the WHB tube bundle. The same style orifice-only rupture occurred. The end result is that the same amount of steam / BFW flowed into the SRU until the WHB level dropped below the rupture. At that point, the amount of flow from the top tube rupture was significantly less than from the bottom tube rupture—120,000 lb/hr vs. 50,000 lbs/hr. The following is a detailed review of the sequence of events shown in the Case 3 results plot shown below that differ from the Case 1 evaluation:
• The WHB level has decreased from 75% to 74.4 ten seconds after tube rupture. The level of the top tube is located at 72.6% on the WHB.
• At 52 seconds, the tube rupture mass flow and the SRU tail gas mass flow are equal at 83,000 lbs/hr. The heat transfer from the MRF refractory to the accumulating BFW has peaked.
• The MRF burner pressure peaked at 66 seconds at 48 psig. This occurred 54 seconds after tube rupture. The WHB level was 72.7% at this point.
• Events tripped in the model scheduler included: condenser duty, SO2 recycle, and air flows. Amine and sour water acid gases continued to flow as their event triggers were not reached.
0
10
20
30
40
50
60
Burner RH1 inlet RH2 inlet RH3 inlet Cond 4 outlet
BP Cherry Point WHB tube rupture evaluationCase 2--S SRU through Unit 25
Maximum pressure profile, psig

Page 14 of 27
Case 3 Simulation Results

Page 15 of 27
Location Max Pressure, psig Burner 47.7 RH1 inlet 44.0 RH2 inlet 36.9 RH3 inlet 29.8 Unit 19 inlet 20.6 Unit 19 compressor outlet 22.9
Case 4 results Case 4 used Case 1 as a base and replaced the orifice-only tube rupture with an API-RP-521 tube rupture. The following is a detailed review of the sequence of events shown in the Case 3 results plot shown below that differ from the Case 1 evaluation:
• After the air blower flow stopped at approximately 16 seconds, system mass flow decreased 15%
• System pressure continued to increase in order to flow the additional 250,000 lbs/hr from the tube rupture.
• The acid gas header pressure peaked at 60 seconds at 50 psig. This occurred 48.5 seconds after tube rupture. Note that the WHB level decreased to 59 % during this period.
0102030405060
Burner RH1 inlet RH2 inlet RH3 inlet Unit 19 inlet Unit 19compressor
outlet
BP Cherry Point WHB tube rupture evaluationCase 3--Case 1 with top WHB tube rupture
Maximum pressure profile, psig

Page 16 of 27
Case 4 Simulation Results

Page 17 of 27
Location Max Pressure, psig Burner 50.1 RH1 inlet 49.2 RH2 inlet 44.4 RH3 inlet 37.3 Unit 19 inlet 23.3 Unit 19 compressor outlet 26.0
Observations: … all that heat Consider for a moment the fate of the steam / BFW mix that exits the WHB shell and travels into the MRF after a tube rupture. Critical or choke flow of 145 psig bubble point boiler feed water through a 2.5 inch od (2.26 inch id) tubesheet orifice is approximately 120,000 lbs/hr. Flashing that flow to a nominal 15 psig yields approximately 12.8 mass % vapor or 15,360 lbs/hr steam. If the sulfur recovery equipment process side pressure increased to 55 psig, the vapor in the flashed stream would be 7% or 8,400 lb/hr. This means that approximately 110,000 lbs/hr of saturated BFW enters the nominal 2400°F refractory lined MRF. With an internal surface area of 226 square feet and a Nusselt number derived heat transfer coefficient of 110 BTU/(hr*ft^2/°F), this would result in the transfer of approximately 51 MMBTU/hr and generate 60,000 lbs/hr of steam leaving 100 gpm of BFW exiting the WHB to either accumulate or vaporize in the downstream piping and equipment. At the end of Case 4 simulation, the MRF had accumulated a 4% level of water. Please note that the MRF outlet nozzle was at the bottom
0
10
20
30
40
50
60
Burner RH1 inlet RH2 inlet RH3 inlet Unit 19 inlet Unit 19compressor
outlet
BP Cherry Point WHB tube rupture evaluationCase 4--Case 1 with API RP-521 tube failure
Maximum pressure profile, psig

Page 18 of 27
of the vessel. Simulation results showed that the combination of the Claus burner heat release and downstream equipment temperature vaporized approximately 15,000 lbs/hr of BFW. Consider the SRU with a maximum normal throughput of 49,300 lbs/hr will experience a flow of 4,000 lb/hr process gas, 10,000 lb/hr flashed steam, 60,000 lb/hr MRF vaporized BFW and 15,000 lbs/hr of SRU piping/equipment vaporized BFW for a total of 89,000 lbs/hr during a WHB tube rupture. Using straight pressure drop estimates, that would result in a pressure increase of 3.3 times the normal operating pressure! Thermal Reactor Refractory The refractory design in the Main Reaction Furnace was added to the model in the form of heat loss calculations from the vessel. The MRF heat loss details were modeled as:
Normal Operation Post-rupture Operation

Page 19 of 27
Referring to the information in the dashed box above: • In the normal operation case, notice the uniform heat duty through the refractory layers
starting with the dense brick inner face on the left, refractory interface in the center and insulating refractory outer face on the right. The temperature profiles are within normal expectations.
• Contrast the post-rupture data with negative heat flow (heat into the system), decreased inner face refractory temperature on the left, reduced heat from across the interface and unaffected heat flow / temperature across the outer face of the insulating refractory layer. There’s still lots of heat in that brick! …and this occurred within 2 minutes after tube rupture.
…all that water More water flows into the MRF than is vaporized by the refractory. In the simulation results above, there’s about 75 gpm of water that exits the MRF. Where will that 35,000 lbs of water go? It could make a real mess of the sulfur pit / tank (if seal legs were in place or if sulfur trap devices passed water) Case 4 model modifications—API 521 style rupture: Simulating an API RP-521 rupture took some additional creativity. We originally started out simulating the rupture using the model configurations shown on pages 3 and 4. We quickly learned that process models set up to calculate Claus reactions as well as combustion reactions do not like to be fed only steam and water. In the interest of developing feasible comparisons, we reverted to simulating Claus hydraulics for Case 4 as a series of pipe segments whose overall pressure drop during normal operation matched the Claus model. We were able to leave the tail gas treating section configured as we did for Cases 1 through 3. The largest difference we saw between our Case 1 and Case 4 runs was larger water flow downstream from the WHB. Adding the tube stub flow to the rupture:
• Boosted the total water flow to the catalytic reactor section from 75 gpm to 375 gpm • Boosted the total steam flow to the catalytic reactor section from 70,000 lbs/hr to 77,000
lbs/hr The results shown in the Case 4 discussion above were based on this model.

Page 20 of 27
Case 4 modified model configuration

Page 21 of 27
Subsequent Evaluations: BP elected to conduct subsequent evaluations to determine the effects of various risk reduction measures. Activating SRU diverter valves and stopping all feed flows to the SRU burner were the primary risk reduction measures evaluated. In addition to evaluating the impact of SIS reaction to a WHB tube rupture, we took a look at the impact of WHB tube size. The tube size evaluations used the same orifice-only style rupture of Case 1 described above. The results were dramatic. Utilizing a SIS trigger pressure of 13.5 psig to activate the SRU diverter valves and a 15 psig trigger to shut off all SRU burner feeds resulted in a 14 psi decrease in maximum MRF pressure. Reducing the WHB tube diameter had similar results. Decreasing the WHB tube id by 0.5 inch resulted in an additional 10 psig reduction in MRF maximum pressure. A summary level plot of the MRF pressures for the four original cases described above and 5 subsequent evaluation cases is shown below.

Page 22 of 27

Page 23 of 27
Conclusions / Lessons learned Estimating the impact of a WHB tube rupture is a difficult task. Using a properly tuned dynamic model is a great technique for evaluating the overpressure response of a WHB tube rupture made possible by the recent availability of a rigorous SRU dynamic modeling package. Some of the lessons learned include:
• Be aware of and think about the disposition of the large quantities of unvaporized BFW flowing into the unit after a WHB tube rupture
• Maximum pressures occur very quickly—in less than 2 minutes for the BP Cherry Point sulfur recovery complex.
• Consider SIS activated responses of o Opening SRU diverter valves to the incinerator to minimize pressure rise and total
emissions o Shutting off all feeds at a burner pressure of 15 psig reduced the maximum
overpressure to 28 psig from 55 psig. • Orifice-only vs. API RP-521 WHB tube failures may not result in significantly different
overpressure maximums • Thermal reactor refractory plays a significant role in the amount of overpressure
What is the risk in your sulfur recovery complex of a WHB tube rupture? How effective are the SIS measures in your facility? Acknowledgements We thank the BP team, especially John Parks, Allison Dole, and the operations crew for their observations, feedback, and reality grounding. We thank VMG’s Mark Beyleveld for his dynamic modeling expertise and repeatedly helping us out of numerous blind alleys.

Page 24 of 27
Appendix A BP Cherry Point Refinery
Sulfur Complex Operating Data October 15, 2013

Page 25 of 27

Page 26 of 27

Page 27 of 27