bridging the gap between security/risk and quality
TRANSCRIPT

14th Argentine Symposium on Software Engineering, ASSE 2013
42 JAIIO - ASSE 2013 - ISSN: 1850-2792 - Page 168
Bridging the Gap between Security/Risk and Quality
Luis Olsina1, Elena Pesotskaya
2, Alexander Dieser
1, and Guillermo Covella
1
1GIDIS_Web, Engineering School at UNLPam, General Pico, Argentina
[email protected]; {alexander.dieser, guillermo.covella}@gmail.com 2School of Software Engineering at National Research University HSE, Moscow, Russia
Abstract. An IT security vulnerability can be considered as an inherent weak-
ness in a target system that could be exploited by a threat source. The underly-
ing hypothesis in our proposal is that each identified attribute associated with
the target entity to be controlled should show the highest quality satisfaction
level as an elementary indicator. The higher the quality indicator value achieved
per each attribute, the lower the vulnerability indicator value and therefore the
potential impact from the risk standpoint. In the present work, we discuss the
added value of supporting the IT security and risk assessment areas with mea-
surement and evaluation (M&E) methods and strategy, which are based on me-
trics and indicators. Also we illustrate excerpts of an M&E case study for cha-
racteristics and attributes of Security, and their potential risk assessment.
1 Introduction
There exist widespread sayings such as “you cannot control what you cannot measure”
meaning –as a possible interpretation- that the lack of data e.g. numbers jeopardizes the
very basic engineering and management principles of being systematic and disciplined.
Also, “if you do not know where you are, a map will not help to reach the destination”
meaning for instance that the lack of data and information for understanding the cur-
rent situation of an entity vanishes any effort –even having enough resources- to meet
the ultimate goal such as improvement. In other words, we cannot improve what we
cannot understand, and we cannot appropriately understand without analyzing consis-
tent data and information. So data and information are basic inputs for different
processes; while data usually come from facts, measures, etc. information is the mea-
ningful interpretation of data for a given purpose, user viewpoint and context.
In the present work, we state that metrics and indicators are basic, yet key organiza-
tional assets for providing suitable data and information for analyzing and monitoring.
With the aim to systematically carry out M&E projects and programs, software organi-
zations should establish clearly a set of principles, activities, methods and tools to spe-
cify, collect, store, and use trustworthy metrics and indicators and their values. Moreo-
ver, in order to make the analysis and decision-making process more robust, it is ne-
cessary to ensure that measures’ and indicators’ values are repeatable and comparable
among the organization’s projects. Therefore, it should be mandatory to store not only
M&E data but also metrics and indicators metadata as for example metric and indicator
ID, version, measurement method, scale, scale type, unit, indicator model, etc.

14th Argentine Symposium on Software Engineering, ASSE 2013
42 JAIIO - ASSE 2013 - ISSN: 1850-2792 - Page 169
In fact, metrics and indicators should be seen as designed and versioned by-product
or resources stored in organizational repositories. Particularly, the metric is the sound
specification of a measurement process which transforms an entity attribute –the input-
into a measure i.e. data –the output; and the elementary indicator is the sound specifi-
cation of an evaluation process, which has as input a metric’s measure and produces an
indicator value i.e. information. However, looking at recognized literature [4, 7, 10, 12,
16] what a metric or indicator means and fits in a given process, and issues such as
why, what, who, when, where and how (W5H for short) to measure and evaluate are
often poorly linked and specified. To make things a bit more complicated, we have
observed very often a lack of consensus among M&E terminological bases in different
recognized standards and manuscripts or, sometimes, absent terms [17].
Ultimately, metrics and indicators are part of our integrated GOCAME (Goal-
Oriented Context-Aware Measurement and Evaluation) strategy [18, 19], which can be
used to understand and improve the quality of any organizational entity or asset. Par-
ticularly, we emphasize in this work metric and indicator specifications for vulnerabili-
ty attributes regarding the Security characteristic [8] for a system, as the target entity.
Note that a vulnerability is an inherent weakness in a target system that could be
exploited by a threat source. Most vulnerable capabilities/attributes of a system can be
identified for instance with security controls. Therefore, understanding the current
quality acceptability level achieved for vulnerability attributes can help in turn assess-
ing the risk and planning actions for improvement, i.e. the risk reduction by imple-
menting the risk treatment from the impact viewpoint. The underlying hypothesis is
that each meaningful attribute associated with the target entity to be controlled should
show the highest quality satisfaction level as an elementary nonfunctional requirement.
The higher the quality indicator value achieved per each attribute, the lower the vulne-
rability indicator value and therefore the potential consequence on the target entity.
So the main contributions of this paper are: i) the awareness of the added value of
supporting the IT security/risk assessment area with a quality evaluation strategy,
which is based on metrics and indicators; ii) a thorough discussion about the specifica-
tion of metrics and indicators as informational, reusable resources for M&E process
descriptions, highlighting the importance of recording not only data but also the asso-
ciated metadata of information needs, context, attributes, metrics and indicators to
ensure repeatability and consistently; and iii) the illustration of metrics and indicators
from excerpts of an actual IT security and risk evaluation case study.
Following this introduction, Section 1 provides an overview of the GOCAME
strategy, focusing on its M&E conceptual framework and process for better under-
standing the modeling of metrics and indicators. Also a summary of risk assessment is
made in order to see where M&E fit. Section 3 elaborates on the GOCAME framework
and process to see where the above mentioned W5H rule fits in the M&E process;
then, concrete metric and indicator templates for security attributes are fleshed out,
following a discussion of our approach contributions. Section 4 addresses related work
and, finally, Section 5 outlines the main conclusions and future work.
2 Background
Measurement and Analysis is a basic CMMI process area at level 2 for the staged re-

14th Argentine Symposium on Software Engineering, ASSE 2013
42 JAIIO - ASSE 2013 - ISSN: 1850-2792 - Page 170
presentation [4] that gives support to other process areas by means of measures. Thus,
measures and their interpretation for a given information need are considered a key
supply to assist and analyze the rest of all other process areas. Moreover, in order to
support consistency in different M&E projects, well-established M&E strategies are
needed as well. For instance, GOCAME [18] is based on three main principles: i) an
M&E conceptual framework; ii) an M&E process; and iii) M&E methods and tools.
GOCAME’s first principle is that designing and implementing an M&E
project/program requires a sound M&E conceptual framework. Often times, organiza-
tions conduct measurement programs that start and stop because they don’t pay enough
attention to the way nonfunctional requirements, contextual properties, metrics and
indicators should be designed, implemented and analyzed. Any M&E effort requires an
M&E framework built on a rich conceptual base as an ontology. Then, we built the C-
INCAMI (Contextual-Information Need, Concept model, Attribute, Metric and Indica-
tor) framework [18] based on our metrics and indicators ontology [17].
GOCAME’s second principle requires a well-established M&E process in order to
guarantee repeatability in performing activities and consistency of results. A process
prescribes a set of phases, activities, inputs and outputs, sequences and parallelisms,
roles, and so forth. Finally, GOCAME’s third principle is M&E methods and tools,
which can be instantiated from both the conceptual framework and process. While
activities state ‘what’ to do methods, on the other hand, describe ‘how’ to perform
these activities. Next, we outline GOCAME’s M&E conceptual framework and
process for better understanding the metric and indicator modeling in Section 3.
2.1 GOCAME Strategy Overview
GOCAME is a multi-purpose strategy that follows a goal-oriented and context-
sensitive approach in defining M&E projects. Regarding the abovementioned first
principle, C-INCAMI is structured in six components, namely: i) M&E project, ii)
Nonfunctional Requirements, iii) Context, iv) Measurement, v) Evaluation, and vi)
Analysis and Recommendation. The components shown in Fig. 1 are presented below.
Also some key terms are defined –see [17] for more details.
The Requirements component (requirements package in Fig. 1) allows speci-
fying the Information Need of any M&E project. It identifies the purpose (e.g. “under-
stand”, “improve”, etc.) and the user viewpoint (e.g. “security administrator”, etc).
Also, it focuses on a Calculable Concept –e.g. “quality”, “security”- and specifies the
Entity Category to evaluate –e.g. a resource, product, system, etc. The leaves of an
instantiated model (a requirements tree) are Attributes associated with an Entity Cate-
gory. From the quoted terms, Information Need is defined as “insight necessary to
manage objectives, goals, risks, and problems”; Entity Category is defined as “object
category that is to be characterized by measuring its attributes or properties”, and,
Attribute is “a measurable physical or abstract property of an entity category”.
Regarding the Context component (context package), one key term is Context,
which is defined as “a special kind of entity representing the state of the situation of an
entity, which is relevant for a particular information need”. Context is a special kind of
Entity in which related relevant entities are involved. Related entities can be resources
–as a network or security infrastructure-, organization or the project itself, among oth-

14th Argentine Symposium on Software Engineering, ASSE 2013
42 JAIIO - ASSE 2013 - ISSN: 1850-2792 - Page 171
ers. To describe the context, Attributes of the relevant entities are used for further
quantification, which are called Context Properties (see details in [13]).
The Measurement component allows specifying the metrics that quantify attributes.
To design a Metric, the Measurement and Calculation Method and the Scale should be
defined. Whereas a measurement method is applied to a Direct Metric, a calculation
method is applied to the formula of an Indirect Metric. A Measurement produces a
Measure. Measurement is defined as “an activity that uses a metric definition in order
to produce a measure’s value”, while a Measure is “the number or category assigned
to an attribute of an entity by making a measurement”, and the Metric is “the defined
measurement or calculation method and the measurement scale”. Hence, for designing
a direct metric two aspects should be clearly specified as metadata, namely: its mea-
surement method and scale. The Measurement Method (i.e. procedure) is “the particu-
lar logical sequence of operations and possible heuristics specified for allowing the
realization of a direct metric description by a measurement”; and the Scale is “a set of
values with defined properties”. Note that the scale type depends on the nature of the
relationship between values of the scale, such as keeping the order and/or distances
among categories, in addition to the existence of the zero category meaning absence of
the measured attribute. The scale types mostly used in Software and Web Engineering
are classified into “nominal”, “ordinal”, “interval”, “ratio”, and “absolute”. Each scale
type determines the choice of suitable mathematical operations and statistics tech-
niques that can be used to analyze the data.
Fig. 1. Main concepts and relationships for the C-INCAMI components
14th Argentine Symposium on Software Engineering, ASSE 2013
42 JAIIO - ASSE 2013 - ISSN: 1850-2792 - Page 172
The Evaluation component includes the concepts intended to specify the design
and implementation of elementary and global evaluations. It is worthy to mention that
the selected metrics are useful for a measurement process as long as the selected indi-
cators are useful for an evaluation process. Indicator is the main term, which allows
specifying how to calculate and interpret the attributes and calculable concepts of a
requirements tree. There are two types of indicators. First, Elementary Indicators that
evaluate lower-level requirements, namely, attributes. Each elementary indicator has
an Elementary Model that provides a mapping function from the metric's measures (the
domain) to the indicator's scale (the range). The new Scale is interpreted using agreed
Decision Criteria (also called Acceptability Levels), which help to analyze the level of
satisfaction reached by each elementary nonfunctional requirement, i.e. by each
attribute. Second, Partial/Global Indicators, which evaluate mid-level and higher-level
requirements, i.e. sub-characteristics and characteristics in a concept model (e.g. a
security model). Different aggregation models (Global Model) can be used to perform
evaluations. As for the implementation, an Evaluation represents the activity involving
a single calculation, following a particular indicator specification –either elementary or
global-, producing an Indicator Value. In our ontology Evaluation is defined as “activ-
ity that uses an indicator definition in order to produce an indicator’s value”, and
Indicator as “the defined calculation method and scale in addition to the model and
decision criteria in order to provide an estimate or evaluation of a calculable concept
with respect to defined information needs”.
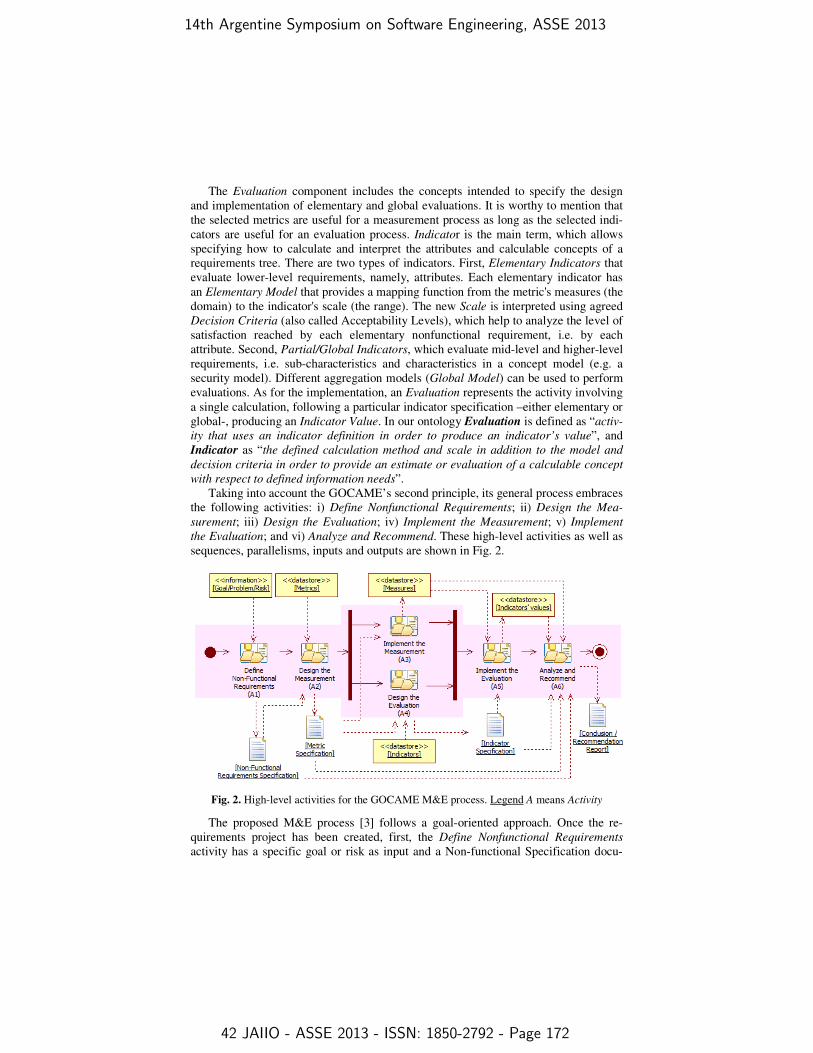
Taking into account the GOCAME’s second principle, its general process embraces
the following activities: i) Define Nonfunctional Requirements; ii) Design the Mea-
surement; iii) Design the Evaluation; iv) Implement the Measurement; v) Implement
the Evaluation; and vi) Analyze and Recommend. These high-level activities as well as
sequences, parallelisms, inputs and outputs are shown in Fig. 2.
Fig. 2. High-level activities for the GOCAME M&E process. Legend A means Activity
The proposed M&E process [3] follows a goal-oriented approach. Once the re-
quirements project has been created, first, the Define Nonfunctional Requirements
activity has a specific goal or risk as input and a Non-functional Specification docu-

14th Argentine Symposium on Software Engineering, ASSE 2013
42 JAIIO - ASSE 2013 - ISSN: 1850-2792 - Page 173
ment as output (which contains the M&E purpose, user viewpoint, focus, entity, instan-
tiated characteristics and attributes, and context information). Then, the Design the
Measurement activity allows identifying the metrics from the Metrics repository
(<<datastore>> stereotype in Fig. 2) to quantify attributes: the output is a Metrics
Specification document. Once the measurement was designed, the evaluation design
and the measurement implementation activities can be performed –in any order or in
parallel. The Design the Evaluation activity allows identifying Indicators.
The Implement the Measurement activity uses the chosen metrics to obtain the
measures that are stored in the Measures repository, and then Implement the Evalua-
tion can be carried out. Lastly, Analyze and Recommend activity has as inputs the
measure and indicator values (i.e. data and information), the metric and indicator speci-
fications (i.e., metadata) in order to produce a Conclusion/Recommendation report.
Since the M&E process includes activities such as specify the requirements tree,
identify metrics, analyze and recommend, and so on, it is necessary to have a metho-
dology that integrates all these aspects and tools that automate them. To this aim the
WebQEM (Web Quality Evaluation) methodology and its tool [18] were instantiated
from the framework and process, and used in different academic and industrial cases. It
is important to remark that some GOCAME methods for evaluation are based on mul-
ti-criteria (attribute) decision analysis, which can also be used for risk assessment [11].
2.2 Risk Assessment Issues regarding M&E
There are abundant standards and research (e.g. [1, 4, 9, 11, 15], to quote just a
few) in areas of risk management, risk assessment techniques and processes as well as
risk vocabularies –however, an ontology for the risk domain is still missing. In this
paper, without entering in specific discussions of the risk terminological base, we use
some terms defined in the previous sub-section as entity, attribute, amongst others.
Categories of entities as software projects, products and systems or some of their
components, involve risks at different development or operative stages which should
be identified, prevented, controlled, treated and monitored through a well-defined and
systematic risk management approach. A risk can be defined as an undesirable conse-
quence of an event on a target entity, which can represent an organizational asset –
where an asset is an entity with (added) value for an organization. The potential losses
affecting the asset are also called impact of the risk. Besides, the term vulnerability is
commonly used in the security area, which briefly means a weakness in an entity
attribute/capability that can be exploited by a threat source.
Software Risk Management (SRM) suggests actions e.g. to prevent risk or reduce
its impact on the target entity instead of dealing with its further consequences. Thus,
we can identify relevant attributes associated to an entity that can be vulnerable (weak)
from triggered external/internal events. Then, by understanding the current attributes’
strengths and weaknesses –e.g. by using the GOCAME strategy-, actions for change
can be recommended and planned for further treatment implementation.
In general terms, SRM includes a set of policies, processes, methods and tools to
analyze risks, understand weaknesses, prepare preventive/perfective actions, and con-
trol risks on the target entity. Particularly, for risk assessment three processes are pro-
posed in [11]: i) Risk identification; ii) Risk analysis; and iii) Risk evaluation. In addi-
tion, Establishing the context, Risk treatment, Risk monitoring and review, and Com-

14th Argentine Symposium on Software Engineering, ASSE 2013
42 JAIIO - ASSE 2013 - ISSN: 1850-2792 - Page 174
munication are also common processes for a well-established SRM strategy. Basically,
the Risk identification activity aims at gathering information about all risks that can
affect the system or resource (i.e. the target entity), such as risk category, possible
causes and outcomes, etc. In [9] it is defined as “the process of finding, recognizing
and describing risks”. Also a note indicates “risk identification involves the identifica-
tion of risk sources, events, their causes and their potential consequences”. In the Risk
analysis activity, the identified risks are prioritized according to the probability of oc-
currence and loss/undesirable consequences associated to the entity attributes to set
how many risks will be treated. It is defined as “the process to comprehend the nature
of risk and to determine the level of risk”. Risk evaluation activity is defined as “the
process of comparing the results of risk analysis with risk criteria to determine whether
the risk and/or its magnitude is acceptable or tolerable”. Risk evaluation assists in the
decision about risk treatment, which is defined as “the process to modify risk” [9]. For
example, risk treatment can involve: i) taking or increasing risk in order to pursue an
opportunity; ii) removing the risk source; iii) changing the likelihood (probability); and
iv) changing the consequences, amongst other choices.
In this work, we propose, for brevity reasons concentrating just on the iv) above
item –particularly, in the vulnerabilities- for designing the M&E and ulterior improve-
ment plan. The plan should describe actions to reduce the vulnerability/impact on the
target entity. Particularly, regarding our proposal, system attributes, metrics and indica-
tors should be selected to manage the risk status, showing whether the risk is reduced.
The interpretation of evaluations is made by the used indicators and their acceptability
levels met, which in turn make use of metrics that quantifies the attributes associated to
the entity as per plan. Therefore, target entities can be measured and evaluated by
means of their associated attributes and calculable concepts (characteristics). The un-
derlying hypothesis is that each meaningful attribute to be controlled (related e.g. to the
Security characteristic) should show the highest quality level of satisfaction as an ele-
mentary nonfunctional requirement. The higher the quality indicator value achieved for
each attribute, the lower the vulnerability indicator value. Then:
Vulnerability Indicator value (for Attribute Ai) = 100 – Quality Indicator value Ai; (1)
where in the percentage scale there are acceptability levels for the elementary
quality indicator, representing 100% a totally satisfied (achieved) requirement, and 0%
totally unsatisfied –so implies that an urgent change action must be planned. So per
each relevant attribute Ai, we can calculate the risk indicator value (magnitude) before
and after improvement changes were performed using the often quoted formula:
Risk value Ai = Probability of Event occurrence for Ai * Vulnerability Indicator value Ai; (2)
and then calculate the risk reduction per each vulnerable attribute. Or even the risk
reduction calculated as an aggregated indicator value e.g. for Security. We argue that
without the well-established support of metrics and indicators and their values SRM is
more craftwork than science. The proposal of looking at vulnerabilities as attributes
and then using metrics and indicators for their M&E is illustrated in sub-section 3.2.
3 Metric and Indicator Specifications for Security
From the specification standpoint, metrics and indicators can be considered as de-

14th Argentine Symposium on Software Engineering, ASSE 2013
42 JAIIO - ASSE 2013 - ISSN: 1850-2792 - Page 175
signed and versioned by-products stored in organizational repositories, which are (re-
)used by M&E activities. Nevertheless, regarding the state-of-the-art literature, what
metrics and indicators mean and where fit in a given M&E process as well as issues
such as why, what, who, when, where and how to measure and evaluate have often
been poorly related and specified.
3.1 The W5H rule: Why, What, Who, When, Where, How?
Nelson [14] asserts that a “discussion of the why, who, what, where, and when of
security metrics brings clarity and further understanding because it establishes a
framework for implementing a framework to implement security metrics in your or-
ganization” (cf. p.14). We want to reinforce this idea and try to strengthen it.
GOCAME’s three principles outlined before will help us to illustrate the rationale for
the W5H mnemonic rule. Particularly, in the following summary, we rely on the gen-
eral process depicted in Fig. 2, which in turn is compliant with the terminological
framework shown in Fig. 1.
Why an organization should tackle the M&E endeavor might be represented in the
M&E project definition and instantiation. Basically, there is an issue (the goal/problem
/risk input in Fig 2) that requires a solution driven by analysis. For instance, the organ-
ization needs to reduce some particular entity vulnerabilities; however, as commented
above, it cannot improve what cannot understand, and it cannot appropriately under-
stand without consistently analyzing data and information. The why aspect therefore
embraces the concrete Information Need and purpose for M&E such as understand,
improve, and control some relevant objective, regarding a specific user viewpoint.
What is to be measured and evaluated? This embraces the concrete target entity –
and related entities including Context that belongs to an Entity Category. Also, a given
information need is described by a focus (e.g. the security Calculable concept) to
which attributes are combined. Moreover, entities cannot be measured directly but only
through their attributes and Context properties. So, the non-functional requirements
specification artifact (see Fig. 2) documents to a great extent the why and the what.
How basically deals with the metric and indicator specifications. Metrics and Indi-
cators are organizational assets stored in repositories (as depicted in Fig. 2), which are
selected respectively by the A2 and A4 activities at design time, and then implemented
by the A3 and A5 activities accordingly. As we show in sub-section 3.2, metric and
indicator specifications should be considered metadata that must be kept linked
through metricID, indicatorID and version –for consistency reasons- to measure and
indicator values produced for the A3 and A5 activities. Further, metadata and datasets
are consumed by the A6 activity or by inter-project analysis tasks.
Who is responsible for the different stages of an M&E project? Certainly, there are
different levels of responsibilities and roles. In the C-INCAMI M&E project definition
component (not shown in Fig. 1) related project concepts allow recording the responsi-
ble information. In addition, author name is a common field for both metric and indi-
cator specifications which represents their creator as a piece of design. Besides, the
data collector name –see Measurement term in Fig. 1- allows recording the responsible
for data gathering in the A3 activity.
When is recorded for each M&E project and also per each enacted M&E task. Ba-
sic questions supported are, among others: When do you collect metric measures? How

14th Argentine Symposium on Software Engineering, ASSE 2013
42 JAIIO - ASSE 2013 - ISSN: 1850-2792 - Page 176
often do you collect them? When do you perform evaluations and analysis? For exam-
ple, the time stamp and frequency fields in the Measurement and Evaluation terms
allow recording them accordingly when A3 and A5 are executed.
Where is the M&E project running? Where is the entity under evaluation placed?
In which context is the target entity measured and evaluated? Where is data collection
activity for metrics performed? Some of these raised issues can be taking into account
by the C-INCAMI M&E project definition component including the recorded Context
and its associated Context properties and values. Next, using the W5H rule we illu-
strate the Security characteristic emphasizing mainly the how aspect, for space reasons.
3.2 Security Characteristic for an Information System: Proof of Concept
In this sub-section, excerpts of a case study we have performed are used as proof of
concept. One issue of the W5H rule is what is to be measured and evaluated? The
concrete entity is named “XYZ”–with fictitious name-, a real student management
WebApp widespread used in Argentinean universities. XYZ is a system –from the
Entity Category standpoint- commonly used by students, professors and faculty mem-
bers. Moreover, why should it be evaluated? Because a concrete information need was
raised by the IT department responsible in the ABC organization (again, a fictitious
name for confidentiality reasons), which is related to security risks due to different
potential threats, e.g. students changing the bad marks of subjects due to system vulne-
rabilities. So the purpose of the information need is firstly to “understand” the current
external quality satisfaction level achieved, particularly for the non-vulnerabilities
regarding the “Security” feature, from the “security administrator” user viewpoint.
Once the current security satisfaction level is understood, secondly the purpose is
to “improve” the WebApp in those weakly performing indicators. That is to say, the
ultimate purpose is to reduce the risk (i.e. security vulnerabilities) on the XYZ entity.
Fig. 2 shows as output of the A1 activity the non-functional requirements specifica-
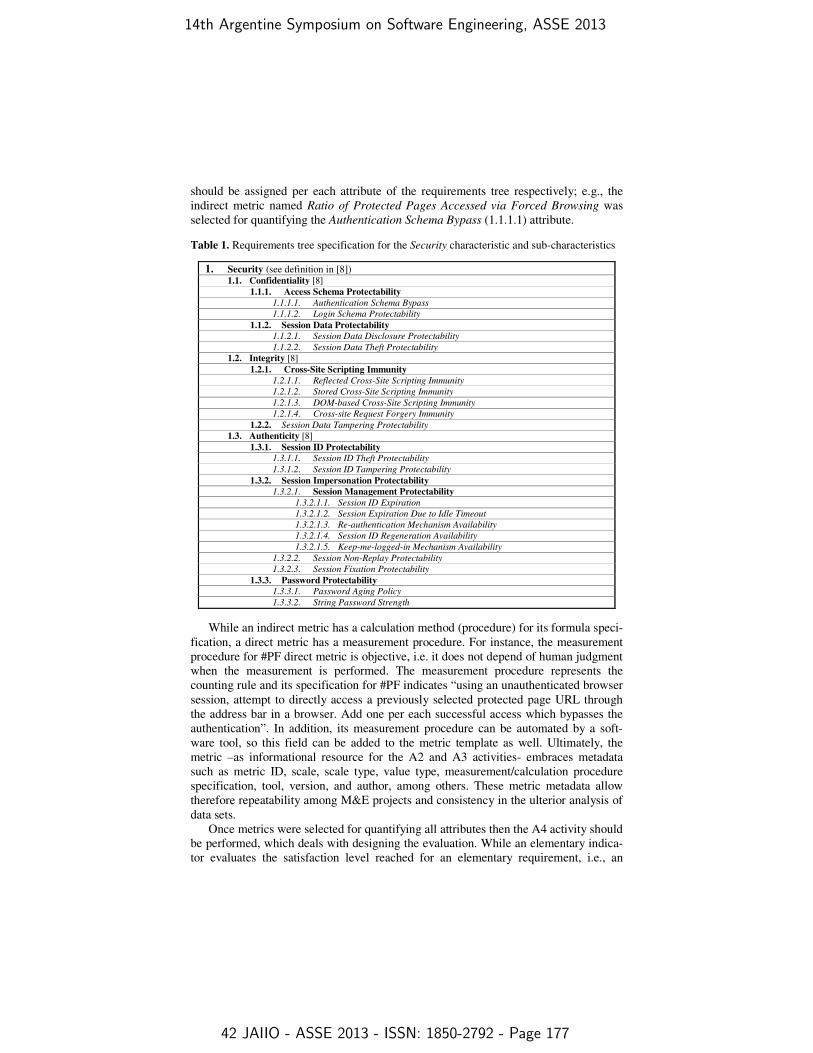
tion artifact, which mainly documents the why and what aspects. Specifically, Table 1
represents the requirements tree instantiated for the Security characteristic and its sub-
characteristics such as Confidentiality (coded 1.1), Integrity (1.2) and Authenticity
(1.3), which are the ones prescribed in the ISO 25010 system quality model [8]. For
instance, Confidentiality is defined as “degree to which a product or system ensures
that data are accessible only to those authorized to have access” [8]. Additionally, we
have identified new sub-characteristics such as Access Schema Protectability (1.1.1)
which is defined as “degree to which the system ensures the confidentiality of data by
providing access protection capabilities”. Moreover, 20 measurable attributes were
specified for Security as shown in Table 1, which are highlighted in italic.
For example, the objective of the 1.1.1.1 attribute is “to find out the degree to
which bypassing the authentication schema is avoided”. While most WebApps require
authentication for gaining access to private information or to execute tasks, not every
authentication method is able to provide adequate security.
In Table 2 this attribute is also defined and its indirect metric –and related direct
metrics- is thoroughly represented in the metric template. The W5H rule’s how issue
deals basically with the metric and indicator specifications. Once the nonfunctional
requirements were specified, the next A2 activity consists in selecting the meaningful
metrics from the Metrics repository (see Fig. 2) to quantify attributes. One metric
14th Argentine Symposium on Software Engineering, ASSE 2013
42 JAIIO - ASSE 2013 - ISSN: 1850-2792 - Page 177
should be assigned per each attribute of the requirements tree respectively; e.g., the
indirect metric named Ratio of Protected Pages Accessed via Forced Browsing was
selected for quantifying the Authentication Schema Bypass (1.1.1.1) attribute.
Table 1. Requirements tree specification for the Security characteristic and sub-characteristics
1. Security (see definition in [8]) 1.1. Confidentiality [8]
1.1.1. Access Schema Protectability
1.1.1.1. Authentication Schema Bypass
1.1.1.2. Login Schema Protectability
1.1.2. Session Data Protectability
1.1.2.1. Session Data Disclosure Protectability 1.1.2.2. Session Data Theft Protectability
1.2. Integrity [8]
1.2.1. Cross-Site Scripting Immunity
1.2.1.1. Reflected Cross-Site Scripting Immunity
1.2.1.2. Stored Cross-Site Scripting Immunity
1.2.1.3. DOM-based Cross-Site Scripting Immunity
1.2.1.4. Cross-site Request Forgery Immunity
1.2.2. Session Data Tampering Protectability
1.3. Authenticity [8]
1.3.1. Session ID Protectability
1.3.1.1. Session ID Theft Protectability
1.3.1.2. Session ID Tampering Protectability
1.3.2. Session Impersonation Protectability
1.3.2.1. Session Management Protectability
1.3.2.1.1. Session ID Expiration
1.3.2.1.2. Session Expiration Due to Idle Timeout
1.3.2.1.3. Re-authentication Mechanism Availability
1.3.2.1.4. Session ID Regeneration Availability
1.3.2.1.5. Keep-me-logged-in Mechanism Availability
1.3.2.2. Session Non-Replay Protectability
1.3.2.3. Session Fixation Protectability
1.3.3. Password Protectability
1.3.3.1. Password Aging Policy
1.3.3.2. String Password Strength
While an indirect metric has a calculation method (procedure) for its formula speci-
fication, a direct metric has a measurement procedure. For instance, the measurement
procedure for #PF direct metric is objective, i.e. it does not depend of human judgment
when the measurement is performed. The measurement procedure represents the
counting rule and its specification for #PF indicates “using an unauthenticated browser
session, attempt to directly access a previously selected protected page URL through
the address bar in a browser. Add one per each successful access which bypasses the
authentication”. In addition, its measurement procedure can be automated by a soft-
ware tool, so this field can be added to the metric template as well. Ultimately, the
metric –as informational resource for the A2 and A3 activities- embraces metadata
such as metric ID, scale, scale type, value type, measurement/calculation procedure
specification, tool, version, and author, among others. These metric metadata allow
therefore repeatability among M&E projects and consistency in the ulterior analysis of
data sets.
Once metrics were selected for quantifying all attributes then the A4 activity should
be performed, which deals with designing the evaluation. While an elementary indica-
tor evaluates the satisfaction level reached for an elementary requirement, i.e., an

14th Argentine Symposium on Software Engineering, ASSE 2013
42 JAIIO - ASSE 2013 - ISSN: 1850-2792 - Page 178
attribute of the requirements tree, a partial/global indicator evaluates the satisfaction
level achieved for partial (sub-characteristic) and global (characteristic) requirements.
Table 2. Indirect and direct metric specifications to the Authentication Schema Bypass attribute
Attribute Name: Authentication Schema Bypass Code: 1.1.1.1 in Table 1
Definition: Due to negligence, ignorance or understatement of security threats often result in authentication
schemes that can be bypassed by simply skipping the login page and directly calling an internal page that is
supposed to be accessed only after authentication has been performed;
Objective: To find out the degree to which bypassing the authentication schema is avoided.
Indirect Metric Name: Ratio of Protected Pages Accessed via Forced Browsing (%PPA); Objective: To determine the ratio between the number of successful attempts accessing protected pages by forced browsing
and the total number of attempts performed; Author: Dieser A.; Version: 1.0; Reference: OWASP Testing
Guide 2008 V3.0 (available at https://www.owasp.org/index.php/OWASP_Testing_Project); Calculation Procedure (Method) / Formula: %PPA = (#PF / #TPP) * 100
Numerical Scale: Representation: Continuous; Value Type: Real; Scale Type: Ratio;
Unit Name: Percentage; Acronym: % Related Metrics: 1) Number of successful attempts to access protected pages by forced browsing (#PF);
and 2) Total number of attempts to access protected pages by forced browsing (#TPP)
Related Direct Metric Name: Number of successful attempts to access protected pages by forced browsing
(#PF) ; Objective: The number of successful attempts bypassing the authentication schema for the protected
page population using the forced browsing technique; Author: Dieser A. ; Version: 1.0;
Measurement Procedure: Name: Direct page request; Type: Objective; Specification: Using an unau-
thenticated browser session, attempt to directly access a previously selected protected page URL through the
address bar in a browser. Add one per each successful access which bypasses the authentication; Numerical Scale: Representation: Discrete; Value Type: Integer; Scale Type: Absolute;
Unit Name: Successful attempts on Protected pages; Acronym: Pp
Related Direct Metric Name: Total number of attempts to access protected pages (#TPP); Objective: The
total number of protected pages (i.e. the given population) to be attempted for access by a given technique;
Author: Dieser A.; Version: 1.0; Measurement Procedure: Type: Objective; Specification: As precondition, log into the website with a
valid user ID and password. Browse the site looking for the URL population of protected pages, which are
those that must be accessed only after a successful login. Add one per each protected page URL selected.
Numerical Scale: Representation: Discrete; Value Type: Integer; Scale Type: Absolute;
Unit Name: Protected pages; Acronym: Pp
Table 3. Elementary indicator specification to the Authentication Schema Bypass attribute
Attribute: Authentication Schema Bypass Code: 1.1.1.1 in Table 1 Elementary Indicator:
Name: Performance Level of the Authentication Schema Bypass (P_ASB)
Author: Dieser A. Version: 1.0
Elementary Model:
Specification: the mapping is: P_ASB = 100 iff %PPA=0; P_ASB = 90 iff %PPA< %PPAMAX;
P_ASB = 0 iff %PPA >= %PPAMAX where %PPA is the indirect metric in Table 2.
Note that the %PPAMAX is an agreed parameter (threshold) of 2% for the XYZ case study. Decision Criterion [Acceptability Level]:
Name 1: Unsatisfactory Description: indicates change actions must be taken with high priority
Range: if 0 ≤ P_ASB ≤ 80 Name 2: Marginal Description: indicates a need for improvement actions
Range: if 80 < P_ASB ≤ 98
Name 3: Satisfactory Description: indicates no need for current actions Range: if 98 < P_ASB ≤ 100
Numerical Scale / Scale Type: Ratio Unit Name: Percentage

14th Argentine Symposium on Software Engineering, ASSE 2013
42 JAIIO - ASSE 2013 - ISSN: 1850-2792 - Page 179
As commented in sub-section 2.1, indicator is the main concept for evaluation,
which can be elementary or partial/global. In Table 3 the elementary indicator named
Performance Level of the Authentication Schema Bypass is specified. This elementary
indicator will determine the quality satisfaction level reached by the 1.1.1.1 attribute
considering the measured value of its indirect metric. Conversely to metrics, indicators
have decision criteria for data interpretation. In Table 3, three acceptability levels use-
ful for the interpretation of indicator values in the percentage scale are designed.
With regard to the how for a global indicator, it has similar metadata as shown for
an elementary indicator. But instead of an elementary model it has a global or aggrega-
tion model. An example of global model is LSP (Logic Scoring of Preference) [5],
which was used e.g. in [18, 19]. LSP is a weighted multi-criteria aggregation model,
which has operators for modeling simultaneity (C conjunctive operators) and replacea-
bility (D disjunctive operators) relationships among attributes, sub-characteristics and
characteristics of a requirements tree. For instance, the C+ strong conjunction operator
lets modeling the simultaneity criterion among the 1.1, 1.2 and 1.3 sub-characteristics,
yielding zero if one input were zero.
Next, it is the specification of the LSP aggregation model:
P/GI (r) = (W1 * I1r + W2 * I2
r + ... + Wm * Imr)1/ r ; (3)
where P/GI represents the partial/global indicator to be calculated, and Ii stands for
elementary indicator value and the following holds 0 <= Ii <= 100 in a percentage
scale; Wi represents the weights, where: W1 + W2 + ... + Wm = 1, and Wi > 0 for i = 1
to m, in an aggregated block of elements; and, r is a parameter selected to achieve the
desired logical simultaneity, neutrality or replaceability relationship.
Lastly, as result of the whole design and selection process –activities A1, A2 and
A4-, the following documents are yielded: the non-functional requirements specifica-
tion, the metrics specification and the indicators specification.
Aspects of when and where are related to great extent to Implement the Measure-
ment and Evaluation activities, as commented in sub-section 3.1. Particularly, for each
executed M&E project, the A3 and A5 activities produce measure and indicator values
accordingly at given moments in time and frequencies.
3.3 Added Value of Metrics and Indicators for Bridging the Gap
We have illustrated above the specification of a security metric and elementary in-
dicator both regarded as resources for M&E process descriptions. Therefore, it is wor-
thy to remark again that metric and indicator specifications should be considered meta-
data that must be kept linked by IDs –for reasons of analysis comparability and consis-
tency- to measure and indicator values produced by the A3 and A5 activities.
Let’s suppose for example that the same Authentication Schema Bypass (1.1.1.1)
attribute can be quantified by two metrics (recall in Fig. 1 that an attribute can be quan-
tified for many metrics, but just one must be selected from the Metric repository for
each M&E project). So one metric (M1) in the repository is that specified in Table 2,
and the other metric (M2) is one which has different measurement procedure and scale
type; e.g. M2 considers the predictability of the session identifiers (IDs) as procedure,

14th Argentine Symposium on Software Engineering, ASSE 2013
42 JAIIO - ASSE 2013 - ISSN: 1850-2792 - Page 180
and a categorical scale, particularly, an ordinal scale type with values ranging from 1 to
3, where 3 represents the highest difficulty to predict the ID session, and 1 the lowest.
After many M&E projects using the same security attributes are executed, all data and
datasets from measurement are recorded in the Measure repository (Fig. 2). In some
projects were used M1 and in others M2 for quantifying the 1.1.1.1 attribute. There-
fore, if metadata of recorded data were not linked appropriately, e.g. to the measured
value 3 which can come from both metrics in different projects, the A6 activity will
produce inconsistent analysis if takes as inputs all these related projects. This inconsis-
tency is due to the 3 value, depending on the used metric, has different scale properties
recalling that each scale type determines the choice of suitable mathematical and statis-
tics techniques that can be used to analyze data and datasets. In summary, even if the
attribute is the same, both metric measures are not comparable.
On the other hand, regarding the elementary indicator shown in Table 3, its specifi-
cation is in terms of quality satisfaction levels –since the Security characteristic in
Table 1 is based on the ISO quality model-, so each vulnerability indicator value can
be obtained as per Eq. 1. Recall that the underlying hypothesis is that each security
attribute to be controlled for the target entity should show the highest quality level of
satisfaction as an elementary nonfunctional requirement. But as the reader can surmise,
the elementary indicator template in Table 3 could also represent the vulnerability level
almost straightforwardly, under the premise that the higher the quality indicator value
achieved per each attribute, the lower will be the vulnerability indicator value. Hence,
the risk magnitude per each vulnerable attribute can be calculated using Eq. 2.
Lastly, the aggregation model in Eq. 3 can be used for calculating the current state
of the security global risk based on risk elementary indicator values. Also the risk re-
duction can be calculated after improvement actions (risk treatment) and re-evaluation
were performed. These issues will be thoroughly illustrated in a follow-up paper.
4 Related Work
Considering the state-of-the-art research literature, what metrics and indicators mean
and where they properly fit in with regard to specific M&E processes and strategy have
often been understated or neglected. Furthermore, there are abundant research and
standards in areas such as measurement and analysis [2, 4, 7, 12], IT security and risk
assessment [1, 10, 11, 15, 16], but issues such as why, what, who, when, where and
how to measure and evaluate have very often been poorly intertwined and specified.
For instance, as quoted in sub-section 3.1, Nelson states that a “discussion of the
why, who, what, where, and when of security metrics brings clarity and further under-
standing because it establishes a framework for implementing a framework to imple-
ment security metrics in your organization”. Nevertheless, in our opinion Nelson fails
in discussing the W5H mnemonic rule with more robust conceptual grounds as we did
based on the GOCAME first and second principles introduced in sub-sections 2.1 and
2.2. Moreover, the how issue –which precisely deals with the key aspect of metric and
indicator specifications- is also left aside, when the author remarks “How is left as an
exercise for the reader” (cf. p.14).
On the other hand, we have developed an integrated M&E strategy so-called
GOCAME, which is made up of three capabilities, i.e. the conceptual framework, the

14th Argentine Symposium on Software Engineering, ASSE 2013
42 JAIIO - ASSE 2013 - ISSN: 1850-2792 - Page 181
process, and the methodology, as overviewed in Section 2. The metric and indicator
ontology used by the C-INCAMI conceptual framework has similarities to the one
presented in [6]. However in [17] we have modeled some terms e.g., elementary indi-
cator, global indicator, etc., and some relationships e.g., measurement and measure,
metric and indicator, among others, which differ semantically with those proposed in
[6]. In addition, we have enlarged the metric and indicator ontology with context terms
and relationships [13] while in [6] these are missing. Moreover, GOCAME exhibits a
terminological correspondence between the C-INCAMI conceptual framework and the
process specifications; for example, the activity diagram of Fig. 2 shows many of the
same terms defined in the ontology and depicted in Fig. 1. Note that a more explicit
representation about this correspondence will be documented apart.
Lastly, in order to support repeatability and consistency of results among different
M&E and analysis projects and programs, well-established strategies are needed as
well. In [19] two integrated M&E strategies –which can also be used for risk assess-
ment- namely GQM+Strategies [2] and GOCAME were assessed and analyzed tho-
roughly. The study drew GQM+Strategies performs lower than GOCAME regarding
the suitability of the conceptual base and framework. Ultimately, the sound and com-
plete specification of metrics and indicators as shown in the previous templates (tables
2 and 3) outperforms the examined ones in the related work.
5 Conclusion and Future Work
Finally, we would like to highlight the three contributions listed in Section 1. The first
one that says “the awareness of the added value of supporting the IT security/risk as-
sessment area with a quality evaluation strategy, which is based on metrics and indica-
tors” was one driver of the paper. We have discussed our approach helps bridging the
gap between the IT security/risk assessment area and existing quality M&E methods.
The entrance gate –as described in sub-section 2.2- is based on identifying vulnerabili-
ty attributes of a target entity, which can be quantified by metrics and interpreted by
indicators. Hence, by using GOCAME, we can apply for quality and risk assessment
its multi-criteria (attribute) decision analysis methods.
To the second contribution that says “a thorough discussion about the specification
of metrics and indicators as informational, reusable resources for M&E process de-
scriptions…” we have stated that metrics and indicators are basic, yet key organiza-
tional assets for providing suitable data and information for analyzing, and ultimately
decision-making tasks. Also we have remarked that a metric is the sound specification
of a measurement process that transforms an entity attribute –the input- into a measure
–the output, i.e. data-; and the elementary indicator is the sound specification of an
evaluation process, which has as input a metric’s measure and produces as output an
indicator value –i.e. contextual information. Besides, we have highlighted throughout
the paper the importance of recording not only data sets and information but also the
associated metadata, giving clues of a potential wrong analysis in sub-section 3.3.
Lastly, the third stated contribution “the illustration of metrics and indicators from
excerpts of an actual IT security and risk evaluation case study” has been made mainly
in sub-section 3.2. The purpose of the information need is firstly to understand the
current quality satisfaction level achieved to the Security characteristic for the XYZ

14th Argentine Symposium on Software Engineering, ASSE 2013
42 JAIIO - ASSE 2013 - ISSN: 1850-2792 - Page 182
entity, from the security administrator user viewpoint. Once its current state is unders-
tood, the following purpose is to improve the XYZ system in those weakly performed
indicators; that is, to reduce its security risks. The whole results and analysis of this
case study will be documented in a separate paper.
Regarding future work, an ontology for risk assessment is to the best of our know-
ledge missing yet, so we are considering its further development as we did for M&E.
Currently, there exist vocabularies such as in [9], but we are aware that an ontology
supports a richer conceptual modeling than a glossary of terms; hence, this can benefit
the instantiation of SRM strategies, processes and methods as well.
References
1. Alberts C., Dorofe A. OCTAVE, Method Implementation Guide V.2.0, CM-SEI, US, 2001.
2. Basili V., Lindvall M., Regardie M., Seaman C., Heidrich J., Jurgen M., Rombach D.,
Trendowicz A. Linking Software Development and Business Strategy through Measure-
ment, IEEE Computer, (43):4, pp. 57–65, 2010.
3. Becker P., Molina H., Olsina L. Measurement and Evaluation as quality driver. In: ISI
Journal (Ingénierie des Systèmes d’Information), Special Issue “Quality of Information
Systems”, Lavoisier, Paris, France, (15): 6, pp. 33-62. 2010.
4. CMMI Product Team. CMMI for Dev. Ver.1.3. CMU/SEI-2010-TR-033, USA, 2010.
5. Dujmovic, J, Continuous Preference Logic for System Evaluation, IEEE Transactions on
Fuzzy Systems, (15): 6, pp. 1082-1099, 2007.
6. Garcia F.; Bertoa M.; Calero C.; Vallecillo A.; Ruiz F.; Piattini M.; Genero M. Towards a
consistent terminology for software measurement. IST Journal (48):8, pp. 631-644, 2005.
7. Goethert W., Fisher M. Deriving Enterprise-Based Measures Using the Balanced Scorecard
and Goal-Driven Measurement Techniques, Software Engineering Measurement and Anal-
ysis Initiative, CMU/SEI-2003-TN-024, Available online, 2003.
8. ISO/IEC 25010. Systems and software engineering – Systems and software product Quality
Requirements and Evaluation (SQuaRE) – System and software quality models, 2011.
9. ISO/IEC Guide 73. Risk management. Vocabulary – Guidelines for use in standards. 2009.
10. ISO/IEC 27004; Information technology - Security techniques - Information security man-
agement - Measurement, 2009.
11. ISO/IEC 31010. Risk management – Risk assessment techniques, 2009.
12. Kitchenham B., Hughes R., Linkman S. Modeling Software Measurement Data. IEEE
Transactions on Software Engineering. (27):9, pp. 788-804, 2001.
13. Molina H.; Rossi G., Olsina L. Context-Based Recommendation Approach for Measure-
ment and Evaluation Projects, In: Journal of Software Engineering and Applications
(JSEA), Irvine, USA, (3): 12, pp. 1089-1106, 2010.
14. Nelson C. Security Metrics: An Overview, In: ISSA Journal, pp. 12-18, August 2010.
15. NIST SP 800-30. Guide for Conducting Risk Assessments. Available at
http://csrc.nist.gov/publications/PubsSPs.html, Set. 2011, accessed in Feb. 2013.
16. NIST SP 800-55. Performance Measurement Guide for Information Security. Available at
http://csrc.nist.gov/publications/PubsSPs.html, July 2008, accessed in Feb. 2013.
17. Olsina L., Martín M. Ontology for Software Metrics and Indicators. In: Journal of Web
Engineering, Rinton Press, USA, (2): 4, pp. 262-281, 2004.
18. Olsina L., Papa F., Molina H. How to Measure and Evaluate Web Applications in a Consis-
tent Way. In: Chapter 13 of Springer book, HCIS Series: Web Engineering: Modeling and
Implementing Web Applications, pp. 385-420, 2008.
19. Papa F.; Toward the Improvement of an M&E Strategy from a Comparative Study; In:
Current Trends in Web Eng., ICWE Workshops, LNCS 7703, Springer, pp. 189-203, 2012.