bridge fuel or gangplank? america’s natural gas · technologies proposed by nrdc and wri . 1%...
TRANSCRIPT

Bridge Fuel or Gangplank? America’s Natural Gas
James McGarry
Chief Policy Analyst
Chesapeake Climate Action Network

Climate Change & Energy
350 parts per million (ppm): The CO2 concentration in our atmosphere considered by scientists to be a “safe upper limit”
400 ppm: The threshold that the Earth passed in May 2013
To prevent global temperatures from rising 2°C relative to pre-industrial levels – the maximum upper limit agreed upon by 114 nations including the United States – global greenhouse gas emissions will have to fall 40% to 70% by 2050.
-Intergovernmental Panel on Climate Change. Fifth Assessment Report, Working Group III: Mitigation of Climate Change. 13 Apr. 2014.

Natural Gas: Bridge Fuel to Clean Energy Future?
Natural gas emits half as much CO2 as coal…. at the point of combustion.
But that’s only half the story!
Combustion is only one part of a much longer natural gas lifecycle.

Lifecycle Natural Gas Emissions
“Because of leaks of methane, the main component of natural gas, the gas extracted from shale deposits is not a “bridge” to a renewable energy future — it’s a gangplank to more warming and away from clean energy investments.”
NYT op-ed, “Gangplank to a Warm Future” July 28, 2013
Anthony R. Ingraffea - professor of civil and environmental engineering at Cornell University
Source: The Carbon Brief
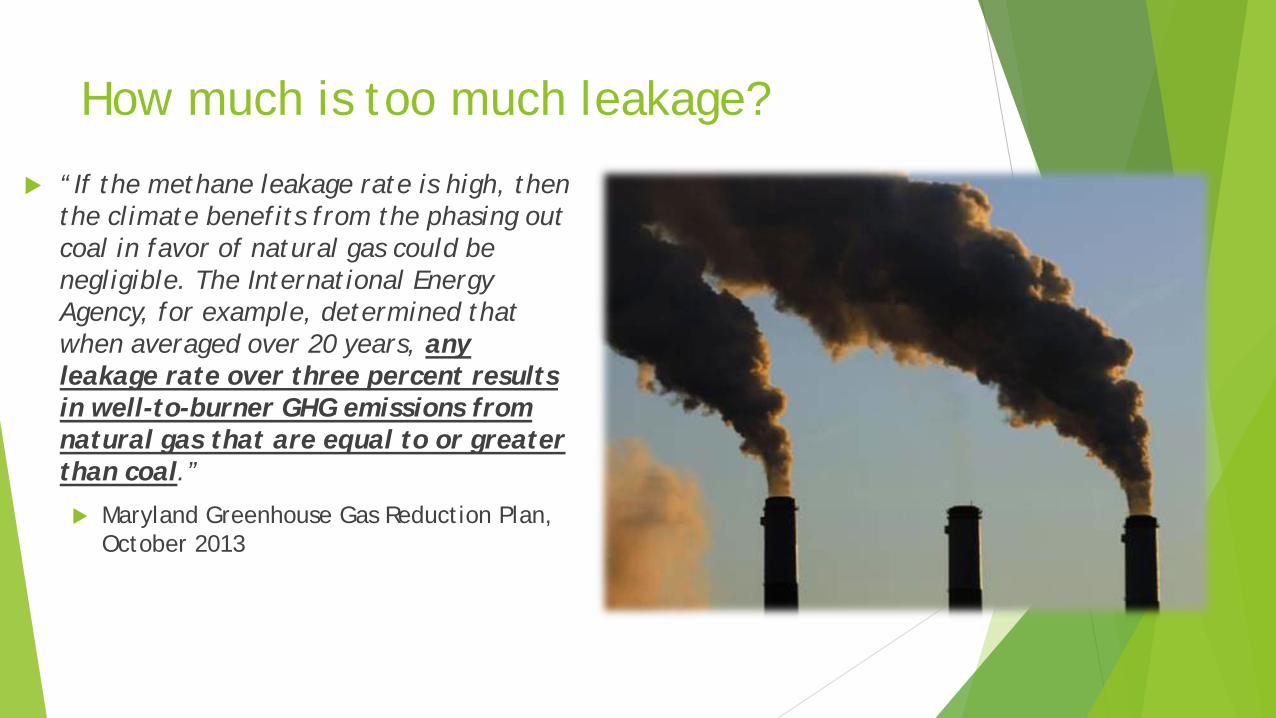
How much is too much leakage?
“If the methane leakage rate is high, then the climate benefits from the phasing out coal in favor of natural gas could be negligible. The International Energy Agency, for example, determined that when averaged over 20 years, any leakage rate over three percent results in well-to-burner GHG emissions from natural gas that are equal to or greater than coal.”
Maryland Greenhouse Gas Reduction Plan, October 2013

How much is too much leakage?
“For Compressed Natural Gas to immediately reduce climate impacts from heavy-duty vehicles, well-to-wheels leakage must be reduced below 1%.”
Alvarez, et. al., Proceedings of the National Academies of Science, Feb. 2012

How high is methane leakage? U.S. Environmental Protection Agency
1.5%
University of Texas, Austin, Environmental Defense Fund, URS Corporation, and Colorado School of Mines, et.al. Measurements of Methane Emissions at Natural Gas Production Sites in the United States. 2013. Fracked gas production-stage emissions are similar to EPA estimates.
Stanford, Harvard, MIT, National Renewable Energy Laboratory, National Oceanic and Atmospheric Administration, et.al. “Methane Leaks from North American Natural Gas Systems”. Science Vol 343 14 February 2014 EPA is underestimating gas sector methane emissions by 50%.
National Oceanic and Atmospheric Administration, and University of Colorado, Boulder. “Methane Emissions Estimates from Airborne Measurements over a Western United States Natural Gas Field.” 2013. Measured leakage rates in fracked Utah gas fields between 6% and 12%
National Oceanic and Atmospheric Administration, Cornell University, Pennsylvania State University, and University of Colorado, Boulder. Toward a Better Understanding and Quantification of Methane Emissions from Shale Gas Development. April 2014. Measured leakage from fracked wells in SW Pennsylvania that were were 2 to 3 orders of magnitude
(100 - 1,000 times) greater than EPA estimates.
Howarth, Robert W., Renee Santoro, and Anthony Ingraffea. "Methane and the Greenhouse-gas Footprint of Natural Gas from Shale Formations: A Letter." Climate Change 106 (2011): 679-90. Estimates lifecycle leakage rates from fracked gas ranges from 3.6% to 7.9%

How do we prevent methane leakage?
Current Trajectory
EPA’s New Source Performance Standards (NSPS) for new oil & gas wells
EPA’s NSPS + 3 cost-effective abatement technologies proposed by NRDC and WRI
1% Leakage Threshold
EPA’s NSPS + 10 cost-effective abatement technologies proposed by NRDC
Source: World Resources Institute, Clearing The Air: Reducing Upstream Greenhouse Gas Emissions From U.S. Natural Gas Systems, 2013

What are 10 cost-effective abatement technologies?
What: Green Completion Payback Time: 0.17 – 1.0 yrs Profit/well/year (after payback): $2,180 - $75,620
What: Plunger Lift System Payback Time: 0.09 – 0.13 yrs. Profit/well/year (after payback): $7,050 - $100,400
What: TEG Dehydrator Emission Controls Payback Time: 0.09 yrs. Profit/well/year (after payback): $7,050 - $100,400
What: Desiccant Dehydrators Payback Time: 2.67 yrs. Profit/well/year (after payback): $2,800
What: Dry Seal Systems Payback Time: 0.38 – 1.15 yrs. Profit/well/year (after payback): $77,620 - $473,870

What are 10 cost-effective abatement technologies?
What: Improved Compressor Maintenance Payback Time: 0.34 – 4.81 yrs Profit/well/year (after payback): $2,460 - $12,170
What: Low-Bleed or No-Bleed Pneumatic Controllers Payback Time: 0.09 – 0.15 yrs Profit/well/year (after payback): $510 - $1,880
What: Pipeline Maintenance and Repair Payback Time: 0.7 – 2.0 yrs Profit/well/year (after payback): $39,870 - $53,800
What: Vapor Recovery Units Payback Time: 0.3 – 3.28 yrs Profit/well/year (after payback): $6,970 - $336,990
What: Leak Monitoring and Repair Payback Time: likely small Profit/well/year (after payback): likely positive

Reducing Methane: Low Cost, High Reward
“It is…. critically important for Maryland and the federal government to develop and implement standards to keep the methane leakage rate as
low as possible.”
-Maryland Greenhouse Gas Reduction Plan, October 2013
Source: Natural Resources Defense Council, Leaking Profits, 2012