bridge condition assessment using remote...
TRANSCRIPT

Bridge Condition Assessment Using Remote Sensors
Michigan Technological University
Colin Brooks – Co-Principal Investigator [email protected]
Dr. Tess Ahlborn, P.E., Principal Investigator [email protected]
Michigan Bridge Conference, March 23, 2011
USDOT/RITA Commercial Remote Sensing and Spatial Information Technologies Program Program Manager: Caesar Singh

Motivation National Need
2
Bridge Condition in the U.S. - $150B to repair today
Deteriorated Concrete Element
Deteriorated Bearing
Settlement Deck Section Loss

3
Cracking- Visual Inspection-Acoustic Emission
- Ultrasonic Pulse Velocity- Thermography
Thickness (Cover)- Ground Penetrating Radar
- Impact Echo
Delamination- Chain Drag- Imact Echo
Corrosion- Half-cell Potential- Acoustic Emission
DURABILITY(Local Material Integrity)
Strain-Electrical Resistance Gages
-Fiber-Optic Gages- Vibrating Wire Gages
Stiffness- Seismic (accelerometers)
- Displacement Transducers
Thickness- Caliper
- Ground Penetrating Radar
Deflection-Displacement Transducers
-- Tiltmeters (rotation)- Seismic (accelerometers)
- Laser
MECHANICAL(Global Structural Integrity)
General Concepts Techniques RS for Bridges
SHM - Overview Remote Sensing In-Progress Wrap-up

Structural Health Monitoring
• Traditional Inspection Techniques – Visual, chain drag, half-cell potential, accelerometers
• Advanced Monitoring Techniques – GPR, impact echo, fiber optics, thermal IR, ultrasonic
– Wireless remote monitoring
• Remote Sensing: Non-contact data collection – “the collection of data about an object, area, or
phenomenon from a distance with a device that is not in contact with the object.”
4
General Concepts Techniques RS for Bridges
SHM - Overview Remote Sensing In-Progress Wrap-up
Structural Health Monitoring
• Remote Sensing for Bridges
– Consider commercially available technologies
– Monitor and assess condition, enhance inspection
– At a distance
– Without stopping traffic or closing lanes
5
General Concepts Techniques RS for Bridges
SHM - Overview Remote Sensing In-Progress Wrap-up

Project Concept
6
DSS: algorithms & interface
Trouble Spot 2Trouble Spot 1
BRIDGE INFRASTRUCTURE
ASSESSMENT DSS
Bridge
Management
Team
DSS
BRIDGE MANAGEMENT TEAM
Rem
ote
Sensin
g
On Site and
In Situ Sensors
BRIDGE
Data Collection
RelayTI
ME
Period X(Current)
Period 0(Baseline)
Period 1
Bridge Management System DataStructural Health Monitoring ModelMaintenance RecordsMeteorological Data
Bridge Health SignatureDamage Location
Bri
dge
He
alth
In
dic
ato
rs
Transportation officials utilize dynamicBridge Health Signature to evaluate changing condition
Periodic assessments enhanced with remote sensing as trouble spots are identified
rderR
erks rrkj
kRj
ˆ2
2
4,
Decision Support System
Concept Commercial Sensor Evaluation
SHM - Overview Remote Sensing In-Progress Wrap-up

Commercial Sensor Evaluation Report
7
Evaluated twelve RS technologies for Bridge Condition Assessment – based on top priorities
Performance metric ranking Commercial availability Sensitivity of measurement: resolution -----------------------------------------------------------------------------------------------------------------------
Cost: capital, operational Ease of pre-collection prep: structure, equip Ease of data collection and operation Complexity of analysis Stand-off distance rating Traffic Disruption
Written for bridge engineers – Available on website
SHM - Overview Remote Sensing In-Progress Wrap-up
Concept Commercial Sensor Evaluation

8
Location “Top 10” Priorities/Challenges
Deck Surface Map cracking, Scaling, Spalling, Delaminations (through surface cracks), Expansion Joint External Issues
Deck Subsurface Scaling, Spalling, Delaminations , Expansion Joint Internal Issues, Corrosion, Chloride Ingress
Girder Surface Structural Steel and Structural Concrete Cracking, Paint Condition, Steel or Concrete Section Loss
Girder Subsurface Structural Concrete Cracking, Concrete Section Loss, Chloride Ingress, Prestress Strand Breakage
Global Metric Bridge Length, Settlement, Transverse Movement, Vibration, Surface Roughness
Top Priorities / Challenges
SHM - Overview Remote Sensing In-Progress Wrap-up
Concept Commercial Sensor Evaluation


Commercial Sensor Evaluation Report: Promising Technologies
10
3-D Optics including Photogrammetry
Thermal Infrared
Digital Image Correlation
Radar including SAR and InSAR
Street-view Style Photography
Satellite Imagery and Aerial Photography
LiDAR
Field Inspection of Bridges – shadowed bridge inspectors for various bridge types to better understand how these technologies can be practically implemented for enhancing inspections
Concept Commercial Sensor Evaluation
SHM - Overview Remote Sensing In-Progress Wrap-up

3-D Optics: Photogrammetry Definition: Any digital
photography in the optical, thermal infrared, and near infrared parts of the spectrum collected from an aerial, satellite, or other platform
Proposed Application: Mapping bridge features; 3D models; characterizing deck surface (spalling, cracks)
11
Current Practice: Most commonly used to create digital elevation models, measure features on aerial photographs; close range photogrammetry is expanding
Currently in Study: using DSLR cameras -
Stereo overlapping of photos + 3-D modeling software creates a surface point cloud
Feasibility Studies SHM - Overview Remote Sensing In-Progress Wrap-up

12
• Preliminary work - showed the resolution to be about 4mm in both the horizontal and vertical directions • System is being designed with low-cost components (Digital SLRs, commercial close-range photogrammetry software) - Low cost alternative for 3-D data (alt. LiDAR) • How to best transfer this information to the bridge inspector – visualizing results
Spalls located under the bridge deck.
Models generated from the infield photos with textured model on the left and shaded model output from PhotoScan on the right.
3-D Optics – Field Testing
Feasibility Studies SHM - Overview Remote Sensing In-Progress Wrap-up

• Calculating volume of spall (dev. algorithm)
• Able to calculate volume for difficult to reach (tall) locations
13
3-D Optics – Field Testing
Feasibility Studies SHM - Overview Remote Sensing In-Progress Wrap-up

Thermal IR
Optical and thermal images of concrete overlay with delaminations
Optical and thermal images of delaminations in the soffit of a bridge [G. Washer et al., Development of hand-held thermographic inspection technologies, Technical report, Missouri Department of Transportation, Sep 2009]
14
Definition: Measure radiant temperature of concrete by thermal infrared camera (anomalies interrupt the heat transfer through the concrete).
Delaminations appear as hot spots. Current Practice: • ASTM D 4788: thermal IR test method, equipments and environmental conditions for detecting delamination in concrete bridge decks (80-90% efficient) •Thermal IR training for bridge inspectors in some state DOTs
Feasibility Studies SHM - Overview Remote Sensing In-Progress Wrap-up
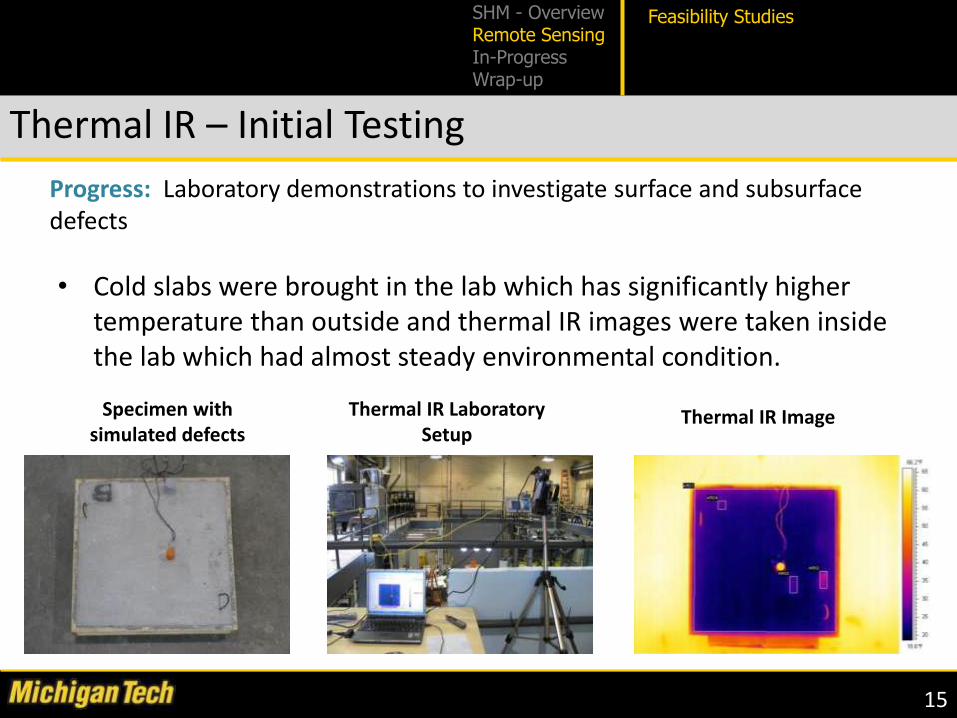
Thermal IR – Initial Testing
Specimen with simulated defects
Thermal IR Laboratory Setup
• Cold slabs were brought in the lab which has significantly higher temperature than outside and thermal IR images were taken inside the lab which had almost steady environmental condition.
Thermal IR Image
15
Progress: Laboratory demonstrations to investigate surface and subsurface defects
Feasibility Studies SHM - Overview Remote Sensing In-Progress Wrap-up

Factors that can influence the Thermal IR image:
• Different materials on the surface: - Dirt - Moisture - Staining • Environmental effects: - Ambient temperature (ASTM D 4788 – 32F)
- Humidity - Solar Loading (consistent) - Wind speed (ASTM D 4788 – 30mph)
• Deck Overlay type - Low slump concrete overlay - Asphalt concrete overlay - HPC overlay • Location of delaminated area - Deck (1-3 in depth) - Soffit - Girder
Edit the data according to the optical (normal) image.
Use ambient temperature and humidity as input values on TIR camera.
Effects of solar loading on thermal contrast (solar loading vs. 1-,2-,3-, 5 in. simulated delaminations) [G. Washer et al., Thermal Imaging for Bridge Inspection and Maintenance, Tenth International Conference on Bridge and Structure Management, 2008]
16
Feasibility Studies SHM - Overview Remote Sensing In-Progress Wrap-up

17
Digital Image Correlation (DIC)
Specimen DIC Camera
LOAD
MATLAB Software Analysis Images Captured from Camera
Definition: technique consisting of correlating pixels on optical images to determine variations
Proposed Application: Global response (movement, settlement, vibration); 3D models;
Exploring for non-contact use
Currently: using SLR cameras on specimens and process images in computer software algorithms such as MATLAB
0
10
20
30
40
0 1 2
Measured System Response
Camera device used in underwater inspections Fig. 11.3.47 Bridge Inspection Reference Manual (2005).
Feasibility Studies SHM - Overview Remote Sensing In-Progress Wrap-up

18
Digital Image Correlation (DIC) – Initial Testing Enhanced Tracking Pattern
• Used for measuring displacements on a steel beam with fiducial marks (pattern)
• Images from Digital SLR camera are processed through MATLAB
• From translation of fiducial marks, the beam deflection is measured • Potential measurement of beam
vibrations (dynamic measurement)
• Can be presented easily graphically
Loaded Steel Beam
Post-Processed Response
Feasibility Studies SHM - Overview Remote Sensing In-Progress Wrap-up

19
Digital Image Correlation (DIC) - Planned
• Compare experimental demonstrations using conventional measurement techniques and finite element analysis (FEA) • Bridge Pylons and W-Shape
steel samples for testing
• FEA modeling on testing frame and specimens for DIC comparison
• Field demo for global behavior
Structural Loading Frame and FEA Representation
Bridge Pylon Sample Before Compression Tests
Feasibility Studies SHM - Overview Remote Sensing In-Progress Wrap-up

Definition: Synthetic Aperture Radar (SAR): Coherently process RF backscattering measurements from a moving radar to produce a 2-D (or 3-D) spatial image of scene reflectivity. Low frequency radar is used to penetrate surfaces. Subsurface reflections correspond to layer and/or defects
Currently: using wideband, low frequency commercially-available radar to investigate detectability of subsurface structure and defects
20
Antenna
Rail
Absorber
Blockwall
Pavers
Foam rotatorcone
LabGenie
Imaging GPR - Synthetic Aperture Radar (SAR)
Paver
Paver
Gap
Gosts of obscured portionsof wall
Blobology: 2 Pavers with 1 mm Gap
Feasibility Studies SHM - Overview Remote Sensing In-Progress Wrap-up

Current Practice: Ground Penetrating Radar like PERES (Precision Electromagnetic Roadway Evaluation System)
• Short pulse
• Slow (3D scan)
• Expensive
• Calibration
• Antenna/Ground Impedance matching
• First Surface cancellation
Proposed Application: Mapping bridge surface/sub-surface features; characterize/locate defects (spalling, cracks, delaminations, etc.)
21
MTRI Approach: using wideband, low frequency commercially-available radar to investigate detectability of subsurface structure and defects
• Fast (2D scan)
• SAR Processing
• Advanced Signal/Image Processing Techniques
• Low Cost
Imaging GPR - Synthetic Aperture Radar (SAR)
Feasibility Studies SHM - Overview Remote Sensing In-Progress Wrap-up

22
• Perform controlled field tests
• Box beams: interior defects • Quantify subsurface spall
• Develop algorithms to enhance the detectability of and characterize defects in radar imagery in context of DSS •Advanced Signal/Image Processing Techniques
•Translate “Blobology” into end user products in DSS •Use data from existing GPR systems
Imaging GPR – Next Steps
Front paver
Paver
Paver
Gap
Note: Rebar not immediatelyevident
Ghosting artifacts fromBackground subtraction
Separation of paversIntimate contact is evident
Pavers
Feasibility Studies SHM - Overview Remote Sensing In-Progress Wrap-up

Interferometric SAR (InSAR) Definition: InSAR exploits phase differences
between 2 or more SAR images to estimate height of features. Comparison from two time periods can detect changes in geometry and/or position
Current Practice: Aerial InSAR frequently used to create 3-D surfaces (Digital Elevation Models); land settlement for large areas (InterMap data)
Proposed Application: Bridge dynamics, vibration, and strain; bridge stiffness; elevation surfaces (DEM); bridge settlement; global changes in position.
23
Our Project: Selecting bridge to assess if settlement can be measured using imagery separated in time
Feasibility Studies
Example SAR data for Blue Water Bridge showing “bright” returns for man-made features – track their heights over time
SHM - Overview Remote Sensing In-Progress Wrap-up

24
StreetView-Style Photography Definition: Contiguous collection of geo-located photographs taken from the
ground, especially where the photographs have been projected into a continuous 360-degree viewing environment (like Google StreetView).
Current Practice: StreetView used by public for viewing areas of interest; private firms doing similar high-res 3-D scans of cities for inventory
Proposed Application: Damaged or missing expansion joint seals or plating, cracks and spalls near expansion joints, map cracking, scaling, spalling, and delaminations – testing use for bridges
Example images from Google's StreetView showing the underside of bridges in SE Michigan. With higher-resolution panoramas, such an interface could be extremely valuable to bridge inspectors and managers.
Our team’s BridgeViewer Remote Camera System setup is designed to demonstrate a low-cost, practical example implementable by DOTs.
Feasibility Studies SHM - Overview Remote Sensing In-Progress Wrap-up

• Low-cost way of creating GPS-tagged photos of top, underside of bridge usable in GIS, Google Earth
• Could be deployable by MDOT as needed as part of photo logging
• “Gigapan” ultra-high res bridge inventory photos as well
25
StreetView-Style Photography
Feasibility Studies SHM - Overview Remote Sensing In-Progress Wrap-up

• Can use high-res photography to automate assessment of spalling amounts
• Calculating % spalled by area: – Ex: 6.4% spalled, 2.68 sq.
ft (dev. algorithm)
26
StreetView-Style Photography
Feasibility Studies SHM - Overview Remote Sensing In-Progress Wrap-up

27
Satellite Imagery and Aerial Photography Definition: Any satellite imagery and
aerial photography in the visible and infrared ranges with sufficient resolution that can be used to remotely assess deck surface conditions
Current Practice: Some applications for assessment of larger crack density (>1/4”); general views of areas along & near transportation infrastructures
Proposed Application: Use high-resolution imagery to calculate indices of deck surface condition, esp. cracking and spalling. We will build from TARUT Study index of road sufficiency calculations via satellite imagery.
Currently in Study: We will be assessing this technology as part of the field demonstrations – ensure careful use of funds if purchasing commercial satellite imagery.
Feasibility Studies SHM - Overview Remote Sensing In-Progress Wrap-up

LiDAR • Current practice example:
UNCC team funded by USDOT-RITA –LiDAR lead – bridge clearance assessment
• Current Study: Assessing methods of integrating bridge clearance data into Decision Support System
• Michigan Tech ‘s deployable “LiDAR car”
• Gathering 3-D LiDAR point cloud of example bridges in March/April – 3-D inventory of bridge + photos
28
LiDAR 3-D point clouds of bridges
Sanb
orn
O
ptech
Michigan Tech’s LiDAR mobile mapping system & Rozsa building point cloud
Feasibility Studies SHM - Overview Remote Sensing In-Progress Wrap-up

Remote Sensing: Promising Technologies
29
3-D Optics including Photogrammetry
Thermal Infrared
Digital Image Correlation
Radar including SAR and InSAR
Street-view Style Photography - Bridgeviewer
Satellite Imagery and Aerial Photography
LiDAR
Feasibility Studies SHM - Overview Remote Sensing In-Progress Wrap-up

Decision Support System Integration
30
Promising Technologies
3-D Optics including Photogrammetry → deck and girder surface challenges including some global metrics Thermal Infrared → deck and girder surface challenges including some subsurface issues Digital Image Correlation → global metrics Radar including SAR & InSAR → deck and girder subsurface challenges including some global metrics Street-view Style Photography → deck and girder surface challenges including surface roughness metric Satellite Imagery → deck and girder surface challenges including some global metrics
Historical Bridge- Specific
Information
Bridge Standards and Requirements
Integrated Bridge
Assessment
Decision Support System
Data analysis Integration Algorithms
BRIDGE SIGNATURE
DSS Field Demo Assessment
SHM - Overview Remote Sensing In-Progress Wrap-up

Decision Support System – key attributes
• DSS needs to be able to integrate, interpret, and present data that is usable by non-experts
• Extract features of interest and indicators of bridge condition from remote sensing and other data
• Compare remote sensing results to expected / normal results and detect anomalous results, especially change (based on previously-collected data or modeled results)
• Should be accessible in the field (durable tablet) and available for mission planning and repair prioritization beforehand
• Needs example data to produce most usable, practical DSS that meets needs of bridge condition community
• Building from lessons learned, interface inspiration from Phase I/II UNCC team – wide survey of DOTs and DSS needs
31
DSS Field Demo Assessment
SHM - Overview Remote Sensing In-Progress Wrap-up

Current design:
- Access to Bridge Operations tools (in the field)
- Access to Bridge Condition data in GIS format
- Access to remote sensing results – mission planning & in the field
- Access to existing mapping tools
- Accessible via ruggedized tablets
32
Decision Support System – under development
DSS Field Demo Assessment
SHM - Overview Remote Sensing In-Progress Wrap-up

• New remote sensing data, geotagged photos, existing mapping tools, algorithm analysis results, & integration with existing bridge condition data – will be made available through a GIS web mapping interface part of the DSS
33
Decision Support System – under development
DSS Field Demo Assessment
SHM - Overview Remote Sensing In-Progress Wrap-up

• Access to bridge operations data in the field would be useful
• Data & DSS access tools
• Rugged, internet-capable, relatively inexpensive tablets now available
• Ex: iPad, Galaxy Tab
• Interest from USDOT as practical tools
34
Decision Support System – ruggedized field tablet
DSS Field Demo Assessment
SHM - Overview Remote Sensing In-Progress Wrap-up

35
Field Demo on 2 Bridges – Summer 2011 • Criteria
• Similar type bridges, condition: bad and ugly
• Representative of high interest problems
• Decks – condition, repairs, no overlays
• Bridge with significant existing info, (e.g. inspections reports, historical data for good ground truthing)
• Accessibility (highway over highway) preferred; distance to AA
• Concurrent MDOT inspection data collection (scoping)
• Special set of bridges for particular challenges (e.g. settlement)
DSS Field Demo Assessment
SHM - Overview Remote Sensing In-Progress Wrap-up

36
Field Activity Planning:
Layout of DIC Process
• Anticipated Outcomes
• Technology/sensor performance vs. expected measures and limitations
• Specific sensor observations to feed the DSS
• Lessons learned with respect to all field demos, practical considerations for implementation
• Identification of redundancies
DSS Field Demo Assessment
SHM - Overview Remote Sensing In-Progress Wrap-up
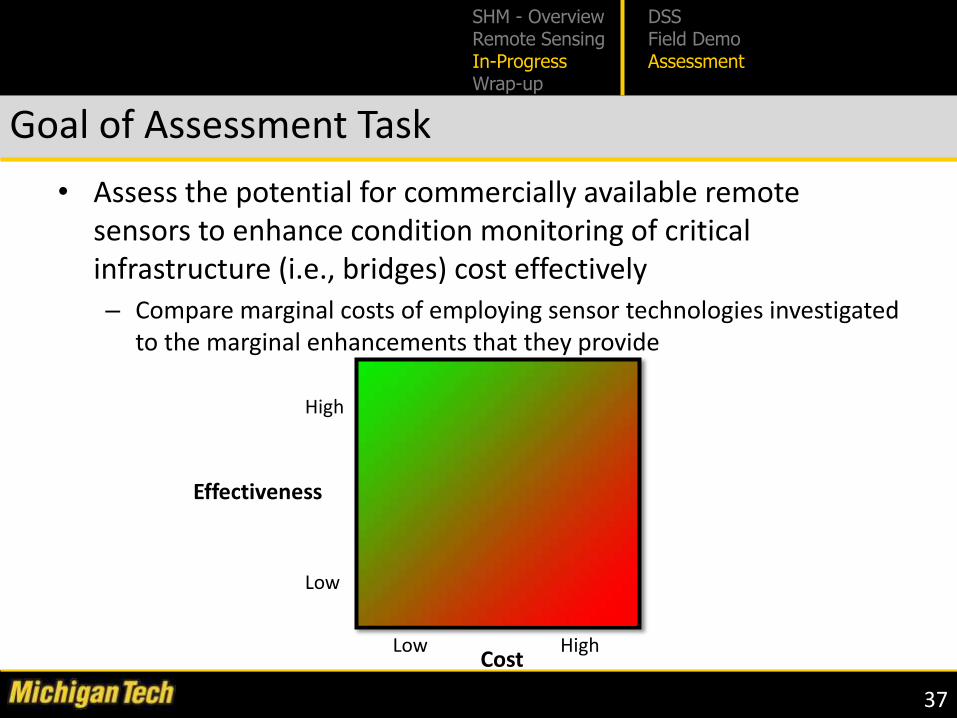
• Assess the potential for commercially available remote sensors to enhance condition monitoring of critical infrastructure (i.e., bridges) cost effectively – Compare marginal costs of employing sensor technologies investigated
to the marginal enhancements that they provide
Goal of Assessment Task
Effectiveness
Cost High
Low
Low
High
DSS Field Demo Assessment
37
SHM - Overview Remote Sensing In-Progress Wrap-up

38
CONTROLLED LABORATORY MEASUREMENTS
On Site Sensor Response to Bridge Components of Varying Configuration and Condition
FIELD MEASUREMENTS On Site Sensor Response to
Representative Bridge Components of Varying
Configuration and Condition
Development of Anomaly Detection
Algorithm
Decision Support Integration
Sensor Selection and Deployment
Field Demonstration
Summary
Summary
Examples: 3-D Optics → spalls Thermal IR → delaminations Digital IC → bridge settlement Radar → loss in cross-section StreetView Photo → missing seal Satellite Imagery → deck condition
SHM - Overview Remote Sensing In-Progress Wrap-up

Acknowledgements
• USDOT – Research and Innovative Technology Administration – Commercial Remote Sensing and Spatial Information
Program Manager: Caesar Singh – Cooperative Agreement #DTOS59-10-H-00001
• Project Partners
– Michigan Department of Transportation – Michigan Tech Transportation Institute – Michigan Tech Research Institute – Center for Automotive Research
• Technical Advisory Council
39
39
SHM - Overview Remote Sensing In-Progress Wrap-up

Project Team / Disclaimer
• Project Team Members: MTTI + MTRI + CAR Tess Ahlborn Devin Harris Larry Sutter Bob Shuchman Colin Brooks Joe Burns Chris Roussi Arthur Endsley Khatereh Vaghefi Ben Hart Renee Oats Rick Dobson
40
40
Darrin Evans Jim Ebling Richard Wallace Mike Forster Ryan Hoensheid Kiko de Melo e Silva John Valenzuela Joel LeBlanc Andrew Leonard Shazeb Quadir Christina Nolte Pam Hannon Michelle Wienert Kirk Scarbrough
DISCLAIMER: The views, opinions, findings and conclusions reflected in this
presentation are the responsibility of the authors only and do not represent the
official policy or position of the USDOT/RITA, or any State or other entity.
SHM - Overview Remote Sensing In-Progress Wrap-up

Website: www.mtti.mtu.edu/bridgecondition/
41
Thank you SHM - Overview Remote Sensing In-Progress Wrap-up

Contact Information
Tess Ahlborn, Ph.D., P.E. – Principal Investigator
Director, Center for Structural Durability
Michigan Tech Transportation Institute
Associate Professor, Civil and Environmental Eng.
Michigan Technological University
1400 Townsend Drive Houghton, MI 49931
906-487-2625; [email protected]
www.mtti.mtu.edu/bridgecondition/
42