brexit and its implications for british and eu energy and climate … · 2017-11-22 · brexit and...
TRANSCRIPT
Centre on Regulation in Europe (CERRE) a.s.b.l.
Avenue Louise 475 Box 10|B-1050 Brussels|Belgium
+32 2 230 83 60|[email protected]|www.cerre.eu
Brexit and its implications for British and EU
Energy and Climate Policy
Project Report
Michael G. Pollitt (CERRE & University of Cambridge)
Kong Chyong (University of Cambridge)
22 November 2017
171122_CERRE_BrexitEnergy_FinalReport 2/59
Table of contents
Table of contents .......................................................................................................... 2
About CERRE ................................................................................................................ 3
About the authors ........................................................................................................ 4
Executive Summary ...................................................................................................... 5
1. Introduction .......................................................................................................... 8
2. The European Policy Context ............................................................................... 10
3. Literature Review of Possible Brexit Impacts ........................................................ 16
4. Modelling of potential impacts of Brexit on wholesale Power and Gas prices ........ 18
4.1. Gas modelling ....................................................................................................... 18
4.2. Electricity modelling ............................................................................................. 27
5. How UK Energy Policy could develop after Brexit ................................................. 35
6. How EU-27 energy and climate policy might develop after Brexit ......................... 41
7. Possible negotiating positions of the UK and the EU-27 on energy ........................ 43
8. Outside Energy Options ....................................................................................... 46
9. Possible models of non-EU membership for the UK & their implications for energy48
10. Conclusions ......................................................................................................... 50
References ................................................................................................................. 52
Annex 1 – Gas and Electricity Market Models .............................................................. 56

171122_CERRE_BrexitEnergy_FinalReport 3/59
About CERRE
Providing high quality studies and dissemination activities, the Centre on Regulation in Europe
(CERRE) promotes robust and consistent regulation in Europe’s network and digital industries.
CERRE’s members are regulatory authorities and operators in those industries as well as
universities.
CERRE’s added value is based on:
• its original, multidisciplinary and cross-sector approach;
• the widely acknowledged academic credentials and policy experience of its team and
associated staff members;
• its scientific independence and impartiality;
• the direct relevance and timeliness of its contributions to the policy and regulatory
development process applicable to network industries and the markets for their
services.
CERRE's activities include contributions to the development of norms, standards and policy
recommendations related to the regulation of service providers, to the specification of market
rules and to improvements in the management of infrastructure in a changing political,
economic, technological and social environment. CERRE’s work also aims at clarifying the
respective roles of market operators, governments and regulatory authorities, as well as at
strengthening the expertise of the latter, since in many Member States, regulators are part of a
relatively recent profession.
The project, within the framework of which this report has been prepared, has received the
financial support of a number of CERRE members. As provided for in the association's by-laws, it
has, however, been prepared in complete academic independence. The views expressed in this
CERRE report are those of the author(s). They do not necessarily correspond to those of CERRE,
to any sponsor or to any (other) member of CERRE.

171122_CERRE_BrexitEnergy_FinalReport 4/59
About the authors1
Michael G. Pollitt is a Research Fellow at CERRE and Professor of Business Economics at the
Judge Business School, University of Cambridge. He is an Assistant Director of the university’s
Energy Policy Research Group (EPRG) and a Fellow and Director of Studies in Economics and
Management at Sidney Sussex College, Cambridge. He is a former external economic advisor to
Ofgem. He is a member of the editorial board of the Review of Industrial Organization,
Competition and Regulation in Network Industries, Utilities Policy and The Energy Journal. He
was a founding co-editor of Economics of Energy and Environmental Policy. His research
interests include productivity analysis, measurement of economic reform impacts and future
electricity and carbon market design and regulation. Michael has a D.Phil. from the University of
Oxford.
Kong Chyong is a Research Associate at the Judge Business School and Director of the Energy
Policy Forum, University of Cambridge. His research interests include energy markets modelling,
and particularly equilibrium modelling of natural gas markets. He holds a PhD in Energy
Economics and Policy from the Cambridge Judge Business School and an MPhil in Technology
Policy from Cambridge. Before coming to Cambridge, he worked as a researcher at the National
Academy of Sciences in Ukraine. Since completing his PhD, Kong has been a research associate
at EPRG working mostly on natural gas market modelling and Eurasian gas trade relations as
well as on energy infrastructure investment.
1 The authors acknowledge the financial support of CERRE and the helpful comments of CERRE members at a
workshop in Brussels in July 2017. They also acknowledge the debt they owe to discussions with EPRG colleagues and
to the EPRG workshop on ‘Implications of Brexit for UK and EU Energy and Climate Policy’ on 6 September 2016.
Pollitt wishes to thank Derek Morris and Cameron Hepburn of the Oxford Review of Economic Policy for their
encouragement and comments on his previous paper on Brexit (Pollitt, 2017), on which this paper builds. We also
would like to thank Thomas McCarty for his excellent research assistant in building and running the UK unit
commitment model for the analyses in this paper. The usual disclaimer applies and the views expressed in this paper
are solely those of the authors and should not be taken to be shared with anyone with whom they are associated.

171122_CERRE_BrexitEnergy_FinalReport 5/59
Executive Summary
The aim of the paper is to examine the potential implications of Brexit from the perspective of
both the UK and EU-ex UK (EU-27) with particular attention to neighbouring states, with physical
energy interconnections with the UK – currently Ireland, France and the Netherlands in
electricity and Ireland, Belgium, and the Netherlands in gas.
We focus on the economic implications and do so in the context of the emerging negotiating
positions of the UK and the EU-27, following the commencement of formal negotiations about
Brexit between the UK and the EU-27 on 19 June 2017.
The EU has been in a long-running process of creating single markets for electricity, gas and
carbon, in line with the objectives of the overall European Single Market project. This is
currently happening within the context of the EU’s 2020 targets for energy and climate. A new
set of targets have been agreed, involving tightening and giving pre-eminence to the carbon
market target out to 2030 (and hence the tradability of existing permits), relaxing the renewable
energy target so that it is no longer decentralised to individual member states and an aspiration
on the energy efficiency target. The UK will leave the EU with its high-level energy and climate
targets fully aligned to the EU-27.
On the basis of the experience of Switzerland, we suggest that the UK will experience some loss
of influence in shaping EU energy and climate policy and further integration following Brexit will
be delayed. However, it will likely continue to be a member of ENTSO-E, an observer at ENTSO-G
and in certain committees of ACER. It can continue to be a member of the electricity system
operator group, Coreso.
Publicly available quantitative studies on the impact of Brexit on energy trade between the UK
and the Continent are rather limited. We have listed all the studies we have found. The evidence
seems to suggest that any likely reduction in trade in electricity will have a limited impact. There
is no published evidence on gas and limited evidence of the impact on the price of carbon in the
EU-ETS.
We present original modelling of potential trade interruption scenarios on electricity and gas
prices on both sides of interconnectors in 2025. The modelling suggests limited price impacts on
both sides on average and peak day prices. This is because the UK is a net exporter of gas to the
EU and electricity interconnection is limited and electricity interconnection also exists via
Norway.
One Brexit impact scenario we model could be a delay to a future electricity interconnector. This
has a negative impact on consumer welfare for both the UK and its interconnected markets
(e.g., Ireland, France, Belgium, the Netherlands and even Norway), if we assume no mitigating
capacity investments in the UK. However, these gains are dwarfed by the substantial amount of
electricity interconnector capacity which is currently under construction.

171122_CERRE_BrexitEnergy_FinalReport 6/59
We consider possible changes to UK energy policy post Brexit. Several large potential areas of
benefit are identified from rethinking domestic energy policy. They are not directly related to
Brexit, but they do suggest that the current benefits from rationalising the expensive subsidy
regime and abandoning the smart meter roll out for gas (let alone electricity) are large.
A mutual desire to maintain current levels of energy security suggests the value of
interconnection, for both electricity and gas, with the rest of Europe. Low prices (and hence
energy security with respect to oil and LNG) suggests the primary importance to both the UK
and the EU-27 of access to global fossil fuel markets and to global equipment markets.
Environmental targets, particularly with respect to carbon, suggest the value of UK membership
of the EU ETS, where the UK is a substantial net purchaser of permits and hence is buying cheap
abatement from overseas via its membership of the trading system.
It is difficult to discern the impact of Brexit on the energy policy of the EU-27. This is because
there are 27 countries in the remaining block and they represent most of the energy demand in
the current EU-28. The EU’s energy policy is evolving with a new package of measures
announced in winter 2016. The UK has been significant in shaping the direction of EU energy
and climate policy in certain areas. One can therefore speculate that the loss of the UK’s voting
weight might have some significant effect in the areas where influence has been felt in the past.
There might be less willingness across the EU-27 to support nuclear, rationalise renewables
policy, preserve and promote the EU ETS and for using market mechanisms generally.
At this stage of the negotiations between the EU-27 and the UK, little can be discerned as to the
final nature of the UK’s membership of the single market in energy and climate. This is because
energy is not a special case; rather it would seem to be a representative single market issue.
What is decided on the UK’s relationship to the EU single market more generally, is likely to play
out in electricity, gas and carbon permit markets. Representativeness also applies to the case of
energy trading across the Island of Ireland, where both parties are agreed that different
arrangements could apply. It seems highly likely that ‘a unique’ solution will be found to
maintain current levels of Irish cross-border co-operation and trading.
We discuss outside energy options for both the EU-27 and the UK. These include more
interconnection from the UK to Norway and Iceland and interconnection from Ireland to France.
All outside options are expensive and mutually undesirable alternatives to the current
arrangements.
We discuss five models of non-EU membership and how they might impact on UK-EU energy
relations. None of them would seem to be consistent with the stated negotiating positions of
the EU-27 and the UK. We suggest that some new arrangement seems the most likely one to
arise from the negotiations.
We conclude that both the UK and the EU-27 benefit substantially from mutual participation in
the current electricity, gas and carbon market arrangements. They also rely on being part of an
171122_CERRE_BrexitEnergy_FinalReport 7/59
integrated electricity and gas transmission system for energy security. The EU ETS underpins
both the EU-27 and the UK’s world-leading role on decarbonisation.
Relative to other sectors, energy is a fairly peripheral issue in Brexit, with short-term trade
disruption likely to be limited in size and impact. The UK is a small part of the EU-27’s energy
system and only significant in the case of Ireland. Similarly, the UK is less exposed to changes in
its relationships with the EU in energy than in other sectors. For the UK, energy costs are already
several times more sensitive to changes in domestic energy policy.

171122_CERRE_BrexitEnergy_FinalReport 8/59
1. Introduction
On 29 March 2017, the UK triggered Article 50 of the Treaty on the European Union (EU)2 and
formally applied to leave the EU, having been a member since 1 January 1973. The UK is the first
country to apply to leave the European Union, which currently has 28 member countries (EU-
28). This ‘Brexit’ has set in process a timetable for the UK ceasing to be a member of the EU on
30 March 2019. This paper examines the potential implications of the UK leaving the European
Union, for both the UK and its near neighbours in the EU, in the area of energy and climate
policy.
We will focus on electricity, gas and carbon policy (and ignore oil and coal) as these are the
areas where EU policy has developed in a distinctive way and where EU-wide single markets
have emerged for wholesale electricity and gas and for carbon permits. These developments
have proceeded incrementally over many years, and have been significantly led and supported
by the UK.
The aim of the paper is to examine the potential implications of Brexit from the perspective of
both the UK and EU-ex UK (EU-27) with a particular attention to neighbouring states, with
physical energy interconnections with the UK (currently Ireland, France and the Netherlands in
electricity and Ireland, Belgium, and the Netherlands in gas). We will focus on the economic
implications and do so in the context of the emerging negotiating positions of the UK and the
EU-27, following the commencement of formal negotiations about Brexit between the UK and
the EU-27 on 19 June 2017.
Total final energy expenditure in the UK in 2016 was £139 bn, of which 43% was petroleum
products, 25% was electricity, and 16% was gas.3 The remainder was coal, crude oil and other
fuels. Energy is a significant source of tax revenue in the UK, raising £38bn, or 6% of the total tax
take,4 though most of this is on transport fuel. The UK is a substantial net energy importer, with
net imports of £11bn in 2015, however electricity net imports from the same period were only
valued at £680m.5 Energy import costs are substantially affected by exchange rate movements
and international commodity prices. The UK is a net importer of electricity from the EU. It is
currently a net exporter of gas to the EU in 2016 (+ 43 TWh on 897 TWh of domestic
consumption), though the gross trade is significantly higher with seasonal imports of 64 TWh.6
2 Available at: http://eur-lex.europa.eu/legal-content/EN/TXT/PDF/?uri=CELEX:12016M/TXT&from=EN, accessed 15
September 2017. 3 See market value of inland consumption in DUKES (2017, Table 1.4, p.33).
4 See HM Treasury (2016, p.58) reports total tax receipts for 2015/16 of £628.6bn. DUKES (2017) reports total fuel
duties + VAT + carbon price floor + climate change levy of £38.0bn in 2016, of which the tax raised on petroleum
products is £33.6bn. 5 See DUKES (2017, Table G.7 (BOP basis)).
6 See DUKES (2017, Table G.5) and DUKES (2017, p.89).

171122_CERRE_BrexitEnergy_FinalReport 9/59
The UK produced 496m tonnes of CO2e in 2015, of which 172m related to the EU ETS fixed
installations.7 The UK is a significant net purchaser of allowances in the EU ETS with net
purchases of 28.5m (172m allowances presented, against 143m allocated).8
In 20149 the UK accounted for 15% of the EU-28’s GDP, and constituted 12% of its total final
energy consumption, 16% of its gas consumption, 11% of its electricity consumption and 13% of
its production of CO2e (and redeemed 8.5% of the EU ETS permits). In terms of net imports, the
UK’s share of the EU’s net imports of all fuels was 10%, and 11% and 6% for gas and electricity
respectively. The small relative size of the UK to the EU-27 immediately suggests that a focus on
the impacts on near neighbours (with physical interconnection) is likely to be easier to model
and discuss in an informed way.
The UK shares a land border with the Republic of Ireland and within the island of Ireland both
electricity and gas networks are physically interconnected, with final demand roughly split 1:5
between Northern Ireland10 and the Republic Ireland11 for electricity and gas. Electricity is
traded within a single wholesale market, the I-SEM, and subject to a joint governance structure
approved by the EU. GB electricity consumption in 2015 was 292.2 TWh, while gas was 489.3
TWh.12
The overall figures suggest that in terms of its GDP, the UK was not particularly energy intensive
or import dependent relative to the EU-27. This reflects its post-industrial economy and
continuing (but declining) domestic production of oil and gas.
The paper proceeds as follows. We will begin by examining the EU energy and climate policy
environment. We will proceed to review the literature on the quantitative impacts of Brexit in
the energy sector and present some original modelling of the potential impact in 2025 of various
scenarios for the electricity and gas sectors. Here, we examine both the impact on annual
average prices and the impact of some plausible security of supply events. We follow this with a
discussion of UK energy policy and how it might be impacted by Brexit, before proceeding to a
discussion of the emerging post-Brexit negotiating positions on both sides. We go on to look at
outside options for the energy and climate sectors. We then review possible overarching
frameworks for the UK’s relationship with the EU and how these relate to the energy and
climate sectors, before offering some conclusions.
7 See BEIS (2017, p.7, 18).
8 See BEIS (2017, p.18).
9 See European Union (2016).
10 electricity consumption in Northern Ireland was 7.82 TWh in 2015 (https://www.economy-
ni.gov.uk/sites/default/files/publications/deti/Issue%204%20-
%20Electricity%20Consumption%20and%20Renewable%20Generation%20in%20Northern%20Ireland%20January%20
2015%20to%20December%202015.pdf) while gas consumption was 5.37 TWh in 2014 (https://www.economy-
ni.gov.uk/sites/default/files/publications/deti/energy-northern-ireland-2016.pdf) 11
Electricity consumption in the Republic of Ireland was 25.55 TWh in 2015
(http://ec.europa.eu/eurostat/data/database) while gas consumption was 43.64 TWh
(http://ec.europa.eu/eurostat/data/database). 12
https://www.gov.uk/government/uploads/system/uploads/attachment_data/file/579203/Sub-
national_electricity_and_gas_consumption_summary_report_2016.pdf

171122_CERRE_BrexitEnergy_FinalReport 10/59
2. The European Policy Context
The EU has been in a long-running process of creating single markets for electricity, gas and
carbon, in line with the objectives of the overall European Single Market project. This is
currently happening within the context of the EU’s 2020 targets for energy and climate. These
targets can be summarised as the 20-20-20 targets: a 20% reduction in CO2e on 1990 levels; the
achievement of 20% of gross final energy consumption from renewables; and a 20% reduction in
energy intensity of GDP relative to 2005 (see Pollitt, 2009, 2016). The Union has agreed to 2030
targets of 40-27-27.13 These have involved tightening and giving pre-eminence to the carbon
market target out to 2030 (and hence the tradability of existing permits), relaxing the renewable
energy target so that it is no longer decentralised to individual member states and an aspiration
on the energy efficiency target.
Successive European Commission electricity and gas directives (in 1996, 2003 and 2009) have
promoted the creation of competitive multi-country (and pan-European) wholesale markets for
electricity and gas (see Jamasb and Pollitt, 2005, and Pollitt, 2009). They have also ensured
unbundling of networks and competitive services within electricity and gas supply. This has
resulted in regulated third party access to transmission and distribution networks for electricity
and gas, and non-discriminatory access to cross-border wires and pipelines. The directives have
also sought to promote retail competition and the deregulation of ownership restrictions on
wholesale and retail assets through free-entry into both wholesale and final retail markets. The
directives have also required the existence of an independent national energy regulator with
certain duties to promote competition and regulate third party access to networks.
The EU Emissions Trading System was created in 2005 and covers around 45% of greenhouse
gases produced in the EU, including all of the emissions from the electricity sector (under EU
Directive 2003/87/EC). This has resulted in a single price for a permit for CO2e across the EU-28
for the covered sectors. The trading scheme was extended in 2013 to cover domestic emissions
from the aviation sector and full auctioning of permits (and hence an end to free allocation to
historic polluters) for the electricity sector. Recent developments include a proposal to create a
market stability reserve to reduce excess permits in the system.14
There have been a significant number of other directives relating to energy efficiency and
energy security. In addition, the nuclear industry is covered by the 1957 Euratom Treaty15 which
ensures freedom of movement and regulation of the movement of nuclear material and nuclear
personnel across the EU.
13
See https://ec.europa.eu/energy/en/topics/energy-strategy-and-energy-union/2030-energy-strategy, accessed 15
September 2017. 14
For a discussion of the phase 4 (2021-30) proposals see https://ec.europa.eu/clima/policies/ets/revision_en,
accessed 15 September 2017. 15
See http://eur-lex.europa.eu/legal-content/EN/TXT/PDF/?uri=CELEX:12012A/TXT&from=EN, accessed 15
September 2017.
171122_CERRE_BrexitEnergy_FinalReport 11/59
The move to create single markets for electricity, gas and carbon has been accompanied by the
creation of pan-European institutions, in addition to the strengthening of national regulatory
agencies. The Agency for the Cooperation of European Energy Regulators (ACER) has been
created to resolve disputes between national energy regulators, oversee the network code
review processes and the assessment of projects of common interest (PCI) lists. This is in
addition to the Council of European Energy Regulators (CEER) which discusses regulatory issues
and makes recommendations to the Commission and ACER. CEER and ACER work closely with
the associations of system operators for electricity and for gas in Europe (ENTSO-E and ENTSO-
G) who have taken initiatives on co-ordinating cross border transmission rules across the EU.
There is currently a large set of streams of work co-ordinating network codes in individual
countries across Europe led by ACER and working closely with ENTSO-E and ENTSO-G.16 This
process is aimed at standardising the detailed network rules across the EU-28. It is largely due
for completion in 2019.
Norway and Switzerland are substantially physically integrated into the European electricity and
gas system. Neither are EU member states. Norway is a significant gas producer and exporter to
the EU. Switzerland is a key transit country for both electricity and gas. Norway is a member of
the European single market, while Switzerland is not. Both are members of the European Free
Trade Area (EFTA). Neither are members of ACER as this is an EU institution but they are
observers in ACER working groups. CEER is open to all members of the European Economic Area
(the single market) and so Norway is a member of CEER. Norway and Switzerland are members
of ENTSO-E and observers of ENTSO-G.
The case of Switzerland is interesting. Switzerland is currently in dispute with the EU over
further integration of its electricity sector into the single electricity market. Further integration
was explicitly stopped following the Swiss referendum on freedom of movement in February
201417, which ended freedom of movement of people between the EU and Switzerland. Thus,
progress towards full market coupling, joint allocation of forward transmission capacity, intra-
day market coupling, cross-border balancing and cross-border transmission capacity allocation
has been halted. The reason for this is partly to do with Swiss unwillingness to agree to the
ultimate jurisdiction of the European Court of Justice and partly due to explicit punishment by
the EU for the referendum decision. It is to be noted that under World Trade Organization
(WTO) law market coupling is a ‘regional economic agreement’ within the EU and hence
Switzerland does not have the automatic right under WTO most favoured nation (MFN) status
(under WTO rules) to participate in it simply because it exists between EU MSs.18
16
See Dale (2016) for a review. 17
See Shotter and Oliver (2014). The referendum asked the following Yes/No question, ‘Do you accept the federal
popular initiative ‘against mass migration’, which ‘Yes’ won. This was interpreted by the EU as a unilateral withdrawal
by Switzerland from its bilateral treaty with the EU on freedom of movement which had been in force since 2002. 18
See Cottier et al. (undated) for a general discussion of the WTO rules on energy. Their basic conclusion is that WTO
rules are ‘highly fragmented and largely incoherent’ (p.1).

171122_CERRE_BrexitEnergy_FinalReport 12/59
The EU ETS includes the EU-28 plus Norway, Liechtenstein and Iceland. The scheme is
administered by the European Commission with compliance delegated to individual member
states. The overall quantity of emissions is set by the Commission and allocated to individual
member states. The scheme is subject to the ultimate jurisdiction of the European Court of
Justice.
Switzerland has been discussing linking its national scheme, which became compulsory in 2013,
to the EU ETS for some time and until recently this process had stalled. However, in August 2017
it was announced19 that there were firm plans to link the two schemes. According the European
Commission, this would lead to ‘mutual recognition’ of one another’s allowances.20
In addition to the market arrangements around electricity, gas and carbon it is worth noting that
physical integration and extension of networks has been an important priority of the EU,
especially with regards to the European periphery. Thus, there has been substantial EU support
for electricity and gas interconnectors between Great Britain and Ireland, with the EU budget
paying around 1/3 of the cost of some interconnectors. If a project is designated a project of
common interest (PCI) this accelerates regulatory permitting and promotes access to finance
from the Connecting Europe Facility (CEF).21 It is worth noting that a PCI can involve connecting
the EU to a third country if there is benefit to at least two EU MSs. Current PCIs include a gas
storage facility in Northern Ireland and an electricity link between Iceland and Scotland.22 A new
list of PCI projects is due to be published in October 2017.
Since the process of creating a single EU market in energy was begun, there has been substantial
progress with market integration of electricity and significant progress on gas.
According to ACER (Pototshnig, 2015) some 85% of EU electricity is now market coupled in day-
ahead electricity markets. This means that the prices quoted on 7 of the day-ahead power
exchanges across Europe are resolved by a single algorithm (EUPHEMIA)23 which in the absence
of binding transmission constraints could lead to a single day-ahead price across the coupled
area. In addition, there is joint regional security coordination between electricity transmission
operators – including National Grid from GB - in part of western Europe via Coreso24. Market
coupling, combined with competitive allocation of cross-border electricity transmission capacity,
19
See https://ec.europa.eu/clima/news/eu-and-switzerland-join-forces-emissions-trading_en, accessed 15
September 2017. 20
See https://ec.europa.eu/clima/policies/ets/markets_en, accessed 13 September 2017. 21
See http://ec.europa.eu/energy/en/topics/infrastructure/projects-common-interest, accessed 13 September 2017. 22
http://ec.europa.eu/energy/infrastructure/transparency_platform/map-viewer/main.html, 13 September 2017. 23
EUPHEMIA stands for the ‘Pan-European Hybrid Electricity Market Integration Algorithm’. See
https://nordpoolspot.com/globalassets/download-center/pcr/euphemia-public-documentation.pdf, accessed 15
September 2017. 24
Coreso is jointly owned by 7 EU TSOs: 50 Hertz (Germany), Elia (Belgium), National Grid (Great Britain), Red
Electrica, (Spain) REN (Portugal), RTE (France) and Terna (Italy). See https://www.coreso.eu/mission/our-mission/,
accessed 15 September 2017.

171122_CERRE_BrexitEnergy_FinalReport 13/59
has resulted in substantial improvements in the economic efficiency of cross-border power
flows, with electricity increasingly flowing ‘in the right direction’ from low to high price areas.25
On gas, the picture is much more mixed with good progress being made on market-driven price
flows between the core European countries and rather less progress in central and eastern
Europe – CEE (see Pototshnig, 2015)26. The European Commission is well aware of the need to
make further progress on the creation of a genuine wide-area market in gas as a way of
enhancing energy security in those CEE countries which are dependent on Russian gas imports.27
The benefits of the single market in terms of reduced wholesale electricity and gas prices are
hard to quantify, because they are tied up with simultaneous and somewhat related
improvements in national regulation of networks and restructuring of state-owned utilities.
However, the overall benefits are perhaps of the order of a 5% reduction in wholesale and final
prices (see Pollitt, 2012). While there have been substantial improvements in the efficiency of
gross flows of electricity and gas as a result of day-ahead market integration, as noted by ACER
above, the flows are only efficient given the interconnector capacity declarations of the system
operators, which can be subject to manipulation by system operators seeking to minimise intra-
country constraints. There also remain substantial intra-day inefficiencies28. The EU has
generally preferred wide area zonal energy pricing to deep market signals (e.g. on nodal
congestion pricing in PJM) in order to promote competition.
In terms of climate progress, the EU ETS is an impressive institutional achievement by global
standards (see Pollitt, 2016). 31 countries are covered by a single emissions market trading
instrument is a great example of what Boasson and Wettestad (2012) call an example of
‘international institutional entrepreneurship’. Annual allowances issued (at c.2200 tonnes
including aviation emissions)29 represent around 5% of global CO2e emissions. The scheme has
demonstrated that multi-country schemes can work and it has provided a model for emissions
trading arrangements across the world, including the new Chinese national emissions trading
scheme currently due to start at the end of this year (which should be twice the size of the EU
ETS).30 The low prices we have observed in the EU ETS recently are not a function of its
institutional set up, but of the unwillingness of national governments to tighten quantity targets
against which the mechanism then determines prices.
Within the specific area of renewable energy, the EU has established a leading position in the
installation of renewable energy technologies. By 2016, 32% of global installed capacity of wind,
25
See ACER (2015, p.191). 26
See also ACER (2015, p.254). 27
In January 2017, the European Commission published a number of consultation papers under its ‘Quo vadis gas
market regulatory framework’. See
https://ec.europa.eu/energy/en/content/study-quo-vadis-gas-market-regulatory-framework-discussion-papers,
accessed 14 September 2017. 28
See Newbery et al. (2016) for a discussion of the benefits of further market integration in electricity. 29
See https://ec.europa.eu/clima/policies/ets/cap_en, accessed 17 September 2017. 30
See World Bank and Ecofys (2017).

171122_CERRE_BrexitEnergy_FinalReport 14/59
solar and bio energy was installed in the EU-28.31 This is against a background where the EU
produced only 5.6% of the world’s energy and consumed only 11.4% of the world’s energy (in
2014)32. This capacity has been promoted by the 2001 Renewable Electricity Directive
(2001/77/EC), which set ambitious targets for the share of renewable electricity in total
electricity output in each member state by 2010, and the 2009 Renewable Energy Directive
(2009/28/EC) which set the national 2020 targets for the share of renewable energy in gross
final energy consumption (as part of the 20-20-20 targets).
Increasing market and physical integration of European energy systems gives rise to significant
shared security benefits. National Grid (2017) give a good example of this in the context of the
UK’s interconnector with France. Normally this interconnector facilitates a flow from France to
the UK as electricity prices are generally higher in the UK than in France. However, when 20
French nuclear reactors were offline for maintenance in autumn 2016, the interconnector was
fully utilised in the opposite direction as the system in Great Britain provided power to support
demand in France. Likewise, the island of Ireland has derived significant energy security benefits
from its two gas and two electricity interconnections with Great Britain, with the Irish system
being wholly dependent on Great Britain to meet its gas demand. The closure of Great Britain’s
largest gas storage facility, Rough, announced in June 2017, will make the UK more dependent
on gas storage capacity in the rest of Europe to meet its winter peak demand (though demand
can currently be met from a combination of imports from Norway, the EU-27 and LNG import
facilities in Great Britain). Thus, gas interconnection between the UK and Europe also
contributes to security of supply and economic efficiency, since having multiple sources of gas
reveals the most efficient way of utilising gas infrastructure while maintaining security standards
for the UK.
The EU energy system continues to develop. Gas demand is falling across Europe as a result of
increased energy efficiency, deindustrialisation and increases in renewable electricity. This is
leading to rationalisation of gas assets by reducing compressor, pipeline and storage capacity.
This will give rise to further opportunities for mutually beneficial international trading of gas in
order to manage overall system costs in the face of competition with other fuels. In electricity,
peak demand remains flat or falling across Europe (see Sioshansi, 2016). However, the rise of
renewables and the closure of coal-fired power plants have increased the value of international
interconnection. Great Britain currently has 4 GW of electricity interconnection capacity with
Ireland, France and the Netherlands. There is currently 7.3 GW of planned future
interconnection by 202233, of which 2 GW (to Belgium and France) is under construction and
31
REN21, 2017, p.34. 32
European Union, 2016, p.10, 12. 33
See https://www.ofgem.gov.uk/electricity/transmission-networks/electricity-interconnectors, accessed 14
September 2017.
171122_CERRE_BrexitEnergy_FinalReport 15/59
due for completion in 201934; 1.4 GW (to Norway) is under construction and due for completion
in 202035.
It is important to note that UK has been a key participant, advocate for and leading country in
implementation in all of the above market and institutional developments. The UK was the first
country in the EU-28 to create wholesale markets for electricity, gas and carbon, and it served as
the model for the subsequent EU Directives mentioned above.36 The UK has promoted shared
market-based security of energy supplies and increased interconnection. The UK’s institutional
arrangements for regulating the energy sector via independent energy regulators (first OFGAS
and Offer, now Ofgem) have provided examples for the rest of the EU to follow.
EU energy and climate policy is moving on. In November 2016 (i.e. after the Brexit vote), the
European Commission published a winter package of draft further reforms, mainly of the
electricity sector, under the title ‘Clean Energy for All Europeans’37. This ambitious set of further
reform documents (and in due course a new set of Directives) seeks to further extend market
integration in the context of rising shares of renewable energy and mutual energy inter-
dependence. Some of the controversial issues raised by the Winter Package include the need to
standardise and coordinate capacity mechanisms for electricity, remove priority dispatch for
renewables, harmonise network tariffs, and extend regional cooperation between system
operators. Importantly the Winter Package suggests the need for each member state to submit
a national energy plan for approval by the European Commission38. This is an attempt to begin
to resolve some of the conflicts between national actions in the area of energy and the wider
interests of the EU, which will become more acute as national systems become more physically
and financially integrated.
Meanwhile some national governments within the EU-28 will continue to promote even more
ambitious energy policies, some of which seem likely to shape European energy policy
developments. In July 2017, France39 and the UK40 announced that they intend to ban the sale of
new fossil fuel cars from 2040. This is a substantial impetus to the ongoing roll out of electric
vehicles, provides support for smart investments in power grids and the encouragement of local
sources for flexibility services within the power system.
34
See http://www.nemo-link.com and http://www.eleclink.co.uk/, accessed 15 September 2017. 35
See http://northsealink.com/, accessed 15 September 2017. 36
For example, see Bergman et al. (1999) on electricity and Hepburn and Teytelboym (2017) on climate policy. 37
See https://ec.europa.eu/energy/en/news/commission-proposes-new-rules-consumer-centred-clean-energy-
transition, accessed 15 September 2017. 38
See http://eur-lex.europa.eu/resource.html?uri=cellar:ac5d97a8-0319-11e7-8a35-
01aa75ed71a1.0024.02/DOC_1&format=PDF, accessed 15 September 2017. 39
See BBC News website, ‘France set to ban sale of petrol and diesel vehicles by 2040’, 6 July 2017,
http://www.bbc.co.uk/news/world-europe-40518293, accessed 15 September 2017. 40
The UK announced a ban on sales of fossil fuel cars and vans by 2040, see BBC News website, ‘New diesel and
petrol vehicles to be banned from 2040 in UK’, 26 July 2017, http://www.bbc.co.uk/news/uk-40723581, accessed 15
September 2017.

171122_CERRE_BrexitEnergy_FinalReport 16/59
3. Literature Review of Possible Brexit Impacts
Quantitative studies on the impact of Brexit on energy trade between the UK and the Continent
are rather limited. We have listed all the studies we have found. We see two primary reasons for
this: (i) no consensus on how Brexit may, in reality, impact the way the UK trades electricity and
gas with the rest of Europe, and (ii) hence any quantification of potential impact is subject to a
degree of uncertainty and subjectivity in choosing Brexit scenarios and their ‘parametrisation’ in
simulation models.
For example, the Oxera (2016) white paper (which was released before referendum day)
modelled a Brexit scenario and how this may impact Great Britain (GB) consumers. In particular,
Oxera (2016) considered a scenario whereby the UK could impose a tariff on electricity imports
that would ‘correct’ for (i) a higher CO2 tax (carbon price in the UK is of magnitude higher than
the current EU ETS prices), and (ii) higher balancing tariffs and transmission loss levies. It is said
that these two factors add ca. £8.5/MWh to the variable costs for gas-fired generation (CCGT) in
GB, of which 75% is due to higher carbon price and the rest is due to balancing charges and
transmission losses. So, the logic behind Oxera’s (2016) Brexit scenario is that a UK government
could impose an additional import tax to correct for these two factors allowing domestic
generators to compete on par with interconnection from France and the Netherlands. Thus,
their modelling results suggest that net imports are reduced by 33% of the current average net
imports or 24% of interconnection capacity with France and the Netherlands if such a tax were
to be introduced. Lower net imports resulted in higher domestic generation and slightly higher
wholesale prices. This results in an average annual electricity bill rises by ca. £2/household.
Aurora Energy Research’s (2016) white paper has a similar perspective to the Oxera (2016)
paper in that their analysis suggests that additional interconnection depresses wholesale prices
in GB (reduction of 3-7% to 2025), but when the full welfare impact of interconnectors is
calculated by including subsidies (higher carbon tax in the UK, higher transmission and
distribution use of system charges - TNUoS and BSUoS) the net benefit of additional
interconnection is negative.41 Thus, Aurora Energy Research (2016) concluded that the long-
term impact of Brexit could be less interconnection with Europe but, in their view, this is not
necessarily a net welfare negative outcome for GB.
Another consulting study by Vivid Economics (2016) for Great Britain’s National Grid, considered
the wider implications of Brexit on short-term electricity trade and long-term investment in the
energy sector. For example, they pointed out that a higher cost of financing - of the order of 50
basis points - would result in an increase of ‘hundreds of millions of pounds’ or ‘deferral of
investment’ until uncertainties resolve. On short-term impact, Vivid Economics (2016) pointed
41
Aurora Energy Research pointed out to the same issue identified by Oxera (2016) – interconnectors enjoy a
£10/MWh price advantage over domestic generation as they receive exemptions from both the Carbon Price Support
and GB network charges (TNUoS
and BSUoS).
171122_CERRE_BrexitEnergy_FinalReport 17/59
out that other impacts of Brexit on the UK electricity sector could be: (a) a loss of market
coupling benefits of the order of £160m p.a., (b) extra balancing services costs of £80m p.a., (c)
extra capacity market costs - due to interconnectors not being part of capacity markets - of
£20m p.a., (d) the loss of future interconnectors such as Viking Link, IFA2, and FAB, which may
not proceed, equal to £160m p.a. Thus, if one includes both the short- as well as the long-term
value of having interconnection for both the GB and Continental Europe then the case for
greater interconnection and free trade in electricity and gas seems stronger than just looking at
the loss to domestic GB generation from higher carbon and network charges, as argued by both
Oxera (2016) and Aurora Energy Research (2016).
Indeed, Newbery et al. (2016) pointed out that apart from short-term gains from trade (baseline
case of national self-security in which the only gains are short-term arbitrage on day-ahead
markets) there are additional benefits of market integration in electricity which includes sharing
balancing, reserves and demand side response. For example, Newbery et al. (2016) stated that
the potential balancing benefits for GB-France interconnection is roughly €3m p.a. and for GB-
Netherlands, €82m p.a. Other benefits from interconnection in the electricity sector, according
to Newbery et al. (2016), include reductions in (i) unscheduled flows (loop flows and
unscheduled transit flows), and (ii) curtailment at borders. In total, Newbery et al. (2016)
estimated total gains from further market integration for the EU-28 at around €3.3 bn p.a. Thus,
if in 2012-2013 there were 23 GW of interconnection capacity in Europe, of which 4 GW, or
17.4% of the total, is between GB and France, the Netherlands and Ireland then the benefits for
the four trading countries could be €574m p.a.
We are not aware of any publicly available quantitative studies that estimate the potential
impact of Brexit on the carbon market in Europe. In general after the Brexit referendum, the
carbon market reacted rather bearishly – there was downward adjustment to the expectation of
carbon price in the range 9-18% from the base level prior to the referendum results, according a
survey of analysts by Reuters42. Although this short-term market reaction seems to suggest a
rather bearish attitude towards Brexit and the European carbon market, most market analysts
expect little impact on the fundamentals of the market other than loss of confidence which was
already priced in the short-term reduction of carbon prices post-Brexit.
Regarding the gas market and possible trading arrangements post-Brexit, there are not many
publicly available quantitative studies analysing potential impact of Brexit on gas trading
between the UK and the Continent. Aurora Energy Research (2016) mentions that in the short-
term Brexit may increase relative gas prices as a devalued pound will mean less Euro-
denominated gas imports. However, over the long-term there are limited impacts because GB is
well-connected to the global gas market via LNG terminals and it still enjoys domestic
production from the UK continental shelf (UKCS) (albeit production is declining rapidly) as well
as imports via direct pipelines with Norway.
42
http://uk.reuters.com/article/eu-carbon/poll-analysts-slash-eu-carbon-price-forecasts-following-brexit-
idUKL8N1B00YF

171122_CERRE_BrexitEnergy_FinalReport 18/59
4. Modelling of potential impacts of Brexit on
wholesale Power and Gas prices
For this analysis, we use electricity and gas market models (see Annex 1 for details) to assess the
potential quantitative impact of Brexit on average annual wholesale electricity and gas prices in
the UK, as well as providing an analysis of the impact on prices and market fundamentals on a
peak day. We undertake this quantitative analysis for 2025 because we want to measure any
potential impact over a longer term. In 2025, one may expect any negative macroeconomic
impact – from loss of trade / uncertainty of investment – arising from Brexit to fully materialise.
At the same time, global commodity markets may be tighter and, hence, any costs and benefits
of market integration in gas and electricity between the UK and the Continent will be fully
appreciated under those circumstances. For the rest of this section, we proceed with presenting
modelling for gas and then for electricity.
4.1. Gas modelling
For gas, the 202543 timeframe is particularly interesting, beyond and above the above-
mentioned reasons. The UK and continental Europe are connected by two gas interconnectors –
IUK, a bidirectional pipeline connecting the UK with Belgium, and BBL, an import pipeline from
the Netherlands to the UK. Both pipelines were financed on the back of a series of long-term
shipping contracts, some of which are believed to expire starting late 2018 and, hence, the
question of the business model and regulatory arrangements around these two interconnectors
are currently under discussion. If anything, Brexit will complicate and create greater
uncertainties for these two interconnectors in terms of capacity provision, pricing and indeed
commercial model of operation (e.g., merchant vs. regulated entity).
Against this background, we have simulated several scenarios representing possible states of the
world in 2025, with respect to demand growth for gas in GB, and available capacities of the two
gas interconnectors (Table 1). Then, we compare annual average wholesale prices and peak day
prices against the baseline scenario – in which no changes are expected in terms of capacity and
tariffs through the interconnectors – as well as gas demand in GB, which follows the projection
of the IEA (2016) World Energy Outlook 2016 New Policy Scenario. We should note that, in line
with the recent announcement, the analysis assumes that the UK’s largest seasonal gas storage
facility – Rough – which accounted for ca. 70% of UK’s storage capacity, is closed and no new
storage facilities are opened by 2025.
43
For gas, we report storage year – 1 Apr 2025 until 31 March 2026.
171122_CERRE_BrexitEnergy_FinalReport 19/59
Furthermore, following the recent announcement of merging the BBL gas pipeline into the TTF
market area,44 we apply only commodity charges on the BBL line. We also assume that IUK’s
import and export capacity are priced at commodity charge level which is a good approximation
for short-run marginal cost (SRMC) for using the pipeline. This is a reasonable assumption so
long as long-term shipping contracts are renewed by 2025, or that the IUK asset base will be
socialised (similar to the recent case of BBL pipeline being merged with TTF market area). In a
very unfortunate circumstance, IUK could divest/close a compressor station reducing cost and
capacity, or indeed close the facility altogether. The latter two cases are covered by our
modelling and sensitivity analyses through reduction in capacity levels being available for
market participants to book in both directions (import and export, see Table 1). Furthermore,
the gas model is a short-run model hence usage of SMRCs for gas infrastructure capacity is the
correct way of conducting analyses. If the capacity is saturated, then the model would reveal a
positive premium, thus approximating the real capacity auction process.45
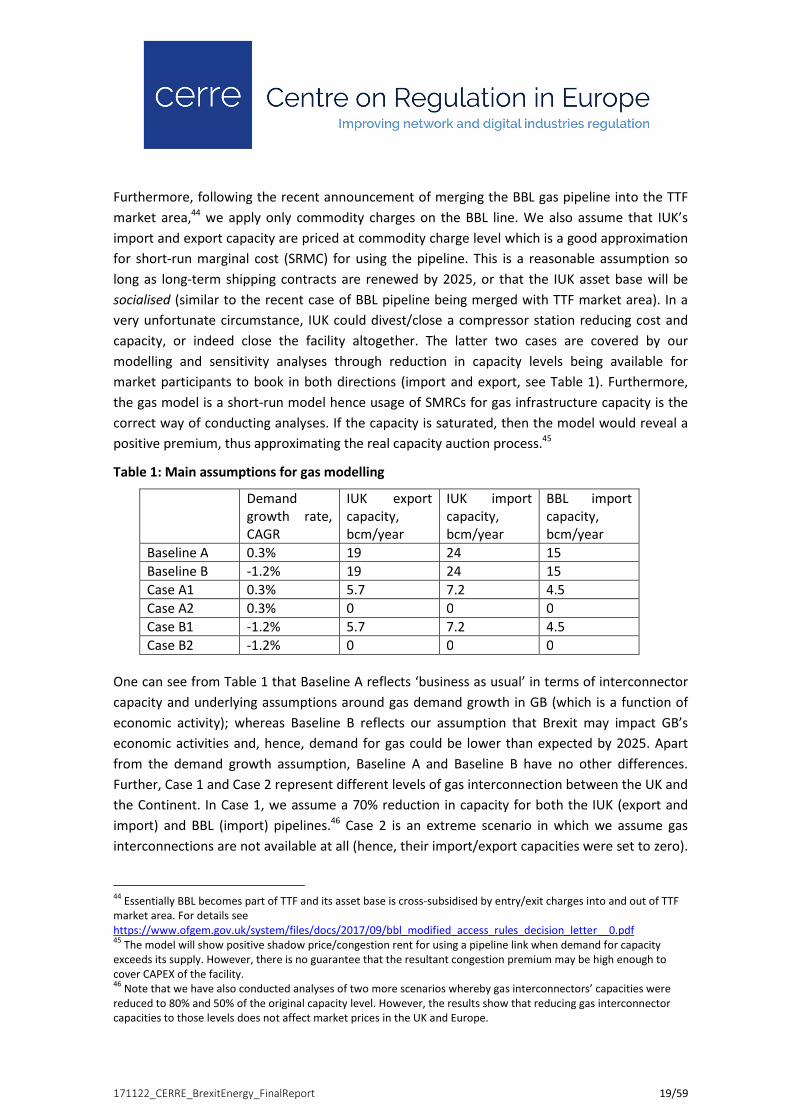
Table 1: Main assumptions for gas modelling
Demand
growth rate,
CAGR
IUK export
capacity,
bcm/year
IUK import
capacity,
bcm/year
BBL import
capacity,
bcm/year
Baseline A 0.3% 19 24 15
Baseline B -1.2% 19 24 15
Case A1 0.3% 5.7 7.2 4.5
Case A2 0.3% 0 0 0
Case B1 -1.2% 5.7 7.2 4.5
Case B2 -1.2% 0 0 0
One can see from Table 1 that Baseline A reflects ‘business as usual’ in terms of interconnector
capacity and underlying assumptions around gas demand growth in GB (which is a function of
economic activity); whereas Baseline B reflects our assumption that Brexit may impact GB’s
economic activities and, hence, demand for gas could be lower than expected by 2025. Apart
from the demand growth assumption, Baseline A and Baseline B have no other differences.
Further, Case 1 and Case 2 represent different levels of gas interconnection between the UK and
the Continent. In Case 1, we assume a 70% reduction in capacity for both the IUK (export and
import) and BBL (import) pipelines.46 Case 2 is an extreme scenario in which we assume gas
interconnections are not available at all (hence, their import/export capacities were set to zero).
44
Essentially BBL becomes part of TTF and its asset base is cross-subsidised by entry/exit charges into and out of TTF
market area. For details see
https://www.ofgem.gov.uk/system/files/docs/2017/09/bbl_modified_access_rules_decision_letter__0.pdf 45
The model will show positive shadow price/congestion rent for using a pipeline link when demand for capacity
exceeds its supply. However, there is no guarantee that the resultant congestion premium may be high enough to
cover CAPEX of the facility. 46
Note that we have also conducted analyses of two more scenarios whereby gas interconnectors’ capacities were
reduced to 80% and 50% of the original capacity level. However, the results show that reducing gas interconnector
capacities to those levels does not affect market prices in the UK and Europe.

171122_CERRE_BrexitEnergy_FinalReport 20/59
We consider Case 2 to be highly unlikely, but we analyse this situation to see what might have
been impact on prices. One can understand Case 2 as being a situation where both
interconnectors are in a world of fierce competition between sources of supplies and flexibility
(storage, upstream pipelines and LNG deliveries into the UK and Europe) and they could both be
‘out of merit order’ and hence divest and shut down (the UK Rough gas storage facility is one
such real example of asset divestment in a competitive setting, albeit this was predominantly
because of aging infrastructure and safety issues).47
Table 2 below highlights our results from running the gas model for the baselines and
alternative scenarios. Firstly, our results indicate that the UK is net exporter of gas to Europe but
at the same, time the average wholesale gas price in the UK is higher than those on the
Continent – price differentials under Baseline A (B) is $0.23/mmbtu ($0.04/mmbtu) (Table 2,
column 3). The reason for this is that UKCS gas producers have a choice of either sending gas
into UK’s NBP market area (and hence paying full costs of the GB transmission system) or
sending gas to the Continent through IUK paying a discounted tariff of using only part of the GB
transmission system.48 Therefore, should export capacity through IUK be partially (Case A1) or
fully divested (Case A2) then UKCS producer will have no choice but to send gas to NBP in the
first instance. This will, ceteris paribus, increase average wholesale gas prices in North-West
Europe, albeit very marginally (from $3.94/mmbtu to $3.96/mmbtu), while reducing average
prices in the UK (from $4.17/mmbtu to $4.01/mmbtu). Thus, one can conclude that maintaining
gas trade between the UK and the Continent may be largely beneficial to European consumers
(lower prices), cross-border pipeline owners, UKCS producers and LNG importers using the UK as
a re-export hub back to Europe. For example, benefits to Belgium and Dutch consumers would
be ca. $42mn p.a. given that their combined annual gas consumption in 2015 was ca. 57 bcm
(IEA, 2016).49 Our results show that imports from the Continent back to the UK is minimal on
average across the year (Table 2, column 13), although the security of supply benefits to the UK
is not insignificant.
47
Though one can still argue that aging infrastructures could be maintained to meet safety standards at increasing
operating expenditure (OPEX). However, increasing OPEX may not be justifiable given low seasonal spreads. 48
The so-called short-haul tariff – a tariff offered by UK’s gas transmission system operator – National Grid – in
response to a potential threat by UKCS producers building a pipeline loop that would allow them to send gas from
UKCS fields to Bacton and from there through IUK to the Continent, bypassing NBP altogether. 49
57 bcm x $0.02/mmbtu (TTF price differences between Case A2 and Baseline A) assuming that one billion cubic
metres of gas is 36,964,868 mmbtu.

171122_CERRE_BrexitEnergy_FinalReport 21/59
Table 2: Results from gas modelling – impact on average and peak wholesale gas prices
TTF
averagea
NBP
averagea
Averagea
price
differential
Changes
relative to
Baselines TTF
Peak b
NBP
Peak b
Peak price
differential
Changes
relative to
Baselines
Peak prices relative to annual
average prices Import Flows,
bcm p.a.c
Export
Flows,
bcm p.a.c
Correlation
between TTF
and NBP
[15]
TTF NBP TTF NBP TTF NBP
[1] [2] [3]=[2]-[1] [4] [5] [6] [7] [8]=[6]-[7] [9] [10] [11]=[9]/[1]-1
[12]=[10]/[2]
-1 [13] [14]
Baseline
A 3.94 4.17 0.23 n/a n/a 4.33 4.86 0.53 n/a n/a 10% 17% 0.05 1.58 0.953
Case A1 3.94 4.17 0.23 0.0% 0.0% 4.33 4.86 0.53 0.0% 0.0% 10% 17% 0.04 1.41 0.953
Case A2 3.96 4.01 0.05 0.4%
-
3.9% 4.33 4.86 0.53 0.0% 0.0% 10% 21% 0.00 0.00 0.919
Baseline
B 3.92 3.96
0.04 n/a n/a 4.33 4.39 0.05 n/a n/a 11% 11% 0.00 5.28 0.967
Case B1 3.93 3.83 -0.10 0.2%
-
3.3% 4.33 4.39 0.05 0.0% 0.0% 10% 15% 0.00 2.32 0.951
Case B2 3.95 3.74 -0.21 0.8%
-
5.6% 4.33 4.39 0.05 0.0% 0.0% 10% 17% 0.00 0.00 0.923
Note: Price Differential = NBP – TTF (positive means NBP is higher than TTF); a
average across the storage year – 1 Apr 2025 until 31 March 2026; b one peak day-ahead price
taken from the period 1 Oct 2025 until 31 Mar 2026; c flows (imports into the UK and export to Europe) for one storage year – 1 Apr 2025 until 31 March 2026.

171122_CERRE_BrexitEnergy_FinalReport 22/59
It is also worth mentioning that gas trade between the UK and Europe does not affect
peak prices in both markets – there is no impact of reducing gas interconnection capacity
on peak day prices in the UK or TTF market area. This means that gas interconnectors are
not setting prices on those peak days and this reduces their value as security of supply
assets on peak days and in managing price spikes on those peak days. LNG import and
short-range storage facilities in the UK and continental Europe will be increasingly setting
prices on peak days and therefore access to extra-European markets are more important
for managing peak prices. This does not mean that gas interconnectors will have
diminishing role in prolonged security of supply events.
What is interesting is that, should the UK economy be impacted by Brexit such that it
affects the overall demand for energy (decline in gas demand – Baseline B), then
potentially lower gas demand in the UK would put downward pressures on wholesale
prices both in the UK and North-West Europe (compare price under Baseline B with those
under Baseline A), although the impact on Europe is rather marginal. Under the
assumption of lower economic growth in the UK, and hence lower gas demand, the UK
would export even more gas to Europe (5.3 bcm p.a. vs 1.6 bcm p.a., column 14 in Table
2). This means that gas trade between the two parties could be even more beneficial to
European consumers, interconnector owners, UKCS producers and potentially LNG
importers into the UK. Another interesting observation from our modelling results is that,
should there be no trade in gas while UK’s gas demand falls due to negative
macroeconomic conditions after Brexit (Case B2), then price differential change signs and
the UK prices become lower than those in North-West Europe. This is principally because
the surplus gas that was meant to be exported to Europe now stays within the UK (and
this is a large volume: 5.28 bcm or 7% of UK’s 2015 gas consumption). As in case A,
interconnector capacity and trade does not seem to affect peak prices in the UK and
Europe (Table 2, columns 6 and 7).
It is worth noting that TTF and NBP prices are highly correlated in all our scenarios;
however, as less interconnection capacity is available (case A1 and A2), price correlation
reduces (Table 2, column 15), suggesting that on some days NBP and TTF could decouple.
We can also note that the impact on the BBL pipeline will be minimal because, as noted
earlier, it was merged into the TTF market area and its asset base is now socialised and
cross-subsidised by all shippers booking Dutch entry and exit capacities. The model results
show that import flows through BBL to the UK in 2025 are minimal, which could have
negative consequences for the owner of the pipeline should it stay as a merchant project.
However, now that BBL is part of TTF market area, the implication of this to the Dutch
transmission system operator would be minimal since the asset base of BBL is relatively
small compared to the overall asset value of the entire Dutch transmission system, and
hence additional top-up to the entry-exit tariffs resulting from adding BBL would be
minimal. The important question is that, with minimal flow through BBL, cost-reflectivity

171122_CERRE_BrexitEnergy_FinalReport 23/59
of entry-exit tariffs of TTF market area could become more distorted and it seems that the
UK could only benefit from having an import pipeline from Europe to the UK in terms of
security of supply. This security value has been underwritten by European shippers. Thus,
the value of BBL pipeline for the UK will be more in terms of security of supply and
managing peak prices.
In general, we should note that gas flows between the UK and Europe will be more
responsive to very short-term variations in demand due to growing share of intermittent
capacity on both sides, rather than being ‘base load’ flow. Both UKCS and Dutch gas
production is declining rapidly and their share in gas consumption by 2025 will be lower –
meaning greater economic incentives to sell gas to ‘home’ markets. This is because non-
domestic higher cost gas sources will set prices in both markets and hence infra-marginal
rent for domestic producers will increase, if selling to ‘home’ markets rather than
exporting to a neighbouring market involves paying additional transport cost. In the case
of IUK export capacity, the only strong economic incentives for UKCS to flow gas to the
EU-27 has been short-haul discount. Should this be removed, then the profit from selling
into the NBP would be higher than from selling into the TTF market area, based on
existing (2015) tariffs and on a netback basis. This will have negative consequences for the
IUK export volumes.
If short-haul tariffs are removed, then we can make some inferences on the future of IUK
by looking at price spreads between the two market areas. For example, price
differentials in Case B2 is $0.21/mmbtu (Table 2, column 3) which roughly covers both
commodity and capacity charges that IUK published in 2015.50 According to the model,
the annual export in the 2025/26 storage year through IUK is 5.28 bcm (Baseline B), which
is roughly 26.5% of annual utilisation rate. If $0.2/mmbtu can be captured as an export
tariff by IUK (thus leaving $0.01/mmbtu as a margin to traders/shippers), the annual
revenue from exporting 5.28 bcm (under Baseline B) at $0.2/mmbtu would be roughly
$41mn or £32.3mn (at a £0.79/USD rate). This is compared to £65mn of annual OPEX for
IUK in 2014/15 reporting period.51 Thus, to cover that level of OPEX, IUK would have to
export at least 10 bcm/year, assuming this higher level of exports would not move the
price spread of $0.21/mmbtu and assuming no imports through IUK. Under Baseline A,
average price spreads suggest no export from the UK to the EU-27 based purely on price
differentials.
The above implications for gas interconnectors are based on average wholesale prices or
average price spreads. However, as we discussed above, the gas trading dynamics
between the UK and Europe are changing dramatically with flows between the two
market areas becoming more volatile in response to day-ahead variations in demand and
50
Based on 2015 data, IUK export charges were: 0.05125 p/kWh/h/day for commodity-related charges and
0.8350 p/kWh/h/day for capacity-related charges. 51
http://www.interconnector.com/media/115974/2016_financial_statements.pdf

171122_CERRE_BrexitEnergy_FinalReport 24/59
supply in both markets. Business models for gas interconnectors between the UK and
Europe will unlikely be based on securing ‘base load’ gas flows or long-term shipping
contracts, as used to be the case when IUK was built as a merchant pipeline. It will be
based on gas interconnector being able to capture higher value in the short-term market
timeframes. To illustrate this point, Figure 1 shows the distribution of price spreads
between the UK and North-West Europe under Baseline A Case A2, under which no gas
interconnection capacity exists between the two markets in 2025-2026.
Figure 1: Price differentials in USD between UK and Europe under Baseline A Case A2.
Note: these price spreads are for storage year Apr-25 until Mar-26; positive means that NBP is higher priced
market and hence the UK should be in a net import position; negative means that NBP is lower priced market
and hence the UK should be in a net export position.
If the export tariff through IUK is $0.234/mmbtu (commodity and capacity charges) then
there are more than 120 days when IUK can make profit – during those 120 days price
differentials are between $0.35/mmbtu and $0.75/mmbtu (the first two left bars in Figure
1). Similarly, if the import tariff through IUK is $0.312/mmbtu (commodity and capacity
charges) then there are at least 100 days when IUK can make a profit on import flows –
during those 100 days, price spread is $0.45/mmbtu-$0.65/mmbtu. Clearly allowing more
flexibility for merchant gas interconnectors to price their capacity products would allow
Flow from UK -> Europe Flow from Europe -> UK
171122_CERRE_BrexitEnergy_FinalReport 25/59
IUK to transition to new trading arrangements. According to IUK,52 it has made a
substantial effort to convince the European authorities to include wording in the 2016
Tariff Code that would allow a merchant pipeline to be exempted from certain provisions
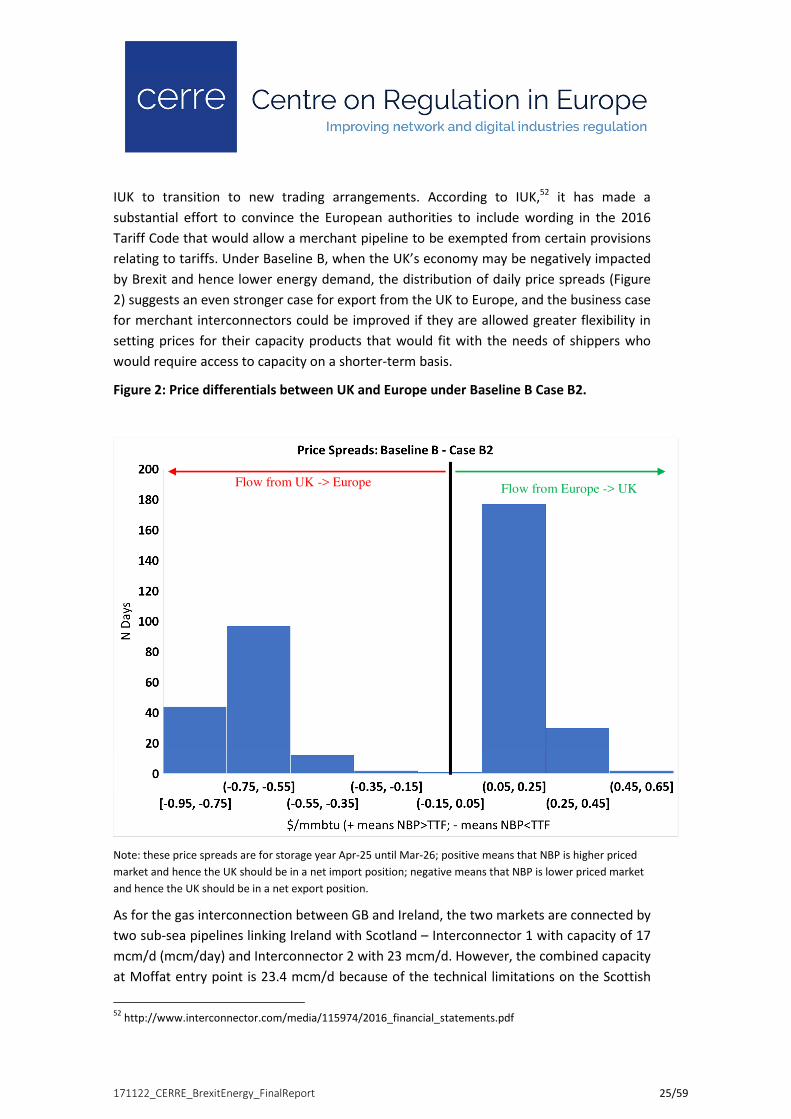
relating to tariffs. Under Baseline B, when the UK’s economy may be negatively impacted
by Brexit and hence lower energy demand, the distribution of daily price spreads (Figure
2) suggests an even stronger case for export from the UK to Europe, and the business case
for merchant interconnectors could be improved if they are allowed greater flexibility in
setting prices for their capacity products that would fit with the needs of shippers who
would require access to capacity on a shorter-term basis.
Figure 2: Price differentials between UK and Europe under Baseline B Case B2.
Note: these price spreads are for storage year Apr-25 until Mar-26; positive means that NBP is higher priced
market and hence the UK should be in a net import position; negative means that NBP is lower priced market
and hence the UK should be in a net export position.
As for the gas interconnection between GB and Ireland, the two markets are connected by
two sub-sea pipelines linking Ireland with Scotland – Interconnector 1 with capacity of 17
mcm/d (mcm/day) and Interconnector 2 with 23 mcm/d. However, the combined capacity
at Moffat entry point is 23.4 mcm/d because of the technical limitations on the Scottish
52
http://www.interconnector.com/media/115974/2016_financial_statements.pdf
Flow from UK -> Europe Flow from Europe -> UK

171122_CERRE_BrexitEnergy_FinalReport 26/59
side of the interconnection. It is worth mentioning that there is a sub-sea spur supplying
gas to the Isle of Man (a self-governing UK Crown dependency) from Interconnector 2.53
Currently, GB supplies around 90% of Irish annual gas demand and with the start-up of
the Corrib gas field off the northwest coast of Ireland, this dependence will be lower for
the next ten years (its estimated producing life is just over 15 years).54 However, by 2025
the level of dependency on GB gas imports would be similar to the current level with a
rather strong gas demand projection for Ireland (12% p.a. over the period to 2021/22).55 It
is unlikely that Brexit will result in any restrictions on the supplies of gas to Ireland, at
least from an economic point of view. The supplies to Ireland supports the utilisation of
the GB gas network assets – on annual basis, supplies to Ireland are ca. 4 bcm, if GB
supplies around 90% of Irish annual demand of ca. 4.4 bcm in 2015. Although this flow is
just over 5% of GB’s annual demand, in the context of GB’s key import infrastructure this
is not insignificant. For example, assuming that the IUK import flows or LNG from Isle of
Grain are marginal during winter days, then peak flow capacity to Ireland corresponds to
45% of peak import flow through IUK56 or 40% of daily send-out rate of LNG at the Grain
terminal.57
Thus, having supplies to Ireland supports the utilisation of these key infrastructure assets
for GB, which supports security of supply to both GB and Ireland. In the global context,
having Ireland, essentially as part of the GB market, increases GB’s attractiveness to
external suppliers. The gas system is interconnected between Northern Ireland and the
Republic of Ireland, which makes any attempt to limit capacity and trade to the island of
Ireland unlikely given the mutual commitment of the EU-27 and the UK to find Brexit
solutions which work across the border in Ireland (discussed below).
Lastly, experience of ‘risky’ and ‘unreliable’ transit countries or external suppliers suggests
that these can and will be ‘bypassed’ – Ukraine is one such example of large transit state
being bypassed by Russia or Lithuania, who secured a substantial discount off its contract
import price in negotiations with Gazprom after building an LNG regasification terminal,
thus breaking Gazprom’s monopoly. An outside option for Ireland would be an LNG
terminal, and in the context of oversupplied global markets and increased international
competition could become credible should GB ‘misbehave’. This is especially relevant
given the rapid development of flexible and relatively less expensive floating
regasification terminals, which can be deployed at fraction of cost and time compared to
53
https://www.iea.org/media/freepublications/security/EnergySupplySecurity2014_Ireland.pdf 54
https://www.dccae.gov.ie/en-ie/natural-resources/topics/Oil-Gas-Exploration-Production/corrib-gas-
field/Pages/Corrib-Gas-Field.aspx 55
https://ec.europa.eu/energy/sites/ener/files/documents/2014_countryreports_ireland.pdf 56
If IUK’s import capacity is 19 bcm p.a. then its average daily flow rate is 19/365 *1000 = 52.05 mcm/d. Then,
maximum daily flow capacity to Ireland is 45% of that average flow rate on the IUK imports (23.4/52.05 =
0.45). 57
Maximum daily LNG regasification rate at the Grain terminal is 58 mcm/d or 645 GWh/d – see
http://grainlng.com/operational-information/terminal-characteristics/

171122_CERRE_BrexitEnergy_FinalReport 27/59
onshore, large and fixed LNG import terminals. To sum up the GB-Irish gas trade, we
believe it is both in energy security and economic terms that the mutual trade in gas will
be sustained. Therefore, we consider status quo, no disruption, as the most plausible
post-Brexit scenario for gas trade between GB and Ireland.
4.2. Electricity modelling
Now we turn to discuss some of the findings from our electricity market modelling. In
particular, we used a detailed UK unit commitment model to simulate impact of possible
delays in bringing more interconnection capacity between the UK and Continental Europe.
As was noted in the literature review section, some of the studies have pointed out that
one implication of Brexit could be greater uncertainties around investment in new
interconnection and generation capacities. Thus, we have modelled three scenarios for
the year 2025:
1. Baseline (the status quo), in which all generating capacity and demand for
electricity follow government projection, while interconnection capacity is kept at
the same level as currently (i.e., 2GW of interconnection with France, 1GW with
the Netherlands and 1GW with Ireland and 3.4 GW of interconnection capacity
under construction (with Belgium, with Norway and with France)
2. Case 1: the same as Baseline, but with additional interconnection capacity of 1GW
between France and the UK. Thus, there is 8.4GW of interconnection in total by
2025.
3. Case 2: the same as Baseline, but we assume that Brexit will have a negative
impact on UK’s economy and hence, electricity demand in the UK in 2025 will be
5% lower than in 2015.
Thus, under the Baseline scenario, average wholesale electricity price in 2025 is ca. £
£39.94/MWh while under Case 1 (i.e., having 1GW of additional interconnection with
France), the price would drop quite marginally to an annual average of £39.86/MWh, or
just £0.08/MWh. This is principally because having one extra GW of interconnection
beyond those already in operation (4GW) and those that will be built by 2025 (3.4GW)
would have a diminishing value, on average across a year. Secondly, our model suggests
that having interconnection with Norway reduces average wholesale price for the UK to
the point that more interconnection with Europe will have marginal impact on wholesale
price in the UK (the Norwegian price is substantially lower than in European markets, with
which UK have or will have an interconnection). Thirdly, using this number to infer the
benefits of interconnection is rather misleading, since there are only 1763 hours (out of
8760) when prices in two scenarios (Baseline and Case 1) differ (see Figure 3 for
distribution of differences in prices for those 1763 hours). Thus, in some hours, having
additional 1GW of capacity (Case 1) will reduce electricity prices in the UK by as much as
£27/MWh. If peak consumption is 53.7GWh (in 2015), then this will amount to around

171122_CERRE_BrexitEnergy_FinalReport 28/59
£1.45mn in savings for UK consumers for that particular peak hour. If we sum up all the
hours (both negative and positive price differences), then the total benefit for UK
consumers of having one more GW of connection with France would be around £7.54mn
p.a.
Figure 3: Differences in UK electricity wholesale prices under Baseline and Case 1
Note: positive means that wholesale price under Case 1 (1GW of additional interconnection with France) is
higher than the price under Baseline; negative means the opposite
Moreover, Figure 3 also suggests that wholesale prices can also rise under Case 1, relative
to the Baseline. This means benefits to France, because in some hours, due to that extra
1GW of interconnection capacity, GB exports electricity to France and hence wholesale
prices in the UK rise relative to the baseline. To show this point, Figure 4 highlights the
marginal benefit of having one extra MW of export capacity (on the existing IFA line) in
2025. Note that, according to our modelling, there were 4297 hours in 2025 (out of 8760)
for which export capacity (UK->FR) of the IFA line were binding. The marginal price – or
congestion rent – at those hours reflects the difference between UK’s future system
marginal price and historical French wholesale electricity prices for those hours. It is
immediately clear from Figure 4 that electricity interconnector owners would benefit from
continued trade, and so would UK generators. Since our electricity market model is UK-
focused it cannot directly estimate impact of export flows from the UK to France on
consumers in France, that is, the impact of export flows on merit order in France and
hence wholesale prices there. However, we can reasonably assume that, if by 2025 French

171122_CERRE_BrexitEnergy_FinalReport 29/59
electricity generation mix will not change dramatically, then for most of the time marginal
prices in France are set by prices in neighbouring countries (such as Germany, Italy or
indeed the UK). France is connected to markets in which marginal plants are fossil-fuel
based (and mostly gas-fired by 2025). Therefore, if we assume that gas-fired plants are
setting prices in France, then based on our gas modelling results (Figure 1 and 2 in
particular), for some days UK export flows to France will set prices in France displacing
slightly more expensive electricity coming from gas generation in other neighbouring
markets with France. Thus, consumer benefits to France of having interconnection with
the UK can be deducted from Figure 4. For example, the mean of the marginal price
distribution shown in Figure 4 is £9.3/MW. If we assume that the UK will set prices in
France 5% of the time when exports to France are at the maximum capacity (i.e., 5% of
4297 hours), then the benefit to consumers in France is £97.2 mn p.a. (Table 3, column
13). 58
Figure 4: Marginal price for one extra MW of export capacity from UK to FR
Note: the model shows that in 2025, out of 8760 hours, there were 4355 hours for which export capacity (UK-
>FR) of the existing IFA line was binding. Hence, the chart shows the shadow prices for those hours.
Assuming that a new 1GW interconnection line between the UK and France (say IFA2)
costs around £614mn or at 10% discount rate over 25 years economic life time would
result in equivalent annual cost of £67.6m p.a. with £11.5m p.a. in opex. Then, under a
conservative estimate, the benefit of having one more GW of interconnection between
58
Assuming that in 2015 final electricity consumption in France was 425 TWh – http://ec.europa.eu/eurostat
171122_CERRE_BrexitEnergy_FinalReport 30/59
the UK and France (on top of existing and all the projects which are already under
construction) would be of £97.2mn for France (but could be substantially larger, see Table
3) and £7.54mn for the UK, giving total benefit for the two countries at ca. £89.66 mn p.a.
Thus, net welfare for the UK and FR is roughly £10.56mn p.a. (£89.66 mn p.a. less £79.1
mn p.a. for the cost of the interconnector) or ca. 1.5p/MWh for whole UK and France.59
But this is a rather conservative estimate. If the UK prices are going to set prices in France
for more than 5% of the time when exports to France are at maximum capacity, then the
benefits should be substantially larger to the consumers in France (see Table 3, column
14).
As for the benefits to other markets of having interconnections with the UK, Table 3
highlights our calculations of benefits to Ireland, to the Netherlands, to Belgium, and to
Norway, based on a similar logic as the one we discussed for the benefits of
interconnection to France (above). We should note that the columns 12-14 show benefits
to consumers in those respective markets, assuming different periods when the UK prices
will set prices in those respective markets. This is the case if the UK export flows through
the interconnectors are the marginal source of supplies to those markets. Hence,
consumers in those countries will benefit more if they enjoy potentially lower import
prices from the UK for longer (e.g., column 12 assumes 1% of the time when export
capacity is binding; see column 4 Table 3). However, if prices in the two connected
markets are similar then that would mean no profit from arbitrage for traders and
producers located in those two markets. Thus, columns 15-17 show profit from arbitrage
between those countries and the UK. One can see that the higher is the number of times
when prices converge, the lower will be annual profit from arbitraging (this takes also into
account annual cost of interconnectors, column 11).
The overall conclusion from Table 3 is that having interconnection with the UK is
beneficial to consumers in Ireland, Belgium, the Netherlands and even Norway (because
although Norway is substantially lower price market, there are 76 hours in a year when
prices in the UK could be lower than in Norway, column 4 Table 3). The Irish impact is for
consumers in Northern Ireland and the Republic of Ireland, and is relatively large in
relation to the size of the market. The interconnections also bring arbitrage profit (i.e.,
price differentials time interconnection capacity, less all capex and opex of these
interconnections) for traders and producers. The only exception are profitability of
arbitrage between France and the UK and between Belgium and the UK, beyond the level
of interconnection that these countries already have or those already under construction.
However, this is based purely on the logic of merchant interconnectors (arbitrage price
differentials, less all costs) but as we discussed above, further interconnection between
these countries brings benefits to consumers on both sides of the market (e.g., in case of
59
Assuming that in 2015 final electricity consumption was 303 TWh in the UK while consumption
in France – 425 TWh.

171122_CERRE_BrexitEnergy_FinalReport 31/59
UK-FR: £26.98 mn p.a. for the UK and potentially up to £194.4mn p.a. for France, column
14 Table 3). One final observation from Table 3 columns 5 and 7 is that connection to
Norway has substantial value to the UK. Column 7 shows that there is 98.6% of time in a
year (8636 hours) when the value of having one extra MW of import capacity from
Norway is positive. Its average value is £20.4 MW, which is at least twice as high as having
additional interconnection with the other markets (column 5, Table 3). Similarly, arbitrage
profit stemming from the UK-Norway connection is substantially higher than profits from
further arbitrage between the UK and Continental Europe.

171122_CERRE_BrexitEnergy_FinalReport 32/59
Table 3: Results – impact on countries connected with the UK
Final
consumpt
ion 2015a,
TWh
marginal value for export
capacity, £/MW
marginal value for import
capacity, £/MW Assumed
capacity of
one
additional
interconnect
or, MWb
CAPEX,
£ mn
OPEXd
over 25
years, £
mn
equival
ent
annual
cost, £
mn
p.a.
average net benefit to
consumers, £ mn p.a.
Average profit from arbitrage, £
mn p.a.
Mean
std.
dev.
N hours
constraint
binding Mean
std.
dev.
N hours
constraint
binding
1% of
time
intercon
nector
sets price
5% of
time
intercon
nector
sets price
10% of
time
intercon
nector
sets price
1% of
time
intercon
nector
sets price
5% of
time
intercon
nector
sets price
10% of
time
intercon
nector
sets price
[1] [2] [3] [4] [5] [6] [7] [8] [9] [10] [11] [12] [13] [14] [15] [16] [17]
IE 25.1 15.0 20.0 3763 10.3 6.9 4698 500 150g
70 19.3 1.6 8.1 16.2 32.8 30.7 28.0
FR 424.9 9.3 6.9 4297 9.2 7.1 3754 1000 614f
286 79.1 19.4 97.2 194.4 -5.4 -8.4 -12.1
NL 103.1 10.3 7.7 4336 9.3 7.3 4203 1000 522e
243 67.2 5.3 26.3 52.6 15.6 12.2 8.0
BE 81.7 10.7 7.8 4244 9.3 7.1 4262 1000 703c
327c
90.5 4.2 21.1 42.2 -6.5 -9.9 -14.2
NO 110.8 2.5 2.1 76 20.4 8.1 8636 1400 1208h
562 155.6 0.0 0.1 0.2 89.2 79.3 66.9
Notes:
a this comes from Eurostat;
b this is our assumed additional capacity which corresponds to the original project which are either operating currently or are being built;
c this is full CAPEX of the NEMO project calculated based on OFGEM’s estimate of UK’s 50% share in the project
https://www.ofgem.gov.uk/sites/default/files/docs/2014/04/nemo_cost_assessment_consultation.pdf
d apart from the OPEX of the NEMO (UK-BE interconnector) project, OPEX of the other assumed interconnectors were derived based on share of OPEX as % of CAPEX of
the NEMO project;
e this is CAPEX of the BritNed taken from OFGEM paper https://www.ofgem.gov.uk/sites/default/files/docs/2014/03/bpi_nemo_cost_report.pdf;
f taken from http://www.4coffshore.com/windfarms/interconnector-interconnexion-france-angleterre-(ifa2)-icid11.html;
g taken from http://www.4coffshore.com/windfarms/interconnector-moyle-icid20.html ;
h this is full CAPEX of the NSL project calculated based on OFEGM’s estimate of the UK’s 50% share in the project https://www.ofgem.gov.uk/ofgem-publications/104964

171122_CERRE_BrexitEnergy_FinalReport 33/59
As for the results from Case 2, should Brexit impact the UK’s economy negatively and
hence lowering energy demand, then the average wholesale price would be £39.61/MWh
(Case 2), or £0.33/MWh lower than the average price under the Baseline (£39.94/MWh).
To put this in the context of additional interconnection means that lower demand in the
UK could potentially balance out potential negative effect from not having more
interconnection with Europe.
Discussion so far has been focused on average hour but what is also interesting to note is
the effect of additional interconnection on peak prices. Figure 5 below outlines the
highest price periods in the UK under the Baseline scenario – there are ca. 2% of 8760
hours when the UK prices are higher than £50/MWh. Note that these 2% of 8760 hours
are distributed randomly across the year (2025) and are not necessarilyconsecutive hours.
Figure 5 also plots prices for those 2% of 8760 hours under Case 1 (one additional GW
conneciton with France) and Case 2 (lower demand in the UK).
Figure 5: Impact of additional interconnection (Case 1) and lower UK electricity demand
(Case 2) on the UK’s peak electricity prices
Note: Figure 5 shows 160 hours for which prices under the Baseline scenario are higher than £50/MWh; this
represents around 2% of 8760 hours or one year. These hours with highest prices are spread randomly across
the year and so are not necessarily representative sequences.
Given the above discussion and highlights from Figure 5, we can conclude that although
the benefit of further interconnection for the UK could be rather marginal (£9.24 mn p.a.
in case of 1GW more interconnection with France, Case 1) the effect on peak hours could

171122_CERRE_BrexitEnergy_FinalReport 34/59
be significantly positive for UK consumers. For example, between hours 19 and 28 in
Figure 5, we can see a drop in wholesale prices under Case 1 (red line) relative to the
prices under the baseline (blue line). The reverse is also true – the impact of having
additional interconnection on French peak prices are rather similar. One can come to this
conclusion by looking at the ‘thin tail’ of the distribution shown in Figure 4.
Finally, what is striking, and re-confirms the above conclusion about lower electricity
demand, is that Case 2 (lower electricity demand) could have quite a similar (positive)
impact on UK wholesale electricity prices - there are even more hours when prices under
Case 2 (dashed green line in Figure 5) are lower than the baseline peak prices.
All in all, we can conclude that the majority of interconnection benefits for the UK seems
to be with Norway. If these benefits with Norway are materialised as shown by our
modelling, then further interconnection between the UK and Continental Europe might be
marginally positive, on average, for the UK. We can also conclude in this case that
interconnection also benefits Continental Europe, on average. Further, interconnection
may have substantial positive impact on peak days for the UK and other connected
markets. Thus, if Brexit delays the construction of electricity interconnector capacity, this
has a negative impact on consumer welfare for both UK and its interconnected markets
(e.g., Ireland, France, Belgium, the Netherlands and even Norway), if we assume no
mitigating capacity investments in the UK. However, another way of looking at this is that
the gains from increased electricity interconnector capacity under construction are
currently not insignificant, but that this it is highly unlikely that they will be affected by
Brexit. We should also note that our analysis does not consider the sort of benefits that
Newbery et al. (2016) discussed in their paper, namely benefits of interconnection for
balancing and ancillary services.

171122_CERRE_BrexitEnergy_FinalReport 35/59
5. How UK Energy Policy could develop after Brexit
UK energy policy, as for the EU-27, is focused on three over-arching objectives: energy
security, low prices (competitiveness) and meeting environmental targets60. As part of
this, the UK remains committed to its climate change targets, as enshrined in its 2008
Climate Change Act. These three objectives together form the energy trilemma facing
every country. There have been no significant changes in the objectives of energy policy
of either the UK or the EU-27 since the UK referendum vote on Brexit on 23 June 2016.
The objective of energy security suggests the value of interconnection for both electricity
and gas with the rest of Europe. Low prices (and hence energy security with respect to oil
and LNG) suggests the importance of access to global fossil fuel markets and to global
equipment markets. Environmental targets, particularly with respect to carbon, suggests
the value of its membership of the EU ETS, where the UK is a substantial net purchaser of
permits and hence is buying cheap abatement from overseas.
One can put these policy benefits in material perspective and compare their value to the
impact of UK domestic energy policy choices. Interconnection, as we have noted above,
might be capable of lowering wholesale system costs by approximately 5% for electricity
and gas, albeit at some costs for the increased interconnection. For the UK in 2016 the
wholesale cost of electricity was around £17bn and the wholesale cost of gas was around
£10bn61. 5% of these values would be £1.35bn p.a. The UK’s net purchasing of EU ETS
permits was 28m in 2015 at say €6 (£5) per tonne. If this abatement had to be met from
additional domestic abatement at £31.25 per tonne CO2 (roughly the extra cost of
offshore wind in the latest government procurement auction62), this would be £875m p.a.
Thus, a complete loss of integration into the EU electricity, gas and carbon markets might
involve a cost of the order of £2.2bn p.a. There would be corresponding losses on the part
of the EU-27, though these would likely be smaller in total due to the more elastic internal
response of the EU-27 to the loss of trading with the UK. The impact would also be spread
over the much larger size of the EU-27, though the proportionate effect might be higher in
Ireland because of its energy dependence on the UK. However, these values are upper
bounds and the experience of Switzerland is that trading has continued even in the
absence of full incorporation into EU markets and that following the Swiss referendum
60
UK energy policy is stated as being ‘ensuring that the country has secure energy supplies that are reliable,
affordable and clean’, see https://www.gov.uk/government/organisations/department-for-business-energy-
and-industrial-strategy/about, accessed 15 September 2017. 61
See DUKES (2017, p.33). 62
The government is paying £57.50 / MWh (2012 prices) for offshore wind in 2022/23 (see
https://www.gov.uk/government/uploads/system/uploads/attachment_data/file/643560/CFD_allocation_ro
und_2_outcome_FINAL.pdf, accessed 15 September 2017) against current power exchange prices of around
£45 / MWh (see https://www.apxgroup.com, accessed 15 September 2017). Thus the government is paying
an additional £12.50 / MWh (or £31.25 / tonne CO2) to save roughly 0.4 tonnes CO2 saving per MWh. This is
on top of the EUETS price which is already included in the current wholesale power price.

171122_CERRE_BrexitEnergy_FinalReport 36/59
existing trading arrangements were frozen rather than changed. Thus the likely worst case
is that integration benefit losses will be a fraction of the maximum potential loss and will
at worst only emerge as a divergence from business as usual over time. A 25% loss of
energy and climate integration benefits would thus be £550m p.a.
We now turn to potential changes in the UK’s energy policy. Looking at the UK’s actual
energy policy and how it should be rationalised puts the above numbers in perspective.
We begin with domestic policies related to current EU energy and climate directives,
before going on to more clearly domestic energy policy choices.
The EU has substantially restricted the UK’s ability to introduce fully merchant electricity
interconnectors and to have competitive capacity allocation for gas interconnectors. The
EU has favoured regulated electricity connectors, where the revenues of the
interconnector are effectively underwritten by both sets of electricity consumers on
either side of the interconnector. This relies on long-term cost benefit analysis of welfare
benefits where costs are socialised across system users rather than exposing investing
parties to market risk. Ofgem, currently, has a cap and floor regime for the allowed return
on new electricity interconnectors and a merchant regime, where the owners simply rely
on arbitrage revenue.63 The argument for merchant interconnectors to the UK is that
current capacity is a long way short of optimal and that merchant interconnections can
get quite close to the social optimal level.64 Similarly, the UK has also favoured
competitive allocation of gas interconnector capacity, but the EU has favoured regulated
returns on gas interconnector assets based on a public investment approach.
EU rules have put restrictions on the UK’s ability to have a pricing regime for electricity
that does not discriminate against domestic electricity generation. In the UK, unlike
domestic generators, electricity interconnectors are not subject to locational transmission
charging according to their point of connection to the domestic transmission system. This
is because this would be deemed to be a restriction on cross border trade within the EU.
This has created a distortion within Great Britain between onshore generators and
generators selling into the UK across interconnectors at the same transmission grid supply
point, as one is subject to locational transmission charges and the other is not.
This applies to both the electricity interconnectors from Ireland (including the one from
Moyle in Northern Ireland) as they are part of the Single Electricity Market (I-SEM) in
Ireland. It is possible that the Moyle interconnector at the very least would become
subject to transmission charges for injection into the GB system if the I-SEM were to end
following Brexit. This might be efficient in terms of reflecting underlying system costs. It
might also lead to lower prices for Northern Irish consumers (and lower profits for NI
63
See https://www.ofgem.gov.uk/electricity/transmission-networks/electricity-interconnectors, accessed 15
September 2017. 64
See Parail (2009) who analyses the Nor-Ned interconnector and makes this point.

171122_CERRE_BrexitEnergy_FinalReport 37/59
generators) assuming the interconnector represents a demand in a constrained part of
the network.
Membership of the EU has also prevented the UK from imposing a border tax adjustment
on imported electricity to correct the distortion coming from the UK’s carbon floor price,
which imposes a further £18 / tonne of CO2 on fossil fuels used in onshore electricity
generation, raising the marginal cost of onshore electricity generation relative to
electricity supplied across the interconnectors. If this distortion raised imports by 5% of
gross demand (330 TWh) and had an efficiency cost of half of the value of the tax (say
£3.6/MWh65), that would be £60m p.a66.
The 2001 EU Large Combustion Plant Directive (LCPD, 2001/80/EC) had significant
implications for the UK. The UK had one of the oldest and largest coal-fired power plant
fleets in Europe. Many of its plants opted out of the Directive’s requirement to install a
flue gas desulphurisation (FGD) unit and hence had to shut by 1 January 2016. The closure
of around 11.55 GW of capacity as a result of the Directive67 (some of it at a time when
fossil fuel and carbon prices were favourable towards coal) was a reason for the
introduction of the UK Capacity Mechanism from 2018/19. This pays plants an availability
payment in return for being able to provide power following the declaration of a ‘capacity
event’ by the system operator. The capacity market involves an estimated NPV cost of
£289m68, which might have been avoided if older coal-fired power plants could have
remained open for longer.
We now look at some of the UK’s fully domestic energy policy choices.
The UK’s renewable subsidy policy currently costs of the order of £4bn per year. The
policy has been widely criticised as being inefficient and expensive relative to the
excellent renewable energy resources that the UK has. The UK has had more generous
onshore wind subsidies than Germany, adjusting for the quality of the wind resource in
the UK. The UK introduced one of the world’s highest feed-in-tariffs for residential PV in
2010 resulting in the rapid uptake of nearly 1 GW of domestic solar by 31 March 2012.
The policy was uncapped and is currently costing around £1bn p.a. (Ofgem, 2015). The
solar subsidy regime, combined with the substantial reduction in PV installation costs, has
resulted in nearly 12 GW of solar capacity being installed in the UK by 2017. The solar
subsidies have contributed to a projected £1.5bn p.a. overspend on the maximum
allowed subsidy towards the electricity sector (itself capped at £7.5bn p.a.) (NAO, 2016,
p.4).
65
The tax is £18 per tonne of CO2. If the marginal fuel is gas and this emits 0.4 tonnes of CO2 per MWh, then
half the value of the tax would be £18*0.4*0.5 = £3.60 / MWh. 66
£3.6*330,000,000 MWh*0.05=£59.4m. 67
See http://www.nationalgrid.com/NR/rdonlyres/DD31ED99-F769-4995-84E3-
809E29CE2E19/19877/pp07_32_LCPD_revised.pdf, accessed 15 September 2017. 68
See, https://www.gov.uk/government/uploads/system/uploads/attachment_data/file/66039/7103-energy-
bill-capacity-market-impact-assessment.pdf, accessed 15 September 2017.

171122_CERRE_BrexitEnergy_FinalReport 38/59
The UK ran a very successful contract for difference auction for renewable electricity in
February 2015 which resulted in significant price reductions (of the order of 25%) in the
required subsidies for offshore and onshore wind.69 This indicated that auctions should
have been used much earlier for the allocation of subsidies to meet the UK’s EU
renewable energy directives (as they had been in the 1990s, see Pollitt, 2010). In August
2017, the UK had another successful CfD auction for renewables. However, this auction
only targeted less mature technologies and did not allow solar and onshore wind to
compete in the auction.70 £290m p.a. of subsidy was allocated and much of this could
have been saved if more mature RES technologies could have been allowed to compete in
the auction. Savings (or increases in low carbon MWh for the same budget) of the order
£500m-£1bn p.a. are certainly possible from a complete rationalisation of renewable
support in the UK.
The EU Energy Services Directive of 2012 (2012/27/EU) provided the backdrop to the UK’s
smart meter roll out. The Directive specified that 80% of new electricity meters for non-
half hourly metered customers (i.e. residential and small business users) should be ‘smart’
– capable of two-way real time communication with the grid – by 2020, subject to a cost-
benefit test of whether they were worth installing on the system. Several EU countries
(including Germany) have chosen not to implement a general early roll out of fully
functional smart meters following a negative cost benefit assessment71. However the UK
decided to have a 100% roll out of both electricity and gas smart meters to all households
and small business users by 2020. This programme has an estimated cost of £11bn (or
£200 per meter). The programme has been widely criticised on the grounds of its
technology choices and overall cost.72 It is quite clear that it could have been
implemented (if at all) with at least half the cost (certainly by dropping all of the 23m gas
meters). This is equivalent to a cost saving of the order of £500m p.a.
The striking thing about the above examples of the rationalisation of domestic policy is
their relative materiality. The possible loss of EU market integration benefits following
Brexit might be worth of the order of £550m p.a. While EU integration has imposed some
costs on the UK by restricting its use of some market mechanisms with respect to
interconnectors, it is unclear whether these are strictly due to membership of the EU
rather than the normal outcome of a bilateral negotiation (and hence would have had to
be accepted anyway as a price to pay for gaining interconnector benefits). However, these
costs are dwarfed by the UK’s domestic policy capacity to add to its own energy costs.
With around £7bn p.a.73 of current energy subsidies and significantly higher subsidies in
69
See NAO (2016). 70
See
https://www.gov.uk/government/uploads/system/uploads/attachment_data/file/598824/Budget_Notice.pdf,
accessed 15 September 2017. 71
See European Commission (2014). 72
See Haney et al. (2011) and Henney (2015). 73
OBR (2016, p.132).

171122_CERRE_BrexitEnergy_FinalReport 39/59
prospect (£13bn by 2021-22), together with expensive technology choices around nuclear
and smart meters, the potential to add to energy consumers costs is an order of
magnitude higher as a result of domestic policy choices than it is dependent on post-
Brexit relations with the EU-27. To emphasise this materiality point further, it is worth
noting that in August 2017 only 36% of the current domestic electricity bill in Great Britain
and 39% of the current domestic gas bill is made up the wholesale price.74 Thus, for
domestic consumers especially, energy specific relations with the EU will not be the
material determinant of what they pay.
In closing this section, it is important to state that energy systems are now at a new
crossroads. The challenge is to scale up renewables still further and to electrify transport
and heating, while managing a likely steady decline of gas (at a somewhat unpredictable
rate). The EU-28’s 2030 targets for CO2e imply an electricity sector which is 55%
renewables by energy (in addition to 20% nuclear).75 The UK’s own national targets imply
a 90%+ low carbon electricity system by 2030. This sort of development of low carbon
requires new designs for the electricity market to support high capital cost, low running
cost systems and a highly competitive and flexible gas market. The EU’s success in
integrating short-term energy markets has come at the same time as the near complete
nationalisation of investment decisions in the electricity system. A high renewables
energy future for Europe suggests that we are on the cusp of moving away from a system
where marginal fossil fuel costs will be the key driver of investment and operational
decision making.
What is required, and is recognised by the Winter Package, is a completely new market
design which decentralises low carbon investment decisions in the energy system (see
Newbery et al., 2017). This might require a return to much more extensive vertical
integration to reduce exposure to price volatility for capital intensive generation
investments and to internalise multiple sources of value for flexibility investments such as
electrical energy storage. There may also be a need to have contracts with the whole of
the supply base for large investments in nuclear, storage and interconnectors (following
Keisling, 2009). Given the technological challenge of complete decarbonisation with high
renewables penetration of the energy system, there is clearly a need for massive local
experimentation on ownership and contractual forms. This is especially the case as we
look beyond the power system to promoting heating and transport decarbonisation and
innovation.
The UK led the way on the introduction of an unbundled electricity and gas system;
however it is in a position to the lead the way on the development of the new high
renewables electricity system, given its plentiful renewable energy resources (see Jamasb
74
See https://www.ofgem.gov.uk/consumers/household-gas-and-electricity-guide/understand-your-gas-and-
electricity-bills, accessed 15 September 2017. 75
See Newbery et al. (2017).

171122_CERRE_BrexitEnergy_FinalReport 40/59
et al. 2008). New York and California have been experimenting in new ways of promoting
distributed energy resources and local markets for electricity products; this is very
different from the emphasis on wide area markets we have seen in the recent past (see
Pollitt and Anaya, 2016). What seems clear is that it is parts of the US, China and Australia
that are likely to lead the world in new energy technologies and in market design. The UK
would like to be part of these new electricity system developments which emphasise local
production and balancing and it is still the 6 or 7th largest country by public energy R+D
expenditure. Ofgem continues to support large scale experimentation in electricity and
gas networks via its Network Innovation Competition (NIC)76 and the UK’s recent
industrial strategy commits the UK to further research in the area of batteries, storage
and grids (BEIS, 2017).
76
See https://www.ofgem.gov.uk/network-regulation-riio-model/network-innovation/electricity-network-
innovation-competition, accessed 15 September 2017.

171122_CERRE_BrexitEnergy_FinalReport 41/59
6. How EU-27 energy and climate policy might
develop after Brexit
This is much more difficult to discern than the potential impacts for the UK. This is
because there are 27 countries in the remaining block and most of the energy demand in
the current EU-28. The EU’s energy policy is evolving with a new package of measures
announced in winter 201677.
The UK has been significant in shaping the direction of EU energy and climate policy in
certain areas. One can speculate that the loss of that voting weight might have some
significant effect in the areas where influence has been felt in the past. We consider the
impact on further market integration, the EU ETS, nuclear policy and renewables subsidy.
There is potential for further integration of both electricity and gas markets across the EU.
This would involve the extension of intra-day trading of electricity and gas across borders.
In electricity, the integration of markets for ancillary services across borders would bring
further benefits, as noted above. Gas markets need to become more efficient across the
EU-27. The UK would undoubtedly have been a key advocate for further market
integration of EU-28 electricity and gas markets. It is unclear how the loss of the UK from
the EU will exactly impact future market developments, but it is difficult to see how the
loss of the UK will speed up improvements in the operation of EU-27 energy markets
relative to continuing membership.
The EU ETS has been advanced by the UK and the UK has been a significant supporter of it
continuing beyond 2020. The UK certainly supported tightening the targets to 2030 and
extending the EU ETS to cover more sectors. Frustration with the lack of tightness of the
EU ETS prompted the UK to introduce an additional carbon tax on fossil fuels for
electricity production in 2013 (the carbon price floor). It seems likely that support for
continuing or extending the EU ETS will be weakened by the UK leaving the EU and the
EU-ETS. If the UK stays in the EU-ETS, its influence on its future development may still be
reduced, and that would also weaken the strength of the mechanism going forward.
Of the large EU countries only France and the UK are actively supporting the continuation
of and new investment in nuclear power. The loss of the UK from the EU will likely
continue to undermine support for nuclear power in the EU-2778, leaving France largely
isolated on the issue. Within the EU-27 only Finland would have a new reactor under
construction. The practical implications of this for nuclear policy are unclear, but the EU
citizenry will be more hostile to nuclear power than it is at moment.
77
https://ec.europa.eu/energy/en/news/commission-proposes-new-rules-consumer-centred-clean-energy-
transition, accessed 15 September 2017. 78
See https://www.imeche.org/news/news-article/new-survey-majority-of-the-public-support-uk-nuclear-
power Accessed 3 November 2017.
171122_CERRE_BrexitEnergy_FinalReport 42/59
The UK has championed limited but competitively allocated subsidies for new renewables.
Indeed, the EU has recently moved away from supporting feed-in-tariffs towards
renewable auctions for subsidy premia. There have been major subsidy cost reductions
observed within the EU-27 (notably Germany’s offshore wind auction which delivered a
zero-subsidy result in the auction79). The use of market-based mechanisms has been
championed by the UK in the face of the need to subsidise new technologies. However,
given the speed of cost reduction in RES technologies and the adoption of auctions within
the EU-27 the immediate impact of the UK leaving in this area may be limited.
From a simple budgetary perspective, the UK will be excluded from energy subsidies and
subsidy payments it might have received or made in the past. Thus the total amount of EU
subsidy money for projects of common interest (PCIs) in energy may be reduced, and the
UK’s ability to qualify for (and receive subsidy for) PCI projects may be reduced.
79
See https://windeurope.org/newsroom/news/1-4-gw-offshore-wind-announced-in-germany-with-zero-
public-financial-support/ Accessed 3 November 2017.

171122_CERRE_BrexitEnergy_FinalReport 43/59
7. Possible negotiating positions of the UK and the
EU-27 on energy
It is important to start the discussion in this section with a statement of the obvious. The
current negotiations are ongoing and it is difficult to discern clearly what the likely
endpoint is on the basis of the current state of the negotiations. This is because as with
any negotiation, nothing is agreed until the final agreement and much of what is said in
the interim reflects what might be desirable for one side, rather than the likely final point
of agreement.
The UK’s basic starting position is that it would like to continue with all of the existing
beneficial trading arrangements that it has with the EU, while the EU’s position is that
leaving the EU must involve some ‘cost’ to the UK and hence business as usual is not its
default option. It is also the case that although there are mutual benefits of the current
trading arrangements in energy, they are relatively much smaller for the EU-27 than they
are for the UK, so the ‘cost’ of punishment in energy, from the point of the EU, is small. It
is possible that, whatever the desirability of reaching agreement to continue with the
current trading arrangements in energy and climate, these may be sacrificed within the
broader Brexit agreement.
Both the UK and the EU have started publishing documents relating to their negotiating
positions and some of these relate to energy. There have also been some UK policy
statements (and notable silences to date) on specific aspects of energy policy. We discuss
what an economically sensible negotiating position might look like rather than focusing on
what the actual position might be.
The UK should continue to seek for a continuation of the current electricity, gas and
carbon trading arrangements. As we have seen these are mutually beneficial and there is
no good economic reason to change them, even if they are themselves something of a
compromise developed over the 44 years of UK membership of the EU. As we noted
above, while they have restricted the UK’s freedom of action over certain aspects of
energy policy, it is not clear that non-membership of the EU would not also have resulted
in compromise on the operation and regulation of joint interconnectors. The current
arrangements involve tariff-free trading of electricity, gas and carbon permits. WTO
maximum tariffs for electricity and gas are €0.05 per MWh and 0.7%. These are levied on
energy imports from Russia.
The UK should therefore seek to remain full members of CEER, ENTSO-E, ENTSO-G and the
EU-ETS and continue participating in the stakeholder negotiations behind the developing
codes and regulations. The UK should also seek to continue to offer unrestricted access to
the ownership of its energy assets.

171122_CERRE_BrexitEnergy_FinalReport 44/59
There are various related deals and actions which might be brokered after the UK leaves
the EU, but which are difficult to take forward before actually leaving the Union. This is
because of the conditions of EU membership and the ‘principle of sincere cooperation’.
These prevent bilateral deals between the UK and third countries being done while the UK
is still an EU member.
The UK could seek a ‘Common Energy Security Treaty’ with various neighbouring
countries with whom it is interconnected. This might govern access to interconnectors
and management of crisis events. However, it is not possible for individual members of
the EU-27 to negotiate on any matters relating to the single market, so it is not clear how
any economically meaningful regional energy security deal could be concluded. The one
exception to this is the case of Ireland, where the UK and the EU-27 have both committed
the maintenance of an open border between Northern Ireland and the Republic of Ireland
and the EU have recently invited the UK to propose ‘a unique solution’ to the general
issues of unrestricted trade and people movement in Ireland.80 This would seem to make
it unlikely that the I-SEM or the current trade flows in electricity and gas within Ireland or
between Ireland and GB will be affected.
The UK might also look to impose border tax adjustment on electricity imports in the
absence of tariff free access to EU electricity and gas markets; given the net trading
position of the EU, this would disproportionately affect EU electricity exporters. However,
given the likely potential for retaliatory border taxes if the UK were to do this, border tax
adjustment, even if desirable in theory, seems unlikely.
The UK government has already announced its intention to exit from the Euratom Treaty
(1957) at the same time as leaving the EU81. This is in line with its desire to remove the UK
from the jurisdiction of the European Court of Justice. This has significant implications for
the freedom of movement of nuclear material and personnel across Europe and impacts
on its ability to participate in the global nuclear industry, due to exiting the trade
agreements between Euratom members and other countries. The UK is seeking a
replacement arrangement82 but in principle this could halt movements of nuclear material
between the UK and France in the absence of a mutually agreed replacement agreement.
The UK and Euratom countries will however remain members of the International Atomic
Energy Agency and subject to its oversight.
The EU-27 published its overall negotiating position on Brexit on 29 April 2017.83 It
reiterated the need for the four freedoms on goods, capital, services and people to be
80
See HM Government (2017b) and European Commission (2017). 81
See
https://www.gov.uk/government/uploads/system/uploads/attachment_data/file/604079/Prime_Ministers_le
tter_to_European_Council_President_Donald_Tusk.pdf, accessed 15 September 2017. 82
See HM Government (2017a). 83
See http://www.consilium.europa.eu/en/press/press-releases/2017/04/29-euco-brexit-guidelines/,
accessed 15 September 2017.

171122_CERRE_BrexitEnergy_FinalReport 45/59
respected for current arrangements to continue. It also stated that ‘nothing is agreed until
everything is agreed’; a future trade arrangement must wait until the terms of leaving are
agreed; the financial settlement is important; bilateral treaties are not allowed between
EU MSs and the UK; a separate agreement on defence and security is possible; and it
reconfirmed its support for the Good Friday agreement in Ireland. Given that an explicit
objective of the UK is to regain control of immigration and end freedom of movement of
workers (violating one of the four freedoms), this implies that some ‘cost’ will be imposed
on the UK and some deviation from the current arrangements is likely in energy.
There has been no explicit mention so far of either side’s position on the electricity, gas or
carbon. However, it is important to say that electricity and gas are integral to the
European single market project and hence what happens on them in the negotiations is
likely to be fully in line with the overall position on the UK’s relationship with the single
market. On carbon, there have been no government statements on the part of the UK to
seek to remain part of the EU ETS. The EU has undertaken two interesting, but conflicting
actions. One is to reanimate the coupling of the EU ETS and the Swiss carbon market
(noted above), thus suggestive of a likely openness to continuing to trade with the UK on
carbon permits. The other, is a plan in the European Parliament to pre-emptively cancel
the outstanding permits of any nation that leaves the EU ETS84. This would have the effect
of not allowing UK holders of permits to sell them in the carbon market ahead of the UK
leaving the scheme and suggests contingency planning for possibility of the UK leaving the
EU ETS.
What will actually happen after Brexit is hard to discern. It is possible for UK private
parties to continue to sign contracts (e.g. National Grid) with EU-based entities after
Brexit. However private entities based in the UK cannot voluntarily sign up to abide by
single market rules and be bound by the ECJ. Bilateral network access arrangements can
continue and evolve after Brexit. This was the situation before the current network code
review process. However private agreements are subject to a potential legal challenge to
the EU party’s signature before the ECJ and to regulatory approval from both sets of
energy regulators. This would mean for instance that an EU party to an agreement (e.g.
between the French transmission system operator, RTE, and Great Britain’s National Grid)
could be challenged. In practice, this has never happened in the case of agreements
between Swiss Grid and other EU network operators. What seems clear is that the UK’s
potential to shape the future market design and network operator arrangements will be
reduced by Brexit.
84
See Jim Brunsden and Alex Barker, Financial Times, ‘EU makes contingency plans to protect carbon market
from Brexit’, 10 September 2017.

171122_CERRE_BrexitEnergy_FinalReport 46/59
8. Outside Energy Options
It is important to explore whether there are any outside options available to the UK or the
EU-27 which strengthen their hand in the energy negotiations, by making it less costly not
to agree to what the other side might want.
On the UK side, it can go ahead with additional electricity integration with Norway and
Iceland without any agreement from the EU. This would certainly allow it to capture much
of any potential energy security value from further interconnection. These would be more
expensive interconnection options due to the distances involved (the current link under
construction to Norway is already the longest subsea electricity cable in the world). In
terms of gas security, it would be possible to negotiate bilateral deals with the US and
Canada for access to LNG from North America. This might reduce the cost of natural gas
coming to the UK (and to the rest of Europe, given the UK’s position as a gas hub).
Overall the UK is in weak position on energy negotiations, with respect to EU-27, due to
their relative impact. This is because the trading benefits are roughly balanced in absolute
terms but the UK is roughly one seventh of the EU-27’s energy demand. However, this is
not true with respect to Ireland, which is a key country on the European periphery. The
UK is in a good position to leverage whatever mutually beneficial arrangements its comes
to with Ireland as a precedent for what happens to its relationships with the rest of the
EU-27. Although the EU has invited ‘a unique solution’,85 it is difficult to see how this
cannot set a legal precedent.
The UK will likely wish to continue accessing skilled labour in the energy sector from the
EU-27.86 However should this become difficult, perhaps due to the withdrawal of EU-27
companies from the UK or a reduced willingness of EU nationals to work in the UK, there
is still a global talent pool in the energy sector from which the UK can benefit. Skills
shortages are a potential issue for specific energy projects: Hinkley C will require a peak of
1800 ‘steel fixers’, of which the UK currently has a total of 2400.
The UK has benefited substantially from collaborative EU research projects in the area of
energy (c. €125m p.a. 2007-13)87. However even if it is forced to exit from future
collaborative projects due to a failure to agree to overall participation in EU research
projects, it could reorient its energy research collaboration towards the US, China and
Japan who already spend 2.5 times more than the EU OECD excluding the UK on public
RD+D on energy.
85
European Commission (2017, p.2). 86
The UK does have a significant number of EU engineers in its workforce (Royal Academy of Engineering,
2016), but energy is not one of the most heavily EU dependent sectors (Migration Advisory Committee
Secretariat, 2010). 87
See The Royal Society (2015) and HM Government (2017c).

171122_CERRE_BrexitEnergy_FinalReport 47/59
Should EU companies no longer wish to own assets in the UK, there would seem to be no
shortage of non-EU investors (both utility and non-utility) who would wish to buy them.
The ownership of the UK gas and electricity sectors is already very diverse. French and
German ownership of assets in the UK energy industry (via EdF, E.ON and RWE) is very
significant and hence they have a strong vested interest in the continuation of the current
arrangements. They significantly rely on current and future UK government contracts,
most significantly the Hinkley C contract with EdF (itself 84.5% owned by the French
government). These companies have a strong incentive to lobby their governments for
ways to facilitate continuation of frictionless trade and solutions to continuing UK
involvement in freedom of movement of nuclear material etc.
On the EU ETS, the UK could either set up its own trading system and/or join an existing
scheme in North America, e.g. RGGI in the North Eastern US, or the California-Quebec
scheme. If it were to set up its own scheme, the UK government could still maintain a
private trading link with the EU ETS (any qualifying private party can set up a trading
account). A wholly national scheme would have the advantage of having the potential of
greater coverage and higher prices than the existing EU ETS. However, coupling with
North America would raise its own jurisdictional issues and potentially restrict freedom of
action in other ways in the future.
On the part of the EU-27, the UK is, for the most part, a peripheral country in terms of
energy. Norwegian gas and electricity can be accessed directly if necessary. Ireland has
recently reopened its investigation of the feasibility of electricity interconnection with
France and EU support for an LNG import terminal88. These are expensive outside options,
but with EU support under the PCI framework they could be made viable for Ireland. This
would remove the ability of UK to use Ireland as a precedent for what happens in its wider
negotiations. The EU-27 could move to make use of the EU ETS’s market stability reserve
mechanism to remove more excess permits from the carbon market in the event of the
UK leaving the carbon market.
88
The Irish Government is concerned about the impact of Brexit on its energy security (see Irish Government,
2017, p.38). For a discussion of Irish energy policy post-Brexit, see Lynch (2017).

171122_CERRE_BrexitEnergy_FinalReport 48/59
9. Possible models of non-EU membership for the
UK & their implications for energy
While we have already discussed specific policy implications of Brexit above, it is useful to
think about overarching frameworks for future UK – EU27 relations and how these relate
to energy. We discuss five models of non-EU membership and how they might impact on
UK-EU energy relations.89
The UK could remain a member of the European Economic Area (EEA). This is the ‘Norway
model’ and involves full access to the single market including European electricity and gas
markets. This would involve no change to the current arrangements, but as detailed
above this does not involve membership of ACER and reduces the UK’s role to taker of EU-
27 rules. The Norway model has currently been ruled out by the UK government because
it does mean accepting the four freedoms, including freedom of movement of people.
One point to note is that non-EU EEA members are subject to the jurisdiction of the EEA
court in the event of disputes, providing a way of exiting from the oversight of the ECJ,
while paradoxically accepting the jurisdiction of another international court.
The UK could rejoin the European Free Trade Area (EFTA). The UK was a member
immediately before it joined the EU. Both Norway and Switzerland are EFTA members.
EFTA membership would put the UK in the position of Switzerland and so would probably
guarantee continuation of the current arrangements, but freeze them at the date of
leaving the EU and make them subject to continuing bilateral negotiations.
The UK could join the European Energy Community which includes EU and candidate
countries (e.g. Albania) seeking to harmonise their energy market arrangements with
those of the EU. This arrangement is focused on South East Europe and is specific to
candidate countries. It would not seem to offer a way forward for the UK, which is leaving
the EU.
The UK could remain in a customs union with the EU (like Turkey). This means that the
level of tariffs it imposes is harmonised with that in the EU. The problem here is that it
prevents the UK signing trade deals with third party countries to lower tariffs below those
already agreed with the EU. This arrangement would avoid the imposition of WTO level
tariffs on imports of electricity and gas (and on energy equipment) should that be a
possibility.
Finally, the UK could seek a separate Free Trade Agreement with the EU on energy. The
EU is already party to the 1994 Energy Charter Treaty which does regulate trade between
signatories. The UK could seek some protection from punitive tariffs, especially on energy
89
See Froggatt et al. (2017) for a discussion of models of non-EU membership and energy.

171122_CERRE_BrexitEnergy_FinalReport 49/59
equipment, through being a separate signatory to this Treaty. The Energy Charter Treaty
does provide a dispute arbitration mechanism between members.
None of these arrangements would seem to ideally fit the size and significance of the UK
and its current relations with the EU-27. If the UK were to join EFTA, it could substantially
increase its significance and might lead to a closer and more significant relationship
between EFTA and the EU going forward.

171122_CERRE_BrexitEnergy_FinalReport 50/59
10. Conclusions
It is straightforward to see that both the UK and the EU-27 benefit substantially from
mutual participation in the current electricity, gas and carbon market arrangements. They
also rely on being part of an integrated electricity and gas transmission system for energy
security. There are no easy alternatives to a continuation of the current arrangements on
energy and climate.
However, the UK is less exposed to changes in its relationships with the EU in energy than
in other sectors. The UK is a net energy exporter to the EU-27 and has relatively little
exposure to EU energy markets. Energy costs in the UK are already several times more
sensitive to changes in domestic energy policy. Our modelling focused on the effects on
markets in the northern EU-27. This shows the price impact and overall welfare impact of
any likely reduction of trade in electricity and gas is small in relation to the size of the
sector. Such impact will likely drive up wholesale prices in the EU-27 for electricity and for
gas and drive them down in the UK, while reducing energy security for both parties. Trade
reduction hurts interconnector owners, while higher prices benefits generators / gas
suppliers in the EU-27. Slower demand growth effects and exchange rate effects (due to
Brexit related macroeconomic slowdown in the UK) have the potential to be more
significant for UK wholesale prices.
The UK can largely continue to mirror changes in EU regulations and codes via industry
bodies such as ENTSO-E, ENTSO-G and Coreso, and possibly via the regulatory body, CEER,
after leaving the EU. However, its influence will be reduced by losing its membership
status of ACER (though it might continue as an observer on some issues) and exclusion
from the work of the European Commission itself. It is currently unclear how its
relationship with the EU ETS will change.90
The opportunities of Brexit for the UK are that it can rationalise its internal energy policy,
redesign its wholesale and ancillary services markets for high renewables penetration and
seek outside integration opportunities with Norway, Iceland, Ireland (with whom the EU-
27 will likely allow a special arrangement) and North America.
As with all other aspects of Brexit, the loss of EU obligations in its energy policy could
expose the UK to more domestic policy volatility. A future UK government could now
more easily abolish its independent regulator, Ofgem, and reintroduce energy price caps,
than before. These possibilities continue to be actively discussed in the UK.
The EU-27 has relatively little exposure to the loss of integration benefits with the UK,
apart from via Ireland, where only expensive outside options exist. The loss of the UK
from the EU seems likely to increase support for a renewable subsidy led ‘Energiewende’
90
See Lockwood et al. (2017) for a discussion of the trade-off between being a member of the single energy
market and loss of influence over policy.

171122_CERRE_BrexitEnergy_FinalReport 51/59
with reduced emphasis on market-based decarbonisation, and a likely increase in the use
of coal for power generation in parts of eastern Europe. The loss of the UK’s voting weight
on energy issues will likely mean energy policy will be more hostile towards nuclear, the
EU ETS and fully market-based solutions, all things championed by the UK.

171122_CERRE_BrexitEnergy_FinalReport 52/59
References
ACER (2015), Market Monitoring Report 2015, Agency for the Cooperation of European
Energy Regulators.
Aurora Energy Research (2016), Brexit – implications for UK energy, available at:
https://www.auroraer.com/wp-content/uploads/2016/10/Aurora-overview-of-potential-
Brexit-and-implications-for-UK-energy.pdf (Accessed July 2017)
Bergman, L., Doyle, C., Newbery, D., Regibeau, P. and von der Fehr, N. and Pollitt, M.
(1999) Monitoring European deregulation: vol.2: A European market for electricity?
London: Centre for Economic Policy Research.
Boasson, E.L. and Wettestad, J. (2013), EU Climate Policy : Industry, Policy Interaction and
External Environment, Farnham: Ashgate.
Chyong, C.K. and B.F. Hobbs (2014). Strategic Eurasian Natural Gas Market Model for
Energy Security and Policy Analysis: Formulation and Application to South Stream. Energy
Economics, Vol. 44, pp. 198–211. Available at:
http://dx.doi.org/10.1016/j.eneco.2014.04.006.
[CCC] Committee on Climate Change (2015). The Fifth Carbon Budget. (October) London:
Committee on Climate Change.
Cottier, T., Malumfashi, G., Matteotti-Berkutova, S., Nartova, O., De Sepibus, J. and
Bigdeli, S.Z. (undated), Energy in WTO law and policy,
https://www.wto.org/english/res_e/publications_e/wtr10_forum_e/wtr10_7may10_e.ht
m, accessed 15 September 2017.
BEIS (2016), Updated Energy and Emissions Projections 2016, available at:
https://www.gov.uk/government/uploads/system/uploads/attachment_data/file/599539
/Updated_energy_and_emissions_projections_2016.pdf (accessed July 2017)
BEIS (2017), Annual Statement on Emissions, London: Department for Business, Energy
and Industrial Strategy.
Brophy Haney, A., Jamasb, T. and Pollitt, M.G. (2011), ‘Smart metering: technology,
economics and international experience’, In: Jamasb, T. and Pollitt, M.G. (eds.) The future
of electricity demand: customers, citizens and loads. Cambridge: Cambridge University
Press, pp.161-184.
Dale, L. (2016), The IEM Integration Process, presentation to EPRG Workshop on
‘Implications of Brexit for UK and EU Energy and Climate Policy’, 6 September 2016.
Department of Energy and Climate Change (2017), Digest of UK Energy Statistics 2017
[DUKES], London: TSO.

171122_CERRE_BrexitEnergy_FinalReport 53/59
European Network of Transmission System Operators for Gas (ENTSO-G) (2015), Ten Year
Network Development Plan 2015. Available at:
https://www.entsog.eu/publications/tyndp (accessed July 2017)
European Commission (2014), Cost-benefit analyses & state of play of smart metering
deployment in the EU-27, Brussels: European Commission.
European Commission (2017), Dialogue on Ireland / Northern Ireland, 6 September 2017,
TF50 (2017) 15 – Commission to EU 27, European Commission.
European Union (2016), EU Energy in Figures, Statistical Pocketbook 2016, Brussels:
European Union.
Froggatt, A., Wright, G., Lockwood, M. (2017), Staying Connected Key Elements for UK–
EU27 Energy Cooperation After Brexit, The Royal Institute of International Affairs,
Chatham House.
Hepburn, C. and Teytelboym, A. (2017), ‘Climate change policy after Brexit’, Oxford
Review of Economic Policy, 33 (S1): S144-154.
HM Government (2017a), Nuclear Materials and Safeguards Issues Position Paper,
London: HM Government.
HM Government (2017b), Northern Ireland and Ireland Position Paper, London: HM
Government.
HM Government (2017c), Collaboration on Science and Innovation Position Paper,
London: HM Government.
HM Treasury (2016), Autumn Statement 2016, London: HM Treasury.
International Energy Agency (2015), World Energy Outlook 2015. Paris
International Energy Agency (2016), World Energy Outlook 2016. Paris
International Energy Agency (2016), Natural Gas Information 2015. Paris
Irish Government (2017), Ireland and the negotiations on the UK’s withdrawal from the
European Union, The Government’s Approach, May 2017, Irish Government Publication.
Jamasb, T. and Pollitt, M. (2005) ‘Electricity market reform in the European Union: review
of progress toward liberalization and integration’, The Energy Journal, 26(Special Issue):
11-41.
Jamasb, T., Nuttall, W.J., Pollitt, M.G. and Maratou, A. (2008), ‘Technologies for a low-
carbon electricity system: an assessment of the UK's issues and options’, In Grubb, M.,
Jamasb, T. and Pollitt, M.G. (eds.): Delivering a low carbon electricity system. Cambridge:
Cambridge University Press, pp.64-99.

171122_CERRE_BrexitEnergy_FinalReport 54/59
Keisling, L.L. (2009), Deregulation, Innovation and Market Liberalization, Oxford:
Routledge.
Lockwood, M., Froggatt, A., Wright, G. and Dutton, J. (2017), ‘The implications of Brexit
for the electricity sector in Great Britain: Trade-offs between market integration and
policy influence’, Energy Policy, 110 (November): 137-143.
Lynch, M. A. (2017), Re-evaluating Irish energy policy in the light of Brexit, ESRI Research
Note.
Migration Advisory Committee Secretariat (2010), Which sectors and occupations use
more immigrant labour and what characterises them? A quantitative analysis, Working
Paper, November 2010.
NAO (2016), Controlling the consumer-funded costs of energy policies: The Levy Control
Framework, Report by the Comptroller and Auditor General, London: National Audit
Office.
Newbery, D.M., Strbac, G. and Viehoff, I. (2016), ‘The benefits of integrating European
electricity markets’, Energy Policy, Vol. 94: 253–263.
Newbery, D.M, Pollitt, M.G., Ritz, R.A. and Strielkowski, W. (2017), Market design for a
high-renewables European electricity system, EPRG Working Paper No.1711.
National Grid (2017), The Case for Mutual Cooperation between the EU and the UK on
Energy Matters Post-Brexit, National Grid.
OBR (2016), Economic and Fiscal Outlook November 2016, London: Office for Budget
Responsibility.
Oxera (2016), Brexit: Implications for the GB Electricity Market, available at:
https://www.oxera.com/getmedia/dfc412a5-61cf-4031-934e-792969f9659c/Impact-of-
Brexit-2016-06-10.pdf.aspx?ext=.pdf (Accessed July 2017)
Parail, V. (2009), Can Merchant Interconnectors Deliver Lower and More Stable Prices? The
Case of NorNed, EPRG Working Paper No.0926.
Pollitt, M.G. (2017), ‘The economic consequences of Brexit: energy’, Oxford Review of
Economic Policy, 33 (S1): S134-143.
Pollitt, M.G. (2016), A Global Carbon Market?, EPRG Working Paper No.1608.
Pollitt, M. and Anaya, K., (2016), ‘Can current electricity markets cope with high shares of
renewables? A comparison of approaches in Germany, the UK and the State of New York’,
The Energy Journal, Volume 37, Bollino-Madlener Special Issue: 69-88.
Pollitt, M.G. (2009), Electricity Liberalisation in the European Union: A Progress Report’,
EPRG Working Paper, No. 0929.

171122_CERRE_BrexitEnergy_FinalReport 55/59
Pollitt, M. (2010), ‘UK renewable energy policy since privatisation’, In: Mozelle, B., Padilla,
J. and Schmalensee, R. (eds.), Harnessing renewable energy in electric power systems:
theory, practice, policy. Washington DC: RFF Press, pp.251-282
Pollitt, M. (2012), ‘The Role of Policy in Energy Transitions: Lessons from the Energy
Liberalisation Era’, Energy Policy, 50, November: 128-137.
Pollitt, M.G. (2016), An Evaluation of EU Energy and Climate Policy, presentation to The
Single Market at 25 Conference, 30 January 2016.
Pototschnig, A. (2015), Overcoming the Obstacles to the Completion of European Energy
Market, presentation to European Court of Auditors, 5 May 2015.
REN21 (2017), Renewables 2017 Global Status Report, Paris: REN21.
Royal Academy of Engineering (2016), Engineering A Future Outside the EU – securing the
best outcome for the UK, London: Royal Academy of Engineering.
The Royal Society (2015), UK Research and the European Union: The Role of EU in funding
UK Research, London: The Royal Society.
Sioshansi, F.P. (2016), ‘What is the Future of the Electric Power Sector?’, In Sioshansi, F.P.
(ed.), Future of Utilities - Utilities of the Future: How Technological Innovations in
Distributed Energy Resources Will Reshape the Electric Power Sector, London: Academic
Press, pp.3-24.
Vivid Economics (2016), The impact of Brexit on the UK energy sector, available at:
http://www.vivideconomics.com/wp-content/uploads/2016/03/VE-note-on-impact-of-
Brexit-on-the-UK-energy-system.pdf (Accessed July 2017)
World Bank and Ecofys (2017), Carbon Pricing Watch 2017. Washington, DC: World Bank.

171122_CERRE_BrexitEnergy_FinalReport 56/59
Annex 1 – Gas and Electricity Market Models
In order to analyse the possible impact of Brexit and in particular reduced capacity to
trade gas and electricity between the UK and Europe, we used gas and electricity market
simulation models. We outline a basic description of the gas and electricity models in
turn.
Global Gas Market Model
The gas model examines and analyses the interaction of supply and demand on a daily
basis at a global scale. On the supply side, the model includes all the main gas producing
countries, such as Russia, Norway, Qatar, Australia, Algeria and other producing regions
such as North America, Central and South America, the Middle East, Central Asia and so
on. The model therefore covers all existing gas producers in the world. On the demand
side, the model covers all existing consuming countries and regions, such as GB,
Continental European markets, Russia and other countries of the Former Soviet Union,
China, India, North America, the Middle East and so on.
To match demand with supply, the model also covers the entire gas value chain from
production regions down to the transmission level. Therefore, it captures various gas
infrastructure assets such as pipelines, LNG facilities and gas storage facilities. It is an
economic and optimisation model and therefore does not include some real-world
characteristics of gas infrastructure (such as pressure drop in gas pipelines, management
of linepack, gas quality limits, etc.). In this model, two main parameters characterise gas
infrastructure assets and differentiates between them – physical capacities and the unit
cost for utilising those assets.
Given the inputted cost structure and capacities for these infrastructure assets, the
objective of the model is to find a least cost solution to meet global demand taking into
account various physical constraints, such as gas production capacities, transmission
network capacities, LNG liquefaction and send-out capacities, storage injection,
withdrawal and maximum working volume capacities, as well as minimum and maximum
daily demand profiles and contractual obligations (e.g. annual contract quantity and
minimum take-or-pay).
The outputs from the model are projections of supply, demand, equilibrium prices,91
pipeline and LNG flows, storage injection and withdrawal at daily resolution. In other
words, the model approximates the operations of day-ahead gas markets. The model
considers all existing cross-border interconnection points in Europe, as well as
disaggregating European demand regions into individual markets according to their
national borders (EU28). This resulted in around 1,320 pipeline connections (or ‘arcs’) in
91
The notion of ‘equilibrium’ prices simply means that prices are determined at the intersection of demand
with supply.

171122_CERRE_BrexitEnergy_FinalReport 57/59
total. The physical capacities of these interconnection points were taken from ENTSO-G’s
2015 capacity map,92 whereas their entry and exit charges were taken from ACER’s most
recent market monitoring report.
Key assumptions
Since the model was run for a future year (2025/2026), expected gas demand and
infrastructure capacities were taken from IEA’s 2016 World Energy Outlook (2016) and
ENTSO-G’s 2015 Ten Year Network Development Plan, or TYNDP (2015). In particular, new
cross-border capacities and LNG regasification capacities in the EU were added in the
model based on their final investment decision (FID) status – those projects which took
FID as outlined in ENTSO-G's 2015 TYNDP report were added into the model with start
time and capacities as reported by these projects. All existing storage sites are aggregated
to regional/country level. New storage capacities are also taken into account according to
their FID status (as reported in ENTSOG’s 2015 TYNDP).
The model also takes into account all LNG projects that took FID before 2016, such as
those from Australia or the USA. Where information about future infrastructure capacities
are not publicly available, such as the majority of non-EU gas infrastructure (pipelines,
LNG and storage facilities), we rely on capacities taken from another long-term gas
capacity expansion model with annual time resolution to 2035.93 The capacity expansion
model is a partial equilibrium model that only takes into account the interaction of
demand and supply for natural gas and hence, such issues as inter-fuel competition (e.g.
coal-gas-oil switching) and income effect (e.g. GDP growth and total energy demand) and
how they may alter demand for natural gas is not explicitly modelled (in the manner that
general equilibrium models would do).94
Thus, to overcome this shortcoming the capacity expansion model was calibrated to run
based largely on IEA’s World Energy Outlook 2015 ‘450/CPS’ scenarios to account for
high-level energy policies and general equilibrium effects (i.e. inter-fuel competition,
income effect etc.). Marginal supply cost curves are derived from publicly available
information for the last ten years, as well as proprietary information obtained from gas
industry stakeholders.
All other assumptions related to physical capacities of existing infrastructure assets were
obtained from IEA’s World Energy Outlook 2015, IEA’s (2016) Natural Gas Information
2015, or from the official sources of owners of those infrastructure assets.
92
Capacity map version May 2015, available at: http://www.entsog.eu/maps/transmission-capacitymap
(accessed March 2016). 93
A detailed description of an earlier version of the long-term gas market model without investment decisions
can be found in Chyong and Hobbs (2014). 94
The drawback of using general equilibrium models for analyses of gas pipeline competition issues is that
these models are aggregated at a high level, representing entire regions and not necessarily representing the
gas network in sufficient detail.

171122_CERRE_BrexitEnergy_FinalReport 58/59
It is also important to note that the entry and exit charges that were used for the
European network (taken from ACER) in the model are annual tariffs, hence flow patterns
from the model should be treated as annual contracted flows, adjusted for daily
fluctuations in supply and demand conditions. In reality, there are different transportation
products (e.g. daily, monthly) with corresponding tariff structures which may (or may not)
result in additional flows for some entry and exit points in Europe. Furthermore, when
running the model for future years, it is implicitly assumed that the relative cost structure
of gas networks in Europe, and hence their tariffs for entry and exit points, stay at the
current level.
Also, it is worth mentioning that the European pipeline network in the model does not
take into account the differences between high- and low-calorific gas, and therefore some
of the physical constraints resulting from such differences are not captured in the network
flow. However, it is understood that conversion facilities between high and low-calorific
gas are in place at the majority of the interconnection points of the two systems (e.g. in
the Netherlands), so these differences may have a limited impact on the flows from the
model.
Finally, daily gas demand profiles are the average of daily gas demand in the last 5 years
and hence, the impact of weather on gas demand in future years is assumed to be the
average impact witnessed in the last 5 years. The model was run for one and a half years
or 546 days starting from 1 January 2025. Since the model determines storage injection
and withdrawal profiles based on the cost structure of the assets in the model, together
with supply and demand conditions, at the beginning of each model run it was assumed
that all storages are half-full, reflecting that 1 January is roughly the mid-point through
the winter season.
UK Unit Commitment Electricity Market Model
The model has a detailed representation of all existing generation units in the UK which
are connected to the transmission level. It captures major supplies of electricity in the UK
at unit level. This includes:
1. Biomass plants
2. CCGT plants
3. Coal plants
4. Peaking plants
5. Nuclear
6. Pump storage facilities
7. All existing interconnectors
It has detailed representation of most power engineering constraints:
171122_CERRE_BrexitEnergy_FinalReport 59/59
1. Ramp up and ramp down of thermal units
2. Minimum up and down time of thermal units
3. Operating reserve and system demand constraints
4. Pump storage charge and discharge as well as maximum and minimum energy
storage level
5. Interconnection capacity and flows
The model has hourly resolution and is setup to meet hourly load, less intermittent
generation. Interconnector flows are modelled explicitly in the model using market prices
in Europe and Ireland as marginal prices for import flows to the UK. The model is a
‘copper plate’ model but transmission network and balancing charges could be applied in
the model. This reflects actual market operations from generators’ point of view. We ran
this unit commitment model for the year 2025 assuming:
1. Decommissioning of all coal plants in the UK by 2025 (in line with policy
announcements in the UK).
2. The total annual demand does not change between 2015 and 2025 because there
is an expectation that underlying demand growth will be offset by greater energy
efficiency (see CCC, 2015; BEIS, 2016). Thus, total electricity demand remains at 336
TWh/year and we use the same demand profile as in 2015.
3. We also assume that the annual wind generation profile in 2025 is similar to 2015
and hence we use the latter one and scale up the projected increase in wind and
solar capacity in 2025 (based on BEIS 2016 projection) to arrive at total renewables
generation.