brenna walraven, managing director, usaa real estate ... · capital & regional crm fund 57 51...
TRANSCRIPT
Expert Panel
Brenna Walraven Managing Director
USAA Real Estate Company
1

Who is USAA Real Estate Company?

Why is Energy So Important?
Total Expense Ratios (Utilities = 21%)
Fixed Expenses
34%
Administrative
11%
Security
6%
Roads/Grounds
2%
Utilities
21%
Repairs/Maintenance
15%
Cleaning
12%
Data based on 2011
BOMA EER
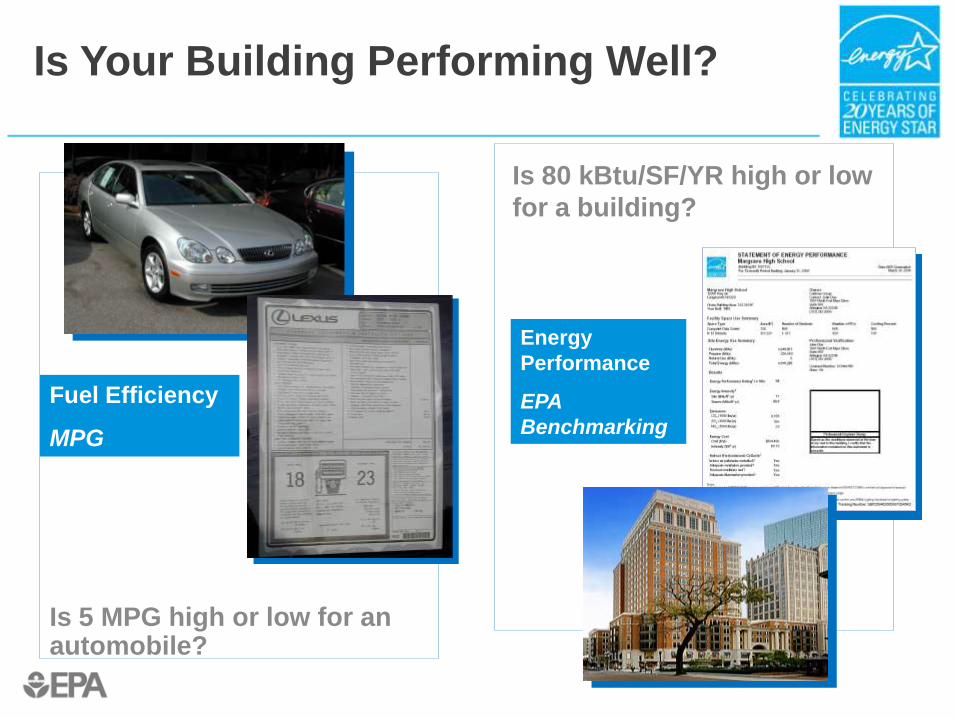
Is Your Building Performing Well?
Is 80 kBtu/SF/YR high or low
for a building?
Energy
Performance
EPA
Benchmarking
Fuel Efficiency
MPG
Is 5 MPG high or low for an automobile?

Why Efficiency? • The market is clearly moving
towards improved sustainability
• Evidence is clear
• There is increased risk to not move towards improved efficiency
• Competitive advantage for those that can connect energy efficiency and the Business Case…

Evidence of Shift
• Top corporations increasingly require green – including the GSA, largest tenant in the US, requiring Energy Star and LEED for all new facilities
• Increased product choices for sustainability – not just for buildings but for everything from hybrid cars to solar power
• Green Building Codes – new construction will increasingly be greener and much more energy efficient
• Federal, State and Local legislation – increasingly requiring or incentivizing green
• Top investors, both foreign and domestic, increasingly are asking how their real estate is being run with respect to energy efficiency, sustainability and carbon.

Energy Star
Use in Benchmarking Programs

Global Real Estate Sustainability Benchmark
Global environmental performance leaders (unlisted)
Rank Company/manager Fund name Management and policy
Implementation and measurement Total
UK
1. Capital & Regional CRM Fund 57 51 53
2. PRUPIM M&G Property Portfolio 57 49 52
3. Grosvenor Grosvenor Shopping Centre Fund 43 43 43
Continental Europe 1. ING REIM Dutch Office Fund 52 43 47
2. ING REIM ING RPFI 70 29 45
3. Pramerica Real Estate TMW Immobilien Weltfonds 52 37 43
USA 1. Principal [anonymous] 57 51 53
2. USAA Real Estate Company USAA Real Estate Funds (overall) 52 44 47
3. Normandy Real Estate Partners Normandy Real Estate Funds (overall)
61 31 43
Australia 1. GPT Funds Management GPT Wholesale Office Fund 87 86 86
2. Investa Investa Commercial 91 80 84
3. GPT Funds Management GPT Wholesale Shopping Centre Fund
87 54 67
Asia 1. CapitaLand CapRet China Incubator 61 51 55
2. Lend Lease Property Investment Services APIC II 74 33 49
3. ING REIM Korea ING Korea Fund 65 34 47

Business Case
• Take a more strategic view
• Consider not just costs
• Consider the full value proposition • Lower operating costs
• Improve tenant comfort – increase retention
• Support tenant employee recruitment and retention efforts
• Be ahead of regulation and mandates – mitigate risk
• Marketing advantage
• Branding as a leader
• Sustainability will increasingly be a measure of quality

Technology Doesn't Always Equal Performance...
0%
25%
50%
75%
100%
VA
V
EM
S
Econom
izer
VSD
s
Motion S
ensors
Energ
y A
udit
ENERGY STAR 1999 -
2001
61.4 kBtu/ft2/yr
CBECS Average
106.7 kBtu/ft2/yr
CBECS
Top 25%
51.4 kBtu/ft2/yr
CBECS
Bottom 25%
226.3 kBtu/ft2/yr

Proving the Value Case Studies

Energy Efficiency is a Potential Leading Indicator of Overall
Superior Operations Quality and Financial Performance
Occupancy Rates
82%
83%
84%
85%
86%
87%
88%
89%
90%
91%
2005 2q 2007 3q
Energy Star Non-Energy Star
Direct Rental Rates
$24
$25
$26
$27
$28
$29
$30
$31
$32
2005 2q 2007 3q
Energy Star Non-Energy Star
Analysis conducted by the CoStar Group of ENERGY STAR buildings compared to peer set
of non ENERGY STAR buildings.

USAA Real Estate Investment Portfolio
100%
95%
90%
Portfolio Occupancy 85%
80%
75%
100%
95%
Tenant Retention 90%
Based on Square Footage 85%
80%
75%
100%
95%
Tenant Satisfaction Results Measured by Annual Survey
90%
85%
80%
75%
91.8% 92.9%
94.1% 93.4% 94.9%
91.5% 92.3%
86.7% 87.2%
90.2% 89.9%
2002 2003 2004 2005 2006 2007 2008 2009 2010 2011 2012
98.5% 98.8% 99.1% 98.1% 97.6% 98.0%
96.9% 98.0% 97.5%
99.6% 99.7%
94.1%
96.8% 97.6%
93.6%
90.8%
96.7%
98.5% 97.6%
99.2% 98.9% 97.9%
2002 2003 2004 2005 2006 2007 2008 2009 2010 2011 2012
91.3% 10 year average
96.5% 10 year average
98.3% 10 year average
2001 2002 2003 2004 2005 2006 2007 2008 2009 2010 2011

What is the Business Case? = Quantify Value
LEED EBOM Platinum
FBI Chicago
Field Office
Chicago, Illinois
Building is four years old
Was not developed green
Metrics thus far on our execution…
• Energy Star Labeled - Improved energy
performance & Energy Star rating from 78
to 95 (22% improvement)
• Reduced water consumption by 43%
saving over $12k annually
• Achieved LEED for Existing Buildings
Operations & Maintenance – Platinum – first EBOM Platinum in world
• Overall efforts have this building under
year one budget by 18.7% or over
$460,000
All of these combine to lower expenses by
more than it costs to implement “sustainable
strategies”
14
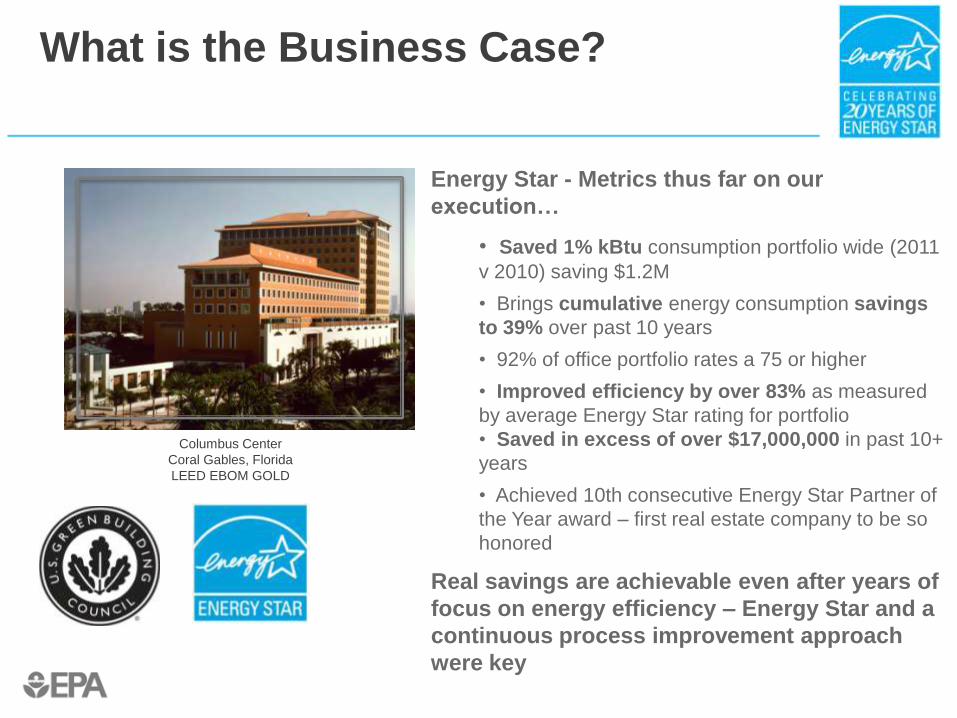
What is the Business Case? = Quantify Value
Columbus Center Coral Gables, Florida LEED EBOM GOLD
Energy Star - Metrics thus far on our
execution…
• Saved 1% kBtu consumption portfolio wide (2011
v 2010) saving $1.2M
• Brings cumulative energy consumption savings
to 39% over past 10 years
• 92% of office portfolio rates a 75 or higher
• Improved efficiency by over 83% as measured
by average Energy Star rating for portfolio
• Saved in excess of over $17,000,000 in past 10+
years
• Achieved 10th consecutive Energy Star Partner of
the Year award – first real estate company to be so
honored
Real savings are achievable even after years of
focus on energy efficiency – Energy Star and a
continuous process improvement approach
were key