breath alcohol sampling simulator (bass) for qualification ... · leferenc® rvitjb publi-cations...
TRANSCRIPT
Leferenc®rvitJb
Publi-
cations
NBS Special
Publication
480-41NAT'L INST. OF STAND & TECH
Breath Alcohol SamplingSimulator (BASS) for
Qualification Testing ofBreath AlcoholMeasurement Devices
Law EnforcementEquipmentTechnology
U.S. DEPARTMENT OFCOMMERCENational Bureau ofStandards
-QC
IQO
.U57
NO. 480-41
1981

r
NBS Special Breath Alcohol SamplingPublication
480-41
KATIOJtAL BUREAUor wtAtWAMua
UBBART
JUL 9 1981
/lot (h
Simulator (BASS) for .^^ /
Qualification Testing of v^^^
Breath AlcoholMeasurement Devices
by
A. Flores
Transportation Systems Center
Cambridge, MA 02142and
L. K. Eliason and Y. C. WuCenter for Consumer Product Technology
National Bureau of Standards
Washington, DC 20234
prepared for the
National Highway Traffic Safety Administration
U.S. Department of Transportation
Washington, DC 20590
Issued July 1 981 U.S. DEPARTMENT OF COMMERCEMalcoinn Baldrige, Secretary
NATIONAL BUREAU OF STANDARDSErnest Ambler, Director
Library of Congress Catalog Card Number: 81-600075
National Bureau of Standards
Special Publication 480-41Nat. Bur. Stand. (U.S.), Spec. Publ. 480-41, 31 pages
CODEN: XNBSAV
U.S. GOVERNMENT PRINTING OFFICE
WASHINGTON, DC: 1981
For sale by the Superintendent of DocumentsU.S. Government Printing Office, Washington, DC 20402Price $2.50
(Add 25 percent for other than U.S. mailing.)
FOREWORD
The National Highway Traffic Safety Administration (NHTSA) is engaged in a continuing effort
to fulfill the objectives of the Highway Safety Act of 1968. To this end, NHTSA has implemented the
development of Qualified Products Lists (QPL) for breath alcohol analysis instruments, and is
pursuing the development of a QPL for speed measuring devices. In this effort, it is receiving tech-
nical support from the National Bureau of Standards' Law Enforcement Standards Laboratory
(LESL), whose overall program involves the application of science and technology to the problems of
crime prevention, law enforcement equipment, and criminal justice.
LESL is assisting the NHTSA Alcohol Countermeasures Program by the development of per-
formance standards for the variety of instruments used to measure the blood alcohol content from
breath samples of suspected drunken drivers, and through related research.
Among the tasks being performed by LESL for NHTSA are the preparation and publication of
technical reports on the results of its researches. This document is one such report.
Technical comments and suggestions are invited from all interested parties. They may be
addressed to the authors, or the Law Enforcement Standards Laboratory, National Bureau of
Standards, Washington, DC 20234.
Lawrence K. Eliason, Chief
Law Enforcement Standards Laboratory
iii

CONTENTS
Foreword
Executive Summary ^-
1. Introduction j
2. Parameters to be Modeled by a Sample Simulator 2
3. BASS Design Objectives ^
Temperature ^
Volume and Time ^
Flow Rate and Pressure
Alcohol Concentration ^4. TSC Breath Alcohol Sampling Simulator ^
Design Approach
Assembly and Operation (j
Determination of Sampling Parameters 12Concentration-Time Profile \2
Pressure, Volume, and Rate of Delivery I7
5. Conclusions and Recommendations 24Appendix A—References 25
V

EXECUTIVE SUMMARY
The U.S. Department of Transportation (DOT) Alcohol Countermeasures Program was
established by authority of the Highway Safety Act of 1968 in an effort to remove the drunken
driver from our Nation's roadways. State and local governments participating in this program
utilize evidential breath testers as a convenient means of measuring the blood alcohol content
(BAG), of individuals suspected of drunken driving, for later use as evidence in the prosecution of
those individuals whose BAG exceeds statutory limits. The National Highway Traffic Safety
Administration (NHTSA) encourages State and local government participation in the
countermeasures program, permitting Federal funds from the program to be used to purchase
breath alcohol instrumentation, provided that the equipment is selected from the NHTSAQualified Products List.
The analysis of the ethanol concentration of a suspect, displayed in units of BAG, is
accomplished using a sample collected from a single breath that the accused delivers to the
instrument. The physiological characteristics of humans vary widely from one individual to
another. Since the BAG of a suspect is measured from a single breath, the differences in the
respiratory system of the individuals that comprise the driving population are of critical
importance to the design of breath alcohol instruments, for an accurate analysis requires a sample
that is essentially "deep lung" or alveolar air.
This report describes a Breath Alcohol Sample Simulator (BASS) that was developed by the
DOT Transportation Systems Genter in cooperation with the National Bureau of Standards' Law
Enforcement Standards Laboratory to provide an objective, reproducible mechanical substitute for
human subjects in the evaluation of the performance of the breath sample collecting systems of
breath alcohol instruments. Prior to undertaking the design of BASS, the results of earlier studies
involving drinking human subjects were reviewed to analyze the relationship of the ethanol
concentration in a single breath (exhalation) as a function of time. These data were expanded upon
during the current laboratory research with non-drinking human subjects in a series of
experiments using individuals with a range of vital capacities and respiratory capability. The
concentration of GO2 as a function of exhalation time for single breath samples was monitored for
each subject when blowing into three tubes of different flow resistance, which approximated the
range of resistance offered by commercially available evidential breath testers. These data,
combined with statistical data on the range of vital capacities of the U.S. driver population, serve
to establish the parameters that must be controlled in order to insure that the BASS can reproduce
the extremes of single breath exhalations.
Each of the essential parameters that must be controlled to produce a substitute for human
breath is discussed, and the capability of the BASS to achieve that degree of control is described,
together with the detailed design and operating characteristics of BASS. Data are presented that
establish the need for a three-segment ethanol vapor concentration profile, in which the time and
volume are controlled to produce a continuous sample that will allow the sample collection system
of breath alcohol analysis systems to be evaluated. Three specific BASS delivery cycles are
recommended that include the range of vital capacities and flow rates, encountered in the driving
population, which must be accommodated by an evidential breath tester to insure that the analysis
of BAG is accomplished using a sample that is essentially deep lung air.
It is recommended that the BASS be incorporated into the NHTSA standards for breath
alcohol testing instruments as the basis for all future qualification testing to eliminate the need of
human subjects to evaluate the breath collecting capability of such instruments.
vii

BREATH ALCOHOL SAMPLING SIMULATOR (BASS)FOR QUALIFICATION TESTING OF BREATH
ALCOHOL MEASUREMENT DEVICES
A. Flores
Transporlalion Systems Center, Cambridge, MA 02142
L. K. Eliason, Y. C. Wu*
National Bureau of Standards, ff'ashington, DC 20234
The blood alcohol content of an individual suspected of driving while intoxicated is often measured
through the analysis of a breath sample using an evidential breath tester (EBT). Two factors determine the
ability of an EBT to provide an accurate analysis of alcohol concentration: a) the capability of obtaining an
appropriate breath sample, and b) the inherent accuracy of the analytical instrument. This report characterizes
the relevant breath parameters and describes a breath alcohol sample simulator (BASS) that was developed as a
means of reproducing accurate equivalents of human breath. The report discusses measurements made on
human subjects to establish values for parameters the BASS must accommodate, and to demonstrate the validity
of the BASS as a replacement for human drinking subjects with different levels of alcohol content and a range
of physiological characteristics.
Key words: Blood alcohol analysis; blood alcohol content; breath alcohol content; breath sampling; evidential
breath testers; human respiratory characteristics; intoxication.
1. INTRODUCTION
The Highway Safety Act of 1968 has resulted in the establishment of a nationwide Alcohol
Countermeasures Program of the National Highway Traffic Safety Administration (NHTSA). The
goal of the program is to remove drunken drivers from the roads. In pursuing this goal the
NHTSA provides funds to assist the State and local governments in the procurement of breath
alcohol test equipment.
All states have accepted blood alcohol concentration (BAG) as part of the legal basis for
prosecution of individuals arrested for driving while intoxicated.
Blood alcohol concentration (BAG) is universally accepted as evidence in the prosecution of
individuals charged with driving while intoxicated. The Uniform Vehicle Code [1] recognizes
breath alcohol measurement as a means for determining BAG. Trained police officers can perform
breath analyses more easily than blood analyses. Moreover, some investigators claim that breath
analysis is a better test of impairment of driving ability because of the variability of ethanol
content of the blood sample, which is dependent upon the part of the body from which the sample
is obtained [2].
A number of commercially available breath alcohol testing devices give sufficiently accurate
results to justify their use as evidence in the prosecution of allegedly drunk drivers. These devices,
known as evidential breath testers (EBT's), utilize various instrumental techniques and principles
of measurement [3].
* Center for Consumer Product Technology, National Engineering Laboratory.
' Numbers in brackets refer to references in appendix A.
1
In 1972, NHTSA initiated a program with the Law Enforcement Standards Laboratory
(LESL) of the National Bureau of Standards (NBS) to develop standards for EBT's and to establish
a Qualified Products List (QPL). (State and local governments may use Federal funds from alcohol
countermeasure programs for the procurement of equipment on the QPL only.) The standard for
evidential breath testers was published by NHTSA in the Federal Register in 1973 [4], and the
standard for calibration equipment in 1975 [5] .
Two factors determine the ability of an EBT to provide an accurate analysis of alcohol
concentration: a) the capability of obtaining an appropriate breath sample, and b) the inherent
accuracy of the analytical instrument. The precision and accuracy of the EBT are readily
determined by replicate measurements using vapors of known alcohol concentration. However, in
order to determine if a given instrument collects an appropriate human breath sample, it is
necessary to correlate the breath-estimated BAG reading of the instrument with either actual blood
alcohol concentration, or with breath that is known to have the same concentration of alcohol as
air in the alveoli of the lungs. The standard issued in 1973 required determination of the breath
sampling characteristics of EBT's through direct correlation of blood analysis with instrument
readings of breath alcohol concentration. The breath and blood samples were taken on as nearly a
simultaneous basis as possible.
Later, an improved test method to evaluate the breath sampling characteristics of EBT's and
other breath alcohol instruments was developed to serve as the basis for QPL acceptance. The
alcohol concentration is first determined for a single breath of one subject, then compared to the
instrument reading obtained after the same subject repeatedly inhales and exhales (rebreathes) the
same air into a collapsed plastic bag. The measured alcohol concentration of the single breath
sample is typically about 10 to 20 percent lower than that of the rebreathed levels. Rebreathed
breath samples very closely approach the alcohol concentration of that portion of the breath that is
in equilibrium with the pulmonary blood [2,6] (see also sec. 2 below). An evidential breath tester
is considered to be satisfactory if paired comparisons of blood and breath alcohol concentrations,
taken over many subjects, yield a correlation coefficient of at least 0.95. Furthermore, since it has
been recognized that breath alcohol readings tend to be biased toward lower values than blood
alcohol concentration, a limiting value of -22 percent has been set: that is, the breath alcohol
concentration must not be less than 78 percent of the value for blood alcohol concentration.
These procedures are acceptable, but have the following undesirable features:
• It is impractical to obtain a sample of human subjects that (a) is representative of the
drinking driver population, and (b) is large enough to account for physiological variability
among individuals yet at the same time small enough to manage within the limits of available
laboratory resources.
• Federal guidelines require that experimental data be obtained without human
experimentation whenever possible.
• Medical monitoring of intoxicated subjects is increasingly difficult to obtain.
There are obvious advantages to the replacement of human subjects with a mechanical system
that is essentially an operational equivalent to the human subject for this purpose, and whose
performance is more reproducible. Of course, human breath cannot be faithfully reproduced in
every respect. Nonetheless, the key physical parameters relevant to breath alcohol content
measurement can be closely modeled and simulated. It is the purpose of this report to characterize
relevant breath parameters and to describe the Breath Alcohol Sample Simulator (BASS) that was
developed by the Transportation Systems Center (TSC) as a means of reproducing accurate
equivalents of human breath. The report discusses measurements made on human subjects to
establish values for parameters that the BASS must accommodate, and the demonstration of the
validity of the BASS as a replacement for human drinking subjects with different levels of alcohol
content.
2
2. PARAMETERS TO BE MODELED BY A SAMPLE SIMULATOR
It is necessary to understand the essential features of the human respiratory system in orfJer
to consider the effects of the presence of alcohol and to characterize those attributes which can be
measured, modeled, and simulated. A more complete treatment than the summary discussion
below can be found in any standard text on human physiology.
The airways of the respiratory system include (a) the alveolar sacs within the lungs and (b)
the upper respiratory tract (URT), which consist of the oro-nasal cavity, pharynx, larynx, trachea,
bronchi, and bronchioli. Where blood vessels contact the alveoli, the surface-to-volume ratio is
much higher than that in the remainder of the respiratory system. Consequently, the alveoli-blood
interface is the primary locus for active gas exchange between blood and breath, with relatively
little exchanged elsewhere. Here, then, almost all alcohol exchange takes place.
All components of the entire respiratory system are covered with watery mucus that plays an
important role in establishing the alcohol content of expired breath. As air laden with alcohol
vapor, carbon dioxide, or other gases passes through the system, some molecules are dissolved into
the surface moisture. At any given moment, during a breathing pause, stationary air in the URTcontains alcohol vapor tending toward equilibrium with the watery film. Following an inhalation,
alcohol deposited in the watery film during the previous expiration is mixed with other gases
present. A single expiration at this time manifests an alcohol concentration much lower than that
found in the alveoli. However, if the mucus of the URT becomes saturated with respect to
alcohol—as would occur with rebreathing exhaled breath several times—the expired breath
reaches an alcohol concentration comparable to that deep in the system. The effect of a single (i.e.,
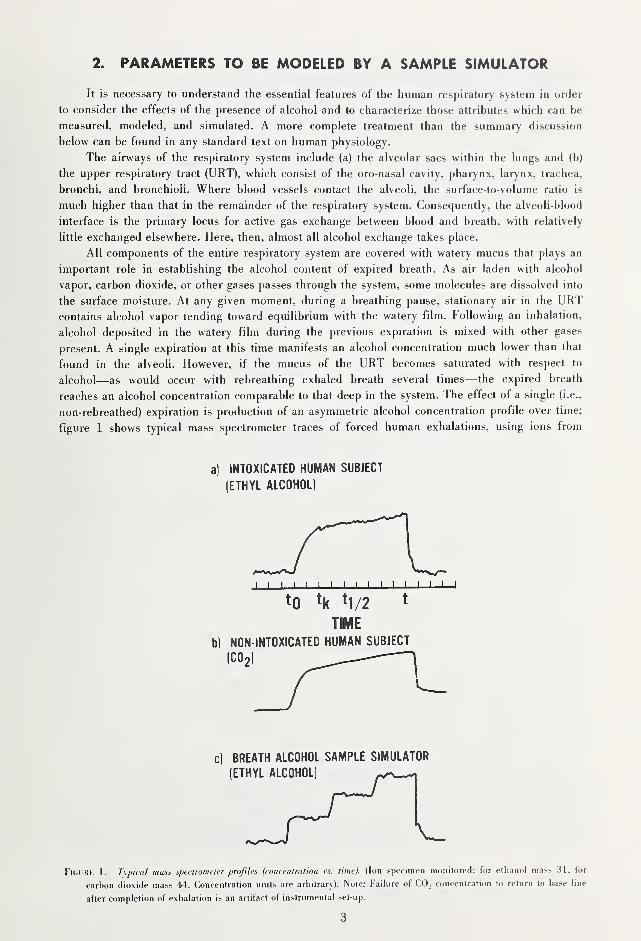
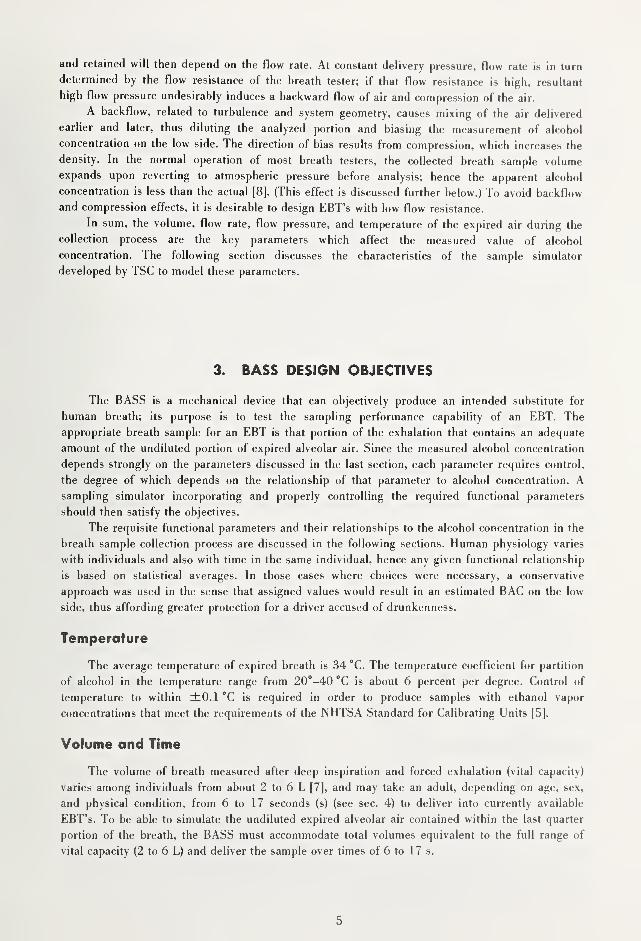
non-rebreathed) expiration is production of an asymmetric alcohol concentration profile over time;
figure 1 shows typical mass spectrometer traces of forced human exhalations, using ions from
a) INTOXICATED HUMAN SUBJECT
(ETHYL ALCOHOL)
BREATH ALCOHOL SAMPLE SIMULATOR
(ETHYL ALCOHOL)
FlcUHK 1. Typical mass speclromeler profiles (concentration \'s. time). (Ion specimen monitored: for ethanol mass 31, for
carbon dioxide mass 44. Concentration units are arbitrary). Note: Failure of CO, concentration to return to base line
after completion of exhalation is an artifact of instrumental set-up.
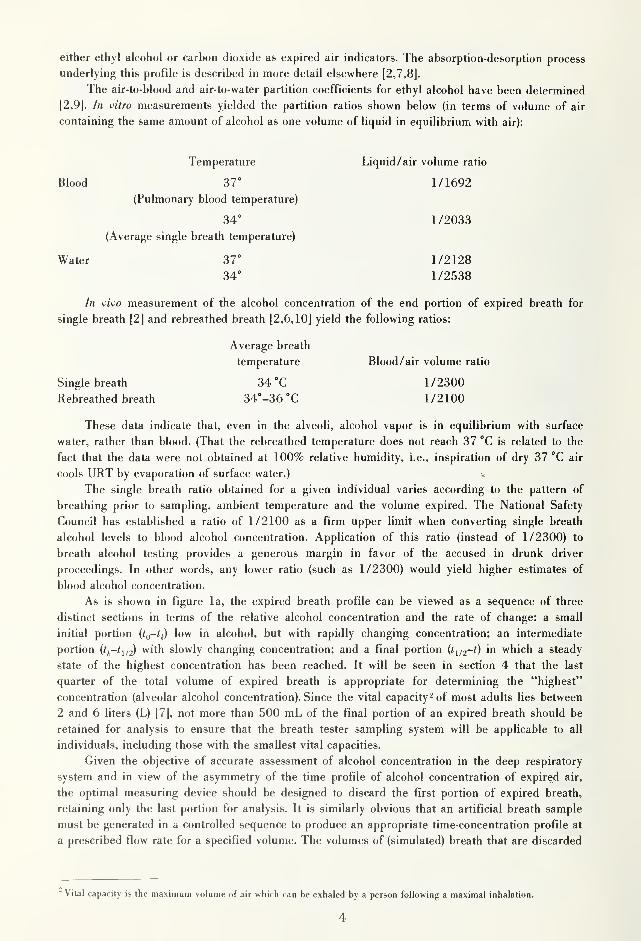
either ethyl alcohol or carbon dioxide as expired air indicators. The absorption-desorption process
underlying this profile is described in more detail elsewhere [2,7,8].
The air-to-blood and air-to-water partition coefficients for ethyl alcohol have been determined
[2,9]. In vitro measurements yielded the partition ratios shown below (in terms of volume of air
containing the same amount of alcohol as one volume of liquid in equilibrium with air):
Temperature Liquid/air volume ratio
Blood 37° 1/1692
(Pulmonary blood temperature)
34° 1/2033
(Average single breath temperature)
Water 37° 1/212834° 1/2538
In vivo measurement of the alcohol concentration of the end portion of expired breath for
single breath [2] and rebreathed breath [2,6,10] yield the following ratios:
Average breath
temperature Blood/air volume ratio
Smgle breath 34 °C 1/2300
Rebreathed breath 34°-36 °C 1/2100
These data indicate that, even in the alveoli, alcohol vapor is in equilibrium with surface
water, rather than blood. (That the rebreathed temperature does not reach 37 °C is related to the
fact that the data were not obtained at 100% relative humidity, i.e., inspiration of dry 37 °C air
cools URT by evaporation of surface water.)
The single breath ratio obtained for a given individual varies according to the pattern of
breathing prior to sampling, ambient temperature and the volume expired. The National Safety
Council has established a ratio of 1/2100 as a firm upper limit when converting single breath
alcohol levels to blood alcohol concentration. Application of this ratio (instead of 1/2300) to
breath alcohol testing provides a generous margin in favor of the accused in drunk driver
proceedings. In other words, any lower ratio (such as 1/2300) would yield higher estimates of
blood alcohol concentration.
As is shown in figure la, the expired breath profile can be viewed as a sequence of three
distinct sections in terms of the relative alcohol concentration and the rate of change: a small
initial portion (io-'t) low in alcohol, but with rapidly changing concentration; an intermediate
portion {ti,-t\,2) with slowly changing concentration; and a final portion (fi/2-0 in which a steady
state of the highest concentration has been reached. It will be seen in section 4 that the last
quarter of the total volume of expired breath is appropriate for determining the "highest"
concentration (alveolar alcohol concentration). Since the vital capacity^ of most adults lies between
2 and 6 liters (L) [7], not more than 500 mL of the final portion of an expired breath should be
retained for analysis to ensure that the breath tester sampling system will be applicable to all
individuals, including those with the smallest vital capacities.
Given the objective of accurate assessment of alcohol concentration in the deep respiratory
system and in view of the asymmetry of the time profile of alcohol concentration of expired air,
the optimal measuring device should be designed to discard the first portion of expired breath,
retaining only the last portion for analysis. It is similarly obvious that an artificial breath sample
must be generated in a controlled sequence to produce an appropriate time-concentration profile at
a prescribed flow rate for a specified volume. The volumes of (simulated) breath that are discarded
Vital capacity is the maximum volume of air which can be exhaled by a person following a maximal inhalation.
4
and retained will then depend on the flow rate. At constant delivery pressure, flow rate is in turn
determined by the flow resistance of the breath tester; if that flow resistance is high, resultant
high flow pressure undesirably induces a backward flow of air and compression of the air.
A backflow, related to turbulence and system geometry, causes mixing of the air delivered
earlier and later, thus diluting the analyzed portion and biasing the measurement of alcohol
concentration on the low side. The direction of bias results from compression, which increases the
density. In the normal operation of most breath testers, the collected breath sample volume
expands upon reverting to atmospheric pressure before analysis; hence the apparent alcohol
concentration is less than the actual [8]. (This effect is discussed further below.) To avoid backflow
and compression effects, it is desirable to design EBT's with low flow resistance.
In sum, the volume, flow rate, flow pressure, and temperature of the expired air during the
collection process are the key parameters which affect the measured value of alcohol
concentration. The following section discusses the characteristics of the sample simulator
developed by TSC to model these parameters.
3. BASS DESIGN OBJECTIVES
The BASS is a mechanical device that can objectively produce an intended substitute for
human breath; its purpose is to test the sampling performance capability of an EBT. The
appropriate breath sample for an EBT is that portion of the exhalation that contains an adequate
amount of the undiluted portion of expired alveolar air. Since the measured alcohol concentration
depends strongly on the parameters discussed in the last section, each parameter requires control,
the degree of which depends on the relationship of that parameter to alcohol concentration. Asampling simulator incorporating and properly controlling the required functional parameters
should then satisfy the objectives.
The requisite functional parameters and their relationships to the alcohol concentration in the
breath sample collection process are discussed in the following sections. Human physiology varies
with individuals and also with time in the same individual, hence any given functional relationship
is based on statistical averages. In those cases where choices were necessary, a conservative
approach was used in the sense that assigned values would result in an estimated BAG on the low
side, thus affording greater protection for a driver accused of drunkenness.
Temperature
The average temperature of expired breath is 34 °C. The temperature coefficient for partition
of alcohol in the temperature range from 20°-40 °C is about 6 percent per degree. Control of
temperature to within ±0.1 "C is required in order to produce samples with ethanol vapor
concentrations that meet the requirements of the NHTSA Standard for Calibrating Units [5].
Volume and Time
The volume of breath measured after deep inspiration and forced exhalation (vital capacity)
varies among individuals from about 2 to 6 L [7], and may take an adult, depending on age, sex,
and physical condition, from 6 to 17 seconds (s) (see sec. 4) to deliver into currently available
EBT's. To be able to simulate the undiluted expired alveolar air contained within the last quarter
portion of the breath, the BASS must accommodate total volumes equivalent to the full range of
vital capacity (2 to 6 L) and deliver the sample over times of 6 to 17 s.
5
Flow Rate and Pressure
According to the Poseuille equation for laminar flow in a pipe, the flow rate, Q (volume per
unit time), is related to the pressure drop from the inlet to the outlet, A/>, by
Q = ^p
where r is the radius and / is the length of the pipe through which the fluid flows and ju, is the
viscosity of the fluid. Since the flow resistance is inversely related to the pressure drop, it follows
that 8]U.// TTr* is the flow resistance. If the latter is a constant, the flow rate is directly proportional
to the pressure drop. If the pressure drop is to be minimized while keeping the flow rate constant,
the flow resistance must be lowered. This may be accomplished by reducing the length or
increasing the radius of the flow pipe, or by doing both.
Physiologically, the flow resistance is about 3.3 cm HjO-s/L in normal breathing through the
oro-nasal cavity fll]. For a flow rate of 1 L/s, which corresponds to 6 L of air delivered in 6 s,
the pressure drop is only about 3.3 cm H^O. A BASS whose output is open to the atmosphere
should therefore have a flow resistance of 3.3 cm HjO-s/L to assure that the simulator delivers
simulated breath to an EBT without inducing error. The effect of the delivery pressure into EBT's
will be discussed in section 4.
Alcohol Concentration
The expirogram shown in figure la shows a typical profile of breath alcohol concentration. Asample simulator must generate a sample with an alcohol concentration profile with increasing
levels of alcohol concentration, attaining a final concentration plateau comparable to the level of
the final concentration in the breath profile. However, the latter portion of the simulation will be
adversely affected if flow resistance in the breath tester induces high delivery pressure. This
problem will be addressed in the following section.
4. TSC BREATH ALCOHOL SAMPLING SIMULATOR
Design Approach
Typical asymmetric breath alcohol profiles (as shown in fig. la) can be approximated (as in
fig. Ic) by arranging several commercial simulators in parallel, their exit tubes all connected to a
common manifold. By switching air through the several simulators in an appropriate sequence, a
series of profile steps, joined together, will produce a single profile. The resultant overall profile
can be shaped as desired by adjusting the amount of alcohol in the individual simulators and by
regulating the times of switching. This design approach was followed in constructing the BASS, a
block diagram of which is shown in figure 2.
Assembly and Operation
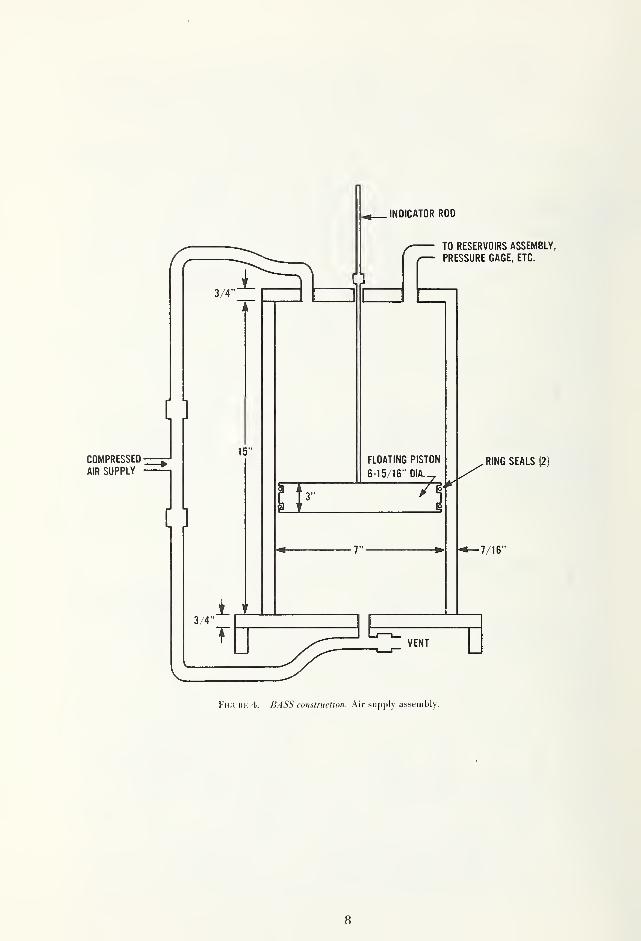
The elements of BASS construction are shown in figures 3 through 6 (pressure gage is not
shown). Figure 3 shows the operation of the device. A 7-L air-driven floating piston and cylinder
assembly delivers air through the three temperature controlled alcohol solution reservoirs. The
output mixture of alcohol and air is passed into the breath test instrument being evaluated.
The following discussion identifies by manufacturer and model the equipment used in
fabricating the prototype BASS unit. However, mention of an item or manufacturer in no way
constitutes an endorsement of the products by either the NBS or the DOT Transportation Systems
Center. Any equipment which meets the functional requirements described herein may be used to
construct a breath alcohol sample simulator.
6
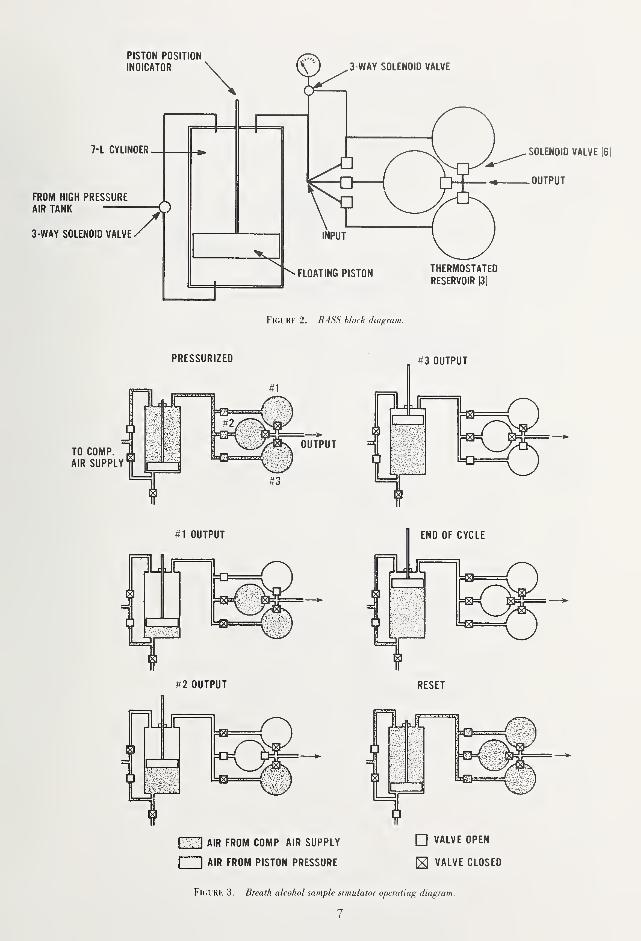
PRESSURIZED #3 OUTPUT
TO COMPAIR SUPPLY
#1 OUTPUT
#2 OUTPUT
OUTPUT
m AIR FROM COMP AIR SUPPLY
AIR FROM PISTON PRESSURE
VALVE OPEN
S VALVE CLOSED
FuiUKK 3. Breath alcohol sample simulator operating diagram.
7
INDICATOR ROD
TO RESERVOIRS ASSEMBLY,
PRESSURE GAGE, ETC.
COMPRESSED-
AIR SUPPLY
15"
3/4"1
FLOATING PISTON
6-15/16" DIA,
7"-
.RING SEALS 12]
-7/16"
VENT
Fl(;iil<K 4. BASS construction. Air supply assembly.
8
occ
C9
cc O Q_
— V7
\
9

10
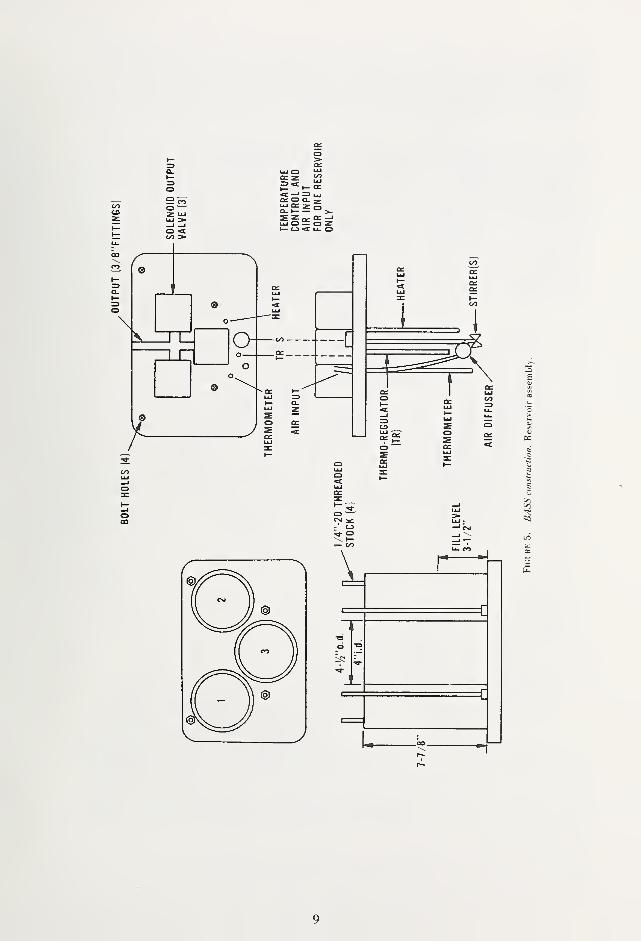
The cylinder assembly is shown in figure 4 and reservoir assembly in figure 5. Input and
output solenoid valves (Model 53C18HN14-2, Valcor Engineering, Kenilworth, NJ) are
automatically controlled so that air passes through each solution at the proper time and for the
proper duration. The wiring diagram for the control of the solenoid valves and the timers is shown
in figure 6.
A typical output alcohol profile is shown in figure Ic. Concentration step heights are
determined by alcohol concentrations in solutions 1, 2, and 3, contained in the three reservoirs,
respectively. (Solutions are replaced frequently to compensate for alcohol depletion on use.) Step
widths are determined by relay timer (Model W21LMASOX-2, Magnecraft Electric Co., Chicago,
IL) settings, which control the solenoid valves. Timers are individually adjustable from 1 to 12 s.
Heaters, thermo-regulators, and stirrers used in the solution reservoirs were taken from MKII
Simulators, Smith and Wesson Electronics, Springfield, MA, the shafts of which were extended.
Air diffusers (double) were taken from Model 999 Air Pump, Lew Childre and Sons, Inc., Foley,
AL. Precision thermometers were used to monitor temperature. Working pressures are variable
from 0 to 500 cm H2O (0-200 in H2O). Although maximum human delivery pressures correspond
to only about 160 cm HjO (64 in H2O) [11], higher working pressures are needed to overcome the
high flow resistance of the air diffusers.
If convenient, sample volumes delivered into breath testers can be measured at the breath
tester vent port, which is connected to a 9 L recording vitalometer. If the breath tester vent port is
not accessible, the unit under test can be placed in an air tight glove box of sufficient size to
provide at least 15 cm (6 in) clearance between the sides and top of the interior surfaces of the
glove box. The glove box should have internal outlets for 110 V ac power, or connections for dc
power as appropriate for the instrument under test and a transparent viewing window that allows
observation of all controls and displays of the breath tester. The output of the BASS is connected
to the input of the breath tester through an air tight feed through. A fitting is installed in a wall of
the glove box, to which the 9 L recording vitalometer is connected. The sample volume delivered
to the breath tester is then measured directly as the volume of air displaced from the glove box.
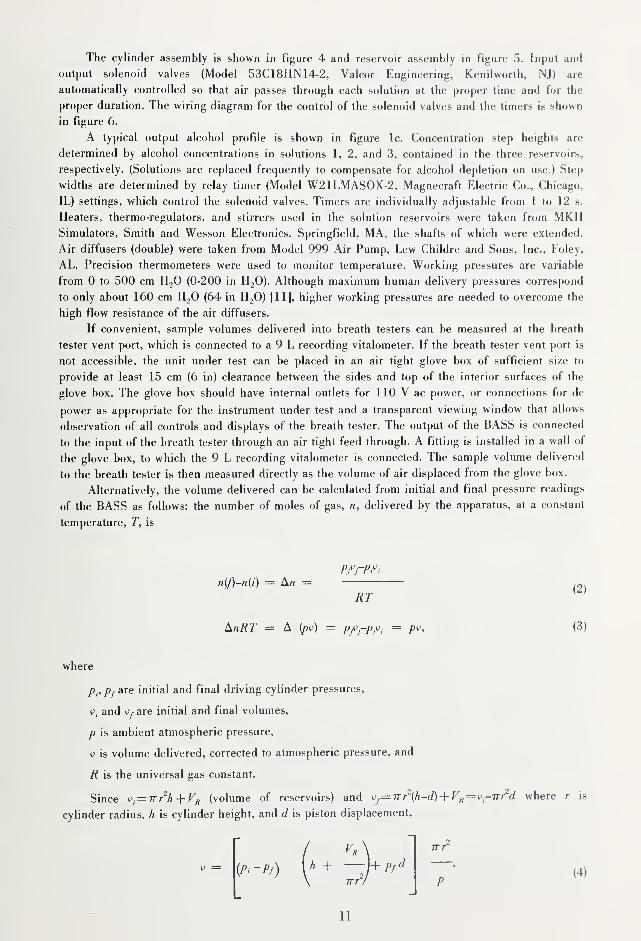
Alternatively, the volume delivered can be calculated from initial and final pressure readings
of the BASS as follows: the number of moles of gas, n, delivered by the apparatus, at a constant
temperature, T, is
n(f)-n{i) = An =RT
LnRT = A ipv) = pfJfPfi = p'^-.
(2)
(3)
pf are initial and final driving cylinder pressures,
and are initial and final volumes,
p is ambient atmospheric pressure,
V is volume delivered, corrected to atmospheric pressure, and
R is the universal gas constant.
Since v-=TTr-h-\-V^ (volume of reservoirs) and v^=Trr^{h-d)+V„=^v~'nT^d where r is
cylinder radius, h is cylinder height, and d is piston displacement.
TTr
[P-Pf) h +TTr
,
(4)
11
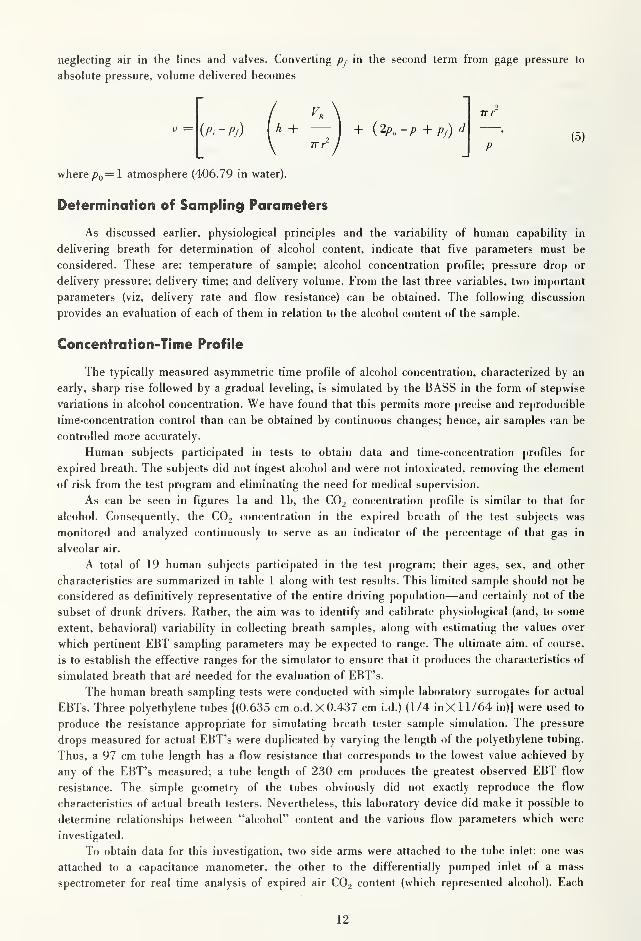
neglecting air in the lines and valves. Converting in the second term from gage pressure to
absolute pressure, volume delivered becomes
V, \
{p. -p) r + ~ + ^^P" -p + pj)^
(5)
where Pq=' \ atmosphere (406.79 in water).
Determination of Sampling Parameters
As discussed earlier, physiological principles and the variability of human capability in
delivering breath for determination of alcohol content, indicate that five parameters must be
considered. These are: temperature of sample; alcohol concentration profile; pressure drop or
delivery pressure; delivery time; and delivery volume. From the last three variables, two important
parameters (viz, delivery rate and flow resistance) can be obtained. The following discussion
provides an evaluation of each of them in relation to the alcohol content of the sample.
Concentration-Time Profile
The typically measured asymmetric time profile of alcohol concentration, characterized by an
early, sharp rise followed by a gradual leveling, is simulated by the BASS in the form of stepwise
variations in alcohol concentration. We have found that this permits more precise and reproducible
time-concentration control than can be obtained by continuous changes; hence, air samples can be
controlled more accurately.
Human subjects participated in tests to obtain data and time-concentration profiles for
expired breath. The subjects did not ingest alcohol and were not intoxicated, removing the element
of risk from the test program and eliminating the need for medical supervision.
As can be seen in figures la and lb, the CO, concentration profile is similar to that for
alcohol. Consequently, the COj concentration in the expired breath of the test subjects was
monitored and analyzed continuously to serve as an indicator of the percentage of that gas in
alveolar air.
A total of 19 human subjects participated in the test program; their ages, sex, and other
characteristics are summarized in table 1 along with test results. This limited sample should not be
considered as definitively representative of the entire driving population—and certainly not of the
subset of drunk drivers. Rather, the aim was to identify and calibrate physiological (and, to some
extent, behavioral) variability in collecting breath samples, along with estimating the values over
which pertinent EBT sampling parameters may be expected to range. The ultimate aim, of course,
is to establish the effective ranges for the simulator to ensure that it produces the characteristics of
simulated breath that ar^ needed for the evaluation of EBT's.
The human breath sampling tests were conducted with simple laboratory surrogates for actual
EBTs. Three polyethylene tubes [(0.635 cm o.d.X 0.437 cm i.d.) (1/4 in X 11/64 in)] were used to
produce the resistance appropriate for simulating breath tester sample simulation. The pressure
drops measured for actual EBT's were duplicated by varying the length of the polyethylene tubing.
Thus, a 97 cm tube length has a flow resistance that corresponds to the lowest value achieved by
any of the EBT's measured; a tube length of 230 cm produces the greatest observed EBT flow
resistance. The simple geometry of the tubes obviously did not exactly reproduce the flow
characteristics of actual breath testers. Nevertheless, this laboratory device did make it possible to
determine relationships between "alcohol" content and the various flow parameters which were
investigated.
To obtain data for this investigation, two side arms were attached to the tube inlet: one was
attached to a capacitance manometer, the other to the differentially pumped inlet of a mass
spectrometer for real time analysis of expired air CO2 content (which represented alcohol). Each
12
subject was asked to empty his or her lungs a number of times into each simulated tester without
special coaching. Results are shown in table 1, from which the parameters of interest here can be
evaluated.
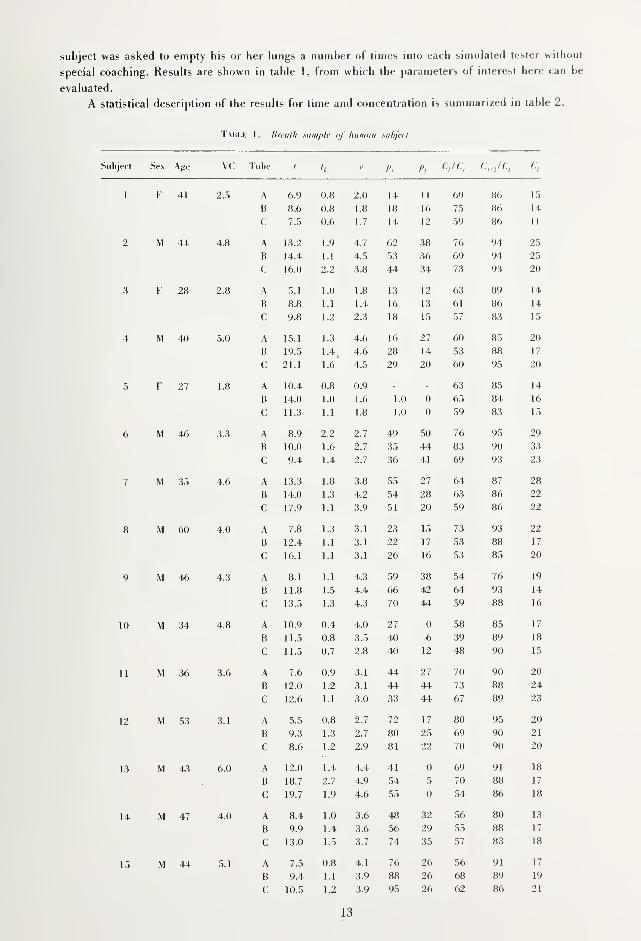
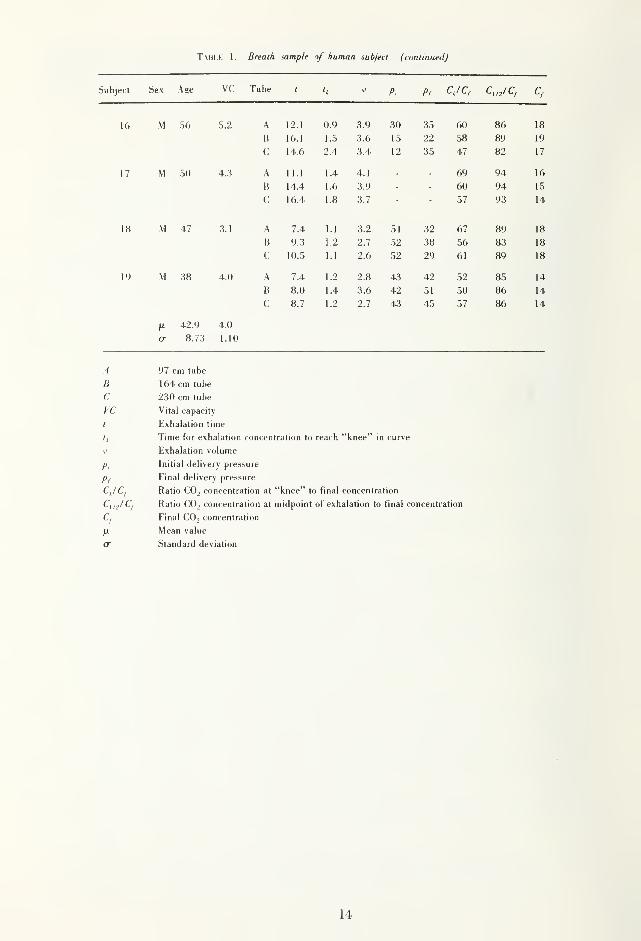
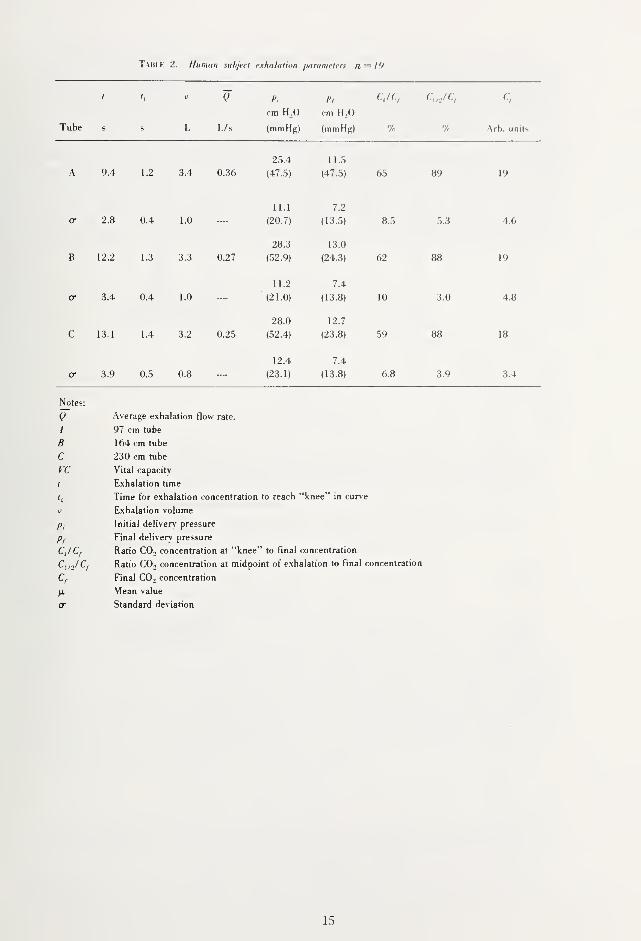
A statistical description of the results for time and concentration is summarized in table 2.
T Mii.i': 1 . It,rt'dfli sit iii/)/r iij It It lit an siihjftl
lei't Sex A (re I n he f '« I'l I'l('. JC
1
1 K 41 2.5 A 6.9 0.8 2.0 14 1 1 69 86 15
B 8.6 0.8 1.8 18 16 75 86 14
C 7.5 0.6 1.7 14 12 59 86 1 1
2 M 44 4.8 A 13.2 1.9 4.7 62 38 76 94 25
B 14.4 1.1 4.5 53 36 69 94 25
C 16.0 2.2 3.8 44 34 73 93 20
3 F 28 2.8 A 5.1 1.0 1.8 13 12 63 89 14
B 8.8 1.1 1.4 16 13 61 86 14
C 9.8 1.2 2.3 18 15 57 83 15
4 M 40 5.0 A 15.1 1.3 4.6 16 27 60 85 20
B 19.5 1.4 4.6 28 14 53 88 17
C 21.1 1.6 4.5 29 20 60 95 20
5 F 27 1.8 A 10.4 0.8 0.9 63 85 14
B 14.0 1.0 1.6 1.0 0 65 84 16
C 11.3 1.1 1.8 1.0 0 59 83 15
6 M 46 3.3 A 8.9 2.2 2.7 49 50 76 95 29
B 10.0 1.6 2.7 35 44 83 90 33
C 9.4 1.4 2.7 36 41 69 93 23
7 M 35 4.6 A 13.3 1.8 3.8 55 27 64 87 28
B 14.0 1.3 4.2 54 28 63 86 22
C 17.9 1.1 3.9 51 20 59 86 22
8 M 60 4.0 A 7.8 1.3 3.1 23 15 73 93 22
B 12.4 1.1 3.1 22 17 53 88 17
C 16.1 1.1 3.1 26 16 53 85 20
9 M 46 4.3 A 8.1 1.1 4.3 59 38 54 76 19
B 11.8 1.5 4.4 66 42 64 93 14
C 13.5 1.3 4.3 70 44 59 88 16
10 M 34 4.8 A 10.9 0.4 4.0 27 0 58 85 17
B 11.5 0.8 3.5 40 6 39 89 18
C 11.5 0.7 2.8 40 12 48 90 15
11 M 36 3.6 A 7.6 0.9 3.1 44 27 70 90 20
B 12.0 1.2 3.1 44 44 73 88 24
C 12.6 1.1 3.0 33 44 67 89 23
12 M 53 3.1 A 5.5 0.8 2.7 72 17 80 95 20
B 9.3 1.3 2.7 80 25 69 90 21
C 8.6 1.2 2.9 81 22 70 90 20
13 M 43 6.0 A 12.0 1.4 4.4 41 0 69 n 1 1 Qlo
B 18.7 2.7 4.9 54 5 70 88 17
C 19.7 1.9 4.6 55 0 54 86 18
14 M 47 4.0 A 8.4 1.0 3.6 48 32 56 80 13
B 9.9 1.4 3.6 56 29 55 88 17
C 13.0 1.5 3.7 74 35 57 83 18
15 M 44 5.1 A 7.5 0.8 4.1 76 26 56 91 17
B 9.4 1.1 3.9 88 26 68 89 19
C 10.5 1.2 3.9 95 26 62 86 21
13
T\H1.K I. Breath sample of human subject (continued)
jert Sex Age VC Tube t JPi c,
16 M 56 5.2 A 12.1 0.9 3.9 30 35 60 86 18
B 16.1 1.5 3.6 15 22 58 89 19
1 4 6 2 4 0.4- 12 35 47 82 j7
17 M 50 4..-} A 11.1 1.4 4.1 - 69 94 16
B 14.4 1.6 3.9 60 94 15/'
I RI .o o t
9'^ 1 4.
18 M 47 .5.1 A 7.4 1.1 3.2 51 32 67 89 18
B 9.3 1.2 2.7 52 38 56 83 18
C 10.5 1.1 2.6 52 29 61 89 18
19 M 38 4.0 A 7.4 1.2 2.8 43 42 52 85 14
B 8.0 1.4 3.6 42 51 50 86 14
C 8.7 1.2 2.7 43 45 57 86 14
42.9 4.0
o- 8.73 1.10
A 97 cm tube
B 164 cm tube
C 230 cm tube
VC Vital capacity
I Exhalation time
h Time for exhalation concentration to reach "knee" in curve
V Exhalation volume
P, Initial delivery pressure
Pf Final delivery pressure
CJC, Ratio COo concentration at "knee" to final concentration
Ratio CO, concentration at midpoint of exhalation to final concentration
c, Final COj concentration
Mean value
cr Standard deviation
14
T^llli, 2. Hunuin siilijerl exhaliilion /iiirdnicters n — 19
1 Q P.
cm HoO
I'l
cm H ,0
CJC, C„JC,
Tube s s L Us (mmHg) (mmHg) % Arb. units
25.4 1 l.,5
A 9.4 1.2 3.4 0.36 (47..5)
11.1
(47.5)
7.2
65 89 19
cr 2.8 0.4 1.0 .... (20.7)
28.3
(13.5)
13.0
8.5 5.3 4.6
B 12.2 1.3 3.3 0.27 (52.9)
11.2
(24.3)
7.4
62 88 19
a 3.4 0.4 1.0 ....'
(21.0)
28.0
(13.8)
12.7
10 3.0 4.8
C 13.1 1.4 3.2 0.25 (52.4)
12.4
(23.8)
7.4
59 88 18
cr 3.9 0.5 0.8 (23.1) (13.8) 6.8 3.9 3.4
Notes:
Q Average e.xhalation flow rate.
4 97 cm tube
B 164 cm tube
C 230 cm tube
VC Vital capacity
t E.xhalation time
h Time for exhalation concentration to reach "knee" in curve
u Exhalation volume
Initial deliverv pressure
p, Final delivery pressure
CJC, Ratio CO., concentration at "knee" to final concentration
C„JC,- Ratio CO2 concentration at midpoint of exhalation to final concentration
Final CO, concentration
Mean value
cr Standard deviation
15
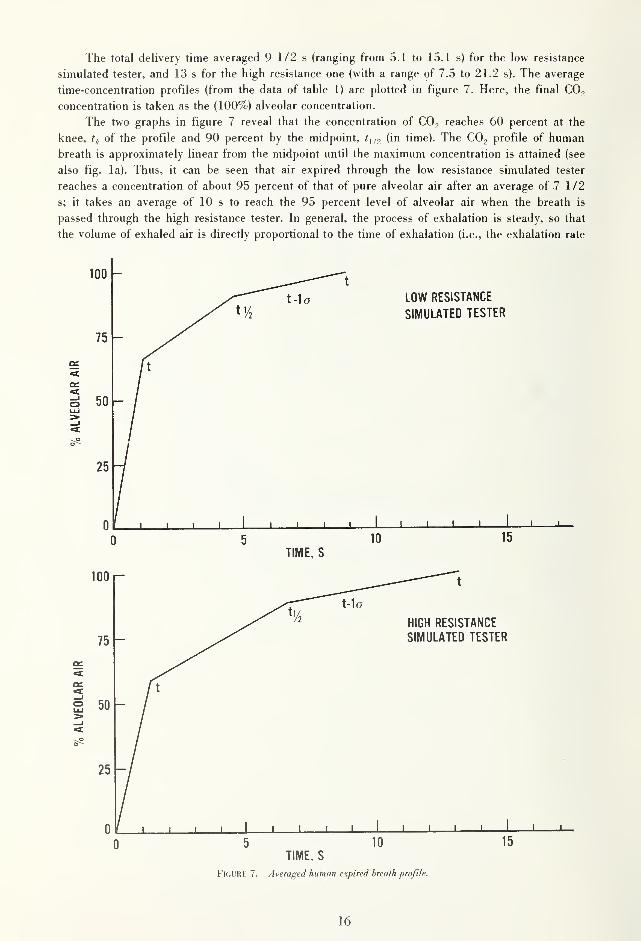
The total delivery time averaged 9 1/2 s (ranging from 5.1 to 15.1 s) for the low resistance
simulated tester, and 13 s for the high resistance one (with a range of 7.5 to 21.2 s). The average
time-concentration profiles (from the data of table 1) are plotted in figure 7. Here, the final CO2
concentration is taken as the (100%) alveolar concentration.
The two graphs in figure 7 reveal that the concentration of CO2 reaches 60 percent at the
knee, t^. of the profile and 90 percent by the midpoint, 1^,2 (in time). The CO2 profile of human
breath is approximately linear from the midpoint until the maximum concentration is attained (see
also fig. la). Thus, it can be seen that air expired through the low resistance simulated tester
reaches a concentration of about 95 percent of that of pure alveolar air after an average of 7 1/2
s; it takes an average of 10 s to reach the 95 percent level of alveolar air when the breath is
passed through the high resistance tester. In general, the process of exhalation is steady, so that
the volume of exhaled air is directly proportional to the time of exhalation (i.e., the exhalation rate
16
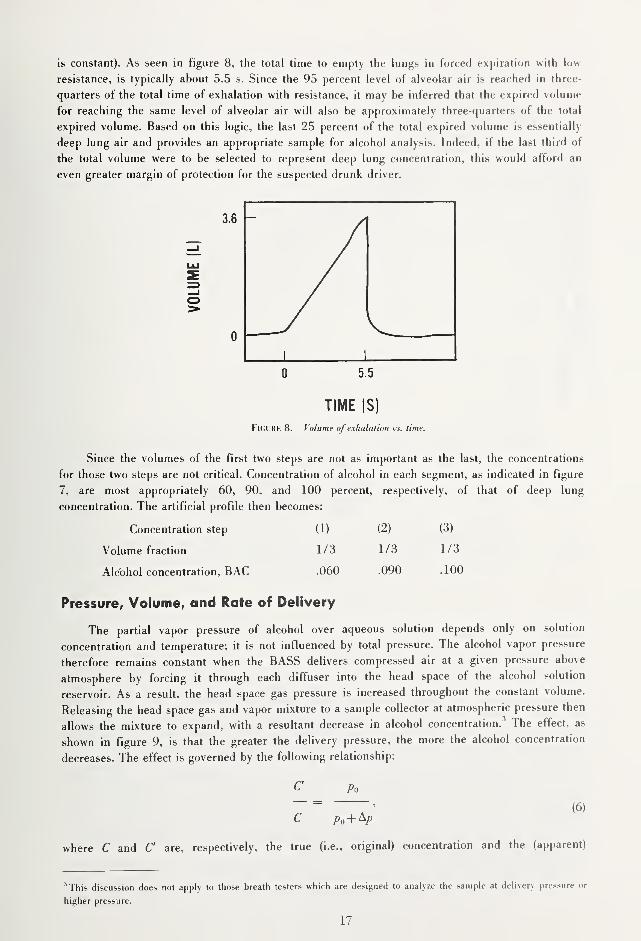
is constant). As seen in figure 8, the total time to empty the lungs in forced expiration with low
resistance, is typically about 5.5 s. Since the 95 percent level of alveolar air is reached in three-
quarters of the total time of exhalation with resistance, it may be inferred that the expired volume
for reaching the same level of alveolar air will also be approximately three-quarters of the total
expired volume. Based on this logic, the last 25 percent of the total expired volume is essentially
deep lung air and provides an appropriate sample for alcohol analysis. Indeed, if the last third of
the total volume were to be selected to represent deep lung concentration, this would afford an
even greater margin of protection for the suspected drunk driver.
3.6
UME
(L
o>
0
11
5.5
TIME (S)
FkjURK 8. Volume of exhalation vs. time.
Since the volumes of the first two steps are not as important as the last, the concentrations
for those two steps are not critical. Concentration of alcohol in each segment, as indicated in figure
7, are most appropriately 60, 90, and 100 percent, respectively, of that of deep lung
concentration. The artificial profile then becomes:
Concentration step (1) (2) (3)
Volume fraction 1/3 1/3 1/3
Alcohol concentration, BAC .060 .090 .100
Pressure, Volume, and Rate of Delivery
The partial vapor pressure of alcohol over aqueous solution depends only on solution
concentration and temperature; it is not influenced by total pressure. The alcohol vapor pressure
therefore remains constant when the BASS delivers compressed air at a given pressure above
atmosphere by forcing it through each diffuser into the head space of the alcohol solution
reservoir. As a result, the head space gas pressure is increased throughout the constant volume.
Releasing the head space gas and vapor mixture to a sample collector at atmospheric pressure then
allows the mixture to expand, with a resultant decrease in alcohol concentration.^ The effect, as
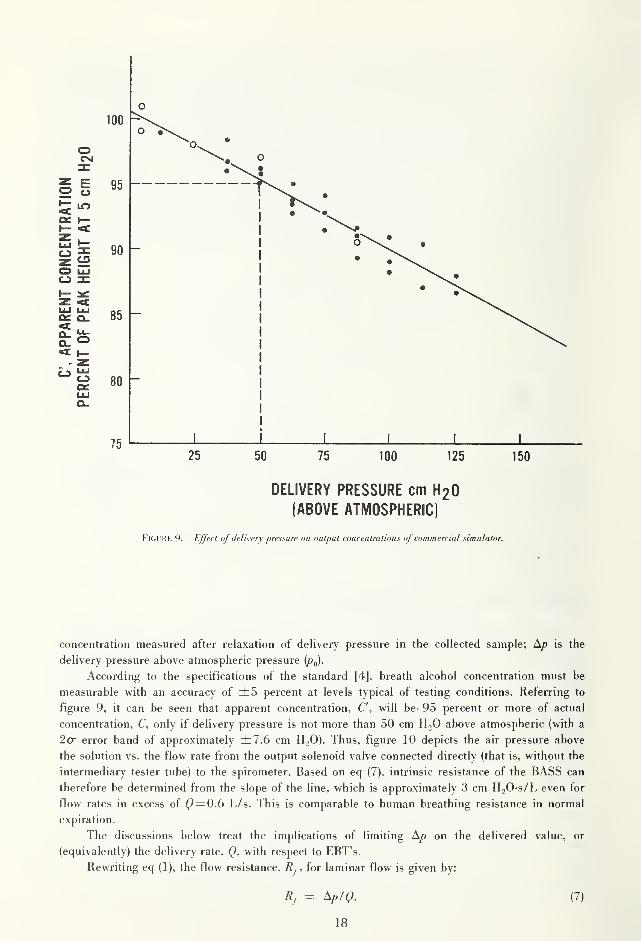
shown in figure 9, is that the greater the delivery pressure, the more the alcohol concentration
decreases. The effect is governed by the following relationship:
C Po
c p,+^p
where C and C are, respectively, the true (i.e., original) concentration and the (apparent)
'This discussion does not apply to those breath testers which are designed to analyze the sample at delivery pressure or
higher pressure.
17
o
\ i \ \ \ L_
25 50 75 100 125 150
DELIVERY PRESSURE cm H2O
(ABOVE ATMOSPHERIC)
FlCUKK 9. Effect of delivery pressure on output concentrations of commercial simulator.
concentration measured after relaxation of delivery pressure in the collected sample; A/? is the
delivery pressure above atmospheric pressure
According to the specifications of the standard [4], breath alcohol concentration must be
measurable with an accuracy of ±5 percent at levels typical of testing conditions. Referring to
figure 9, it can be seen that apparent concentration, C", will be 95 percent or more of actual
concentration, C, only if delivery pressure is not more than 50 cm HjO above atmospheric (with a
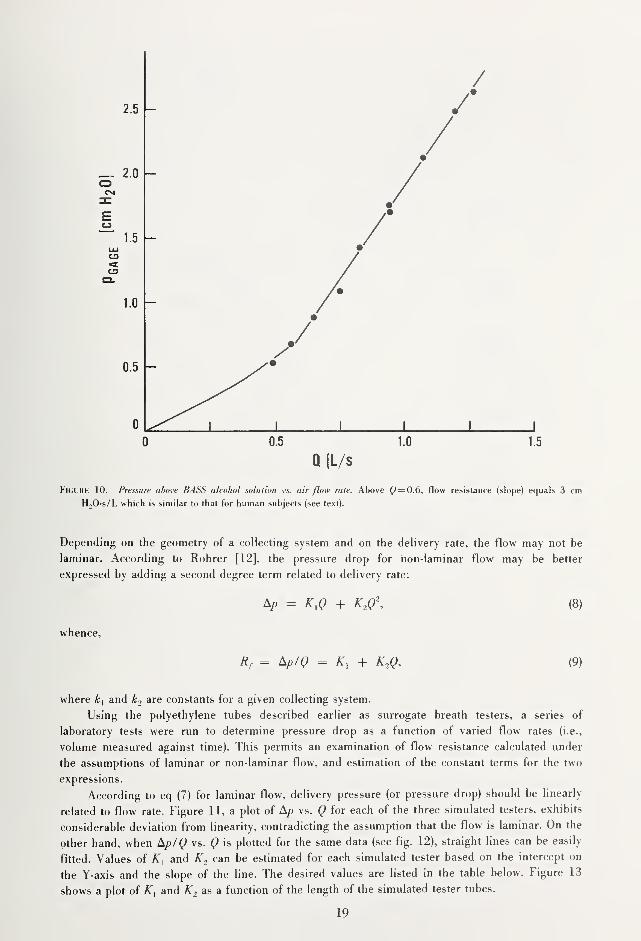
2cr error band of approximately ±7.6 cm HjO). Thus, figure 10 depicts the air pressure above
the solution vs. the flow rate from the output solenoid valve connected directly (that is, without the
intermediary tester tube) to the spirometer. Based on eq (7), intrinsic resistance of the BASS can
therefore be determined from the slope of the line, which is approximately 3 cm H20-s/L even for
flow rates in excess of Q= 0.() L/s. This is comparable to human breathing resistance in normal
expiration.
The discussions below treat the implications of limiting on the delivered value, or
(equivalently) the delivery rate, with respect to EBT's.
Rewriting eq (1), the flow resistance, , for laminar flow is given by:
Rj = ^p'Q. (7)
18
/
./
0 0.5 1.0 1.5
Q(L/s
FuiURK 10. Pressure abo\ie BASS alcohol solution vs. air flow rale. Above C= 0.6, flow resistance (slope) equals 3 cm
HjO-s/L which is similar to that for human subjects (see text).
Depending on the geometry of a collecting system and on the delivery rate, the flow may not be
laminar. According to Rohrer [12], the pressure drop for non-laminar flow may be better
expressed by adding a second degree term related to delivery rate:
Ap = K,Q + K,Q\ (8)
whence,
Rf = Ap'Q = + K.,Q, (9)
where and are constants for a given collecting system.
Using the polyethylene tubes described earlier as surrogate breath testers, a series of
laboratory tests were run to determine pressure drop as a function of varied flow rates (i.e.,
volume measured against time). This permits an examination of flow resistance calculated under
the assumptions of laminar or non-laminar flow, and estimation of the constant terms for the two
expressions.
According to eq (7) for laminar flow, delivery pressure (or pressure drop) should be linearly
related to flow rate. Figure 11, a plot of A/^ vs. Q for each of the three simulated testers, exhibits
considerable deviation from linearity, contradicting the assumption that the flow is laminar. On the
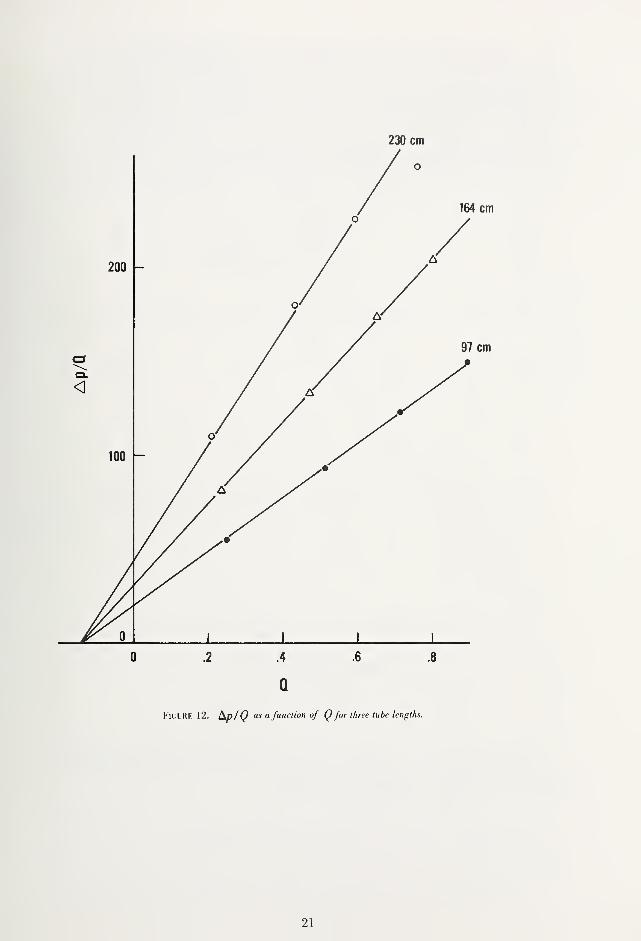
other hand, when t^p/Q vs. Q is plotted for the same data (see fig. 12), straight lines can be easily
fitted. Values of A,and K, can be estimated for each simulated tester based on the intercept on
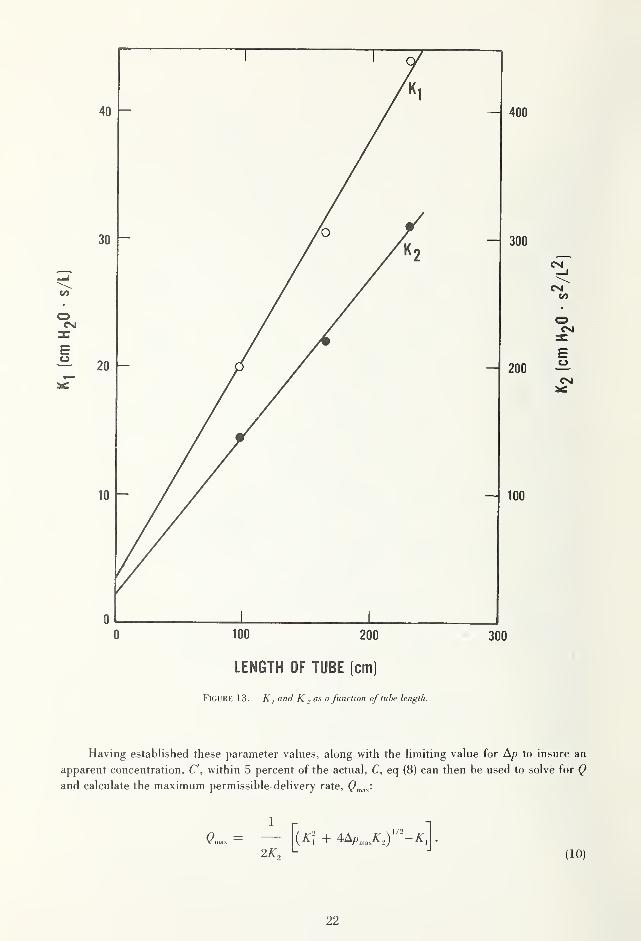
the Y-axis and the slope of the line. The desired values are listed in the table below. Figure 13
shows a plot of A^i and A^^ a function of the length of the simulated tester tubes.
19

230 cm
0 .2 4 .6 .8 1.0
Q (L/s)
Figure 11. Deli^tTy pressure vs. flow rale ihrough tubes.
20
21
0 100 200 ' 300
LENGTH OF TUBE (cm)
FiGURK 13. K I and K , as a function of tube length.
Having established these parameter values, along with the limiting value for A/? to insure an
apparent concentration, C, within 5 percent of the actual, C, eq (8) can then be used to solve for Qand calculate the maximum permissible delivery rate, Q^^^:
Of L -I
(10)
22
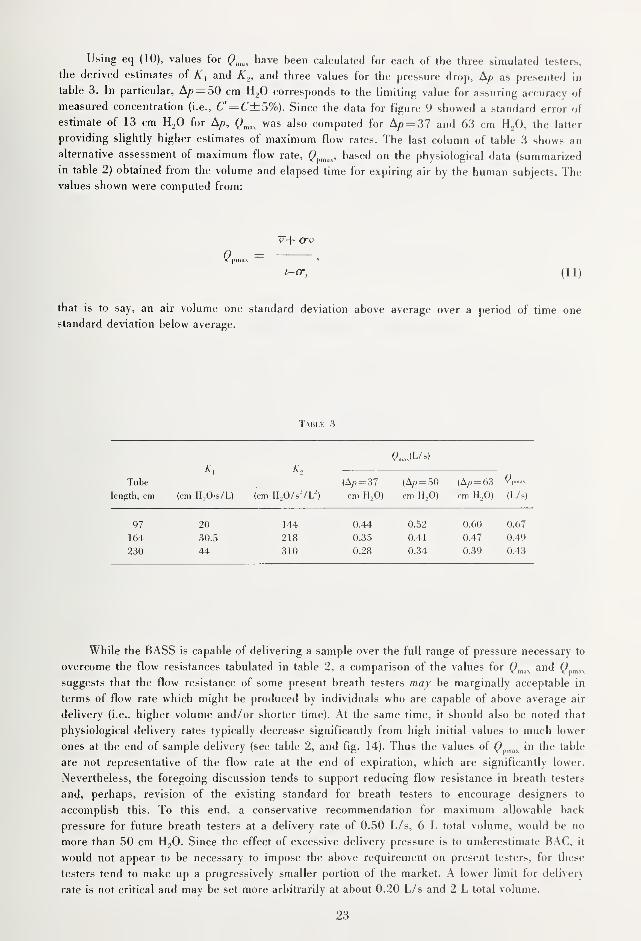
Using eq (10), values for have been calculated for each of ihe three simulated testers,
the derived estimates of and K.^, and three values for the |)ressure drop, A/y as [)resented in
table 3. In particular, AyD = 50 cm H2O corresponds to the limiting value for assuring accuracy of
measured concentration (i.e., C'= C±S%). Since the data for figure 9 showed a standard error of
estimate of 13 cm HjO for A/), (),„^^ was also computed for A/3 = 37 and 63 cm H/), the latter
providing slightly higher estimates of maximum flow rates. The last column of table 3 shows an
alternative assessment of maximum flow rate, (>|„,„,, based on the physiological data (summarized
in table 2) obtained from the volume and elapsed time for expiring air by the human subjects. Thevalues shown were computed from:
^pmax '
t-cr, (11)
that is to say, an air volume one standard deviation above average over a period of time one
standard deviation below average.
Taui.k 3
A".
Tube (A/<= 37 (A/) = 50 (A/)= 63 Q »^
length, cm (cm H,0-s/L) (cm H0O/S-/L-) cm H.O) cm H_,0) cm H,0) (L/s)
97 20 144 0.44 0.52 0.60 0.67
164 30.5 218 0.3.5 0.41 0.47 0.49
230 44 310 0.28 0.34 0.39 0.43
While the BASS is capable of delivering a sample over the full range of pressure necessary to
overcome the flow resistances tabulated in table 2, a comparison of the values for Q^^^^ and Q^,„y^^
suggests that the flow resistance of some present breath testers may be marginally acceptable in
terms of flow rate which might be produced by individuals who are capable of above average air
delivery (i.e., higher volume and/or shorter time). At the same time, it should also be noted that
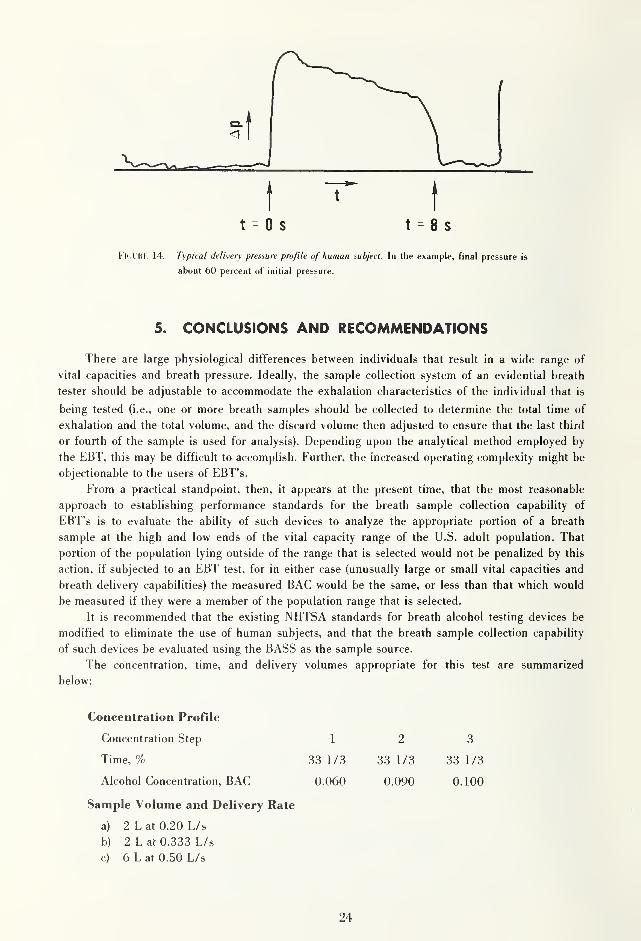
physiological delivery rates typically decrease significantly from high initial values to much lower
ones at the end of sample delivery (see table 2, and fig. 14). Thus the values of (^|„„,„ in the table
are not representative of the flow rate at the end of expiration, which are significantly lower.
Nevertheless, the foregoing discussion tends to support reducing flow resistance in breath testers
and, perhaps, revision of the existing standard for breath testers to encourage designers to
accomplish this. To this end, a conservative recommendation for maximum allowable back
pressure for future breath testers at a delivery rate of 0.50 L/s, 6 L total volume, would be no
more than 50 cm HjO. Since the effect of excessive delivery pressure is to underestimate BAG. it
would not appear to be necessary to impose the above requirement on present testers, for these
testers tend to make up a progressively smaller portion of the market. A lower limit for delivery
rate is not critical and may be set more arbitrarily at about 0.20 L/s and 2 L total volume.
23
t^
t
t = 0 s t = 8 s
FkjL'KK 14. Typical delivery pressure profile of human subject. In the example, final pressure is
about 60 percent of initial pressure.
5. CONCLUSIONS AND RECOMMENDATIONS
There are large physiological differences between individuals that result in a wide range of
vital capacities and breath pressure. Ideally, the sample collection system of an evidential breath
tester should be adjustable to accommodate the exhalation characteristics of the individual that is
being tested (i.e., one or more breath samples should be collected to determine the total time of
exhalation and the total volume, and the discard volume then adjusted to ensure that the last third
or fourth of the sample is used for analysis). Depending upon the analytical method employed by
the EBT, this may be difficult to accomplish. Further, the increased operating complexity might be
objectionable to the users of EBT's.
From a practical standpoint, then, it appears at the present time, that the most reasonable
approach to establishing performance standards for the breath sample collection capability of
EBT's is to evaluate the ability of such devices to analyze the appropriate portion of a breath
sample at the high and low ends of the vital capacity range of the U.S. adult population. That
portion of the population lying outside of the range that is selected would not be penalized by this
action, if subjected to an EBT test, for in either case (unusually large or small vital capacities and
breath delivery capabilities) the measured BAG would be the same, or less than that which would
be measured if they were a member of the population range that is selected.
It is recommended that the existing NHTSA standards for breath alcohol testing devices be
modified to eliminate the use of human subjects, and that the breath sample collection capability
of such devices be evaluated using the BASS as the sample source.
The concentration, time, and delivery volumes appropriate for this test are summarized
below:
Concentration Profile
Concentration Step 12 3
Time, % 33 1/3 33 1/3 33 1/3
Alcohol Concentration, BAC 0.060 0.090 0.100
Sample Volume and Delivery Rate
a) 2 L at 0.20 L/s
b) 2 L at 0.333 L/s
c) 6 L at 0.50 L/s
24
The use of the BASS test profiles noted above will apply only to the evaluation of the breath
sampling capability of breath alcohol devices. The other tests within the NHTSA standards, such
as precision and accuracy and environmental testing would be retained without change.
The BASS test profiles have been selected to ensure that EBT's are capable of accurately
measuring the BAG of a large portion of the adult U.S. population, without placing unduly
restrictive requirements upon the manufacturers of such devices. For example, while tests with
human subjects have shown that in some cases the delivery time for an individual might be as
long as 17 s, a test time of 12 s at a flow rate of 0.5 L has been selected. This is a consequence of
the fact that under prolonged delivery times, the delivery rate of an indivdual decreases rapidly. It
would not be realistic to require that the unit under test accommodates the 0.5 L constant flow for
a period as long as 17 s.
Appendix A—References
|l| Uniform vehicle code. Available from: National (]ommis>ion on Traffic l.aws and ()rdinani-es. 52S School St.. NW..
Washington, DC 20024.
[2] Jones, A. W.; Wright, B. M.; Jones, T. P. A historical and ex()erimental study of the breath/hlood alcohol ratio.
Israelstram, S.; Lambert, S., ed. Proceedings of the Sixth International (Conference on Drugs, and Traffic Safety;
1974 September 8-13; Toronto; Addiction Research Foundation of Ontario, Toronto; 197.5.
[3] Voas, R. B.; Moulden, J. V. Breath measurement instrumentations in the U.S. Tech. Note DOT HS-801 621;
Washington, DC: National Highway Traffic Safety Administration; 1975 June.
(4| Evidential breath testers for alcohol content. Federal Register. 38(212): 30459-30463; 1973 November 5.
[5] Calibrating units for breath alcohol testers. Federal Register. 40(161): 36167-36171; 1975 August 19.
[6| Flores, A. L. Rebreathed air as a reference for breath alcohol testers. Report No. DOT-TSC-NHTSA-74-4; 1975
January. Available from: NTIS.
[7] Dubowski, K. M. A study of characteristics of a reliable vs. practical breath alcohol screening test. Report No. DOT-
TSC-NHTSA-76-4; 1975 August.
[8] Dubowski, K. M. Biological aspects of breath-alcohol analysis. Clin. Chem. 20/21: 294-299; 1974.
[9] Harger, R. N.; Raney, B. B.; Bridwell, E. G.; Mitchell, M. F. The partition ratio of alcohol between air and water.
urine and blood, estimation and identification of alcohol in these liquids from analyses of air equilibrium with
them. J. Biol. Chem. 183: 197; 1950.
[10] Harger, R. N.; Forney, R. B.; Baker, R. S. Estimation of the level of blood alcohol from analysis of breath, (^uarterlv
J. Studies on Alcohol. 17(1); 1956.
[11] Hildebrand, J. Anatomy and physics of respiration. Chapter 20 in Physiology & Biophysics, 20th ed.. Vol. 2, Sec. 2.
Ruch, T. C; Patton. J. D.. ed. Philadelphia, PA: W. B. Saunders Co.; 1974. 297-324.
[12] Rohrer, F. Der zusammenhang der atemkrafte and ihre abhangigkeit vom dehnungszustand der atmungsorgame.
Pfliiger's Arch. f. d. ges. Physiol. 165: 419; 1916.
25

ANNOUNCEMENT OF NEW PUBLICATIONS ONNATIONAL CRIME AND RELATED SUBJECTS
Superintendent of Documents,
Government Printing Office,
Washington, D.C. 20402
Dear Sir:
Please add my name to the announcement list of new publications to be issued
on the above subjects (including this NBS series):
Name
Company .
Address
City State Zip Code
(Notification Key N-538)
if U.S. GOVERNMENT PRINTING OFFICE: 1981 —340-997 '1720


U.S. DEPARTMENT OF COMMERCENational Bureau off StandardsWashington, O.C. S0234
OFFICIAL BUSINESS
Penalty for Private Use. S300
POSTAGE AND FEES PAIOU.S. DEPARTMENT OF COMMERCE
COM-215U.S.MAIL
3rd Class
\