breakdown of cyanide and cholecalciferol in feratox and ... · cholecalciferol in feratox and ......
TRANSCRIPT
Breakdown of cyanide and cholecalciferol in Feratox and Feracol possum baits
Malcolm Thomas and Philip Ross
DOC ReseaRCh & DevelOpment seRies 288
Published by
Science & Technical Publishing
Department of Conservation
PO Box 10420, The Terrace
Wellington 6143, New Zealand

DOC Research & Development Series is a published record of scientific research carried out, or advice
given, by Department of Conservation staff or external contractors funded by DOC. It comprises reports
and short communications that are peer-reviewed.
Individual contributions to the series are first released on the departmental website in pdf form.
Hardcopy is printed, bound, and distributed at regular intervals. Titles are also listed in our catalogue on
the website, refer www.doc.govt.nz under Publications, then Science & technical.
© Copyright November 2007, New Zealand Department of Conservation
ISSN 1176–8886 (hardcopy)
ISSN 1177–9306 (web PDF)
ISBN 978–0–478–14342–3 (hardcopy)
ISBN 978–0–478–14343–0 (web PDF)
This report was prepared for publication by Science & Technical Publishing; editing by Helen O’Leary
and layout by Amanda Todd. Publication was approved by the Chief Scientist (Research, Development &
Improvement Division), Department of Conservation, Wellington, New Zealand.
In the interest of forest conservation, we support paperless electronic publishing. When printing,
recycled paper is used wherever possible.

CONTeNTS
Abstract 5
1. Introduction 6
2. Background 6
2.1 Persistence of toxins 6
2.2 Feratox 7
2.2.1 Toxicity of cyanide 7
2.2.2 environmental fate of cyanide 7
2.3 Feracol 8
2.3.1 Toxicity of cholecalciferol 8
2.3.2 environmental fate of cholecalciferol 8
2.4 Ferafeed paste and block formulations 9
2.5 Using Feratox and Feracol 9
3. Objectives 10
4. Methods 10
4.1 Measuring the decline in toxin concentration 10
4.2 Measuring risk to target and non-target animals 11
5. Results and discussion 13
5.1 Decline in toxicity 13
5.1.1 Decline in cyanide concentration 13
5.1.2 Decline in cholecalciferol concentration 16
5.2 Risks to non-target species 18
5.2.1 Feratox 18
5.2.2 Feracol 20
6. Conclusions 21
7. Recommendations 23
8. Acknowledgements 23
9. References 24
Appendix 1
Weight categories for dogs and associated representative breeds 26
Appendix 2
Cyanide breakdown in Feratox baits 27
Appendix 3
Cholecalciferol breakdown in Feracol baits 28


5DOC Research & Development Series 288
Breakdown of cyanide and cholecalciferol in Feratox and Feracol possum baits
Malcolm Thomas1 and Philip Ross2
1 Pest Control Research Ltd, PO Box 7223, Christchurch 8240,
New Zealand. email: [email protected]
2 Coffey Geotechnics, 26 Patey Street, Newmarket, Auckland 1051,
New Zealand
A B S T R A C T
Feratox®, which contains potassium cyanide, and Feracol®, which
contains cholecalciferol (vitamin D3), are two baits commonly used
for possum (Trichosurus vulpecula) control. This study aimed
to determine the persistence of the toxins in these two baits,
which are often left in the field for several months. In this study,
monthly samples of weathered baits were collected from two sites
(wet and dry) over 1 year. These were assayed to measure the concentration
of cyanide and cholecalciferol to determine decay rates. Decay of cyanide
(in Feratox) depended on how long the surface coating on the Feratox
capsule remained intact: once the coating ruptured, the cyanide decayed
rapidly. Results indicated that the coating could remain intact for 8 months
retaining 100% of the cyanide toxicity. Cholecalciferol (in Feracol) decayed
at a steady rate, retaining 50% of its toxicity after 8 months and 30% after
11 months. We conclude that both target and non-target animals will be at
risk from poisoning for at least 8 months from the cyanide in Feratox baits
and for at least 12 months from the cholecalciferol in Feracol baits. Therefore,
we recommend that Feratox and Feracol baits be removed from the field
after 1 month to reduce risks of sub-lethal and non-target poisoning.
Keywords: possum, pest control, baits, cyanide, Feratox®, Feracol®,
cholecalciferol, environmental fate, New Zealand
© November 2007, New Zealand Department of Conservation. This paper may be cited as:
Thomas, M.; Ross, P. 2007: Breakdown of cyanide and cholecalciferol in Feratox and
Feracol possum baits. DOC Research & Development Series 288. Department of
Conservation, Wellington. 28 p.

6 Thomas & Ross—Breakdown of cyanide and cholecalciferol in possum baits
1. Introduction
Feratox® and Feracol® are two possum baits manufactured by Connovation
Ltd (east Tamaki, Auckland). These baits are commonly used to control
possums (Trichosurus vulpecula) by the Department of Conservation (DOC)
(Thomas 2005). However, there is limited information on the breakdown
rates of these baits in the field. This study was undertaken to investigate
breakdown rates and to use this information to calculate potential risks to
target and non-target species.
2. Background
2 . 1 P e R S I S T e N C e O F T O x I N S
Materials exposed to ambient conditions in the environment may be affected
by physical, chemical and biological action that is capable of causing
significant alterations to the material. Physical attack on materials involves
the direct action of heat, light, wind, water and physical abrasion. Chemical
attacks on materials may involve a variety of reactants: oxidisers, reducing
agents, and other substances that promote solubility or otherwise react with
the material in question. Finally, biological attack involves the action of fungi,
bacteria, plants and animals.
These agents may act alone or together to bring about the complex changes
that are collectively described as deterioration or breakdown of a material.
Where specific factors interact (such as light, moisture, UV radiation, bacterial
action and the action of oxygen), the breakdown rate will be the result of a
complex suite of conditions. It is possible that a relatively small change in
one factor could result in a large change in the apparent breakdown rate.
Toxins that resist physical, chemical and biological breakdown can persist in
the environment for long periods of time. However, even toxins that readily
break down can be made more stable by using coatings that can reduce
the action of moisture, UV radiation, oxygen and bacteria, and thus slow
breakdown rates. For example, the encapsulation of cholecalciferol in a gel,
or wax coating of cereal baits that contain the anticoagulant brodifacoum,
can reduce the breakdown of these toxins (Morgan 2004).
Persistence can arise from the nature of the compound (e.g. being stable
and relatively unreactive) or from the conditions to which the compound
is exposed. It is important to differentiate between persistence that is an
inherent property of the material as opposed to the circumstances in which
the chemical is present. For example, a material may degrade rapidly in
warm, aerobic conditions but persist indefinitely under cool, anaerobic
conditions.

7DOC Research & Development Series 288
In Feratox, cyanide is encapsulated within a hard coating, and in Feracol,
cholecalciferol is covered with an oil and fat coating. These coatings are
likely to extend the baits’ field lives. However, little is known about how
long these baits remain toxic. This study was designed to measure their field
lives and to use this information to evaluate risks to target and non-target
mammals and birds.
2 . 2 F e R A T O x
Feratox was developed in 1996 principally to overcome cyanide shyness,
which can occur following the use of cyanide paste baits (Warburton &
Drew 1994; Morgan et al. 2001). In Feratox baits, a 5-mm-diameter pellet of
> 50% potassium cyanide (KCN) is encapsulated within a hard coating that
protects the cyanide from air and moisture. As long as the coating remains
intact, the potassium cyanide can be expected to remain relatively stable.
To be effective against possums, the Feratox pellet needs to be crushed by
their teeth when the non-toxic paste or block formulation that encloses the
pellet is eaten (see section 2.4). Cyanide kills possums within an average
time of 18 min (Gregory et al. 1998). Feral IP Ltd owns the registration for
this product (registration number P004713), which is registered to contain
475 g/kg (47.5% wt/wt) of potassium cyanide.
2.2.1 Toxicity of cyanide
Cyanide is a small molecule (molecular weight = 65.12) that can rapidly cross
membranes and directly interact with cellular metabolism. The cytochrome C
oxidase enzyme system can be blocked by cyanide during lethal exposure;
death follows rapidly due to failure of the respiratory and central nervous
systems.
2.2.2 Environmental fate of cyanide
The behaviour of cyanide in the environment has been extensively studied in
association with its use as an industrial chemical, mainly in the gold mining
industry. Cyanide is quite mobile due to its high solubility in water and
moderate rates of volatilisation. In natural water and soil solutions, cyanide
occurs in equilibrium primarily in two forms: molecular hydrogen cyanide
(HCN) and the dissociated cyanide ion (CN–). The ion can form simple
cyanide salts as well as oxidised cyanate (OCN–) and thiosulphate (SCN–)
compounds. The form of cyanide is largely dictated by the solution’s pH.
At neutral and acidic pH, cyanide is present as molecular HCN. At alkaline
pH (e.g. > 8), cyanide is present as CN–. The molecular form is prone to
volatilisation through gaseous release, while the ionic form is more likely
to react with metals and organic matter, and precipitate out of solutions
(Moran 1998).
environmental conversions of cyanide can occur rapidly and be significantly
affected by temperature and radiation (particularly UV wavelengths).
Several of the metallocyanide complexes (ferricyanides, cuprocyanides
and cobalocyanides) may be degraded solely by photolysis (Moran 1998).

8 Thomas & Ross—Breakdown of cyanide and cholecalciferol in possum baits
Cyanides can also be degraded by microbial action. A wide range of
bacterial genera can metabolise cyanide and some can use it as their sole
carbon source, although these processes may be impaired at higher cyanide
concentrations, when the toxicity of cyanide affects bacterial metabolism
(Akcil & Mudder 2003). Cyanide metabolism can convert cyanide to carbon
dioxide, nitrogen ammonia and a range of organic nitrogen compounds.
2 . 3 F e R A C O L
Feracol is a paste and block bait (see section 2.4) that was developed in
2000. It contains cholecalciferol (or vitamin D3) at a concentration of 8 g/kg
(0.8% wt/wt). Feral IP Ltd owns the registration for this product (registration
number P005263). Cholecalciferol was developed as a rodenticide in the
USA and europe in the early 1980s (Marshall 1984), and was subsequently
shown to be effective for possum control in the early 1990s (eason 1992).
It kills possums in an average of 7 days (Wickstrom et al. 1997; Morgan &
Rhodes 2000a).
2.3.1 Toxicity of cholecalciferol
Cholecalciferol is a large organic molecule (molecular weight = 384.62) that is
fat soluble and collects in adipose tissue. Low levels are required to prevent
deficiency disease, but high doses are toxic. Toxic amounts of cholecalciferol
promote mobilisation of calcium from bones, leading to high blood calcium
concentrations and calcification of other tissues. This appears to cause
hypercalcaemia, tissue calcification and renal or cardiac failure leading to
death in the possum (Jolly et al. 1993).
2.3.2 Environmental fate of cholecalciferol
Unlike cyanide, there are no published data on the fate of cholecalciferol
in soil and water (eason & Wickstrom 2001). However, some studies have
been undertaken to examine the fate of cholecalciferol in possum baits.
Booth et al. (1999) exposed cereal pellets containing cholecalciferol to
400 mm of simulated rainfall and found that the cholecalciferol concentration
remained at the same level as unexposed baits even though the pellets had
been reduced to a water-saturated paste. They also found that soil under
the exposed baits contained very small quantities of cholecalciferol (2% of
the concentration in the baits), even after the baits had been exposed to
500 mm of simulated rainfall. Morgan (2004) measured the natural breakdown
of cholecalciferol in paste baits (Feracol) that had been protected from
the weather using plastic bottles and in gel baits (Kiwicare, ‘No Possums
Cholecalciferol Gel Bait’) that were used in purpose-designed bait stations in
Westland, New Zealand. He found that there was no decline in cholecalciferol
levels in the paste bait after 12 months and no decline in gel baits after
25 months.

9DOC Research & Development Series 288
2 . 4 F e R A F e e D P A S T e A N D B L O C K F O R M U L A T I O N S
In order to use Feratox, Connovation Ltd developed a non-toxic paste bait
called Ferafeed® paste (Morgan & Rhodes 2000b), which acts as a carrier for
the Feratox pellets. This bait consists of a mixture of oils, vegetable fat and
cereals, and contains hard lumps of cereal of a similar size and dimension to
Feratox pellets. These lumps act as placebos to condition possums to eating
hard pellets so they are more likely to crush the Feratox pellets. Feracol
consists of Ferafeed without the Feratox and placebos but with 0.8% wt/wt
cholecalciferol.
Connovation Ltd also developed a 20-g Ferafeed® block formulation that
also contains either Feratox or cholecalciferol. The size of the blocks is
40 × 40 × 20 mm and they are made from a mixture of vegetable fat, sugar
and ground cereal. The block formulation was developed so that Feratox and
Feracol could be handled more easily in the field. It was also intended as a
more water-resistant option to the paste formulation, to provide a long-life
bait formulation.
2 . 5 U S I N G F e R A T O x A N D F e R A C O L
Feratox and Feracol can be used in standard,
commercially available bait stations such as
the Philproof, Kilmore and Sentry bait stations
(Thomas et al. 1996). However, a more cost-
effective method is the use of small paper bait
bags (Fig. 1). Since the baits and bait bags are
lightweight, many can be carried, allowing large
areas to be treated quickly. The bait bags are
stapled to trees or fence posts, approximately
100–400 mm above the ground and are often
accompanied with a blaze of flour to attract possums
(Thomas et al. 2003). Cost-effectiveness is
commonly increased by not undertaking any bait
retrieval, instead relying on the baits and bait bags
being broken down by the various environmental
conditions present at the baiting site. Because bait
bags are a commonly used bait delivery method for Feratox and Feracol, the
degredation of baits enclosed in bait bags was measured in this study.
Figure 1. Paper bait bag commonly used to deploy Feratox and Feracol in the
field. The bags are attached to trees or fence posts and
are ripped open by possums (Trichosurus vulpecula) to
gain access to the bait.

10 Thomas & Ross—Breakdown of cyanide and cholecalciferol in possum baits
3. Objectives
The objectives of this study were to:
Measure the decline in cholecalciferol (Feracol) and cyanide (Feratox)•
concentrations when used in bait bags exposed to natural weathering.
Compare cholecalciferol and cyanide concentrations (calculated from •
the measured rates of decline) with known LD50 figures for birds and
mammals to calculate the period when target and non-target species are
likely to be at risk from poisoning.
4. Methods
4 . 1 M e A S U R I N G T H e D e C L I N e I N T O x I N C O N C e N T R A T I O N
Two study sites that had rainfall and sunlight extremes were selected, so
that the effects of minimum and maximum weathering conditions (i.e. the
longest and shortest periods that baits are likely to remain toxic) could be
studied. The ‘dry’ site was a grassland area (0.1 ha) located at Twizel in the
Mackenzie Basin (44°15′S, 170°5′e). The ‘wet’ site was a small, broadleaf
podocarp forest (5 ha) located at Paroa near Greymouth on the West Coast
of the South Island (42°30′S, 171°10′e).
Bait bags containing 20 g of Ferafeed paste or block baits containing either
one pellet of Feratox or 0.8% wt/wt cholecalciferol were deployed in the
field at the Mackenzie Basin and West Coast sites from August 2004 to
July 2005. For each treatment variant (see below), 24 bait bags (i.e. two for
each monthly sample) were placed within wire cages to prevent baits being
eaten by birds, rodents or possums (Fig. 2). Bait bags were either elevated
above the ground to simulate bait bags attached to trees or located on the
ground to simulate bait bags that had fallen to the ground.
The four treatments were:
Ferafeed paste containing Feratox (Feratox paste) elevated or on the •
ground
Ferafeed block containing Feratox (Feratox block) elevated or on the •
ground
Ferafeed paste containing cholecalciferol (Feracol paste) elevated or on •
the ground
Ferafeed block containing cholecalciferol (Feracol block) elevated or on •
the ground
For each treatment type (i.e. cyanide or cholecalciferol, paste or block,
elevated or ground, West Coast or Mackenzie Basin), one bait bag was

11DOC Research & Development Series 288
collected each month and then frozen. These samples (48 for paste containing
cholecalciferol, 48 for blocks containing cholecalciferol, 48 for paste
containing Feratox pellets and 48 for blocks containing Feratox pellets) were
sent to Hill Laboratories (Hamilton) for analysis to determine cholecalciferol
content (g/kg) and cyanide content (mg/Feratox pellet). Graphs were plotted
for each treatment type and regression analyses undertaken to record the
reduction of toxin concentration for the treatment types at the two study
sites.
4 . 2 M e A S U R I N G R I S K T O T A R G e T A N D N O N -T A R G e T A N I M A L S
The risk of target and non-target poisoning from degraded baits was
determined using published acute oral toxicity LD50 data (mg/kg) for cyanide
and cholecalciferol for the possum, Norway rat (Rattus norvegicus), mouse
(Mus musculus), mallard duck (Anas patyrhyncos), rabbit (Oryctolagus
cuniculus) and goat (Capra hircus), taken from eason & Wickstrom (2001);
values for cholecalciferol in the domestic dog (Canis familiaris) were taken
from eason & Wickstom (2001) and those for cyanide in the dog from
Sterner (1979). In toxicology, the median lethal dose or LD50 (abbreviation
for ‘Lethal Dose, 50%’) of a toxic substance is the dose required to kill
half the members of a test population. LD50 figures are frequently used as
a general indicator of a substance’s acute (i.e. lethal) toxicity.
The threshold dose required to kill 50% of a test sample for these animals
was then estimated as the published acute oral LD50 × the mean weight of
each species (Table 1). Mean weights for the possum, rat, mouse, rabbit and
goat were sourced from King (1990), while the mean weight for the mallard
duck was sourced from the website http://animals.nationalgeographic.com/
animals/birds/mallard-duck.html (viewed 15 September 2007). Because of the
diverse size differences of different breeds of dog, this species was divided
Figure 2. example of the wire cage used to protect
the baits from animals and birds when the bait bags
were deployed in the field.

12 Thomas & Ross—Breakdown of cyanide and cholecalciferol in possum baits
into five weight categories based on information sourced from the website
www.pgaa.com/canine/general/size.html (viewed 16 September 2007). These
categories were: miniature (2–5 kg), small (5–11 kg), medium (11–27 kg), large
(27–36 kg) and very large (36–70 kg). Representative breeds for these weight
classes are shown in Appendix 1.
The total amount of toxin in a fresh bait was calculated by taking the mean
concentration of toxin recorded in fresh bait in this study (8 mg/g for Feracol
and 47.5 mg/g for Feratox pellets) and multiplying it by the mean weight of
the bait (20 g for Feracol and 1 g for Feratox). These thresholds were graphed
along with the decline in concentration of cyanide and cholecalciferol in bait
as determined from this study.
The risk of poisoning target and non-target animals was calculated as the
period from bait deployment (i.e. August 2004) to the time when the
amount of toxin remaining in the bait was less than the published LD50
value. The rate at which the toxin in the bait declined was calculated from
the regression relationships derived from the results of this study using the
following formula:
Toxint = Toxin1 + (Φt)
Where Toxint = the toxin remaining at time t after deployment; Toxin1 = the
initial toxin concentration at bait deployment; Φ = mg of toxin lost per month
calculated from the toxin breakdown data determined from this study; and
t = the time for which the toxin was exposed in the field (months).
Our calculations assumed that the full amount of bait (i.e. one Feratox pellet
or 20 g of Feracol) was consumed. For smaller animals such as mice, this is
unlikely to occur; therefore, the risk to these smaller animals is likely to be
lower than estimated. For larger animals, no attempt was made to evaluate
toxicity associated with the animal eating more than one bait, although that
would increase the risk.
TABLe 1. PUBLISHeD ORAL LD50 VALUeS (mg/kg) FOR CyANIDe AND CHOLeCALCIFeROL, AND MeAN WeIGHTS
FOR A RANGe OF SPeCIeS. THe AMOUNT OF eACH TOxIN (mg) TO KILL 50% OF THe INDIVIDUALS IN A
POPULATION, BASeD ON THeSe VALUeS, IS ALSO eSTIMATeD. See APPeNDIx 1 FOR DOG SIZe CATeGORIeS.
ANIMAL ORAL LD50 (mg/kg) MeAN WeIGHT OF AMOUNT TO ReACH LD50 (mg)
CyANIDe CHOLeCALCIFeROL INDIVIDUAL (kg) CyANIDe CHOLeCALCIFeROL
Possum 8.7 16.8 2.8 24.4 47
Rabbit 4 9 1.4 5.6 12.6
Mouse 6.4 43.6 0.02 0.16 0.9
Rat 6.4 42.5 0.2 1.3 12.7
Duck 1.4 2000 1.2 1.7 2400
Goat 4 Unknown 36 144 Unknown
Dog (miniature) 5.4 80 3 16.2 240
Dog (small) 5.4 80 8 43.2 640
Dog (medium) 5.4 80 19 102.6 1520
Dog (large) 5.4 80 31 167.4 2480
Dog (very large) 5.4 80 50 270 4000

13DOC Research & Development Series 288
5. Results and discussion
5 . 1 D e C L I N e I N T O x I C I T y
5.1.1 Decline in cyanide concentration
The cyanide content (mg/Feratox pellet) of both the block and paste baits
showed a significant decline over the 12-month sampling period at both sites
(Figs 3 & 4, Table 2) with one exception, the block bait on the ground at the
West Coast site. This exception occurred because cyanide in this sample was
only recorded as present at the start of the study and was absent from all
other sampling periods (Fig. 3, Table 2). There was a rapid reduction in the
average cyanide concentration within 3 months at the West Coast site and
an intermittent reduction for up to 8 months at the Mackenzie Basin site.
However, there was no significant difference in the overall breakdown rates
0
10
20
30
40
50
60
Bait de
ploye
d
Aug-04
Sep-04
Oct-04
Nov-04
Dec-04
Jan-0
5
Feb-05
Mar-05
Apr-05
May-05
Jun-0
5Ju
l-05
Month
Cya
nide
(mg/
pelle
t)
Mackenzie block elevatedMackenzie block groundWest Coast block elevatedWest Coast block ground
0
10
20
30
40
50
60
Bait de
ploye
d
Aug-04
Sep-04
Oct-04
Nov-04
Dec-04
Jan-0
5
Feb-05
Mar-05
Apr-05
May-05
Jun-0
5Ju
l-05
Month
Cya
nide
(mg/
pelle
t)
Mackenzie paste elevatedMackenzie paste groundWest Coast paste elevatedWest Coast paste ground
Figure 4. Changes in monthly cyanide
concentrations (mg/pellet) in elevated or ground-level Feratox pellets embedded in paste baits exposed to
natural weathering at sites in the Mackenzie Basin and
West Coast.
Figure 3. Changes in monthly cyanide
concentrations (mg/pellet) in elevated or ground-level Feratox pellets embedded in block baits exposed to
natural weathering at sites in the Mackenzie Basin and
West Coast.

14 Thomas & Ross—Breakdown of cyanide and cholecalciferol in possum baits
between study sites (F = 2.2, df = 1, 24, P = 0.14). This may have been due to
the highly variable cyanide concentrations that were collected (see below).
Individual decay graphs for cyanide are shown in Appendix 2.
The cyanide samples were commonly found to contain either high cyanide
levels or no cyanide. This ‘all or nothing’ nature of the cyanide samples made
statistical analysis difficult because of the variability in the data that it caused.
It seems that the breakdown of the Feratox coating occurred inconsistently,
but once the pellet coating was ruptured there appeared to be rapid decay
of the cyanide contents. Therefore, very few samples had intermediate levels
of cyanide recorded. Rupturing times of the coating appeared highly variable
regardless of the site, bait formulation or bait placement. Although there
were no statistically significant differences in cyanide levels between sites,
the graphs suggest that rupturing of the coating (followed by rapid decay
of cyanide) is more likely to occur at a faster rate at wet sites.
Wright & Manning (2003) found that exposure to water plays a major role
in the breakdown rates of Feratox pellets. They showed that Feratox pellets
immersed in water release about 90% of their cyanide after 34 days compared
to Feratox pellets immersed in moist soil, which release only about 50% of
their cyanide over the same period.
While collecting the samples, rupturing of the Feratox coating could be
observed visually in the form of a brown stain on the surface of the Feratox
pellet. This staining occurs following the ingress of moisture through the
pellet coating and its resulting reaction with the cyanide. Initially, the stain
appeared as a small spot; however, it increased in size as the pellet swelled
and more moisture entered the pellet. Because laboratory analysis tended
to indicate an all or nothing cyanide content, the monthly sampling period
appeared to be inadequate to measure the decline once the coating was
ruptured. Therefore, in retrospect, we consider that a visual assessment of
the pellets rather than a laboratory assessment of the cyanide content would
be a cheaper and more practical method of assessing the breakdown of
cyanide in Feratox pellets.
We propose that in future studies, a sample of approximately 20 pellets be
visually examined for each monthly sampling period instead of undertaking
SITe BAIT TyPe POSITION P ReGReSSION COeFFICIeNT
Mackenzie Cyanide block elevated < 0.05 –3.85
Mackenzie Cyanide block Ground < 0.01 –3.37
Mackenzie Cyanide paste elevated < 0.05 –3.26.
Mackenzie Cyanide paste Ground < 0.01 –3.87
West Coast Cyanide block elevated < 0.05 –2.57
West Coast Cyanide block Ground > 0.05 n.s. –1.49
West Coast Cyanide paste elevated < 0.05 –2.95
West Coast Cyanide paste Ground < 0.05 –2.66
TABLe 2. ReGReSSION COeFFICIeNTS AND LeVeLS OF SIGNIFICANCe FOR
CyANIDe SAMPLeS (n = 12) exPOSeD TO WeATHeRING FOR 12 MONTHS AT
MACKeNZIe BASIN AND WeST COAST SITeS IN eITHeR PASTe OR BLOCK BAIT
FORMULATIONS LOCATeD ON THe GROUND OR eLeVATeD.
15DOC Research & Development Series 288
a laboratory assay of the cyanide content. This will provide larger sample
sizes and less variability than the current laboratory method, where the
sample size was restricted because of the cost of the chemical analyses.
Prior to undertaking such sampling, it would be necessary to conduct a
study to determine how quickly the cyanide in the Feratox pellets breaks
down once the coating has ruptured when surrounded with media containing
different moisture contents. The study should record the percentage of the
coating that has a brown stain and calibrate this with an assay of cyanide
concentration (mg/pellet).
Overall, it appears that the cyanide in Feratox used in dry sites in New
Zealand, such as Central Otago, Mackenzie Basin and parts of Canterbury,
is more likely to persist for longer periods than that in Feratox used at
wet sites, such as the West Coast, although this was not proven statistically
in this study. Also, although we were unable to detect a statistically
significant difference in the breakdown rates of Feratox in the paste and
block formulations, we consider that Feratox pellets that are enclosed in
more water-resistant baits, such as the block formulation, will persist for
longer periods than pellets enclosed in paste. Additional studies should be
conducted to further test this prediction.
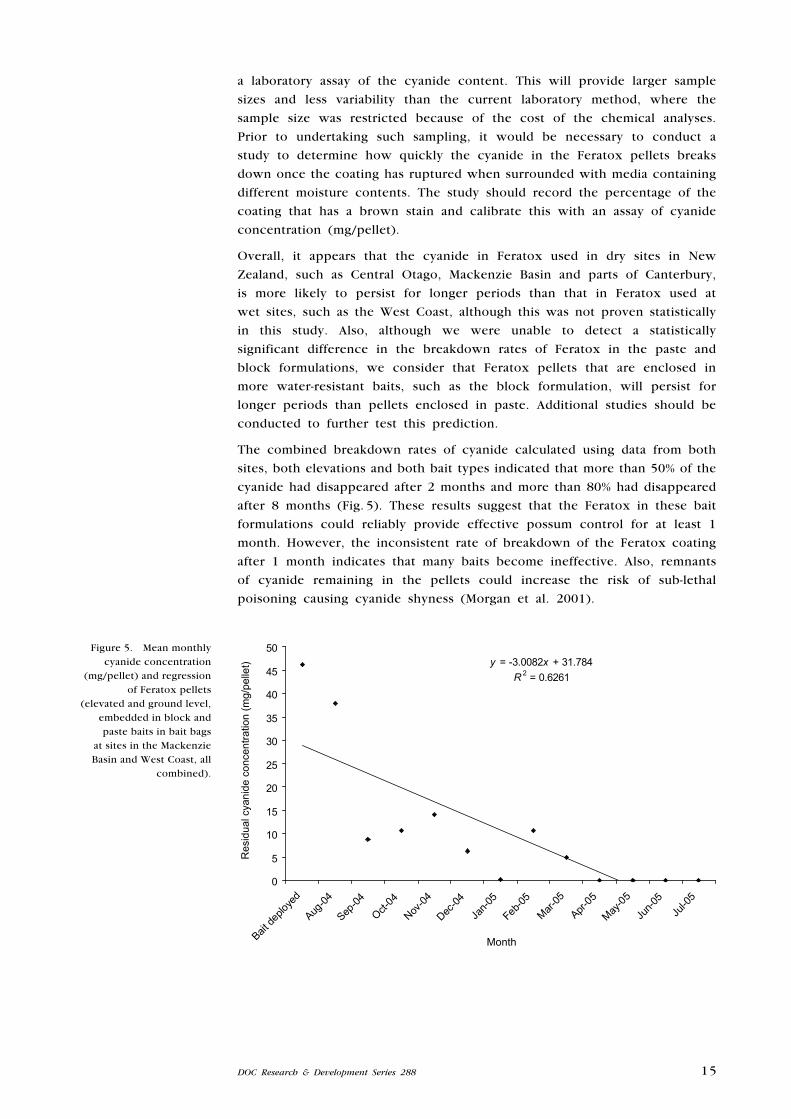
The combined breakdown rates of cyanide calculated using data from both
sites, both elevations and both bait types indicated that more than 50% of the
cyanide had disappeared after 2 months and more than 80% had disappeared
after 8 months (Fig. 5). These results suggest that the Feratox in these bait
formulations could reliably provide effective possum control for at least 1
month. However, the inconsistent rate of breakdown of the Feratox coating
after 1 month indicates that many baits become ineffective. Also, remnants
of cyanide remaining in the pellets could increase the risk of sub-lethal
poisoning causing cyanide shyness (Morgan et al. 2001).
Figure 5. Mean monthly cyanide concentration
(mg/pellet) and regression of Feratox pellets
(elevated and ground level, embedded in block and paste baits in bait bags
at sites in the Mackenzie Basin and West Coast, all
combined).
y = -3.0082x + 31.784R 2 = 0.6261
0
5
10
15
20
25
30
35
40
45
50
Bait de
ploye
d
Aug-04
Sep-04
Oct-04
Nov-04
Dec-04
Jan-0
5
Feb-05
Mar-05
Apr-05
May-05
Jun-0
5Ju
l-05
Month
Res
idua
l cya
nide
con
cent
ratio
n (m
g/pe
llet)
(mg/
pelle
t)
Month
16 Thomas & Ross—Breakdown of cyanide and cholecalciferol in possum baits
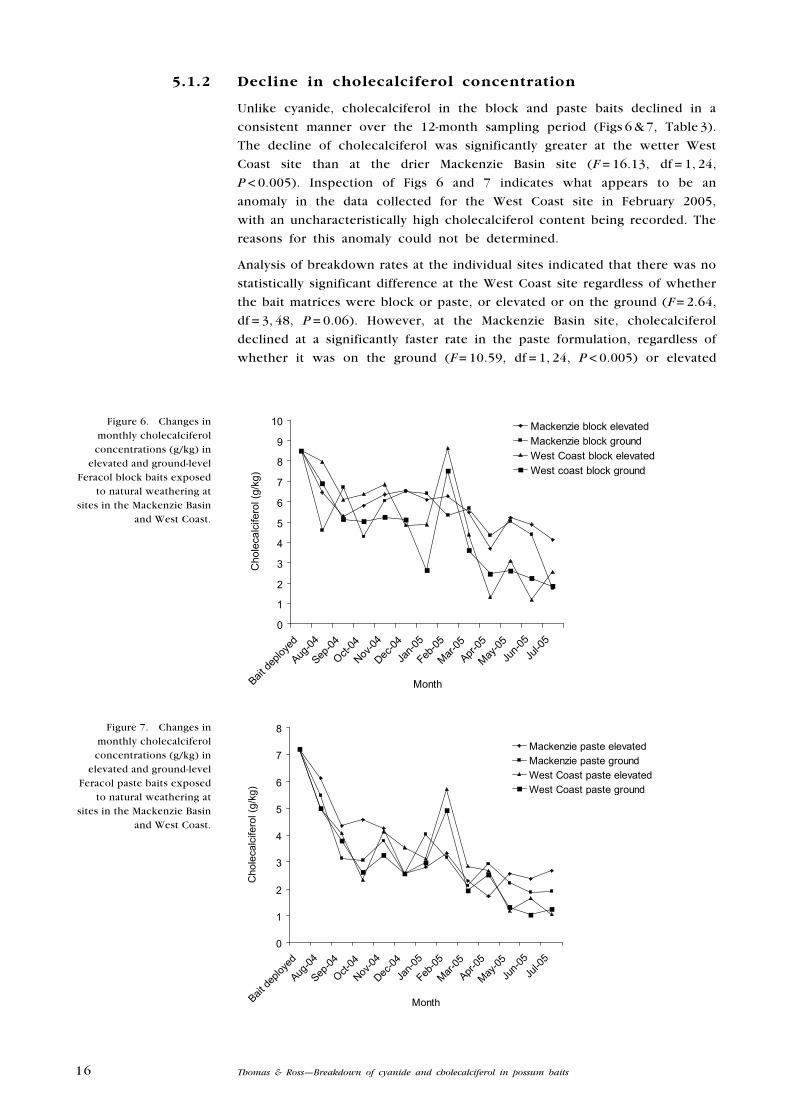
5.1.2 Decline in cholecalciferol concentration
Unlike cyanide, cholecalciferol in the block and paste baits declined in a
consistent manner over the 12-month sampling period (Figs 6 & 7, Table 3).
The decline of cholecalciferol was significantly greater at the wetter West
Coast site than at the drier Mackenzie Basin site (F = 16.13, df = 1, 24,
P < 0.005). Inspection of Figs 6 and 7 indicates what appears to be an
anomaly in the data collected for the West Coast site in February 2005,
with an uncharacteristically high cholecalciferol content being recorded. The
reasons for this anomaly could not be determined.
Analysis of breakdown rates at the individual sites indicated that there was no
statistically significant difference at the West Coast site regardless of whether
the bait matrices were block or paste, or elevated or on the ground (F = 2.64,
df = 3, 48, P = 0.06). However, at the Mackenzie Basin site, cholecalciferol
declined at a significantly faster rate in the paste formulation, regardless of
whether it was on the ground (F = 10.59, df = 1, 24, P < 0.005) or elevated
0
1
2
3
4
5
6
7
8
9
10
Bait de
ploye
d
Aug-04
Sep-04
Oct-04
Nov-04
Dec-04
Jan-0
5
Feb-05
Mar-05
Apr-05
May-05
Jun-0
5Ju
l-05
Month
Cho
leca
lcife
rol (
g/kg
)
Mackenzie block elevatedMackenzie block groundWest Coast block elevatedWest coast block ground
0
1
2
3
4
5
6
7
8
Bait de
ploye
d
Aug-04
Sep-04
Oct-04
Nov-04
Dec-04
Jan-0
5
Feb-05
Mar-05
Apr-05
May-05
Jun-0
5Ju
l-05
Month
Cho
leca
lcife
rol (
g/kg
)
Mackenzie paste elevatedMackenzie paste groundWest Coast paste elevatedWest Coast paste ground
Figure 7. Changes in monthly cholecalciferol concentrations (g/kg) in
elevated and ground-level Feracol paste baits exposed
to natural weathering at sites in the Mackenzie Basin
and West Coast.
Figure 6. Changes in monthly cholecalciferol concentrations (g/kg) in
elevated and ground-level Feracol block baits exposed
to natural weathering at sites in the Mackenzie Basin
and West Coast.

17DOC Research & Development Series 288
(F = 14.59, df = 1, 24, P < 0.005). Individual decay graphs for cholecalciferol
are shown in Appendix 3.
These results indicate that cholecalciferol concentration is likely to decline
more slowly at drier than at wetter sites. Block baits at these drier sites will
retain their cholecalciferol content for a longer period than paste baits. The
mean breakdown rates of cholecalciferol calculated from data from both sites
and both bait types indicate that, overall, the baits retained approximately
50% of their cholecalciferol content after 8 months and about 30% after
11 months (Fig. 8). After 1 month, the cholecalciferol content declined to
approximately 6 g/kg or 0.6% wt/wt. Henderson & Morriss (1996) showed
that baits containing 0.6% wt/wt of cholecalciferol only achieved a 64% kill
of captive possums compared to a 95% kill when using baits containing the
registered 0.8% wt/wt concentration. These results suggest that Feracol baits
as used in this study are only likely to be effective for possum control in
the first month of deployment. Also, the reduction in toxin content could
cause bait shyness, as demonstrated by Morgan & Milne (2002), if the baits
are used for > 1 month.
SITe BAIT TyPe POSITION P ReGReSSION COeFFICIeNT
Mackenzie Cholecalciferol block elevated < 0.01 –0.23
Mackenzie Cholecalciferol block Ground < 0.05 –0.27
Mackenzie Cholecalciferol paste elevated < 0.01 –0.36
Mackenzie Cholecalciferol paste Ground < 0.01 –0.31
West Coast Cholecalciferol block elevated < 0.01 –0.54
West Coast Cholecalciferol block Ground < 0.01 –0.45
West Coast Cholecalciferol paste elevated < 0.01 –0.35
West Coast Cholecalciferol paste Ground < 0.01 –0.36
TABLe 3. ReGReSSION COeFFICIeNTS AND LeVeLS OF SIGNIFICANCe FOR
CHOLeCALCIFeROL SAMPLeS (n = 12) exPOSeD TO WeATHeRING FOR 12 MONTHS
AT MACKeNZIe BASIN AND WeST COAST SITeS IN eITHeR PASTe OR BLOCK BAIT
FORMULATIONS LOCATeD ON THe GROUND OR eLeVATeD.
Figure 8. Mean monthly cholecalciferol
concentrations and regression in elevated and ground-level Feracol block and paste baits in bait bags
at sites in the Mackenzie Basin and West Coast.
y = -0.3601x + 6.802R 2 = 0.7644
0
1
2
3
4
5
6
7
8
9
Bait de
ploye
d
Aug-04
Sep-04
Oct-04
Nov-04
Dec-04
Jan-0
5
Feb-05
Mar-05
Apr-05
May-05
Jun-0
5Ju
l-05
Month
Res
idul
al c
hole
calc
ifero
l con
cent
ratio
n (g
/kg)
18 Thomas & Ross—Breakdown of cyanide and cholecalciferol in possum baits
5 . 2 R I S K S T O N O N - T A R G e T S P e C I e S
5.2.1 Feratox
Graphs of residual toxicity and the susceptibility of target and non-target
animals from cyanide poisoning with Feratox showed that there is a risk
of poisoning non-target species for up to approximately 12–16 months
(Fig. 9).
Rats and mice are unlikely to be able to break the Feratox coating; therefore,
they would be at low risk of being killed by Feratox baits. However, it is
feasible that rats and mice could be killed once the coating has ruptured
exposing the cyanide. Mice would require only 0.3% of the cyanide in a
Feratox pellet and rats 3% to receive an LD50 dose.
Goats and rabbits are about twice as susceptible as possums to cyanide
poisoning (Table 1). However, a 36-kg goat would need to eat approximately
three Feratox pellets to be at risk of accidental death (Table 1). Domestic
livestock are unlikely to be killed by Feratox baits unless they move along
a Feratox baiting line and eat a series of baits. Miniature and small dogs
could be at risk of accidental death if they eat one Feratox pellet. However,
medium-sized dogs and larger are unlikely to die unless they eat more than
one Feratox pellet (Table 1, Appendix 1).
Birds, such as the mallard duck, are six times more susceptible than possums
to cyanide poisoning (LD50 = 1.4 mg/kg c.f. 8.7 mg/kg for the duck and
possum respectively). A 1.2-kg duck would need to eat only 1.7 mg (about
3% of a Feratox pellet) of cyanide to exceed the estimated LD50. However,
Wiemeyer et al. (1986) recorded considerable variation in the susceptibility
of birds to cyanide poisoning, ranging from 4 mg/kg for the American
kestrel (Falco sparverius) to 21 mg/kg for the domestic chicken (Gallus
domesticus). They also found that the three flesh-eating birds they examined
(American kestrel, black vulture (Coragyps atratus; 4.8 mg/kg) and eastern
screech-owl (Otus asio; 8.6 mg/kg)) were more susceptible to cyanide
poisoning than the birds that fed predominantly on plant material (domestic
chicken, Japanese quail (Coturnix japonica; 9.4 mg/kg) and european starling
(Sturnus vulgaris; 17 mg/kg)). Despite the differences in susceptibility of
these birds to cyanide, all would be at risk of dying if they ate one or
more Feratox pellets.
It is likely that New Zealand native birds will fall within the LD50 range
identified by Wiemeyer et al. (1986), i.e. 4–21 mg/kg. If we assume that the
toxicity of cyanide to New Zealand native birds is the same as the bird that he
found least susceptible to cyanide poisoning (i.e. 21 mg/kg for the domestic
chicken), then all native birds weighing under 2 kg would receive a lethal dose
of cyanide if they ate one Feratox pellet. Information from the website www.
nzbirds.com/birds/gallery.html (viewed 20 September 2007) indicates that few
native birds weigh more than 2 kg, with the exception of the great spotted kiwi
(Apteryx haasti) and the North Island brown kiwi (Apteryx australis). Small
native birds, such as an 11-g tomtit (Petroica macrocephala), would only
need to ingest 0.23 mg of cyanide (< 1% of a Feratox pellet) to exceed an
LD50 of 21 mg/kg.

19DOC Research & Development Series 288
Since intact coatings on Feratox pellets would be difficult to break, especially
for small birds, the risk to small birds is low provided the Feratox coating
remains intact. However, this study has shown that the coating will
decay, exposing the cyanide to small birds. Larger birds that are capable
of swallowing whole Feratox pellets, such as weka (Gallirallus australis),
probably have only limited ability to break the pellet coating—but swallowed
pellets could rupture internally, killing the bird.
Based on the limited information obtained in this study, we conclude that
there is a risk of poisoning from Feratox baits for dogs of < 10 kg in weight
and native birds (with the exception of those over 2 kg) for up to 1 year
after the baits have been deployed in the field. There is likely to be no risk
to larger animals, such as sheep, cattle and deer, unless they move along
bait lines and eat several baits.
Figure 9. Rates of decline of cyanide content
(mg/pellet) in Feratox pellets embedded in paste and block baits, calculated
from regression coefficients determined from recorded decay rates. A. West Coast;
B. Mackenzie Basin. The amounts of cyanide (mg)
required to kill a range of species (calculated from
LD50 values in Table 1) are plotted as horizontal lines. The period of time
(months after application) where cyanide would still
constitute an LD50 dose for these species is the time to the left of where the
horizontal lines intersect the rates of cyanide
decline lines.
0
5
10
15
20
25
30
35
40
45
50
0 2 4 6 8 10 12 14 16 18 20 22 24
Months
Res
idua
l cya
nide
con
cent
ratio
n (m
g/pe
llet)
Elevated blockBlock on groundElevated pastePaste on ground
A
Small dog
Possum
Rabbit
Mallard duckNorway rat
0
5
10
15
20
25
30
35
40
45
50
0 2 4 6 8 10 12 14 16 18 20 22 24
Months
Res
idua
l cya
nide
con
cent
ratio
n (m
g/pe
llet)
Elevated blockBlock on groundElevated pastePaste on ground
B
Small dog
Possum
Rabbit
Mallard duckNorway rat
20 Thomas & Ross—Breakdown of cyanide and cholecalciferol in possum baits
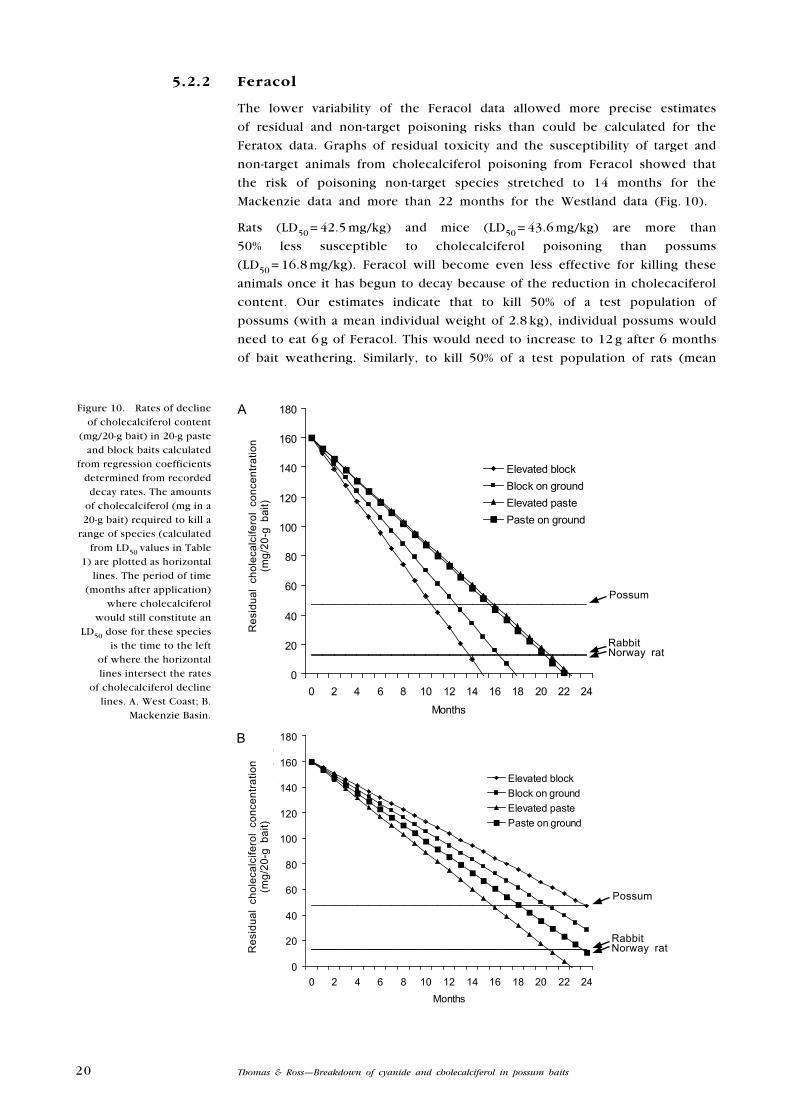
5.2.2 Feracol
The lower variability of the Feracol data allowed more precise estimates
of residual and non-target poisoning risks than could be calculated for the
Feratox data. Graphs of residual toxicity and the susceptibility of target and
non-target animals from cholecalciferol poisoning from Feracol showed that
the risk of poisoning non-target species stretched to 14 months for the
Mackenzie data and more than 22 months for the Westland data (Fig. 10).
Rats (LD50 = 42.5 mg/kg) and mice (LD50 = 43.6 mg/kg) are more than
50% less susceptible to cholecalciferol poisoning than possums
(LD50 = 16.8 mg/kg). Feracol will become even less effective for killing these
animals once it has begun to decay because of the reduction in cholecaciferol
content. Our estimates indicate that to kill 50% of a test population of
possums (with a mean individual weight of 2.8 kg), individual possums would
need to eat 6 g of Feracol. This would need to increase to 12 g after 6 months
of bait weathering. Similarly, to kill 50% of a test population of rats (mean
Figure 10. Rates of decline of cholecalciferol content
(mg/20-g bait) in 20-g paste and block baits calculated
from regression coefficients determined from recorded decay rates. The amounts
of cholecalciferol (mg in a 20-g bait) required to kill a
range of species (calculated from LD50 values in Table
1) are plotted as horizontal lines. The period of time
(months after application) where cholecalciferol
would still constitute an LD50 dose for these species
is the time to the left of where the horizontal lines intersect the rates
of cholecalciferol decline lines. A. West Coast; B.
Mackenzie Basin.
B
0
20
40
60
80
100
120
140
160
180
0 2 4 6 8 10 12 14 16 18 20 22 24Months
Res
idua
l cho
leca
lcife
rol c
once
ntra
tion
(mg/
kg)
Elevated blockBlock on groundElevated pastePaste on ground
Norway ratRabbit
Possum
Res
idua
l ch
olec
alci
fero
l co
ncen
tratio
n
(mg/
20-g
bai
t)
0
20
40
60
80
100
120
140
160
180
0 2 4 6 8 10 12 14 16 18 20 22 24
Months
Res
idua
l cho
leca
lcife
rol c
once
ntra
tion
(mg/
kg)
Elevated blockBlock on groundElevated pastePaste on ground
Norway ratRabbit
Possum
A
Res
idua
l ch
olec
alci
fero
l co
ncen
tratio
n
(mg/
20-g
bai
t)

21DOC Research & Development Series 288
individual weight 200 g), individual rats would need to eat 1.6 g of Feracol
or 3.2 g after 6 months of bait weathering.
Dogs are approximately half as susceptible to cholecalciferol poisoning as
rats (Table 1). Therefore, to kill 50% of a test population of small (8 kg) dogs
(Appendix 1), individuals would need to eat 80 g (four baits) of fresh Feracol
bait or 160 g (eight baits) after 6 months of bait weathering. A medium-
sized dog of 19 kg (Appendix 1) would need to eat almost ten 20-g baits to
receive an LD50 dose. However, managers undertaking possum control using
baits containing cholecalciferol need to be aware that dogs that are sub-
lethally poisoned with cholecalciferol will suffer debilitating effects that are
difficult to remedy, such as metastatic mineralisation throughout the body
(Talcott et al. 1991).
For birds, a mallard duck weighing 1.2 kg would need to eat 300 g of
fresh Feracol bait or 15 20-g baits (about 25% of its body weight). This is
unlikely to occur. If we assume that smaller native birds are as susceptible
to cholecalciferol poisoning as ducks, then a 10-g bird such as a tomtit or a
20-g robin (Petroica australis) would require 2.5 g and 5 g, respectively, of
fresh bait to exceed the estimated LD50 dose—or up to about 25% of their
body weight. However, as various bird species may display different levels
of vulnerability to cholecalciferol (eason & Wickstrom 2001), these estimates
need to be treated with caution.
6. Conclusions
The cyanide in Feratox can break down to undetectable levels within
1 month but can also persist for more than 8 months when used in bait
bags that are exposed to the weather. The breakdown rate of Feratox is
governed by the longevity of its encapsulating coating, which appears to
be highly variable. The life of the coating appears to be governed by the
amount of moisture present, with faster breakdown rates occurring at higher
levels of moisture. Our study could not determine a difference between
breakdown rates when using paste or block baits, but it seems likely that
water-resistant baits and/or protection from weather will prolong the life of
the Feratox pellets.
The cyanide decay data were too variable to determine whether bait position
influenced the decay of cyanide in Feratox pellets. A visual examination of
the integrity of the coatings for a large sample (> 20 pellets) of Feratox rather
than laboratory analysis of a small sample could provide an alternative method
for estimating the breakdown rates of Feratox and reduce the variability in
the data observed in this study. However, studies would be required to
provide a calibration of the visual method against actual cyanide content
using laboratory analyses, to determine whether this method can accurately
determine cyanide concentration in Feratox.
Our study indicated that cholecalciferol in Feracol decayed at a less variable
rate than that recorded for cyanide decay in Feratox. Approximately 25% of

22 Thomas & Ross—Breakdown of cyanide and cholecalciferol in possum baits
the cholecalciferol content of Feracol baits was removed after 1 month’s
exposure and approximately 50% after 8 months’ exposure to weathering.
Cholecalciferol was removed at a faster rate in wet environments regardless
of bait formulation. However, in drier climates, more water-resistant bait
formulations, such as the block bait, will slow breakdown rates compared
to less water-resistant formulations, such as the paste bait. Bait position,
i.e. elevated or on the ground, did not influence the decay rates of
cholecalciferol in Feracol.
Feratox bait will still have the potential to kill possums for at least 8 months
after deployment in the field. The proportion of pellets capable of doing so
could not be determined from the results of this study, but is likely to be
small. This study indicated that the capability of all Feratox baits used in
possum control operations to remain viable (i.e. all are 100% capable of killing
possums) is likely to occur for only 1 month. After a month, the ability of the
baits to kill possums will progressively decline to zero after 8 months. This
characteristic suggests that Feratox is not suitable as a long-life bait.
Feracol bait could remain capable of killing possums 1 year after deployment
provided possums ate enough bait for it to be lethal. However, the toxicity
of the baits declined by about 20% after 1 month, which is likely to reduce
possum kills. This study indicated that the longer the bait is exposed to
the weather, the less likely possums are to be killed (and this may increase
the risk of bait shyness developing). The study indicated that maximum
possum kills are likely to occur within the first 2 weeks of bait deployment,
especially in wet climates. As with Feratox, this suggests that Feracol is
unsuitable as a long-life bait and should not remain in the field for more
than 1 month.
For non-target animals such as dogs and domestic stock, Feratox and Fercol
baiting is unlikely to cause deaths. However, managers need to be aware of
the debilitating long-term effects that sub-lethal cholecalciferol poisoning can
cause. This could have a major impact on the health of animals that have
eaten cholecalciferol baits.
Native birds are highly susceptible to cyanide poisoning, but Feratox offers
a safer option than using cyanide paste formulations because the cyanide is
enclosed within a hard coating that is difficult for birds to break. However,
decayed Feratox pellets could pose a cyanide poisoning risk once their pellet
coatings are broken. This could occur after less than 1 month’s exposure in
the field and continue for at least 8 months. There is some evidence that
birds such as weka can swallow whole Feratox pellets, which could rupture
internally resulting in death (Mehrtens & Gaze 2002).
There is a perception that long-life baits offer cost-effective and sustained
possum control with very little labour input over long time periods. However,
this option will substantially increase the risk of poisoning non-target species
and is more likely to cause bait shyness compared to short-term (< 1 week)
poisoning strategies such as 1080 baits used in bait stations (see Thomas et
al. 1996), especially if the toxin degrades as observed in this study. Therefore,
we conclude that short-term Feratox and Feracol baiting strategies (< 1 month)
where unused bait is retrieved will provide high efficacy, low risk of bait
shyness and minimise the length of exposure to non-target species.
23DOC Research & Development Series 288
7. Recommendations
Based on the results of this study, the authors recommend that:
Managers using Feratox and Feracol in paper bags should be aware that •
they can remain toxic to target and non-target species for at least 1 year
for Feratox and for at least 2 years for Feracol if baits are left in the
field.
To maximise possum kills and minimise the risk of bait shyness and non-•
target deaths, both Feratox and Feracol baits should be left in the field
for no more than 1 month.
All unused baits should be removed from the field to minimise non-target •
deaths and to reduce the likelihood of bait shyness developing.
A study should be undertaken to determine the accuracy of estimating •
the cyanide content in Feratox using a visual measure of decay on the
Feratox coating as an alternative to the more expensive laboratory assay
method used in this study.
Managers should carefully consider the risks associated with the use of •
long-life baits for possum control.
Managers need to be aware that sub-lethal poisoning from baits containing •
cholecalciferol can cause long-term debilitating effects to dogs and
domestic stock that are difficult to cure. Therefore, these animals should
be excluded from areas where these baits are present.
8. Acknowledgements
This study was funded by DOC (science investigation no. 3763). We
would like to thank Fraser Maddigan (Pest Control Research Ltd,
Christchurch) for assisting with the deployment and collection of
the bait decay samples from the field. We would also like to thank
John Hughes (Pest Net, Greymouth) and Vernon Reid (Discovery Tours,
Twizel) for assisting with the field trials.

24 Thomas & Ross—Breakdown of cyanide and cholecalciferol in possum baits
9. References
Akcil, A.; Mudder, T. 2003: Microbial destruction of cyanide waste in gold mining: process
review. Biotechnology Letters 25(6): 445–450.
Booth, L.H.; Ogilvie, S.C.; eason, C.T. 1999: Persistence of sodium monofluoroacetate (1080),
pindone, cholecalciferol, and brodifacoum in possum baits under simulated rainfall.
Journal of Agricultural Science and Research 42: 107–112.
eason, C.T. 1992: The evaluation of alternative toxins to sodium monofluoroacetate (1080) for
possum control. Pp. 348–350 in Borecco, J.e.; Marsh, R.e. (eds): Proceedings of the
15th Vertebrate Pest Conference, March 3–5 2002, Newport Beach, California. University
of California, Davis.
eason, C.T.; Wickstrom, M. 2001: Vertebrate pesticide toxicology manual (poisons). Department
of Conservation Technical Series 23. Department of Conservation, Wellington. 122 p.
Gregory, N.G.; Milne, L.M.; Rhodes, A.T.; Littin, K.e.; Wickstrom, M.; eason, C.T. 1998: effect of
potassium cyanide on behaviour and time to death in possums. New Zealand Veterinary
Journal 46: 60–64.
Henderson, R.J.; Morriss G.A. 1996: Sub-lethal poisoning of possums with acute pesticides used
in bait stations. Proceedings of the 46th Plant Protection Conference: 137–142.
Jolly, S.e.; eason, C.T.; Frampton, C. 1993: Serum calcium levels in response to cholecalciferol
and calcium carbonate in the Australian brushtail possum. Pesticide Biochemistry and
Physiology 47(3): 159–164.
King, C.M. (ed.) 1990: The handbook of New Zealand mammals. Oxford University Press,
Auckland. 600 p.
Marshall, e.F. 1984: Cholecalciferol: a unique toxicant for rodent control. Pp. 95–98 in Clark,
D.O (ed.): Proceedings of 11th Vertebrate Pest Conference, March 6–8 1984, Sacramento,
California. University of California, Davis.
Mehrtens, B.; Gaze, P. 2002: The impact of Feratox on weka. Unpublished report held by
Nelson/Marlborough Conservancy Office, Department of Conservation. 4 p.
Moran, R.e. 1998: Cyanide in mining: some observations on the chemistry, toxicity and analysis
of mining-related waters. www.zpok.hu/cyanide/baiamare/docs/MoranCyanidePaper0799.
rtf (viewed 20 September 2007).
Morgan, D.R. 2004: enhancing maintenance control of possum populations using long-life baits.
New Zealand Journal of Zoology 31: 271–282.
Morgan, D.R.; Milne L. 2002: Cholecalciferol-induced bait shyness in possums (Trichosurus
vulpecula). International Journal of Pest Management 48(2): 113–119.
Morgan, D.R.; Milne, L.; O’Conner, C.; Ruscoe, W.A. 2001: Bait shyness in possums induced by
sub-lethal doses of cyanide paste. International Journal of Pest Management 47(4):
227–284.
Morgan, D.R.; Rhodes, A.T. 2000a: Feracol paste bait for possum control—a cage trial. New
Zealand Plant Protection 53: 305–309.
Morgan, D.R.; Rhodes, A.T. 2000b: Selectivity of Ferafeed paste bait treated with a rodent
repellent—a cage trial. New Zealand Plant Protection 53: 316–320.
Sterner, R.T. 1979: effects of sodium cyanide and diphacinone in coyotes (Canis latrans):
applications as predacides in livestock toxic collars. Bulletin of Environmental
Contaminants and Toxicology 23: 211–217.
Talcott, P.A.; Mather, G.G.; Kowitz, e.H. 1991: Accidental ingestion of a cholecalciferol-
containing rodent bait in a dog. Veterinary and Human Toxicology 33(3): 252–256.

25DOC Research & Development Series 288
Thomas, M. 2005: Feratox and Feracol as alternatives to brodifacoum for possum control. DOC
Science Internal Series 200. Department of Conservation, Wellington. 24 p.
Thomas, M.D.; Henderson, R.J.; Hickling, G.J. 1996: Optimising the use of bait stations for
possum control. Pp. 65–69 in Wright, D.e. (ed.): Proceedings of a workshop on improving
conventional control of possums. Royal Society of New Zealand Miscellaneous Series
33. Royal Society of New Zealand, Wellington.
Thomas, M.D.; Maddigan, F.W.; Brown J.A.; Trotter M. 2003: Optimising possum control using
encapsulated cyanide (Feratox). New Zealand Plant Protection 56: 77–80.
Warburton, B.; Drew, K.W. 1994: extent and nature of cyanide-shyness in some populations of
Australian brushtail possums in New Zealand. Wildlife Research 21: 599–605.
Wickstrom, M.L.; Henderson, R.J.; eason, C.T. 1997: Alternatives to 1080 for possums (July
1994–July 1996). Landcare Research Contract Report LC9697/79 (unpublished). 26 p.
Wiemeyer, S.N.; Hill, e.F.; Carpenter, J.W.; Krynitsky, A.J. 1986: Acute oral toxicity of sodium
cyanide in birds. Journal of Wildlife Diseases 22(4): 538–546.
Wright, G.; Manning, L.A. 2003: Cyanide residues in soil and water. Landcare Research Contract
Report LC0203/38 (unpublished).

26 Thomas & Ross—Breakdown of cyanide and cholecalciferol in possum baits
CATeGORy WeIGHT RePReSeNTATIVe BReeDS
(kg)
Minature 2–5 Chihuahua, Maltese, Pekinese, Poodle (toy), yorkshire
Small 5–11 Dachshund, Jack Russell Terrier, Pug, Poodle (miniature),
Scottish Terrier, Fox Terrier
Medium 11–27 Airedale, Cocker Spaniel, Bassett Hound, Beagle, Border Collie,
Whippet, Welsh Corgi, Staffordshire Bull Terrier
Large 27–36 Afgan, Airedale, Boxer, Bull Terrier, Bulldog, Collie,
Doberman, english Setter, German Shepherd, Greyhound,
Labrador, Irish Setter, english Sheepdog, Weimaraner
Very large 36–70 Bloodhound, Bullmastiff, Great Dane, Rhodesian Ridgeback,
Rottweiller, Saint Bernard, Scottish Deerhound
Appendix 1
W e I G H T C A T e G O R I e S F O R D O G S A N D A S S O C I A T e D R e P R e S e N T A T I V e B R e e D S

27DOC Research & Development Series 288
Appendix 2
C y A N I D e B R e A K D O W N I N F e R A T O x B A I T S
Cyanide breakdown in elevated and ground-level Feratox block and paste
baits located at Mackenzie Basin and West Coast study sites. The linear
relationship and 95% confidence intervals are also shown.
Mackenzie block elevatedy = -3.8945x + 46.515
R 2 = 0.4471
0
10
20
30
40
50
60
70
Deploy
ed
Aug-04
Sep-04
Oct-04
Nov-04
Dec-04
Jan-0
5
Feb-05
Mar-05
Apr-05
May-05
Jun-0
5Ju
l-05
Month
Res
idua
l cya
nide
con
cent
ratio
n (m
g/pe
llet)
Mackenzie block ground
y = -3.3736x + 34.885R 2 = 0.5063
0
10
20
30
40
50
60
70
Deploy
ed
Aug-04
Sep-04
Oct-04
Nov-04
Dec-04
Jan-0
5
Feb-05
Mar-05
Apr-05
May-05
Jun-0
5Ju
l-05
Month
Res
idua
l cya
nide
con
cent
ratio
n (m
g/pe
llet)
Res
idua
l cya
nide
con
cent
ratio
n (m
g/pe
llet)
Mackenzie paste elevated
y = -3.2577x + 41.935R 2 = 0.4219
0
10
20
30
40
50
60
70
Deploy
ed
Aug-04
Sep-04
Oct-04
Nov-04
Dec-04
Jan-0
5
Feb-05
Mar-05
Apr-05
May-05
Jun-0
5Ju
l-05
Month
Res
idua
l cya
nide
con
cent
ratio
n (m
g/pe
llet)
Mackenzie paste ground
y = -3.8731x + 38.835R 2 = 0.6012
0
10
20
30
40
50
60
70
Deploy
ed
Aug-04
Sep-04
Oct-04
Nov-04
Dec-04
Jan-0
5
Feb-05
Mar-05
Apr-05
May-05
Jun-0
5Ju
l-05
Month
Res
idua
l cya
nide
con
cent
ratio
n (m
g/pe
llet)
Res
idua
l cya
nide
con
cent
ratio
n (m
g/pe
llet)
West Coast block elevated
y = -2.567x + 24.5R 2 = 0.4174
0
10
20
30
40
50
60
70
Deploy
ed
Aug-04
Sep-04
Oct-04
Nov-04
Dec-04
Jan-0
5
Feb-05
Mar-05
Apr-05
May-05
Jun-0
5Ju
l-05
Month
Res
idua
l cya
nide
con
cent
ratio
n (m
g/pe
llet)
West Coast block ground
y = -1.4934x + 13.938R 2 = 0.2143
0
10
20
30
40
50
60
70
Deploy
ed
Aug-04
Sep-04
Oct-04
Nov-04
Dec-04
Jan-0
5
Feb-05
Mar-05
Apr-05
May-05
Jun-0
5Ju
l-05
Month
Res
idua
l cya
nide
con
cent
ratio
n (m
g/pe
llet)
Res
idua
l cya
nide
con
cent
ratio
n (m
g/pe
llet)
West Coast paste elevated
y = -2.9505x + 28.346R 2 = 0.4668
0
10
20
30
40
50
60
70
Deploy
ed
Aug-04
Sep-04
Oct-04
Nov-04
Dec-04
Jan-0
5
Feb-05
Mar-05
Apr-05
May-05
Jun-0
5Ju
l-05
Month
Res
idua
l cya
nide
con
cent
ratio
n (m
g/pe
llet)
West Coast paste ground
y = -2.6555x + 25.319R 2 = 0.4046
0
10
20
30
40
50
60
70
Deploy
ed
Aug-04
Sep-04
Oct-04
Nov-04
Dec-04
Jan-0
5
Feb-05
Mar-05
Apr-05
May-05
Jun-0
5Ju
l-05
Month
Res
idua
l cya
nide
con
cent
ratio
n (m
g/pe
llet)
Res
idua
l cya
nide
con
cent
ratio
n (m
g/pe
llet)

28 Thomas & Ross—Breakdown of cyanide and cholecalciferol in possum baits
Appendix 3
C H O L e C A L C I F e R O L B R e A K D O W N I N F e R A C O L B A I T S
Cholecalciferol breakdown in elevated and ground-level Feracol block and
paste baits at Mackenzie Basin and West Coast study sites. The linear
relationship and 95% confidence intervals are also shown.
Mackenzie block elevatedy = -0.2354x + 7.3977
R 2 = 0.5723
0123456789
Deploy
ed
Aug-04
Sep-04
Oct-04
Nov-04
Dec-04
Jan-0
5
Feb-05
Mar-05
Apr-05
May-05
Jun-0
5Ju
l-05
Month
Res
idua
l cho
leca
lcife
rol
conc
entra
tion
(g/k
g)
Mackenzie block groundy = -0.2742x + 7.275
R 2 = 0.4354
0123456789
Deploy
ed
Aug-04
Sep-04
Oct-04
Nov-04
Dec-04
Jan-0
5
Feb-05
Mar-05
Apr-05
May-05
Jun-0
5Ju
l-05
Month
Res
idua
l cho
leca
lcife
rol
conc
entra
tion
(g/k
g)
Res
idua
l cho
leca
lcife
rol
conc
entra
tion
(g/k
g)
Mackenzie paste elevated
y = -0.3557x + 6.0912R 2 = 0.7258
0123456789
Deploy
ed
Aug-04
Sep-04
Oct-04
Nov-04
Dec-04
Jan-0
5
Feb-05
Mar-05
Apr-05
May-05
Jun-0
5Ju
l-05
Month
Res
idua
l cho
leca
lcife
rol
conc
entra
tion
(g/k
g)
Mackenzie paste ground
y = -0.3109x + 5.5227R 2 = 0.6278
0123456789
Deploy
ed
Aug-04
Sep-04
Oct-04
Nov-04
Dec-04
Jan-0
5
Feb-05
Mar-05
Apr-05
May-05
Jun-0
5Ju
l-05
Month
Res
idua
l cho
leca
lcife
rol
conc
entra
tion
(g/k
g)
Res
idua
l cho
leca
lcife
rol
conc
entra
tion
(g/k
g)
West Coast paste elevated
y = -0.3552x + 5.9135R 2 = 0.5914
0123456789
Deploy
ed
Aug-04
Sep-04
Oct-04
Nov-04
Dec-04
Jan-0
5
Feb-05
Mar-05
Apr-05
May-05
Jun-0
5Ju
l-05
Month
Res
idua
l cho
leca
lcife
rol
conc
entra
tion
(g/k
g)
West Coast paste ground
y = -0.3628x + 5.6465R 2 = 0.6429
0123456789
Deploy
ed
Aug-04
Sep-04
Oct-04
Nov-04
Dec-04
Jan-0
5
Feb-05
Mar-05
Apr-05
May-05
Jun-0
5Ju
l-05
Month
Res
idua
l cho
leca
lcife
rol
conc
entra
tion
(g/k
g)
Res
idua
l cho
leca
lcife
rol
conc
entra
tion
(g/k
g)
West Coast block elevated
y = -0.5367x + 8.8908R 2 = 0.6683
0123456789
Deploy
ed
Aug-04
Sep-04
Oct-04
Nov-04
Dec-04
Jan-0
5
Feb-05
Mar-05
Apr-05
May-05
Jun-0
5Ju
l-05
Month
Res
idua
l cho
leca
lcife
rol
conc
entra
tion
(g/k
g)R
esid
ual c
hole
calc
ifero
l co
ncen
tratio
n (g
/kg)
West Coast block ground
y = -0.4498x + 7.6785R 2 = 0.6502
0123456789
Deploy
ed
Aug-04
Sep-04
Oct-04
Nov-04
Dec-04
Jan-0
5
Feb-05
Mar-05
Apr-05
May-05
Jun-0
5Ju
l-05
Month
Res
idua
l cho
leca
lcife
rol
conc
entra
tion
(g/k
g)

DOC Research & Development Series
DOC Research & Development Series is a published record of scientific research carried out, or advice given, by Department of Conservation staff or external contractors funded by DOC. It comprises reports and short communications that are peer-reviewed.
Individual contributions to the series are first released on the departmental website in pdf form. Hardcopy is printed, bound, and distributed at regular intervals. Titles are also listed in the DOC Science Publishing catalogue on the website, refer www.doc.govt.nz under Publications, then Science & technical.