brazil’s multinationals take off - columbia center on...
TRANSCRIPT
1
Press Release
Brazil’s Multinationals Take Off
Release of the FDCCPII 2007 ranking of Brazilian multinational enterprises
Nova Lima and New York, December 3, 2007
Brazil’s top multinational enterprises (MNEs) have made the country the second largest outward investor among developing countries in terms of foreign direct investment (FDI) outflows in 2006, according to a new survey released today jointly by the Brazilbased Fundação Dom Cabral (FDC) and the Columbia Program on International Investment (CPII) in New York.
The survey’s principal findings include:
§ The country’s Top 20 multinationals have US$56bn 1 assets abroad, equivalent to over half of the country’s outward FDI stock.
§ The Top 20 produce and sell goods and services worth approximately US$30bn and employ 77,000 persons abroad.
§ About half focus on their region, Latin America, where they are represented in the relative largest number of countries.
§ The multinationalization of Brazilian firms has risen rapidly during the past few years, fueled primarily by natural resource firms; these firms account for about twothirds of the foreign assets of the Top 20. CVRD leads the MNE ranking list, which also includes many industrial groups, heavy construction companies and some hightech groups like EMBRAER and Itautec.
§ Despite the concentrated nature of outward FDI from Brazil, a growing number of firms, including many small and mediumsized enterprises, are becoming multinationals.
1 All reais figures are converted into U.S. dollars using IMF International Financial Statistics data, averaged for each year.
EMBARGO The contents of this press release must not be quoted or summarized in the print, broadcast or electronic media
before December 3, 2007, 00:01 EST (03:01 am, Dec. 3, Sao Paulo; 05:01 am, Dec. 3, London; 01:01 pm, Dec. 3, Shanghai)
2
“This is an extraordinary performance by the leading Brazilian multinationals – and it raises real managerial challenges for them, namely how to manage this process and the international production networks that are the result, and at the same time contribute to a more sustainable world,” says Emerson de Almeida, President of FDC.
Adds Karl P. Sauvant, Executive Director of the Columbia Program on International Investment, “Brazilian firms, led by CVRD, are becoming important players in the world FDI market.”
Fundação Dom Cabral, a leading international executive and company development center, and the Columbia Program on International Investment, a joint undertaking of the Columbia Law School and The Earth Institute at Columbia University, collaborated on this ranking of Brazilian MNEs. The exercise is part of a global effort to rank emerging market MNEs, with the results for Russia, China, Hong Kong (China) and South Africa to be released soon.
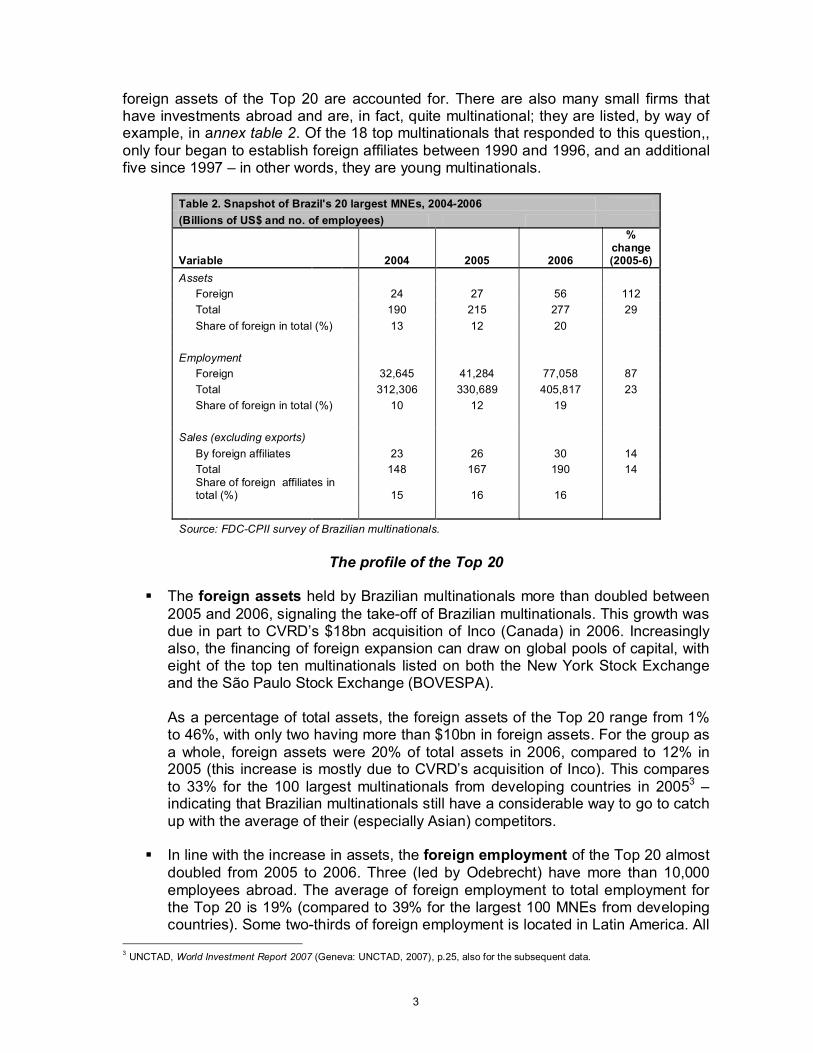
Table 1. FDCCPII ranking of the top 20 Brazilian multinationals, in terms of foreign assets, 2006
(Millions of US$) Rank Name Industry 1 Companhia Vale do Rio Doce (CVRD) Mining & metals 2 Petrobras S.A. (Petroleo Brasileiro S.A.) Oil & gas 3 Gerdau S.A. Steel
4 EMBRAER Empresa Brasileira de Aeronáutica
S.A. Aviation 5 Votorantim Participações S.A. Diversified 6 Companhia Siderurgica Nacional (CSN) Steel 7 Camargo Corrêa S.A. Diversified 8 Odebrecht S.A. Construction & petrochemicals 9 Aracruz Celulose Pulp & paper 10 Weg S.A. Electromechanical 11 Marcopolo S.A. Bus manufacture 12 Andrade Gutierrez S.A. Diversified 13 Tigre S.A. Tubos e Conexões Construction 14 Usinas Siderúrgicas de Minas Gerais S.A.Usiminas Steel 15 Natura Cosméticos S.A. Cosmetics 16 Itautec S.A. IT 17 America Latina Logistica S.A. Logistics 18 Ultrapar Participações S.A. Diversified 19 Sabó Indústria e Comércio de Autopeças Ltda. Automobile parts 20 Lupatech S.A. Electromechanical
Total foreign assets of the Top 20: 56,426 Source: FDCCPII survey of Brazilian multinationals.
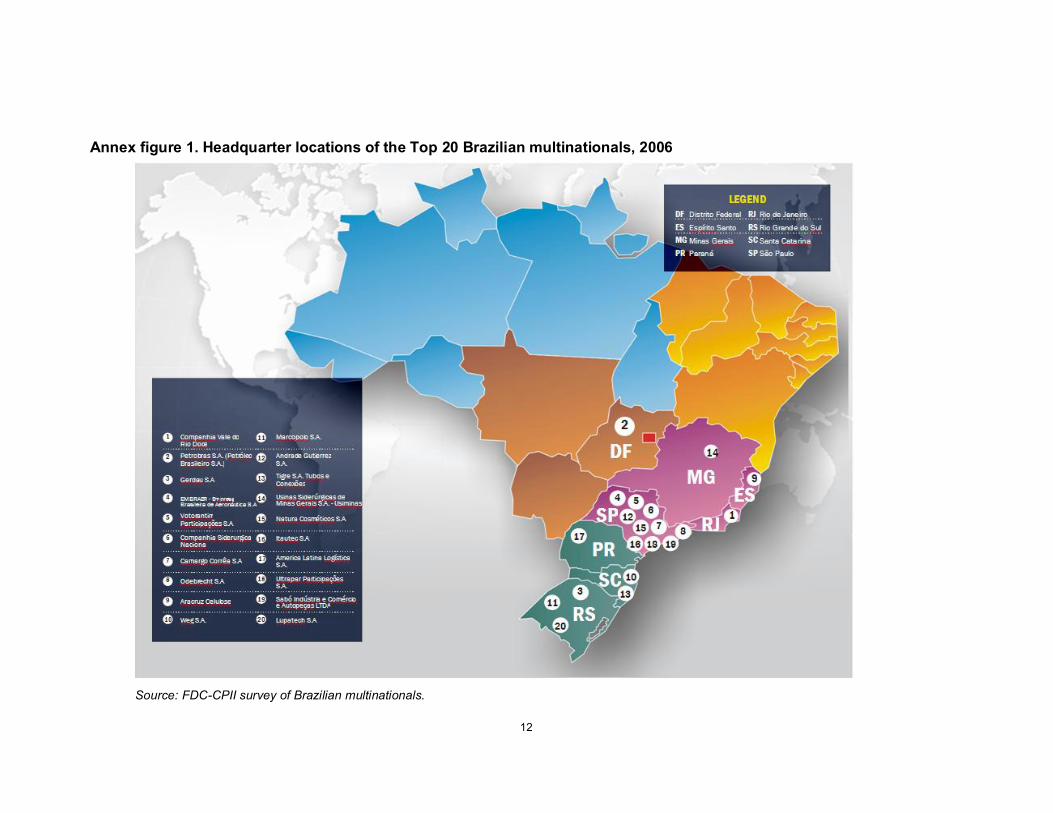
Table 1 2 (and annex table 1) list the Top 20 in terms of foreign assets in 2006. Half of the Top 20 are headquartered in Sao Paulo state (annex figure 1). They are all privately held firms, except for Petrobras. CVRD and Petrobras, the top two (and both natural resource companies), together accounted for over twothirds of the foreign assets of the Top 20; if the third ranking firm, Gerdau, is added, more than threequarters of all the
2 Financial services companies are not included in the ranking.
3
foreign assets of the Top 20 are accounted for. There are also many small firms that have investments abroad and are, in fact, quite multinational; they are listed, by way of example, in annex table 2. Of the 18 top multinationals that responded to this question,, only four began to establish foreign affiliates between 1990 and 1996, and an additional five since 1997 – in other words, they are young multinationals.
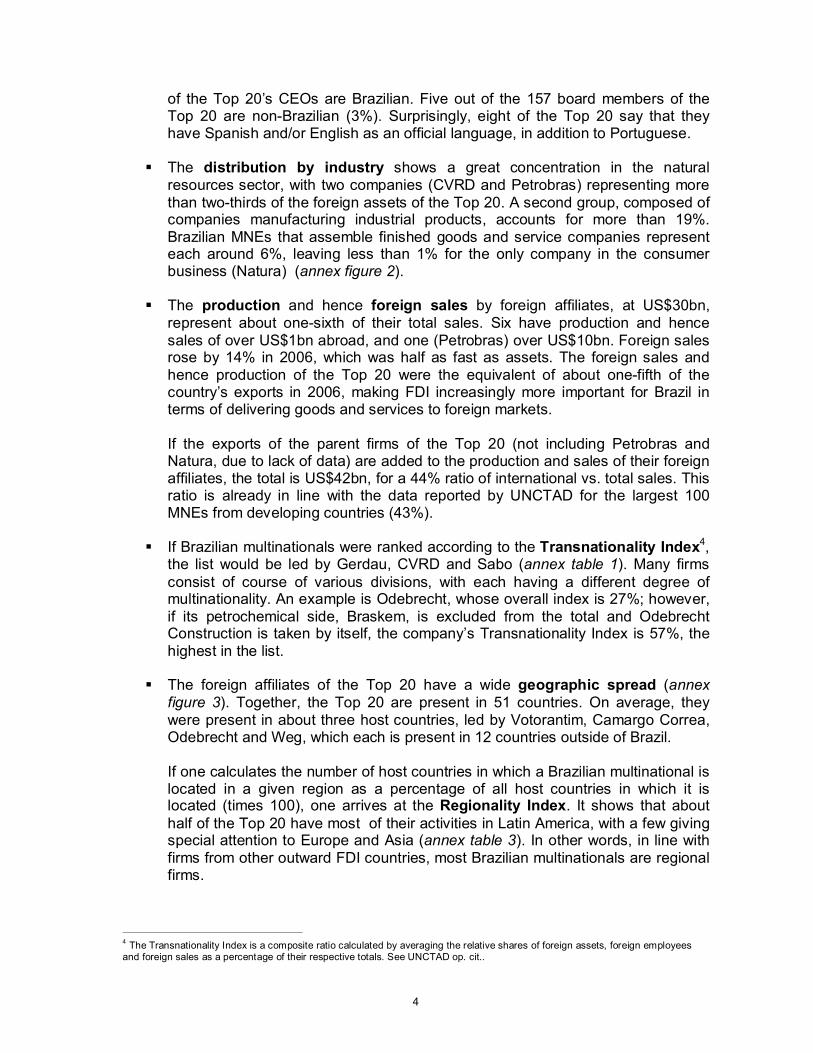
Table 2. Snapshot of Brazil's 20 largest MNEs, 20042006 (Billions of US$ and no. of employees)
Variable 2004 2005 2006
% change (20056)
Assets Foreign 24 27 56 112 Total 190 215 277 29 Share of foreign in total (%) 13 12 20
Employment Foreign 32,645 41,284 77,058 87 Total 312,306 330,689 405,817 23 Share of foreign in total (%) 10 12 19
Sales (excluding exports) By foreign affiliates 23 26 30 14 Total 148 167 190 14 Share of foreign affiliates in total (%) 15 16 16
Source: FDCCPII survey of Brazilian multinationals.
The profile of the Top 20
§ The foreign assets held by Brazilian multinationals more than doubled between 2005 and 2006, signaling the takeoff of Brazilian multinationals. This growth was due in part to CVRD’s $18bn acquisition of Inco (Canada) in 2006. Increasingly also, the financing of foreign expansion can draw on global pools of capital, with eight of the top ten multinationals listed on both the New York Stock Exchange and the São Paulo Stock Exchange (BOVESPA).
As a percentage of total assets, the foreign assets of the Top 20 range from 1% to 46%, with only two having more than $10bn in foreign assets. For the group as a whole, foreign assets were 20% of total assets in 2006, compared to 12% in 2005 (this increase is mostly due to CVRD’s acquisition of Inco). This compares to 33% for the 100 largest multinationals from developing countries in 2005 3 – indicating that Brazilian multinationals still have a considerable way to go to catch up with the average of their (especially Asian) competitors.
§ In line with the increase in assets, the foreign employment of the Top 20 almost doubled from 2005 to 2006. Three (led by Odebrecht) have more than 10,000 employees abroad. The average of foreign employment to total employment for the Top 20 is 19% (compared to 39% for the largest 100 MNEs from developing countries). Some twothirds of foreign employment is located in Latin America. All
3 UNCTAD, World Investment Report 2007 (Geneva: UNCTAD, 2007), p.25, also for the subsequent data.
4
of the Top 20’s CEOs are Brazilian. Five out of the 157 board members of the Top 20 are nonBrazilian (3%). Surprisingly, eight of the Top 20 say that they have Spanish and/or English as an official language, in addition to Portuguese.
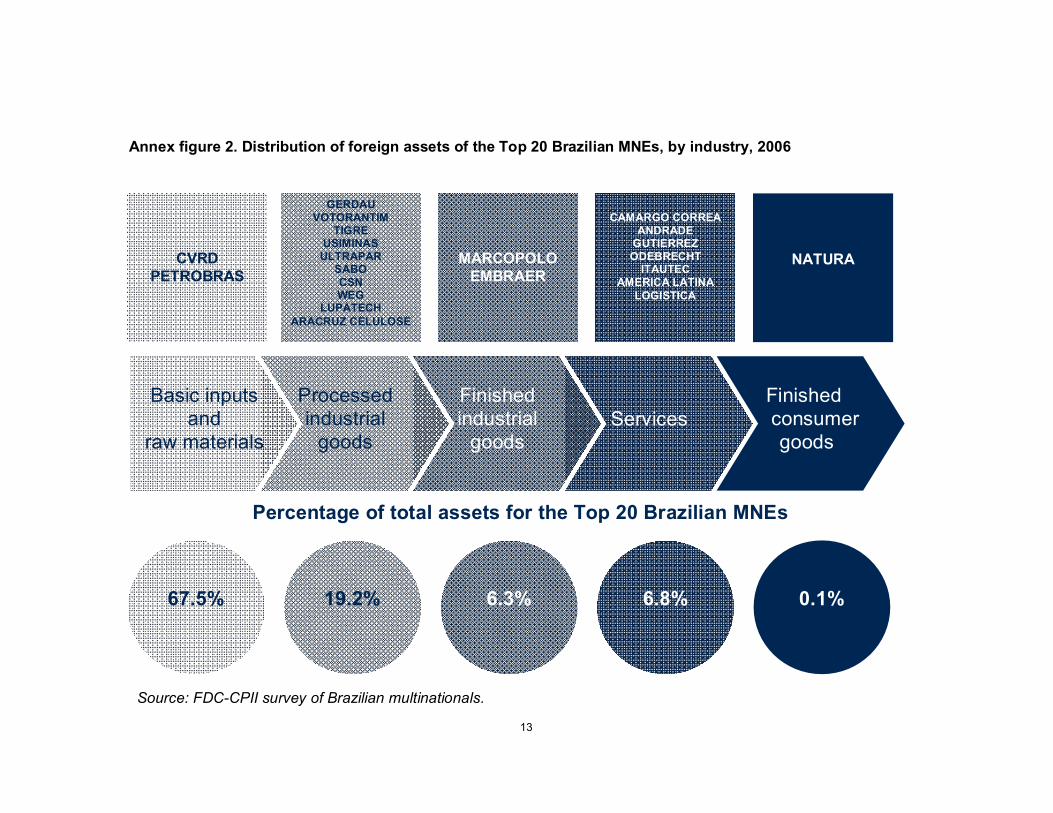
§ The distribution by industry shows a great concentration in the natural resources sector, with two companies (CVRD and Petrobras) representing more than twothirds of the foreign assets of the Top 20. A second group, composed of companies manufacturing industrial products, accounts for more than 19%. Brazilian MNEs that assemble finished goods and service companies represent each around 6%, leaving less than 1% for the only company in the consumer business (Natura) (annex figure 2).
§ The production and hence foreign sales by foreign affiliates, at US$30bn, represent about onesixth of their total sales. Six have production and hence sales of over US$1bn abroad, and one (Petrobras) over US$10bn. Foreign sales rose by 14% in 2006, which was half as fast as assets. The foreign sales and hence production of the Top 20 were the equivalent of about onefifth of the country’s exports in 2006, making FDI increasingly more important for Brazil in terms of delivering goods and services to foreign markets.
If the exports of the parent firms of the Top 20 (not including Petrobras and Natura, due to lack of data) are added to the production and sales of their foreign affiliates, the total is US$42bn, for a 44% ratio of international vs. total sales. This ratio is already in line with the data reported by UNCTAD for the largest 100 MNEs from developing countries (43%).
§ If Brazilian multinationals were ranked according to the Transnationality Index 4 , the list would be led by Gerdau, CVRD and Sabo (annex table 1). Many firms consist of course of various divisions, with each having a different degree of multinationality. An example is Odebrecht, whose overall index is 27%; however, if its petrochemical side, Braskem, is excluded from the total and Odebrecht Construction is taken by itself, the company’s Transnationality Index is 57%, the highest in the list.
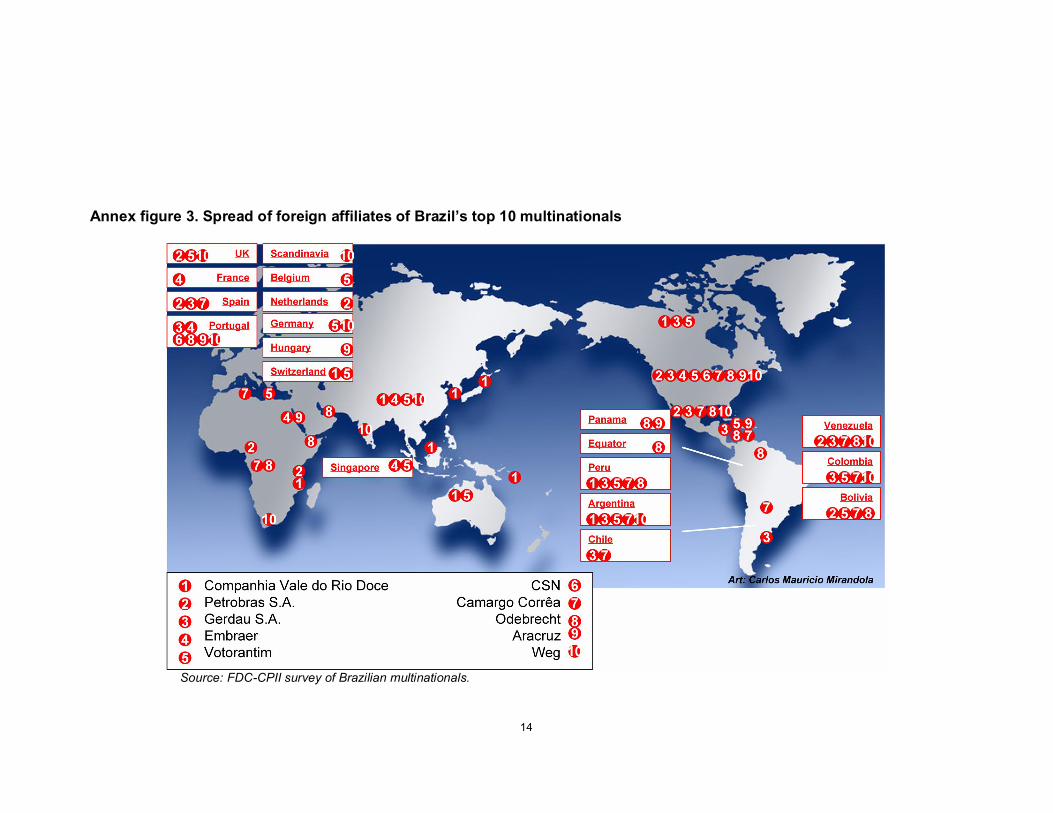
§ The foreign affiliates of the Top 20 have a wide geographic spread (annex figure 3). Together, the Top 20 are present in 51 countries. On average, they were present in about three host countries, led by Votorantim, Camargo Correa, Odebrecht and Weg, which each is present in 12 countries outside of Brazil.
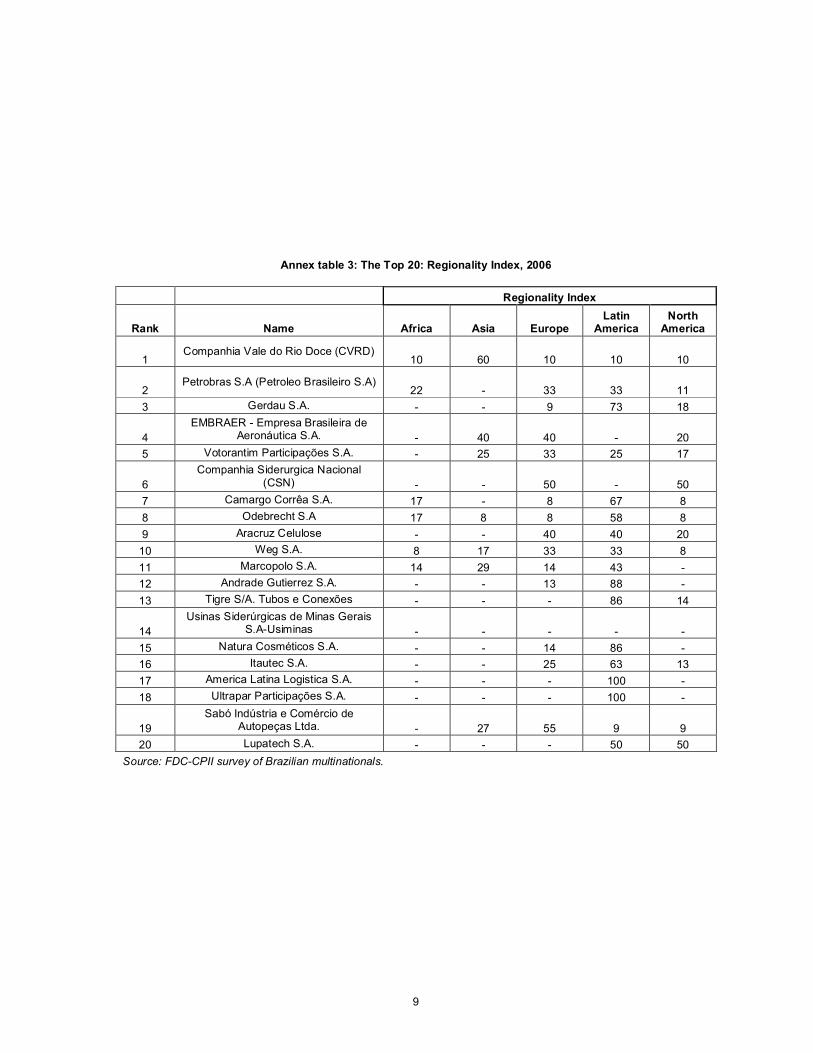
If one calculates the number of host countries in which a Brazilian multinational is located in a given region as a percentage of all host countries in which it is located (times 100), one arrives at the Regionality Index. It shows that about half of the Top 20 have most of their activities in Latin America, with a few giving special attention to Europe and Asia (annex table 3). In other words, in line with firms from other outward FDI countries, most Brazilian multinationals are regional firms.
4 The Transnationality Index is a composite ratio calculated by averaging the relative shares of foreign assets, foreign employees and foreign sales as a percentage of their respective totals. See UNCTAD op. cit..
5
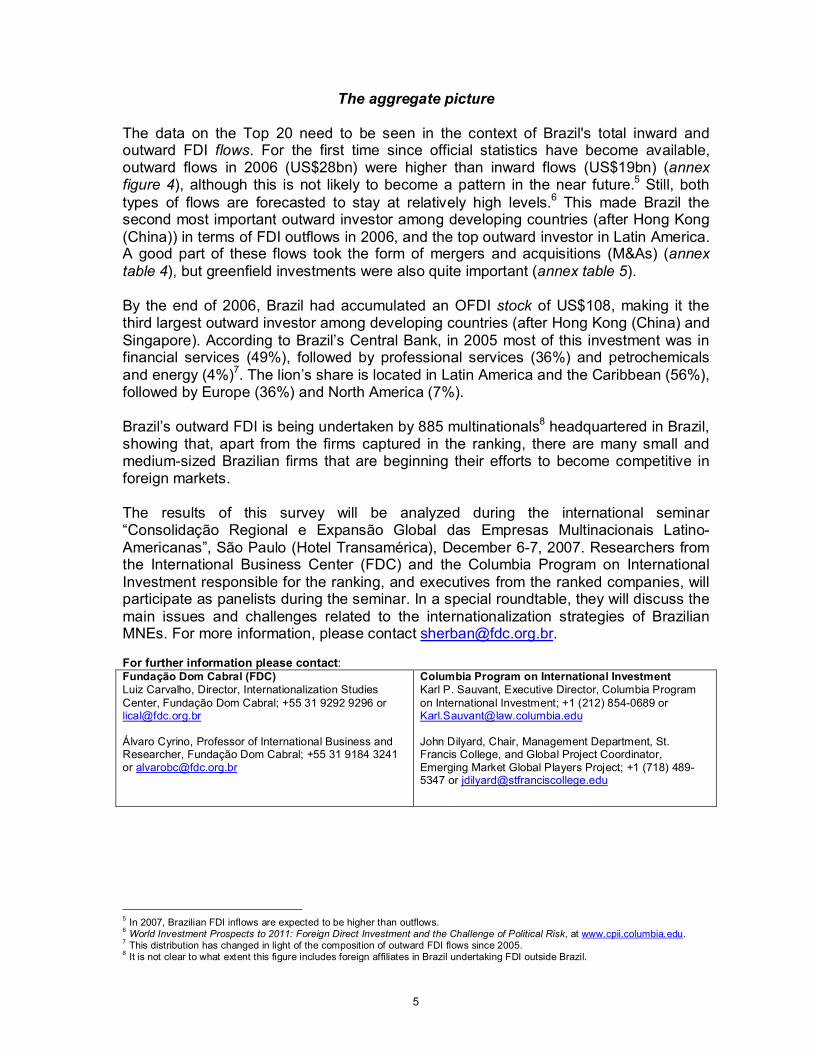
The aggregate picture
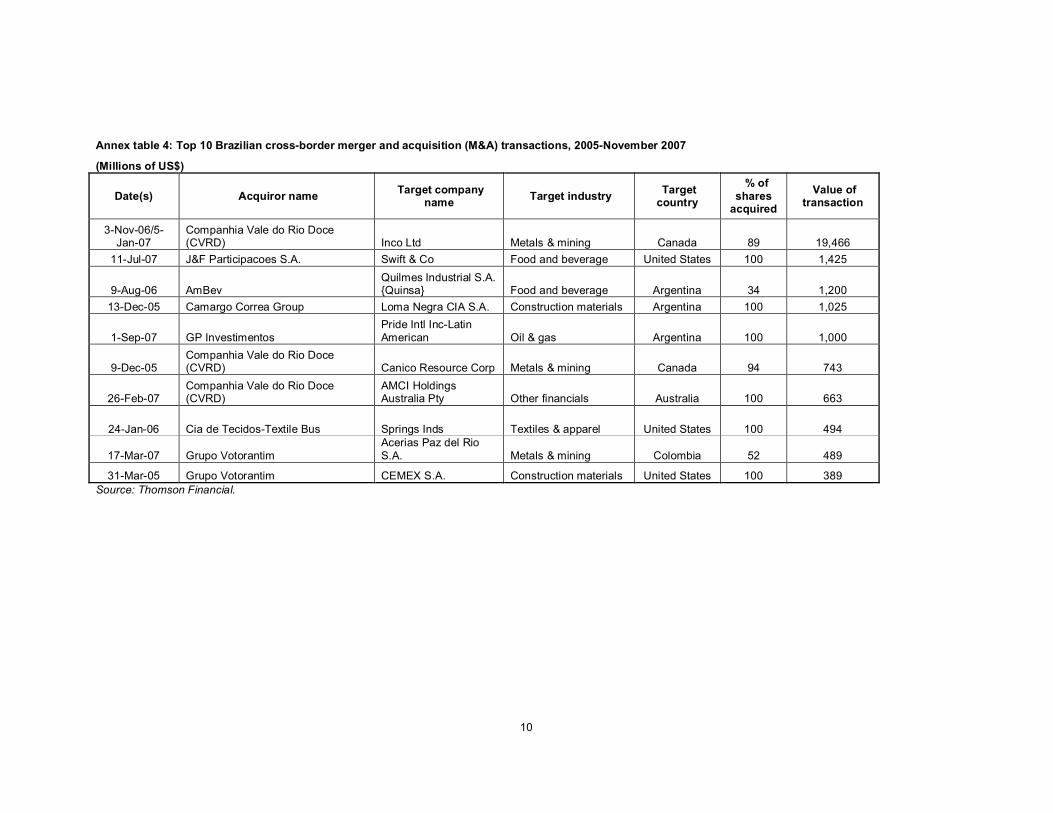
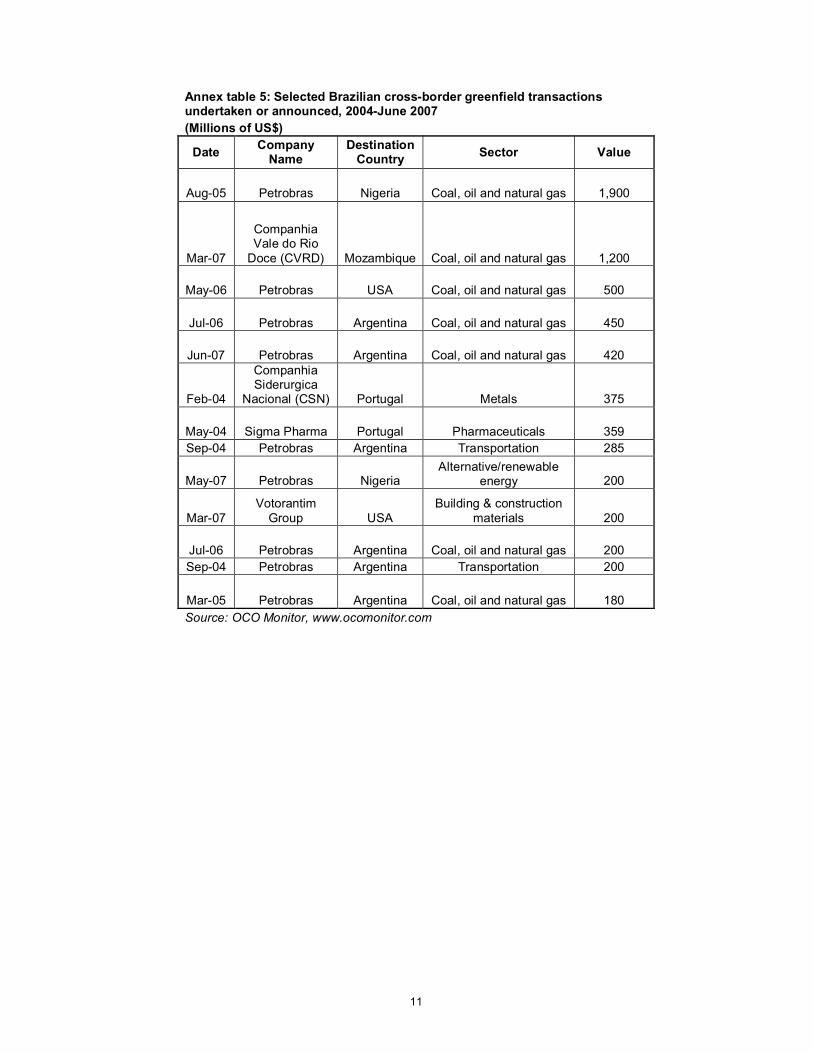
The data on the Top 20 need to be seen in the context of Brazil's total inward and outward FDI flows. For the first time since official statistics have become available, outward flows in 2006 (US$28bn) were higher than inward flows (US$19bn) (annex figure 4), although this is not likely to become a pattern in the near future. 5 Still, both types of flows are forecasted to stay at relatively high levels. 6 This made Brazil the second most important outward investor among developing countries (after Hong Kong (China)) in terms of FDI outflows in 2006, and the top outward investor in Latin America. A good part of these flows took the form of mergers and acquisitions (M&As) (annex table 4), but greenfield investments were also quite important (annex table 5).
By the end of 2006, Brazil had accumulated an OFDI stock of US$108, making it the third largest outward investor among developing countries (after Hong Kong (China) and Singapore). According to Brazil’s Central Bank, in 2005 most of this investment was in financial services (49%), followed by professional services (36%) and petrochemicals and energy (4%) 7 . The lion’s share is located in Latin America and the Caribbean (56%), followed by Europe (36%) and North America (7%).
Brazil’s outward FDI is being undertaken by 885 multinationals 8 headquartered in Brazil, showing that, apart from the firms captured in the ranking, there are many small and mediumsized Brazilian firms that are beginning their efforts to become competitive in foreign markets.
The results of this survey will be analyzed during the international seminar “Consolidação Regional e Expansão Global das Empresas Multinacionais Latino Americanas”, São Paulo (Hotel Transamérica), December 67, 2007. Researchers from the International Business Center (FDC) and the Columbia Program on International Investment responsible for the ranking, and executives from the ranked companies, will participate as panelists during the seminar. In a special roundtable, they will discuss the main issues and challenges related to the internationalization strategies of Brazilian MNEs. For more information, please contact [email protected].
For further information please contact: Fundação Dom Cabral (FDC) Luiz Carvalho, Director, Internationalization Studies Center, Fundação Dom Cabral; +55 31 9292 9296 or [email protected]
Álvaro Cyrino, Professor of International Business and Researcher, Fundação Dom Cabral; +55 31 9184 3241 or [email protected]
Columbia Program on International Investment Karl P. Sauvant, Executive Director, Columbia Program on International Investment; +1 (212) 8540689 or [email protected]
John Dilyard, Chair, Management Department, St. Francis College, and Global Project Coordinator, Emerging Market Global Players Project; +1 (718) 489 5347 or [email protected]
5 In 2007, Brazilian FDI inflows are expected to be higher than outflows. 6 World Investment Prospects to 2011: Foreign Direct Investment and the Challenge of Political Risk, at www.cpii.columbia.edu. 7 This distribution has changed in light of the composition of outward FDI flows since 2005. 8 It is not clear to what extent this figure includes foreign affiliates in Brazil undertaking FDI outside Brazil.

6
Emerging Market Global Players Project The FDCCPII 2007 Ranking of Brazilian Multinational Enterprises was conducted in the framework of the Emerging Markets Global Players Project, a collaborative effort led by the Columbia Program on International Investment. It brings together researchers on FDI from leading institutions in emerging markets to generate annual ranking lists of emerging market MNEs. The next rankings will be released for Russia by SKOLKOVO Moscow School of Management; China and Hong Kong (China) by Fudan University; and South Africa by University of Pretoria. Watch www.cpii.columbia.edu for further information or contact [email protected].
About Fundação Dom Cabral Fundação Dom Cabral is an international executive and company development center aligned with the most current management technologies. Receiving over 20,000 executives in its programs annually, FDC has been placed among the 20 best business schools in the world by the Financial Times executive education ranking in 2007. International quality accreditations such as EQUIS and AMBA also attest to the quality and global scope of our activities. For more information, see http://www.fdc.org.br/en.
About the Columbia Program on International Investment The Columbia Program on International Investment (CPII), headed by Dr. Karl P. Sauvant, is a joint undertaking of the Columbia Law School and The Earth Institute at Columbia University. It seeks to be a leader on issues related to FDI in the global economy. The CPII focuses on the analysis and teaching of the implications of FDI for public policy and international investment law. Its objectives are to analyze important topical policyoriented issues related to FDI, develop and disseminate practical approaches and solutions, and provide students with a challenging learning environment. For more information, see www.cpii.columbia.edu.
Five Diamond Conference Series Given the importance of the international expansion of companies from BRIC countries, CPII, FDC, Fudan University, the Indian School of Business and SKOLKOVO Moscow School of Management will organize a series of conferences dedicated to that phenomenon. The first Five Diamond conference will take place in New York City on April 2829, 2008. For more information, please contact [email protected].
7
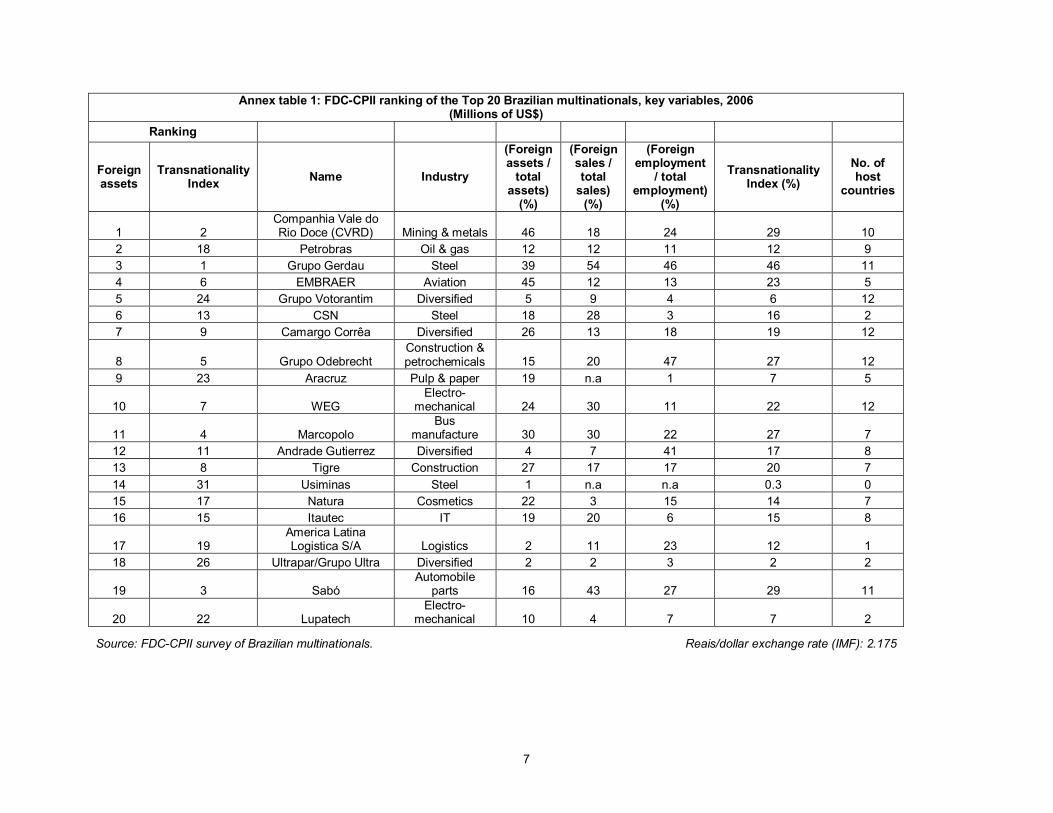
Annex table 1: FDCCPII ranking of the Top 20 Brazilian multinationals, key variables, 2006 (Millions of US$)
Ranking
Foreign assets
Transnationality Index Name Industry
(Foreign assets / total
assets) (%)
(Foreign sales / total sales) (%)
(Foreign employment
/ total employment)
(%)
Transnationality Index (%)
No. of host
countries
1 2 Companhia Vale do Rio Doce (CVRD) Mining & metals 46 18 24 29 10
2 18 Petrobras Oil & gas 12 12 11 12 9 3 1 Grupo Gerdau Steel 39 54 46 46 11 4 6 EMBRAER Aviation 45 12 13 23 5 5 24 Grupo Votorantim Diversified 5 9 4 6 12 6 13 CSN Steel 18 28 3 16 2 7 9 Camargo Corrêa Diversified 26 13 18 19 12
8 5 Grupo Odebrecht Construction & petrochemicals 15 20 47 27 12
9 23 Aracruz Pulp & paper 19 n.a 1 7 5
10 7 WEG Electro
mechanical 24 30 11 22 12
11 4 Marcopolo Bus
manufacture 30 30 22 27 7 12 11 Andrade Gutierrez Diversified 4 7 41 17 8 13 8 Tigre Construction 27 17 17 20 7 14 31 Usiminas Steel 1 n.a n.a 0.3 0 15 17 Natura Cosmetics 22 3 15 14 7 16 15 Itautec IT 19 20 6 15 8
17 19 America Latina Logistica S/A Logistics 2 11 23 12 1
18 26 Ultrapar/Grupo Ultra Diversified 2 2 3 2 2
19 3 Sabó Automobile
parts 16 43 27 29 11
20 22 Lupatech Electro
mechanical 10 4 7 7 2
Source: FDCCPII survey of Brazilian multinationals. Reais/dollar exchange rate (IMF): 2.175
8
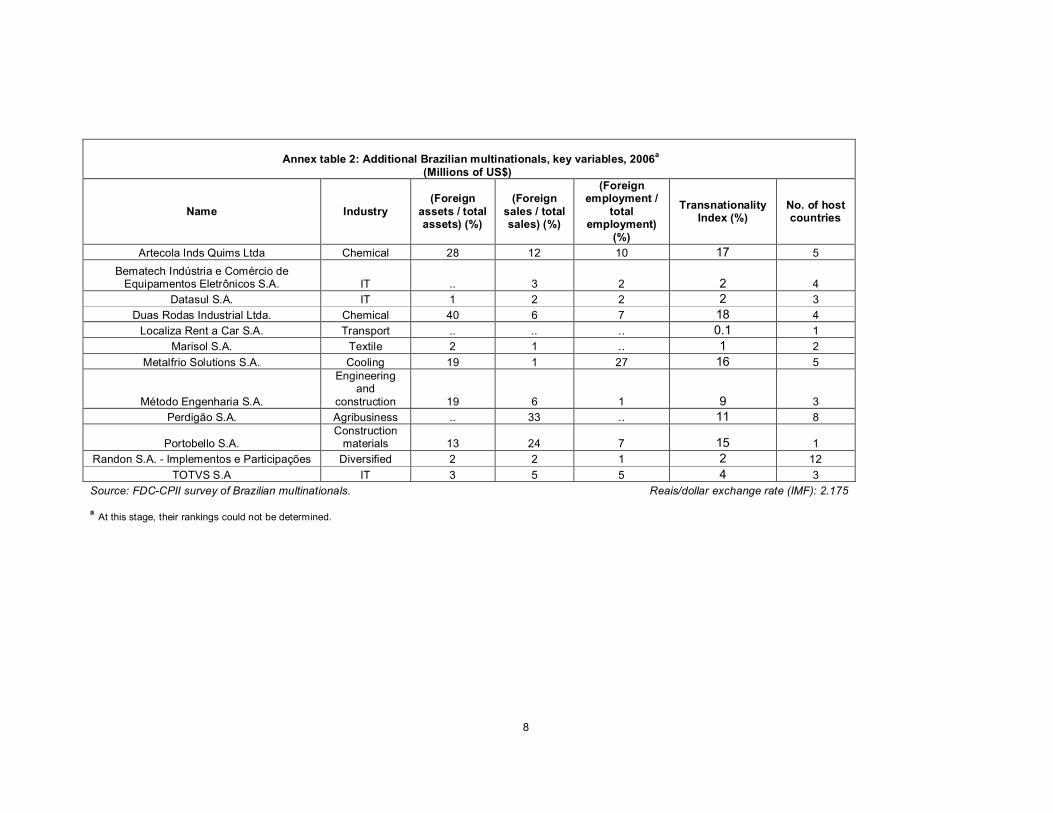
Annex table 2: Additional Brazilian multinationals, key variables, 2006 a (Millions of US$)
Name Industry (Foreign
assets / total assets) (%)
(Foreign sales / total sales) (%)
(Foreign employment /
total employment)
(%)
Transnationality Index (%)
No. of host countries
Artecola Inds Quims Ltda Chemical 28 12 10 17 5 Bematech Indústria e Comércio de Equipamentos Eletrônicos S.A. IT .. 3 2 2 4
Datasul S.A. IT 1 2 2 2 3 Duas Rodas Industrial Ltda. Chemical 40 6 7 18 4 Localiza Rent a Car S.A. Transport .. .. .. 0.1 1
Marisol S.A. Textile 2 1 .. 1 2 Metalfrio Solutions S.A. Cooling 19 1 27 16 5
Método Engenharia S.A.
Engineering and
construction 19 6 1 9 3 Perdigão S.A. Agribusiness .. 33 .. 11 8
Portobello S.A. Construction materials 13 24 7 15 1
Randon S.A. Implementos e Participações Diversified 2 2 1 2 12 TOTVS S.A IT 3 5 5 4 3
Source: FDCCPII survey of Brazilian multinationals. Reais/dollar exchange rate (IMF): 2.175
a At this stage, their rankings could not be determined.
9
Annex table 3: The Top 20: Regionality Index, 2006
Regionality Index
Rank Name Africa Asia Europe Latin
America North
America
1 Companhia Vale do Rio Doce (CVRD)
10 60 10 10 10
2 Petrobras S.A (Petroleo Brasileiro S.A)
22 33 33 11 3 Gerdau S.A. 9 73 18
4 EMBRAER Empresa Brasileira de
Aeronáutica S.A. 40 40 20 5 Votorantim Participações S.A. 25 33 25 17
6 Companhia Siderurgica Nacional
(CSN) 50 50 7 Camargo Corrêa S.A. 17 8 67 8 8 Odebrecht S.A 17 8 8 58 8 9 Aracruz Celulose 40 40 20 10 Weg S.A. 8 17 33 33 8 11 Marcopolo S.A. 14 29 14 43 12 Andrade Gutierrez S.A. 13 88 13 Tigre S/A. Tubos e Conexões 86 14
14 Usinas Siderúrgicas de Minas Gerais
S.AUsiminas 15 Natura Cosméticos S.A. 14 86 16 Itautec S.A. 25 63 13 17 America Latina Logistica S.A. 100 18 Ultrapar Participações S.A. 100
19 Sabó Indústria e Comércio de
Autopeças Ltda. 27 55 9 9 20 Lupatech S.A. 50 50
Source: FDCCPII survey of Brazilian multinationals.
10
Annex table 4: Top 10 Brazilian crossborder merger and acquisition (M&A) transactions, 2005November 2007
(Millions of US$)
Date(s) Acquiror name Target company name Target industry Target
country
% of shares acquired
Value of transaction
3Nov06/5 Jan07
Companhia Vale do Rio Doce (CVRD) Inco Ltd Metals & mining Canada 89 19,466
11Jul07 J&F Participacoes S.A. Swift & Co Food and beverage United States 100 1,425
9Aug06 AmBev Quilmes Industrial S.A. Quinsa Food and beverage Argentina 34 1,200
13Dec05 Camargo Correa Group Loma Negra CIA S.A. Construction materials Argentina 100 1,025
1Sep07 GP Investimentos Pride Intl IncLatin American Oil & gas Argentina 100 1,000
9Dec05 Companhia Vale do Rio Doce (CVRD) Canico Resource Corp Metals & mining Canada 94 743
26Feb07 Companhia Vale do Rio Doce (CVRD)
AMCI Holdings Australia Pty Other financials Australia 100 663
24Jan06 Cia de TecidosTextile Bus Springs Inds Textiles & apparel United States 100 494
17Mar07 Grupo Votorantim Acerias Paz del Rio S.A. Metals & mining Colombia 52 489
31Mar05 Grupo Votorantim CEMEX S.A. Construction materials United States 100 389 Source: Thomson Financial.
11
Annex table 5: Selected Brazilian crossborder greenfield transactions undertaken or announced, 2004June 2007 (Millions of US$)
Date Company Name
Destination Country Sector Value
Aug05 Petrobras Nigeria Coal, oil and natural gas 1,900
Mar07
Companhia Vale do Rio Doce (CVRD) Mozambique Coal, oil and natural gas 1,200
May06 Petrobras USA Coal, oil and natural gas 500
Jul06 Petrobras Argentina Coal, oil and natural gas 450
Jun07 Petrobras Argentina Coal, oil and natural gas 420
Feb04
Companhia Siderurgica
Nacional (CSN) Portugal Metals 375
May04 Sigma Pharma Portugal Pharmaceuticals 359 Sep04 Petrobras Argentina Transportation 285
May07 Petrobras Nigeria Alternative/renewable
energy 200
Mar07 Votorantim Group USA
Building & construction materials 200
Jul06 Petrobras Argentina Coal, oil and natural gas 200 Sep04 Petrobras Argentina Transportation 200
Mar05 Petrobras Argentina Coal, oil and natural gas 180 Source: OCO Monitor, www.ocomonitor.com
12
Annex figure 1. Headquarter locations of the Top 20 Brazilian multinationals, 2006
Source: FDCCPII survey of Brazilian multinationals.
13
Basic inputs and
raw materials
Processed industrial goods
Finished industrial goods
Services Finished consumer goods
CVRD PETROBRAS
GERDAU VOTORANTIM
TIGRE USIMINAS ULTRAPAR
SABO CSN WEG
LUPATECH ARACRUZ CELULOSE
MARCOPOLO EMBRAER
CAMARGO CORREA ANDRADE GUTIERREZ ODEBRECHT ITAUTEC
AMERICA LATINA LOGISTICA
NATURA
Percentage of total assets for the Top 20 Brazilian MNEs
67.5% 19.2% 6.3% 6.8% 0.1%
Annex figure 2. Distribution of foreign assets of the Top 20 Brazilian MNEs, by industry, 2006
Source: FDCCPII survey of Brazilian multinationals.
14
Annex figure 3. Spread of foreign affiliates of Brazil’s top 10 multinationals
Source: FDCCPII survey of Brazilian multinationals.

15
Annex figure 4. Evolution of Brazilian FDI flows, 19802006
5000 0
5000 10000
15000 20000
25000 30000
35000
1980
1982
1984
1986
1988
1990
1992
1994
1996
1998
2000
2002
2004
2006
Source: Central Bank of Brazil
US $ million
Outward FDI Inward FDI