brazil soybean transportation · brazil soybean transportation a quarterly publication of the ......
TRANSCRIPT
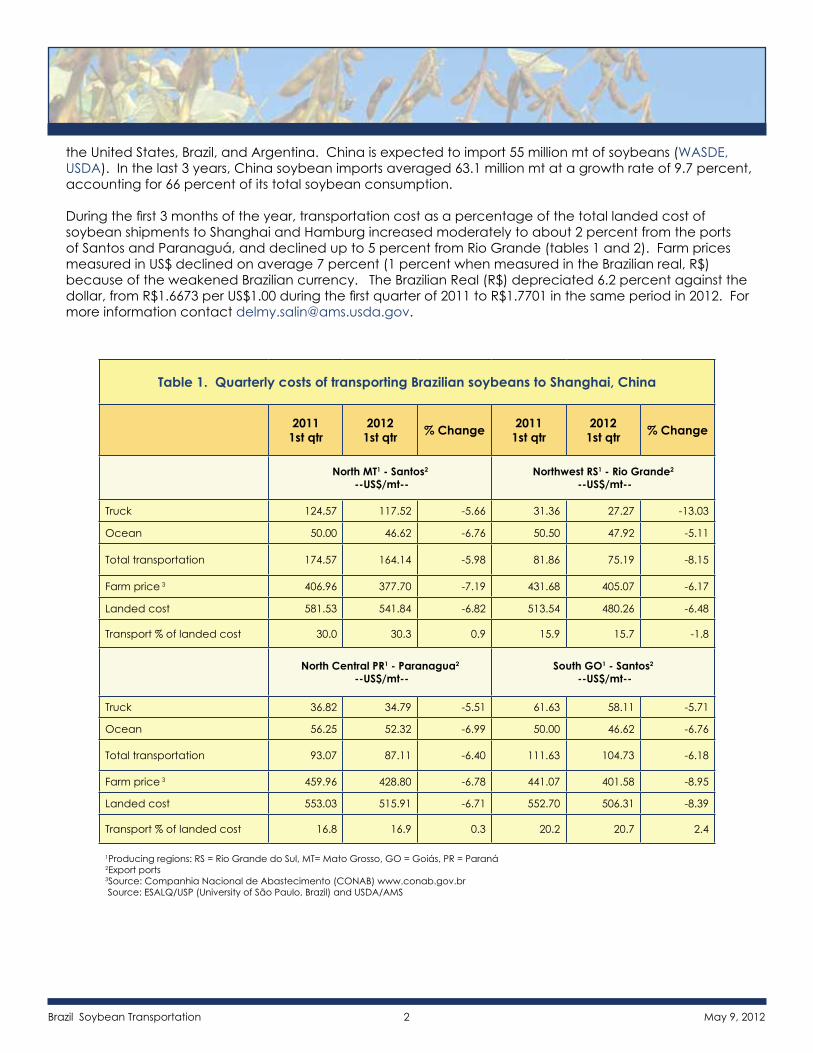
Smaller-Than-Expected Brazilian Soybean Crop Lowers Transportation Cost. Because of a drought, Brazil’s current soybean harvest is expected to be 65,603 million metric tons (mt), nearly 13 percent less than the 2010/2011 record levels of 75,324 million mt (CONAB). Brazilian soybean farmers increased the planted area but severe dry conditions since last November have lowered yields, especially in the Central-South States, lowering transportation demand. Production declined in Mato Grosso do Sul (MS) (-11%), Paraná (PR) (-36%), Rio Grande do Sul (RS) (-44%), and Santa Catarina (SC) ( 26%). During the first quarter of the year, 75 percent of the Brazil soybean production has been harvested and, on average, about 13 percent of the crop has been exported (figure 1). The peak of the harvest typically occurs in March and exports peak in May, resulting in higher truck rates during this time. However, this quarter, the rising trend changed, truck rates declined for the first time since 2005. The cost of shipping a metric ton of soybeans 100 miles by truck decreased 2 percent from $11.46 in the first quarter of 2011 to $10.53 in 2012 (table 6).
China, Brazil’s major soybean buyer, bought 22.1 million mt of Brazilian soybeans in 2011, valued at nearly US$11 billion. Preliminary data indicate that China purchased 73 percent of the first quarter 2012 soybean exports (Secretariat of Foreign Trade (SECEX)). The top leading soybean export ports were Santos, Paranaguá, and Sâo Francisco do Sul. Almost half of all soybean exports were shipped from Santos. China is the world’s largest soybean importer and fourth largest producer after
Brazil Soybean Transportationa quarterly publication of the
Transportation and Marketing Programs/Transportation Services Divisionwww.ams.usda.gov/AgTransportation
May 9, 2012
Contents
Brazil Soybean Transportation Indicators
Brazil Soybean Transportation Guide: 2010 (PDF)
Contact Information
Data Sets
Subscription Information
AgriculturalMarketing Service
Figure 1. Brazil soybean average monthly exports and harvest
Source: Source: Secretariat of Foreign Trade (SECEX) and National Company of Food Supply (CONAB)
Jan Feb Mar Apr May June July Aug Sept Oct Nov DecTotal exports 05-11 1.7 2.2 9.0 14.1 15.2 14.2 13.6 11.0 7.8 5.4 3.4 2.5Production 2012 3.8 31.8 39.8 21.1 3.3 0.2Exports to China 05-11 0.3 0.9 8.6 15.7 16.5 15.7 16.0 10.9 7.9 4.0 2.1 1.5
0.0
5.0
10.0
15.0
20.0
25.0
30.0
35.0
40.0
45.0
Perc
enta
ge
Brazil Soybean Transportation 2 May 9, 2012
the United States, Brazil, and Argentina. China is expected to import 55 million mt of soybeans (WASDE, USDA). In the last 3 years, China soybean imports averaged 63.1 million mt at a growth rate of 9.7 percent, accounting for 66 percent of its total soybean consumption.
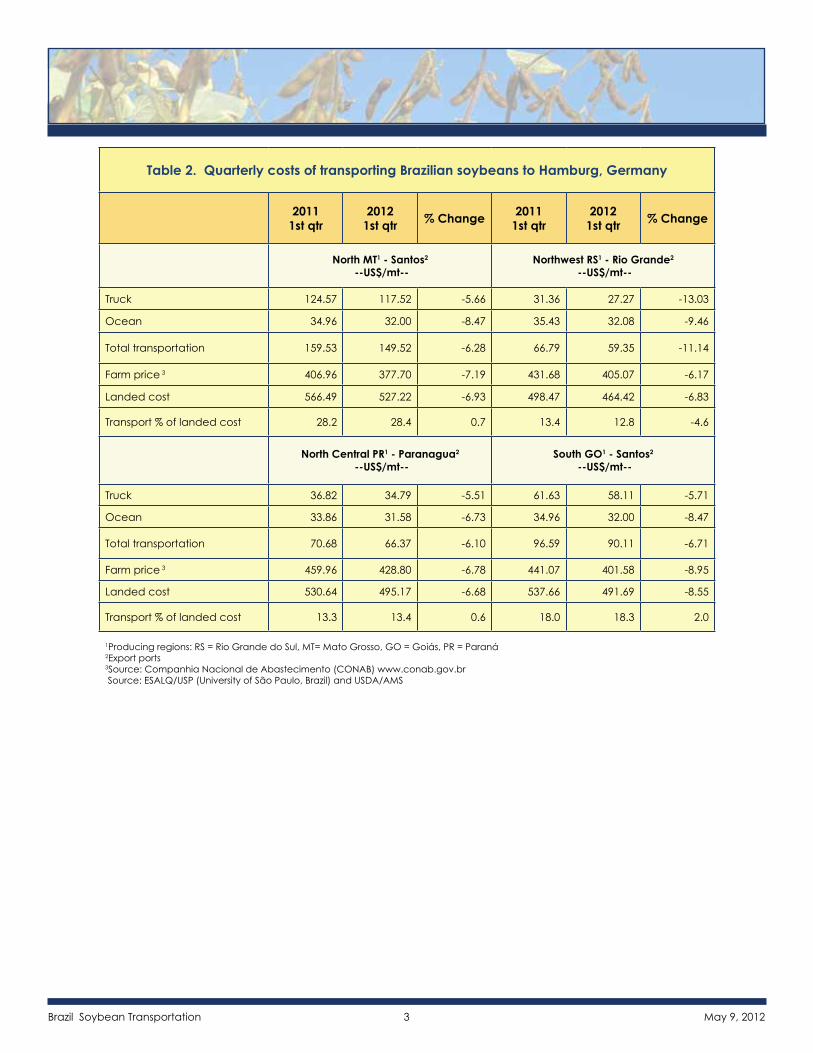
During the first 3 months of the year, transportation cost as a percentage of the total landed cost of soybean shipments to Shanghai and Hamburg increased moderately to about 2 percent from the ports of Santos and Paranaguá, and declined up to 5 percent from Rio Grande (tables 1 and 2). Farm prices measured in US$ declined on average 7 percent (1 percent when measured in the Brazilian real, R$) because of the weakened Brazilian currency. The Brazilian Real (R$) depreciated 6.2 percent against the dollar, from R$1.6673 per US$1.00 during the first quarter of 2011 to R$1.7701 in the same period in 2012. For more information contact [email protected].
Table 1. Quarterly costs of transporting Brazilian soybeans to Shanghai, China
2011 1st qtr
2012 1st qtr % Change 2011
1st qtr2012
1st qtr % Change
North MT1 - Santos2
--US$/mt-- Northwest RS1 - Rio Grande2
--US$/mt--
Truck 124.57 117.52 -5.66 31.36 27.27 -13.03
Ocean 50.00 46.62 -6.76 50.50 47.92 -5.11
Total transportation 174.57 164.14 -5.98 81.86 75.19 -8.15
Farm price 3 406.96 377.70 -7.19 431.68 405.07 -6.17
Landed cost 581.53 541.84 -6.82 513.54 480.26 -6.48
Transport % of landed cost 30.0 30.3 0.9 15.9 15.7 -1.8
North Central PR1 - Paranagua2
--US$/mt-- South GO1 - Santos2
--US$/mt--
Truck 36.82 34.79 -5.51 61.63 58.11 -5.71
Ocean 56.25 52.32 -6.99 50.00 46.62 -6.76
Total transportation 93.07 87.11 -6.40 111.63 104.73 -6.18
Farm price 3 459.96 428.80 -6.78 441.07 401.58 -8.95
Landed cost 553.03 515.91 -6.71 552.70 506.31 -8.39
Transport % of landed cost 16.8 16.9 0.3 20.2 20.7 2.4
1Producing regions: RS = Rio Grande do Sul, MT= Mato Grosso, GO = Goiás, PR = Paraná 2Export ports3Source: Companhia Nacional de Abastecimento (CONAB) www.conab.gov.br Source: ESALQ/USP (University of São Paulo, Brazil) and USDA/AMS
Brazil Soybean Transportation 3 May 9, 2012
Table 2. Quarterly costs of transporting Brazilian soybeans to Hamburg, Germany
2011 1st qtr
2012 1st qtr % Change 2011
1st qtr2012
1st qtr % Change
North MT1 - Santos2
--US$/mt-- Northwest RS1 - Rio Grande2
--US$/mt--
Truck 124.57 117.52 -5.66 31.36 27.27 -13.03
Ocean 34.96 32.00 -8.47 35.43 32.08 -9.46
Total transportation 159.53 149.52 -6.28 66.79 59.35 -11.14
Farm price 3 406.96 377.70 -7.19 431.68 405.07 -6.17
Landed cost 566.49 527.22 -6.93 498.47 464.42 -6.83
Transport % of landed cost 28.2 28.4 0.7 13.4 12.8 -4.6
North Central PR1 - Paranagua2
--US$/mt-- South GO1 - Santos2
--US$/mt--
Truck 36.82 34.79 -5.51 61.63 58.11 -5.71
Ocean 33.86 31.58 -6.73 34.96 32.00 -8.47
Total transportation 70.68 66.37 -6.10 96.59 90.11 -6.71
Farm price 3 459.96 428.80 -6.78 441.07 401.58 -8.95
Landed cost 530.64 495.17 -6.68 537.66 491.69 -8.55
Transport % of landed cost 13.3 13.4 0.6 18.0 18.3 2.0
1Producing regions: RS = Rio Grande do Sul, MT= Mato Grosso, GO = Goiás, PR = Paraná 2Export ports3Source: Companhia Nacional de Abastecimento (CONAB) www.conab.gov.br Source: ESALQ/USP (University of São Paulo, Brazil) and USDA/AMS
Brazil Soybean Transportation 4 May 9, 2012
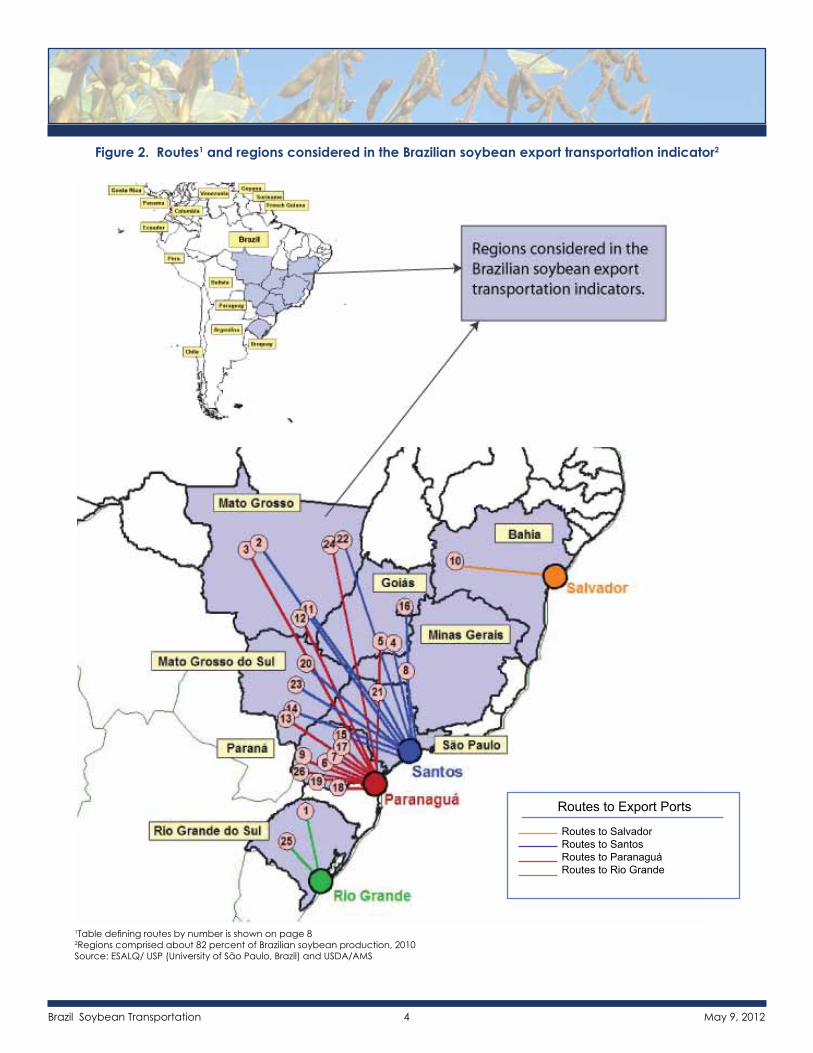
Figure 2. Routes1 and regions considered in the Brazilian soybean export transportation indicator2
Routes to Export Ports
Routes to Salvador Routes to Santos Routes to Paranaguá Routes to Rio Grande
1Table defining routes by number is shown on page 82Regions comprised about 82 percent of Brazilian soybean production, 2010Source: ESALQ/ USP (University of São Paulo, Brazil) and USDA/AMS
Brazil Soybean Transportation 5 May 9, 2012
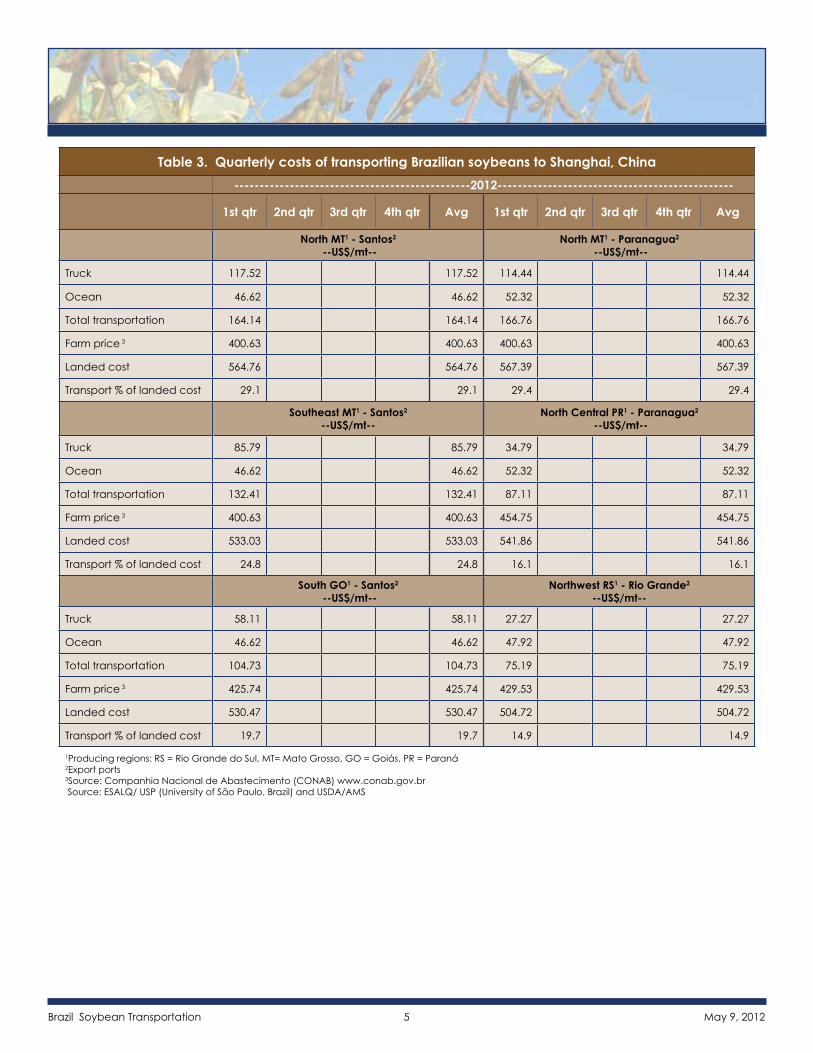
Table 3. Quarterly costs of transporting Brazilian soybeans to Shanghai, China-----------------------------------------------2012-----------------------------------------------
1st qtr 2nd qtr 3rd qtr 4th qtr Avg 1st qtr 2nd qtr 3rd qtr 4th qtr Avg
North MT1 - Santos2
--US$/mt-- North MT1 - Paranagua2
--US$/mt--
Truck 117.52 117.52 114.44 114.44
Ocean 46.62 46.62 52.32 52.32
Total transportation 164.14 164.14 166.76 166.76
Farm price 3 400.63 400.63 400.63 400.63
Landed cost 564.76 564.76 567.39 567.39
Transport % of landed cost 29.1 29.1 29.4 29.4
Southeast MT1 - Santos2
--US$/mt-- North Central PR1 - Paranagua2
--US$/mt--
Truck 85.79 85.79 34.79 34.79
Ocean 46.62 46.62 52.32 52.32
Total transportation 132.41 132.41 87.11 87.11
Farm price 3 400.63 400.63 454.75 454.75
Landed cost 533.03 533.03 541.86 541.86
Transport % of landed cost 24.8 24.8 16.1 16.1
South GO1 - Santos2
--US$/mt-- Northwest RS1 - Rio Grande2
--US$/mt--
Truck 58.11 58.11 27.27 27.27
Ocean 46.62 46.62 47.92 47.92
Total transportation 104.73 104.73 75.19 75.19
Farm price 3 425.74 425.74 429.53 429.53
Landed cost 530.47 530.47 504.72 504.72
Transport % of landed cost 19.7 19.7 14.9 14.9
1Producing regions: RS = Rio Grande do Sul, MT= Mato Grosso, GO = Goiás, PR = Paraná 2Export ports3Source: Companhia Nacional de Abastecimento (CONAB) www.conab.gov.br Source: ESALQ/ USP (University of São Paulo, Brazil) and USDA/AMS
Brazil Soybean Transportation 6 May 9, 2012
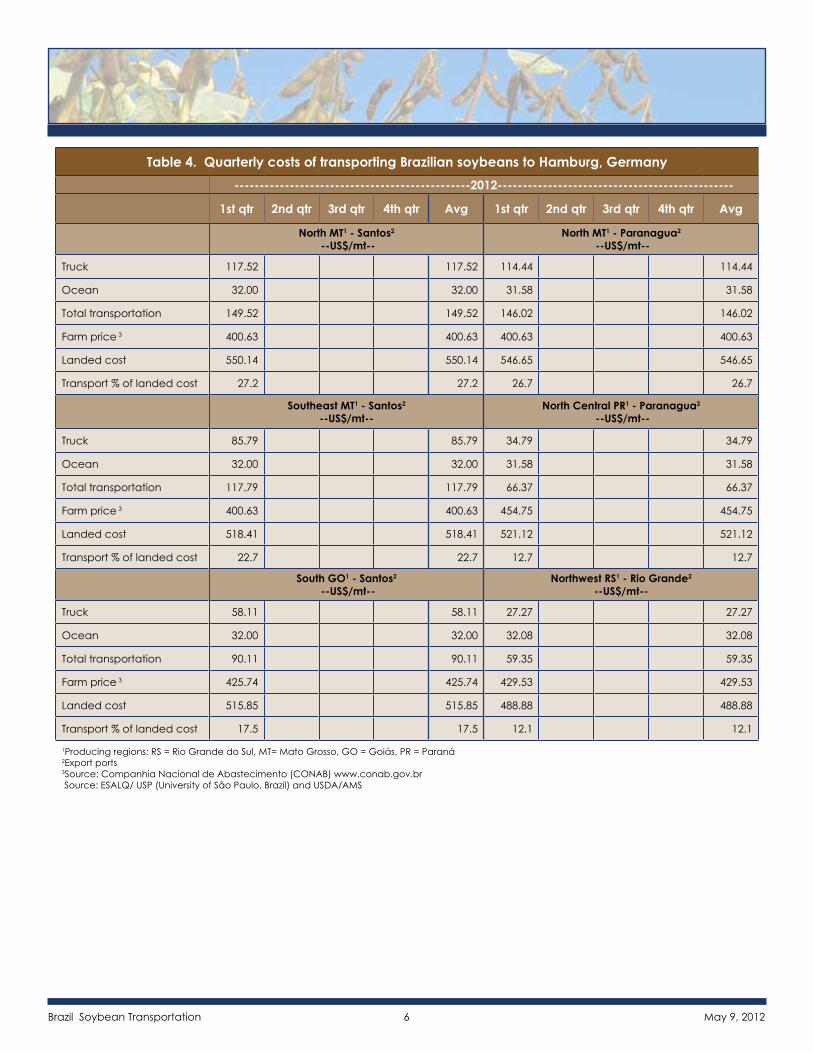
Table 4. Quarterly costs of transporting Brazilian soybeans to Hamburg, Germany-----------------------------------------------2012-----------------------------------------------
1st qtr 2nd qtr 3rd qtr 4th qtr Avg 1st qtr 2nd qtr 3rd qtr 4th qtr Avg
North MT1 - Santos2
--US$/mt-- North MT1 - Paranagua2
--US$/mt--
Truck 117.52 117.52 114.44 114.44
Ocean 32.00 32.00 31.58 31.58
Total transportation 149.52 149.52 146.02 146.02
Farm price 3 400.63 400.63 400.63 400.63
Landed cost 550.14 550.14 546.65 546.65
Transport % of landed cost 27.2 27.2 26.7 26.7
Southeast MT1 - Santos2
--US$/mt-- North Central PR1 - Paranagua2
--US$/mt--
Truck 85.79 85.79 34.79 34.79
Ocean 32.00 32.00 31.58 31.58
Total transportation 117.79 117.79 66.37 66.37
Farm price 3 400.63 400.63 454.75 454.75
Landed cost 518.41 518.41 521.12 521.12
Transport % of landed cost 22.7 22.7 12.7 12.7
South GO1 - Santos2
--US$/mt-- Northwest RS1 - Rio Grande2
--US$/mt--
Truck 58.11 58.11 27.27 27.27
Ocean 32.00 32.00 32.08 32.08
Total transportation 90.11 90.11 59.35 59.35
Farm price 3 425.74 425.74 429.53 429.53
Landed cost 515.85 515.85 488.88 488.88
Transport % of landed cost 17.5 17.5 12.1 12.1
1Producing regions: RS = Rio Grande do Sul, MT= Mato Grosso, GO = Goiás, PR = Paraná 2Export ports3Source: Companhia Nacional de Abastecimento (CONAB) www.conab.gov.br Source: ESALQ/ USP (University of São Paulo, Brazil) and USDA/AMS
Brazil Soybean Transportation 7 May 9, 2012
Brazil Soybean Transportation Indicators
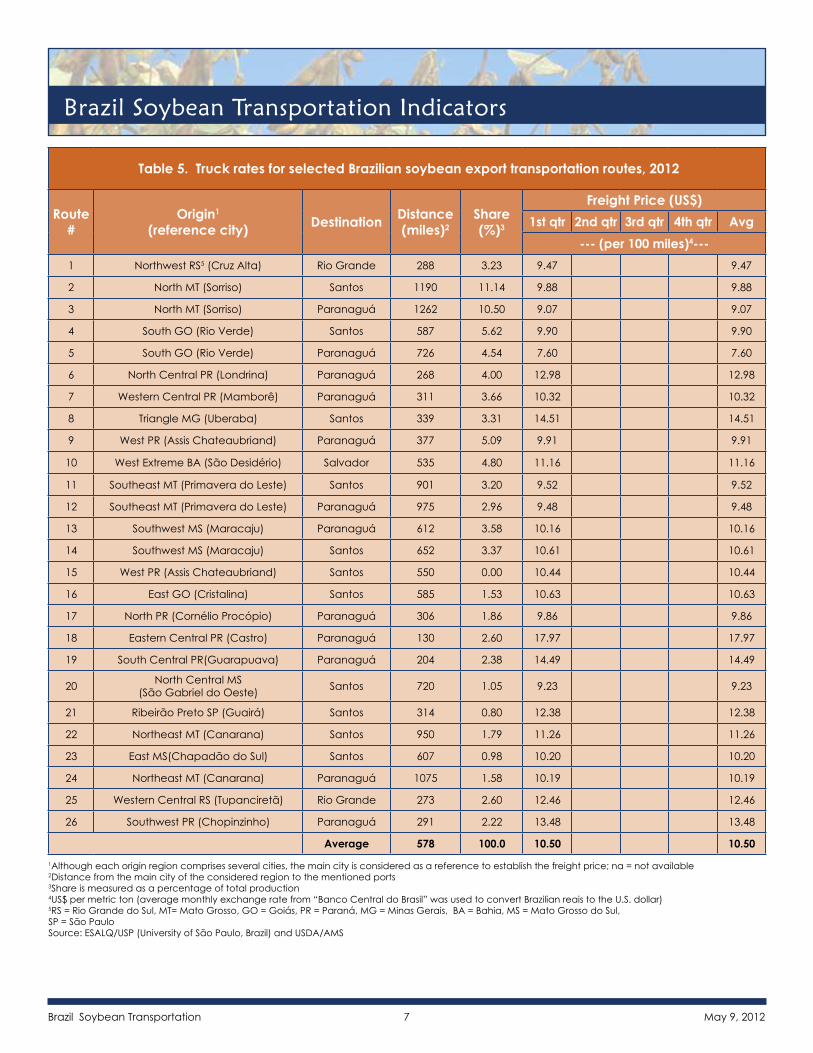
Table 5. Truck rates for selected Brazilian soybean export transportation routes, 2012
Route #
Origin1 (reference city) Destination Distance
(miles)2Share (%)3
Freight Price (US$)1st qtr 2nd qtr 3rd qtr 4th qtr Avg
--- (per 100 miles)4---1 Northwest RS5 (Cruz Alta) Rio Grande 288 3.23 9.47 9.47
2 North MT (Sorriso) Santos 1190 11.14 9.88 9.88
3 North MT (Sorriso) Paranaguá 1262 10.50 9.07 9.07
4 South GO (Rio Verde) Santos 587 5.62 9.90 9.90
5 South GO (Rio Verde) Paranaguá 726 4.54 7.60 7.60
6 North Central PR (Londrina) Paranaguá 268 4.00 12.98 12.98
7 Western Central PR (Mamborê) Paranaguá 311 3.66 10.32 10.32
8 Triangle MG (Uberaba) Santos 339 3.31 14.51 14.51
9 West PR (Assis Chateaubriand) Paranaguá 377 5.09 9.91 9.91
10 West Extreme BA (São Desidério) Salvador 535 4.80 11.16 11.16
11 Southeast MT (Primavera do Leste) Santos 901 3.20 9.52 9.52
12 Southeast MT (Primavera do Leste) Paranaguá 975 2.96 9.48 9.48
13 Southwest MS (Maracaju) Paranaguá 612 3.58 10.16 10.16
14 Southwest MS (Maracaju) Santos 652 3.37 10.61 10.61
15 West PR (Assis Chateaubriand) Santos 550 0.00 10.44 10.44
16 East GO (Cristalina) Santos 585 1.53 10.63 10.63
17 North PR (Cornélio Procópio) Paranaguá 306 1.86 9.86 9.86
18 Eastern Central PR (Castro) Paranaguá 130 2.60 17.97 17.97
19 South Central PR(Guarapuava) Paranaguá 204 2.38 14.49 14.49
20 North Central MS (São Gabriel do Oeste) Santos 720 1.05 9.23 9.23
21 Ribeirão Preto SP (Guairá) Santos 314 0.80 12.38 12.38
22 Northeast MT (Canarana) Santos 950 1.79 11.26 11.26
23 East MS(Chapadão do Sul) Santos 607 0.98 10.20 10.20
24 Northeast MT (Canarana) Paranaguá 1075 1.58 10.19 10.19
25 Western Central RS (Tupanciretã) Rio Grande 273 2.60 12.46 12.46
26 Southwest PR (Chopinzinho) Paranaguá 291 2.22 13.48 13.48
Average 578 100.0 10.50 10.50
1Although each origin region comprises several cities, the main city is considered as a reference to establish the freight price; na = not available2Distance from the main city of the considered region to the mentioned ports3Share is measured as a percentage of total production4US$ per metric ton (average monthly exchange rate from “Banco Central do Brasil” was used to convert Brazilian reais to the U.S. dollar)5RS = Rio Grande do Sul, MT= Mato Grosso, GO = Goiás, PR = Paraná, MG = Minas Gerais, BA = Bahia, MS = Mato Grosso do Sul, SP = São PauloSource: ESALQ/USP (University of São Paulo, Brazil) and USDA/AMS
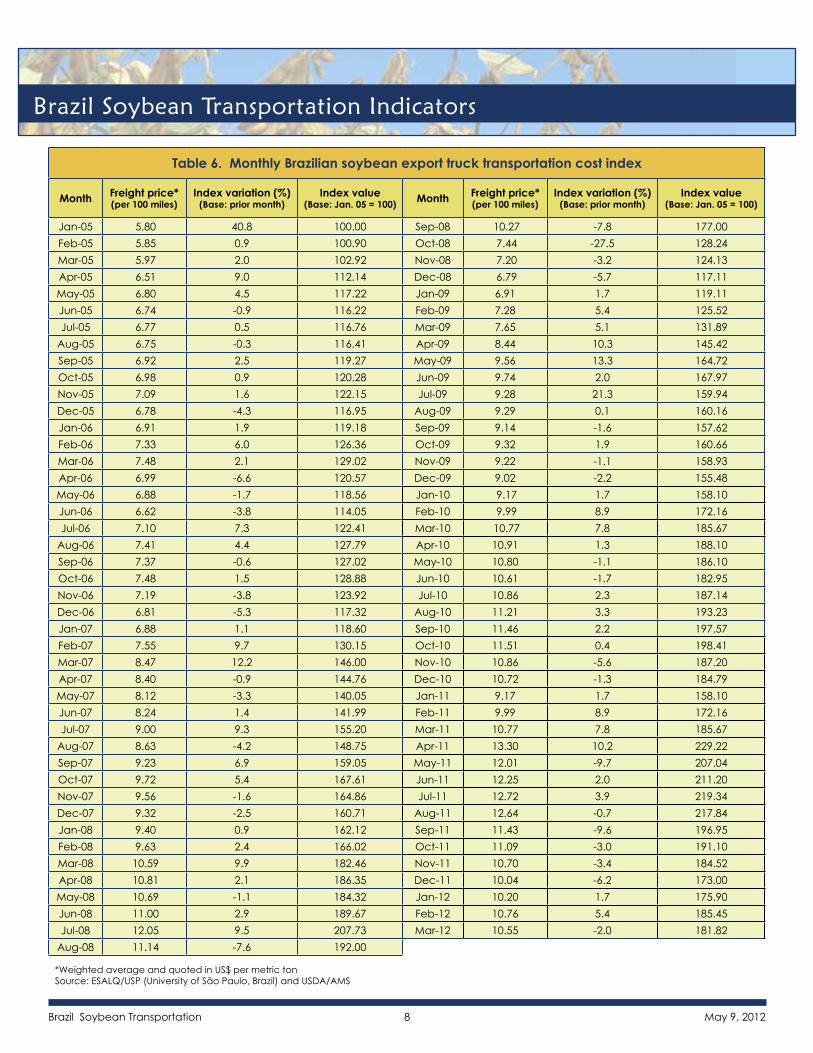
Table 6. Monthly Brazilian soybean export truck transportation cost index
Month Freight price* (per 100 miles)
Index variation (%) (Base: prior month)
Index value (Base: Jan. 05 = 100) Month Freight price*
(per 100 miles)Index variation (%)
(Base: prior month)Index value
(Base: Jan. 05 = 100)
Jan-05 5.80 40.8 100.00 Sep-08 10.27 -7.8 177.00Feb-05 5.85 0.9 100.90 Oct-08 7.44 -27.5 128.24Mar-05 5.97 2.0 102.92 Nov-08 7.20 -3.2 124.13Apr-05 6.51 9.0 112.14 Dec-08 6.79 -5.7 117.11May-05 6.80 4.5 117.22 Jan-09 6.91 1.7 119.11Jun-05 6.74 -0.9 116.22 Feb-09 7.28 5.4 125.52Jul-05 6.77 0.5 116.76 Mar-09 7.65 5.1 131.89
Aug-05 6.75 -0.3 116.41 Apr-09 8.44 10.3 145.42Sep-05 6.92 2.5 119.27 May-09 9.56 13.3 164.72Oct-05 6.98 0.9 120.28 Jun-09 9.74 2.0 167.97Nov-05 7.09 1.6 122.15 Jul-09 9.28 21.3 159.94Dec-05 6.78 -4.3 116.95 Aug-09 9.29 0.1 160.16Jan-06 6.91 1.9 119.18 Sep-09 9.14 -1.6 157.62Feb-06 7.33 6.0 126.36 Oct-09 9.32 1.9 160.66Mar-06 7.48 2.1 129.02 Nov-09 9.22 -1.1 158.93Apr-06 6.99 -6.6 120.57 Dec-09 9.02 -2.2 155.48May-06 6.88 -1.7 118.56 Jan-10 9.17 1.7 158.10Jun-06 6.62 -3.8 114.05 Feb-10 9.99 8.9 172.16Jul-06 7.10 7.3 122.41 Mar-10 10.77 7.8 185.67
Aug-06 7.41 4.4 127.79 Apr-10 10.91 1.3 188.10Sep-06 7.37 -0.6 127.02 May-10 10.80 -1.1 186.10Oct-06 7.48 1.5 128.88 Jun-10 10.61 -1.7 182.95Nov-06 7.19 -3.8 123.92 Jul-10 10.86 2.3 187.14Dec-06 6.81 -5.3 117.32 Aug-10 11.21 3.3 193.23Jan-07 6.88 1.1 118.60 Sep-10 11.46 2.2 197.57Feb-07 7.55 9.7 130.15 Oct-10 11.51 0.4 198.41Mar-07 8.47 12.2 146.00 Nov-10 10.86 -5.6 187.20Apr-07 8.40 -0.9 144.76 Dec-10 10.72 -1.3 184.79May-07 8.12 -3.3 140.05 Jan-11 9.17 1.7 158.10Jun-07 8.24 1.4 141.99 Feb-11 9.99 8.9 172.16Jul-07 9.00 9.3 155.20 Mar-11 10.77 7.8 185.67
Aug-07 8.63 -4.2 148.75 Apr-11 13.30 10.2 229.22Sep-07 9.23 6.9 159.05 May-11 12.01 -9.7 207.04Oct-07 9.72 5.4 167.61 Jun-11 12.25 2.0 211.20Nov-07 9.56 -1.6 164.86 Jul-11 12.72 3.9 219.34Dec-07 9.32 -2.5 160.71 Aug-11 12.64 -0.7 217.84Jan-08 9.40 0.9 162.12 Sep-11 11.43 -9.6 196.95Feb-08 9.63 2.4 166.02 Oct-11 11.09 -3.0 191.10Mar-08 10.59 9.9 182.46 Nov-11 10.70 -3.4 184.52Apr-08 10.81 2.1 186.35 Dec-11 10.04 -6.2 173.00May-08 10.69 -1.1 184.32 Jan-12 10.20 1.7 175.90Jun-08 11.00 2.9 189.67 Feb-12 10.76 5.4 185.45Jul-08 12.05 9.5 207.73 Mar-12 10.55 -2.0 181.82
Aug-08 11.14 -7.6 192.00 *Weighted average and quoted in US$ per metric ton Source: ESALQ/USP (University of São Paulo, Brazil) and USDA/AMS
Brazil Soybean Transportation 8 May 9, 2012
Brazil Soybean Transportation Indicators
Brazil Soybean Transportation 9 May 9, 2012
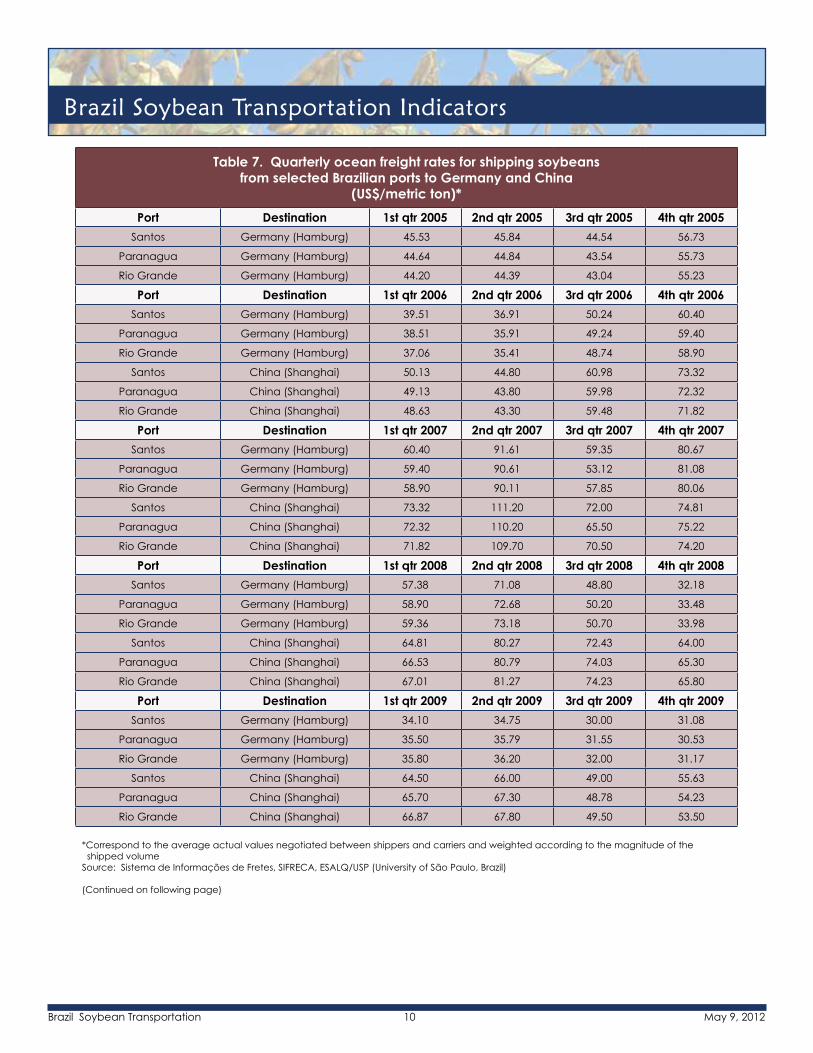
Figure 4. Brazilian soybean export truck transportation weighted average prices, 2010/12
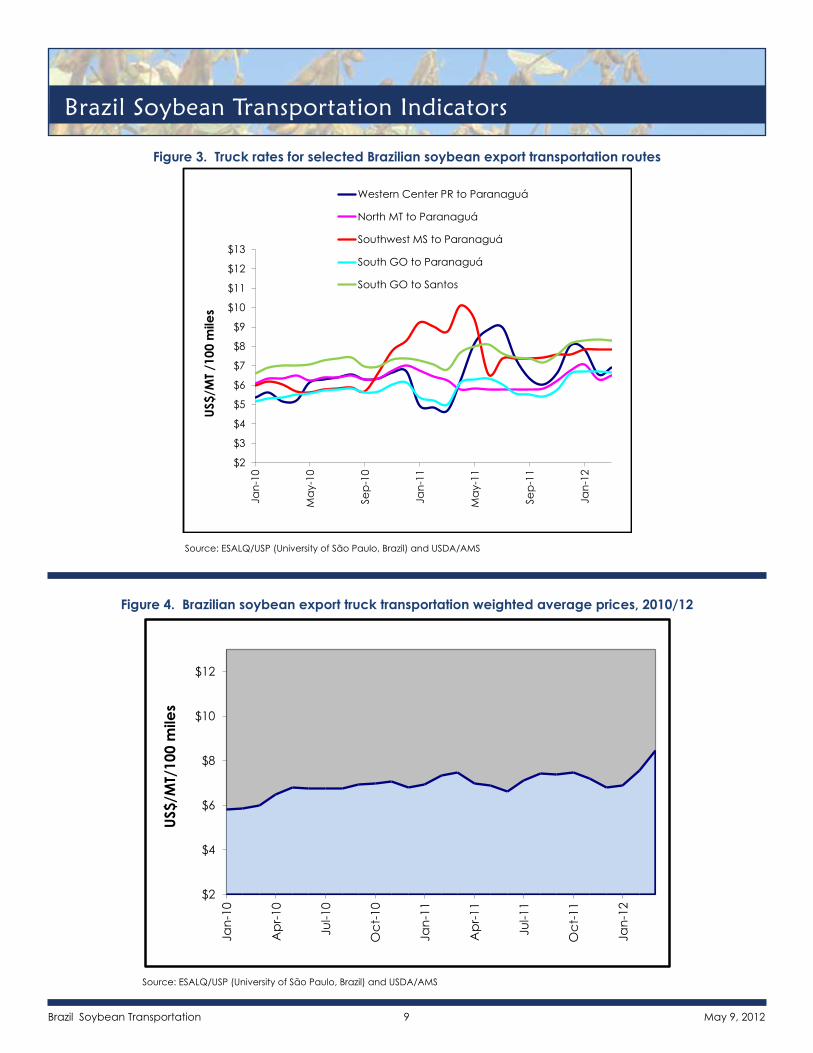
Figure 3. Truck rates for selected Brazilian soybean export transportation routes
Source: ESALQ/USP (University of São Paulo, Brazil) and USDA/AMS
Source: ESALQ/USP (University of São Paulo, Brazil) and USDA/AMS
Brazil Soybean Transportation Indicators
$2
$3
$4
$5
$6
$7
$8
$9
$10
$11
$12
$13Ja
n-10
May
-10
Sep-
10
Jan-
11
May
-11
Sep-
11
Jan-
12
US$/
MT /
100
mile
sWestern Center PR to Paranaguá
North MT to Paranaguá
Southwest MS to Paranaguá
South GO to Paranaguá
South GO to Santos
$2
$4
$6
$8
$10
$12
Jan-
10
Apr
-10
Jul-1
0
Oct
-10
Jan-
11
Apr
-11
Jul-1
1
Oct
-11
Jan-
12
US$/
MT/
100
mile
s
Brazil Soybean Transportation 10 May 9, 2012
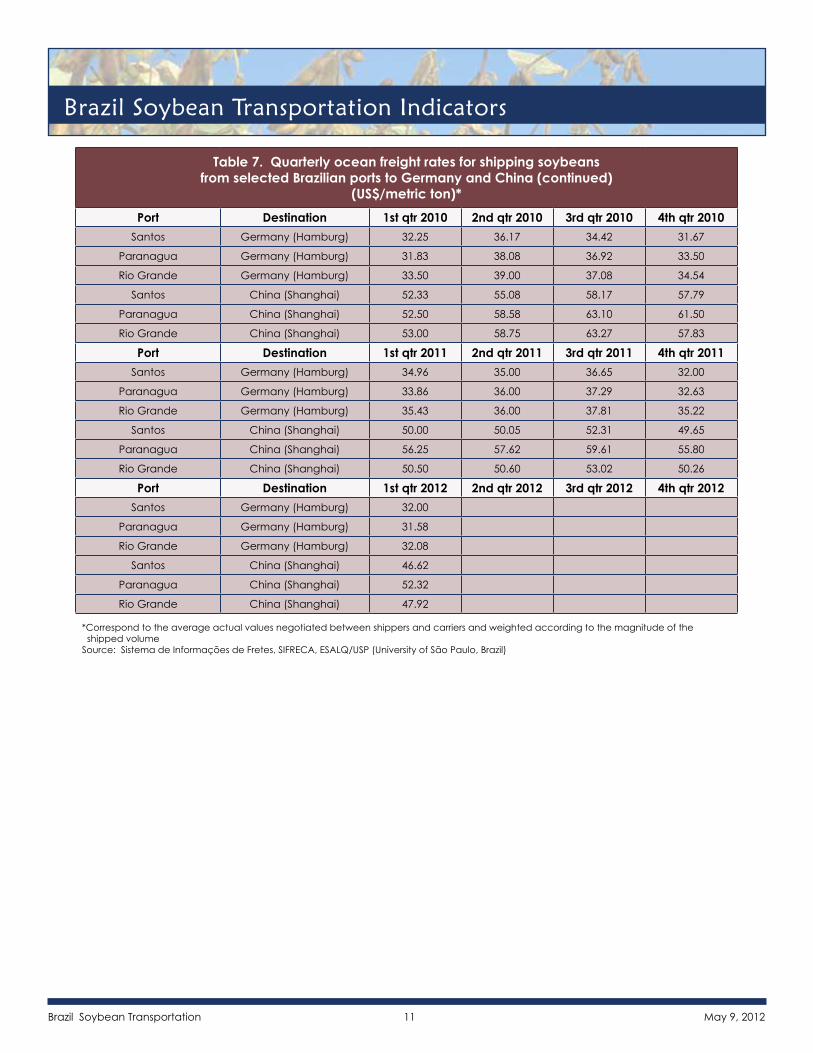
Table 7. Quarterly ocean freight rates for shipping soybeans from selected Brazilian ports to Germany and China
(US$/metric ton)*Port Destination 1st qtr 2005 2nd qtr 2005 3rd qtr 2005 4th qtr 2005
Santos Germany (Hamburg) 45.53 45.84 44.54 56.73
Paranagua Germany (Hamburg) 44.64 44.84 43.54 55.73
Rio Grande Germany (Hamburg) 44.20 44.39 43.04 55.23
Port Destination 1st qtr 2006 2nd qtr 2006 3rd qtr 2006 4th qtr 2006Santos Germany (Hamburg) 39.51 36.91 50.24 60.40
Paranagua Germany (Hamburg) 38.51 35.91 49.24 59.40
Rio Grande Germany (Hamburg) 37.06 35.41 48.74 58.90
Santos China (Shanghai) 50.13 44.80 60.98 73.32
Paranagua China (Shanghai) 49.13 43.80 59.98 72.32
Rio Grande China (Shanghai) 48.63 43.30 59.48 71.82
Port Destination 1st qtr 2007 2nd qtr 2007 3rd qtr 2007 4th qtr 2007Santos Germany (Hamburg) 60.40 91.61 59.35 80.67
Paranagua Germany (Hamburg) 59.40 90.61 53.12 81.08
Rio Grande Germany (Hamburg) 58.90 90.11 57.85 80.06
Santos China (Shanghai) 73.32 111.20 72.00 74.81
Paranagua China (Shanghai) 72.32 110.20 65.50 75.22
Rio Grande China (Shanghai) 71.82 109.70 70.50 74.20
Port Destination 1st qtr 2008 2nd qtr 2008 3rd qtr 2008 4th qtr 2008Santos Germany (Hamburg) 57.38 71.08 48.80 32.18
Paranagua Germany (Hamburg) 58.90 72.68 50.20 33.48
Rio Grande Germany (Hamburg) 59.36 73.18 50.70 33.98
Santos China (Shanghai) 64.81 80.27 72.43 64.00
Paranagua China (Shanghai) 66.53 80.79 74.03 65.30
Rio Grande China (Shanghai) 67.01 81.27 74.23 65.80
Port Destination 1st qtr 2009 2nd qtr 2009 3rd qtr 2009 4th qtr 2009Santos Germany (Hamburg) 34.10 34.75 30.00 31.08
Paranagua Germany (Hamburg) 35.50 35.79 31.55 30.53
Rio Grande Germany (Hamburg) 35.80 36.20 32.00 31.17
Santos China (Shanghai) 64.50 66.00 49.00 55.63
Paranagua China (Shanghai) 65.70 67.30 48.78 54.23
Rio Grande China (Shanghai) 66.87 67.80 49.50 53.50
*Correspond to the average actual values negotiated between shippers and carriers and weighted according to the magnitude of the shipped volumeSource: Sistema de Informações de Fretes, SIFRECA, ESALQ/USP (University of São Paulo, Brazil) (Continued on following page)
Brazil Soybean Transportation Indicators
Brazil Soybean Transportation 11 May 9, 2012
Table 7. Quarterly ocean freight rates for shipping soybeans from selected Brazilian ports to Germany and China (continued)
(US$/metric ton)*Port Destination 1st qtr 2010 2nd qtr 2010 3rd qtr 2010 4th qtr 2010
Santos Germany (Hamburg) 32.25 36.17 34.42 31.67
Paranagua Germany (Hamburg) 31.83 38.08 36.92 33.50
Rio Grande Germany (Hamburg) 33.50 39.00 37.08 34.54
Santos China (Shanghai) 52.33 55.08 58.17 57.79
Paranagua China (Shanghai) 52.50 58.58 63.10 61.50
Rio Grande China (Shanghai) 53.00 58.75 63.27 57.83
Port Destination 1st qtr 2011 2nd qtr 2011 3rd qtr 2011 4th qtr 2011Santos Germany (Hamburg) 34.96 35.00 36.65 32.00
Paranagua Germany (Hamburg) 33.86 36.00 37.29 32.63
Rio Grande Germany (Hamburg) 35.43 36.00 37.81 35.22
Santos China (Shanghai) 50.00 50.05 52.31 49.65
Paranagua China (Shanghai) 56.25 57.62 59.61 55.80
Rio Grande China (Shanghai) 50.50 50.60 53.02 50.26
Port Destination 1st qtr 2012 2nd qtr 2012 3rd qtr 2012 4th qtr 2012Santos Germany (Hamburg) 32.00
Paranagua Germany (Hamburg) 31.58
Rio Grande Germany (Hamburg) 32.08
Santos China (Shanghai) 46.62
Paranagua China (Shanghai) 52.32
Rio Grande China (Shanghai) 47.92
*Correspond to the average actual values negotiated between shippers and carriers and weighted according to the magnitude of the shipped volume Source: Sistema de Informações de Fretes, SIFRECA, ESALQ/USP (University of São Paulo, Brazil)
Brazil Soybean Transportation Indicators
Brazil Soybean Transportation 12 May 9, 2012
Contact Information:
Delmy L. SalinSenior Economist, Project Manager [email protected] (202) 720-0833
Jessica E. LaddGraphic Analyst [email protected] (202) 720-6494
Data Sets:
♦ Figure 1: Brazil soybean average monthly exports and harvest (XLS)
♦ Figure 3: Truck rates for selected Brazilian soybean export transportation routes (XLS)
♦ Figure 4: Brazilian soybean export truck transportation weighted average prices, 2010/12 (XLS)
♦ Table 1: Quarterly costs of transporting Brazilian soybeans to Shanghai, China (XLS)
♦ Table 2: Quarterly costs of transporting Brazilian soybeans to Hamburg, Germany (XLS)
♦ Table 3: Quarterly costs of transporting Brazilian soybeans to Shanghai, China (XLS)
♦ Table 4: Quarterly costs of transporting Brazilian soybeans to Hamburg, Germany (XLS)
♦ Table 5: Truck rates for selected Brazilian soybean export transportation routes, 2012 (XLS)
♦ Table 6: Monthly Brazilian soybean export truck transportation cost index (XLS)
♦ Table 7: Quarterly ocean freight rates for shipping soybeans from selected Brazilian ports to Germany and China (XLS)
Subscription Information: Send relevant information to [email protected] for an electronic copy.
Related Websites:
♦ Soybean Transportation Guide: Brazil 2010 (PDF)
♦ Prior Articles: Brazil Soybean Transportation, February 14, 2012 (PDF)
♦ Related Articles: Grain Transportation Report (PDF)
♦ U.S. Corn, Soybean, and Wheat Quarterly Transportation Cost Indicator Reports
The U.S. Department of Agriculture (USDA) prohibits discrimination in all its programs and activities on the basis of race, color, national origin, age, disability, and where applicable, sex, marital status, familial status, parental status, religion, sexual orientation, genetic information, political beliefs, reprisal, or because all or part of an individual’s income is derived from any public assistance program (Not all prohibited bases apply to all programs.) Persons with disabilities who require alternative means for communication of program information (Braille, large print, audiotape, etc.) should contact USDA’s TARGET Center at (202) 720-2600 (voice and TDD). To file a complaint of discrimination, write to USDA, Director, Office of Civil Rights, 1400 Independence Avenue, S.W., Washington, D.C. 20250-9410, or call (800) 795-3272 (voice) or (202) 720-6382 (TDD). USDA is an equal opportunity provider and employer.