brazil - economiaemdia.com.br€¦ · o economic activity continued to outperform expectations,...
TRANSCRIPT

BRAZIL MACROECONOMIC
OUTLOOKAugust, 2020
Economic Research Department

o Economic activity continued to outperform expectations, suggesting that GDP will slide less thaninitially thought in 2020.
o We revised our 2020 GDP growth forecast from -5.9% to -4.5%, and expect growth to rebound to+3.5% in 2021. Manufacturing output and retail sales are conforming a more robust improvement inconfidence.
o External accounts adjustment is likely to be more moderate going forward. We expect that theconfirmation of a more positive domestic growth trend, coupled with less aversion to external risk, will leaveroom for the exchange rate to stay at BRL/USD 5.10 at year-end 2020 and 2021.
o The Broad Consumer Price Index (IPCA) is expected to end 2020 at 1.9%, reaching 3.1% in 2021. Thisupward trend is to be expected, as inflation is moving back towards the center of the target range after anatypical period of deflation during the pandemic.
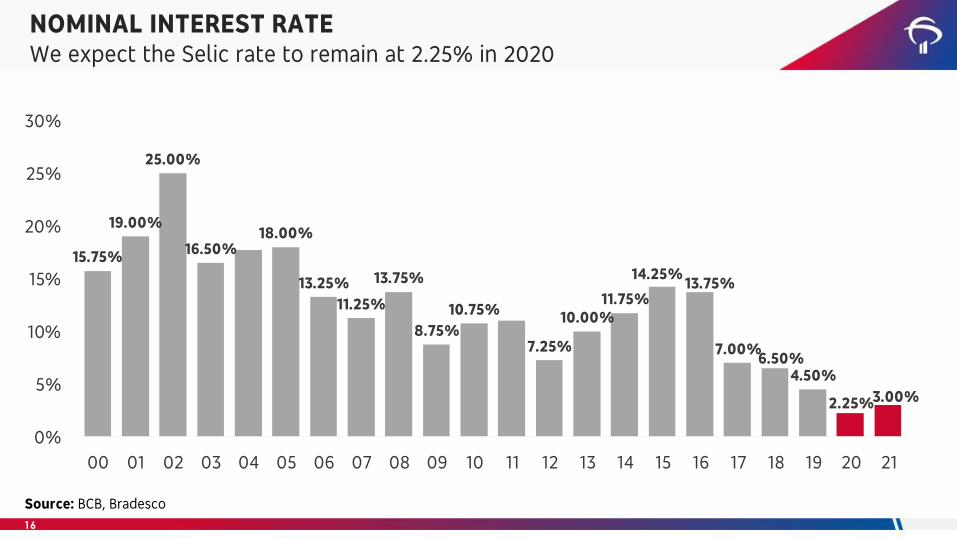
o We expect the benchmark Selic rate to remain at 2.25% through the end of this year, and to end 2021at 3.00%. The balance of risks continues to suggest caution. We expect monetary policy to normalizetowards the neutral interest rate, bringing the Selic rate to 3.00% at year-end 2021.
BRAZIL – MACROECONOMIC OUTLOOKUpdates
2

GDPAnnual rate of change, %
Source: IBGE, Bradesco
3
4.4
1.4
3.1
1.1
5.8
3.24.0
6.15.1
-0.1
7.5
4.0
1.93.0
0.5
-3.5 -3.3
1.3 1.3 1.1
-4.5
3.5
-6.0
-4.0
-2.0
0.0
2.0
4.0
6.0
8.0
10.0
00 01 02 03 04 05 06 07 08 09 10 11 12 13 14 15 16 17 18 19 20 21
Crescimento anual do PIB, em %

Investment
Government Consumption Household Consumption
Source: IBGE, Bradesco
GDPAnnual rate of change, %
8.5
2.0
6.7
12.0 12.3
-2.1
17.9
6.8
0.8
5.8
-4.2
-13.9-12.1
-2.6
3.92.2
-7.1
6.0
-20.0
-15.0
-10.0
-5.0
0.0
5.0
10.0
15.0
20.0
04 05 06 07 08 09 10 11 12 13 14 15 16 17 18 19 20 21
-0.2
2.6
3.8
1.6
3.9
2.0
3.64.1
2.0
2.9
3.9
2.2 2.3
1.5
0.8
-1.4
0.2
-0.7
0.4
-0.4
0.6
2.0
-2.0
-1.0
0.0
1.0
2.0
3.0
4.0
5.0
00 01 02 03 04 05 06 07 08 09 10 11 12 13 14 15 16 17 18 19 20 21
4.0
0.81.3
-0.5
3.94.4
5.36.4 6.5
4.5
6.2
4.8
3.5 3.52.3
-3.2-3.8
2.0 2.1 1.8
-5.7
3.4
-8.0
-6.0
-4.0
-2.0
0.0
2.0
4.0
6.0
8.0
00 01 02 03 04 05 06 07 08 09 10 11 12 13 14 15 16 17 18 19 20 21
Renda real
4

5.0
3.74.3
5.84.8
2.1
5.8
3.52.9 2.8
1.0
-2.7-2.2
0.81.5 1.3
-5.0
3.5
-6.0
-4.0
-2.0
0.0
2.0
4.0
6.0
8.0
04 05 06 07 08 09 10 11 12 13 14 15 16 17 18 19 20 21
Serviços
2.01.1
4.63.2
5.8
-3.7
6.75.6
-3.1
8.4
2.8 3.3
-5.2
14.2
1.4 1.33.0 3.5
-10.0
-5.0
0.0
5.0
10.0
15.0
20.0
04 05 06 07 08 09 10 11 12 13 14 15 16 17 18 19 20 21
Título
ServicesAgricultural
Source: IBGE, Bradesco
GDPAnnual rate of change, %
8.2
2.0 2.0
6.2
4.1
-4.7
10.2
4.1
-0.7
2.2
-1.5
-5.8-4.6
-0.5
0.5 0.5
-4.5
3.0
-10.0
-5.0
0.0
5.0
10.0
15.0
04 05 06 07 08 09 10 11 12 13 14 15 16 17 18 19 20 21
Renda real
5
Industrial

INDUSTRY, RETAIL AND SERVICESSeasonally adjusted level
Source: IBGE, Bradesco
6
60,0
65,0
70,0
75,0
80,0
85,0
90,0
95,0
100,0
14 15 16 17 18 19 20
Indústria
Varejo
Serviços
Retail
Services
Industry

CONFIDENCE INDEXSeasonally adjusted level
Industrial Services
Retail Construction
Source: FGV, Bradesco
86.1
60
70
80
90
100
110
120
10 11 12 13 14 15 16 17 18 19 20
7
90.1
100.0
45.0
55.0
65.0
75.0
85.0
95.0
105.0
115.0
125.0
05 06 07 08 09 10 11 12 13 14 15 16 17 18 19 20
Índice de Confiança da Indústria - Série com ajuste sazonalFonte: FGV
76,6
50,0
60,0
70,0
80,0
90,0
100,0
110,0
120,0
09 10 11 12 13 14 15 16 17 18 19 20
Título do Gráfico
ICS Neutro
83,7
60
70
80
90
100
110
120
11 12 13 14 15 16 17 18 19 20
indice confianca dessaz

EMPLOYMENT AND INCOME
Unemployment Real Income
Source: IBGE, Bradesco
9.8%9.3%
9.8%
8.8%
8.0%8.5% 8.2%
7.6% 7.3% 7.2%6.8%
8.3%
11.3%
12.8%12.3% 12.1%
13.5% 13.5%
0.0%
2.0%
4.0%
6.0%
8.0%
10.0%
12.0%
14.0%
16.0%
04 05 06 07 08 09 10 11 12 13 14 15 16 17 18 19 20 21
Título do Gráfico
-1.7%
1.1%
4.1%
3.4%3.3%3.4%3.3%2.9%
4.1%
3.3%
2.1%
-0.8%
-2.3%
1.5%1.6%
0.6%
-0.5%
2.0%
-3.0%
-2.0%
-1.0%
0.0%
1.0%
2.0%
3.0%
4.0%
5.0%
04 05 06 07 08 09 10 11 12 13 14 15 16 17 18 19 20 21
Renda real
8

NOMINAL EXCHANGE RATER$/US$
Source: Bloomberg, Bradesco
5.15
3.00
3.20
3.40
3.60
3.80
4.00
4.20
4.40
4.60
4.80
5.00
5.20
5.40
5.60
5.80
6.00
Oct-17 Jan-18 Apr-18 Jul-18 Oct-18 Jan-19 Apr-19 Jul-19 Oct-19 Jan-20 Apr-20 Jul-20
9

BRL vs. EMERGING MARKET CURRENCIESAccumulated BRL fluctuation vs. EMC median and percentiles
Source: Bloomberg, Bradesco
10
4.31
5.15
3.5
4.0
4.5
5.0
5.5
jan/2019 jul/2019 jan/2020 jul/2020
75% 25% 10% Last Copom Median BRL
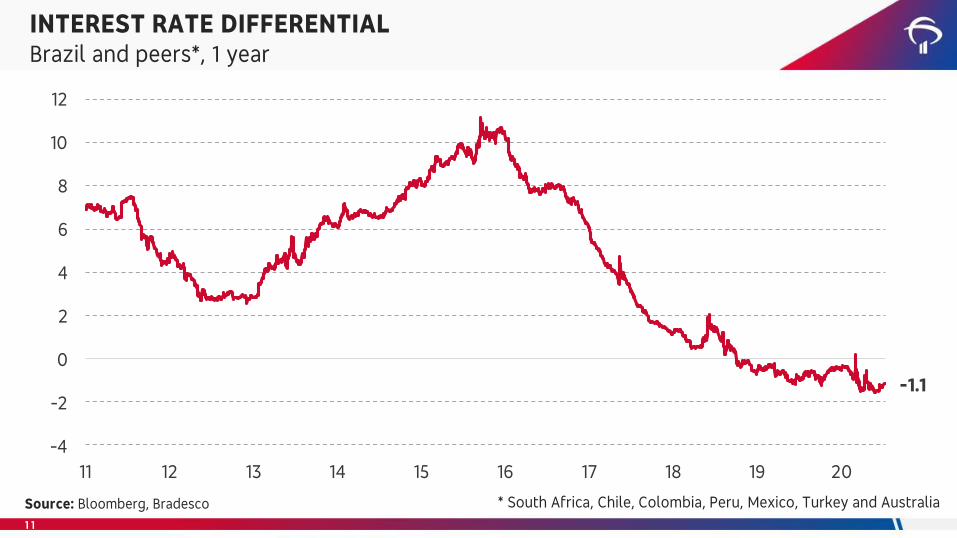
INTEREST RATE DIFFERENTIALBrazil and peers*, 1 year
Source: Bloomberg, Bradesco * South Africa, Chile, Colombia, Peru, Mexico, Turkey and Australia
11
-1.1
-4
-2
0
2
4
6
8
10
12
11 12 13 14 15 16 17 18 19 20
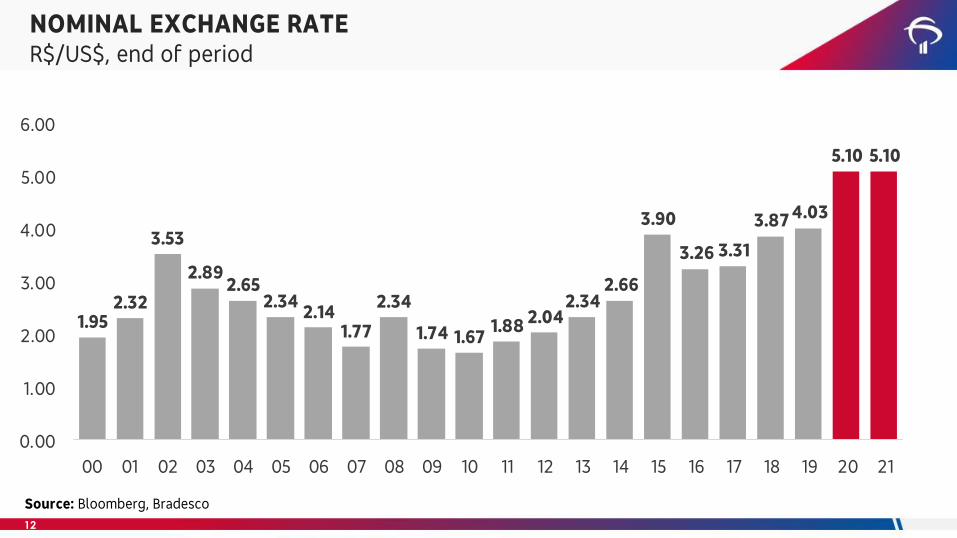
NOMINAL EXCHANGE RATER$/US$, end of period
Source: Bloomberg, Bradesco
1.952.32
3.53
2.892.65
2.342.14
1.77
2.34
1.74 1.671.88 2.04
2.342.66
3.90
3.26 3.31
3.874.03
5.10 5.10
0.00
1.00
2.00
3.00
4.00
5.00
6.00
00 01 02 03 04 05 06 07 08 09 10 11 12 13 14 15 16 17 18 19 20 21
Título do Gráfico
12

Source: IBGE, Bradesco
CONSUMER PRICES INDEX – IPCA Annual rate of change, %
13
7.7%
12.5%
9.3%
7.6%
5.7%
3.1%
4.5%
5.9%
4.3%
5.9%6.5%5.8%5.9%6.4%
10.7%
6.3%
2.96%3.7%
4.3%
1.9%
3.1%
0%
2%
4%
6%
8%
10%
12%
14%
01 02 03 04 05 06 07 08 09 10 11 12 13 14 15 16 17 18 19 20 21

1.07%1.11%
2.12%
0%
1%
2%
3%
4%
5%
6%
7%
8%
9%
10%
06 07 08 09 10 11 12 13 14 15 16 17 18 19 20
3ma
6ma
12m
IPCA – AVERAGE INFLATION CORESCores at historically low levels
Source: IBGE, Bradesco
14

MARKET EXPECTATIONS – IPCAFalling inflation expectations
Source: BCB, Bradesco
1.7
3.1
1.5
2.0
2.5
3.0
3.5
4.0
4.5
jul/18 nov/18 mar/19 jul/19 nov/19 mar/20 jul/20
Título do Gráfico
2020 2021
15
15.75%
19.00%
25.00%
16.50%18.00%
13.25%
11.25%
13.75%
8.75%
10.75%
7.25%
10.00%11.75%
14.25%13.75%
7.00%6.50%
4.50%
2.25%3.00%
0%
5%
10%
15%
20%
25%
30%
00 01 02 03 04 05 06 07 08 09 10 11 12 13 14 15 16 17 18 19 20 21
Título do Gráfico
NOMINAL INTEREST RATE We expect the Selic rate to remain at 2.25% in 2020
Source: BCB, Bradesco
16

2.4% 2.1%2.8%
1.2%
2.8%2.1%
1.6% 1.4%
-0.3%
-1.9%-2.6%
-1.9% -1.8%-1.2%
-11.6%
-2.9%
-14%
-12%
-10%
-8%
-6%
-4%
-2%
0%
2%
4%
2005 2007 2008 2009 2010 2011 2012 2013 2014 2015 2016 2017 2018 2019 2020* 2021*
17
CENTRAL GOVERNMENT PRIMARY BALANCE% of GDP, with new fiscal measures
Source: STN, Bradesco

Source: BCB, Bradesco
GROSS PUBLIC DEBT% of GDP
18
56%59%
52% 51%54% 52%
56%
66%70%
74%77% 76%
96% 97%
0%
10%
20%
30%
40%
50%
60%
70%
80%
90%
100%
2008 2009 2010 2011 2012 2013 2014 2015 2016 2017 2018 2019 2020* 2021*

Source: Bradesco
OUR FORECASTS...
Bradesco economic forecasts are revised at the beginning of each month. During moments of greater volatility, the level of uncertainty and error margins naturally rise, especially between revisions.Our forecasts are based on the assumption that the adjustments necessary to ensure the sustainability of Brazil’s macroeconomic framework will be implemented over the next few years. If theseadjustments do not materialize or are better than expected, the forecast could be altered significantly. Last updated on July 28th, 2020.
19
2017 2018 2019 2020 2021
GDP growth (%) 1.3 1.3 1.1 -4.5 3.5
Consumer inflation - IPCA (%) 2.95 3.75 4.31 1.9 3.1
Wholesale inflation - IGP-M (%) -0.5 7.5 7.3 8.5 4.0
Selic Rate (%, eop) 7.00 6.50 4.50 2.25 3.00
Exchange Rate (BRL/USD, eop) 3.31 3.87 4.03 5.10 5.10
Industrial Production (%) 2.5 1.0 -1.1 -4.5 3.0
Retail Sales (%) 4.0 5.0 3.9 -6.0 4.5
Job Creation (in thousands) 1899 966 1816 -5200 1904
Unemployment Rate (% of labor force, avg) 12.7 12.3 12.1 13.5 13.5
Outstanding Credit Growth (%) -0.4 5.1 6.5 5.0 7.6
Trade Balance (USD bn) 64.0 53.0 39.4 58.0 66.9
Current Account (USD bn) -15.0 -41.5 -50.8 -7.7 -7.8
Primary Balance (BRL bn) -111 -108.3 -61.9 -864 -225
Gross Debt (% of GDP) 74.1 76.5 75.8 96.0 96.7

DEPEC-BRADESCOwww.economiaemdia.com.br
DEPEC - BRADESCO does not accept responsibility for any actions/decisions that may be taken based on the information provided in its publications and
projections. All the data and opinions contained in these information bulletins is carefully checked and drawn up by fully qualified professionals, but it
should not be used, under any hypothesis, as the basis, support, guidance or norm for any document, valuations, judgments or decision taking, whether of
a formal or informal nature. Therefore, we emphasize that all the consequences and responsibility for using any data or analysis contained in this
publication is assumed exclusively by the user, exempting BRADESCO from all responsibility for any actions resulting from the usage of this material. We
all point out that access to this information implies acceptance in full of this term of responsibility and usage.
The reproduction of the content in this report partially or in full is strictly forbidden except if authorized by BRADESCO or if the Sources the name of the
authors, publication and BRADESCO are strictly mentioned.
Updated: July 28th, 2020
20