braskem s.a. - latibex.com2014/braskem ctas 2013.pdf · braskem s.a. we have audited the...
TRANSCRIPT

Braskem S.A. Financial Statements at December 31, 2013 and 2012 and Independent Auditors' Report

Independent auditor’s report
To the Board of Directors and Shareholders
Braskem S.A.
We have audited the accompanying financial statements of Braskem S.A. ("Parent Company"), which
comprise the balance sheet as at December 31, 2013 and the statements of operations and comprehensive
income, changes in equity and cash flows for the year then ended, and a summary of significant
accounting policies and other explanatory information.
We have also audited the accompanying consolidated financial statements of Braskem S.A. and its
subsidiaries ("Consolidated"), which comprise the consolidated balance sheet as at December 31, 2013
and the consolidated statements of operations and comprehensive income, changes in equity and cash
flows for the year then ended, and a summary of significant accounting policies and other explanatory
information.
Management’s responsibility for the financial statements
Management is responsible for the preparation and fair presentation of the parent company financial
statements in accordance with accounting practices adopted in Brazil, and for the consolidated financial
statements in accordance with the International Financial Reporting Standards (IFRS) issued by the
International Accounting Standards Board (IASB) and accounting practices adopted in Brazil, and for
such internal control as management determines is necessary to enable the preparation of financial
statements that are free from material misstatement, whether due to fraud or error.
Auditor’s responsibility
Our responsibility is to express an opinion on these financial statements based on our audit. We
conducted our audit in accordance with Brazilian and International Standards on Auditing. Those
standards require that we comply with ethical requirements and plan and perform the audit to obtain
reasonable assurance about whether the financial statements are free from material misstatement.
An audit involves performing procedures to obtain audit evidence about the amounts and disclosures in
the financial statements. The procedures selected depend on the auditor’s judgment, including the
assessment of the risks of material misstatement of the financial statements, whether due to fraud or
error.
In making those risk assessments, the auditor considers internal control relevant to the entity’s
preparation and fair presentation of the financial statements in order to design audit procedures that are
appropriate in the circumstances, but not for the purpose of expressing an opinion on the effectiveness of
the entity’s internal control. An audit also includes evaluating the appropriateness of accounting policies
used and the reasonableness of accounting estimates made by management, as well as evaluating the
overall presentation of the financial statements.
We believe that the audit evidence we have obtained is sufficient and appropriate to provide a basis for
our audit opinion.

Opinion on the parent company financial statements
In our opinion, the parent company financial statements referred to above present fairly, in all material
respects, the financial position of Braskem S.A. as at December 31, 2013, and its financial performance
and its cash flows for the year then ended, in accordance with accounting practices adopted in Brazil.
Opinion on the consolidated financial statements
In our opinion, the consolidated financial statements referred to above present fairly, in all material
respects, the financial position of Braskem S.A. and its subsidiaries as at December 31, 2013, and their
financial performance and their cash flows for the year then ended, in accordance with the International
Financial Reporting Standards (IFRS) issued by the International Accounting Standards Board (IASB)
and accounting practices adopted in Brazil.
Emphasis of matter
As discussed in note 2 to these financial statements, the parent company financial statements have been
prepared in accordance with accounting practices adopted in Brazil. In the case of Braskem S.A., these
practices differ from IFRS applicable to separate financial statements only in relation to the measurement
of investments in subsidiaries, associates and jointly-controlled entities based on equity accounting, while
IFRS requires measurement based on cost or fair value. Our opinion is not qualified in respect of this
matter.
Other matters
Supplementary information - statements of value added
We also have audited the parent company and consolidated statements of value added for the year ended
December 31, 2013, which are the responsibility of the Company’s management. The presentation of these
statements is required by the Brazilian corporate legislation for listed companies, but they are considered
supplementary information for IFRS. These statements were subject to the same audit procedures
described above and, in our opinion, are fairly presented, in all material respects, in relation to the
financial statements taken as a whole.
Salvador, February 13, 2014
PricewaterhouseCoopers
Auditores Independentes
CRC 2SP000160/O-5 “F” BA
Fábio Cajazeira Mendes
Contador CRC 1SP196825/O-0 “S” BA

Braskem S.A. Balance sheet at December 31 All amounts in thousands of reais
1
The Management notes are an integral part of the financial statements.
Assets Note 2013 2012 2013 2012
2.1.1(a) Revised RevisedCurrent assets
Cash and cash equivalents 6 4,335,859 3,287,622 2,425,078 1,627,928 Financial investments 7 86,719 172,146 86,535 155,535 Trade accounts receivable 8 2,810,520 2,326,480 3,814,830 1,834,491 Inventories 9 5,033,593 4,102,055 2,848,700 2,478,550 Taxes recoverable 11 2,237,213 1,476,211 1,246,858 1,005,842 Dividends and interest on capital 0 150 2,645 78,031 130,145 Prepaid expenses 0 62,997 54,013 19,778 14,153 Related parties 10 124,487 13,912 100,173 13,906 Insurance claims 13 27,691 160,981 21,556 160,981 Other receivables 14 240,218 818,434 148,755 761,450
00 14,959,447 12,414,499 10,790,294 8,182,981 0
Non-current assets held for sale1(b)(xxvi)e 2.1.1(b)
37,681 277,828 - -
00 14,997,128 12,692,327 10,790,294 8,182,981 0
Non-current assets 0Financial investments 7 20,779 34,489 20,774 34,088 Trade accounts receivable 8 61,875 37,742 60,328 35,710 Advances to suppliers 9 116,714 - 116,714 - Taxes recoverable 11 1,285,990 1,527,134 899,751 1,026,391 Deferred income tax and social contribution 22 2,653,606 2,062,009 1,769,683 1,100,611 Judicial deposits 12 209,910 179,618 194,397 164,443 Related parties 10 133,649 127,627 404,668 988,589 Insurance claims 13 139,497 47,255 138,308 45,649 Other receivables 14 278,871 218,279 112,497 153,466 Investments in subsidiaries and jointly-controlled investments 15 115,385 118,787 10,479,371 9,591,644 Other investments 0 6,501 6,948 6,123 6,575 Property, plant and equipment 16 25,413,548 21,176,785 11,650,667 11,794,385 Intangible assets 17 2,912,630 2,940,966 2,225,326 2,241,565
33,348,955 28,477,639 28,078,607 27,183,116
Total assets 48,346,083 41,169,966 38,868,901 35,366,097
Consolidated Parent Company

Braskem S.A. Balance sheet at December 31 All amounts in thousands of reais Continued
2
The Management notes are an integral part of the financial statements.
Liabilities and shareholders' equity Note 2013 2012 2013 20122.1.1(a) Revised Revised
Current liabilitiesTrade payables 10,421,687 8,897,597 8,845,414 6,446,898 Borrowings 18 1,248,804 1,836,028 1,283,046 1,887,811 Project finance 19 25,745 - - - Derivatives operations 20.2 95,123 293,378 20,751 293,378 Payroll and related charges 0 490,816 349,176 320,548 249,275 Taxes payable 21 445,424 342,789 316,408 245,173 Dividends and interest on capital 0 131,799 5,369 129,022 2,160 Advances from customers 26 297,403 237,504 38,274 257,079 Sundry provisions 23 105,856 52,264 60,991 11,930 Post-employment benefits 25 158,137 147,175 158,122 147,175 Accounts payable to related parties 10 - - 127,629 206,991 Other payables 27 174,007 385,577 54,501 29,478
13,594,801 12,546,857 11,354,706 9,777,348
Non-current liabilities held for sale 2.1.1(b) 109,770 - -
13,594,801 12,656,627 11,354,706 9,777,348
Non-current liabilitiesBorrowings 18 17,353,687 15,675,610 11,721,414 10,534,287 Project finance 19 4,705,661 - - - Derivatives operations 20.2 396,040 - 396,040 - Taxes payable 21 902,875 1,164,753 839,531 1,059,225 Accounts payable to related parties 10 - - 5,148,743 3,667,754 Long-term incentives 24 9,274 10,405 9,274 10,405 Deferred income tax and social contribution 22 2,393,698 2,138,622 1,095,410 1,015,743 Post-employment benefits 25 44,054 36,602 - - Provision for losses on subsidiaries and jointly-controlled investments 0 - - 149,213 119,375 Advances from customers 0 152,635 204,989 53,807 80,463 Sundry provisions 23 449,694 363,411 226,007 144,782 Other payables 27 662,330 266,963 281,646 343,652
27,069,948 19,861,355 19,921,085 16,975,686
Shareholders' equity 29Capital 0 8,043,222 8,043,222 8,043,222 8,043,222 Capital reserve 0 232,430 797,979 232,430 797,979 Revenue reserves 0 410,149 - 410,149 - Other comprehensive income 0 (1,092,691) 337,411 (1,092,691) 337,411 Treasury shares 0 (48,892) (48,892) - - Accumulated loss 0 - (565,549) - (565,549)
0Total attributable to the Company's shareholders 0 7,544,218 8,564,171 7,593,110 8,613,063
0Non-controlling interest 2.1.2 137,116 87,813 - -
7,681,334 8,651,984 7,593,110 8,613,063
Total liabilities and shareholders' equity 48,346,083 41,169,966 38,868,901 35,366,097
Consolidated Parent Company

Braskem S.A. Statement of operations Years ended December 31 All amounts in thousands of reais, except earnings (loss) per share
3
The Management notes are an integral part of the financial statements.
Consolidated Parent CompanyNote 2013 2012 2013 2012
2.1.1(b) RevisedContinued operationsNet sales revenue 31 40.969.490 36.160.327 23.542.490 20.634.400
Cost of products sold 0 (35.820.761) (32.709.068) (20.469.552) (18.217.333) 0
Gross profit 0 5.148.729 3.451.259 3.072.938 2.417.067 0
Income (expenses) 0Selling and distribution 0 (1.000.749) (990.365) (597.341) (589.072) General and administrative 0 (1.077.934) (1.071.029) (669.978) (695.828) Research and development 0 (115.812) (106.197) (85.806) (81.653) Results from equity investments 15(c) (3.223) (25.807) 298.241 290.414 Other operating income (expenses), net 33 (211.090) 333.457 122.701 392.159
0Operating profit 0 2.739.921 1.591.318 2.140.755 1.733.087
0Financial results 34
Financial expenses 0 (2.549.111) (3.926.209) (2.098.965) (3.404.722) Financial income 0 773.138 531.928 703.449 364.389
00 (1.775.973) (3.394.281) (1.395.516) (3.040.333) 0
Profit (loss) before income tax and 0 social contribution 0 963.948 (1.802.963) 745.239 (1.307.246)
0Current and deferred income tax and social contribution 22 (456.910) 783.111 (235.542) 576.103
0 (456.910) 783.111 (235.542) 576.103 0
Profit (loss) for the period of continued operations 0 507.038 (1.019.852) 509.697 (731.143) 0
Discontinued operations results 5Profit from discontinued operations 0 - 424.860 Current and deferred income tax and social contribution 0 - (143.313)
0 - 281.547 - - 0
Profit (loss) for the year 0 507.038 (738.305) 509.697 (731.143) 0
Attributable to: 0Company's shareholders 0 509.697 (731.143) Non-controlling interest 2.1.2 (2.659) (7.162)
0Profit (loss) for the year 0 507.038 (738.305)
0

Braskem S.A. Statement of operations Years ended December 31 All amounts in thousands of reais Continued
4
The Management notes are an integral part of the financial statements.
Consolidated Parent CompanyNote 2013 2012 2013 2012
2.1.1(b) Revised
Profit (loss) for the year 507.038 (738.305) 509.697 (731.143)
Other comprehensive income or loss:Items that may be reclassified subsequently to profit or loss:
Fair value of cash flow hedge (127.520) 16.238 (118.000) 16.238 Income tax and social contribution 40.120 (5.522) 40.120 (5.522)
(87.400) 10.716 (77.880) 10.716
Fair value of cash flow hedge of foreign subsidiaries - - (7.140) -
Exchange variation of foreign sales hedge 20.2.1(b.iii) (2.303.540) - (2.303.540) - Income tax and social contribution 783.204 - 783.204 -
(1.520.336) - (1.520.336) -
Foreign currency translation adjustment 221.270 78.780 205.249 61.662
Total (1.386.466) 89.496 (1.400.107) 72.378
Items that will not be reclassified to profit or loss:Defined benefit plan actuarial (loss) gain 169 (18.204) 169 (18.204) Income tax and social contribution - 6.388 - 6.388
Total 169 (11.816) 169 (11.816)
Total other comprehensive income (loss) (1.386.297) 77.680 (1.399.938) 60.562
Total comprehensive income (loss) for the year (879.259) (660.625) (890.241) (670.581)
Attributable to:Company's shareholders - continued operations (890.241) (952.128) Company's shareholders - discontinued operations - 281.547 Non-controlling interest 10.982 9.956
Total comprehensive income (loss) for the year (879.259) (660.625)
Parent Company2013 2012
Note Basic and diluted Basic Diluted2.1.1(b) Revised Revised
Profit (loss) per share attributable to the shareholders of the Company 0of continued operations at the end of the year (R$) 30 0
Earnings per share - common 0,6403 (1,2718) (1,2713) Earnings per share - preferred shares class "A" 0,6403 (1,2718) (1,2713) Earnings per share - preferred shares class "B" 0,6062 - -
0 0 - Profit (loss) per share attributable to the shareholders of the Company 0 0 -
of discontinued operations at the end of the year (R$) 5 0 0 - Earnings per share - common 0 0,3536 0,3534 Earnings per share - preferred shares class "A" 0 1,2718 1,2713
0 0 - Profit (loss) per share attributable to the shareholders of the Company 0 0 -
at the end of the year (R$) 0 0 - Earnings per share - common 0,6403 (0,9182) (0,9179) Earnings per share - preferred shares class "A" 0,6403 (0,9182) (0,9179) Earnings per share - preferred shares class "B" 0,6062 - -

Braskem S.A. Statement of changes in equity All amounts in thousands of reais
5
The Management notes are an integral part of the financial statements.
Consolidated
TotalUnrealized Additional Other Braskem Total
Capital Legal Tax profit Returns dividends comprehensive Treasury Accumulated shareholders' Non-controlling shareholders'Note Capital reserve reserve incentives reserve Earnings proposed income shares loss interest interest equity
At December 31, 2011 0 8,043,222 845,998 87,710 4,547 16,457 - 482,593 315,586 (60,217) 28,692 9,764,588 215,322 9,979,910 0
Comprehensive income for the period: 0Loss for the period 0 - - - - - - - - - (731,143) (731,143) (7,162) (738,305) Fair value of cash flow hedge, net of taxes 0 - - - - - - - 10,716 - - 10,716 - 10,716 Foreign currency translation adjustment 0 - - - - - - - 61,662 - - 61,662 17,118 78,780
0 - - - - - - - 72,378 - (731,143) (658,765) 9,956 (648,809) 0
Equity valuation adjustments: 0 - Realization of deemed cost of jointly-controlled investment, net of taxes 0 - - - - - - - (952) - 952 - - - Realization of additional property, plant and equipment price-level restatement, net of taxes 0 - - - - - - - (27,236) - 27,236 - - - Actuarial loss with post-employment benefits, net of taxes 0 - - - - - - - (11,816) - - (11,816) - (11,816)
0 - - - - - - - (40,004) - 28,188 (11,816) - (11,816) 0
Contributions and distributions to shareholders: 0Additional dividends approved at Shareholders’ Meeting 0 - - - - - - (482,593) - - - (482,593) - (482,593) Capital loss from non-controlling interest 0 - - - - - - - - - - - (17,962) (17,962) Write-off non-controlling by investments sale 0 - - - - - - - - - - - (125,420) (125,420) Loss on interest in subsidiary 0 - - - - - - - (5,917) - - (5,917) 5,917 - Write-off gain on interest in subsidiary by sale 0 - - - - - - - (4,632) - - (4,632) - (4,632) Repurchase of treasury shares 0 - - - - - - - - (36,694) - (36,694) - (36,694) Cancellation of shares 0 - (48,019) - - - - - - 48,019 - - - - Absorption of losses 0 - - (87,710) (4,547) (16,457) - - - - 108,714 - - -
0 - (48,019) (87,710) (4,547) (16,457) - (482,593) (10,549) 11,325 108,714 (529,836) (137,465) (667,301) 0
At December 31, 2012 (Revised) 2.1.1(a) 8,043,222 797,979 - - - - - 337,411 (48,892) (565,549) 8,564,171 87,813 8,651,984 0
Comprehensive income for the period: 0Profit for the period 0 - - - - - - - - - 509,697 509,697 (2,659) 507,038 Exchange variation of foreign sales hedge, net of taxes 0 - - - - - - - (1,520,336) - - (1,520,336) - (1,520,336) Fair value of cash flow hedge, net of taxes 0 - - - - - - - (85,020) - - (85,020) (2,380) (87,400) Foreign currency translation adjustment 0 - - - - - - - 205,249 - - 205,249 16,021 221,270
0 (1,400,107) - 509,697 (890,410) 10,982 (879,428) 0
Equity valuation adjustments: 0Realization of deemed cost of jointly-controlled investment, net of taxes 0 - - - - - - - (27,236) - 27,236 - - - Realization of additional property, plant and equipment price-level restatement, net of taxes 0 - - - - - - - (967) - 967 - - - Actuarial loss with post-employment benefits, net of taxes 0 - - - - - - - 169 - - 169 - 169
0 (28,034) - 28,203 169 - 169 0
Contributions and distributions to shareholders: 0Absorption of losses 29 - (565,549) - - - - - - - 565,549 - - - Capital increase from non-controlling interest 0 - - - - - - - - - - - 38,321 38,321 Loss on interest in subsidiary 0 - - - - - - - (1,961) - - (1,961) - (1,961) Legal reserve 0 - - 26,895 - - - - - - (26,895) - - - Mandatory minimum dividends 0 - - - - - - - - - (127,751) (127,751) - (127,751) Additional dividends proposed 0 - - - - - - 354,842 - - (354,842) - - - Returns Earnings 0 - - - - - 28,412 - - - (28,412) - - -
0 - (565,549) 26,895 - - 28,412 354,842 (1,961) - 27,649 (129,712) 38,321 (91,391) 0
At December 31, 2013 0 8,043,222 232,430 26,895 - - 28,412 354,842 (1,092,691) (48,892) - 7,544,218 137,116 7,681,334
Attributed to shareholders' interestRevenue reserves

Braskem S.A. Statement of changes in equity All amounts in thousands of reais
6
1 The Management notes are an integral part of the financial statements.
Parent CompanyTotal
Unrealized Additional Other BraskemCapital Legal Tax profit Returns dividends comprehensive Treasury Accumulated shareholders'
Note Capital reserve reserve incentives reserve Earnings proposed income shares loss interest
At December 31, 2011 0 8,043,222 845,998 87,710 4,547 16,457 - 482,593 315,586 (11,325) 28,692 9,813,480
Comprehensive income for the period: - Loss for the period 0 - - - - - - - - - (731,143) (731,143) Fair value of cash flow hedge, net of taxes 0 - - - - - - - 10,716 - - 10,716 Foreign currency translation adjustment 0 - - - - - - - 61,662 - - 61,662
- - - - - - - 72,378 - (731,143) (658,765)
Equity valuation adjustments:Realization of deemed cost of jointly-controlled investment, net of taxes 0 - - - - - - - (952) - 952 - Realization of additional property, plant and equipment price-level restatement, net of taxes 0 - - - - - - - (27,236) - 27,236 - Actuarial loss with post-employment benefits, net of taxes 0 - - - - - - - (11,816) - - (11,816)
- - - - - - - (40,004) - 28,188 (11,816)
Contributions and distributions to shareholders:Additional dividends approved at Shareholders’ Meeting 0 - - - - - - (482,593) - - - (482,593) Capital loss from non-controlling interest 0 - - - - - - - (5,917) - - (5,917) Write-off non-controlling by investments sale 0 - - - - - - - (4,632) - - (4,632) Repurchase of treasury shares 0 - - - - - - - - (36,694) - (36,694) Cancellation of shares 0 - (48,019) - - - - - - 48,019 - - Absorption of losses 0 - - (87,710) (4,547) (16,457) - - - - 108,714 -
- (48,019) (87,710) (4,547) (16,457) - (482,593) (10,549) 11,325 108,714 (529,836)
At December 31, 2012 (Revised) 2.1.1(a) 8,043,222 797,979 - - - - - 337,411 - (565,549) 8,613,063
Comprehensive income for the period: - Profit for the period 0 - - - - - - - - - 509,697 509,697 Exchange variation of foreign sales hedge, net of taxes 0 - - - - - - - (1,520,336) - - (1,520,336) Fair value of cash flow hedge, net of taxes 0 - - - - - - - (85,020) - - (85,020) Foreign currency translation adjustment 0 - - - - - - - 205,249 - - 205,249
- - - - - - - (1,400,107) - 509,697 (890,410)
Equity valuation adjustments:Realization of deemed cost of jointly-controlled investment, net of taxes 0 - - - - - - - (967) - 967 - Realization of additional property, plant and equipment price-level restatement, net of taxes 0 - - - - - - - (27,236) - 27,236 - Actuarial loss with post-employment benefits, net of taxes 0 - - - - - - - 169 - - 169
- - - - - - - (28,034) - 28,203 169
Contributions and distributions to shareholders:Absorption of losses 29 - (565,549) - - - - - - - 565,549 - Capital increase from non-controlling interest 0 - - - - - - - (1,961) - - (1,961) Legal reserve 0 - - 26,895 - - - - - - (26,895) - Mandatory minimum dividends 0 - - - - - - - - - (127,751) (127,751) Additional dividends proposed 0 - - - - - - 354,842 - - (354,842) - Returns Earnings 0 - - - - - 28,412 - - - (28,412) -
- (565,549) 26,895 - - 28,412 354,842 (1,961) - 27,649 (129,712)
At December 31, 2013 8,043,222 232,430 26,895 - - 28,412 354,842 (1,092,691) - - 7,593,110
Revenue reserves

Braskem S.A. Statement of cash flows Years ended December 31 All amounts in thousands of reais
7
The Management notes are an integral part of the financial statements.
Note 2013 2012 2013 20122.1.1(b) Revised
Profit (loss) before income tax and social contribution and after of discontinued operations results 963,948 (1,378,103) 745,239 (1,307,246)
Adjustments for reconciliation of profit (loss)Depreciation, amortization and depletion 2,056,088 1,924,265 1,302,531 1,193,976 Results from equity investments 15(c) 3,223 25,807 (298,241) (290,414) Interest and monetary and exchange variations, net 1,341,770 2,442,973 1,253,324 2,000,307 Other 9,175 294,199 4,298 240,675
4,374,204 3,309,141 3,007,151 1,837,298
Changes in operating working capital Held-for-trading financial investments 97,693 16,716 69,982 16,216 Trade accounts receivable (492,851) (625,130) (2,092,346) (681,681) Inventories (927,435) (566,025) (431,948) (495,689) Taxes recoverable (448,378) (458,763) (68,650) (302,375) Prepaid expenses (8,915) 49,707 (5,626) 45,956 Other receivables (27,019) (529,103) 140,710 (710,879) Trade payables 742,649 2,165,530 1,718,970 1,394,075 Taxes payable (127,443) (430,789) (262,176) (324,774) Long-term incentives (1,131) (4,808) (1,132) (4,808) Advances from customers 6,344 206,044 (299,268) 245,761 Sundry provisions 139,858 94,382 87,934 52,522 Other payables 308,734 389,032 226,212 326,513
Cash from operations 3,636,310 3,615,934 2,089,813 1,398,135
Interest paid (1,123,691) (1,006,840) (630,918) (583,738) Income tax and social contribution paid (54,828) (37,283) (33,569) (35,403)
Net cash generated by operating activities 2,457,791 2,571,811 1,425,326 778,994
Proceeds from the sale of fixed assets 2,576 115,846 - - Proceeds from the sale of investments 689,868 - 689,868 - Cash effect from incorporated (discontinued) subsidiary 9,985 (141,348) - 394 Acquisitions of investments in subsidiaries and associates (86) - (414,464) (84,282) Acquisitions to property, plant and equipment (5,656,440) (2,792,853) (1,145,447) (1,375,908) Acquisitions of intangible assets (25,748) (15,734) (24,782) (13,384) Held-for-maturity and available for sale financial investments 25,645 (218) 38,211 19,453
Net cash used in investing activities (4,954,200) (2,834,307) (856,614) (1,453,727)
Short-term and long-term debtObtained borrowings 6,317,022 6,665,938 5,161,555 4,058,052 Payment of borrowings (7,300,718) (5,493,015) (6,070,448) (4,760,048)
Project finance 19Obtained funds 4,562,343 - - -
Related partiesObtained loans - - 1,373,541 1,823,138 Payment of loans - - (253,248) (366,861) Net current transactions - - 17,072 (157,210)
Dividends paid (35) (482,051) (34) (482,051) Non-controlling interests in subsidiaries 35,628 (20,295) - - Repurchase of treasury shares - (36,694) - (36,694)
Net cash provided by financing activities 3,614,240 633,883 228,438 78,326
Exchange variation on cash of foreign subsidiaries (69,594) (36,037) - -
Increase in cash and cash equivalents 1,048,237 335,350 797,150 (596,407)
Represented byCash and cash equivalents at the beginning for the period 3,287,622 2,952,272 1,627,928 2,224,335 Cash and cash equivalents at the end for the period 4,335,859 3,287,622 2,425,078 1,627,928
Increase in cash and cash equivalents 1,048,237 335,350 797,150 (596,407)
Consolidated Parent Company

Braskem S.A. Statement of value added Years ended December 31 All amounts in thousands of reais
8
• The statement of value added is not a required part of a set of financial statements under the standards issued by the International Accounting Standards Board (“IASB”).
The Management notes are an integral part of the financial statements.
Continued and discontinued operations Note 2013 2012 2013 20122.1.1(b) Revised
Revenue 47,209,844 43,376,748 27,817,793 25,248,033 Sale of goods, products and services, including discontinued operations 47,384,014 42,647,728 27,658,207 24,868,066 Other income (expenses), net (146,837) 779,083 178,263 410,617 Allowance for doubtful accounts (27,333) (50,063) (18,677) (30,650)
Inputs acquired from third parties (39,860,100) (37,141,063) (23,356,597) (21,144,265) Cost of products, goods and services sold (38,455,954) (35,782,490) (22,465,636) (20,324,249) Material, energy, outsourced services and others (1,405,722) (1,353,377) (890,744) (820,111) Impairment of assets 1,576 (5,196) (217) 95
Gross value added 7,349,744 6,235,685 4,461,196 4,103,768
Depreciation, amortization and depletion (2,056,088) (1,933,776) (1,302,531) (1,193,976)
Net value added produced by the entity 5,293,656 4,301,909 3,158,665 2,909,792
Value added received in transfer 770,744 519,926 1,002,029 655,020 Results from equity investments (3,223) (14,179) 298,241 290,414 Financial income 773,138 532,012 703,449 364,389 Other 829 2,093 339 217
Total value added to distribute 6,064,400 4,821,835 4,160,694 3,564,812
Personnel 860,593 807,804 514,818 505,687 Direct compensation 663,251 608,193 398,369 378,082 Benefits 146,004 150,947 77,422 91,665 FGTS (Government Severance Pay Fund) 51,338 48,664 39,027 35,940
Taxes, fees and contributions 1,984,334 653,659 925,046 254,347 Federal 1,076,431 (174,029) 348,495 (440,584) State 891,151 805,363 571,631 687,777 Municipal 16,752 22,325 4,920 7,154
Remuneration on third parties' capital 2,712,435 4,098,677 2,211,133 3,535,921 Financial expenses (including exchange variation) 2,524,737 3,908,924 2,081,922 3,391,552 Rentals 187,698 189,753 129,211 144,369
Remuneration on own capital 507,038 (738,305) 509,697 (731,143) Profit (loss) for the year 509,697 (1,012,690) 509,697 (731,143) Non-controlling interests in profit (loss) for the period (2,659) (7,162) - - Profit from discontinued operations - 281,547 - -
Value added distributed 6,064,400 4,821,835 4,160,694 3,564,812
Consolidated Parent Company

Braskem S.A. Notas explicativas da Administração às demonstrações financeiras em 31 de dezembro de 2013 Valores expressos em milhares de reais, exceto quando indicado de outra forma
9
1 Operations
Braskem S.A. (hereinafter “Parent Company”) is a public corporation headquartered in Camaçari, Bahia (“BA”), which jointly with its subsidiaries (hereinafter “Braskem” or “Company”), operates 36 industrial units, 29 of which in the Brazilian states of Alagoas (“AL”), BA, Rio de Janeiro (“RJ”), Rio Grande do Sul (“RS”) and São Paulo (“SP”), 5 are located in the United States, in the states of Pennsylvania, Texas and West Virginia and 2 are located in Germany. These units produce thermoplastic resins – polyethylene (“PE”), polypropylene (“PP”) and polyvinyl chloride (“PVC”), as well as basic petrochemicals - such as ethylene, propylene butadiene, toluene, xylene and benzene, as well as gasoline, diesel and LPG (Liquefied Petroleum Gas), and other petroleum derivatives. Additionally, Braskem is also engaged in the import and export of chemicals, petrochemicals and fuels, the production, supply and sale of utilities such as steam, water, compressed air, industrial gases, as well as the provision of industrial services and the production, supply and sale of electric energy for its own use and use by other companies. Braskem also invests in other companies, either as a partner or as shareholder. The Company is controlled by Odebrecht S.A. (“Odebrecht”), which directly and indirectly holds interests of 50.11% and 38.32% in its voting and total capital, respectively. The issue of these financial statements was authorized by the Company’s Board of Directors on February 12, 2014.
(a) Significant operating events
(i) In 2012, Sunoco Chemicals, Inc. (“Sunoco”) formally informed the Management of Braskem America, Inc. (“Braskem America”) of its alternative plan to supply feedstock to the PP plant in Pennsylvania, after having announced in December 2011 the definitive shutdown of operations of its refinery. The definitive termination of the supply agreement occurred on June 8, 2012, upon payment of the respective compensation set forth in the contract, in the amount of R$235,962 (Note 33). Despite the termination of the supply agreement, operations at the unit were maintained through other propylene supply sources. Another important and fundamental step in maintaining the operations at the plant was the acquisition of a propylene splitter unit from Sunoco on June 29, 2012. This unit transforms refinery-grade propylene into polymer-grade propylene. With the acquisition, Braskem America expanded its supply sources, since the supply of refinery-grade propylene is more abundant in the U.S. market. This acquisition does not represent a business combination, since it does not meet the definitions required by IFRS 3 and its corresponding pronouncement issued by the Committee of Accounting Pronouncements (“CPC”) (CPC 15 (R1)).
(ii) On August 17, 2012, the Company inaugurated, in Marechal Deodoro, Alagoas, a new plant with annual production capacity of 200 kton of PVC*, which expanded Braskem’s total installed capacity to 710 kton*. Total investment in the plant was approximately R$1 billion.
(iii) On September 13, 2012, the Company inaugurated, in the Triunfo Petrochemical Complex in the state of RS, a
new plant with annual production capacity of 103 kton of butadiene*, which expanded Braskem’s total installed capacity to 477 kton*. Total investment was approximately R$300 million.

Braskem S.A. Notas explicativas da Administração às demonstrações financeiras em 31 de dezembro de 2013 Valores expressos em milhares de reais, exceto quando indicado de outra forma
10
(b) Corporate events
(i) On January 27, 2012, the controlling shareholder of Braskem, at the time, BRK Investimentos Petroquímicos S.A. (“BRK”) was proportionally spun-off. In the spin–off, a part of the shares issued by Braskem that were held by BRK was delivered to Petróleo Brasileiro S.A. – Petrobras (“Petrobras”). With the spin-off, BRK became a wholly-owned subsidiary of Odebrecht Serviços e Participações (“OSP”) and maintained ownership of shares corresponding to 50.11% and 28.23% of the voting and total capital of Braskem, respectively. On the same date, the merger of Petrobras Química S.A. – Petroquisa (“Petroquisa”) into Petrobras was approved and Petrobras became the holder of 47.03% and 35.95% of the voting and total capital of Braskem, respectively.
(ii) On February 27, 2012, the company Braskem International GmbH (“Braskem Áustria”) was incorporated with the purpose of holding equity interests in other companies, and conducting financial and commercial operations. The capital stock was fully paid up by the Parent Company, a sole partner, in the amount of R$81 (EUR$35 thousand).
(iii) On February 28, 2012, the Extraordinary Shareholders’ Meeting (“ESM”) of the Parent Company approved the
merger of the subsidiary Ideom Tecnologia Ltda. (“Ideom”), based on its net book value as of December 31, 2011, in the amount of R$20,762, pursuant to the terms and conditions set forth in the protocol and justification dated February 6, 2012.
(iv) On April 30, 2012, the capital stock of the subsidiaries Braskem Petroquímica S.A. (“Braskem Petroquímica”)
and Rio Polímeros S.A. (“Riopol”) was increased in the amounts of R$649,639 and R$738,799, respectively, without the issue of new shares. The increases occurred through utilization of the balances recorded under advance for future capital increase.
(v) On June 27, 2012, Braskem Áustria incorporated Braskem Petroquímica Ibérica, S.L. (“Braskem Espanha”),
which has capital of R$8 (EUR$3 thousand). The purpose of this subsidiary is to hold equity interests in other companies.
(vi) On June 30, 2012, BRK was merged into its parent company OSP, which changed its interest to 50.11% and
38.11% of the voting and total capital of the Parent Company, respectively, held directly and indirectly.
(vii) On August 27, 2012, Braskem Áustria incorporated Braskem Áustria Finance GmbH (“Braskem Áustria Finance”), which has paid up capital of R$47 (EUR$18 thousand). The subsidiary’s purpose is to raise funds in international financial markets.
(viii) On September 3, 2012, a capital increase at the subsidiary Braskem Distribuidora Ltda. (“Braskem Distribuidora”) was approved, with the transfer of the facilities comprising the Water Treatment Unit (WTU) of the Basic Petrochemicals Unit at the Camaçari Petrochemical Complex (BA), in the amount of R$75,024, which corresponds to the residual book value of the assets in this unit, along with the change in the type of company to a corporation operating under the new corporate name of Braskem Distribuidora S.A.
(ix) On November 5, 2012, in an ESM, approval was given for the increase in the capital stock of the subsidiary
Braskem Idesa S.A.P.I. (“Braskem Idesa”), in the amount of R$41,573 (MXN$266.666 thousand), through the issue of 86,052 Class “A” shares, which was fully paid in by the Parent Company. Subsequently, part of the capital was returned to the non-controlling shareholder, which resulted in an increase in the interest held by the Parent Company in the capital stock of Braskem Idesa, from 65% to 75%.

Braskem S.A. Notas explicativas da Administração às demonstrações financeiras em 31 de dezembro de 2013 Valores expressos em milhares de reais, exceto quando indicado de outra forma
11
(x) On November 9, 2012, the ESM approved the change in the company name of Braskem Distribuidora to Distribuidora de Águas Camaçari S.A. (“Braskem Distribuidora”).
(xi) On December 11, 2012, through a series of corporate decisions, the subsidiary Braskem America became a wholly owned subsidiary of Braskem Europe GmbH (“Braskem Alemanha”).
(xii) On December 17, 2012, the ESM approved the change in the type of company of Braskem Petroquímica S.A. to a limited liability company, with the new corporate name Braskem Petroquímica Ltda. (“Braskem Petroquímica”).
(xiii) On December 28, 2012, the Parent Company and Braskem Participações S.A. (“Braskem Participações”) entered into a private instrument for the purchase and sale of shares through which it sold all shares of the subsidiary Braskem Distribuidora (Note 5).
(xiv) On December 28, 2012, the Parent Company entered into a private instrument for the purchase and sale of
shares through which it sold its interest in the subsidiary Cetrel S.A. (“Cetrel”) (Note 5).
(xv) Braskem and Petroquímica de Venezuela S.A. (“Pequiven”) decided to concentrate their estimated investments in Venezuela in the jointly-controlled investment Polipropileno Del Sur (“Propilsur”). As a result of this decision, the shareholders meeting held in 2012 decided to withdraw the interest held by Braskem in the jointly-controlled investment Polietilenos de America (“Polimerica”).
(xvi) On January 24, 2013, Braskem Participações acquired from Braskem Chile Ltda. (“Braskem Chile”), 215,552 common shares issued by Braskem Argentina S.A. (“Braskem Argentina”) for CLP$21,667 thousand.
(xvii) On May 15, 2013, the ESM approved the increase in the capital stock of the subsidiary Braskem Idesa, without
the issue of new shares, in the amount of R$141,620 (MXN$850,061 thousand), through capital injection of R$106,214 (MXN$637,546 thousand) by the Parent Company and R$35,406 (MXN$212,515 thousand) by the non-controlling shareholder.
(xviii) On July 1, 2013, the Parent Company acquired 2 thousand common shares of Odebrecht Comercializadora de Energia S.A. (“OCE”), equivalent to 20% of the capital of that company, whose main corporate purpose is to buy and sell energy in the spot market. Due to the provisions in the shareholders' agreement, OCE was classified as a jointly-controlled investment.
(xix) On August 30, 2013, the ESM approved the merger of Riopol with Braskem Qpar S.A. (“Braskem Qpar”) and the increase in its capital from R$4,252,353 to R$7,131,165, through the issue of 293,604,915 common shares.
(xx) On September 19, 2013, the parent company and Braskem Austria acquired the shares issued by Braskem
Mexico and held by Braskem Participações and Braskem Importação e Exportação Ltda. (“Braskem Importação”) for R$1,803 and R$1, respectively.
(xxi) On November 1, 2013, approval was given to increase the capital of the subsidiary Distribuidora de Águas
Triunfo S.A. (“DAT”) through the transfer of assets of the WTU at the Basic Petrochemicals Unit in the Triunfo Petrochemical Complex in RS, amounting to R$37,561. On December 27, 2013, approval was given to a capital increase of R$151 through the transfer of assets, after which the capital increased to R$37,717.
Braskem S.A. Notas explicativas da Administração às demonstrações financeiras em 31 de dezembro de 2013 Valores expressos em milhares de reais, exceto quando indicado de outra forma
12
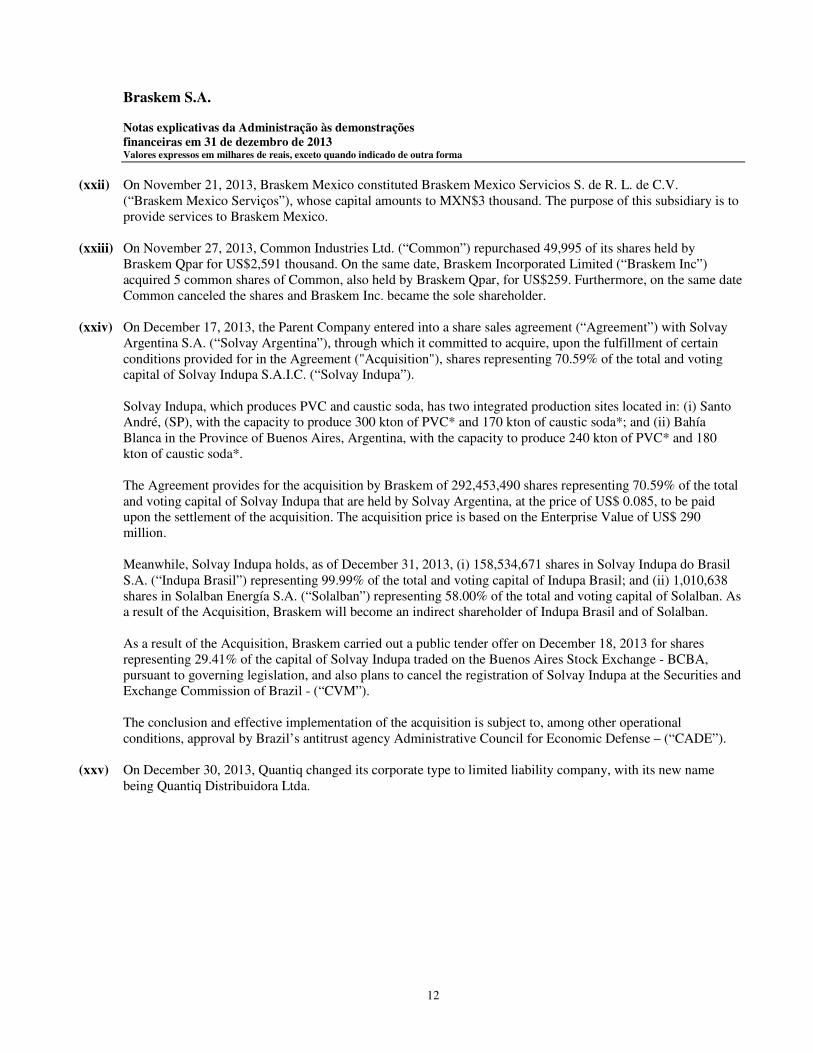
(xxii) On November 21, 2013, Braskem Mexico constituted Braskem Mexico Servicios S. de R. L. de C.V. (“Braskem Mexico Serviços”), whose capital amounts to MXN$3 thousand. The purpose of this subsidiary is to provide services to Braskem Mexico.
(xxiii) On November 27, 2013, Common Industries Ltd. (“Common”) repurchased 49,995 of its shares held by Braskem Qpar for US$2,591 thousand. On the same date, Braskem Incorporated Limited (“Braskem Inc”) acquired 5 common shares of Common, also held by Braskem Qpar, for US$259. Furthermore, on the same date Common canceled the shares and Braskem Inc. became the sole shareholder.
(xxiv) On December 17, 2013, the Parent Company entered into a share sales agreement (“Agreement”) with Solvay
Argentina S.A. (“Solvay Argentina”), through which it committed to acquire, upon the fulfillment of certain conditions provided for in the Agreement ("Acquisition"), shares representing 70.59% of the total and voting capital of Solvay Indupa S.A.I.C. (“Solvay Indupa”).
Solvay Indupa, which produces PVC and caustic soda, has two integrated production sites located in: (i) Santo André, (SP), with the capacity to produce 300 kton of PVC* and 170 kton of caustic soda*; and (ii) Bahía Blanca in the Province of Buenos Aires, Argentina, with the capacity to produce 240 kton of PVC* and 180 kton of caustic soda*. The Agreement provides for the acquisition by Braskem of 292,453,490 shares representing 70.59% of the total and voting capital of Solvay Indupa that are held by Solvay Argentina, at the price of US$ 0.085, to be paid upon the settlement of the acquisition. The acquisition price is based on the Enterprise Value of US$ 290 million. Meanwhile, Solvay Indupa holds, as of December 31, 2013, (i) 158,534,671 shares in Solvay Indupa do Brasil S.A. (“Indupa Brasil”) representing 99.99% of the total and voting capital of Indupa Brasil; and (ii) 1,010,638 shares in Solalban Energía S.A. (“Solalban”) representing 58.00% of the total and voting capital of Solalban. As a result of the Acquisition, Braskem will become an indirect shareholder of Indupa Brasil and of Solalban. As a result of the Acquisition, Braskem carried out a public tender offer on December 18, 2013 for shares representing 29.41% of the capital of Solvay Indupa traded on the Buenos Aires Stock Exchange - BCBA, pursuant to governing legislation, and also plans to cancel the registration of Solvay Indupa at the Securities and Exchange Commission of Brazil - (“CVM”). The conclusion and effective implementation of the acquisition is subject to, among other operational conditions, approval by Brazil’s antitrust agency Administrative Council for Economic Defense – (“CADE”).
(xxv) On December 30, 2013, Quantiq changed its corporate type to limited liability company, with its new name being Quantiq Distribuidora Ltda.

Braskem S.A. Notas explicativas da Administração às demonstrações financeiras em 31 de dezembro de 2013 Valores expressos em milhares de reais, exceto quando indicado de outra forma
13
(xxvi) On December 31, 2013, the parent company entered into a share sales agreement with Odebrecht Ambiental (“OA”), through which it sold its interest in the subsidiary DAT for R$315 million, to be received during 2014. The investments in DAT are shown in the balance sheet as “non – current assets held for sale”. DAT did not register results or hold liabilities in the year ended on December 31, 2013, and held only fixed assets. The change of administration with the consequent transfer of management of the DAT operations will only occur in 2014. * Unaudited
(c) Net working capital
On December 31, 2013, net working capital at the Parent Company was negative R$564,412 (negative R$1,594,367 in 2012). On the other hand, consolidated net working capital was positive R$1,402,327 (2012 – R$35,700). The consolidated figures are used in the management of working capital, since the Company uses mechanisms to transfer funds between the companies efficiently without jeopardizing the fulfillment of the commitments of each of the entities forming the consolidated statements. For this reasons, any analysis of the Parent Company’s working capital will not reflect the actual liquidity position of the consolidated group. Braskem also has three revolving credit lines that may be used at any time (Note 4.3).
(d) Effect of foreign exchange variation The Company is exposed to foreign exchange variation on the balances and transactions made in currencies other than its functional currencies, particularly in U.S. dollar, such as financial investments, trade accounts receivable, trade payables, borrowings and sales. In addition to the exchange effect of the U.S. dollar in relation to the Brazilian real, Braskem is exposed to the U.S. dollar through its subsidiaries abroad, particularly in Euros and Mexican peso. The balances of assets and liabilities are translated based on the exchange rate at the end of each period, while transactions are based on the effective exchange rate on the date of each operation. The following table shows the U.S. dollar average and end-of-period exchange rates for the fiscal years in this report:
Effect of foreign exchange variation
End of period rate
U.S. dollar - Brazilian real, 2013 2.3426 U.S. dollar - Mexican peso, 2013 13.1005 U.S. dollar - euro, 2013 0.7261U.S. dollar - Brazilian real, 2012 2.0435 U.S. dollar - Mexican peso, 2012 13.0327 U.S. dollar - euro, 2012 0.7582Appreciation of the U.S. dollar in relation to the Brazilian real 14.64% Appreciation of the U.S. dollar in relation to the Mexican peso 0.52% Devaluation of the U.S. dollar in relation to the euro -4.23%
Average rate
U.S. dollar - Brazilian real, 2013 2.3455 U.S. dollar - Mexican peso, 2013 13.0088 U.S. dollar - euro, 2013 0.7296U.S. dollar - Brazilian real, 2012 2.0778 U.S. dollar - Mexican peso, 2012 12.8647 U.S. dollar - euro, 2012 0.7619Appreciation of the U.S. dollar in relation to the Brazilian real 12.88% Appreciation of the U.S. dollar in relation to the Mexican peso 1.12% Devaluation of the U.S. dollar in relation to the euro -4.24%

Braskem S.A. Notas explicativas da Administração às demonstrações financeiras em 31 de dezembro de 2013 Valores expressos em milhares de reais, exceto quando indicado de outra forma
14
2 Summary of significant accounting policies The principal accounting policies applied in the preparation of these financial statements are described below. These policies have been consistently applied to the years presented, with the exception of the cases mentioned in Note 2.1.1.
2.1 Basis of preparation and presentation of the financial statements The financial statements have been prepared under the historical cost convention and were adjusted, when necessary, to reflect the fair value of assets and liabilities. The preparation of financial statements requires the use of certain critical accounting estimates. It also requires Management to exercise its judgment in the process of applying the Company’s accounting policies. The areas involving a higher degree of judgment or complexity, or areas where assumptions and estimates are significant to the consolidated financial statements are disclosed in Note 3.
2.1.1 Revised The financial statements of 2012 was retrospectively revised to reflect (a) the effects of the retroactive application of CPC 33 (R1) and IAS 19. The income statements for 2012 was also retrospectively revised to reclassify (b) the results from discontinued operations to continuing operations of IQ Soluções & Química S.A. (“Quantiq”) and IQAG Armazéns Gerais Ltda. (“IQAG”) resulting from the Company’s decision to not sell assets previously held for sale. In additional, the Company revised the “Other comprehensive income or loss” at the statement of operations separating the items between “Items that will be reclassified subsequently to profit or loss” and “ Items that will not be reclassified to profit and loss”.
(a) Post-employment benefits plans Until 2012, actuarial gains and losses arising from actuarial remeasurement were not recognized if they were lower than 10% (a) of the present value of the defined benefit obligation; and (b) of the fair value of any assets of the plan. The accounting practice adopted in accordance with CPC 33 (R1) and IAS 19 is in note 2.20.

Braskem S.A. Notas explicativas da Administração às demonstrações financeiras em 31 de dezembro de 2013 Valores expressos em milhares de reais, exceto quando indicado de outra forma
15
(b) Held-for-sale assets The Management of the Company decided to maintain the investments in Quantiq and IQAG. Hence, the Company is consolidating the effects of the income statements with retroactive effect in 2012. The Company recorded charges of R$7,300 related to amortization and depreciation in 2013. The effect of those expenses for prior year is immaterial as the decision to classify these investments as held for sale occurred on December 07, 2012. The assets and liabilities of these companies in 2012 are being shown under the items “Non-current assets held for sale” and “Liabilities related to non-current assets held for sale”. Consolidated information from the balance sheets of Quantiq and IQAG:
2012
AssetsCash and cash equivalents 9,985 Trade accounts receivable 17,897 Inventories 106,386 Property, plant and equipment 56,727 Intangible assets 13,246 Other 73,587
Total assets 277,828
LiabilitiesTrade payables 101,893 Borrowings 1,095 Payroll and related charges 5,232 Other 1,550
Total liabilities 109,770

Braskem S.A. Notas explicativas da Administração às demonstrações financeiras em 31 de dezembro de 2013 Valores expressos em milhares de reais, exceto quando indicado de outra forma
16
The effects of the resubmission of items (a) and (b) are shown below: Balance sheet
2012
(a) Post- (a) Post- employment employment
Assets Published benefits Revised Published benefits Revised
Current assets and non-current assetsheld for sale 12,692,327 - 12,692,327 8,182,981 - 8,182,981
Non-currentDeferred income tax and social contribution 2,055,621 6,388 2,062,009 1,100,611 - 1,100,611 Investments in subsidiaries and - - - - - -
jointly-controlled investments 86,842 - 86,842 9,571,515 (11,816) 9,559,699 Other non-current assets 26,328,788 - 26,328,788 16,522,806 - 16,522,806
28,471,251 6,388 28,477,639 27,194,932 (11,816) 27,183,116
Total assets 41,163,578 6,388 41,169,966 35,377,913 (11,816) 35,366,097
Liabilities
Current liabilities and non-current liabilitiesheld for sale 12,656,627 12,656,627 9,777,348 9,777,348
Non-currentDeferred income tax and social contribution 2,138,622 - 2,138,622 1,015,743 - 1,015,743 Other non-current liabilities 17,704,529 18,204 17,722,733 15,959,943 - 15,959,943
19,843,151 18,204 19,861,355 16,975,686 - 16,975,686
EquityOther comprehensive income 349,227 (11,816) 337,411 349,227 (11,816) 337,411 Other equity 8,226,760 - 8,226,760 8,275,652 - 8,275,652
Total attributable to the Company's shareholders 8,575,987 (11,816) 8,564,171 8,624,879 (11,816) 8,613,063
Non-controlling interest 87,813 - 87,813 - - -
8,663,800 (11,816) 8,651,984 8,624,879 (11,816) 8,613,063
Total liabilities and equity 41,163,578 6,388 41,169,966 35,377,913 (11,816) 35,366,097
Consolidated Parent company

Braskem S.A. Notes to the financial statements Years ended December 31 All amounts in thousands of reais
17
Statement of operations
2012
(b) Assets heldPublished for sale Revised
Continued operationsNet sales revenue 35,513,397 646,930 36,160,327
Cost of products sold (32,209,958) (499,110) (32,709,068)
Gross profit 3,303,439 147,820 3,451,259
Income (expenses) Selling and distribution (968,337) (22,028) (990,365) General and administrative (998,261) (72,768) (1,071,029) Research and development (106,198) 1 (106,197) Results from equity investments (25,807) - (25,807) Other operating income (expenses), net 333,767 (310) 333,457
Operating profit 1,538,603 52,715 1,591,318
Financial resultsFinancial expenses (3,902,499) (23,710) (3,926,209) Financial income 530,182 1,746 531,928
(3,372,317) (21,964) (3,394,281)
Profit (loss) before income tax and social contribution (1,833,714) 30,751 (1,802,963)
Current and deferred income tax and social contribution 793,376 (10,265) 783,111 793,376 (10,265) 783,111
Profit (loss) for the period of continued operations (1,040,338) 20,486 (1,019,852)
Discontinued operations resultsProfit (loss) from discontinued operations 451,262 (26,402) 424,860 Current and deferred income tax and social contribution (149,229) 5,916 (143,313)
302,033 (20,486) 281,547
Loss for the year (738,305) - (738,305)
Attributable to:Company's shareholders (731,143) - (731,143) Non-controlling interest (7,162) - (7,162)
(738,305) - (738,305)
Consolidated

Braskem S.A. Notes to the financial statements Years ended December 31 All amounts in thousands of reais
18
Statement of comprehensive income
2012Consolidated Parent company
Published
(b) Post-employment
benefits Revised Published
(b) Post-employment
benefits Revised
Loss for the year (738,305) - (738,305) (731,143) - (731,143)
Other comprehensive income or loss:Items that may be reclassified subsequently to profit or loss
Fair value of cash flow hedge 16,238 - 16,238 16,238 - 16,238 Income tax and social contribution (5,522) - (5,522) (5,522) - (5,522)
10,716 - 10,716 10,716 - 10,716
Foreign currency translation adjustment 78,780 - 78,780 61,662 - 61,662
Total 89,496 - 89,496 72,378 - 72,378
Items that will not be reclassified to profit or loss:Defined benefit plan actuarial (loss) gain - (18,204) (18,204) - (18,204) (18,204) Income tax and social contribution - 6,388 6,388 - 6,388 6,388
Total - (11,816) (11,816) - (11,816) (11,816)
Total other comprehensive income or loss 89,496 (11,816) 77,680 72,378 (11,816) 60,562
Total comprehensive income or loss for the year (648,809) (11,816) (660,625) (658,765) (11,816) (670,581)
Attributable to:Company's shareholders - continued operations (940,312) (11,816) (952,128) 0 - 0Company's shareholders - discontinued operations 281,547 - 281,547 0 - 0Non-controlling interest 9,956 - 9,956 0 - 0
Total comprehensive income or loss for the year (648,809) (11,816) (660,625) 0 - 0

Braskem S.A. Notes to the financial statements Years ended December 31 All amounts in thousands of reais
19
2.1.2 Consolidated financial statements The consolidated financial statements were prepared and presented in accordance with accounting practices adopted in Brazil, including the standards issued by the CPC, and in accordance with the IFRS issued by the IASB.
(a) Consolidation The financial statements of subsidiaries and specific purpose entities included in the consolidated financial statements have been prepared in accordance with the same accounting practices as those adopted by the parent company. The consolidation process provided for in pronouncements CPC 36 (R3) and IFRS 10 corresponds to the sum of balance sheet accounts and profit and loss, in addition to the following eliminations:
a) the investments of the Parent Company in the equity of subsidiaries; b) balance sheet accounts between companies;
c) income and expenses arising from commercial and financial operations carried out between companies;
and
d) the portions of profit and loss for the year and assets that correspond to unrealized gains and unrealized losses with third parties on transactions between companies.

Braskem S.A. Notes to the financial statements Years ended December 31 All amounts in thousands of reais
20
The consolidated financial statements comprise the financial statements of the Parent Company and the following entities:
Headquarters
(Country) 2013 2012
Braskem Alemanha Germany 100.00 100.00 Braskem America Finance Company ("Braskem America Finance") USA 100.00 100.00 Braskem America, Inc. (“Braskem America”) USA 100.00 100.00 Braskem Argentina S.A. (“Braskem Argentina”) Argentina 100.00 100.00 Braskem Austria Austria 100.00 100.00 Braskem Austria Finance Austria 100.00 100.00 Braskem Chile Chile 100.00 100.00 Braskem Espanha Spain 100.00 100.00 Braskem Finance Limited (“Braskem Finance”) Cayman Islands 100.00 100.00 Braskem Idesa Mexico 75.00 75.00 Braskem Idesa Servicios S.A. de CV ("Braskem Idesa Serviços") Mexico 75.00 75.00 Braskem Importação Brazil 100.00 100.00 Braskem Incorporated Limited (“Braskem Inc”) Cayman Islands 100.00 100.00 Braskem México Serviços Mexico 100.00 Braskem México, S de RL de CV (“Braskem México”) Mexico 100.00 100.00 Braskem Netherlands B.V (“Braskem Holanda”) Netherlands 100.00 100.00 Braskem Participações Brazil 100.00 100.00 Braskem Petroquímica Brazil 100.00 100.00 Braskem Petroquímica Chile Ltda. (“Petroquímica Chile”) Chile 100.00 100.00 Braskem Qpar Brazil 100.00 100.00 Common British Virgin Islands 100.00 100.00 DAT Brazil 100.00 IQAG Brazil 100.00 100.00 Lantana Trading Co. Inc. (“Lantana”) Bahamas 100.00 100.00 Norfolk Trading S.A. (“Norfolk”) Uruguay 100.00 100.00 Politeno Empreendimentos Ltda. (“Politeno Empreendimentos”) Brazil 100.00 100.00 Quantiq Brazil 100.00 100.00 Riopol Brazil 100.00
Fundo de Investimento M ultimercado Crédito Privado Sol (“FIM Sol”) Brazil 100.00 100.00 Fundo de Investimento Caixa Júpiter Multimercado Crédito Privado
Brazil 100.00 100.00
Total interest - %
Direct and Indirect subsidiaries
Specific Purpose Entity ("SPE")
Longo Prazo ("Fundo Júpiter)

Braskem S.A. Notes to the financial statements Years ended December 31 All amounts in thousands of reais
21
(a.i) Non-controlling interest in the equity and results of operations of the Company’s subsidiaries
(a.ii) Reconciliation between equity and profit (loss) for the year of parent company and consolidated
2.1.3 Parent company financial statements
The Parent Company financial statements have been prepared in accordance with accounting practices adopted in Brazil, following the provisions in Federal Law 6,404/76, and subsequent amendments (“Brazilian Law of Corporations”), and the standards issued by CPC, and are disclosed together with the consolidated financial statements. The accounting practices adopted in Brazil applicable to the Parent Company financial statements differ from International Financial Reporting Standards (“IFRS”) only in relation to the valuation of investments in subsidiaries and associates based on the equity accounting method, instead of cost or fair value in accordance with IFRS.
2.2 Operating segment reporting This information is prepared and presented consistently with the internal report provided to the Chief Executive Officer, who is the main operating decision-maker and responsible for allocating resources and assessing performance of the operating segments (Note 36). The determination of results per segment takes into consideration transfers of goods and provision of services between segments that are considered arm’s length sales and stated based on market prices.
2.3 Foreign currency translation
(a) Functional and presentation currency The functional and presentation currency of the Company is the real, determined in accordance with CPC 02 (R2) and IAS 21.
2013 2012 2013 2012
Braskem Idesa 137,116 87,813 (2,659) (7,162) Total 137,116 87,813 (2,659) (7,162)
Adjusted shareholders' equity Adjusted profit (loss) for the period
Note 2013 2012 2013 20122.1.1(a) Revised
Parent Company 7,593,110 8,613,063 509,697 (731,143) Braskem shares owned by subsidiary Braskem Petroquímica (48,892) (48,892) 0 - Non-controlling interest of Braskem Idesa 137,116 87,813 (2,659) (7,162)
Consolidated 7,681,334 8,651,984 507,038 (738,305)
Shareholders' equity Profit (loss) for the period

Braskem S.A. Notes to the financial statements Years ended December 31 All amounts in thousands of reais
22
(b) Brazilian real as functional currency The company has a few companies abroad that also use the real as their functional currency. Foreign currency transactions and balances are translated into the functional currency using the foreign exchange rates prevailing at the dates of the transactions or at year end, as applicable. Foreign exchange gains and losses resulting from the settlement of such transactions and from the translation at year-end foreign exchange rates of monetary assets and liabilities denominated in foreign currencies are recognized in the statement of operations as “financial income” and “financial expenses”, respectively, except those designated for hedge accounting, which are, in this case, deferred in equity as cash flow hedges.
(c) Functional currency other than the Brazilian real Some subsidiaries and a jointly-controlled investment have a different functional currency from that of the Parent Company, as follows:
USD = U.S. dollar EUR = Euro MXN = Mexican peso The financial statements of these companies are translated into reais based on the following rules:
• assets and liabilities for each balance sheet presented are translated at the closing rate at the date of that balance sheet;
• equity is converted at the historical rate, that is, the foreign exchange rate prevailing on the date of each transaction; and
• income and expenses for each statement of operations are translated at the monthly average rate. All resulting exchange differences are recognized as a separate component of equity in the account “other comprehensive income”. When a foreign investment is partially or fully written off for any reason, the respective exchange differences recorded in equity are recognized in the statement of operations as part of the gain or loss on the transaction.
2.4 Cash and cash equivalents Cash and cash equivalents include cash in hand, deposits held at call with banks and highly liquid investments with maturities of three months or less. They are convertible into a known amount and subject to an immaterial risk of change in value (Note 6).
Propilsur Braskem IdesaBraskem Idesa Serviços
Braskem México
Braskem México Serviços
Braskem America
Braskem America Finance
Braskem Alemanha
Braskem Áustria
USD MXN MXN MXN MXN USD USD EUR EUR

Braskem S.A. Notes to the financial statements Years ended December 31 All amounts in thousands of reais
23
2.5 Financial assets
2.5.1 Classification and measurement Financial assets are classified as held for trading, loans and receivables held to maturity. This classification depends on the purpose for which they were acquired. These financial assets are derecognized when the corresponding rights to receive cash flows have been received or transferred and the Company has transferred substantially all risks and rewards of ownership of the related assets. Eventual expenses with the acquisition or sale of held-for-trading financial assets are expensed in the statement of operations. For the other financial assets, these expenses, when significant, are added to their respective fair value.
(a) Held-for-trading financial assets – these are measured at fair value and they are held to be actively and frequently traded in the short term. The assets in this category are classified as current assets. Derivatives are also categorized as held for trading unless they are designated for hedge accounting (Note 2.6). Held-for-trading financial assets are carried at fair value on an ongoing basis. Gains or losses arising from changes in the fair value of these financial assets are presented in “financial results” in the period in which they arise.
(b) Loans and receivables - these are non-derivative financial assets with fixed or determinable payments that are not quoted in an active market. The Company’s loans and receivables comprise loans to related parties and accounts with associates (Note 10), trade accounts receivable (Note 8), other accounts receivable (Note 14), cash and cash equivalents (Note 6) and financial investments (Note 7). Loans and receivables are carried at amortized cost using the effective interest method. These assets are stated at cost of acquisition, plus earnings accrued, against profit or loss for the year. Assets held to maturity – the Company’s held-to-maturity financial investments comprise mainly quotas of investment funds in credit rights.
2.5.2 Impairment of financial assets The Company permanently assesses the existence of objective evidence that a financial asset, classified as loans and receivables or held-to-maturity is impaired. The criteria the Company uses to determine that there is objective evidence of an impairment loss include:
a) significant financial difficulty of the issuer or debtor;
b) a breach of contract by the issuer or debtor, such as a default or delinquency in interest or principal payments;
c) it becomes probable that the debtor will enter bankruptcy or other financial reorganization; or
d) the disappearance of an active market for that financial asset because of financial difficulties.

Braskem S.A. Notes to the financial statements Years ended December 31 All amounts in thousands of reais
24
Losses are recorded when there is objective evidence of impairment as a result of one more events that occurred after the initial recognition of the asset and that loss event has an impact on the future cash flows that can be reliably estimated. The amount of any impairment loss is measured as the difference between the asset’s carrying amount and the present value of future cash flows carried to their future value at market rates and discounted at the financial asset’s original effective interest rate. This methodology does not apply to the calculation of the provision for impairment. The methodology adopted by the Company for recognizing the provision for impairment is based on the history of losses and considers the sum of (i) 100% of the amount of receivables past due for over 180 days; (ii) 50% of the amount of receivables past due for over 90 days; (iii) 100% of the amount of receivables under judicial collection (iv) all the receivables from the first renegotiation maturing within more than 24 months; and (v) 100% of the receivables arising from a second renegotiation with customers. Receivables from related parties are not considered in this calculation.
2.6 Derivative and non-derivative financial instruments and hedging activities Derivatives are recognized at fair value on an ongoing basis. The recognition of the gain or loss in profit or loss depends on whether the derivative is designated as a hedging instrument.
(a) Designated as hedge accounting Management may designate certain derivatives as hedges of a particular risk associated with a recognized asset or liability or a highly probable forecast transaction. It may also designate non-derivative financial instruments as hedge for highly probable future sales in foreign currency (cash flow hedge). The Company documents at the inception of the transaction the relationship between hedging instruments and hedged items, as well as its risk Management objectives and strategy for undertaking various hedging transactions. It also documents its assessment, on an ongoing basis, of whether the derivatives that are used in hedging transactions are highly effective in offsetting changes in fair values or cash flows of hedged items. The effective portion (i) of the changes in the fair value of hedge derivatives and (ii) of the exchange variation of financial liabilities designated and qualified as sales flow hedge is recognized in equity, under “other comprehensive income”. These amounts are transferred to profit or loss for the periods in which the hedged item affects the financial results. The ineffective portion is recognized immediately in the statement of operations as “financial result”. When the hedge instrument matures or is sold or when it no longer meets the criteria for hedge accounting, it is prospectively discontinued and any cumulative gain or loss in equity remains in equity and is recognized in profit or loss when the hedged item or transaction affects profit or loss. If the hedged item or transaction is settled in advance, discontinued or is not expected to occur, the cumulative gain or loss in equity is immediately transferred to “financial result”. The cash flow hedge transactions carried out by the Company are described in Note 20.2.1(b).

Braskem S.A. Notes to the financial statements Years ended December 31 All amounts in thousands of reais
25
(b) Derivatives at fair value through profit or loss Derivatives not designated as hedge instruments are classified as current assets or liabilities. Changes in the fair value of these derivative instruments are recognized immediately in the statement of operations under “financial results”, regardless of the instrument contracted.
2.7 Trade accounts receivable Trade accounts receivable are recognized at the amount billed net of the allowance for doubtful accounts. The Company’s billing period is generally 30 days; therefore, the amount of the trade accounts receivable corresponds to their fair value on the date of the sale (Note 8).
2.8 Inventories Inventories are stated at the lower between the average acquisition or production cost or at the estimated retail price, net of taxes. The Company determines the cost of its production using the absorption method, and uses the weighted average cost to determine the value of its inventories.
2.9 Discontinued operations The Company classifies as discontinued the operations related to cash generating units or reportable operating segment that have been divested or are undergoing divestment and are classified as held-for-sale. Profit or loss from discontinued operations is presented in a single item on the statement of operations for the fiscal year. In addition, detailed information is also reported, as follows: (i) revenue, cost of sales, general and administrative expenses and profit or loss before income tax and social contribution; (ii) income tax and social contribution; (iii) gains from the sale of assets that comprise the discontinued operation; and (iv) income tax and social contribution related to item (iii) above. Profit or loss from discontinued operations is recognized after eliminating the revenues and expenses arising from any commercial and financial operations carried out among the companies.
2.10 Investments in subsidiaries The Company controls an entity when it is exposed or entitled to variable returns on account of its involvement with the entity and is capable of affecting these returns through its power over the entity. Investment gains and losses arising from transactions with non-controlling shareholders are directly recorded in equity in “other comprehensive income”. These gains and losses are transferred to profit or loss for the year when the Company ceases to have control over the related subsidiary.

Braskem S.A. Notes to the financial statements Years ended December 31 All amounts in thousands of reais
26
The Company recognizes, in the Parent Company’s financial statements, a provision for losses in subsidiaries at an amount equivalent to the net capital deficiency of these subsidiaries. This provision is recorded in non-current liabilities with a contra-entry to the account “results from equity investments”. The unrealized gains in operations between the Parent Company and its subsidiaries that are still recorded in the assets held by the Company are fully eliminated from the financial statements of the Parent Company.
2.11 Investments in associates and other investments Associates are all entities over which the Company has the power to participate in the financial and operating decisions without having control (significant influence). Investments in associates are initially accounted for at cost and subsequently using the equity method and they may include possible goodwill identified on acquisition, net of any accumulated impairment loss. Unrealized gains on transactions between the Company and its associates are eliminated to the extent of the Company’s interest in these investments. Other investments are stated at acquisition cost, less provision for adjustments to market value, when applicable.
2.12 Investments in jointly-controlled investments Jointly-controlled investments are all entities over which the Company shares, under an agreement, control with one or more parties. Investments in jointly-controlled investments are initially accounted for at cost and subsequently using the equity method. The unrealized gains in operations between the Company and its jointly-controlled investments are eliminated proportionately to its interest in these investments.
2.13 Property, plant and equipment Property, plant and equipment is stated at cost net of accumulated depreciation and provision for impairment, when applicable. The cost includes: (a) the acquisition price and the financial charges incurred in borrowings during the phase of construction
(Note 16), and all other costs directly related with making the asset usable; and
(b) the fair value of assets acquired through business combinations. The financial charges are capitalized on the balance of the projects in progress using (i) an average funding rate of all borrowings; and (ii) the portion of the foreign exchange variation that corresponds to a possible difference between the average rate of financing in the internal market and the rate mentioned in item (i). The machinery, equipment and installations of the Company require inspections, replacement of components and maintenance in regular intervals. The Company makes shutdowns in regular intervals that vary from two to six years to perform these activities. These shutdowns can involve the plant as a whole, a part of it, or even relevant pieces of equipment, such as industrial boilers, turbines and tanks. Shutdowns that take place every six years, for example, are usually made for the maintenance of industrial plants as a whole. Costs of materials and outsourced services that are directly attributable to these shutdowns are capitalized when (i) it is probable that future economic benefits associated with these costs will flow to the Company; and (ii) these costs can be

Braskem S.A. Notes to the financial statements Years ended December 31 All amounts in thousands of reais
27
measured reliably. Expenses with each scheduled shutdown are included in property, plant and equipment items that were the subject matter of the stoppage and are fully depreciated until the beginning of the following related stoppage. The expenditures with personnel, the consumption of small materials, maintenance and the related services from third parties are recorded, when incurred, as production costs. Property, plant and equipment items are depreciated on a straight-line basis. The average depreciation and depletion rates used, determined based on the useful lives of the assets, are presented in Note 16. Projects in progress are not depreciated. Depreciation begins when the assets are available for use. The Company does not attribute a residual value to assets due to its insignificance.
2.14 Intangible assets The group of accounts that comprise the intangible assets is the following:
(a) Goodwill based on future profitability The existing goodwill was determined in accordance with the criteria established by the accounting practices adopted in Brazil before the adoption of the CPC and IFRS pronouncements and represent the excess of the amount paid over the amount of equity of the entities acquired. Upon adoption of the CPC and IFRS pronouncements in 2009, the Company applied the exemption related to business combinations prior to January 1, 2009 and did not remeasure these amounts. This goodwill has not been amortized since that date and it is tested annually for eventual impairment.
(b) Trademarks and patents The technologies acquired from third parties, including those acquired through business combination, are recorded at the cost of acquisition and/or fair value and other directly attributed costs, net of accumulated amortization and provision for impairment, when applicable. Technologies that have defined useful lives and are amortized using the straight-line method based on the term of the purchase agreement (between 10 and 20 years) Expenditures with research and development are accounted for in profit or loss as they are incurred.
(c) Contractual customer and supplier relationships Contractual customer and supplier relationships arising from a business combination were recognized at fair value at the respective acquisition dates. These contractual customer and supplier relationships have a finite useful life and are amortized using the straight-line method over the term of the respective purchase or sale agreement (between 14 and 28 years).
Braskem S.A. Notes to the financial statements Years ended December 31 All amounts in thousands of reais
28
(d) Software Software is recorded at cost net of accumulated amortization. Cost includes the acquisition price and/or internal development costs and all other costs directly related with making the software usable. All software booked has defined useful life estimated between 3 and 10 years and is amortized using the straight-line method. Costs associated with maintaining computer software programs are recognized in profit or loss as incurred.
2.15 Impairment of non-financial assets
Assets that have indefinite useful lives, as goodwill based on future profitability, are not subject to amortization and are tested annually for impairment. This goodwill is allocated to the Cash Generating Units (“CGU”) or operating segments for the purposes of impairment testing. Assets that that have defined useful lives are reviewed for impairment whenever events or circumstances indicate that the carrying amount may not be recoverable. An impairment loss is recognized when the asset’s carrying amount exceeds its recoverable amount. The recoverable amount is the higher of (i) an asset’s fair value less costs to sell; (ii) and its value in use. Taking into consideration the peculiarities of the Company’s assets, the value used for assessing impairment is the value in use, except when specifically indicated otherwise. The value in use is estimated based on the present value of future cash flows (Note 16(a)). For the purposes of assessing impairment, assets are grouped at the lowest levels for which there are identifiable cash flows that can be CGUs or operating segments.
2.16 Trade payables Trade payables are obligations arising from the acquisition of goods or services in the ordinary course of business and they are recorded at the amount billed. When applicable, they are recorded at present value based on interest rates that reflect the term, currency and risk of each transaction. The Company calculates the adjustment to present value for operations that have material impact on its financial statements.
2.17 Borrowings Borrowings are recognized initially at fair value and net of the transaction costs incurred in structuring the transaction, when applicable. Subsequently, borrowings are presented with the charges and interest in proportion to the period incurred.
2.18 Provisions Provisions are recognized in the balance sheet when (i) the Company has a present legal, contractual or constructive obligation as a result of past events, (ii) it is probable that an outflow of financial resources will be required to settle the obligation and (iii) the amount can be reliably estimated. The provisions for tax, labor and other contingencies are recognized based on Management’s expectation of probable loss in the respective proceedings and supported by the opinion of the Company’s external legal advisors (Note 23).

Braskem S.A. Notes to the financial statements Years ended December 31 All amounts in thousands of reais
29
The contingencies assumed in a business combination for which an unfavorable outcome is considered possible are recognized at their fair value on the acquisition date. Subsequently, and until the liability is settled, these contingent liabilities are measured at the higher of the amount recorded in the business combination and the amount that would be recognized under CPC 25 and IAS 37. Provisions are measured at the present value of the expenditures required to settle the obligation using a rate before tax effects that reflects current market assessments. The increase in the provision due to passage of time is recognized in “financial results”.
2.19 Current and deferred income tax and social contribution The income tax (“IR”) and social contribution (“CSL”) recorded in the year are determined on the current and deferred tax basis. These taxes are calculated on the basis of the tax laws enacted at the balance sheet date in the countries where the Company operates and are recognized in the statement of operations, except to the extent they relate to items recorded in equity. Deferred income tax and social contribution are recognized on temporary differences between the tax bases of assets and liabilities and their carrying amounts in the financial statements. On the other hand, the deferred income tax and social contribution are not accounted for if they arise from the initial recognition of an asset or liability in a transaction other than a business combination that at the time of the transaction affects neither accounting, nor taxable profit or loss. Deferred income tax and social contribution assets are recognized to the extent that it is probable that future taxable profit will be available against which the temporary differences can be utilized based on projections of future results prepared and based on internal assumptions and future economic scenarios that will allow for their utilization. The amounts accounted for and projections are regularly reviewed. Deferred income tax and social contribution assets and liabilities are presented net in the balance sheet when there is a legally enforceable right to offset them upon the calculation of current taxes. Accordingly, deferred tax assets and liabilities in different companies or countries are generally presented separately, and not on a net basis. Management periodically evaluates positions taken by the Company in income tax returns with respect to situations in which applicable tax regulation is subject to interpretation.
2.20 Post-employment benefits The Company sponsors a defined contribution plan and defined benefit plans.
(i) Defined contribution plan For the defined contribution plan, the Company pays contributions to private pension plan on contractual or voluntary bases. As soon as the contributions are paid, the Company does not have any further obligations related to additional payments.

Braskem S.A. Notes to the financial statements Years ended December 31 All amounts in thousands of reais
30
(ii) Defined benefit plan The defined benefit plans are financed by the payment of contributions to pension funds and the use of actuarial assumptions is necessary to measure the liability and the expenses of the plans, as well as the existence of actuarial gains and losses. The liability recognized in respect of these plans is the present value of the defined benefit obligation at the balance sheet date, less the fair value of plan assets, adjusted by actuarial gains or losses and past-service costs. The cost components of defined-benefit plans are recognized as follows: (i) actuarial gains and losses from the actuarial remeasurement are recognized under “other comprehensive
income”.
(ii) costs of past services are recognized as profit or loss as they are incurred; and (iii) the net amount of interest on the assets and liabilities of the plan are recorded in the financial results of
the year.
2.21 Contingent assets and liabilities and judicial deposits The recognition, measurement and disclosure of contingent assets and liabilities and judicial deposits are performed in accordance with CPC 25 and IAS 37 as follows: (i) Contingent assets – are not recognized in the books, except when Management considers, supported by
the opinion of its external legal advisors, the gain to be virtually certain or when there are secured guarantees or for which a favorable final and unappealable decision has been rendered.
(ii) Contingent liabilities – are not recognized, except when Management considers, supported by the opinion
of its external legal advisors, that the chances of an unfavorable outcome is probable. For unrecognized contingencies, the Company discloses the main proceedings for which an unfavorable outcome is assessed as a possible in (Note 28).
(iii) Judicial deposits – are maintained in non-current assets without the deduction of the related provisions for
contingencies or legal liabilities, unless such deposit can be legally offset against liabilities and the Company intends to offset such amounts.
2.22 Distribution of dividends
The distribution of dividends to shareholders of the company is recognized based on Brazilian Corporation Law and on the bylaws of the Company. Upon closing the balance sheet, the amount corresponding to the minimum mandatory dividend (Note 29(b)) is registered in current liabilities under “dividends and interest on capital” since it is considered a legal obligation provided for in the bylaws of the Company. The portion of dividends that exceeds the minimum mandatory amount is represented in “additional proposed dividend”, in the “revenue reserves” group under shareholders' equity. Once approved by the shareholders’ meeting, this portion is transferred to current liabilities.

Braskem S.A. Notes to the financial statements Years ended December 31 All amounts in thousands of reais
31
2.23 Recognition of sales revenue Sales revenue comprises the fair value of the consideration received or receivable for the sale of goods and services in the ordinary course of the Company’s activities. Revenue is shown net of taxes, returns and rebates. Revenue from the sale of goods is recognized when (i) the amount of revenue can be reliably measured and the Company no longer has control over the goods sold; (ii) it is probable that future economic benefits will be received by the Company; and (iii) all legal rights and risks and rewards of ownership have been transferred to the customer. The Company does not make sales with continued Management involvement. Most of Braskem’s sales are made to industrial customers and, in a lower volume, to resellers. The moment at which the legal right, as well as the risks and rewards, are substantially transferred to the customer and determined as follows: (i) for contracts in which the Company is responsible for freight and insurance, the legal right, as well as the
risks and rewards, are transferred to the customer after the good is delivered at the contractually agreed destination;
(ii) for contracts in which the freight and insurance are the responsibility of the customer, the risks and
rewards are transferred at the moment the goods are delivered at the client’s shipping company; and (iii) for contracts in which the delivery of the goods involves the use of pipelines, particularly basic
petrochemicals, the risks and rewards are transferred immediately after the Company’s official measures, which is the point of delivery of the goods and transfer of their ownership.
The cost of freight services related to sales, transfers to storage facilities and product transfers are included in cost of sales.
2.24 Rules, changes and interpretation applied for the first time in 2013 Braskem applied for the first time in 2013 the effects of CPC 33 (R1) and IAS 19 – “Employee benefits” (Note 2.1.1 (a)) and the amendment of CPC 26 (R1) and IAS 1 – “Presentation of Financial Statements” including the disclosure of profits and losses in other comprehensive income that will affect or not the result of the period at the Financial of Operations. There are other changes applied for the first time in 2013. Nonetheless, they have no impact to the Company financial statements.
2.25 Rules, changes and interpretations of standards that will be in force in 2014 Rules, changes and interpretations of standards that will be in force in 2014 and have not been adopted early by the Company: IAS 32 – “Financial Instruments: Presentation” provides further clarification in addition to the application guidance in IAS 32 on the requirement to offset financial assets and liabilities in the balance sheet. The standard will be applicable as of January 1, 2014. This standard has not yet been issued by the CPC. IFRS 10, IFRS 12 and IAS 27 - "Investment Entities" – in October 2012, IASB issued an amendment to the IFRS 10, IFRS 12 and IAS 27 standards, which defines investment entities and introduces an exception to the

Braskem S.A. Notes to the financial statements Years ended December 31 All amounts in thousands of reais
32
consolidation of subsidiaries by investment entities, also establishing the accounting treatment in these cases. These will be applicable as of January 1, 2014. These standards have not yet been issued by the CPC. The Company analyzed these standards and concluded that there will be no impacts on its consolidated financial statements.
2.26 Rules, changes and interpretations of standards that are not yet in force Rules, changes and interpretations of standards that currently are not in force and have not been adopted early by the Company: IFRS 9 – “Financial Instruments” outlines the requirements for the classification, measurement and recognition of financial assets and liabilities IFRS 9 was issued in November 2009 and October 2010 and substitutes the paragraphs in IAS 39 related to the classification and measurement of financial instruments. IFRS 9 required classification of financial assets into two categories: measured at fair value and measured at amortized cost. Classification is determined when the financial asset is initially recognized. Classification depends on the business model of the entity and the characteristics of the cash flow arrangements of the financial instruments. For financial liabilities, the standard maintains most of the requirements under IAS 39. The main change is when the fair value option is adopted for financial liabilities, in which case the portion of change in fair value that is attributable to changes in the credit risk of the entity is registered in “other comprehensive income” and not in the statement of operations, except for cases in which this results in accounting mismatches. The standard will be applicable as of January 1, 2015. This standard has not yet been issued by the CPC.
3 Application of critical accounting practices and judgments Critical estimates and judgments Critical estimates and judgments are those that require the most difficult, subjective or complex judgments by Management, usually as a result of the need to make estimates that affect issues that are inherently uncertain. Estimates and judgments are continually reassessed and are based on historical experience and other factors, including expectations of future events that are believed to be reasonable under the circumstances. Actual results can differ from planned results due to differences in the variables, assumptions or conditions used in making estimates In order to provide an understanding of the way the Company forms its judgments on future events, the variables and assumptions used in estimates are presented below:
3.1 Deferred income tax and social contribution The Company keeps a permanent record of deferred income tax and social contribution on the following bases: (i) tax losses and social contribution tax loss carryforwards; (ii) temporarily non-taxable and nondeductible income and expenses, respectively; (iii) tax credits and expenses that will be reflected in the books in subsequent periods; and (iv) asset and liability amounts arising from business combinations that will be treated as income or expenses in the future and that will not affect the calculation of income tax and social contribution. The recognition and the amount of deferred taxes assets depend on the generation of future taxable income, which requires the use of an estimate related to the Company’s future performance. This information is in the Business Plan, which is approved by the Board of Directors. This plan is prepared by the Executive Board using as main variables the price of the products manufactured by the Company, price of naphtha, expected market

Braskem S.A. Notes to the financial statements Years ended December 31 All amounts in thousands of reais
33
growth, Gross Domestic Product (“GDP”), exchange variation, interest rate, inflation rate and fluctuations in the supply and demand of inputs and finished products are obtained from expert external consultants, historical performance and results of the Company and its capacity to generate taxable income, improvement in the utilization rates of the Company's plants based on market growth and internal programs focused on operational efficiency, specific incentives from the Brazilian government for the petrochemical sector in Brazil. The Company annually reviews the projection of taxable income. If this projection shows that the taxable income will not be sufficient to absorb the deferred tax, the corresponding portion of the asset that cannot be recovered is written off. The tax losses and negative social contribution bases do not expire under the Brazilian taxation regime, as do tax losses in Germany.
3.2 Fair value of derivative and non-derivative financial instruments The Company evaluates the derivative financial instruments at their fair value and the main sources of information are the stock exchanges, commodities and futures markets, disclosures of the Central Bank of Brazil and quotation services like Bloomberg and Reuters. Nevertheless the high volatility of the foreign exchange and interest rate markets in Brazil caused, in certain periods, significant changes in future rates and interest rates over short periods of time, leading to significant changes in the market value of swaps and other financial instruments. The fair values recognized in its financial statements may not necessarily represent the amount of cash that the Company would receive or pay upon the settlement of the transactions. The fair values of non-derivative, quoted financial instruments are based on current bid prices. If the market for a financial asset and for unlisted securities is not active, the Company establishes fair value by using valuation techniques. These include the use of recent arm’s length transactions, reference to other instruments that are substantially the same, discounted cash flow analysis, and option pricing models that make maximum use of market inputs and rely as little as possible on information provided by the Company’s Management.
3.3 Useful life of assets The Company recognizes the depreciation and depletion of its long-lived assets based on their useful life estimated by independent appraisers and approved by the Company’s technicians taking into consideration the experience of these professionals in the Management of Braskem’s plants. The useful lives initially established by independent appraisers are reviewed at the end of every year by the Company’s technicians in order to check whether they need to be changed. In December 2013, this analysis concluded that the useful lives applied in 2013 should be maintained in 2014. The main factors that are taken into consideration in the definition of the useful life of the assets that compose the Company’s industrial plants are the information of manufacturers of machinery and equipment, volume of the plants’ operations, quality of preventive and corrective maintenance and the prospects of technological obsolescence of assets. The Company’s Management also decided that (i) depreciation should cover all assets value because when the equipment and installations are no longer operational, they are sold by amounts that are absolutely immaterial; and (ii) land is not depreciated because it has an indefinite useful life.

Braskem S.A. Notes to the financial statements Years ended December 31 All amounts in thousands of reais
34
The useful lives applied to the assets determined the following average depreciation and depletion rates:
3.4 Business combination In accordance with CPC 15(R1) and IFRS 3, the Company must allocate the cost of the assets acquired and the contingencies and liabilities assumed based on their estimated fair values on the acquisition date. The Management of the Company exercises a significant amount of judgment when measuring tangible assets, identifying and measuring intangible assets, identifying and measuring risks and contingencies, measuring other assets acquired and liabilities assumed and determining remaining useful lives. The use of assumptions in risk measurements and assessments may result in estimated amounts that differ from the assets acquired and liabilities assumed. The Company contracts specialized companies to support it in these activities. If the future results are not consistent with the estimates and assumptions used, the Company may be exposed to losses that may be material.
3.5 Impairment test for tangible and intangible assets
(a) Tangible and intangible assets with defined useful lives On the balance sheet date, the Company makes an analysis to determine if there is evidence that the amount of long-lived tangible assets and intangible assets with defined useful lives will not be recoverable. This analysis is based on the business plan prepared and approved annually by the Management of the Company (Note 3.1). When some indication that the amount of these assets will not be recovered is identified, the Company compares the book value of such assets with the respective values in use. For this test, the Company uses the cash flow that is prepared based on the Business Plan. The assets are allocated to the CGUs as follows: Basic petrochemicals operating segment: • CGU UNIB Bahia: represented by assets of the basic petrochemicals plants located in the BA; • CGU UNIB South: represented by assets of the basic petrochemicals plants located in the RS; • CGU UNIB Southeast: represented by assets of the basic petrochemicals plants located in the states of RJ
and SP;
2013 2012Buildings and improvements 3.42 3.59 Machinery, equipment and installations 7.23 7.25 Mines and wells 8.96 9.01 Furniture and fixtures 10.28 10.75 IT equipment 21.21 20.50 Lab equipment 9.30 9.90 Security equipment 9.83 9.99 Vehicles 20.02 18.71 Other 15.86 19.54
(% )

Braskem S.A. Notes to the financial statements Years ended December 31 All amounts in thousands of reais
35
Polyolefins operating segment: • CGU Polyethylene: represented by assets of the PE plants located in Brazil; • CGU Polypropylene: represented by assets of the PP plants located in Brazil; • CGU Renewables: represented by the Green PE plant located in Brazil;
Vinyls operating segment: • CGU Vinyls: represented by assets of PVC plants and chloride soda located in Brazil; International businesses operating segment:
• CGU Polypropylene USA: represented by assets of PP plants located in the United States; • CGU Polypropylene Germany: represented by assets of PP plants located in Germany; Chemical Distribution operating segment: • represented by assets of the subsidiaries Quantiq and IQAG.
(b) Goodwill based on future profitability and intangible assets with indefinite useful lives Whether there are indications that the amount of an asset may not be recovered or not, the balances of goodwill from future profitability arising from business combinations and intangible assets with indefinite useful lives are tested for impairment at least once a year at the balance sheet date. For the purposes of testing impairment, the Company allocated the goodwill existing at the CGU UNIB South and in the Polyolefins and Vinyls operating segments. The Company’s Management allocated the goodwill to the Polyolefins segment based on the way this goodwill is internally managed. The existing goodwill was generated in a business combination that resulted in the simultaneous acquisition of polypropylene and polyethylene plants. The main raw materials of these plants were already supplied by the Parent Company, which allowed for the obtainment of significant synergies in the operation. These synergies were one of the main drivers of that acquisition. Accordingly, the Company’s Management tested this goodwill and assets for impairment in the ambit of their operating segment since the benefits of the synergies are associated with all units acquired.
3.6 Provisions and contingent liabilities The contingent liabilities and provisions that exist at the Company are mainly related to discussions in the judicial and administrative spheres arising from primarily labor, pension, civil and tax lawsuits and administrative procedures. Braskem’s Management, based on the opinion of its external legal advisors, classifies these proceedings in terms of probability of loss as follows: Probable loss – these are proceedings for which there is a higher probability of loss than of a favorable outcome, that is, the probability of loss exceeds 50%. For these proceedings, the Company recognizes a provision that is determined as follows:
Braskem S.A. Notes to the financial statements Years ended December 31 All amounts in thousands of reais
36
(i) labor claims – the amount of the provision corresponds to the amount to be disbursed as estimated by the Company’s legal counsels;
(ii) tax claims - the amount of the provision corresponds to the value of the matter plus charges corresponding to the variation in the Selic rate; and
(iii) other claims – the amount of the provision corresponds to the value of the matter. Possible loss – these are proceedings for which the possibility of loss is greater than remote. The loss may occur, however, the elements available are not sufficient or clear to allow for a conclusion on whether the trend is for a loss or a gain. In percentage terms, the probability of loss is between 25% and 50%. For these claims, except for the cases of business combinations, the Company does not recognize a provision and mentions the most significant ones in a note to the financial statements (Note 28). In business combination transactions, in accordance with the provision in CPC 15 (R1) and IFRS 3, the Company records the fair value of the claims based on the assessment of loss (Note 23). The amount of the provision corresponds to the value of the matter, plus charges corresponding to the variation in the Selic rate, multiplied by the probability of loss. Remote loss – these are proceedings for which the risk of loss is small. In percentage terms, this probability is lower than 25%. For these proceedings, the Company does not recognize a provision not does it disclose them in a note to the financial statements regardless of the amount involved. The Company’s Management believes that the estimates related to the outcome of the proceedings and the possibility of future disbursement may change in view of the following: (i) higher courts may decide in a similar case involving another company, adopting a final interpretation of the matter and, consequently, advancing the termination of the of a proceeding involving the Company, without any disbursement or without implying the need of any financial settlement of the proceeding; and (ii) programs encouraging the payment of the debts implemented in Brazil at the Federal and State levels, in favorable conditions that may lead to a disbursement that is lower than the one that is recognized in the provision or lower than the value of the matter.
4 Risk Management Braskem is exposed to market risks arising from variations in commodity prices, foreign exchange rates and interest rates, credit risks of its counterparties in cash equivalents, financial investments and trade accounts receivable, and liquidity risks to meet its obligations from financial liabilities. Braskem adopts procedures for managing market and credit risks that are in conformity with the financial policy approved by the Board of Directors on August 9, 2010. The purpose of risk Management is to protect the cash flows of Braskem and reduce the threats to the financing of its operating working capital and investment programs.

Braskem S.A. Notes to the financial statements Years ended December 31 All amounts in thousands of reais
37
4.1 Market risks
Braskem prepares a sensitivity analysis for foreign exchange rate and interest rate risks to which it is exposed, which is presented in Note 20.4.
(a) Exposure to commodity risks Braskem is exposed to the variation in the prices of various commodities and, in general, seeks to transfer the variations caused by fluctuations in market prices. In addition, the Company entered into derivative operations to hedge against the exposure to risks arising from isolated transactions involving the commodities naphtha and ethylene (Note 20.2.1).
(b) Exposure to foreign exchange risk Braskem has commercial operations denominated in or pegged to foreign currencies. Braskem’s inputs and products have prices denominated in or strongly influenced by international prices of commodities, which are usually denominated in U.S. dollar. Additionally, Braskem has long-term loans in foreign currencies that expose it to variations in the foreign exchange rate between the functional currency (Brazilian real, Mexican peso and Euro) and the foreign currency, in particular the U.S. dollar. Braskem manages its exposure to foreign exchange risk through the combination of debt, financial investments, accounts receivable and raw material purchases denominated in foreign currencies and through derivative operations. Braskem’s financial policy for managing foreign exchange risks provides for the maximum and minimum coverage limits that must be observed and which are continuously monitored by its Management. On December 31, 2013, Braskem prepared sensitivity analyses for exposures to the risks of fluctuations in Euro and U.S. dollar, as informed in Note 20.4.
(c) Exposure to interest rate risk Braskem is exposed to the risk that a variation in floating interest rates causes an increase in its financial expense due to payments of future interest. Debt denominated in foreign currency subject to floating rates is mainly subject to fluctuations in Libor. Debt denominated in local currency is mainly subject to the variation in the Long-Term Interest Rate (“TJLP”) and in the Interbank Certificate of Deposit (“daily CDI”) rate. In the year, Braskem held swap contracts (Note 20.2.1) in which it: (i) receives the pre-contractual rate and pays the CDI overnight rate; and (ii) receives Libor and pays a fixed rate. On December 31, 2013, Braskem prepared a sensitivity analysis for the exposure to the floating interest rates Libor, CDI and TJLP, as informed in Notes 20.4(f), (g) and (h).

Braskem S.A. Notes to the financial statements Years ended December 31 All amounts in thousands of reais
38
4.2 Exposure to credit risk The transactions that subject Braskem to the concentration of credit risks are mainly in current accounts with banks, financial investments and trade accounts receivable in which Braskem is exposed to the risk of the financial institution or customer involved. In order to manage this risk, Braskem maintains bank current accounts and financial investments with major financial institutions, weighting concentrations in accordance with the credit rating and the daily prices observed in the Credit Default Swap market for the institutions, as well as netting contracts that minimize the total credit risk arising from the many financial transactions entered into by the parties. On December 31, 2013, Braskem held netting contracts with Banco Citibank S.A., HSBC Bank Brasil S.A. – Banco Múltiplo, Banco Itaú BBA S.A., Banco Safra S.A., Banco Santander S.A., Banco Votorantim S.A., Banco West LB do Brasil S.A., Banco Caixa Geral – Brasil S.A., and Banco Bradesco S.A. Approximately 36% of the amounts held in cash and cash equivalents (Note 6) and financial investments (Note 7) are contemplated by these agreements, whose related liabilities are accounted for under “borrowings” (Note 18). The effective netting of these amounts is possible only in the event of default by one of the parties. With respect to the credit risk of customers, Braskem protects itself by performing a rigorous analysis before granting credit and obtaining secured and unsecured guarantees when considered necessary. The maximum exposure to credit risk of non-derivative financial instruments on the reporting date is the sum of their carrying amounts less any provisions for impairment losses. On December 31, 2013, the balance of trade accounts receivable was net of allowance for doubtful accounts of R$282,753 (2012 - R$256,884) (Note 8).
4.3 Liquidity risk
Braskem has a calculation methodology to determine operating cash and minimum cash for the purpose of, respectively: (i) ensuring the liquidity needed to comply with obligations of the following month; and (ii) ensuring that the Company maintains liquidity during potential crises. These amounts are calculated based on the projected operating cash generation, less short-term debts, working capital needs and other items. Some of Braskem’s borrowing agreements had financial covenants that linked net debt and the payment of interest to its consolidated EBITDA (earnings before interest, tax, depreciation and amortization) (Note 18), which were monitored on a quarterly basis by the Company’s Management. These agreements were settled in the third quarter of 2012 and the Company no longer holds commitments of this nature. Additionally, Braskem has three revolving credit lines that may be used without restrictions in the amounts of: (i) US$350 million for a period of 4 years as from November 2012; and (ii) US$250 million for a period of 5 years as from August 2011; and (iii) R$450 million for a period of 3 years as from December 2012. These credit facilities enable Braskem to reduce the amount of cash it holds. As of December 31, 2013, none of these credit lines had been used. The table below shows Braskem’s financial liabilities by maturity, corresponding to the period remaining between the balance sheet date and the contractual maturity date. These amounts are calculated from undiscounted cash flows and may not be reconciled with the balance sheet.

Braskem S.A. Notes to the financial statements Years ended December 31 All amounts in thousands of reais
39
(i) Refers to amounts payable to non-controlling shareholders of Braskem Idesa and amounts payable to BNDES Participações S.A.,
as part of the business combination with Quattor, in the amounts of R$370,420 and R$275,742, respectively.
4.4 Capital Management
The ideal capital structure, according to Braskem’s Management, considers the balance between own capital and the sum of all payables less the amount of cash and cash equivalents and investments. This composition meets the Company’s objectives of perpetuity and of offering an adequate return to shareholders and other stakeholders. This structure also permits borrowing costs to remain at adequate levels to maximize shareholder remuneration. Due to the impact of the U.S. dollar on the Company’s operations, the Management of Braskem believes that the own capital used for capital Management purposes should be measured in this currency and on a historical basis. Moreover, the Company may temporarily maintain a capital structure that is different from this ideal. This occurs, for example, during periods of growth, when the Company may finance a large portion of its projects through borrowings, provided that this option maximizes return for shareholders once the financed projects start operating. In order to adjust and maintain the capital structure, the Management of Braskem may also consider the sale of non-strategic assets, the issue of new shares or even adjustments to dividend payments. As is also the case of liquidity, capital is not managed at the Parent Company level, but rather at the consolidated level.
5 Discontinued operations In the last quarter of 2012, the Management of the Company divested its interests in the capital of Cetrel and Braskem Distribuidora. The accounting practices used to recognize and measure these transactions are described in Note 2.9. • Cetrel Braskem held 54.2% of the total and voting capital of Cetrel, whose activities include effluent treatment, industrial waste Management, air and water monitoring, laboratory services and environmental consulting services. This investment was sold, on December 28, 2012, to Odebrecht Ambiental (Note 1(b.xiv)) for R$208,100. The sale price defined by the parties was confirmed by a specialized company contracted for this purpose, which issued a favorable fairness opinion regarding the price. The amount was fully received in 2013. With this sale, Braskem recognized a gain of R$48,827 in 2012.
ConsolidatedUntil Between one and Between two and More than
one year two years five years five years TotalFinancial liabilities
Trade payables 10,421,687 - - - 10,421,687 Borrowings 1,291,993 3,896,070 3,875,378 20,445,519 29,508,960 Project finance 29,317 106,888 720,944 6,588,359 7,445,508 Derivatives 95,123 (68,128) 464,168 - 491,163 Other payables (i) - 133,416 142,326 370,420 646,162
At December 31, 2013 11,838,120 4,068,246 5,202,816 27,404,298 48,513,480

Braskem S.A. Notes to the financial statements Years ended December 31 All amounts in thousands of reais
40
The results of Cetrel for 2012 and the gain from its divestment are presented in the line “profit or loss from discontinued operations” in the consolidated statements of operations and detailed in item (a) of this Note. The operating profit or loss of Cetrel was presented under segment information as “Other segments” (Note 36). • Braskem Distribuidora Braskem held 100% of the capital of Braskem Distribuidora, whose business activities include the production of demineralized, clear drinking water and managing the fire water reservoir. This investment was sold on December 28, 2012 to Odebrecht Ambiental for R$444,000. The sale price defined by the parties was confirmed by a specialized company, which issued a favorable fairness opinion regarding the price. The amount was fully received in 2013. With this sale, Braskem recognized a gain of R$359,892 in 2012. The results of Braskem Distribuidora for 2012 and the gain from its divestment are presented in the line “profit or loss from discontinued operations” in the consolidated statements of operations and detailed in item (a) of this Notes. The operating results of Braskem Distribuidora were presented in the segment information as “Other segments” (Note 36).

Braskem S.A. Notes to the financial statements Years ended December 31 All amounts in thousands of reais
41
(a) Gains or losses from discontinued operations Consolidated statements of discontinued operations.
This information is presented after eliminating the operations between companies in the group.
Note 20122.1.1(b) Revised
Net sales revenue 0 81,703 Cost of products sold 0 (48,660)
Gross profit 0 33,043 0
Selling, General and administrative expenses 0 (30,592) Other operating income, net 0 5,209
0Operating loss 0 7,660
0Financial results 0 8,481 Gain on sale of equity investments 0 408,719
0Profit before income tax and social contribution 0 424,860
0Current and deferred income tax and social contribution 0 (143,313)
0Discontinued operations results 0 281,547

Braskem S.A. Notes to the financial statements Years ended December 31 All amounts in thousands of reais
42
(b) Cash flow statements from discontinued operations Consolidated cash flow statements from discontinued operations.
Note 20122.1.1(b) Revised
Profit before income tax and social contribution 424,860
Adjustments for reconciliation of profitDepreciation, amortization and depletion 10,644 Interest and monetary and exchange variations, net 2,964 Gain on sale of equity investments (408,719) Other adjustments 1,276
31,025
Changes in operating working capital 2,642
Net cash generated by operating activities 33,667
Acquisitions to property, plant and equipment (33,883) Acquisitions of intangible assets (732)
Net cash used in investing activities (34,615)
Short-term and long-term debtPayment of borrowings (19,423) Non-controlling interests in subsidiaries 9,930
Net cash used in financing activities (9,493)
Increase in cash and cash equivalents (10,441)
Represented byCash and cash equivalents at the beginning of the period 141,804 Cash and cash equivalents at the end of the period 131,363
Decrease in cash and cash equivalents (10,441)

Braskem S.A. Notes to the financial statements Years ended December 31 All amounts in thousands of reais
43
(c) Statement of value added for discontinued operations Consolidated statements of value added from discontinued operations.
Note 20122.1.1(b) Revised
Revenue 409,246 Other revenue, net 409,246
Inputs acquired from third parties (208) Cost of products, goods and services sold (167) Material, energy, outsourced services and others (41)
Gross value added 409,038
Depreciation, amortization and depletion (2,019)
Net value added produced by the entity 407,019
Value added received in transfer 13,511 Non-controlling interests in subsidiaries 11,628 Financial income 84 Other 1,799
Total value added to distribute 420,530
Taxes, fees and contributions 138,980 Federal 138,965 Municipal 15
Remuneration on third parties' capital 3 Financial expenses (including exchange variation) 3
Remuneration on own capital 281,547 Result from discontinued operations 281,547
Value added distributed 420,530

Braskem S.A. Notes to the financial statements Years ended December 31 All amounts in thousands of reais
44
6 Cash and cash equivalents
(i) The amount of R$656,427 corresponds to cash and bank balance and R$153,448 corresponds to cash equivalents abroad of
Braskem Idesa, available for its use on the project. Investments in Brazil are mainly represented by fixed-income instruments and time deposits held by the exclusive FIM Sol fund. Investments abroad mainly comprise fixed–income instruments issued by first-class financial institutions (time deposit) with high market liquidity.
7 Financial investments
(i) On December 31, 2013, the Parent Company held junior subordinated shares issued by receivables-backed investment funds. These
shares are measured by their redemption value and are held until the conclusion of operations of said funds. The funds issue two other types of shares that enjoy priority in compensation over the junior subordinated shares. The risk related to the operations of these funds is limited to the value of the shares held by the Parent Company.
(ii) On December 31, 2013, Braskem Holanda had financial investments held to maturity that are irrevocably offset, by an export prepayment agreement of the Parent Company, in the amount of US$200 million, as provided for in the credit assignment agreement entered into between these two companies and Banco Bradesco (Note 18). This accounting offset was carried out in accordance with CPC 39 and IAS 32, which provide for the possibility of offsetting financial instruments when there is intent and rightfully executable right to realize an asset and settle a liability simultaneously.
2013 2012 2013 2012
Cash and banks (i) 987,824 398,142 131,210 9,332 Cash equivalents:
Domestic market 1,906,790 1,293,164 1,835,423 1,278,816 Foreign market (i) 1,441,245 1,596,316 458,445 339,780
Total 4,335,859 3,287,622 2,425,078 1,627,928
Consolidated Parent Company
2013 2012 2013 2012Held-for-trading
Investments in FIM Sol 61,670 50,803 61,670 50,803 Investments in foreign currency 3,773 5,256 3,773 5,256 Shares 1,170 3,023 1,170 3,023
Loans and receivablesInvestments in FIM Sol - 77,469 - 77,469 Investments in local currency - 513 - 513
Held-to-maturity(i) 40,696 52,559 40,696 52,559
Restricted deposits - 1,281 - - Time deposit investment 189 15,731 - - Investments in foreign currency (ii) 469,376 307,639 - - Compensation of investments in foreign currency (ii) (469,376) (307,639) - -
Total 107,498 206,635 107,309 189,623
In current assets 86,719 172,146 86,535 155,535 In non-current assets 20,779 34,489 20,774 34,088 Total 107,498 206,635 107,309 189,623
Consolidated Parent Company
Quotas of investment funds in credit rights

Braskem S.A. Notes to the financial statements Years ended December 31 All amounts in thousands of reais
45
8 Trade accounts receivable
The breakdown of trade accounts receivable by maturity is as follows:
The changes in the balance of the allowance for doubtful accounts are presented below:
The Company realizes part of its trade accounts receivable through the sale of trade notes to funds that acquire receivables. These operations are not entitled to recourse, for which reason the trade notes are written-off at the moment of the operation.
2013 2012 2013 2012Consumers
Domestic market 1,578,008 1,038,673 1,203,071 790,518 Foreign market 1,577,140 1,582,433 2,872,881 1,283,605
Allowance for doubtful accounts (282,753) (256,884) (200,794) (203,922) Total 2,872,395 2,364,222 3,875,158 1,870,201
In current assets 2,810,520 2,326,480 3,814,830 1,834,491 In non-current assets 61,875 37,742 60,328 35,710 Total 2,872,395 2,364,222 3,875,158 1,870,201
Consolidated Parent Company
2013 2012 2013 2012
Accounts receivables not past due 2,650,938 2,051,353 2,283,066 1,397,535 Past due securities:
Up to 90 days 246,740 350,476 699,467 429,715 91 to 180 days 8,393 5,814 593,583 28,654 As of 180 days 249,077 213,463 499,836 218,219
3,155,148 2,621,106 4,075,952 2,074,123 Allowance for doubtful accounts (282,753) (256,884) (200,794) (203,922) Total customers portfolio 2,872,395 2,364,222 3,875,158 1,870,201
Consolidated Parent Company
2013 2012 2013 2012
Balance of provision at the beginning of the year (256,884) (253,607) (203,922) (189,071) Provision in the year (27,333) (53,255) (18,677) (30,650) Write-offs 23,250 27,374 21,805 15,799 Write-off by investment sale - 818 - - Transfers (of) to non-current assets held for sale (21,786) 21,786 -
Balance of provision at the end of the year (282,753) (256,884) (200,794) (203,922)
Consolidated Parent Company

Braskem S.A. Notes to the financial statements Years ended December 31 All amounts in thousands of reais
46
9 Inventories
Advances to suppliers and expenditures with imports in transit are mainly related to operations for the acquisition of the main raw material.
10 Related parties
The Parent Company and its subsidiaries carry out transactions among themselves and with other related parties in the ordinary course of its operations and activities. The Company believes that all the conditions set forth in the contracts with related parties meet the Company’s interests. To ensure that these contracts present terms and conditions that are as favorable to the Company as those it would enter into with any other third parties is a permanent objective of Braskem’s Management.
(a) Consolidated
(i) Amount in “dividends and interest on capital payable”. (ii) Amounts related to raw material suppliers. (iii) Amount of R$665,851 in “Property, plant and equipment” related to ongoing construction works and R$116,714 related raw material supply.
2013 2012 2013 2012
Finished goods 3,429,979 2,622,736 1,717,416 1,417,380 Raw materials, production inputs and packaging 1,113,272 1,175,451 851,448 908,298 Maintenance materials 230,822 211,517 122,848 113,118 Advances to suppliers 236,672 61,385 190,931 10,969 Imports in transit and other 139,562 30,966 82,771 28,785 Total 5,150,307 4,102,055 2,965,414 2,478,550
In current assets 5,033,593 4,102,055 2,848,700 2,478,550 In non-current assets 116,714 - 116,714 - Total 5,150,307 4,102,055 2,965,414 2,478,550
Consolidated Parent company
Balances at December 31, 2013Assets Liabilities
Current Current Trade
accounts receivable Other Total Other Total Trade payables
Receivable notes Other receivable
Loan agreements Other receivable
Jointly-controlled investmentRefinaria de Petróleo Riograndense S.A. ("RPR") - - - 150 (i) 150 - - - - 3,106
- - - 150 150 - - - - 3,106
Associated companies - Borealis Brasil S.A. ("Borealis") 11,368 187 - - 11,555 - - - - -
11,368 187 - - 11,555 - - - - -
Related companiesOdebrecht and subsidiaries 440 - 78,068 37,436 (ii) 115,944 - - 782,565 (iii) 782,565 533,498 Petrobras and subsidiaries 99,018 9,925 36,307 42,013 (ii) 187,263 67,348 66,301 - 133,649 1,833,040 Other 15,135 - - - 15,135 - - - - -
114,593 9,925 114,375 79,449 318,342 67,348 66,301 782,565 916,214 2,366,538
Total 125,961 10,112 114,375 79,599 330,047 67,348 66,301 782,565 916,214 2,369,644
Non-current
Related parties Related parties

Braskem S.A. Notes to the financial statements Years ended December 31 All amounts in thousands of reais
47
(i) Amount in “dividends and interest on capital receivable”. (ii) Amount in “other receivables” in the balance sheet.
Purchases of Cost ofraw materials, Financial production/general
Sales services and income and administrativeof products utilities (expenses) expenses
Jointly-controlled investmentRPR 18,775 39,640 - -
18,775 39,640 - -
Associated companiesBorealis 291,836 - - -
291,836 - - -
Related companies Odebrecht and subsidiaries 23,707 284,433 - - Petrobras and subsidiaries 1,369,882 15,980,040 4,525 - Other 34,014 4,625 - -
1,427,603 16,269,098 4,525 -
Post employment benefit planOdebrecht Previdência Privada ("Odeprev") - - - 19,703
- - - 19,703
Total 1,738,214 16,308,738 4,525 19,703
Income statement transactions from January to December 31, 2013
Balances at December 31, 2012Assets Liabilities
Current Current Trade
accounts receivable Other Total Total Trade payables
Receivable notes Other receivable
Loan agreements Other receivable
Jointly-controlled investmentRPR - - - 2,645 (i) 2,645 - - - -
- - - 2,645 2,645 - - - -
Associated companiesBorealis 1,017 187 - - 1,204 - - - -
1,017 187 - - 1,204 - - - -
Related companiesOdebrecht and subsidiaries - - - 652,100 (ii) 652,100 - - - 1,388 Petrobras and subsidiaries 95,462 - 13,725 - 109,187 62,822 64,805 127,627 1,505,754 Sansuy 15,640 - - - 15,640 - - - -
111,102 - 13,725 652,100 776,927 62,822 64,805 127,627 1,507,142
Total 112,119 187 13,725 654,745 780,776 62,822 64,805 127,627 1,507,142
Non-current
Related parties Related parties

Braskem S.A. Notes to the financial statements Years ended December 31 All amounts in thousands of reais
48
Purchases of Cost ofraw materials, Financial production/general
Sales services and income and administrativeof products utilities (expenses) expenses
Jointly-controlled investmentPropilsur 43 RPR 24,434 42,925 743 -
24,434 42,925 786 - Associated companies
Borealis 143,477 - - - 143,477 - - -
Related companies Odebrecht and subsidiaries - 276,193 - - Petrobras and subsidiaries 1,227,344 16,783,645 4,304 - Sansuy 27,871 11,050 - - Other 3,150 232,988 - -
1,258,365 17,303,876 4,304 - Post employment benefit plan
Odeprev - - - 24,898 - - - 24,898
Total 1,426,276 17,346,801 5,090 24,898
Income statement transactions from January to December 31, 2012

Braskem S.A. Notes to the financial statements Years ended December 31 All amounts in thousands of reais
49
(b) Parent Company
(i) Amounts in “dividends and interest on capital receivable”. (ii) Amounts related raw material supply. (iii) Amounts in “cash and cash equivalents”: R$1,334,653 and in “financial investments": R$61,670. (iv) Amount of R$20,000 in “property, plant and equipment”, related to ongoing construction works, and R$116,714 related raw material supply.
Balances at December 31, 2013Assets
Current
Trade accounts receivable Other Total Other Total
Receivable notes Other receivable Current accounts
Loan agreements Other receivable
SubsidiariesBraskem America 47,985 - 39,287 - 87,272 - - - - - Braskem Argentina 53,415 - - - 53,415 - - - - - Braskem Chile 12,613 - - - 12,613 - - - - - Braskem Holanda 265,132 - - - 265,132 - - - - - Braskem Idesa 23,794 2,742 5,577 - 32,113 - - - - - Braskem Inc 1,759,572 - 33 - 1,759,605 - 9,104 - - 9,104 Braskem Petroquímica 39,332 - 71 66,300 (i) 105,703 - - - - - Braskem Qpar 28,905 - 23,342 - 52,247 313,417 - - - 313,417 Quantiq - - 596 11,580 (i) 12,176 - - - - - Other 2,021 263 2,103 - 4,387 1,742 67 - - 1,809
2,232,769 3,005 71,009 77,880 2,384,663 315,159 9,171 - - 324,330
Jointly-controlled investmentRPR - - - 151 (i) 151 - - - - -
- - - 151 151 - - - - -
Associated companiesBorealis 11,368 187 - - 11,555 - - - - -
11,368 187 - - 11,555 - - - - -
Related companiesOdebrecht and subsidiaries 3,651 - - 35,473 (ii) 39,124 - - - 136,714 (iv) 136,714 Petrobras and subsidiaries 99,018 9,925 16,047 28,233 (ii) 153,223 - 67,348 12,990 - - 80,338 Other 14,980 - - - 14,980 - - - - -
117,649 9,925 16,047 63,706 207,327 - 67,348 12,990 136,714 217,052
SPEFIM Sol - - - 1,396,323 (iii) 1,396,323 - - - - -
- - - 1,396,323 1,396,323 - - - - -
Total 2,361,786 13,117 87,056 1,538,060 4,000,019 315,159 76,519 12,990 136,714 541,382
Non-current
Related Parties Related Parties

Braskem S.A. Notes to the financial statements Years ended December 31 All amounts in thousands of reais
50
Current
Trade payables Borrowings Total Borrowings
- Advance to export Other payable Advance to export - - -
Subsidiaries - Braskem America 3,018 - 34,064 3,170 40,252 - 662,956 Braskem Austria - - 48,036 - 48,036 - 351,390 Braskem Holanda - - 41,090 - 41,090 - 3,874,252 Braskem Importação - - - - - - - Braskem Inc 3,863,320 248,544 - 917 4,112,781 3,720,604 - Braskem Participações - - - - - - - Braskem Petroquímica 5,625 - - 6 5,631 - - Braskem Qpar 3,692 - - 11 3,703 - - Quantiq 327 - - - 327 - - IQAG - - - - - - - Politeno Empreendimentos - - - - - - -
3,875,982 248,544 123,190 4,104 4,251,820 3,720,604
Jointly-controlled investmentRPR 256 - - - 256 - -
256 - - - 256 -
Related companies - - - - - - Odebrecht and subsidiaries 61,631 - - 335 61,966 - - Petrobras and subsidiaries 1,572,473 - - - 1,572,473 - -
1,634,104 - - 335 1,634,439 -
Total 5,510,342 248,544 123,190 4,439 5,886,515 3,720,604
Accounts payable to related parties

Braskem S.A. Notes to the financial statements Years ended December 31 All amounts in thousands of reais
51
Purchases of Cost ofraw materials, Financial production/general
Sales services and income and administrativeof products utilities (expenses) expenses
SubsidiariesBraskem America 10,587 - (128,204) # - Braskem Argentina 187,316 - 12,424 # - Braskem Austria - - (77,554) - Braskem Chile 31,804 - 1,456 # - Braskem Holanda 436,576 - (579,645) # - Braskem Idesa 58,950 - 48,874 # - Braskem Inc 2,018,463 1,802,855 (1,009,651) # - Braskem Petroquímica 481,106 242,168 - # - Braskem Qpar 183,902 347,409 - # - Quantiq 140,070 10,129 - # - Other - - 12 -
3,548,774 2,402,561 (1,732,288) -
Jointly-controlled investmentRPR 17,680 5,660 - -
17,680 5,660 - -
Associated companiesBorealis 266,716 - - -
266,716 - - -
Related companiesOdebrecht and subsidiaries 23,707 281,218 - - Petrobras and subsidiaries 930,354 10,963,823 4,525 - Other 33,995 4,625 - -
988,056 11,249,666 4,525 -
Post-employment benefit planOdeprev - - - 15,321
- - - 15,321
Total 4,821,226 13,657,887 (1,727,763) 15,321
Income statement transactions from January to December 31, 2013

Braskem S.A. Notes to the financial statements Years ended December 31 All amounts in thousands of reais
52
(i) Amounts in "dividends and interest on capital receivable". (ii) Amount in "other accounts receivable" in the balance sheet. (iii) Amount in “cash and cash equivalents”: R$954,919 and in “financial investments": R$128,271.
Balances at December 31, 2012Assets
Current
Trade accounts
receivable Other Total TotalReceivable
notes Other receivableCurrent accounts
Loan agreements Other receivable
SubsidiariesBraskem America 20,295 4,011 - - 24,306 - - - - Braskem Argentina 95,273 - 20 - 95,293 - - - - Braskem Chile 429 - - - 429 - - - - Braskem Holanda 7,588 168 39 - 7,795 - - - - Braskem Idesa - 3,026 - - 3,026 - - - - Braskem Inc 478,182 - - - 478,182 - 7,584 - 7,584 Braskem Participações - 96 - - 96 1,611 - - 1,611 Braskem Petroquímica 5,939 - - 34,000 (i) 39,939 54,085 - - 54,085 Braskem Qpar 1,138 - 196 - 1,334 849,437 - - 849,437 Quantiq 610 - - - 610 - - - Lantana - - - - - - 57 - 57 Riopol 5,066 - 50 93,500 (i) 98,616 - - - -
614,520 7,301 305 127,500 749,626 905,133 7,641 - 912,774
Jointly-controlled investmentRPR - - - 2,645 (i) 2,645 - - - -
- - - 2,645 2,645 - - - -
Associated companies - Borealis 252 187 - - 439 - - - -
252 187 - - 439 - - - - -
Related companies - Odebrecht and subsidiaries - - - 652,148 (ii) 652,148 - - - - Petrobras and subsidiaries 85,566 - 6,113 - 91,679 - 62,822 12,993 75,815 Sansuy 15,609 - - - 15,609 - - - -
101,175 - 6,113 652,148 759,436 - 62,822 12,993 75,815
SPEFIM Sol - - - 1,083,190 (iii) 1,083,190 - - -
- - - 1,083,190 1,083,190 - - - -
Total 715,947 7,488 6,418 1,865,483 2,595,336 905,133 70,463 12,993 988,589
Non-current
Related Parties Related Parties

Braskem S.A. Notes to the financial statements Years ended December 31 All amounts in thousands of reais
53
(i) Amounts in “liabilities related to non-current assets held for sale”. (ii) Amount in “current accounts”. (iii) Amount in “trade notes payable”.
Balances at December 31, 2012Liabilities
Current Non-Current
Trade payablesAdvances from
customers Borrowings Outros Total Borrowings Outros Total
- - Advance to export Other payable Advance to export Other payable - - - -
Subsidiaries - - Braskem America - # - # - # 181,639 # 170 # - - 181,809 # - # 408,700 # - - - - 408,700 Braskem Holanda - # 80 # - # 24,382 # - # - - 24,462 # - # 2,521,323 # - - - - 2,521,323 Braskem Importação - # - # - # - # - # - - - # - # - # 113 - - - 113 Braskem Inc 2,677,575 # - # 53,406 # - # 800 # - - 2,731,781 # 3,245,562 # - # 86,181 (ii) - - 3,331,743 Braskem Petroquímica 863 # - # - # - # - # - - 863 # - # - # - - - - - Braskem Qpar 40 # - # - # - # - # - - 40 # - # - # - - - - - Quantiq - - - - - 1,954 (i) 1,954 - - - 81,418 (i) 81,418 IQAG - - - - - - - - - 1,235 (i) 1,235 Politeno Empreendimentos - # - # - # - # - # - - - # - # - # 15 - - - 15 Riopol 954 # - # - # - # - # - - 954 # - # - # 651,422 (iii) - - 651,422
2,679,432 80 53,406 206,021 970 1,954 2,941,863 3,245,562 2,930,023 737,731 82,653 6,995,969
Related companiesOdebrecht and subsidiaries 1,388 # - - # - # - # - - 1,388 - - - - - - - Petrobras and subsidiaries 1,193,461 # - - # - # - # - - 1,193,461 - - - - - - -
1,194,849 - - - - - 1,194,849 - - - - -
Total 3,874,281 80 53,406 206,021 970 1,954 4,136,712 3,245,562 2,930,023 737,731 82,653 6,995,969
Accounts payable to related parties Accounts payable to related parties

Braskem S.A. Notes to the financial statements Years ended December 31 All amounts in thousands of reais
54
As provided for in the Company’s bylaws, the Board of Directors has the exclusive power to decide on any contract but those related to the supply of raw materials that exceed R$ 5,000 per operation or R$ 15,000 altogether per year. This provision encompasses contracts between the Parent Company and its subsidiaries and any of its common shareholders, directors of the Company, its parent company or subsidiary or its respective related parties. Additionally, the Company has a Finance and Investment Committee that, among other things, monitors the contracts with related parties that are approved by the Board of Directors.
Pursuant to Brazilian Corporation Law, officers and directors are prohibited from: (i) performing any acts of freedom with the use of the Company’s assets and in its detriment; (ii) intervening in any operations in which these officers and directors have a conflict of interest with the Company or in resolutions in which they participate; and (iii) receiving, based on their position, any type of personal advantage from third parties, directly or indirectly, without an authorization granted by the competent body.
Purchases of Cost ofraw materials, Financial production/general
Sales services and income and administrativeof products utilities (expenses) expenses
SubsidiariesBraskem America 13,356 # - (15,722) - Braskem Argentina 173,400 # - 2,058 - Braskem Chile 23,377 # - 113 - Braskem Finance - # - 1 - Braskem Holanda 444,607 # - (410,883) - Braskem Idesa - # - 108 - Braskem Inc 473,398 # 2,032,821 (593,624) - Braskem Petroquímica 344,950 # 218,279 (1) - Braskem Qpar 29,501 # 99,532 (22,822) - Ideom 2 # 5,500 - - Lantana - # - 5 - Riopol 157,483 # 103,846 - -
1,833,873 2,471,114 (1,040,767) -
Jointly-controlled investmentPolimerica - # - 28 Propilsur - # - 43 RPR 22,509 # 1,482 743 -
22,509 1,482 814 -
Associated companiesBorealis 125,107 # - - -
125,107 - - -
Related companiesOdebrecht and subsidiaries - 273,395 - - Petrobras and subsidiaries 763,842 10,366,807 4,653 - Sansuy 27,841 # 11,050 - - Other 3,150 # 231,385 - -
794,833 10,882,637 4,653 - Post employment benefit planOdeprev - - - 20,382
- - - 20,382
Total 2,776,322 13,355,233 (1,035,300) 20,382
Income statement transactions from January to December 31, 2012

Braskem S.A. Notes to the financial statements Years ended December 31 All amounts in thousands of reais
55
The related parties have the following relationship with the Company: • Cetrel: subsidiary of Odebrecht • CNO: subsidiary of Odebrecht • Odebrecht Ambiental: subsidiary of Odebrecht • OCS: subsidiary of Odebrecht • Petrobras: shareholder of Braskem • Petrobras Global Trading BV: subsidiary of Petrobras • Refap: merged by Petrobras The transactions with related parties, except wholly-owned subsidiaries of the Company, are summarized below:
• Cetrel:
(i) In November 2012, an agreement was executed for the acquisition of reuse water by plants installed in the Camaçari Petrochemical Complex for a period of 15 years and with an estimated value of R$120 million;
(ii) In August 2010, an agreement was executed for the treatment of the effluents discharged by the plants
located in the Camaçari Petrochemical Complex for a period of 4 years and with a total maximum value of R$60 million.
• CNO:
(i) Braskem – In February 2007, an agreement was executed, with the objective of performing services in the shutdowns for maintenance and inspection in the industrial units. This agreement is valid through February, 15 2014 and provides for a different price for each type of activity carried out by CNO;
(ii) Braskem Idesa – In September 2012, an agreement was executed, for the engineering, procurement and construction services of the Ethylene XXI Project. The contract has an estimated value of US$3 billion and duration through 2015.
• Odebrecht Ambiental:
In September 2009, the Company entered into an agreement for the acquisition of reuse water with Aquapolo (a special purpose entity formed by Odebrecht Ambiental and the water utility Company of Basic Sanitation of São Paulo State (“SABESP”) for the production of industrial reuse water) by the plants located in the SP Petrochemical Complex. The agreement is valid through 2053 and has an estimated annual value of R$65 million.
• Petrobras:
(i) Naphtha
The Parent Company and the subsidiary Braskem Qpar have agreements for the supply of naphtha with Petrobras. The agreements provide for the supply of naphtha to the basic petrochemicals plants located in the Triunfo, Camaçari and SP Petrochemical Complexes. The agreed-upon price of the naphtha is based on several factors, such as the market price of the naphtha itself and a number of oil

Braskem S.A. Notes to the financial statements Years ended December 31 All amounts in thousands of reais
56
byproducts, the volatility of the prices of these products in the international markets, the Brazilian real - U.S. dollar exchange rate and the concentration of paraffinic content and contaminants present in the naphtha delivered. The agreement provides for a minimum consumption of 3,800,000 tons a year and a maximum consumption of 7,019,600 tons a year. The subsidiary of Petrobras, Petrobras Global Trading BV, also supplies naphtha to the Company and its subsidiaries.
(ii) Propylene
Braskem has propylene supply agreements with Petrobras through its refineries for the Company’s plants located in the Petrochemical Complexes of Triunfo, RJ and SP. These agreements provide for the full supply of approximately 910,000 tons of propylene a year. The contracted propylene price is based on various international references linked to the most important markets for propylene and polypropylene, particularly the U.S., European and Asian markets.
(iii) Ethane, propane, light refinery hydrocarbons (“HLR”) and electricity
The subsidiary Riopol has an agreement with Petrobras for the supply of 392,500 metric tons of ethane a year, 392,500 tons of propane a year, 438,0 N/M3 of HLR a year and 306.6 GWh of electricity a year.
(iv) Fuel oil
Braskem has an agreement with BR Distribuidora, a subsidiary of Petrobras, to supply fuel oil to its unit in the Camaçari Petrochemical Complex.
(v) Sale of various products
The Company supplies to Petrobras and its subsidiaries many products it manufactures, such as solvents, automotive gasoline, butadiene, paraxylene, benzene, toluene, etc. These supplies are not covered by an agreement and take place on a regular basis at market prices.
• OCS: The Company entered into a risk and insurance Management agreement with OCS, amounting to approximately R$3.6 million, which may be renewed for another year.

Braskem S.A. Notes to the financial statements Years ended December 31 All amounts in thousands of reais
57
(b) Key management personnel The Company considers “Key management personnel” to be the members of the Board of Directors and the Executive Board, composed of the CEO and vice-presidents. Not all the members of the Executive Board are members of the statutory board.
11 Taxes recoverable
Parent company and ConsolidatedNon-current liabilities 2013 2012
Long-term incentives 2,333 2,897 Total 2,333 2,897
Income statement transactions 2013 2012Remuneration
Short-term benefits to employees and managers 35,380 35,026 Post-employment benefit 275 214 Long-term incentives 15 565 Total 35,670 35,805
Parent company and Consolidated
2013 2012 2013 2012
Parent Company and subsidiaries in BrazilIPI 0 28,701 32,734 26,307 31,647
(a) 738,282 845,045 410,004 447,086 ICMS - credits from PP&E 0 123,354 178,920 93,018 108,910
(b) 719,448 484,692 650,355 419,170 PIS and COFINS - credits from PP&E 0 269,006 273,693 134,161 147,764 PIS and COFINS - Law 9,718/98 (c) 24,207 171,140 22,602 158,570 PIS - Decree-Law 2,445 and 2,449/88 (d) 88,339 104,256 65,801 70,856 Income tax and social contribution (IR and CSL) (e) 542,686 452,867 395,214 323,924 REINTEGRA program (f) 267,049 217,775 232,507 194,694 Other 0 155,965 150,980 116,640 129,612
0 - - - - Foreign subsidiaries 0 - - - -
Value-added tax (g) 563,650 90,301 - - Income tax 0 2,516 942 - -
Total 0 3,523,203 3,003,345 2,146,609 2,032,233 0
Current assets 0 2,237,213 1,476,211 1,246,858 1,005,842 Non-current assets 0 1,285,990 1,527,134 899,751 1,026,391 Total 0 3,523,203 3,003,345 2,146,609 2,032,233
Consolidated Parent company
Value-added tax on sales and services (ICMS) - normal operations
Social integration program (PIS) and social contribution on revenue (COFINS) - normal

Braskem S.A. Notes to the financial statements Years ended December 31 All amounts in thousands of reais
58
(a) ICMS – normal operations The Company has accumulated ICMS credits over the past few years arising mainly from domestic sales subject to deferred taxation and export sales. This accumulation of tax credits was more evident in the states of BA, RS and SP where most production units are concentrated. The Company’s Management has been prioritizing a series of actions so as to maximize the use of these credits and, currently, it does not expect losses on their realization. Among the actions carried out by Management are: • Agreement with the Government of RS, maintaining the full deferral of ICMS on the imports, reduction in
the ICMS tax levied on domestic operations with naphtha and limiting the use of accumulated ICMS credits to R$ 8,500 per month for offsetting monthly ICMS payable by the units in that state;
• Maintenance of the Agreement with the Government of BA, which ensures the effective enforcement of State Decree No. 11,807 of October 27, 2009, which (i) full deferral of the ICMS tax on domestic and imported naphtha acquired in that state and; (ii) capped at R$9,100 per month the use of cumulative ICMS tax credits that can be deducted from the debt balance between April 2011 and March 2014, and the amount of R$ 5,907 per month between April 2014 and March 2018; and
• In SP, Decree 59,232/13 allowed deferral of the ICMS tax on naphtha, propylene and ethylene produced in
Brazil or imported, acquired in this state, which enabled Braskem to use the accumulated ICMS credits.
(b) PIS and COFINS The Company has PIS and COFINS tax credits arising materially from the internal outflows promoted by the deferment of taxes and sales destined to foreign markets and those related to the acquisition of property, plant and equipment. The realization of these credits occurs in two ways: (i) offset of overdue or falling due liabilities related to taxes levied by the Federal Revenue Service; or (ii) cash reimbursement.
(c) PIS and COFINS – Law 9,718/98 This account contains credits arising from legal discussions on the constitutionality of some aspects of Law No. 9,718/98. These credits are used to offset the federal taxes payable and have been restated by the basic interest rate (Selic). In 2013, Braskem offset the amount of R$144,184 (2012 - R$15,729 ).
(d) PIS – Decree-Laws 2,445 and 2,449/88 This item includes credits arising from decisions in lawsuits that challenged the constitutionality of Decree Laws No. 2,445 and No. 2,449/88. In 2013, Braskem offset the amount of R$13,311 (2012 - R$90,561)
(e) Income tax and social contribution This account contains IR and CSL credits arising from prepayments in years that did not present taxable income at year end in addition to the taxes withheld on financial investments and restatements by the Selic basic interest rate. These credits will be realized by offsetting other federal taxes and witholdings payable.

Braskem S.A. Notes to the financial statements Years ended December 31 All amounts in thousands of reais
59
(f) REINTEGRA Program The REINTEGRA program aims to refund to exporters the federal taxes levied on the production chain for goods sold abroad. The amount to be refunded is equivalent to 3% of all export revenue and such credits may be made in two ways: (i) by offsetting own debits overdue or undue related to taxes levied by the Federal Revenue Service; or (ii) by a cash reimbursement. In accordance with Provisional Presidential Decree (“PPD”) 601, the program was valid until December 31, 2013. In the fiscal year ended December 31, 2013, the Company recognized credits in the amount of R$229,742 (2012 - R$228,052) (Note 11) and offset the amount of R$180,468 (2012 - R$28,201).
(g) Value added tax – subsidiaries abroad On December 31, 2013, this line included:
(i) R$16,111 from sales by Braskem Alemanha to other countries. These credits are reimbursed in cash by the local government; and
(ii) R$541,904 from purchases of machinery and equipment for the Ethylene XXI project (Note 16). These
credits will be reimbursed in cash by the local government after validating the credits according to established tax procedures.
12 Judicial deposits – non-current assets
As of December 31, 2013, a portion of the deposits is associated with legal proceedings for which the probability of loss is possible (Note 23) and a portion is associated with proceedings for which the probability of loss is remote. In addition, on December 31, 2013, the Company maintains escrow deposits amounting to R$54,793 (2012 - R$44,163) related to legal proceedings for which the chance of loss was deemed as probable. Such deposits are offset by their respective provisions.
13 Insurance claims On December 31, 2013, this item under current and non-current was as follows: (i) R$119,937 related to damages receivable from losses that occurred in the furnaces, electric system and
equipment of the Basic Petrochemicals unit of the Camaçari Complex (BA);
2013 2012 2013 2012Judicial deposits
Tax contingencies 137,631 101,499 134,103 95,816 Labor and social security contingencies 62,621 73,177 50,637 63,712 Other 9,658 4,942 9,657 4,915
Total 209,910 179,618 194,397 164,443
Consolidated Parent company

Braskem S.A. Notes to the financial statements Years ended December 31 All amounts in thousands of reais
60
(ii) R$37,823 related to damages receivable from losses at the Chlor-Alkali and PVC plants in the state of AL. In 2013, the Company received R$178,190, mainly relating to the losses at UNIB BA in December 2010 and February 2011.
14 Other accounts receivable (consolidated)
(a) Current The main balances forming this line under current assets are: (i) R$95,149 in advances to service suppliers (2012 - R$91,090); (ii) R$34,101 from operations for hedge accounting (Note 20.2.1(b)); and (iii) During fiscal year 2013, Braskem received from Odebrecht Ambiental the amount of R$689,868 related to
the divestment of the interests in Cetrel and Braskem Distribuidora.
(b) Non-current The main balances under this item in non-current assets are: (i) Eletrobras compulsory loans The compulsory loan created to benefit Eletrobras was instituted by Law 4,156/62 with the objective of financing the power industry. The amounts owed were charged monthly on the electricity bills of companies that surpassed a certain level of consumption. This compulsory loan was in force between 1962 and 1993. Between 2001 and 2003, the merged companies Trikem S.A., Copesul – Companhia Petroquímica do Sul S.A. (“Copesul”), Companhia Alagoas Industrial – Cinal (“Cinal”) and the subsidiaries Alclor Química de Alagoas Ltda. (“Alclor”) and Braskem Petroquímica filed lawsuits claiming credits arising from amounts unduly paid to Eletrobras as compulsory loan, interest and monetary adjustment. The Superior Court of Justice (STJ) appeased the matter in favor of the taxpayers upon the judgment of RESP No. 1003955 and RESP No. 1028592 made after repetitive appeals under Article 543-C of the Civil Procedure Code, establishing this decision to all cases that address this matter. Meanwhile, through the judgment of the Interlocutory Appeal No. 735933 lodged by Eletrobras, the Federal Supreme Court (STF) consolidated the understanding of the STJ in the sense that the discussion over the matter relates to ordinary law. In 2011, the lawsuits of Trikem S.A. and Braskem Petroquímica received final and unappealable decisions by the STJ, which exhausted the option of appealing these decisions. Accordingly, based on the opinion of its external legal advisors, the Company recognized in 2011 the corresponding credits, which, as per its understanding, are uncontested, amounting to R$51,000 and R$29,000, respectively, for the lawsuits of Trikem and Braskem Petroquímica. In 2012, the Company received the amount of R$21,932 related to part of the credits of the Braskem Petroquímica lawsuit. In 2012, the lawsuits of Copesul and Cinal also received final and unappealable decisions by the STJ. In 2013, the Alclor case received the final and unappealable judgment. Th amount for 2013of deemed uncontestable in relation to the companies Copesul, Cinal and Alclor, which totaled R$13,339.

Braskem S.A. Notes to the financial statements Years ended December 31 All amounts in thousands of reais
61
The amounts recorded correspond to 60% of the total claimed and the legal counsels assess as probable the chance of obtaining a favorable outcome for receiving the remaining 40%. On December 31, 2013, the balance of this account is R$71,895 (2012 – R$71,895). (ii) R$137,345, from operations to hedge accounting (Note 20.2.1(b).
15 Investments
(a) Information on investments
(i) Company merged into Braskem Qpar in September 2013. (ii) Shares acquired in July 2013 (Note 1(b.xviii)).
Note Direct Direct and Indirect 2013 2012 2013 20122.1.1(a) Revised Revised
Subsidiaries 0Braskem Alemanha 0 5.66 100.00 0 (35,123) (21,739) 1,056,093 961,450 Braskem America 0 - 100.00 0 14,731 313,839 940,124 810,315 Braskem America Finance 0 - 100.00 0 342 1,221 1,448 (4,206) Braskem Argentina 0 96.77 100.00 0 3,529 3,385 11,379 7,850 Braskem Austria 0 100.00 100.00 0 (3,536) - (4,097) 81 Braskem Austria Finance 0 - 100.00 0 (18) - 25 47 Braskem Chile 0 99.02 100.00 0 81 239 1,863 1,782 Braskem Espanha 0 - 100.00 0 (17) - (9) 8 Braskem Holanda 0 100.00 100.00 0 24,120 (35,227) 1,333,390 1,188,368 Braskem Finance 0 100.00 100.00 0 (27,129) (26,439) (144,558) (117,429) Braskem Idesa 0 75.00 75.00 0 (10,700) (19,131) 548,465 351,249 Braskem Idesa Serviços 0 - 75.00 0 2,032 422 5,138 2,726 Braskem Importação 0 0.04 100.00 0 (3) (1) 201 203 Braskem Inc. 0 100.00 100.00 0 (152,332) 113,839 153,021 301,829 Braskem México 0 99.97 100.00 0 (5,076) (2,682) 271,654 - Braskem Participações 0 100.00 100.00 0 1,664 (3,171) (558) (1,945) Braskem Petroquímica 0 100.00 100.00 0 132,256 71,417 1,647,845 1,593,973 Braskem Qpar 0 98.61 100.00 0 189,702 (185,967) 5,601,077 2,536,089 Common 0 0 100.00 0 (73,623) 643 (12) 7,550 DAT 0 100.00 100.00 37,681 IQAG 0 0.12 100.00 3,241 1,750 7,184 3,942 Lantana 0 - 100.00 (84) (88,816) (592) (544) Norfolk 0 - 100.00 (64,240) 8,074 (103) 70,069 Petroquímica Chile 0 97.96 100.00 (1,536) (173) 4,999 6,535 Politeno Empreendimentos 0 99.98 100.00 (9) 576 598 607 Quantiq 0 99.90 100.00 15,738 31,440 243,584 249,383 Riopol (i) - - - 235,965 - 2,632,337
0 - - - - - - Jointly-controlled investment 0 - - - - - -
RPR 0 33.20 33.20 1,871 24,335 124,980 128,591 OCE (ii) 20.00 20.00 402 - 689 - Propilsur 0 49.00 49.00 (4,445) (556) 109,300 109,695
0 - - - - - - Associates 0 - - - - - -
Borealis 0 20.00 20.00 5,492 16,102 166,746 165,459 Companhia de Desenvolvimento 0 - - - - - -
Rio Verde ("Codeverde") 0 35.97 35.97 (596) (596) 46,342 46,342
total (% ) - 2013 for the period equityInterest in total capital Adjusted net profit (loss) Adjusted
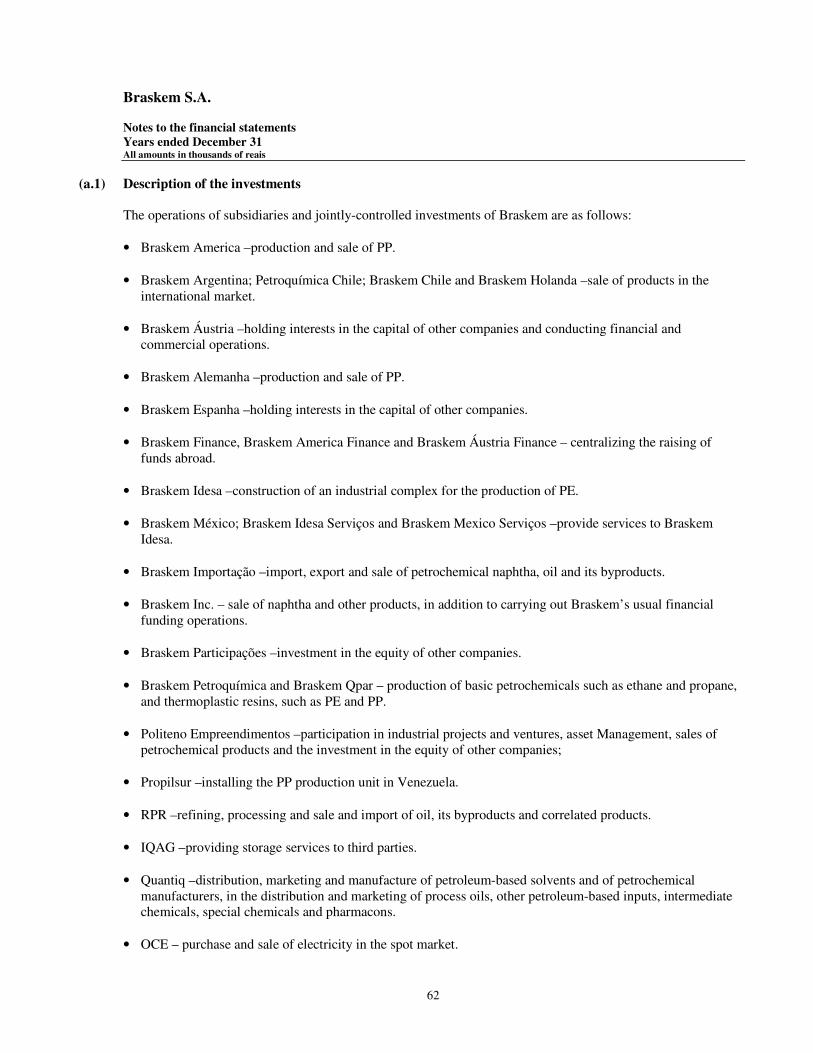
Braskem S.A. Notes to the financial statements Years ended December 31 All amounts in thousands of reais
62
(a.1) Description of the investments The operations of subsidiaries and jointly-controlled investments of Braskem are as follows: • Braskem America –production and sale of PP.
• Braskem Argentina; Petroquímica Chile; Braskem Chile and Braskem Holanda –sale of products in the
international market. • Braskem Áustria –holding interests in the capital of other companies and conducting financial and
commercial operations. • Braskem Alemanha –production and sale of PP. • Braskem Espanha –holding interests in the capital of other companies.
• Braskem Finance, Braskem America Finance and Braskem Áustria Finance – centralizing the raising of
funds abroad. • Braskem Idesa –construction of an industrial complex for the production of PE. • Braskem México; Braskem Idesa Serviços and Braskem Mexico Serviços –provide services to Braskem
Idesa. • Braskem Importação –import, export and sale of petrochemical naphtha, oil and its byproducts. • Braskem Inc. – sale of naphtha and other products, in addition to carrying out Braskem’s usual financial
funding operations. • Braskem Participações –investment in the equity of other companies. • Braskem Petroquímica and Braskem Qpar – production of basic petrochemicals such as ethane and propane,
and thermoplastic resins, such as PE and PP. • Politeno Empreendimentos –participation in industrial projects and ventures, asset Management, sales of
petrochemical products and the investment in the equity of other companies;
• Propilsur –installing the PP production unit in Venezuela. • RPR –refining, processing and sale and import of oil, its byproducts and correlated products. • IQAG –providing storage services to third parties. • Quantiq –distribution, marketing and manufacture of petroleum-based solvents and of petrochemical
manufacturers, in the distribution and marketing of process oils, other petroleum-based inputs, intermediate chemicals, special chemicals and pharmacons.
• OCE – purchase and sale of electricity in the spot market.

Braskem S.A. Notes to the financial statements Years ended December 31 All amounts in thousands of reais
63
(b) Changes in investments – parent company
(i) Settlement of contingencies by this subsidiary that were reflected in the Parent Company at the time of its acquisition (Note 23 (c.2)).
Dividends Equity CurrencyBalance at Acquisition Capital and interest Effect Adjustment of Goodwill Interest valuation translation Balance at
Note 2012 Merger of shares increase on equity of results profit in inventories amortization O ther Gain (loss) adjustments adjustments 2013
Subsidiaries and jointly-controlled investment 2.1.1(a) Revised
Domestic subsidiariesBraskem Petroquímica 1,452,589 - - - (78,000) 132,256 (168) (3,436) - (385) - - 1,502,856 Braskem Qpar 3,367,628 2,878,812 - - - 188,463 1,733 (97,885) 47,746 (i) (3,139) - - 6,383,358 Distribuidora de Águas Triunfo - - - 37,712 - (31) - - - - - - 37,681
Politeno Empreendimentos 607 - - - - (9) - - - - - - 598
Quantiq 253,272 - - - (21,536) 15,738 (89) - 3 - - - 247,388
Riopol 2,630,417 (2,878,812) - - - 246,474 1,921 - - - - - -
RPR 42,698 - - - - (1,428) - - 230 - - - 41,500 OCE - - 2 55 - 48 - - - 33 - - 138
7,747,211 - 2 37,767 (99,536) 581,511 3,397 (101,321) 47,979 (3,491) - - 8,213,519
Foreign subsidiaries
Braskem Alemanha 53,753 - - - - (1,988) (231) - - - 169 7,845 59,548
Braskem Argentina 7,850 - - - - 3,529 (3,872) - - - - - 7,507
Braskem Austria 81 - - - - - - - (81) - - - -
Braskem Chile 1,782 - - - - 81 - - - - - - 1,863
Braskem Holanda 1,177,221 - - - - 24,120 (249) - - - - 132,049 1,333,141
Braskem Idesa 263,437 - - 114,964 - (8,025) (405) - - (1,994) (7,141) 50,106 410,942 Braskem Inc. 301,829 - - - - (152,332) (10,172) - - 3,524 - - 142,849 Braskem México - - 1,447 260,856 - (6,800) - - - - - 16,151 271,654 Petroquímica Chile 6,535 - - - - (1,536) - - - - - - 4,999
1,812,488 - 1,447 375,820 - (142,951) (14,929) - (81) 1,530 (6,972) 206,151 2,232,503
Total subsidiaries and jointly-controlled investment 9,559,699 - 1,449 413,587 (99,536) 438,560 (11,532) (101,321) 47,898 (1,961) (6,972) 206,151 10,446,022
Associates
Domestic subsidiariesBorealis 31,945 - - - - 1,404 - - - - - - 33,349 Nitrocolor - - - 38 - - - - (38) - - - -
Total associates 31,945 - - 38 - 1,404 - - (38) - - - 33,349
Total subsidiaries, jointly-controlled investmentand associates 9,591,644 - 1,449 413,625 (99,536) 439,964 (11,532) (101,321) 47,860 (1,961) (6,972) 206,151 10,479,371
Equity in results of investees

Braskem S.A. Notes to the financial statements Years ended December 31 All amounts in thousands of reais
64
(c) Breakdown of equity accounting results
(i) Amortization of fair value adjustments comprises the following:
• R$97,885, related to the amortization of fair value adjustments on the assets and liabilities from the acquisition of Quattor. This amount is distributed in the following items of the consolidated statement of operations: “net sales revenue” of R$17,722; “cost of sales” of R$92,106; “general and administrative expenses” of R$91, and “financial results” of R$13,794. The effect of deferred income tax and social contribution was R$25,828.
• R$3,436 related to the amortization of fair value adjustments on property, plant and equipment of the subsidiary Braskem Petroquímica.
Consolidated Parent company2013 2012 2013 2012
Equity in results of subsidiaries, associate and jointly-controlled (3,223) (22,199) 428,432 410,413 Amortization of fair value adjustment - - (101,321) (i) (93,262) Provision for losses on investments - - (29,055) (28,199) Other - (3,608) 185 1,462
(3,223) (25,807) 298,241 290,414
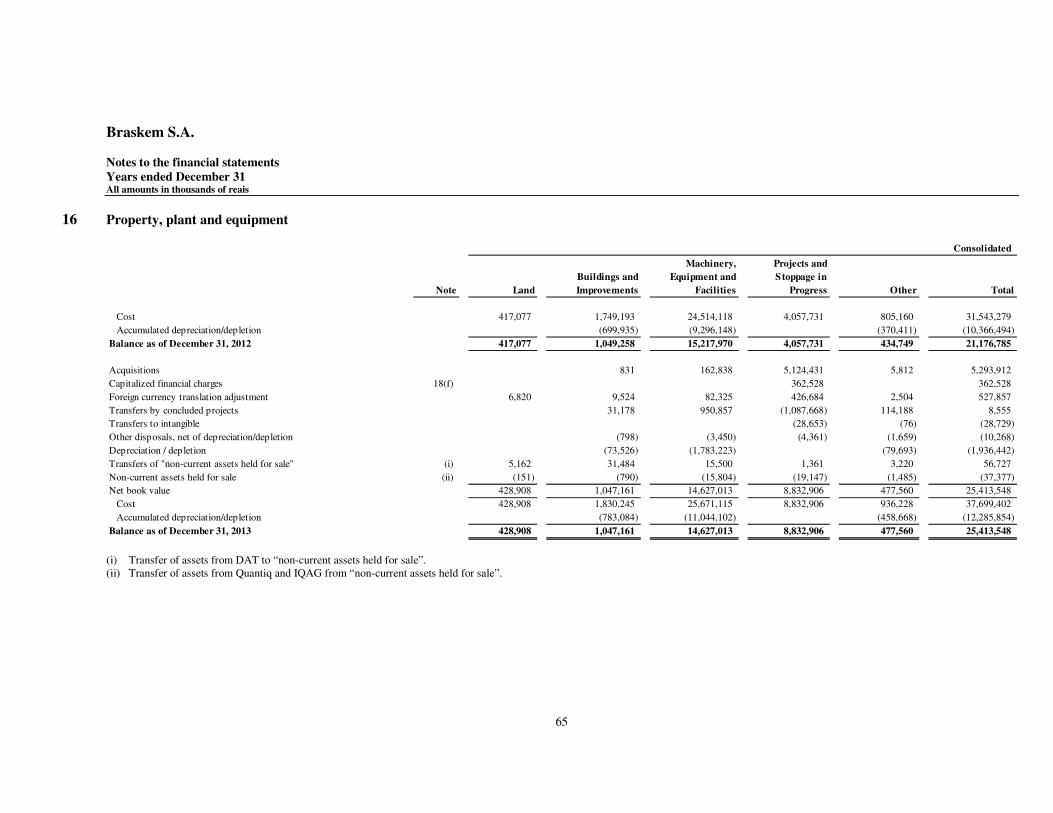
Braskem S.A. Notes to the financial statements Years ended December 31 All amounts in thousands of reais
65
16 Property, plant and equipment
(i) Transfer of assets from DAT to “non-current assets held for sale”. (ii) Transfer of assets from Quantiq and IQAG from “non-current assets held for sale”.
Note Land Buildings and Improvements
Machinery, Equipment and
Facilities
Projects and Stoppage in
Progress Other Total
Cost 417,077 1,749,193 24,514,118 4,057,731 805,160 31,543,279 Accumulated depreciation/depletion - (699,935) (9,296,148) - (370,411) (10,366,494)
Balance as of December 31, 2012 417,077 1,049,258 15,217,970 4,057,731 434,749 21,176,785
Acquisitions - 831 162,838 5,124,431 5,812 5,293,912 Capitalized financial charges 18(f) - - - 362,528 - 362,528 Foreign currency translation adjustment 6,820 9,524 82,325 426,684 2,504 527,857 Transfers by concluded projects - 31,178 950,857 (1,087,668) 114,188 8,555 Transfers to intangible - - - (28,653) (76) (28,729)Other disposals, net of depreciation/depletion - (798) (3,450) (4,361) (1,659) (10,268)Depreciation / depletion - (73,526) (1,783,223) - (79,693) (1,936,442)Transfers of "non-current assets held for sale" (i) 5,162 31,484 15,500 1,361 3,220 56,727 Non-current assets held for sale (ii) (151) (790) (15,804) (19,147) (1,485) (37,377)Net book value 428,908 1,047,161 14,627,013 8,832,906 477,560 25,413,548
Cost 428,908 1,830,245 25,671,115 8,832,906 936,228 37,699,402 Accumulated depreciation/depletion - (783,084) (11,044,102) - (458,668) (12,285,854)
Balance as of December 31, 2013 - 428,908 1,047,161 14,627,013 8,832,906 477,560 25,413,548
Consolidated

Braskem S.A. Notes to the financial statements Years ended December 31 All amounts in thousands of reais
66
Land Buildings and Improvements
Machinery, Equipment and
Facilities
Projects and Stoppage in
Progress Other Total
Cost 83,776 1,423,806 16,607,652 1,839,278 517,951 20,472,463 Accumulated depreciation/depletion - (675,177) (7,657,862) - (345,039) (8,678,078)
Balance as of December 31, 2012 83,776 748,629 8,949,790 1,839,278 172,912 11,794,385
Acquisitions - - 112,049 968,524 752 1,081,325 Capitalized financial charges - - - 64,122 - 64,122 Transfers by concluded projects - 7,220 817,965 (886,126) 60,941 - Transfers to intangible - - - 2,826 (76) 2,750 Other disposals, net of depreciation/depletion (151) (799) (1,311) - (1,453) (3,714)Depreciation / depletion - (53,066) (1,188,277) - (46,858) (1,288,201)Net book value 83,625 701,984 8,690,216 1,988,624 186,218 11,650,667
Cost 83,625 1,429,976 17,482,837 1,988,624 576,301 21,561,363
Accumulated depreciation/depletion - (727,992) (8,792,621) - (390,083) (9,910,696)Balance as of December 31, 2013 83,625 701,984 8,690,216 1,988,624 186,218 11,650,667
Parent company

Braskem S.A. Notes to the financial statements Years ended December 31, 2013 All amounts in thousands of reais
67
On December 31, 2013, the main project in progress is located in Mexico, through the subsidiary Braskem Idesa (Note 19). Braskem offered in guarantee plants, land, real estate properties and machinery and equipment to comply with the obligations assumed in financing agreements (Note 18).
(a) Impairment test for property, plant and equipment In the preparation of the Business Plan for the 2014/2018 period, the Company’s Management analyzed the prospects for the main variables that affect its activities (Note 3.6) in both domestic and international markets. In general, the Business Plan was prepared taking into consideration that no situation that may prevent the operational continuity of Braskem’s assets, both in terms of obsolescence of the industrial park and technologies employed and of legal restrictions is foreseen. Braskem’s Management believes that the plants will operate at their full capacity, or close to it, within the projected period. Also, no significant changes in the Braskem’s business are expected, such as a significant excess in the offer by other manufacturers that may negatively affect future sales, with the exception of the seasonal price and profitability increases and decreases, which are historically associated with the petrochemical business worldwide. Also, no new technologies or raw materials, which could negatively impact Braskem’s future performance, are expected. Braskem expects to continue to operate in a regulatory environment aimed at environmental preservation, which is absolutely in line with its practices. In view of all the analysis made throughout 2013, Braskem’s Management understood that there was no need to conduct an impairment test for the assets of the Foreign Business and Chemical Distribution operating segments, as well as of the CGUs UNIB-Bahia and UNIB-Southeast. Despite this conclusion, Braskem conducted an impairment test for the assets of the Polyolefins and Vinyls operating segments and CGU UNIB-South since they are associated with goodwill from future profitability (Note 17).
17 Intangible assets
(i) Transfer of assets from Quantiq and IQAG from “non-current assets held for sale”.
ParentCompany
Goodwill based on Costumers
expected future Brands Software and Suppliers profitability and Patents licenses Agreements Total Total
Cost 3,187,722 199,367 402,396 685,890 4,475,375 3,581,502 Accumulated amortization (1,128,804) (71,141) (183,908) (150,556) (1,534,409) (1,339,937)
Balance as of December 31, 2012 2,058,918 128,226 218,488 535,334 2,940,966 2,241,565
Acquisitions - - 25,608 140 25,748 24,782 Foreign currency translation adjustment - 1,394 5,365 26,469 33,228 - Transfers from PP&E - 7,813 20,916 - 28,729 (2,750)Transfers of non-current assets held for sale (i) - - 13,246 - 13,246 - Amortization - (11,035) (54,987) (63,265) (129,287) (38,271)Net book value 2,058,918 126,398 228,636 498,678 2,912,630 2,225,326
Cost 3,187,722 208,574 473,560 712,499 4,582,355 3,583,762 Accumulated amortization (1,128,804) (82,176) (244,924) (213,821) (1,669,725) (1,358,436)
Balance as of December 31, 2013 2,058,918 126,398 228,636 498,678 2,912,630 2,225,326
Average annual rates of amortization 5.80% 8.09% 7.96%
Consolidated

Braskem S.A. Notes to the financial statements Years ended December 31, 2013 All amounts in thousands of reais
68
(a) Impairment test of intangible assets with defined and undefined useful lives
The Company’s goodwill was systematically amortized until December 2008. As from 2009, it has been subject to annual impairment tests in accordance with the provisions in CPC 01 (R1) and IAS 36. On December 31, 2013, the goodwill of the Company is allocated at the CGU of UNIB-South and at the Polyolefins and Vinyls operating segments. The CGU UNIB-South belongs to the Basic Petrochemicals operating segment, which is divided into three CGUs. The other CGU, called UNIB-BA and UNIB-Southeast do not have goodwill allocated. The Polyolefins operating segment is divided into two CGUs: Polyethylene and Polypropylene. Part of the industrial plants that compose these CGUs was acquired in a business combination that resulted in a goodwill based on the future profitability of these plants. The Company’s Management established that the benefits from the synergy of this transaction should be associated with all units acquired and, therefore, the goodwill recognized is allocated and monitored at the lowest level of the corresponding group of assets, which is the Polyolefins operating segment. In October 2013, Braskem conducted an impairment test of the goodwill using the value in use method (discounted cash flow) and did not identify any loss, as shown in the table below:
The following premises were adopted to determine the discounted cash flow: cash flow for 5 years based on the Business Plan, discount rate and perpetuity rate based on the Weighted Average Cost of Capital (WACC) of 13.26% p.a. and without real growth rate
(b) Sensitivity analysis Given the potential impact on cash flows of the “discount rate” and the “growth rate in perpetuity”, Braskem conducted a sensitivity analysis based on changes in these variables, with cash flows shown in the table below:
Consolidated Book value
Allocated Cash flow (with goodwill CF/Bookgoodwill (CF) and work capital) value
CGU and operating segmentsCGU - UNIB - South 926,854 7,353,584 848,412 8.7 Operating segment - Polyolefins 939,711 12,468,556 7,658,046 1.6 Operating segment - Vinyls 192,353 3,829,542 3,237,688 1.2
Consolidated -0,5% on
+0,5% on growth rate discount rate to perpetuity
CGU and operating segmentsCGU - UNIB - South 6,702,392 7,042,942 Operating segment - Polyolefins 11,223,392 11,864,605 Operating segment - Vinyls 3,434,515 3,638,822

Braskem S.A. Notes to the financial statements Years ended December 31, 2013 All amounts in thousands of reais
69
18 Borrowings
Consolidated
Monetary restatement 2013 2012Foreign currency
Bonds and Medium term notes (MTN) Note 18 (a) Note 18 (a) 10,432,526 9,278,759 Advances on exchange contracts US dollar exchange variation 0.60% 117,132 173,939 Export prepayment Note 18 (b) Note 18 (b) 540,744 513,610 BNDES Note 18 (c) Note 18 (c) 453,065 495,260 Export credit notes Note 18 (d) Note 18 (d) 843,060 787,687 Working capital US dollar exchange variation 1.77% above Libor 633,632 - Other US dollar exchange variation 4.00% above Libor 1,268 917,283 Other Exchange variation (UMBNDES) 6.06% - 768 Transactions costs (81,375) (60,285)
Local currencyExport credit notes Note 18 (d) Note 18 (d) 2,528,077 2,384,414 BNDES Note 18 (c) Note 18 (c) 2,464,987 2,381,892 BNB/ FINAME/ FINEP/ FUNDES 6.51% 658,372 605,273 BNB/ FINAME/ FINEP/ FUNDES TJLP 0.35% 16,093 25,746 Other TJLP 2.87% - 7,292 Transactions costs (5,090) -
Total 18,602,491 17,511,638
Current liabilities 1,248,804 1,836,028 Non-current liabilities 17,353,687 15,675,610 Total 18,602,491 17,511,638
Annual financial chargesAverage interest (unless otherwise stated)
Parent company2013 2012
Foreign currencyCurrent liabilities 735,512 1,026,644 Non-current liabilities 6,940,002 6,480,063
7,675,514 7,506,707 Local currency -
Current liabilities 547,534 861,167 Non-current liabilities 4,781,412 4,054,224
5,328,946 4,915,391
Current liabilities 1,283,046 1,887,811 Non-current liabilities 11,721,414 10,534,287 Total 13,004,460 12,422,098

Braskem S.A. Notes to the financial statements Years ended December 31, 2013 All amounts in thousands of reais
70
(a) Bonds and MTN
(i) Partially liquidated in February 2014 (Nota 39).
(b) Export prepayments (“EPP”)
(i) On September 30, 2013, Braskem Europe maintained an investment of US$150,000 thousand to offset this operation (Note 7).
Issue amount InterestIssue date (US$ in thousands) Maturity (% per year) 2013 2012July 1997 250,000 June 2015 9.38 152,328 134,175 January 2004 250,000 January 2014 11.75 178,897 169,609 September 2006 (i) 275,000 January 2017 8.00 305,006 275,270 June 2008 (i) 500,000 June 2018 7.25 1,000,375 1,026,894 May 2010 (i) 400,000 May 2020 7.00 940,780 820,621 May 2010 350,000 May 2020 7.00 828,360 722,596 October 2010 450,000 no maturity date 7.38 1,072,742 935,776 April 2011 750,000 April 2021 5.75 1,772,070 1,545,798 July 2011 500,000 July 2041 7.13 1,207,927 1,053,701 February 2012 250,000 April 2021 5.75 592,666 516,995 February 2012 250,000 no maturity date 7.38 595,968 519,876 May 2012 500,000 May 2022 5.38 1,181,443 1,030,598 July 2012 250,000 July 2041 7.13 603,964 526,850 Total 4,975,000 10,432,526 9,278,759
Consolidated
Initial amountof the transaction
Issue date (US$ thousand) Maturity Charges (% per year) 2013 2012May 2010 (i) 150,000 May-2015 US dollar exchange variation + semiannual Libor + 2.40 - 307,406 December 2010 100,000 December-2017 US dollar exchange variation + semiannual Libor + 2.47 118,505 206,204 January 2013 200,000 November-2022 US dollar exchange variation + semiannual Libor + 1.10 422,239 - Total 450,000 540,744 513,610
Consolidated
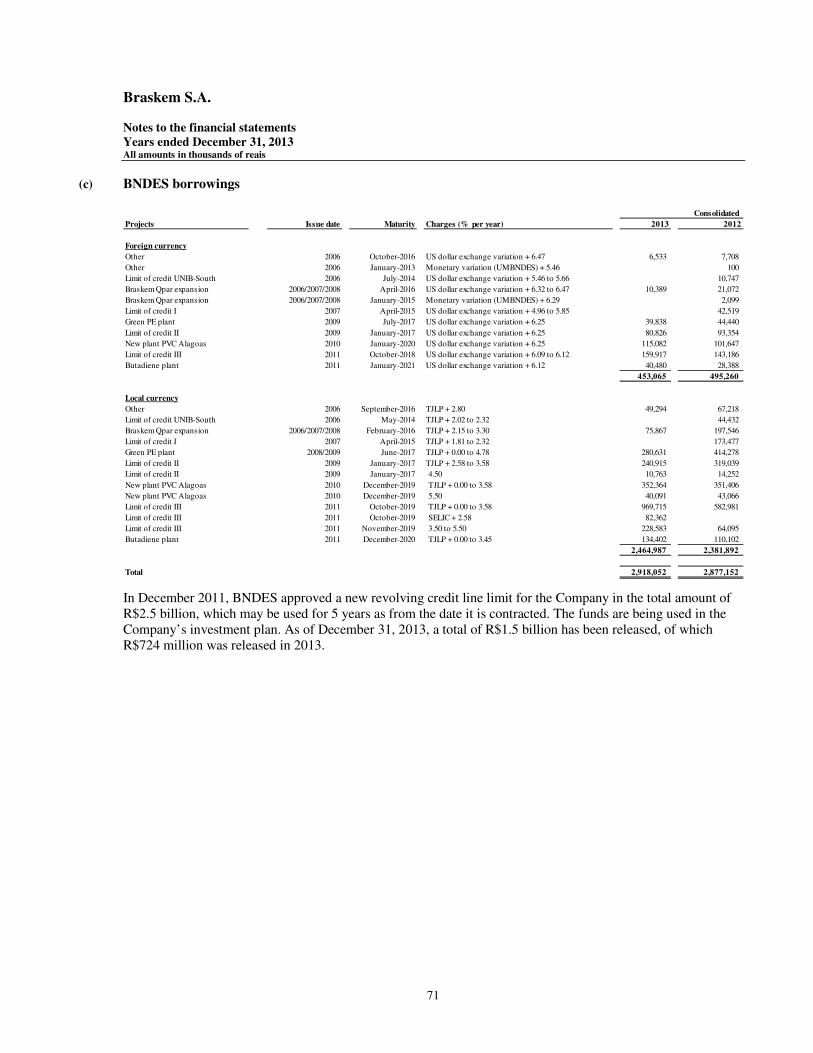
Braskem S.A. Notes to the financial statements Years ended December 31, 2013 All amounts in thousands of reais
71
(c) BNDES borrowings
In December 2011, BNDES approved a new revolving credit line limit for the Company in the total amount of R$2.5 billion, which may be used for 5 years as from the date it is contracted. The funds are being used in the Company’s investment plan. As of December 31, 2013, a total of R$1.5 billion has been released, of which R$724 million was released in 2013.
ConsolidatedProjects Issue date Maturity Charges (% per year) 2013 2012
Foreign currencyOther 2006 October-2016 US dollar exchange variation + 6.47 6,533 7,708 Other 2006 January-2013 Monetary variation (UMBNDES) + 5.46 - 100 Limit of credit UNIB-South 2006 July-2014 US dollar exchange variation + 5.46 to 5.66 - 10,747 Braskem Qpar expansion 2006/2007/2008 April-2016 US dollar exchange variation + 6.32 to 6.47 10,389 21,072 Braskem Qpar expansion 2006/2007/2008 January-2015 Monetary variation (UMBNDES) + 6.29 - 2,099 Limit of credit I 2007 April-2015 US dollar exchange variation + 4.96 to 5.85 - 42,519 Green PE plant 2009 July-2017 US dollar exchange variation + 6.25 39,838 44,440 Limit of credit II 2009 January-2017 US dollar exchange variation + 6.25 80,826 93,354 New plant PVC Alagoas 2010 January-2020 US dollar exchange variation + 6.25 115,082 101,647 Limit of credit III 2011 October-2018 US dollar exchange variation + 6.09 to 6.12 159,917 143,186 Butadiene plant 2011 January-2021 US dollar exchange variation + 6.12 40,480 28,388
453,065 495,260
Local currencyOther 2006 September-2016 TJLP + 2.80 49,294 67,218 Limit of credit UNIB-South 2006 May-2014 TJLP + 2.02 to 2.32 - 44,432 Braskem Qpar expansion 2006/2007/2008 February-2016 TJLP + 2.15 to 3.30 75,867 197,546 Limit of credit I 2007 April-2015 TJLP + 1.81 to 2.32 - 173,477 Green PE plant 2008/2009 June-2017 TJLP + 0.00 to 4.78 280,631 414,278 Limit of credit II 2009 January-2017 TJLP + 2.58 to 3.58 240,915 319,039 Limit of credit II 2009 January-2017 4.50 10,763 14,252 New plant PVC Alagoas 2010 December-2019 TJLP + 0.00 to 3.58 352,364 351,406 New plant PVC Alagoas 2010 December-2019 5.50 40,091 43,066 Limit of credit III 2011 October-2019 TJLP + 0.00 to 3.58 969,715 582,981 Limit of credit III 2011 October-2019 SELIC + 2.58 82,362 - Limit of credit III 2011 November-2019 3.50 to 5.50 228,583 64,095 Butadiene plant 2011 December-2020 TJLP + 0.00 to 3.45 134,402 110,102
2,464,987 2,381,892
Total 2,918,052 2,877,152

Braskem S.A. Notes to the financial statements Years ended December 31, 2013 All amounts in thousands of reais
72
(d) Export credit notes (“NCE”)
(i) Financing paid in advance in September 2013. (ii) Maturities and charges on these operations were renegotiated in October 2013. (iii) The Company enters into swap transactions to offset the variation in the Interbank Certificate of Deposit (CDI) rate. (iv) The Company entered into swap transactions for these contracts (77.52% to 92.70% of CDI).
Initial amount ConsolidatedIssue date of the transaction Maturity Charges (% per year) 2013 2012
Foreign currencyNovember 2006 ##### 167,014 May 2018 Us dollar exchange variation + 8.10 184,778 161,150 April 2007 ##### 101,605 March 2018 Us dollar exchange variation + 7.87 119,255 104,029 May 2007 ##### 146,010 May 2019 Us dollar exchange variation + 7.85 176,806 154,298 January 2008 ##### 266,430 February 2020 Us dollar exchange variation + 7.30 362,221 315,973 March 2008 (i) 41,750 March 2016 Us dollar exchange variation + 7.50 - 52,237
722,809 843,060 787,687
Local currencyApril-2010 (ii) 50,000 October-2021 105% of CDI 50,880 65,678 June-2010 (ii) 200,000 October-2021 105% of CDI 203,521 256,471 February-2011 (ii) 250,000 October-2021 105% of CDI 203,521 297,434 April-2011 (iii) 450,000 April-2019 112.5% of CDI 459,408 456,876 June-2011 (ii) 80,000 October-2021 105% do CDI 81,408 91,563 August-2011 (iii) 400,000 August-2019 112.5% of CDI 403,513 402,527 January-2012 ##### 200,000 December-2013 103% of CDI - 217,320 June-2012 (ii) 100,000 October-2021 105% of CDI 101,761 103,818 September-2012 (ii) 300,000 October-2021 105% of CDI 305,282 305,684 October-2012 (ii) 85,000 October-2021 105% of CDI 86,496 86,419 November-2012 ##### 100,000 November-2013 106% of CDI - 100,624 February-2013 (iv) 100,000 February-2016 8.00 101,183 - February-2013 (iv) 50,000 February-2016 7.50 50,505 - February-2013 (iv) 100,000 February-2016 8.00 101,010 - February-2013 (iv) 50,000 February-2016 8.00 50,440 - February-2013 (iv) 100,000 February-2016 8.00 100,923 - March-2013 (iv) 50,000 March-2016 8.00 50,257 - March-2013 (iv) 17,500 March-2016 8.00 17,583 - August-2013 (iv) 10,000 August-2016 8.00 10,129 - December-2013 ##### 150,000 December-2016 8.00 150,257 - Total 2,842,500 2,528,077 2,384,414

Braskem S.A. Notes to the financial statements Years ended December 31, 2013 All amounts in thousands of reais
73
(e) Payment schedule The maturity profile of the long-term amounts is as follows:
(f) Capitalized financial charges - consolidated
The Company capitalized financial charges in the year ended December 31, 2013 in the amount of R$362,528 (2012 - R$162,227), including monetary variation and part of the exchange variation. The average rate of these charges in the year was 7.40% p.a. (2012 - 6.98% p.a.).
(g) Guarantees Braskem gave collateral for part of its borrowings as follows:
(h) Financial covenants The Company has not entered into financing agreements that establish limits for certain indicators related to the capacity to contract debt and pay interest.
2013 20122014 - 1,759,551 2015 1,121,998 1,515,498 2016 1,738,496 1,092,519 2017 1,576,790 715,362 2018 1,881,848 1,512,383 2019 1,479,686 1,146,166 2020 2,366,125 1,884,761 2021 2,561,516 2,059,513 2022 1,248,355 1,042,067 2023 1,676 - 2024 - - 2025 and thereafter 3,377,197 2,947,790 Total 17,353,687 15,675,610
Consolidated
Totaldebt Total
Loans Maturity 2013 guaranteed Guarantees
BNB March-2023 341,051 341,051 Mortgage of plants, pledge of machinery and equipmentBNDES January-2021 2,918,052 2,918,052 Mortgage of plants, land and property, pledge of machinery and equipmentFUNDES June-2020 207,694 207,694 Mortgage of plants, land and property, pledge of machinery and equipmentFINEP August-2023 122,255 122,255 Bank suretyFINAME February-2022 3,465 3,465 Pledge of equipmentTotal 3,592,517 3,592,517

Braskem S.A. Notes to the financial statements Years ended December 31, 2013 All amounts in thousands of reais
74
19 Project finance Braskem Idesa is constructing a plant in Mexico (Ethylene XXI Project), with capacity to produce around 750 kton of high-density polyethylene and 300 kton of low-density polyethylene using ethane as feedstock. The raw material will be supplied through an agreement with PEMEX-Gás for delivery of 66,000 barrels of ethane per day for 20 years. In line with the Company’s financial policy, the investment is being financed under the Project finance mode, whereby the project loan must be paid exclusively with the cash generated by the project itself and shareholders provide limited guarantees (limited recourse project finance). Thus, this financing has the usual guarantees of this type of operation such as assets, receivables, cash generation and other rights from the project, as well commitments by shareholders to inject a limited amount of capital to provide for eventual additional costs thereof. The financing structure was concluded in December 2012, at the ratio of 70% debt and 30% equity. The total financing contracted to meet construction expenses and start project operation was US$3,193,095 thousand. In 2013, a total of R$4,562,343 (US$2,030,812 thousand) was released. A portion of these funds was used to settle the amounts lent by shareholders Braskem and Grupo Idesa, totaling R$1,449,826 (US$648,750 thousand) and R$483,276 (US$216,250 thousand), respectively. Braskem Idesa capitalized the interest on this financing, since its funding through December 31, 2013, in the amount of R$69,097 (MXN$391,915 thousand). The average interest rate was 4.88% p.a. The breakdown of charges and final maturities is as follows:
Contract value Value receivedIdentification US$ thousands US$ thousands Maturity Charges (% per year) 2013 2012Project finance I 700,000 484,847 February-2027 Us dollar exchange variation + quarterly Libor + 3.25 1,141,515 Project finance II 210,000 51,422 February-2027 Us dollar exchange variation + 6.17 121,387 Project finance III 600,000 263,264 February-2029 Us dollar exchange variation + 4.33 621,410 Project finance IV 660,000 551,173 February-2029 Us dollar exchange variation + quarterly Libor + 3.88 1,298,791 Project finance V 400,000 277,055 February-2029 Us dollar exchange variation + quarterly Libor + 4.65 653,288 Project finance VI 90,000 33,811 February-2029 Us dollar exchange variation + quarterly Libor + 2.73 79,630 Project finance VII 533,095 369,242 February-2029 Us dollar exchange variation + quarterly Libor + 4.64 866,581 Transactions costs - - (51,196) Total 3,193,095 2,030,814 4,731,406 -
Current liabilities 25,745 Non-current liabilities 4,705,661 Total 4,731,406
Consolidated
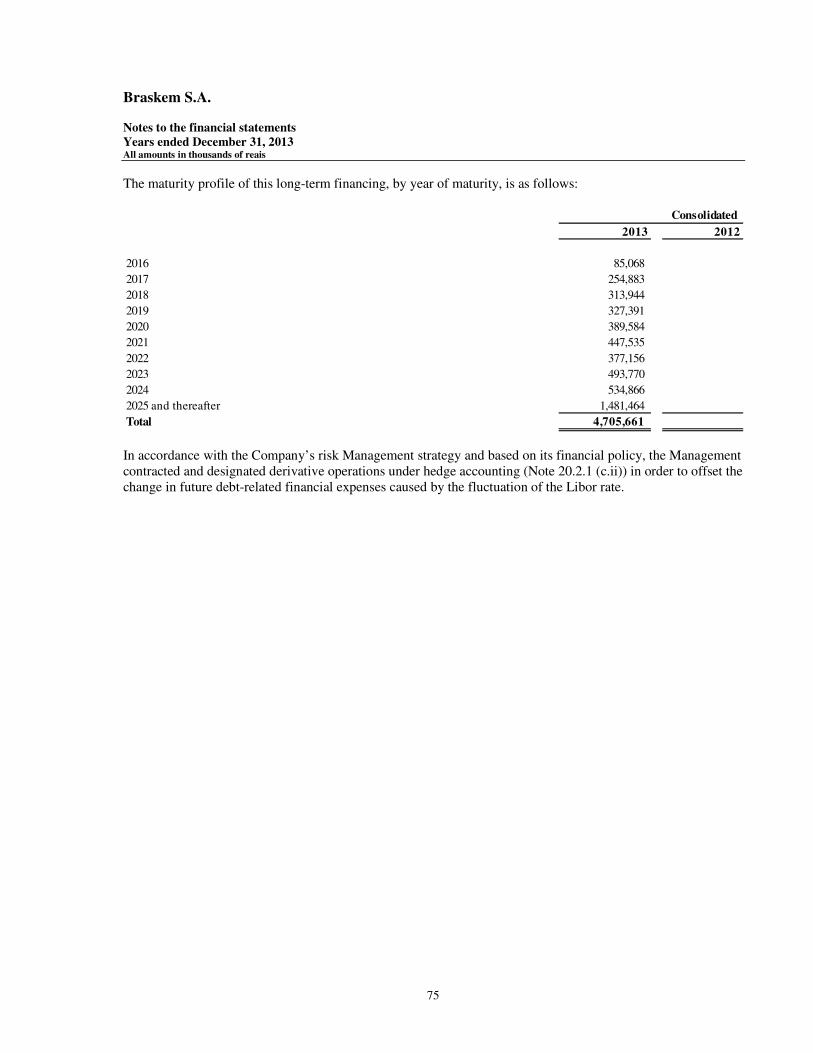
Braskem S.A. Notes to the financial statements Years ended December 31, 2013 All amounts in thousands of reais
75
The maturity profile of this long-term financing, by year of maturity, is as follows:
In accordance with the Company’s risk Management strategy and based on its financial policy, the Management contracted and designated derivative operations under hedge accounting (Note 20.2.1 (c.ii)) in order to offset the change in future debt-related financial expenses caused by the fluctuation of the Libor rate.
2013 2012
2016 85,068 - 2017 254,883 - 2018 313,944 - 2019 327,391 - 2020 389,584 - 2021 447,535 - 2022 377,156 2023 493,770 2024 534,866 2025 and thereafter 1,481,464 - Total 4,705,661 -
Consolidated

Braskem S.A. Notes to the financial statements Years ended December 31, 2013 All amounts in thousands of reais
76
20 Financial instruments
20.1 Non-derivative financial instruments measured at fair value - consolidated
Fair valueNote Classification by category hierarchy 2013 2012 2013 2012
Cash and cash equivalents 6Cash and banks Loans and receivables 987,824 398,142 987,824 398,142 Financial investments in Brazil Held-for-trading Level 2 687,938 393,348 687,938 393,348 Financial investments in Brazil Loans and receivables 1,218,852 899,816 1,218,852 899,816 Financial investments abroad Held-for-trading Level 2 1,441,245 1,596,316 1,441,245 1,596,316
4,335,859 3,287,622 4,335,859 3,287,622 0 0
Financial investments 7 - - FIM Sol investments Held-for-trading Level 2 61,670 50,803 61,670 50,803 Investments in foreign currency Held-for-trading Level 2 3,773 5,256 3,773 5,256 Investments in foreign currency Held-to-maturity 189 15,731 189 15,731 Shares Held-for-trading Level 1 1,170 3,023 1,170 3,023 FIM Sol investments Loans and receivables - 77,469 - 77,469 Investments in national currency Loans and receivables - 513 - 513 Quotas of receivables investment fund Held-to-maturity 40,696 52,559 40,696 52,559 Restricted deposits Held-to-maturity - 1,281 - 1,281
107,498 206,635 107,498 206,635 0 0
Trade accounts receivable 8 Loans and receivables 2,872,395 2,364,222 2,872,395 2,364,222 0 0
Related parties credits 10 Loans and receivables 258,136 141,539 258,136 141,539
Other receivables - - Disposal of shareholdings Loans and receivables - 652,100 - 652,100
- - Trade payables Other financial liabilities 10,421,687 8,999,491 10,421,687 8,999,491
0 0Borrowings 18 0 -
Foreign currency - Bond Other financial liabilities Level 1 10,432,526 9,278,759 10,241,359 10,032,553 Foreign currency - other borrowings Other financial liabilities 2,588,901 2,888,547 2,588,901 2,888,547 Local currency Other financial liabilities 5,667,529 5,404,617 5,667,529 5,404,617
18,688,956 17,571,923 18,497,789 18,325,7170 0
Project finance 19 Other financial liabilities 4,782,602 - 4,782,602 - - 0
Other payables - 0Creditors for the acquisitions of shares Other financial liabilities 275,743 256,030 275,743 256,030 Accounts payable to non-controlling Other financial liabilities 341,993 260,649 341,993 260,649
617,736 516,679 617,736 516,679
Book value Fair value

Braskem S.A. Notes to the financial statements Years ended December 31, 2013 All amounts in thousands of reais
77
(a) Fair value The fair value of financial assets and liabilities is estimated as the amount for which a financial instrument could be exchanged in an arm’s length transaction and not in a forced sale or settlement. The following methods and assumptions were used to estimate the fair value: (i) held-for-trading and available-for-sale financial assets are measured in accordance with the fair value
hierarchy (Level 1 and Level 2), with inputs used in the measurement processes obtained from sources that reflect the most recent observable market prices.
(ii) trade accounts receivable and trade payables approximate their respective carrying amount due to the short-
term maturity of these instruments. (iii) the fair value of related parties is the same as the carrying amount. (iv) the fair value of borrowings is estimated by discounting future contractual cash flows at the market interest
rate, which is available to Braskem in similar financial instruments. (v) the fair value of debentures is obtained through secondary market prices disclosed by ANDIMA (National
Association of Financial Market Institutions).
(b) Fair value hierarchy The Company adopts CPC 40 and IFRS 7 for financial instruments that are measured in the balance sheet, this requires disclosure of measurements by level of the following fair value measurement hierarchy: Level 1 – fair value obtained through prices quoted (without adjustments) in active markets for identical assets or liabilities, such as the stock exchange; and Level 2 – fair value obtained from discounted cash flow models, when the instrument is a forward purchase or sale or a swap contract, or valuation models of option contracts, such as the Black-Scholes model, when the derivative has the characteristics of an option.
The valuation assumptions (inputs to models) are obtained from sources that reflect the most recent observable market prices, particularly the curves of interest and future currency quotes disclosed by the Commodities & Futures Exchange, the spot exchange rate disclosed by the Central Bank of Brazil and the foreign interest curves disclosed by well-known quoting services such as Bloomberg or Reuters.
20.2 Financial instruments designated and not designated for hedge accounting Financial instruments designated and not designated for hedge accounting are presented in the balance sheet at their fair value in an asset or liability account depending on whether the fair value represents a positive or a negative balance to Braskem, respectively. Financial instruments are necessarily classified as "held-for-trading". The regular changes in the fair value are recognized as financial income or expense in the period in which they occur, except when designated and qualified for hedge accounting. All financial instruments held at December 31, 2013 were contracted on Over the Counter - OTC markets with large financial counterparties under global derivative contracts in Brazil or abroad and its fair value is classified as Level 2.

Braskem S.A. Notes to the financial statements Years ended December 31, 2013 All amounts in thousands of reais
78
Braskem’s Financial Policy provides for a continuous short-term hedging program for foreign exchange rate risk arising from its operations and financial items. The other market risks are addressed on a case-by-case basis for each transaction. In general, Braskem assesses the need for hedging in the analysis of prospective transactions and seeks to customize the hedge for each operation and keeps it in place for the whole period of the hedged transaction. Braskem may elect derivatives as hedges for the application of hedge accounting in accordance with CPCs 38, 39, 40 and IAS 39-32 and IFRS 7. The hedge designation is not mandatory. In general, Braskem will elect to designate financial instruments as hedges when the application is expected to provide a significant improvement in the presentation of the offsetting effect on the changes in the hedged items.
20.2.1 Changes in derivative financial instruments designated and not designated for hedge accounting
The counterparties in these contracts are daily monitored based on the analysis of their respective ratings and Credit Default Swaps – CDS. Braskem has many bilateral risk mitigators in its derivative contracts, such as the possibility of depositing or requesting deposits of a guarantee margin from the counterparties it deems convenient. On December 31, 2013, the Company had security deposits related to NCE currency swaps (Note 20.2.1(a.ii)) amounting to R$244,832.
(a) Non-hedge accounting transactions The Company has operations that were not designated as hedge accounting since the risks posed to the principals protected are satisfactorily represented by the coinciding results from the variation in the exposure indexes of the principal and the variation in the fair value. The regular changes in the fair value of these swaps are recorded as financial income or expenses in the same period in which they occur. In the fiscal year ended December 31, 2013, the Company recognized a financial expense of R$15,455.
Fair value Balance at Change in Financial Balance atIdentification Note hierarchy Derivatives 2012 fair value settlement 2013
Non-hedge accounting transactionsNon-deliverable forward ("NDF") - ethanol 0 Level 2 Real Dollar 1,791 52 (1,843) - Commodity swap - Naphtha 20.2.1 (a.i) Level 2 Fixed price Variable price - (287) (183) (470) Commodity swap - Naphtha 20.2.1 (a.i) Level 2 Fixed price Variable price - (1,080) 1,080 - Contract for the future purchase - ethanol 0 Level 1 Fixed price Variable price 2 - (2) - Exchange swap 0 Level 2 Dollar CDI 4,968 (1,688) (3,280) - Interest rate swaps 20.2.1 (a.ii) Level 2 Fixed rate CDI - 18,458 2,293 20,751 Deliverable Forward 20.2.1 (c.i.i) Level 2 Mexican peso Dollar - 65,117 (17,837) 47,280 Deliverable Forward 20.2.1 (c.i.ii) Level 2 Euro Dollar - (8,801) 3,779 (5,022)
6,761 71,771 (15,993) 62,539
Hedge accounting transactionsExchange swap 20.2.1 (b.i) Level 2 CDI Dollar 286,617 68,202 12,740 367,559 Commodity swap - ethylene 20.2.1 (b.ii) Level 2 Variable price Fixed price - (69) - (69) Commodity swap - PGP 20.2.1 (b.ii) Level 2 Fixed price Variable price - (59) - (59) Interest rate swaps 20.2.1 (c.ii.i) Level 2 Libor Dollar - (116,476) 6,223 (110,253)
286,617 (48,402) 18,963 257,178
Current assets (other receivables) - (34,101) Non current assets (other receivables) - (137,345) Current liabilities (derivat ives operat ions) 293,378 95,123 Non current liabilities (derivat ives operat ions) - 396,040
293,378 319,717
O peration characteristics
Principal exposure

Braskem S.A. Notes to the financial statements Years ended December 31, 2013 All amounts in thousands of reais
79
(a.i) Commodity swap - Naphtha The parent company made a single operation of resin at a fixed price sale to a final customer. With the goal of preserving its margin, potentially affected by the fluctuation in the price of naphtha, were made four future purchase contracts at a fixed price of this raw material, as shown below:
(a.ii) Interest rate swap linked to NCE
The Parent Company has contracted financing facilities in the form of NCE (Note 18(d)) with fixed interest
payments. Considering that the cash in Brazilian real is largely invested in the overnight rate (CDI)-indexed investments, the company contracted swaps to match financial charges with cash yields.
Nominal valueUS$ thousands 2013 2012
Commodity swap - naphtha 477 830.000 February-2014 (144) - Commodity swap - naphtha 477 830.000 March-2014 (127) - Commodity swap - naphtha 477 830.000 April-2014 (112) - Commodity swap - naphtha 425 830.000 May-2014 (87) - Total 1,856 (470)
Current assets (other receivables) (470) Total (470) -
IdentificationFixed price - US$/Ton
(hedge) MaturityFair value
Interest rate Fair valueNominal value (hedge) 2013 2012
Swap NCE I 100,000 90.65% CDI February-2016 4,086 - Swap NCE II 50,000 88.20% CDI February-2016 2,243 - Swap NCE III 100,000 92.64% CDI February-2016 4,435 - Swap NCE IV 50,000 92.70% CDI February-2016 2,315 - Swap NCE V 100,000 91.92% CDI February-2016 4,407 - Swap NCE VI 50,000 92.25% CDI March-2016 2,310 - Swap NCE VII 17,500 91.10% CDI March-2016 765 - Swap NCE VIII 10,000 77.52% CDI August-2016 190 Total 477,500 20,751 -
Current liabilities (derivatives operations) 20,751 - Total 20,751 -
MaturityIdentification

Braskem S.A. Notes to the financial statements Years ended December 31, 2013 All amounts in thousands of reais
80
(b) Hedge accounting transactions
(b.i) Swaps related to NCE In line with the Company’s risk Management strategy and based on its financial policy, the Management contracted swap operations to offset the interest rate and currency risks arising from the financings mentioned in Note 18(d), by maintaining its exposure to long-term financial liabilities in the U.S. dollar.
Prior to designating these swaps as hedge accounting, on May 1, 2013, the Company had recognized financial income of R$43,651 as profit for the fiscal year. After the recognition of this designation, an expense of R$111,853, relating to changes in the fair value of these swaps since the designation until December 31, 2013, was recognized.
(b.ii) Commodity swap – Ethylene and PGP
To reduce the volatility of its results, the subsidiary Braskem America decided to swap the part of the ethylene used in the production of PP copolymers for Polymer Grade Propylene (PGP), which is the main factor influencing the price of this resin. For this purpose, the company contracted two operations with derivatives for the same terms and volumes. In the first operation, the ethylene cost was fixed:
Interest rateNominal value US$ mil (hedge) 2013 2012
Swap NCE I 200,000 122,100 5.44% August 2019 101,904 82,812 Swap NCE II 100,000 60,187 5.40% August 2019 48,414 39,008 Swap NCE III 100,000 59,588 5.37% August 2019 46,642 37,333 Swap NCE IV 100,000 56,205 5.50% April 2019 39,005 29,904 Swap NCE V 100,000 56,180 5.50% April 2019 38,939 29,250 Swap NCE VI 150,000 82,372 5.43% April 2019 52,745 38,585 Swap NCE VII 100,000 58,089 4.93% April 2019 39,910 29,725 Total 850,000 494,721 367,559 286,617
- Current assets (other receivables) (28,481) - Current liabilities (derivatives operations) - 286,617 Non Current liabilities (derivatives operations) 396,040 Total 367,559 286,617
Identification MaturityFair value
Nominal value HedgeUS$ thousands Cents/Pound 2013 2012
Commodity swap - ethylene 285 0.57 January-2014 (6)Commodity swap - ethylene 285 0.57 February-2014 (10)Commodity swap - ethylene 285 0.57 March-2014 (13)Commodity swap - ethylene 285 0.57 April-2014 (15)Commodity swap - ethylene 285 0.57 May-2014 (13)Commodity swap - ethylene 285 0.57 June-2014 (12)Total 1,710 (69) -
Current assets (other receivables) (69)Total (69) -
-
Identification MaturityFair value

Braskem S.A. Notes to the financial statements Years ended December 31, 2013 All amounts in thousands of reais
81
To preserve its margin, potentially affected by the fluctuation in resin prices, it contracted a swap operation that makes the cost variable on account of the PGP, as follows:
On the date of contracting the derivative, the operations were designated as hedge accounting. Thus, the Company recognized income of R$128 in shareholders' equity, relating to the variation in the fair value of these swaps.
(b.iii) Non-derivative liabilities designated for export hedge accounting On May 1, 2013, Braskem S.A. designated non-derivative financial instrument liabilities, denominated in U.S. dollars, as hedge for the flow of its highly probable future exports. Thus, the impact of exchange rates on future cash flows in dollars derived from these exports will be offset by the foreign exchange variation on the designated liabilities, partly eliminating the volatility of results. On December 31, 2013, the following non-derivative liabilities of the Parent Company were designated as hedge for the flow of its highly probable future exports:
Nominal value HedgeUS$ thousands Cents/Pound 2013 2012
Commodity swap - PGP 385 0.77 January-2014 41 Commodity swap - PGP 390 0.78 February-2014 53 Commodity swap - PGP 390 0.78 March-2014 53 Commodity swap - PGP 365 0.73 April-2014 (6)Commodity swap - PGP 340 0.68 May-2014 (64)Commodity swap - PGP 310 0.62 June-2014 (136)Total 2,180 (59) -
Current assets (other receivables) (59)Total (59) -
-
Identification MaturityFair value

Braskem S.A. Notes to the financial statements Years ended December 31, 2013 All amounts in thousands of reais
82
The Company considers the flow covered as highly probable based, on the following factors:
• Historically, annual export volumes represent 3 to 4 times the annual amount covered; • In the past 5 years, Braskem S.A. recorded average exports of US$2.4 billion annually, supporting the
export amounts underlying the hedge; and • The flow covered varies between 15% and 30% of the export flows planned by the Company.
The Company designated longer export flows than the financial liabilities that hedge them. However, to analyze the effectiveness of the operations, the export flows will be considered only until the date of maturity of the underlying debt. Nevertheless, to ensure continuity of the relation and strategy of the proposed hedge, the Company plans to refinance and/or substitute these hedging instruments according to their maturity, in accordance with CPC 38 and IAS 39.
Nominal value Balance at Balance atIdentification Maturity Hedge US$ thousands 2013 2012
O perations designated for hedge accountingTrade payables 0 2016 0 Dollar 0 272,254 637,785 T rade payables related parties 0 2016 0 Dollar 0 567,192 1,328,703 - T rade payables 0 2017 0 Dollar 0 82,648 193,610 - T rade payables related parties 0 2017 0 Dollar 0 667,037 1,562,602 - Export prepayments - related parties 0 2017 0 Dollar 0 80,000 187,408 - T rade payables 0 2018 0 Dollar 0 151,472 354,837 - T rade payables related parties 0 2018 0 Dollar 0 593,089 1,389,370 - Export prepayments 0 2018 0 Dollar 0 43,333 101,513 - Bond 0 2019 0 Dollar 0 65,143 152,604 - Accounts payable - related parties 0 2019 0 Dollar 0 50,000 117,130 - Export prepayments 0 2019 0 Dollar 0 150,000 351,390 - Export prepayments - related parties 0 2019 0 Dollar 0 468,837 1,098,298 - Accounts payable - related parties 0 2020 0 Dollar 0 288,000 674,669 - T rade payables 0 2020 0 Dollar 0 50,000 117,130 - T rade payables related parties 0 2020 0 Dollar 0 6,000 14,056 - Export prepayments 0 2020 0 Dollar 0 50,000 117,130 - Export prepayments - related parties 0 2020 0 Dollar 0 330,000 773,058 - Accounts payable - related parties 0 2021 0 Dollar 0 332,000 777,743 - T rade payables related parties 0 2021 0 Dollar 0 10,000 23,426 - Export prepayments 0 2021 0 Dollar 0 374,000 876,132 - Accounts payable - related parties 2022 0 Dollar 0 216,000 506,002 - Credit note export 2022 0 Dollar 0 353,000 826,938 - Export prepayments - related parties 2022 0 Dollar 0 150,000 351,388 - Accounts payable - related parties 2023 0 Dollar 0 653,972 1,531,994 - Export prepayments - related parties 2023 0 Dollar 0 64,400 150,863 - Accounts payable - related parties 0 2024 0 Dollar 0 113,854 266,715 Export prepayments - related parties 0 2024 0 Dollar 0 575,000 1,346,995
0 0 # 0 6,757,231 15,829,489 -
0 0 # -
Financial liabili ties - Parent company
0 0 1900 # 1900 0 Nominal value Balance at 0 Balance at
Related parties 0 1900 # 1900 0 US$ thousands 2013 0 2012Braskem Holanda 0 1900 0 0 0 1,283,826 3,007,490 - Braskem América 0 1900 0 0 0 200.000 468,520 - Braskem Inc. 0 1900 0 0 0 3,511,555 8,226,168 - Braskem Austria 0 1900 0 0 170.000 398,242 -
0 0 1900 0 0 5,165,381 12,100,420 -
#REF! #REF!

Braskem S.A. Notes to the financial statements Years ended December 31, 2013 All amounts in thousands of reais
83
Braskem in order to maintain consistency between the parent company’s results and the consolidated results, selected the hedge instruments with subsidiaries abroad observing the guarantees at those companies whose counterparty is external to that of Braskem. As such, non-derivative financial liabilities in which the foreign subsidiary acted as an intermediary in the operations were selected, which effectively maintained the essence of the transactions. On December 31, 2013, the following non-derivative financial liabilities were designated as guarantee for the hedge, considering the scope of the consolidated balance sheet:
Nominal value Balance at Balance atIdentification Maturity Hedge US$ thousands 2013 2012
0O perations designated for hedge accounting 0Bond 2016 0 Dollar 0 78,893 184,814 - T rade payables 2016 0 Dollar 0 760,551 1,781,674 - Bond 2017 0 Dollar 0 213,220 499,489 - Foreign currency borrowings 2017 0 Dollar 0 72,632 170,148 - T rade payables 2017 0 Dollar 0 543,833 1,273,982 - Bond 2018 0 Dollar 0 340,455 797,550 - T rade payables 2018 0 Dollar 0 439,275 1,029,046 - Bond 2019 0 Dollar 0 315,483 739,051 - T rade payables 2019 0 Dollar 0 378,712 887,170 - Advance on exchange contracts 2019 0 Dollar 0 47,949 112,325 - Bond 2020 0 Dollar 0 460,001 1,077,599 - Foreign currency borrowings 2020 0 Dollar 0 39,923 93,523 - T rade payables 2020 0 Dollar 0 120,076 281,291 - Export prepayments 2020 0 Dollar 0 104,000 243,630 - Bond 2021 0 Dollar 0 480,001 1,124,450 - Foreign currency borrowings 2021 0 Dollar 0 99,999 234,257 - T rade payables 2021 0 Dollar 0 10,001 23,428 - Export prepayments 2021 0 Dollar 0 126,000 295,168 - Bond 2022 0 Dollar 0 363,656 851,901 - T rade payables 2022 0 Dollar 0 2,344 5,490 - Credit note export 2022 0 Dollar 353,000 826,938 - Bond 2023 0 Dollar 698,372 1,636,005 T rade payables 2023 Dollar 20,000 46,852 Bond 2024 Dollar 681,199 1,595,776 T rade payables 2024 Dollar 7,656 17,934
6,757,231 15,829,491 -
Financial liabil ities - Consol idated

Braskem S.A. Notes to the financial statements Years ended December 31, 2013 All amounts in thousands of reais
84
The amounts of the operations designated for hedge accounting booked in shareholders' equity are shown below:
(c) Hedge operations by Braskem Idesa related to project finance
The hedge operations of Braskem Idesa follow the same mode as project finance, whereby the project loan must be paid exclusively with the cash generated by the project itself and shareholders provide limited guarantees (limited recourse project finance) (Note 19).
(c.i) Operations not designated for hedge accounting
The periodic changes in the fair value of swaps are recorded as financial income or expense in the same period in which they occur. In the year ended December 31, 2013, the Company recognized a financial expense of R$56,316.
(c.i.i) Currency futures contract– Mexican Peso Braskem Idesa contracted currency purchase transactions through futures contracts to hedge its future obligations in Mexican peso (local trade payables, payroll, taxes and etc.). Since the cash of this subsidiary is maintained in U.S. dollar, these operations were contracted to ensure cash flow balance.
Balance at Balance at2012 Addition Reversion 2013
Exchange variation of foreign sales hedge 0 - 2,303,540 - 2,303,540 Income tax and social contribution on foreign sales hedge 0 - (783,204) - (783,204)
Fair value of cash flow hedges, net of taxes - 1,520,336 - 1,520,336
Nominal value Foreign exchange Fair valueUS$ thousands (hedge) 2013 2012
Deliverable Forward 41,020 13.1120 January-2014 3,620 Deliverable Forward 35,453 13.1428 February-2014 3,815 Deliverable Forward 39,206 13.1742 March-2014 4,065 Deliverable Forward 42,391 13.1998 April-2014 3,468 Deliverable Forward 32,410 13.2305 June-2014 3,164 Deliverable Forward 36,844 13.2645 June-2014 3,624 Deliverable Forward 36,839 13.2953 July-2014 3,612 Deliverable Forward 33,627 13.3273 September-2014 3,281 Deliverable Forward 30,750 13.3544 September-2014 2,988 Deliverable Forward 30,079 13.3871 Octuber-2014 2,923 Deliverable Forward 27,843 13.4200 December-2014 2,707 Deliverable Forward 24,091 13.4519 December-2014 2,344 Deliverable Forward 22,522 13.4906 February-2015 2,202 Deliverable Forward 18,209 13.5217 March-2015 1,788 Deliverable Forward 15,394 13.5551 March-2015 1,519 Deliverable Forward 9,703 13.5896 April-2015 961 Deliverable Forward 5,299 13.6264 June-2015 525 Deliverable Forward 3,191 13.6598 June-2015 317 Deliverable Forward 1,769 13.6952 July-2015 176 Deliverable Forward 1,840 13.7306 August-2015 181 Total 488,480 47,280 -
Current liabilities (derivatives operations) 47,280 Total 47,280 -
Identification Maturity

Braskem S.A. Notes to the financial statements Years ended December 31, 2013 All amounts in thousands of reais
85
(c.i.ii) Currency futures contract - Euro
Braskem Idesa contracted currency purchase transactions through futures contracts to hedge its future obligations in euro (trade payables). Since the cash of this subsidiary is maintained in U.S. dollar, these operations were contracted to ensure cash flow balance.
(c.ii) Operations designated for hedge accounting
(c.ii.i) Interest rate swap linked to Libor
On December 31, 2013, Braskem Idesa held 6 interest rate swap contracts for a nominal value of US$1,312,892 thousand, contracted on the future disbursements of the project finance (Note 19) contracted in U.S. dollar at floating rates (based on Libor). In these swaps, Braskem Idesa receives floating rates (Libor) and pays fixed rates periodically, coinciding with the financing cash flows. The objective of these swaps is to offset the changes in the future financial expenses from debt caused by changes in the Libor rate. The term, amount, settlement dates and floating interest rates coincide with the terms of the project finance.
Before designating these swap operations as hedge accounting, on September 1, 2013, the Company recognized financial income of R$116,007 as profit in the fiscal year. After recognizing such designation, in shareholders’ equity, the Company recognized financial expense of R$469 relating to changes in the fair value of these swaps since the designation through December 31, 2013.
Nominal value Foreign exchange Fair valueUS$ thousands (hedge) 2013 2012
Deliverable Forward 8,485 1.3053 January-2014 (1,119)Deliverable Forward 6,096 1.3059 January-2014 (801)Deliverable Forward 7,839 1.3066 March-2014 (1,020)Deliverable Forward 3,287 1.3068 March-2014 (426)Deliverable Forward 6,501 1.3079 June-2014 (831)Deliverable Forward 6,555 1.3089 July-2014 (825)Total 38,763 (5,022) -
Current assets (other receivables) (5,022)Total (5,022) -
Identification Maturity
Nominal value Interest rate Fair valueUS$ thousands (hedge) 2013 2012
Swap Libor I 299,996 1.9825% May-2025 (25,124)Swap Libor II 299,996 1.9825% May-2025 (25,213)Swap Libor III 299,996 1.9825% May-2025 (25,213)Swap Libor IV 129,976 1.9825% May-2025 (10,924)Swap Libor V 132,996 1.9825% May-2025 (11,178)Swap Libor VI 149,932 1.9825% May-2025 (12,601)Total 1,312,892 (110,253) -
Non-Current assets (other receivables) (137,345)Current liabilities (derivatives operations) 27,092 Total (110,253) -
Identification Maturity

Braskem S.A. Notes to the financial statements Years ended December 31, 2013 All amounts in thousands of reais
86
(d) Estimated maximum loss On December, 31, 2013, the amount at risk of the derivatives held by Braskem, which is defined as the highest loss that could result in one month and in 95% of the cases under normal market conditions, was estimated by the Company at R$31,045 (US$13,252 thousand) for the NCE swap designated for hedge accounting and R$1,773 for the NCE swap that is not designated for hedge accounting. The value at risk of derivatives related to the Ethylene XXI Project in Mexico in 95% of the cases, under normal market conditions, was estimated at R$23,101 (US$9.861 thousand) for the Libor derivative and R$3,342 (US$1.426 thousand) for the derivative of Mexican pesos.
20.3 Credit quality of financial assets
(a) Trade accounts receivable Virtually none of Braskem’s clients have risk ratings assigned by credit rating agencies. For this reason, Braskem developed its own credit rating system for all accounts receivable from domestic clients and for part of the accounts receivable from foreign clients. Braskem does not apply this rating to all of its foreign clients because most accounts receivable from them are covered by an insurance policy or letters of credit issued by banks. On December 31, 2013, the credit ratings for the domestic market were as follows:
(%) 2013 2012
1 Minimum risk 16.56 21.19 2 Low risk 32.61 32.04 3 Moderate risk 23.54 33.68 4 High risk 26.26 4.23 5 Very high risk (i) 1.03 8.85
(i) Most clients in this group are inactive and the respective accounts are in the process of collection actions in the courts. Clients in this group that are still active buy from Braskem and pay in advance. Default indicators for the periods ended:
Domestic Market (LTM)
Export Market (LTM)
December 31, 2013 0.14% 0.13% December 31, 2012 0.28% 0.37% December 31, 2011 0.18% 0.43% LTM – last 12 months

Braskem S.A. Notes to the financial statements Years ended December 31, 2013 All amounts in thousands of reais
87
(b) Other financial assets In order to determine the credit ratings of counterparties in financial assets classified as cash and cash equivalents, held-for-trading, held-to-maturity and loans and receivables, Braskem uses the following credit rating agencies: Standard & Poor’s, Moody’s and Fitch Ratings.
(i) Financial assets with no internal or external ratings and approved by the Management of the Company. (ii) Investment funds with no internal and external risk assessment whose portfolio is composed of assets from major
financial institutions and that comply with Braskem’s financial policy. (iii) Risk-free financial assets Braskem’s financial policy determines “A-” as the minimum rating for financial investments.
20.4 Sensitivity analysis Financial instruments, including derivatives, may be subject to changes in their fair value as a result of the variation in commodity prices, foreign exchange rates, interest rates, shares and share indexes, price indexes and other variables. The sensitivity of the derivative and non-derivative financial instruments to these variables are presented below:
(a) Selection of risks On December 31, 2013, the main risks that can affect the value of Braskem’s financial instruments are: • Brazilian real/U.S. dollar exchange rate; • Mexican peso/U.S. dollar exchange rate; • Euro/U.S. dollar exchange rate; • Libor floating interest rate; • CDI interest rate; and • TJLP interest rate.
2013 2012Financial assets with risk assessment
AAA 3,436,378 2,484,788 AA+ - 190,660 AA 93,955 5 AA- - 449,555 A+ - 120,123 A 865,105 19 A- 1,485 80,231
4,396,923 3,325,381 Financial assets without risk assessment
Quotas of investment funds in credit rights (i) 40,696 103,359 Sundry funds (ii) 3,773 60,356 Restricted deposits (iii) - 1,281 Other financial assets with no risk assessment 1,965 3,880
46,434 168,876
Total 4,443,357 3,494,257

Braskem S.A. Notes to the financial statements Years ended December 31, 2013 All amounts in thousands of reais
88
For the purposes of the risk sensitivity analysis, Braskem presents the exposures to currencies as if they were independent, that is, without reflecting in the exposure to a foreign exchange rate the risks of the variation in other foreign exchange rates that could be directly influenced by it.
(b) Selection of scenarios In accordance with CVM Instruction No. 475/08, Braskem included three scenarios in the sensitivity analysis, with one that is probable and two that represent adverse effects to the Company. In the preparation of the adverse scenarios, only the impact of the variables on the financial instruments, including derivatives, and on the items covered by hedge transactions, was considered. The overall impacts on Braskem’s operations, such as those arising from the revaluation of inventories and revenue and future costs, were not considered. Since Braskem manages its exposure to foreign exchange rate risk on a net basis, adverse effects from depreciation in the Brazilian real in relation to the U.S. dollar can be offset by opposing effects on Braskem’s operating results.
(b.1) Probable scenario The Market Readout published by the Central Bank of Brazil on December 27, 2013 was used to create the probable scenario for the U.S. dollar/Brazilian real exchange rate and the CDI interest rate, using the reference date of December 31, 2013. The Market Readout presents a consensus of market expectations based on a survey of the forecasts made by various financial and non-financial institutions. According to the Market Readout, by the end of 2014, the U.S. dollar will appreciate 4.58% against the Brazilian real compared to the end of 2013, and the CDI rate will be 10.50%. The Market Readout does not publish forecasts for the interest rates Libor and TJLP. Therefore, Braskem considered the expectations for the CDI interest rate for determining the probable scenario for those rates, given their correspondence. The probable scenario for the TJLP is an increase of 0.5% from the current rate of 5%, in line with the size of the government’s most recent decisions to increase or decrease the rate, and accompanying the forecast for the cumulative increase in the CDI rate by end-2014 of 0.50%.
(b.2) Possible and extreme adverse scenarios For the Brazilian real/U.S. dollar and the Mexican peso/U.S. dollar exchange rates, a positive change of 25% was considered for the possible adverse scenario and of 50% for the extreme scenario based on the exchange rate on December 31, 2013. For the Euro/U.S. dollar exchange rate, a negative change of 25% was considered for the possible adverse scenario and of 50% for the extreme scenario based on the rate on December 31, 2013. For the Libor and CDI interest rates, a positive change of 25% was considered for the possible adverse scenario and of 50% for the extreme scenario based on their respective rates on December 31, 2013. For the TJLP interest rate, an increase of 1% was considered for the possible adverse scenario and of 1.5% for the extreme scenario based on its rate on December 31, 2013, in accordance with the upward or downward adjustments made by the government in the rate, in this order of scale. The sensitivity values in the table (c) below are the changes in the value of the financial instruments in each scenario. Tables (d), (e), (f), (g) and (h) show the changes in future cash flows.

Braskem S.A. Notes to the financial statements Years ended December 31, 2013 All amounts in thousands of reais
89
(c) Sensitivity to the Brazilian real/U.S. dollar exchange rate
The sensitivity of each financial instrument, including derivatives and items covered by them, to the variation in the Brazilian real/US dollar exchange rate is presented in the table below:
(d) Sensitivity to the Mexican peso/U.S. dollar exchange rate The sensitivity of each financial instrument, including derivatives and items covered by them, to the variation in the Mexican peso/U.S. dollar exchange rate is presented in the table below:
(e) Sensitivity to the Euro/U.S. dollar exchange rate The sensitivity of each financial instrument, including derivatives and items covered by them, to the variation in the Euro/U.S. dollar exchange rate is presented in the table below:
(f) Sensitivity of future cash flows to the Libor floating interest rate The sensitivity of future interest income and expenses of each financial instrument, including derivatives and items covered by them, is presented in the table below. The figures represent the impact on financial income (expenses), taking into consideration the average term of the respective instrument.
Possible adverse Extreme adverseInstrument Probable (25% ) (50% )
Bonds and MTN (478,295) (2,608,132) (5,216,263)Advance on exchange contracts (5,370) (29,283) (58,566)BNDES (20,771) (113,266) (226,533)Working capital / structured operations (67,701) (369,173) (738,346)Raw material financing (58) (317) (634)Export prepayments (24,791) (135,186) (270,372)Financial investments abroad 74,884 408,340 816,679 Swaps (93,287) (355,034) (675,561)
Possible adverse Extreme adverseInstrument Probable (25% ) (50% )
Project finance (65,712) (504,931) (1,009,862)Deliverable Forward (33,999) (216,414) (361,505)
Possible adverse Extreme adverseInstrument Probable (25% ) (50% )
Deliverable Forward (1,466) (23,957) (47,914)
Possible adverse Extreme adverseInstrument Probable (25% ) (50% )
Borrowings (998) (4,992) (9,984)Export prepayments (2,102) (10,510) (21,020)Swaps 1,703 (8,513) (17,026)

Braskem S.A. Notes to the financial statements Years ended December 31, 2013 All amounts in thousands of reais
90
(g) Sensitivity of future cash flows to the CDI interest rate The sensitivity of each financial instrument, including derivatives and items covered by them, to the variation in CDI interest rate is presented in the table below:
(h) Sensitivity of future cash flows to the TJLP interest rate The sensitivity of each financial instrument, including derivatives and items covered by them, to the variation in TJLP interest rate is presented in the table below:
21 Taxes payable
(a) Tax debt refinancing program – Law 11,941/09 In 2009, the Parent Company and the subsidiaries Braskem Qpar and Braskem Petroquímica adhered to the federal tax debit refinancing program established by Law 11.941 on May 27, 2009. The associated installments were deferred over a maximum of 180 months, which is the maximum limit permitted by said law. The law also provides for the possibility of amortizing at least 12 installments with the same reduction in penalties and interest applicable to the payment in cash of tax debits that fall under the scope of this law.
Possible adverse Extreme adverseInstrument Probable (25% ) (50% )
Export credit notes (4,294) (20,898) (40,442)Agricultural credit note (39,666) (182,183) (329,235)Financial investments in local currency (9,878) (49,376) (98,720)
Probable Possible adverse Extreme adverseInstrument 5.5% 6.0% 6.5%
BNDES (43,377) (85,661) (126,884)FINEP (113) (225) (335)Other governmental agents (31) (61) (91)
2013 2012 2013 2012
Parent Company and subsidiaries in BrazilIPI 81,282 71,440 60,355 55,609 PIS and COFINS 615 5,764 - - Income tax and social contribution 52,226 54,987 21,200 16,983 ICMS 120,941 72,435 56,077 16,274 Federal tax payment program - Law 11,941/09 (a) 1,024,127 1,237,156 956,884 1,168,413 Other 67,680 59,630 61,423 47,119
Foreign subsidiariesValue-added tax - 2,538 - - Income tax - 2,132 - - Other 1,428 1,460 - -
Total 1,348,299 1,507,542 1,155,939 1,304,398
Current liabilities 445,424 342,789 316,408 245,173 Non-current liabilities 902,875 1,164,753 839,531 1,059,225 Total 1,348,299 1,507,542 1,155,939 1,304,398
Consolidated Parent company
Braskem S.A. Notes to the financial statements Years ended December 31, 2013 All amounts in thousands of reais
91
In June 2012, the Company's Management decided to pay in advance part of the installments of the Parent Company under the program, amortizing 72 installments at once, which amounted to R$403,821. After applying the benefits of cash payment to the amortization, Braskem disbursed R$301,841 on July 31, 2012. The reduction, in the amount of R$101,980, was recognized as follows: (i) the amounts corresponding to the renegotiated tax payments, of R$80,496, were recorded under “other operating income (expenses), net”; and (ii) their restatement by the Selic interest rate, as from the renegotiation date, was recorded under “financial results”, in the amount of R$21,484. In September and December 2013, Brazil’s Federal Revenue Service offset, through a circular, with the approval of the Management, a part of the installments of the parent company, amortizing 39 installments amounting to R$ 156,484. Applying the benefits of cash payment on amortization, Braskem paid R$ 8,200, used credits from the Reintegra program in the amount of R$112,564, and other credits of R$1,658, obtaining a discount of R$34,062. This discount was recognized as follows: (i) the amount corresponding to the renegotiated tax installments, of R$25,063, was recorded under “other net operating income (expenses)”; and (ii) its restatement by the Selic interest rate, from the renegotiation date, was recorded under “financial results”, in the amount of R$8,999. Due to the reopening of the installment program, the Parent Company included a few more tax dues amounting to R$25,965, deferred for payment in up to 180 months. As established in the rules of said installment program, Braskem will lose all the reductions of arrears charges if it fails to pay three installments, whether consecutive or not.
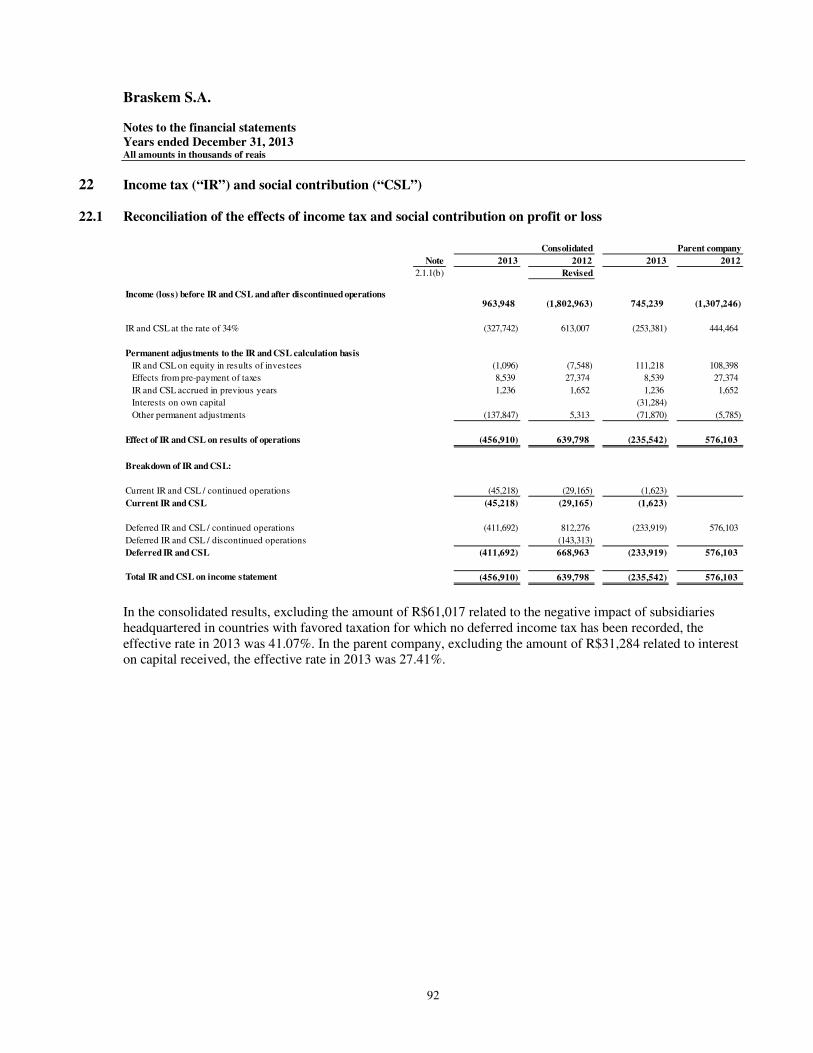
Braskem S.A. Notes to the financial statements Years ended December 31, 2013 All amounts in thousands of reais
92
22 Income tax (“IR”) and social contribution (“CSL”)
22.1 Reconciliation of the effects of income tax and social contribution on profit or loss
In the consolidated results, excluding the amount of R$61,017 related to the negative impact of subsidiaries headquartered in countries with favored taxation for which no deferred income tax has been recorded, the effective rate in 2013 was 41.07%. In the parent company, excluding the amount of R$31,284 related to interest on capital received, the effective rate in 2013 was 27.41%.
Note 2013 2012 2013 2012
2.1.1(b) Revised
Income (loss) before IR and CSL and after discontinued operations963,948 (1,802,963) 745,239 (1,307,246)
IR and CSL at the rate of 34% (327,742) 613,007 (253,381) 444,464
Permanent adjustments to the IR and CSL calculation basisIR and CSL on equity in results of investees (1,096) (7,548) 111,218 108,398 Effects from pre-payment of taxes 8,539 27,374 8,539 27,374 IR and CSL accrued in previous years 1,236 1,652 1,236 1,652 Interests on own capital - - (31,284) - Other permanent adjustments (137,847) 5,313 (71,870) (5,785)
Effect of IR and CSL on results of operations (456,910) 639,798 (235,542) 576,103
Breakdown of IR and CSL:
Current IR and CSL / continued operations (45,218) (29,165) (1,623) - Current IR and CSL (45,218) (29,165) (1,623) -
Deferred IR and CSL / continued operations (411,692) 812,276 (233,919) 576,103 Deferred IR and CSL / discontinued operations - (143,313) - - Deferred IR and CSL (411,692) 668,963 (233,919) 576,103
Total IR and CSL on income statement (456,910) 639,798 (235,542) 576,103
Parent companyConsolidated

Braskem S.A. Notes to the financial statements Years ended December 31, 2013 All amounts in thousands of reais
93
The Parent Company has subsidiaries abroad, whose nominal income tax (IR) rates differ from those in Brazil, of 34% (IR – 25% and CSL - 9%), as shown below:
(*) Country with favored taxation – rate of 0%.
Headquarters
(Country) 2013
Braskem America and Braskem America Finance USA 35.00 Braskem Argentina Argentina 35.00 Braskem Austria Finance Austria 25.00 Braskem Chile Chile 20.00 Braskem Alemanha Germany 31.90 Braskem Finance and Braskem Inc Cayman Islands*Braskem Idesa, Braskem Idesa Serviços and Braskem México Mexico 30.00 Braskem Austria Austria 25.00 Braskem Holanda Netherland 25.00 Petroquímica Chile Chile 20.00 Braskem Espanha Spain 30.00 Common British Virgin Islands*Lantana Bahamas*Norfolk Uruguay 25.00
Official rate - %
Direct and Indirect subsidiaries

Braskem S.A. Notes to the financial statements Years ended December 31, 2013 All amounts in thousands of reais
94
22.2 Deferred income tax and social contribution
(a) Breakdown of and changes in deferred IR and CSL
Consolidated
Deferred tax - assets NoteAs of December
31, 2012
Transfers of non-current
assets held for sale
Impact on the result (expense) income
Impact on the equity / (decrease) increase
As of December 31, 2013
2.1.1(a) RevisedTax losses (IR) and negative base (CSL) 1,099,345 (83,758) 0 1,015,587Goodwill amortized 31,432 (19,367) 0 12,065Exchange variations 215,545 575,963 0 791,508Temporary adjustments 362,198 4,112 44,594 (2,671) 408,233Business combination 243,517 (11,478) 0 232,039Pension plan 49,912 12,015 0 61,927Deferred charges - write-off 60,060 (22,089) 0 37,971Investments in subsidiaries (CPC-18) 0 94,276 0 94,276
Total assets 2,062,009 4,112 590,156 (2,671) 2,653,606
Consolidated
Deferred tax - liabilitiesAs of December
31, 2012
Transfers of non-current
liabilities held for sale
Impact on the result (income) expense
Impact on the equity / (increase) decrease
As of December 31, 2013
Amortization of goodwill based on future profitability 586,857 56,193 0 643,050Tax depreciation 391,224 150,101 0 541,325Temporary differences 327,500 260 22,134 76,292 426,186Business combination 624,817 (39,567) 0 585,250Write-off negative goodwill of incorporated subsidiaries 1,781 (594) 0 1,187Additional indexation PP&E 154,189 (14,032) 0 140,157Hedge accounting 0 823,324 (823,324) 0Other 52,254 4,289 0 56,543
Total liabilities 2,138,622 260 1,001,848 (747,032) 2,393,698
Parent company
Deferred tax - assetsAs of December
31, 2012Impact on the result
(expense) incomeImpact on the equity /
(decrease) increaseAs of December
31, 2013
Tax losses (IR) and negative base (CSL) 444,332 (1,147) 0 443,185Goodwill amortized 28,126 (18,936) 0 9,190Exchange variations 205,725 570,116 0 775,841Temporary adjustments 277,549 17,945 0 295,494Business combination 89,770 0 0 89,770Pension plan 49,912 12,015 0 61,927Deferred charges - write-off 5,197 (5,197) 0 0Investments in subsidiaries (CPC-18) 0 94,276 0 94,276
Total assets 1,100,611 669,072 0 1,769,683
Parent company
Deferred tax - liabilitiesAs of December
31, 2012Impact on the result
(income) expenseImpact on the equity /
(increase) decreaseAs of December
31, 2013
Amortization of goodwill based on future profitability 510,308 34,093 0 544,401Tax depreciation 208,849 60,344 0 269,193Temporary differences 8,014 (588) 0 7,426Business combination 85,746 (2,196) 0 83,550Write-off negative goodwill of incorporated subsidiaries 1,781 (594) 0 1,187Additional indexation PP&E 154,188 (14,031) 0 140,157Other 46,857 2,639 0 49,496Hedge accounting 0 823,324 (823,324) 0
Total liabilities 1,015,743 902,991 (823,324) 1,095,410

Braskem S.A. Notes to the financial statements Years ended December 31, 2013 All amounts in thousands of reais
95
(b) Net balance of deferred income and social contribution tax assets and liabilities
Headquarters (Country) IR-CSL Asset IR-CSL Liability
Braskem S.A. Brazil 1,769,683 (1,095,410) Braskem Argentina Argentina 5,552 - Braskem Alemanha Germany 67,910 - Braskem Idesa Mexico 57,613 (52,554) Braskem Petroquímica Brazil 215,348 (129,022) Petroquímica Chile Chile 123 - Braskem Qpar Brazil 532,285 (755,006) Braskem America USA - (361,706) IQAG Brazil 23 - Quantiq Brazil 5,069 -
2,653,606 (2,393,698)
2013
Headquarters (Country) IR-CSL Asset IR-CSL Liability
Braskem S.A. Brazil 1,100,611 (1,015,743) Braskem Argentina Argentina 3,251 - Braskem Alemanha Germany 17,448 (9,176) Braskem Idesa Mexico 24,677 - Braskem Petroquímica Brazil 214,430 (93,256) Petroquímica Chile Chile 168 - Braskem Qpar Brazil 459,914 (626,807) Riopol Brazil 237,944 (88,201) Braskem America USA 3,566 (305,439)
2,062,009 (2,138,622)
2012

Braskem S.A. Notes to the financial statements Years ended December 31, 2013 All amounts in thousands of reais
96
(c) Realization of deferred income tax and social contribution
Basis for constitution and realization: (i) Goodwill recognized from merged investments amortized prior to Law 11,638/07, which are controlled in the Taxable
Income Journal (LALUR). Realization is based on the tax rules for amortization. (ii) Exchange variation of assets and liabilities denominated in foreign currency, whose tax realization is recognized upon
their receipt or settlement. (iii) Accounting expenses not yet deductible for calculating income tax and social contribution, whose recognition for tax
purposes occurs in subsequent periods. (iv) Refers to: (i) tax-related goodwill generated by the acquisition of Quattor and (ii) contingencies recognized from
business combinations at Quattor. Tax realization of goodwill will occur upon the merger of the investments and contingencies arising from write-offs due to the settlement or reversal of the processes involved.
(v) Provision for the defined-benefit plan at Petros Copesul, with realization expected for 2014. (vi) Amounts constituted based on the deferred assets written off due to the adoption of Law 11,638/07. Tax realization is
based on the application of the amortization rate used prior to the adoption of this law. (vii) Realization will take place in the first quarter of 2014. (viii) Goodwill for the future profitability of the merged companies not amortized since the adoption of Law 11,638/07. Tax
realization is associated with the impairment or realization of assets related to goodwill. (ix) Difference between the accounting and tax depreciation rates in accordance with Normative Rule nº1 of July 29,
2011. (x) Accounting revenues not yet taxable for calculation of income tax and social contribution, whose taxation will occur
in subsequent periods. (xi) Added value on property, plant and equipment and intangible assets identified in business combinations at Quattor,
Unipar and Petroquímica Triunfo, whose tax realization is based on the depreciation and amortization of these assets. (xii) Write-off of negative goodwill from the merged company Cinal, which was offered as tax based on the amortization
of taxes. (xiii) Adjustments to the additional indexation of property, plant and equipment, whose tax realization is based on the
depreciation of assets. Annually, the Company revises its projection of taxable income using as base the Business Plan, which is approved by the Company’s Management, using as key variables those described in Note 3.1. If this projection indicates that the taxable income will not be sufficient to absorb the deferred taxes, the amount corresponding to portion of the asset that will not be recovered is written off.
Consolidated Parent companyDecember 31, 2015 and 2017 and 2019 December 31, 2015 and 2017 and 2019
Deferred tax - assets Note 2013 2014 2016 2018 thereafter 2013 2014 2016 2018 thereafter
Tax losses (IR) and negative base (CSL) 2.19 1,015,587 66,986 390,957 398,657 158,987 443,185 41,053 203,606 191,285 7,241Goodwill amortized (i) 12,065 2,210 3,650 1,934 4,271 9,190 1,779 2,787 1,072 3,552Exchange variations (ii) 791,508 0 0 0 791,508 775,841 0 0 0 775,841Temporary adjustments (iii) 408,233 219,936 11,988 7,910 168,399 295,494 200,548 7,020 7,020 80,906Business combination (iv) 232,039 0 0 0 232,039 89,770 0 0 0 89,770Pension plan tax (v) 61,927 61,927 0 0 0 61,927 61,927 0 0 0Deferred charges - write-off (vi) 37,971 16,890 21,081 0 0 0 0 0 0 0Investments in subsidiaries (CPC-18) (vii) 94,276 94,276 0 0 0 94,276 94,276 0 0 0
Total assets 0 2,653,606 462,225 427,676 408,501 1,355,204 1,769,683 399,583 213,413 199,377 957,310
Consolidated Parent companyDecember 31, 2015 and 2017 and 2019 December 31, 2015 and 2017 and 2019
Deferred tax - liabilities Note 2013 2014 2016 2018 thereafter 2013 2014 2016 2018 thereafter
Amortization of goodwill based on future profitability (viii) 643,050 0 0 0 643,050 544,401 0 0 0 544,401Tax depreciation (ix) 541,325 0 0 0 541,325 269,193 0 0 0 269,193Temporary differences (x) 426,186 38,743 77,486 78,518 231,439 7,426 590 1,180 2,597 3,059Business combination (xi) 585,250 40,469 80,938 80,938 382,905 83,550 2,201 4,401 4,401 72,547Write-off negative goodwill of incorporated subsidiaries (xii) 1,187 594 593 0 0 1,187 594 593 0 0Additional indexation PP&E (xiii) 140,157 14,031 28,062 28,062 70,002 140,157 14,031 28,062 28,062 70,002Other 56,543 0 0 0 56,543 49,496 0 0 0 49,496
Total liabilities 0 2,393,698 93,837 187,079 187,518 1,925,264 1,095,410 17,416 34,236 35,060 1,008,698
Braskem S.A. Notes to the financial statements Years ended December 31, 2013 All amounts in thousands of reais
97
22.3 Provisional Presidential Decree No. 627 On November 11, 2013, PPD 627 was passed, which introduced several provisions, notably the following: (i) revocation of the Transitional Tax System (RTT); (ii) changes to Decree-Law 1,598/77 related to Corporate Income Tax, and to the law related to Social Contribution; (iii) provision that any changes or adoption of accounting methods and criteria through administrative acts issued based on the powers granted by business law, after the publication of this PPD, will not have any implication in the calculation of federal taxes until the applicable tax law regulates the matter; (iv) inclusion of specific treatment on the taxation of profits or dividends; (v) provisions for the calculation of interest on capital; and (vi) new considerations on investments valued using the equity accounting method. The PPD mentioned in items (i) to (iii) above came into effect in 2015. However, the Decree allows taxpayers to choose to advance the effects to 2014 as a condition for eliminating any tax effects related to dividends paid up to the date of publication of said Decree, the calculation of interest on capital and the valuation of significant investments in subsidiaries and associated companies using the equity accounting method. Though there is the possibility of the Company announcing the early adoption, the final decision on the effective exercise of said option will be taken when the PPD is made into law. The Company conducted studies on the possible effects that could arise from the adoption of this PPD and concluded that it there are no material adjustments to its financial statements of December 31, 2013.
23 Sundry provisions
(a) Provision for client bonus
Some sales agreements of Braskem provide for a rebate, in products, should some sales volumes be achieved within the year, six-month period or three-month period, depending on the agreement. The rebate is monthly recognized in a provision, assuming that the minimum contractual amount will be achieved. As they are recognized based on contracts, the provisions are not subject to significant uncertainties with respect to their amount or settlement.
(b) Provision for recovery of environmental damages
Braskem has a provision for future expenses for the recovery of environmental damages in some of its industrial plants. The term estimated for this recovery is measured at present value.
Note 2013 2012 2013 2012Measures to
Provision for customers bonus (a) 45,060 40,666 18,058 5,594 Provision for recovery of environmental damages (b) 132,762 32,944 96,182 25,015 Judicial and administrative provisions (c) 362,896 333,218 172,758 126,103 Other 14,832 8,847 - -
Total 555,550 415,675 286,998 156,712
Current liabilities 105,856 52,264 60,991 11,930 Non-current liabilities 449,694 363,411 226,007 144,782 Total 555,550 415,675 286,998 156,712
Consolidated Parent company

Braskem S.A. Notes to the financial statements Years ended December 31, 2013 All amounts in thousands of reais
98
(c) Judicial and administrative provisions As presented below, Braskem maintains a provision for legal and administrative proceedings against the Company, for which the chances of loss are considered probable, and tax claims against Quattor, for which the chances of loss are considered possible on April 30, 2010, date on which the control of Quattor was acquired.
(c.1) Labor claims
On December 31, 2013, the Company is involved in 358 labor claims, including occupational health and security cases, which were assessed as probable losses. For these claims, the Company maintains a provision of R$125,887 which corresponds to the expected amount of disbursement upon their resolution. The Company’s legal advisors estimate that the term for the termination of these types of claims in Brazil exceeds 5 years. The estimates related to the outcome of proceedings and the possibility of future disbursement may change in view of new decisions in higher courts. The Company’s Management believes that the chances of having to increase the existing provision amount are remote.
(c.2) Tax claims
On December 31, 2013, Braskem has recognized a provision in the amount of R$61,372 for claims from the Brazilian tax authorities and the chances of loss for which are considered probable. On the same date, the Company has recognized a provision in the amount of R$165,618 for these claims arising from business combination and the chances of loss for which are considered possible. On December 31, 2013, the main tax claims for which the Company maintains a provision are the following:
(i) Income tax and social contribution
At the administrative level, the subsidiary Braskem Petroquímica is assessed for the payment of such taxes, in the amount of R$32,319 as of December 31, 2013, represented mostly by income tax and social contribution on the foreign exchange variation in the account of investments in foreign subsidiaries in 2002. The amount of the provision recognized is based on the estimate of future disbursement made by an external legal advisor taking into consideration the case law on the matter at the administrative and judicial levels.
There is no judicial deposit or other type of guarantee for this claim. The Company’s Management expects this case to be terminated by 2015.
Note 2013 2012 2013 2012
Labor claims (c.1) 125,887 75,697 113,555 68,375
Tax claims (c.2)Income tax and social contribution (i) 32,319 29,980 - - PIS and COFINS (ii) 35,634 32,929 - - ICMS - interstate purchases (iii) 86,233 79,688 - - ICMS - other (iv) 11,432 56,974 - - Other 61,372 50,744 49,186 50,744
Societary claims and other 10,019 7,206 10,017 6,984 362,896 333,218 172,758 126,103
Consolidated Parent company

Braskem S.A. Notes to the financial statements Years ended December 31, 2013 All amounts in thousands of reais
99
(ii) PIS and COFINS taxes The subsidiary Braskem Petroquímica is assessed for the payment of these taxes in many claims, such as: • allegedly insufficient payment of COFINS for the period from March 1999 to December 2000, from
February 2001 to March 2002, from May to July 2002 and September 2002 due to alleged calculation errors by tax authorities, of widening the tax calculation base and increasing the contribution rate envisaged in Law 9,718/98;
• offset of the COFINS dues relating to September and October 1999 using the credit resulting from the addition of 1% to the COFINS rate;
• rejection of the offset of PIS and COFINS dues relating to the period from February to April 2002 using
the PIS credits under Decree-Laws 2,445 and 2,449, calculated between June 1990 and October 1995, under the argument that the time period for using said credits had expired;
• alleged non-taxation of revenue in the calculation basis of income arising from foreign exchange variations on assets, determined as a result of successive reductions in the capital of the associated company.
On December 31, 2013, the total amount involved in these claims is R$35,634. The amount of the provision recognized is based on the estimate of future disbursement made by an external legal advisor taking into consideration the case law on the matters at the administrative and judicial levels. Guarantees were offered for these claims in the form of bank guarantee and finished products manufactured by Braskem Petroquímica, which, together, cover the amount of the claims. The Company’s Management estimates that these cases should be terminated by 2020.
(iii) ICMS - interstate purchases
In 2009, the subsidiary Braskem Qpar was assessed by the Finance Department of the State of São Paulo for the payment, at the administrative level, of ICMS in view of: • use of tax credits in the periods from February 2004 to August 2005, November 2005 to February 2006,
and September 2006 to January 2008, arising from the bookkeeping of credits that were presented in the purchase invoices of products acquired from another company, since the operations were aimed at the export of the products and, as such, they would not be subject to ICMS;
• issue of invoices without registering the shipment of the goods from its facilities for storage; and
• non-presentation of the tax documents requested by inspection authorities. On December 31, 2013, the amount involved is R$86,233. The amount of the provision recognized is based on the estimate of future disbursement made by an external legal advisor taking into consideration the case law on the matters at the administrative and judicial levels. No judicial deposits or other types of security were accrued for this procedure.

Braskem S.A. Notes to the financial statements Years ended December 31, 2013 All amounts in thousands of reais
100
Management estimates that this case should be terminated by 2019.
(iv) ICMS - sundry violations The subsidiary Braskem Qpar was served a tax deficiency notice by the Finance Department of the State of São Paulo, demanding (i) the payment of ICMS tax in view of the alleged non-payment of the tax from 2002 to 2004 while carrying out interstate sales to taxpayers located in other states though the goods never left the state of São Paulo, and (ii) the payment of ICMS and fines for using tax credits from August 2004 to November 2005, issue of tax documents without the corresponding exit of goods, and allegedly failure to submit the requested tax documents. In 2013, Braskem paid R$47,746 (Note 15), taking advantage of the Special Installment Program announced by the São Paulo state government, thereby eliminating the contingency described in item (i) above, while the amount of R$28,581 relating to the contingency described in item (ii).
The amount of the provision recognized is based on the estimate of disbursement made by an external legal advisor taking into consideration the case law on the matters at the administrative and judicial levels. No judicial deposits or other types of security were accrued for this procedure. Management estimates that these cases should be terminated by 2020.
(d) Changes in provisions
Recovery ofenvironmental Legal
Bonus damage provisions Other Total
December 31, 2012 40,666 32,944 333,218 8,847 415,675
Additions, inflation adjustments and exchange variation, net 58,794 96,589 92,575 5,985 253,943 Write-offs through usage and payments (54,400) 3,229 (62,897) - (114,068)
- December 31, 2013 45,060 132,762 362,896 14,832 555,550
Consolidated
Recovery ofenvironmental Legal
Bonus damage provisions Total
December 31, 2012 5,594 25,015 126,103 156,712
Additions, inflation adjustments and exchange variation, net 28,805 66,088 46,716 141,609 Write-offs through usage and payments (16,341) 5,079 (61) (11,323)
December 31, 2013 18,058 96,182 172,758 286,998
Parent company

Braskem S.A. Notes to the financial statements Years ended December 31, 2013 All amounts in thousands of reais
101
24 Long-term incentive A long-term non-share-based plan (“ILP”) was approved at the Shareholders’ Meeting held in September 2005, under which the participants in strategic programs can acquire securities issued by the Company that are called “Certificates of Investment Units”. The objective of the plan is, among others, to align the interests of participants in strategic programs in the creation of long-term value with those of shareholders, in order to motivate the vision and commitment of these participants to long-term results. No new certificates have been issued since 2008, and the transactions under this program are, since then, limited to redemptions. The balances at December 31, 2013 and 2012 are as follows:
25 Post-employment benefits
25.1 Defined contribution plans
(a) ODEPREV
The Company maintains a defined contribution plan for its employees managed by ODEPREV, a private pension plan entity created by Odebrecht. ODEPREV offers its participants, which are employees of the sponsoring companies, an optional defined contribution plan in which monthly and additional participant contributions and monthly and annual sponsor contributions are made to individual pension savings accounts. On December 31, 2013, the number of active participants in ODEPREV totals 5,451 (2012 - 5,404). The contributions made by the Company in the year amount to R$19,703 (2012 - R$24,898) and the contributions made by the participants amounted to R$46,411 (2012 - R$44,070).
(b) Triunfo Vida Braskem, due to the merger of Petroquímica Triunfo S.A., became a sponsor of Triunfo Vida. On May 31, 2010, the Company requested to withdraw its sponsorship of this plan and on July 27, 2012, PREVIC – National Superintendence of Supplementary Pension Plan (“PREVIC”) approved the withdrawal without the need for any further disbursements by Braskem.
Quantity Amount Quantity Amount
Investment unitsIssued (Alfa units) 377,156 5,254 427,313 6,200 Bonus (Beta units) 341,408 4,020 389,336 4,205
Total 718,564 9,274 816,649 10,405
2013 2012
Braskem S.A. Notes to the financial statements Years ended December 31, 2013 All amounts in thousands of reais
102
25.2 Post-employment benefit plans
(a) PETROS Copesul Plan Braskem, due to the merger of Copesul, became the sponsor of the Petros Copesul plan. On September 28, 2012, PREVIC approved the withdrawal of sponsorship of this plan by Braskem. The payment of the mathematical reserves of participants is expected to be made in 2014. For this reason, the provisioned amount of R$158,122 (Note 25.3.1 (a)) is recorded under current liabilities.
(b) PETROS PQU Plan With the acquisition of Quattor, in April 2010, the Company assumed the liabilities of Petros PQU. On August 6, 2012, PREVIC approved the sponsorship withdrawal process, which had been requested on September 30, 2009. The payment of the mathematical reserves to participants is expected to be made in 2014. Due to the plan’s surplus situation, no provision has been accrued.
25.3 Defined benefit plans
(a) Novamont – Braskem America With the acquisition of Sunoco Chemicals, Braskem America became the sponsor of Novamont, which is a defined benefit plan of the employees of the plant located in the State of West Virginia. On December 31, 2013, the plan has 54 active participants (2012 – 53). In 2013 and 2012, no contributions were made by the Company or by participants.
(b) Braskem Alemanha With the acquisition of the PP business from Dow Chemical, Braskem Alemanha became the sponsor of the defined benefit plan of the employees of the plants located in that country. On December 31, 2013, the plan has 136 (2012 – 96) active participants. In 2013 and 2012, no contributions were made by the Company or by participants. The defined benefit plan of Braskem Alemanha is a non-contribution plan, that is, the contributions of the sponsor are managed directly by the company and this type of plan is allowed by legislation of that country.

Braskem S.A. Notes to the financial statements Years ended December 31, 2013 All amounts in thousands of reais
103
25.3.1 Composition and changes in the balances of the post-employment benefit plans
(a) Amounts in balance sheet
(i) With the adoption of CPC 33 (R1) and IAS 19, the actuarial losses previously unrecognized in these two plans in the amount of
R$18,204 (R$11,816, net of income tax) were recognized retroactively, on December 31, 2012, under "other comprehensive income (loss)". The balance sheet on that date was restated to reflect the changes to the item “post-employment benefits”. For comparison purposes, the information for December 31, 2011 was not revised in the statement of changes in shareholders’ equity, since the amounts are immaterial.
Note 2013 2012 2013 20122.1.1(a) Revised
Post-employment benefitsPetros Copesul 158,122 147,175 158,122 147,175
Defined benefitNovamont Braskem America (i) 9,554 10,381 Braskem Alemanha (i) 34,515 26,221
44,069 36,602
202,191 183,777 158,122 147,175
Current liabilities 158,137 147,175 158,122 147,175 Non-current liabilities 44,054 36,602 - - Total 202,191 183,777 158,122 147,175
Consolidated Parent company
ConsolidatedDefined benefits Note 2013 2012
2.1.1(a) RevisedBenefit obligations (67,668) (56,338) Fair value of plan assets 23,599 19,736 Funded status of the plan (44,069) (36,602) Consolidated net balance (44,069) (36,602)
In non-current liability (44,069) (36,602) (44,069) (36,602)

Braskem S.A. Notes to the financial statements Years ended December 31, 2013 All amounts in thousands of reais
104
(b) Change in obligations
(c) Change in fair value plan assets
(d) Amounts recognized in profit or loss
The amounts recognized in the statement of operations refer to transactions involving the defined benefit pension plans that are recognized in “other operating (revenues) expenses, net” and in “financial results”, depending on their nature.
ConsolidatedNote 2013 2012
2.1.1(a) RevisedBalance at beginning of year 56,338 37,166 Current service cost 2,593 1,255 Interest cost 2,561 2,138 Benefits paid (1,693) (2,561) Actuarial losses (gain) (909) 14,769 Exchange variation 8,778 3,571 Balance at the end of the year 67,668 56,338
- -
ConsolidatedNote 2013 2012
2.1.1(a) RevisedBalance at beginning of year 19,736 18,981 Actual return on plan assets 1,158 314 Employer contributions 1,392 178 Current expenses - (39) Benefits paid (1,619) (1,406) Exchange variation 2,932 1,708 Balance at the end of the year 23,599 19,736
- -
ConsolidatedNote 2013 2012
2.1.1(a) RevisedCurrent service cost 2,593 1,255 Interest cost 2,547 2,138 Expected return on plan assets (1,614) (1,489) Amortization of actuarial loss 675 74 Amortization of unrecognized service cost 119 104
4,320 2,082

Braskem S.A. Notes to the financial statements Years ended December 31, 2013 All amounts in thousands of reais
105
(e) Actuarial assumptions
(f) Hierarchy of fair value assets
On December 31, 2013, the balance of the fair value of assets is represented by the assets of the Novamont defined benefit plan of Braskem America, which has a level-1 fair value hierarchy. As mentioned in item 25.3(c) of this Note, the defined benefit plans of Braskem Alemanha is not a contribution-based plan and as such, on December 31, 2013, this plan had no assets.
26 Advances from clients
The balance includes advances amounting to R$430,959 (2012 - R$358,428) from four clients overseas for the acquisition of products for supply between February 2013 and December 2016.
27 Other accounts payable
(a) Non-current (i) On August 9, 2010, as part of the business combination of Quattor (currently named Braskem Qpar),
BNDES Participações S.A. (“BNDESPAR”) exercised its option to sell the shares in Riopol, incorporated by Braskem Qpar in August, 2013 (Note 1(b.xix)). The balance, on December 31, 2013, is R$275,743 (2012 - R$256,030).
The purchase price will be paid in 3 installments, with restatement by the TJLP, as follows:
• On June 11, 2015, the amount corresponding to 15% of the purchase price;
• On June 11, 2016, the amount corresponding to 35% of the purchase price; and
• On June 11, 2017, the amount corresponding to 50% of the purchase price.
(ii) amounts payable to the non-controlling shareholder of Braskem Idesa, in the amount of R$370,420, arising
from loans for the Ethylene XXI Project.
2012United UnitedStates Germany States Germany
Discount rate 5.00 3.75 5.00 5.75 Inflation rate 3.00 1.51 3.00 2.00 Expected return on plan assets 7.50 n/a 7.50 n/aRate of increase in future salary levels n/a 3.00 n/a 3.00 Rate of increase in future pension plan n/a n/a n/a n/a
2013 (% )

Braskem S.A. Notes to the financial statements Years ended December 31, 2013 All amounts in thousands of reais
106
28 Contingencies Braskem has contingent liabilities related to lawsuits and administrative proceedings arising from the normal course of its business. These contingencies are of a labor and social security, tax, civil and corporate nature and involve risks of losses that are classified by the Company’s Management as possible. The balance of contingent liabilities not booked as on December 31, 2013 and 2012, as classified:
(a) Labor
On December 31, 2013, the Company is involved in 1,934 indemnity and labor claims for which the chances of loss are considered possible. Among these claims are:
(a.1) Class actions filed by the Union of Workers in the Petrochemical and Chemical Industries in Triunfo (RS), in the second quarter of 2005, claiming the payment of overtime amounting to R$39 million. The chances of loss are deemed as possible.
The Management of the Company does not expect further disbursements to terminate these lawsuits. All lawsuits in progress are with the Superior Labor Court and Management expects them to be judged in 2014. Two of these actions were awarded a final and unappealable decision in favor of the Company. There are not judicial deposits related to these claims.
(a.2) Class actions filed by the Union of Workers in the Petrochemical and Chemical Industries in Triunfo (RS) in the third quarter of 2010 claiming the payment of overtime referring to work breaks and integration into base salary of the remunerated weekly day-off amounting to R$311 million. The Management of the Company does not expect to disburse any amounts upon their closure. The claims are in the fact-finding and appeals phase and they are expected to be granted a final and unappealable decision in the last quarter of 2014. No judicial deposit or other form of security was accrued for these claims.
2013 2012
Labor claims (a) 606,166 698,036 Tax claims (b) 3,399,794 2,967,799 Other lawsuits (c) 389,352 411,324 Total 4,395,312 4,077,159
Consolidated

Braskem S.A. Notes to the financial statements Years ended December 31, 2013 All amounts in thousands of reais
107
(b) Tax
On December 31, 2013, the Company is involved in many proceedings with the Brazilian tax authorities. The Management understands that the chances of loss are possible, but not probable, based on the estimate and opinion of its external advisors. On December 31, 2013 the main tax contingencies, together by matter and totaling at least R$60 million, are the following:
(b.1) ICMS
The Company is involved in many ICMS collection claims related to assessment notices drawn up mainly by the Finance Department of the States of SP, BA and AL. On December 31, 2013, the adjusted amounts of these claims total R$773 million and the claims include the following matters: • ICMS credit on the acquisition of assets that are considered by the Revenue Services as being of use and
consumption. The Revenue Service understands that the asset has to be a physically integral part of the final product to give rise to a credit. Most of the inputs questioned do not physically compose the final product. However, the Judicial branch has a precedent that says that the input must be an integral part of the product or be consumed in the production process;
• ICMS credit arising from the acquisition of assets to be used in property, plant and equipment, which is considered by the Revenue Services as not being related to the production activity, such as laboratory equipment, material for the construction of warehouses, security equipment, etc.;
• transfer of goods for an amount lower than the production cost;
• omission of the entry or shipment of goods based on physical count of inventories;
• lack of evidence that the Company exported goods so that the shipment of the goods is presumably taxed for the domestic market;
• non-payment of ICMS on the sale of products subject to tax substitution and credit from acquisitions of
products subject to tax substitution; and
• fines for the failure to register invoices.
The Company’s legal advisors estimate that: (i) these judicial proceedings are expected to be terminated in 2020, and (ii) in the event of an unfavorable decision to the Company, which is not expected, these contingencies could be settled for up to 40% of the amounts in dispute. This estimate is based on the probability of loss of the Company’s defense theory taking into consideration the case law at the administrative and judicial levels. No judicial deposit or other form of security was accrued for these claims.

Braskem S.A. Notes to the financial statements Years ended December 31, 2013 All amounts in thousands of reais
108
(b.2) COFINS
The Company is involved in collection actions related to COFINS in which the use, by the Company, of certain tax credits to determine and pay this tax is under discussion. These credits arise from (i) legal actions; and (ii) income tax prepayments.
On December 31, 2013, the adjusted amounts involved of these assessments total R$342 million. The Company’s external legal advisors estimate that: (i) these judicial proceedings are expected to be terminated in 2018; and (ii) in the event of an unfavorable decision to the Company, which is not expected, these contingencies could be settled for up to 50% of the amounts in dispute. This estimate is based on the probability of loss of the Company’s defense theory taking into consideration the case law at the administrative and judicial levels. The Company offered assets in guarantee, in the amount of R$136 million, that cover the amount involved in these claims.
(b.3) IPI – presumed credit
The Company is involved in tax assessments that question the undue use of presumed IPI credit as a way to offset the payment of PIS and COFINS levied on the acquisitions of raw materials, intermediate products and packaging material used in the industrialization of exported products. The Revenue Service understands that only the inputs that have been in contact with or have a direct influence on the final product are entitled to the presumed credit. The Judicial branch understands that the products that give rise to the right to the credits are those that (i) are incorporated into the final product; or (ii) are immediately and completely consumed in the production process. On December 31, 2013, the adjusted amount involved of these assessments is R$111 million. The Company’s legal advisors estimate that: (i) the judicial proceeding is expected to be terminated in 2020; and (ii) in the event of an unfavorable decision to the Company, which is not expected, this contingency could be settled for up to 60% of the amount in dispute. This estimate is based on the probability of loss of the Company’s defense theory taking into consideration the case law at the administrative and judicial levels. The Company furnished guarantee of R$ 19 million, which sustains the amount involved in the lawsuit on the issue.

Braskem S.A. Notes to the financial statements Years ended December 31, 2013 All amounts in thousands of reais
109
(b.4) Non-cumulative PIS and COFINS The Company received a deficiency notice from the Brazilian Federal Revenue Service due to the use of non-cumulative PIS and COFINS tax credits related to: (i) expenditures with treatment of effluents; (ii) charges on transmission of electricity; (iii) freight for storage of finished products; and (iv) extemporaneous credits from acquisitions of property, plant and equipment. These deficiency notices have already been contested at the administrative level and comprise the period from 2006 to 2011, and on December 31, 2013 totaled R$712 million, of which R$366 million related to principal and R$346 million of fine and interest. The Company's legal counsel, in view of the recent decisions by the Tax Resources Administrative Board and the evidence provided by the Company, assess as possible the chances of loss at the administrative and legal levels. For this reason, no provision has been accrued for these deficiency notices. Any changes in the court’s understanding of the position could cause future impacts on the financial statements of the Company due to such proceedings. The Company’s external legal counsel expect the proceedings at administrative level to conclude in 2020. No judicial deposit or other form of guarantee was accrued for this claim.
(b.5) IR and CSL – Amortization charges for goodwill and other charges
The Company was served a tax deficiency notice by the Federal Revenue Service for having deducted, between 2007 and 2012, amortization charges from goodwill originated from equity interests acquired in calendar year 2012. That year, several business groups divested their petrochemical assets, the consolidation of which enabled the incorporation of Braskem. On December 31, 2013, the updated value of said income and social contribution tax deficiency notice was R$650 million. In addition to the amounts related to Income and Social Contribution taxes recorded in the notices filed by tax authorities, the company rectified the balances of tax losses and negative social contribution tax bases corresponding to the disallowance of part of the amortization charges on the goodwill mentioned above, and the interest and exchange variation expenses incurred in 2008. The offset amounts represent R$653 million of the balance of tax losses and R$667 million of the balance negative social contribution bases, whose estimated tax impact is equivalent to the principal amount of R$223 million. The Management, based on the opinion of the Company’s legal counsel, believes that the existence of an effective business purpose in the acquisition of the aforementioned petrochemical assets, the participation of third parties in the businesses that originated the goodwill from acquisitions, and the real economic nature of the operations that led to the recording of interest and exchange variation expenses, considers the chances of loss in the administrative and legal spheres as possible. Hence, no provision was accrued for these tax deficiency notices. There is no judicial deposit or any other type of guarantee for all these proceedings.

Braskem S.A. Notes to the financial statements Years ended December 31, 2013 All amounts in thousands of reais
110
(c) Other court disputes involving the Company and its subsidiaries
(c.1) Civil The Company is the defendant in civil lawsuits filed by the owner of a former distributor of caustic soda and by the shipping company that provided services to this former distributor, which, on December 31, 2013, totaled R$123 million. The claimants seek indemnity for damages related to the alleged non-performance of the distribution agreement by the Company. No judicial deposit or other form of guarantee was accrued for these lawsuits. Management's evaluation, supported by the opinion of its external legal advisors who are responsible for the cases, is that the lawsuits will possibly be dismissed within a period of 8 years.
(c.2) Societary
Some shareholders of preferred shares acquired with incentives filed lawsuits, originally against Copene, the former name of the Company, and against the merged companies Nitrocarbono, OPP Química, Salgema, Trikem, Polialden and Politeno. They claim a share in the profit remaining after the payment of priority dividends on the same basis as the common shareholders, in addition to the right to vote in shareholders' meetings until the distribution of dividends in the desired conditions is reestablished. The amount involved in the lawsuits for which there is a possibility of loss is R$17 million. No judicial deposits or other types of security were accrued for these lawsuits. Since the lawsuits are in different phases, the Company’s external legal advisors consider it unfeasible to estimate when these proceedings are expected to be terminated.
(c.3) Social security The Company is a party to various administrative and judicial proceedings concerning social security matters, which total approximately R$137 million on December 31, 2013, as adjusted by the Selic rate. The Management of the Company, based on the opinion of its external legal advisors, understands that no amount is due with respect to these assessments. Additionally, Management believes that is not possible to estimate the amount of disbursement to cover a possible unfavorable decision to the Company, or even estimate when these proceedings will be brought to conclusion. For these proceedings, security was given in the form of judicial deposits and finished products that combined cover the amounts claimed. The Company’s external legal advisors consider it unfeasible to estimate when these proceedings are expected to be terminated.

Braskem S.A. Notes to the financial statements Years ended December 31, 2013 All amounts in thousands of reais
111
29 Equity
(a) Capital On December 31, 2013, the Company's subscribed and paid up capital stock amounted to R$8,043,222 and comprised 797,265,348 shares with no par value divided into 451,668,652 common shares, 345,002,878 class “A” preferred shares, and 593,818 class “B’ preferred shares, distributed as follows:
(i) American Depositary Receipts traded on the New York Stock Exchange (USA). (ii) These share are considered “treasury shares” in the consolidated shareholders’ equity, amounting to R$48,892.
(b) Share rights Preferred shares carry no voting rights, but they ensure priority, non-cumulative annual dividend of 6% of their unit value, according to profits available for distribution. The unit value of the shares is obtained through the division of capital by the total number of outstanding shares. Only class “A” preferred shares will have the same claim on the remaining profit as common shares and will be entitled to dividends only after the priority dividend is paid to preferred shareholders. Only class “A” preferred shares also have the same claim as common shares on the distribution of shares resulting from capitalization of other reserves. Only class “A” preferred shares can be converted into common shares upon resolution of majority voting shareholders present at a General Meeting. Class “B” preferred shares can be converted into class “A” preferred shares at any time, at the ratio of two class “B” preferred shares for one class “A” preferred share, upon a simple written request to the Company, provided that the non-transferability period provided for in specific legislation that allowed for the issue and payment of such shares with tax incentive funds has elapsed. In the event of liquidation of the Company, class “A” and “B” preferred shares will have priority in the reimbursement of capital. Shareholders are entitled to receive a mandatory minimum dividend of 25% on profit for the year, adjusted under Brazilian Corporation Law.
Preferred PreferredCommon shares shares
shares % class A % class B % Total %
OSP e Odebrecht 226,334,623 50.11% 79,182,498 22.96% - 305,517,121 38.32%Petrobras 212,426,951 47.03% 75,591,019 21.91% - 288,017,970 36.13%BNDESPAR - 0.00% 40,102,837 11.62% - 40,102,837 5.03%ADR (i) - 0.00% 34,191,744 9.91% - 34,191,744 4.29%Other 12,907,078 2.86% 114,780,022 33.27% 593,818 100.00% 128,280,918 16.09%Total 451,668,652 100.00% 343,848,120 99.67% 593,818 100.00% 796,110,590 99.86%Braskem shares owned by subsidiary of Braskem Petroquímica (ii) - 1,154,758 0.33% - 1,154,758 0.14%Total 451,668,652 100.00% 345,002,878 100.00% 593,818 100.00% 797,265,348 100.00%

Braskem S.A. Notes to the financial statements Years ended December 31, 2013 All amounts in thousands of reais
112
(c) Tax incentive reserve This reserve mainly comprised the income tax deduction benefit determined before the base period of 2006 (Note 32(a)). After the adoption of Laws 11,638/07 and 11,941/09, as from January 1, 2007, the income tax benefit started to be recorded in the statement of operations in the revenue reserves account as proposed by Management and approved at the General Shareholders’ Meeting. Regardless of the change introduced by Laws 11,638/07 and 11,941/09, this tax incentive can be used only for capital increase or absorption of losses. At the end of fiscal year 2012, the Company used the balance of this reserve to absorb part of the fiscal year’s loss.
(d) Legal reserve Under Brazilian Corporation Law, the Company must transfer 5% of net profit for the year, determined in accordance with the accounting practices adopted in Brazil, to a legal reserve until this reserve is equivalent to 20% of the paid-up capital. The legal reserve can be used for capital increase or absorption of losses. At the end of fiscal year 2012, the Company used part of the balance of this reserve to absorb partially the loss in the period.
(e) Unrealized profit reserves This reserve was established based on unrealized profits in fiscal year 2011, in accordance with items I and II, paragraph 1 of Article 197 of Law No. 6,404/76, which states that in the fiscal year that the distributable dividends exceed the amount of profits, which generated cash inflows to the Company, the General Stockholders’ Meeting may, upon proposal of the board, attribute such excess to “unrealized profit reserves”. Under the terms of the Law No 6,404/76, this reserve should only be used to absorb losses or pay dividends. At the end of fiscal year 2012, the Company used part of the balance of this reserve to absorb partially the loss in the period.
(f) Ongoing share repurchase programs
(f.1) 3rd Share repurchase program On August 26, 2011, Braskem’s Board of Directors approved a program for the repurchase of shares effective for the period between August 29, 2011 and August 28, 2012, through which the Company could acquire up to 12,162,504 class “A” preferred shares at market price. Shares could be purchased by the Company or by financial institutions hired for that purpose. Upon the expiration of the program, Braskem would have to acquire from financial institutions, at market value, the shares acquired by the latter. The private deal was approved by the Securities and Exchange Commission of Brazil (“CVM”).

Braskem S.A. Notes to the financial statements Years ended December 31, 2013 All amounts in thousands of reais
113
During the program, a total of 2,595,300 shares were repurchased for the amount of R$33,204, of which 2,007,600 were repurchased by financial institutions, and 587,700 shares were repurchased directly by Braskem. The average cost of these shares was R$12.79 (minimum of R$10.53 and maximum R$15.15). The shares purchased by financial institutions were purchased by Braskem in August 2012, when the program ended. In the operation, Braskem received R$1,575 related to the swap instrument associated with the repurchase transaction, net of withholding income tax of R$698. The purchased shares were canceled in December 2012.
(f.2) 4th Share repurchase program On August 13, 2012, Braskem’s Board of Directors approved a program for the repurchase of shares effective for the period between August 29, 2012 and August 28, 2013, through which the Company might acquire up to 13,376,161 class “A” preferred shares at market price. The shares might be acquired by the Company or by financial institutions hired for such purpose. Upon the expiration of the program, Braskem would have to acquire from financial institutions, at market value, the shares eventually acquired by the latter. The private transaction was approved by the CVM. As of November 2012, the financial institutions had acquired 262,300 shares for the amount of R$3,489 (item (f) of this Note) at the average cost of R$13.30 per share (minimum of R$12.66 and maximum R$14.07) On November 12, 2012, the Company acquired these shares and received in the operation R$71 related to the swap instrument associated with the repurchase transaction, net of the withholding income tax of R$29. The shares repurchased were cancelled in December 2012. There were no purchases under this program in 2013.

Braskem S.A. Notes to the financial statements Years ended December 31, 2013 All amounts in thousands of reais
114
(g) Dividends proposed and appropriation of profit Under the Company’s bylaws, profit for the year, adjusted according to Law 6,404/76, is appropriated as follows: (i) 5% to a legal reserve, which must not exceed 20% of capital; (ii) 25% to pay for mandatory, non-cumulative dividends, provided that the legal and statutory advantages of
the Class “A” and “B” preferred shares are observed. When the amount of the priority dividend paid to class “A” and “B” preferred shares is equal to or higher than 25% of profit for the year calculated under Article 202 of Brazilian Corporation Law, it is the full payment of the mandatory dividend. Any surplus remaining after the payment of the priority dividend will be used to: • pay dividends to common shareholders up to the limit of the priority dividends of preferred shares;
• if there still is any surplus, distribute additional dividends to common shareholders and class “A”
preferred shareholders so that the same amount of dividends is paid for each common share or class “A” preferred share.
(g.1) Profit or loss in 2013 and dividends proposed
Management proposes paying total dividends of R$482,593. The total dividends proposed correspond to R$0.6061888020 for all classes of shares and meets the priority dividend of preferred shares in accordance with the Bylaws of the Company. Management proposes to the Annual Shareholders Meeting the allocation of net income from 2013 as follows:
(i) Recorded in current liabilities. (ii) Recorded in shareholders' equity, under the item “proposed additional dividend”.
2013
Net income for the year of Company's shareholders 509,697 Realization of additional property, plant and equipment 28,203
Net income adjusted 537,900 Legal reserves distribution (26,895)
Net income adjusted by dividends calculation 511,005 Proposed dividends (*) (482,593) Portion allocated to unrealized profit reserves (28,412)
Balance of retained earnings -
(*) Minimum dividends - 25% adjusted net income (i) 127,751 Additional proposed dividends (ii) 354,842 Total dividends 482,593

Braskem S.A. Notes to the financial statements Years ended December 31, 2013 All amounts in thousands of reais
115
(g.2) Absorption of the balance of retained losses and dividend payment The adjusted loss for fiscal year 2012, in the amount of R$674,263, was absorbed by the unrealized profits reserves, tax incentives and the legal reserve, resulting in a balance of R$565,549. On April 2, 2013, the Annual Shareholders Meeting approved the absorption of the balance by using a portion of the “capital reserve” account. On April 27, 2012, the Annual Shareholders’ Meeting approved the payment of dividends as per the Management proposal in 2011, in the amount of R$482,593, equivalent to R$0.605085049 per common, class “A” and “B” ordinary and preferred share, paid as of November 19, 2012.

Braskem S.A. Notes to the financial statements Years ended December 31, 2013 All amounts in thousands of reais
116
(h) Other comprehensive income – Equity
Defined ForeignAdditional Deemed benefit currency Gain (loss)
indexation of cost of plan actuarial Fair value translation on interestPP&E PP&E Gain (loss) of hedge adjustment in subsidiary
Note (i) (i) (ii) (iii) (iv) (v) Total
On December 31, 2011 326,541 21,159 - (10,716) (24,504) 3,106 315,586
Additional indexationRealization by depreciation or write-off assets (41,268) (41,268) Income tax and social contribution 14,032 14,032
Deemed cost of jointly-controlled investmentRealization by depreciation or write-off assets (1,442) (1,442) Income tax and social contribution 490 490
Defined benefit plan actuarial lossActuarial loss (18,204) (18,204) Income tax and social contribution 6,388 6,388
Cash flow derivativesChange in fair value 1,948 1,948 Transfer to result 14,290 14,290 Income tax and social contribution (5,522) (5,522)
Loss on interest in subsidiary 16 (b) - - - - (5,917) (5,917)
Write-off gain on interest in subsidiary (4,632) (4,632)
Foreign currency translation adjustment 61,662 61,662
On December 31, 2012 (revised) 2.1.1(a) 299,305 20,207 (11,816) - 37,158 (7,443) 337,411
Additional indexationRealization by depreciation or write-off assets (41,268) (41,268) Income tax and social contribution 14,032 14,032
0 - Deemed cost of jointly-controlled investment 0 -
Realization by depreciation or write-off assets (1,465) (1,465) Income tax and social contribution 498 498
Foreign sales hedgeExchange rate (2,303,540) (2,303,540) Income tax and social contribution 783,204 783,204
Fair value of Cash flow hedgeChange in fair value (83,413) - (83,413) Transfer to result (41,727) - (41,727) Income tax and social contribution 40,120 - 40,120
- Defined benefit plan actuarial gain 169 169
Net loss interest in subsidiary (1,961) (1,961) -
Foreign currency translation adjustment 205,249 - 205,249
On December 31, 2013 272,069 19,240 (11,647) (1,605,356) 242,407 (9,404) (1,092,691)
(i) Realization as the asset is depreciated or written-off.
(ii) Realization upon extinction of the plan.
(iii) Realization upon maturity, prepayment or loss of efficacy for hedge accounting.
(iv) Realization upon write-off of subsidiary abroad.
(v) Realization upon divestment or transfer of control of subsidiary.
Parent company and consolidated

Braskem S.A. Notes to the financial statements Years ended December 31, 2013 All amounts in thousands of reais
117
30 Earnings per share Basic and diluted earnings (loss) per share is calculated by means of the division of adjusted profit for the year attributable to the Company’s common and preferred shareholders by the weighted average number of these shares held by shareholders, excluding those held in treasury and following the rules for the distribution of dividends provided for in the Company’s bylaws, as described in Note 29 (g), particularly in view of the limited rights of class “B” preferred shares. In view of these limited rights, this class of share does not participate in losses. In this case, the diluted result takes into account the conversion of two class "B" preferred shares into one class “A” preferred share, as provided for in the Bylaws of the Company. The weighted average number of shares is calculated based on the number of outstanding common and preferred shares at the beginning of the period, adjusted by the number of shares repurchased or issued in the period, multiplied by a weighting time factor. There has been no change in the number of shares in fiscal year 2013. The calculation of the weighted average in 2012 is shown below:
(i) The shares repurchased were not considered in the calculation of earnings per share since they are not entitled to dividends (Note
29(f)).
Class “A” preferred shares participate in dividends with common shares after the mandatory dividends has been attributed in accordance with the formula provided for in the Company’s bylaws, as described in Note 29(g). There is no highest limit for their participation. Diluted and basic earnings (losses) per share are equal when there is profit in the year, since Braskem has not issued convertible financial instruments.
Note Common shares
Preferred shares class
"A"Total of weighted
average Common shares
Preferred shares class
"A"Total of weighted
average
As of December 31, 2011 451,668,652 345,300,320 796,968,972 451,668,652 346,451,489 798,120,141
Repurchase of shares (i) - (1,452,200) (1,452,200) - (700,738) (700,738)
As of December 31, 2012 451,668,652 343,848,120 795,516,772 451,668,652 344,599,582 796,268,234
Total of outstanding shares Weighted average

Braskem S.A. Notes to the financial statements Years ended December 31, 2013 All amounts in thousands of reais
118
As required by CPC 41 and IAS 33, the table below show the reconciliation of profit (loss) for the year adjusted to the amounts used to calculate basic and diluted earnings (loss) per share.
(i) In the calculation of the weighted average, the shares of the Company that were repurchased were excluded from the base (Note 29(f)).
2013 2012Note Basic and diluted Basic Diluted
2.1.1(b) Revised Revised
Profit (loss) for the year attributed to Company's shareholdersof continued operations 509,697 (1,012,690) (1,012,690)
Distribution of dividends attributable to priority:Preferred shares class "A" 208,437 - - Preferred shares class "B" 360 - -
208,797 - -
Distribution of 6% of unit value of common shares 273,796 - -
Distribution of plus income, by classCommon shares 15,389 - - Preferred shares class "A" 11,715 - -
27,104
Reconciliation of income available for distribution, by class (numerator):Common shares 289,185 (574,430) (574,216) Preferred shares class "A" 220,152 (438,260) (438,097) Preferred shares class "B" 360 - - Preferred share class "A" potentially convertible - - -
(the ratio of 2 shares class "B" for each share class "A") (377) 509,697 (1,012,690) (1,012,690)
Weighted average number of shares, by class (denominator):Common shares 451,668,652 451,668,652 451,668,652 Preferred shares class "A" (i) 343,848,120 344,599,582 344,599,582 Preferred shares class "B" 593,818 - - Preferred share class "A" potentially convertible
(the ratio of 2 shares class "B" for each share class "A") - - 296,909 796,110,590 796,268,234 796,565,143
Profit (loss) per share (in R$)Common shares 0.6403 (1.2718) (1.2713) Preferred shares class "A" 0.6403 (1.2718) (1.2713) Preferred shares class "B" 0.6062 - -

Braskem S.A. Notes to the financial statements Years ended December 31, 2013 All amounts in thousands of reais
119
31 Net sales revenues
32 Tax incentives
(a) SUDENE – Income Tax The benefit of the 75% reduction in the income tax from the sale of production applies to the Camaçari (BA) PE plant and the PVC plant, in Marechal Deodoro (AL), until 2016 and 2019 respectively. Productions of caustic soda, chloride, ethylene dichloride, caprolactam, polypropylene and polyethylene and the basic petrochemicals and utilities plant located in the Sudene region, are in the process of requesting for renewal of the benefit of a 75% decrease in the income tax rate from the agency. The Management of the Company believes it is possible to obtain the renewal of this benefit.
(b) PRODESIN - ICMS The Company has ICMS tax incentives granted by the state of AL, through the state of Alagoas Integrated Development Program - PRODESIN. These incentives are aimed at the implementation and expansion of a plant in that state and are recorded in the account “net sales revenue” in the statement of operations and in the account “taxes” of Note 31. In 2013, the amount of this incentive was R$50,908 (2012 - R$32,780).
(c) REINTEGRA In 2013, the Company determined a credit of R$229,742 (Note 11 (h)) (2012 - R$228,052), which is presented in the account “cost of goods sold”, in the statement of operations.
33 Other operating income (expenses), net For the year ended December 31, 2013, the main expenditure under this heading refer to the depreciation and maintenance of paralyzed plants, provision for remedying environmental damage and inventory adjustments, that sum R$203,207. Additionally, the Company recorded revenues of R$25,063 due to the reduction in the balance of the installment of Law 11.941/09 (Note 22 (a)). On December 31, 2013, the main amount is the indemnity received under the supply agreement between Sunoco and Braskem America in the amount of R$235,962.
Note 2013 2012 2013 20122.1.1(b) Revised
Sales revenueDomestic market 30,236,855 27,409,691 21,015,632 19,020,637 Foreign market 17,532,783 15,572,798 6,895,490 6,059,708
47,769,638 42,982,489 27,911,122 25,080,345 Sales deductions
Taxes (6,414,524) (6,487,401) (4,115,717) (4,233,666) Sales returns and other (385,624) (334,761) (252,915) (212,279)
(6,800,148) (6,822,162) (4,368,632) (4,445,945)
Net sales revenue 40,969,490 36,160,327 23,542,490 20,634,400
Parent companyConsolidated

Braskem S.A. Notes to the financial statements Years ended December 31, 2013 All amounts in thousands of reais
120
34 Financial results
Note 2013 2012 2013 20122.1.1(b) Revised
Financial incomeInterest income 281,669 220,169 253,785 193,669 Monetary variations 24,117 40,599 23,384 37,167 Exchange rate variations 333,424 219,757 367,666 88,079 Other 133,928 51,403 58,614 45,474
773,138 531,928 703,449 364,389
Financial expensesInterest expenses (1,121,761) (973,195) (1,053,756) (892,885) Monetary variations (300,310) (274,881) (299,132) (253,620) Exchange rate variations (78,510) (1,898,677) (182,457) (1,709,356) Inflation adjustments on fiscal debts (173,864) (208,186) (100,833) (182,053) Tax expenses on financial operations (32,884) (17,289) (25,555) (13,171) Discounts granted (89,495) (58,859) (35,229) (25,736) Loans transaction costs - amortization (6,200) (27,221) (501) (18,883) Adjustment to present value - appropriation (592,413) (310,525) (347,187) (251,791) Other (153,674) (157,376) (54,315) (57,227)
(2,549,111) (3,926,209) (2,098,965) (3,404,722)
Total (1,775,973) (3,394,281) (1,395,516) (3,040,333)
Parent companyConsolidated
Note 2013 2012 2013 20122.1.1(b) Revised
Interest incomeHeld for sale 13,416 5,023 13,416 5,023 Loans and receivables 102,623 139,580 109,697 138,401 Held-to-maturity 31,147 17,841 27,208 17,841
147,186 162,444 150,321 161,265 Other assets not classifiable 134,483 57,725 103,464 32,404
Total 281,669 220,169 253,785 193,669
Parent companyConsolidated

Braskem S.A. Notes to the financial statements Years ended December 31, 2013 All amounts in thousands of reais
121
35 Expenses by nature The Company chose to present its expenses by function in the statement of operations. As required by CPC 26 and IAS 1, the breakdown of expenses by nature is presented below:
36 Segment information Management defined the organizational structure of Braskem based on the types of business, the main products, markets and production processes, and identified 5 operating and reportable segments - 4 production segments and one distribution segment. Considering that the assets of Quantiq and IQAG (Note 2.1.1(b)) were not divested, the Chemical Distribution segment once again became a reportable segment on December 31, 2013. The information for 2012 was revised to include this change. The current operational segments are the following: • Basic petrochemicals: comprises the activities related to the production of basic petrochemicals and the
supply of electric energy, steam and compressed air to second-generation producers located in the Camaçari, Triunfo, SP and RJ petrochemical complexes.
• Polyolefins: comprises the activities related to the production of PE, PP and renewables.
• Vinyls: comprises the activities related to the production of PVC, caustic soda and chloride. • United States and Europe: operations related to PP production in the United States and Europe.
• Chemical distribution: consists mainly of Quantiq’s operations related to the distribution of petroleum-based
solvents, intermediate chemicals, special chemicals and pharmacons.
Note 2013 2012 2013 20122.1.1(b) Revised
Classification by nature:Raw materials other inputs (30,515,643) (27,812,462) (17,246,854) (15,175,241) Personnel expenses (1,953,194) (1,772,097) (1,143,557) (1,112,486) Outsourced services (1,570,320) (1,633,747) (870,530) (932,031) Tax expenses (9,847) (8,293) (3,624) (3,880) Depreciation, amortization and depletion (2,038,366) (1,902,475) (1,302,531) (1,193,976) Freights (1,471,853) (1,302,899) (932,645) (850,232) Other expenses (667,123) (111,229) (200,235) 76,119 Total (38,226,346) (34,543,202) (21,699,976) (19,191,727)
Classification by function:Cost of products sold (35,820,761) (32,709,068) (20,469,552) (18,217,333) Selling and distribution (1,000,749) (990,365) (597,341) (589,072) General and administrative (1,077,934) (1,071,029) (669,978) (695,828) Research and development (115,812) (106,197) (85,806) (81,653) Other operating income (expenses), net (211,090) 333,457 122,701 392,159 Total (38,226,346) (34,543,202) (21,699,976) (19,191,727)
Parent companyConsolidated

Braskem S.A. Notes to the financial statements Years ended December 31, 2013 All amounts in thousands of reais
122
(a) Presentation, measurement and conciliation of results Information by segment is generated in accounting records maintained in accordance with the accounting principles and practices adopted in Brazil, according to CPC pronouncements and IFRS, and which are reflected in the consolidated financial statements. The eliminations stated in the operating segment information, when compared with the consolidated balances, are represented by sales between segments that are carried out as arm’s length sales. The results of equity investments recognized in the Company’s statement of operations are presented in Corporate unit. The operating segments are stated based on the results of operations, which does not include financial results, and current and deferred income tax and social contribution. The Company does not disclose assets by segment since this information is not presented to its chief decision maker.
(b) Main clients In 2013 and 2012, the Company does not have any revenue arising from transactions with only one client that is equal to or higher than 10% of its total net revenue. In 2013, the most significant revenue from a single client amounts to approximately 3% of total net revenues of the Company and refers to the basic petrochemical segment.

Braskem S.A. Notes to the financial statements Years ended December 31, 2013 All amounts in thousands of reais
123
(c) Results of operations by segment
(i) The other segments, includes the full results of the subsidiary Braskem Idesa.
Total BraskemBasic USA and Chemical reportable Other Corporate consolidated Braskem
Note petrochemicals Polyolefins Vinyls Europe distribution segments segments (i) unit before adjustments Eliminations consolidated
Net sales revenue 25,037,780 16,944,709 2,581,076 6,748,502 891,734 52,203,801 130,289 - 52,334,090 (11,364,600) 40,969,490 Cost of products sold (22,561,151) (14,694,326) (2,384,543) (6,419,523) (761,136) (46,820,679) (133,690) - (46,954,369) 11,133,608 (35,820,761) Gross profit 2,476,629 2,250,383 196,533 328,979 130,598 5,383,122 (3,401) - 5,379,721 (230,992) 5,148,729
Operating expensesSelling, general and distribution expenses (534,896) (852,680) (174,072) (282,880) (96,673) (1,941,201) (68,576) (184,718) (2,194,495) - (2,194,495) Results from equity investments - - - - - - - (3,223) (3,223) - (3,223) Other operating income (expenses), net (67,835) (30,673) (11,179) (37,621) (6,537) (153,845) 196 (57,441) (211,090) - (211,090)
(602,731) (883,353) (185,251) (320,501) (103,210) (2,095,046) (68,380) (245,382) (2,408,808) - (2,408,808)
Operating profit (loss) 1,873,898 1,367,030 11,282 8,478 27,388 3,288,076 (71,781) (245,382) 2,970,913 (230,992) 2,739,921
2.1.1(b) RevisedTotal Braskem
Basic USA and Chemical reportable Other Corporate consolidated Braskempetrochemicals Polyolefins Vinyls Europe distribution segments segments (i) unit before adjustments Eliminations consolidated
Net sales revenue 23,603,038 14,456,827 2,019,884 5,465,180 898,786 46,443,715 72,652 - 46,516,367 (10,356,040) 36,160,327 Cost of products sold (21,793,497) (13,131,842) (1,947,749) (5,272,065) (751,013) (42,896,166) (88,052) - (42,984,218) 10,275,150 (32,709,068) Gross profit 1,809,541 1,324,985 72,135 193,115 147,773 3,547,549 (15,400) - 3,532,149 (80,890) 3,451,259
- - - - - - - - - -
Operating expenses - - - - - - - - - - Selling, general and distribution expenses (491,999) (868,410) (129,696) (243,300) (94,796) (1,828,201) (37,823) (301,567) (2,167,591) - (2,167,591) Results from equity investments - - - - - - - (25,807) (25,807) - (25,807) Other operating income (expenses), net (64,050) (20,012) 1,808 364,798 (265) 282,279 (98,298) 149,476 333,457 - 333,457
(556,049) (888,422) (127,888) 121,498 (95,061) (1,545,922) (136,121) (177,898) (1,859,941) - (1,859,941) - - - - - - - - - -
Operating profit (loss) 1,253,492 436,563 (55,753) 314,613 52,712 2,001,627 (151,521) (177,898) 1,672,208 (80,890) 1,591,318
2013
2012
Reporting segments
Reporting segments

Braskem S.A. Management’s notes to the financial statements on December 31, 2013 Amounts in thousands of Brazilian real, except where stated otherwise
124
(d) Net sales revenue by country
(e) Net sales revenue by product
Note 2013 20122.1.1 (b) Revised
Headquarter - Brazil 23,548,870 20,840,355 United States 7,981,211 5,642,946 Singapore 1,514,216 561,669 Argentina 1,222,729 1,195,728 Netherlands 1,099,945 913,208 Mexico 680,054 764,244 United Kingdom 578,351 406,132 Germany 536,343 583,952 Italy 318,357 282,671 Colombia 299,287 219,405 Chile 282,231 224,956 Peru 247,427 200,952 Uruguay 243,672 263,163 Poland 221,433 232,004 Switzerland 211,371 1,725,665 Japan 190,729 269,672 Spain 186,354 216,405 Bolivia 154,473 - Canada 145,378 - Paraguay 136,393 - France 117,429 136,664 South Korea 90,531 143,036 Venezuela 90,595 152,870 Other 872,111 1,184,628
40,969,490 36,160,327
Note 2013 20122.1.1(b) Revised
PE/PP 23,693,211 19,922,007 Benzene, toluene and xylene 2,974,235 2,727,659 Ethylene, Propylene 2,875,381 2,502,111 Naphtha, condensate and crude oil 2,548,457 2,019,884 PVC/Caustic Soda/EDC 2,240,950 2,417,416 ETBE/Gasoline 2,015,749 1,751,961 Butadiene 1,194,839 1,643,172 Chemical distribution 879,801 889,190 Cumene 729,999 646,286 Solvents 527,083 515,130 Other 1,289,785 1,125,511
40,969,490 36,160,327

Braskem S.A. Management’s notes to the financial statements on December 31, 2013 Amounts in thousands of Brazilian real, except where stated otherwise
125
(f) Property plant and equipment and intangible assets by country
37 Insurance coverage
Braskem, according to the policy approved by the Board of Directors, maintains a broad risk and insurance Management program. Specifically in the risk Management area, the risk and procedure assessment practices are applied in all companies, in Brazil and abroad, including the acquisition for the period, following the principles adopted by Braskem. In April 2013, the entire All Risks program of Braskem was renewed. In addition, in 2012, Braskem Idesa contracted insurance to cover the risks related to the construction of the Ethylene XXI Project. The All-Risk insurance policies of Braskem, which include all assets in Brazil and abroad, have maximum indemnity limits established based on the amounts of maximum possible loss that are deemed sufficient to cover possible claims in view of the nature of the Company’s activities and based on the guidance of its insurance consultants. The information on the All-Risk policies in effect is presented below:
Additionally, the Company contracted civil liability, transportation, sundry risk and vehicle insurance. The risk assumptions adopted are not part of the audit scope and, therefore, were not subject to review by our independent accountants.
38 Non-cash operations (Statements of cash flow) (a) 2013
Capital increase in DAT (Note 15(b)) realized through transfer of assets.
(b) 2012 (i) Capital increase of Braskem Distribuidora (Note 1(b)(viii)).
(ii) Divestment of equity interests in Braskem Distribuidora and Cetrel (Note 5), with the stipulated receipt for
2013.
2013 2012
Headquarter country - Brazil 21,238,537 21,617,382 Mexico 5,684,813 1,255,171 USA 1,160,186 1,027,372 Germany 241,069 217,538 Other 1,573 288
28,326,178 24,117,751
Effectiveness Maximum indemnity limit Amount insuredMaturity (in days) US$ million US$ million
Braskem (industrial units in Brazil) April 8, 2014 372 2,000 24,441 Braskem America and Braskem Alemanha April 8, 2014 372 250 2,583 Braskem Idesa September 30, 2015 912 4,148 4,148 Quantiq May 30, 2014 424 70 70 Total 31,242

Braskem S.A. Management’s notes to the financial statements on December 31, 2013 Amounts in thousands of Brazilian real, except where stated otherwise
126
39 Subsequent events On January 16, 2014, Braskem issued Notes amounting to US$500 million in bonds, with coupon of 6.45% p.a. and maturing in February 2024. This was the first issue of Bonds by Braskem registered with the U.S. Securities and Exchange Commission (SEC). In February 2014, Braskem used the resources captured to partially settle the Bonds of 2017, 2018 and 2020 (Note 18 (c)).

Capital Budget for partial retention of net income for 2013.
The capital budget for 2014, which was reviewed by the Board of Directors and received a
favorable opinion from the Audit Board and will be submitted for approval by the Annual
Shareholders' Meeting, provides for investment in the amount of R$2,664,495 thousand, to be
financed thirty percent by own capital, using the amount retained of a portion of net income for
2013e, and seventy percent by third-party capital.
The investments by type are presented below:
Maintenance / Replacement / Other R$1,475,865 thousand
Productivity / HES R$226,178 thousand
Comperj/Ac.Acrylics/Splitter R$258,452 thousand
Mexico Project R$704,000 thousand
Total R$2,664,495 thousand

Braskem's resin sales grow by 6% in 2013 Net Revenue reaches R$41 billion
HIGHLIGHTS:
The Brazilian market of thermoplastic resins reached 5.4 million tons, expanding around 8% from 2012. Braskem’s resin sales came to 3.7
million tons, with market share of 68%.
In 4Q13, the average cracker capacity utilization rate was 84%, mainly
reflecting the scheduled maintenance shutdown at the Camaçari site.
In 2013, the average cracker capacity utilization rate was 90%.
PP sales volume at Braskem America grew by 7% from 3Q13,
reflecting the recovery of the U.S. economy and the good performance of sectors related to consumer goods. In 2013, PP sales volume
increased by 3%, positively affected by the production growth, the highest since 2011.
Consolidated EBITDA in the last quarter of the year was R$1,175 million. In U.S. dollar, EBITDA was
US$521 million, growing approximately 20% from 4Q12 recurring EBITDA.
In 2013, Braskem recorded EBITDA of R$4,813 million. The spreads recovery in the international
market, the better sales mix, the tax relief on raw material purchases and the controling of costs were the main factors driving this performance. In U.S. dollar, EBITDA was US$2,217 million, increasing by
11% from 2012.
In line with the Company's strategy to diversify its feedstock profile and make it more competitive, the construction of the Mexico project continued to advance, with the complex's physical completion
reaching 58%. In November, the subsidiary Braskem-Idesa withdrew the second installment of the project finance in the amount of US$547 million. In 2013, withdrawals amounted to US$2,031 million.
As part of its commitment to add value to the existing streams, Braskem announced the expansion of one of its polyethylene production lines and the signing of a memorandum of understanding (MOU)
with Styrolution for the production of styrenics specialties. These projects also reflect the Company's
commitment to developing Brazil's chemical and plastics chain.
To meet the region's growing demand and to further strengthen its vinyls chain, Braskem announced
that it entered into an agreement with Solvay for the acquisition of the controlling interest in Solvay Indupa, which has 4 plants producing PVC and caustic soda in Brazil and Argentina. With the
acquisition, which is still subject to approval by the countries' regulatory agencies, Braskem:
expands by 42% its PVC production in the Brazilian market and increases its capacity in the region to 1,250 kton, making it the fourth largest PVC producer in the Americas;
expands its caustic soda capacity by over 60% to 890 kton.
Braskem posted net income for the year of R$507 million and, based on this result, Management
proposal is for a distribution of dividends in the amount of R$483 million.
Braskem’s leverage measured by its ratio of net debt to EBITDA in U.S. dollar stood at 2.87x, down
12% from 2012. In Brazilian real, the leverage ratio stood at 3.09x.
4Q13 and 2013 Earnings Release

2
MESSAGE FROM MANAGEMENT
In yet another challenging year, the global economy showed signs of recovery, as reflected by the better performance of the U.S. economy and indications that the euro zone had begun to emerge from crisis.
Meanwhile, China's economy grew in line with market expectations, with the country's GDP expanding 7.7% in 2013. This scenario helped support a recovery in the profitability of the global petrochemical industry, and
the spreads for thermoplastic resins1 and main basic petrochemicals2 expanded 28% and 12%, respectively.
In Brazil, GDP growth once again fell short of expectations and is expected to remain at around 2% in 2013. However, the good performance of certain sectors, such as food, infrastructure, automotive and agribusiness
and the restocking trend in the chain positively influenced apparent consumption of thermoplastic resins, which grew 8% in relation to 2012.
The Brazillian chemical and petrochemical sector enjoyed an important achievement in 2013. The Government, in response to one of the proposals elaborated by the Chemical Industry Competitiveness
Council, approved the PIS and COFINS tax rates relief on raw material purchases by first and second
generation producers, which serve various sectors of the economy. The measure aimed to restore some of the industry's competitiveness, which was weakened by factors related to infrastructure, productivity,
feedstock and energy costs and the exchange rate that pressured the chemical industry’s trade deficit which ended 2013 at US$32 billion.
Braskem, in keeping with its commitment to Brazil's plastic chain and its spirit of serving Clients, in
partnership with the manufacturing industry elaborated the Plastic Chain Competitiviness Incentive Plan (PIC). The initiative provides an investment by the Company of up to R$80 million in 2014 as commercial
support and structuring actions for the converters, with initiatives that include stimulus measures for exports of manufactured plastic products, incentives to promote innovation and support for training professionals.
Despite uncertainties regarding the global economic recovery, Braskem invested R$2.7 billion in 2013, of which 50% was allocated to the maintenance and improvement of current assets and 40% to the
construction of the integrated petrochemical complex in Mexico, which will play an important role in the
Company’s strategy to diversify and secure competitive feedstock sources.
Developed through a joint venture with Mexican group Idesa, the project in Mexico, which will consist of a
gas-based cracker and three polyethylene plants, with a production capacity of 1.05 million tons, continued to advance and its physical completion reached 58% by the end of 2013. The project's startup is scheduled
for 2015.
A structural initiative for the future of the sector in Brazil, the Rio de Janeiro Petrochemical Complex - COMPERJ - also has the goal of leveraging competitiveness through use of feedstock based on gas, whose
production in Brazil is expected to increase with the exploration of the country’s pre-salt oil deposits. The project, which is currently in the study phase, aims to meet the growing demand of thermoplastic resins in
Brazil, adding value to the country’s natural resources and support its industrialization process.
Alert to the opportunities provided by the competitiveness of shale gas and aligned with its growth program, Braskem worked together with investors to analyze the feasibility of an integrated project for the production
of ethylene in West Virginia state, in the United States, where the Company is already the leader producer in the polypropylene market. If the feasibility of the project called the Appalachian Shale Cracker Enterprise –
Ascent - is confirmed, the role of each participant and the business model will be submitted for approval to the boards of directors of the companies. Braskem is expected to preserve its financial capacity to implement
other strategic projects in Brazil, in particular COMPERJ.
In December, Braskem signed an agreement with the Belgium-based company Solvay for the acquisition of its controlling interest in Solvay Indupa, which has four plants producing PVC and caustic soda in Brazil and
1 65% PE (USA), 25% PP (Asia) and 10% PVC (Asia)
2 80% ethylene and propylene, 20% BTX (base Europe)

3
Argentina. With the acquisition, which is still subject to approval by both countries’ regulatory agencies,
Braskem expands its annual PVC production capacity in Brazil by 42% to 1,010 kton and its regional PVC production capacity to 1,250 kton, strengthening its international industrial footprint and becoming the fourth
largest PVC producer in the Americas. In the case of caustic soda, Braskem's annual production capacity would reach 890 kton, a growth of over 60%.
Braskem also announced a project to expand and convert one of its polyethylene lines in the state of Bahia
to produce metallocene-based LLDPE, which will require investment of R$50 million. The resin, which is based on more modern technology, will supply producers of plastic films.
In line with its strategy to add value to existing streams and strengthen the production chains of the petrochemical complexes, Braskem also signed a memorandum of understanding with Styrolution to assess a
joint venture in Brazil in which its equity interest is expected to be 30%. The objective is to produce, in Camaçari, Bahia, styrenics specialties and the copolymers acrylonitrile butadiene styrene (ABS) and styrene
acrylonitrile (SAN) to replace the imports of these products into the local market.
The implementation of this and other new expansion projects is based on the assumption that the industry will continue to enjoy the guaranteed supply of feedstock at cost conditions that are compatible with global
competitive dynamics.
The Company also invested around R$200 million in innovation and technology, which supported the launch
of 13 new resins and contributed to the development of new applications for plastic products and to the
chain's performance in Brazil.
In terms of the performance of Braskem’s financial indicators, gross revenue was R$48 billion and net
revenue was R$41 billion, representing growth of 11% and 13%, respectively, in relation to 2012, with these figures reflecting the Brazilian real depreciation and the recovery in petrochemical prices at the global level.
EBITDA reached R$4.8 billion, increasing 22% on the prior year. The factors that contributed to this performance were: (i) the better sales mix of thermoplastic resins; (ii) the higher contribution margin, which
was influenced by the recovery in resin and basic petrochemical spreads in the international market and by
the tax relief on feedstock purchases as explained earlier; and (iii) the Brazilian real depreciation.
Net income amounted to R$507 million, reflecting the better operating performance in the period and the
adoption, as of May, of hedge accounting, which better translates the effects of exchange rate variation on the Company’s income statement.
Working closely with Clients, decentralized management and a culture of entrepreneurship are fundamental
pillars of the Group's culture, which is based on the Odebrecht Entrepreneurial Technology (TEO), with these values also making an important contribution to the results achieved in 2013. Another important factor was
the creation of two training programs for process and maintenance engineers in partnership with Petrobras University, whose goal is to develop professionals capable of ensuring competitiveness in industrial processes
by, for example, reducing costs and increasing productivity.
In the area of workplace safety, the Injury Frequency Rate with and without Lost Time considering both Members and partners remained stable at 1.04 accidents per million hours worked, in line with last year's
performance, which was the best in the Company’s history. Another highlight was the important progress made in carbon management. For the third consecutive year, Braskem was recognized by figuring in the Gold
Category of the GHG Protocol and elected the best publicly held corporation in Brazil in carbon management by the Carbon Disclosure Project (CDP) in the categories transparency and performance.
The Company confirmed its inclusion in the Corporate Sustainability Index (ISE) for the ninth straight year
and in the Carbon Efficient Index, both indexes of the BM&FBovespa, and also remained a component of the Dow Jones Sustainability Emerging Markets Index (DJSI Emerging Markets). Braskem also received
innumerous national and international recognitions, such as one of the best companies in organizational people development and a model company in sustainability by the annual Guia Exame 2013.
In the social dimension of its sustainable development, the Company operates through a set of programs
focused on environmental education, social inclusion and promoting culture in local communities, in which it invested close to R$14 million in 2013. Key initiatives include the Ser + Realizador Project, which promotes

4
the social inclusion of recyclable-material collectors; the Conscientious Consumption Learning Network, which
provides environmental education to students, and the Fábrica de Florestas project, which works to recover ecological corridors in the Atlantic Forest.
PERFORMANCE
As a result of the decision to maintain the investments in chemical distribution, which are the assets related to Quantiq, Braskem’s consolidated results reflect the consolidation of its result for 4Q13 and 2013, as well
as the restatement of the quarterly and annual financial statements for 2012.
Net Revenue
In 4Q13, Braskem's consolidated net revenue was US$5.0 billion, 8% higher than in the previous quarter. In Brazilian real, net revenue was R$11.4 billion, growing by 7%, which is explained by the consolidation of the
results of Quantiq in the amount of R$880 million. Excluding Quantiq’s result and the volume of
naphtha/condensate resales from the analysis, net revenue in the last quarter of the year decreased by 3.3% and 2.8% in U.S. dollar and Brazilian real, respectively, reflecting the decrease in total sales volume
caused by seasonality and the scheduled maintenance shutdown.
Compared to 4Q12, consolidated net revenue in U.S. dollar grew by 10%. In Brazilian real, net revenue was
22% higher. This performance is explained by the higher sales volume and the impact of the 11% U.S.
dollar appreciation between the periods and by the consolidation of the the chemical distribution business result, as mentioned before.
Export revenue in 4Q13 was US$2.1 billion, similar to 3Q13. The higher volume of resales and Braskem America (USA+Europe) offset the reduction in exports from the Polyolefins and Basic Petrochemicals units. In
relation to 4Q12, export revenue increased by 9%, reflecting the sales volume growth in the period.
In 2013, consolidated net revenue was US$19 billion, up 3% from the previous year, explained by the higher
resin sales volume in the domestic market and the recovery in petrochemical prices in the international
market. In Brazilian real, net revenue stood at R$41 billion, increasing 13%, influenced by the 10% appreciation in the U.S. dollar between the periods.
Net revenue from exports was US$8.1 billion, up 2% on 2012. The higher sales volume of basic petrochemicals and the recovery in prices at global level offset the lower resales and resins volumes in the
period.
55%
23%
16%
6%
Domestic Sales Export Sales (ex-resale) United States and Europe Resale
58%21%
15%
6%
58%
18%
16%
8%
4Q12 Net Revenue 3Q13 Net Revenue 4Q13 Net Revenue

5
Highlights by Segment
Capacity utilization rate
In Brazil, the reduction in the average capacity utilization of the main products in 4Q13 basically reflects the scheduled shutdown at the Camaçari cracker. The exception was PVC, which returned to high utilization rates
after the problems caused by the interruption in power supply and the anticipation of the scheduled
maintenance shutdown in 3Q13.
In 2013, Braskem's capacity utilization rates remained at high levels.
Polyolefins
Brazilian market: the polyolefins (PE and PP) market reached 1 million tons in 4Q13, virtually in line with 3Q13, a quarter when demand was affected from the chain inventory rebuilding during the first half of the
57%
21%
17%
5%
Domestic Sales Export Sales (ex-resale) United States and Europe Resale
57%
21%
15%
7%
2012 Net Revenue 2013 Net Revenue
82%92% 84%
76%87% 82% 82% 82% 78% 73% 72%
89% 88% 88% 93%
4Q12 3Q13 4Q13 4Q12 3Q13 4Q13 4Q12 3Q13 4Q13 4Q12 3Q13 4Q13 4Q12 3Q13 4Q13
* Does not consider Green Ethylene
Ethylene * Polyethylene Polypropylene PVC USA and Europe
89% 90% 84% 85% 84% 83% 84% 82% 89% 91%
2012 2013 2012 2013 2012 2013 2012 2013 2012 2013
Ethylene Polyethylene Polypropylene PVCInternational Business (PP)

6
year. The stability observed in the last quarter also reflects the opportunistic entry of PE imports in October,
given the expiration of the additional PE import tariff. Compared to 4Q12, the market grew by 6%, positively affected by the performance of the agricultural and construction sectors.
Production: production amounted to 1,014 kton, down 5% from 3Q13, explained by the scheduled maintenance shutdown at the Camaçari cracker. In relation to 4Q12, production increased by 4%.
Domestic sales: Braskem’s sales in 4Q13 totaled 740 kton, declining 2% from 3Q13, in line with quarter
seasonality. Market share contracted by 3 p.p. to 72%, explained by the opportunistic entry of imported materials, as noted above. Compared to 4Q12, domestic sales grew by 2%.
Export sales: in 4Q13, exports were 283 kton, down 7% from 3Q13, influenced by the lower production volume and weaker demand in the region. Compared to 4Q12, sales increased by 7%.
In 2013, domestic demand for polyolefins (PE and PP) was 4.1 million tons, increasing 7% from 2012, driven by (i) the retail, automotive, food, construction and agribusiness sectors; and (ii) the opportunistic entry of
imported material. Meanwhile, Braskem’s sales grew by 5% to 3.0 million tons, with its market share in the
year at 74%.
Responding to the stronger domestic demand, export sales decreased by 15% in relation to 2012.
Vinyls
Brazilian market: PVC demand in 4Q13 came to 313 kton, increasing 3% from the prior quarter, reflecting the
restocking trend in the period and the expectations of a continuous growth in the construction sector.
Compared to 4Q12, PVC demand grew by 16%.
Production: PVC production volume reached 159 kton, reflecting the normalization of utilization rates at its
units, which had been impacted by the power interruption and the anticipation of the scheduled maintenance shutdown in 3Q13. Caustic soda production was 102 kton, down 6% from the prior quarter, reflecting the
scheduled shutdown at the Alagoas plant.
In relation to 4Q12, PVC production increased by 22%, due the additional output provided by the Alagoas
plant. Meanwhile, caustic soda production decreased by 6%, as explained above.
Domestic sales: the higher supply supported growth of 14% in Braskem’s PVC sales compared to the previous quarter to reach 166 kton. Market share expanded by 5 p.p. to 53% in 4Q13. Compared to 4Q12, PVC sales
grew by 16%.
Caustic soda sales volume decreased 11% from 3Q13, when imports occurred to take advantage of
opportunities in the local market. Compared to 4Q12, caustic soda sales fell by 9%.
(2)
(7)
(5)
4Q13 x 3Q13 (%) 4Q13 x 4Q12 (%)
Export sales
Production
Domestic sales 2
7
4
PE + PP
5
(15)
1
2013 x 2012 (%)

7
In 2013, Brazilian PVC demand was close to 1.3 million tons, increasing 12% on the previous year, driven by
the performance of the construction sector and by the chain’s inventory rebuilding. Due to the higher production volume (new plant in Alagoas), Braskem’s sales followed this trend to reach 637 kton ending the
year with 50% of market share.
Sales of caustic soda reached 469 kton, virtually stable compared to 2012. The lower production volume,
which was affected by scheduled and unscheduled maintenance shutdowns, was offset by imports to take advantage of opportunities in the domestic market.
Basic Petrochemicals
In 4Q13, ethylene production reached 795 kton, down 8% from 3Q13, explained by the scheduled
maintenance shutdown at the Camaçari plant. Compared to 4Q12, production volume increased by 3%.
Ethylene and propylene: the Company's total sales were 224 kton, or 7% lower than in 3Q13, reflecting the
scheduled shutdown and the quarter seasonality. Compared to 4Q12, sales volume increased by 1%.
Butadiene: sales in 4Q13 came to 95 kton, growing 6% from the prior quarter, driven by the recovery in global demand. In relation to 4Q12, sales volume decreased 5%.
BTX: aromatics sales volume declined 27% from 3Q13 to 218 kton, explained by scheduled and unscheduled maintenance shutdowns. Compared to 4Q12, sales volume was 22% lower, due to the same factors.
In a year in which the petrochemical complexes operated at an average utilization rate of 90%, Braskem
posted record-high ethylene production of 3.4 million tons. The impacts from the scheduled maintenance shutdown in one of the cracker lines at Camaçari and the interruption in production caused by power outages
in August were offset by the higher utilization rates in the first half of 2013.
16
(9)
22
(6)
14
(11)
23
(6)
4Q13 x 3Q13 (%) 4Q13 x 4Q12 (%)
Production
Domestic sales(10)
3
(3)
(6)PVC Caustic Soda PVC Caustic Soda
13
1
17
(3)
2013 x 2012 (%)
Performance (tons) 4Q13 3Q13 4Q12 Change (%) Change (%) 2013 2012 Change (%)
BASIC PETROCHEMICALS (A) (B) (C) (A)/(B) (A)/(C) (D) (E) (D)/(E)
Production
Ethylene 795,483 865,868 770,887 (8) 3 3,372,825 3,329,758 1
Propylene 348,251 392,956 341,299 (11) 2 1,505,595 1,472,488 2
Butadiene 96,116 88,129 95,047 9 1 389,854 355,703 10
BTX* 257,357 309,332 293,201 (17) (12) 1,217,831 1,246,517 (2)
BTX* - Benzene, Toluene, Orthoxylene and Paraxylene
Performance (tons) 4Q13 3Q13 4Q12 Change (%) Change (%) 2013 2012 Change (%)
BASIC PETROCHEMICALS (A) (B) (C) (A)/(B) (A)/(C) (D) (E) (D)/(E)
Total Sales
Ethylene/Propylene 224,041 240,824 221,123 (7) 1 924,435 934,640 (1)
Butadiene 95,334 90,322 100,070 6 (5) 381,764 357,001 7
BTX* 218,165 299,025 281,268 (27) (22) 1,036,147 1,059,479 (2)
BTX* - Benzene, Toluene, Orthoxylene and Paraxylene

8
Ethylene and propylene sales amounted to 924 kton, similar to 2012. Butadiene sales increased 7%,
reflecting the startup, in June 2012, of the 100-kton capacity-expansion project. BTX sales, however, fell 2%, due to the reduction in production volumes in the period.
Braskem America (USA and Europe)
Market: U.S. demand for PP remained at good levels, reflecting the stability in the price of raw material. In
Europe, the PP market expanded by 2%, reflecting the recovery in demand after the end of the holiday season.
Compared to 4Q12, demand grew by 5% and 6% in the United States and Europe, respectively, reflecting the improvement in U.S. economic indicators and the signs of recovery in the euro zone.
Production: production in 4Q13 was 463 kton, growing by 6% from 3Q13, when production was impacted by a scheduled maintenance shutdown and the seasonally weaker demand in Europe. Compared to 4Q12,
production grew by 5%.
Sales: in the fourth quarter, sales came to 463 kton, increasing 7% and 4% from 3Q13 and 4Q12, respectively, driven by the better performance of the U.S. and European economies.
The gradual improvement in the economic environment in the United States and euro zone had positive impacts on the International Business unit (i.e., the operations in the United States and Europe), which
recorded PP sales volume of 1.8 million tons in the year, up 3% on 2012.
Another highlight was the average utilization rate of 91% in 2013, 2 p.p. higher than in the previous year, which is explained by continuous improvement in the operational management of assets and the
international scenario. As a consequence, the production volume of PP reached 1,786 kton, the highest since 2011.
Cost of Goods Sold (COGS)
Braskem's cost of goods sold (COGS) in 4Q13 amounted to R$10.0 billion, increasing 11% on the prior quarter.
Excluding the consolidation of Quantiq, COGS increased by 3%. The lower sales volume was partially offset by (i)
the increase in the ARA naphtha price reference for
domestic supply (three month moving average) to US$914/ton, compared to US$853/ton in 3Q13; and (ii)
the increase in the gas price in the international market.
Braskem acquires around 70% of its naphtha needs from
Petrobras, with the remainder imported directly from
suppliers in North African countries, Argentina, Mexico and Venezuela. The ARA naphtha price, which is the
reference for imported naphtha, stood at US$929/ton in the quarter, increasing 2% from the previous quarter
(US$907/ton).
Performance (tons) 4Q13 3Q13 4Q12 Change (%) Change (%) 2013 2012 Change (%)
UNITED STATES AND EUROPE (A) (B) (C) (A)/(B) (A)/(C) (D) (E) (D)/(E)
Sales
PP 462,719 432,208 443,571 7 4 1,790,693 1,744,104 3
Production
PP 463,372 438,160 441,978 6 5 1,785,938 1,756,732 2
(1) Does not include naphtha resale and Quantiq costs
Naphtha , 47.3%
Ethane/ Propane
Propylene;
Electric Energy, 2.3%
Natural Gas, 2.1%
Other Variable Costs, 7.8%
Labor, 3.5%
Services, 1.5%Others, 0.9%
Deprec / Amort, 5.5%
Freight, 3.5%
COGS 4Q13 (1)
Gas as feedstock; 25.5%

9
Regarding the average gas price, the Mont Belvieu reference prices for ethane and propane increased by 5%
and 16% to US$26 cts/gal (US$194/ton) and US$120 cts/gal (US$625/ton) from 3Q13, respectively, reflecting the harsh winter in the United States. Meanwhile, the USG propylene price reference averaged
US$1,503/ton in the period, virtually stable compared to the prior quarter.
Compared to 4Q12, COGS increased 20%, reflecting primarily (i) the 22% increase in the average price of
USG propylene; (ii) the 11% U.S. dollar appreciation, which generated a negative impact of R$850 million;
and (iii) the full consolidation of Quantiq in 4Q13; with these factors partially offset by the tax relief for raw material purchases.
In 2013, Braskem's cost of goods sold (COGS) amounted to R$36 billion, increasing 10% on the prior year, basically due to (i) the higher sales volume of resins and basic petrochemicals; and (ii) the 10% U.S. dollar
appreciation between the periods, which generated a negative impact of R$2.9 billion. The higher costs were partially offset by the lower naphtha price in the international market and by the reduction in the PIS and
COFINS tax rates on raw material purchases that began to be recorded in mid-May.
Selling, General and Administrative Expenses (SG&A)
Selling, General and Administrative Expenses amounted to R$650 million in 4Q13, increasing R$108 million on the prior quarter, which is due the R$97 million impact from the consolidation of the chemical
distribution assets. In relation to 4Q12, SG&A expenses increased by R$70 million or 12%, explained by the
same reason.
Selling Expenses amounted to R$272 million. Excluding the effects from Quantiq, these expenses were
R$251 million or 4% higher than in 3Q13, due to the payment of expenses with warehousing and demurrage. On the same basis and in relation to 4Q12, selling expenses decreased by R$24 million.
General and Administrative Expenses in the quarter were R$378 million, up 26% from 3Q13, explained by the R$76 million impact from the consolidation of the chemical distribution assets. Compared to 4Q12,
G&A expenses increased by R$79 million.
In 2013, Selling, General and Administrative expenses came to R$2.2 billion, virtually in line with 2012, reflecting Braskem’s efforts to manage its costs.
EBITDA
Braskem’s consolidated EBITDA[1] in 4Q13 amounted to R$1,175 million or US$521 million, decreasing by 29% and 28%, respectively, in relation to 3Q13. EBITDA margin excluding naphtha resales stood at 10.7%,
contracting by 5.8 p.p.. The main factors contributing to this performance were (i) the lower total sales volume; (ii) the higher feedstock costs, as previously explained; (iii) the nonrecurring negative impact of
R$49 million related to the recognition of a labor claim on the payment of overtime in the industrial
operations; partially offset by the result posted by Quantiq of R$35 million.
[1] EBITDA is defined as the net result in the period plus taxes on profit (income tax and social contribution), the financial result and depreciation, amortization and depletion. The Company opts to present adjusted EBITDA, which excludes or adds other items from the statement of operations that help improve the information on its potential gross cash generation.
EBITDA is used by the Company’s management as a measure of performance, but does not represent cash flow for the periods presented and should not be considered a substitute for net income or an indicator of liquidity. The Company believes that in addition to serving as a measure of operating performance, EBITDA allows for comparisons with other companies. However, note that EBITDA is not a measure established in accordance with international financial reporting standards (IFRS) and is presented herein in accordance with Instruction 527 issued on October 4, 2012 by the Securities and Exchange Commission of Brazil (CVM).

10
Compared to 4Q12, EBITDA decreased by R$224 million. Excluding the nonrecurring positive impact of
R$516 million from the divestment of non-strategic assets in 4Q12 and the negative impact of R$49 million in 4Q13, EBITDA increased by 39% in Brazilian real and 27% in U.S. dollar. This performance is mainly
explained by (i) the recovery in thermoplastic resins spreads in the international market, and (ii) the tax relief on raw material purchases.
In 2013, Braskem’s consolidated EBITDA was R$4.8 billion, up 22% from 2012, with EBITDA margin
excluding naphtha resales of 12.3%. In U.S. dollar terms, EBITDA increased 11% to US$2.2 billion. The main factors contributing to this performance were (i) the higher domestic sales volume of thermoplastic resins;
(ii) the recovery in thermoplastic resin and basic petrochemical spreads in the international market, which increased 28% and 12%, respectively; (iii) the PIS and COFINS tax relief on raw material purchases; and (iv)
the 10% appreciation in the U.S. dollar in the period. Excluding the nonrecurring effects, Braskem’s EBITDA grew 57% in Brazilian real and 43% in U.S. Dollar in 2013.
Net Financial Result
In 4Q13, the net financial result was an expense of R$467 million, compared to the expense of R$536 million
in the prior quarter.
Since Braskem holds net exposure to the U.S. dollar (more dollar-denominated liabilities than dollar-
denominated assets), any change in the exchange rate has an impact on the accounting financial result. On
December 31, 2013, this exposure was formed (i) in the operations, by 63% of suppliers, which was partially offset by 70% of accounts receivable; and (ii) in the capital structure, by 75% of net debt. Since the
Company’s operating cash flow is heavily linked to the dollar, the Company’s believes that maintaining this level of net exposure to the dollar in liabilities acts as a natural hedge, which is in compliance with its
Financial Management Policy. Virtually 100% of its revenue is directly or indirectly pegged to the variation in
the U.S. dollar and approximately 80% of its costs are also pegged to this currency.
Since Braskem regularly exports part of its production and aiming to better reflect exchange variation in its
result, the Company designated, as of May 1st, part of its dollar-denominated liabilities as hedge for its future
677 720
521
4Q12 3Q13 4Q13
EBITDA (US$ million)
-28%
-23%
1,3991,650
1,175
4Q12 3Q13 4Q13
EBITDA (R$ million)
-16%
-29%
3,958
4,813
2012 2013
EBITDA (R$ million)
+22%
2,003 2,217
2012 2013
EBITDA (US$ million)
+11%

11
exports, in compliance with accounting standards IAS 39 and CPC 38. As a result, the exchange variation
from these liabilities, which amount to US$6,757 million, is temporarily recorded under shareholders’ equity and transferred to the income statement only when such exports occur, which enables the simultaneous
recognition of the impact from currency variation on both liabilities and exports.
In 4Q13, the effect from the 5% appreciation in the U.S. dollar3 on the net exposure of liabilities not
designated as hedge accounting generated a positive impact on the financial result of R$45 million.
It is important to mention that in both cases this effect has no immediate impact on the Company’s cash position, since the amount represents currency translation accounting impacts, especially on Braskem’s debt,
with any expenditure occurring only upon the maturity of the debt, which has an average term of 15.5 years (up from 15 years). The portion of debt denominated in U.S. dollar has an average term of around 21 years.
If hedge accounting had not been adopted, exchange variation would have generated a negative impact on the net financial result of R$2.0 billion and Braskem would have recorded a net loss of R$1.0 billion in 2013.
Excluding the effects of exchange and monetary variation, the net financial result in 4Q13 was an expense of
R$452 million, decreasing by R$24 million from the prior quarter. Compared to 4Q12, the net financial result
increased by R$148 million.
On the same basis, the net financial result in 2013 was an expense of R$1,755 million, increasing R$274
million from the prior year, which is mainly explained by (i) the increase in the line interest expenses, reflecting the hikes in the Selic basic interest rate, which influences the main indexer for BRL-denominated
debt; (ii) the restatement of lawsuits related to participation in the Special Installment Program (PEP) of the state of São Paulo; and (iii) the application of the accounting rule for adjustment to present value due to the
change in the payment term for raw materials acquired in the domestic market to 90 days as of 2Q12.
The following table shows the composition of Braskem’s net financial result.
3 On December 31, 2013, the Brazilian real/U.S. dollar exchange rate was R$2.3426/US$1.00.
US$ million R$ million
Operations designated for hedge 6,757 15,829
(a) Exchange variation on liabilities designated as hedge 2,304
(b) Tax and Social Contribution (784)
Amount recorded in shareholders' equity (a) – (b) 1,520
R$ million With HedgeWithout Hedge
Exchange Variation 255 (2,049)
Net Financial Result (1,776) (4,080)
Net Profit (loss) 507 (1,013)
2013

12
Net Income / Loss
Braskem recorded net income of R$15 million in 4Q13 and of R$507 million in fiscal year 2013. In both cases,
the result benefitted from the improvement in operating performance. As mentioned above, to better reflect the effects of exchange variation on the profit and loss, Braskem adopted hedge accounting as of May 1st.
Note that if the Company had not adopted this practice, it would have registered a net loss of R$1.0 billion.
Dividends
Based on this result, Braskem's Management is proposing to the Annual Shareholders’ Meeting to be held on
March 26, 2014, the distribution of dividends in the aggregate amount of R$483 million (see Note 29 – Shareholders’ Equity – items (g) Dividends proposed and appropriation of profit and (g.1) Profit or loss in
2013 and proposed dividends).
Capital Structure and Liquidity
On December 31, 2013, Braskem's consolidated gross debt stood at US$9,972 million. This amount includes
the financing for the Mexico project of US$2,031 million that was received by the subsidiary Braskem-Idesa. The first installment of US$1,484 million was received on July 24, 2013, and the second installment of
US$547 million was received on November 6, 2013. Since this investment was made through a project
finance structure (70% debt and 30% equity) in which the project’s debt will be repaid using its own cash flow, for the purpose of analyzing the Company's debt this project will not be included.
In this context, Braskem's consolidated gross debt stood at US$7,941 million, down 3% from the balance on September 30, 2013. In Brazilian real, gross debt increased by 2%, reflecting the impact from U.S. dollar
R$ million 4Q13 3Q13 4Q12 2013 2012
Financial Expenses (750) (574) (739) (2,549) (3,926)
Interest Expenses (292) (307) (201) (1,122) (973)
Monetary Variation (MV) (71) (82) (60) (300) (275)
Foreign Exchange Variation (FX) (117) 82 (277) (79) (1,899)
Net Interest on Fiscal Provisions (35) (34) (46) (174) (208)
Others (235) (233) (155) (875) (571)
Financial Revenue 282 38 177 773 532
Interest 96 53 69 226 191
Monetary Variation (MV) 10 6 11 24 41
Foreign Exchange Variation (FX) 162 (66) 68 333 220
Net Interest on Fiscal Credits (13) 29 2 56 30
Others 28 16 27 134 51
Net Financial Result (467) (536) (562) (1,776) (3,394)
R$ million 4Q13 3Q13 4Q12 2013 2012
Net Financial Result (467) (536) (562) (1,776) (3,394)
Foreign Exchange Variation (FX) 45 16 (209) 255 (1,679)
Monetary Variation (MV) (60) (76) (49) (276) (234)
Net Financial Result Excluding FX and MV (452) (476) (304) (1,755) (1,481)

13
appreciation of 5%4 in the period. At the end of the period, 70% of gross debt was denominated in U.S.
dollar.
Cash and cash equivalents amounted to US$1,551 million, in line with the previous quarter. In line with its
strategy to maintain high liquidity and safeguard its financial health, the Company maintains three stand-by
credit facilities, with two in the aggregate amount of US$600 million and one in the amount of R$450 million, which do not include any restrictive covenants on withdrawals during times of Material Adverse Change (MAC
Clause). Only prime banks with low default rates (credit default swap) and high credit ratings participated in the transactions.
As a result, Braskem's net debt in U.S. dollar decreased by 3% to US$6,390 million. In Brazilian real, net debt
grew by 2%. The percentage of net debt denominated in dollar was 75%.
Financial leverage, as measured by the ratio of net debt to EBITDA in U.S. dollar, ended the year at 2.87x, up 5% from the leverage ratio on September 30, 2013, when EBITDA in the last 12 months was positively
influenced by the divestment of non-core assets in 4Q12. In Brazilian real, this leverage ratio stood at 3.09x.
On December 31, 2013, the average debt term was 15.5 years, in line with the term at September 30, 2013.
Considering only the portion of debt denominated in U.S. dollar, the average debt term was around 20.7
years. The Company's average debt cost on December 31, 2013 was 6.25% in U.S. dollar and 9.04% in Brazilian real, compared to 6.24% and 9.01%, respectively, in the previous quarter.
The following charts show Braskem’s gross debt by category and indexer.
4 On December 31, 2013, the Brazilian real/U.S. dollar exchange rate was R$2.3426/US$1.00.
14,618
14,969
1,699
1,964
18,163
18,602
1,847
1,669
Sep 13
Dec 13
Sep 13
Dec 13
Sep 13
Dec 13
6,555
6,390
762
838
8,145
7,941
828
713
Sep 13
Dec 13
Sep 13
Dec 13
Sep 13
Dec 13
Net Debt
Gross Debt Gross Debt
Cash Cash
Net Debt
R$ million US$ million
3,633
3,545
1,551
1,590
invested in US$invested in R$
invested in US$invested in R$
2.73x 2.87x
Set 13 Dez 13
Net Debt/ EBITDA(US$)
5%
2.87x 3.09x
Set 13 Dez 13
Net Debt / EBITDA(R$)
8%
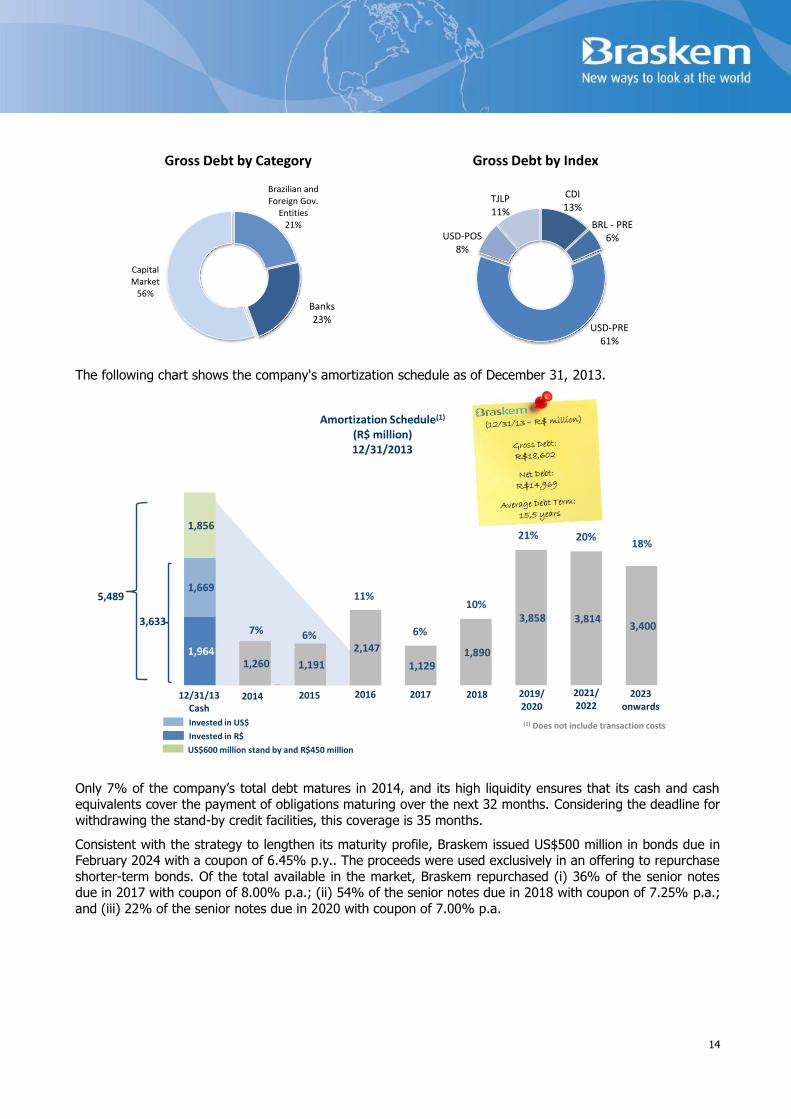
14
The following chart shows the company's amortization schedule as of December 31, 2013.
Only 7% of the company’s total debt matures in 2014, and its high liquidity ensures that its cash and cash equivalents cover the payment of obligations maturing over the next 32 months. Considering the deadline for
withdrawing the stand-by credit facilities, this coverage is 35 months.
Consistent with the strategy to lengthen its maturity profile, Braskem issued US$500 million in bonds due in February 2024 with a coupon of 6.45% p.y.. The proceeds were used exclusively in an offering to repurchase
shorter-term bonds. Of the total available in the market, Braskem repurchased (i) 36% of the senior notes due in 2017 with coupon of 8.00% p.a.; (ii) 54% of the senior notes due in 2018 with coupon of 7.25% p.a.;
and (iii) 22% of the senior notes due in 2020 with coupon of 7.00% p.a.
Brazilian and Foreign Gov.
Entities21%
Capital Market
56%
Gross Debt by Category
CDI13%
BRL - PRE6%
USD-PRE61%
USD-POS8%
TJLP11%
Gross Debt by Index
Banks 23%
3,633
1,964 1,260 1,191
2,147
1,129 1,890
3,858 3,814 3,400
1,669
1,856
2014 2015 2016 2017 2018 2019/2020
2021/2022
2023onwards
12/31/13Cash
7% 6%
11%
6%
10%
21% 20%18%
5,489
Invested in US$
Invested in R$
Amortization Schedule(1)
(R$ million)12/31/2013
(1) Does not include transaction costs
US$600 million stand by and R$450 million

15
CAPITAL EXPENDITURE:
Maintaining its strategy of making investments with returns above the cost of capital, in 2013, Braskem made
investments (excluding capitalized interest) of R$2,722 million, which was 21% above the initial estimate. The deviation in relation to the initially planned amount is explained primarily by the Mexico project. The
main factors were:
(i) the advance of a portion of the disbursement due to the arrival and assembly of large pieces of equipment at the site;
(ii) the delay by the Mexican government in the process to refund the value-added tax levied on equipment purchases;
(iii) the exchange-variation effects on the translation of amounts invested in U.S. dollar into Brazilian real, which is the Company's functional currency.
It is important to note that Braskem is committed to its financial discipline, with this deviation in relation to
the initially budgeted amount not reflecting any cost increases in the project's total investment.
To maintain the reliability and high level of efficiency of its assets, Braskem spent R$1,354 million on
maintenance, which included the expenses with the scheduled maintenance shutdown at Camaçari in 4Q13.
For 2014, total investment is estimated at R$2.7 billion, of which (i) 25% will be allocated to building the new
petrochemical complex in Mexico; and (ii) 60% will be allocated to the maintenance, productivity
improvements and reliability of its assets, which include the scheduled maintenance shutdowns at the Rio Grande do Sul and São Paulo crackers. The remainder will be allocated to other ongoing projects, such as the
conversion of one of the polyethylene production lines in Bahia to increase its capacity to produce metallocene-based LLDPE; the studies related to COMPERJ and to the production, in Camaçari, Bahia, of
styrenics specialties and copolymers of acrylonitrile butadiene styrene (ABS) and styrene-acrylonitrile (SAN); and the conclusion of construction on the pipeline that will supply propylene to the acrylics complex in Bahia.
1,332 1,354 1,476
204 194226173 75
2585361,098
704
2013e 2013 2014e
Investments(R$ million)
Maintenance / Equipment Replacement / Others Productivity / HSE Comperj / Other Projects Mexico
2,244
2,722 2,664

16
ACQUISITION OF SOLVAY INDUPA:
In December, Braskem entered into a contract with Solvay Argentina S.A. (“Solvay Argentina") for the acquisition of 292,453,490 shares representing 70.59% of the total and voting capital of Solvay Indupa
S.A.I.C (“Solvay Indupa”) for US$0.085 per share.
Solvay Indupa, a PVC and Caustic Soda producer, owns two integrated industrial facilities that enjoy
privileged geographic positions close to major consumer markets, which are located in:
(i) Santo André, São Paulo, with the capacity to produce 300 kton of PVC and 170 kton of Caustic Soda;
(ii) and Bahía Blanca in the Province of Buenos Aires, with the capacity to produce 240 kton of PVC and 180 kton of caustic soda.
To Braskem, the leading producer of thermoplastic resins in the Americas, the acquisition aims to strengthen its vinyls business and the vinyls chain in Brazil and Argentina, given the growing demand in the region for
PVC and Caustic Soda. With this acquisition, which is still subject to approval by the antitrust authorities of
both countries, Braskem expands its annual production capacity to 1,250 kton of PVC and 890 kton of caustic soda.
PROJECT PIPELINE:
Consistent with its middle and long term strategy, Braskem focuses on investments that improve the
competitiveness and diversification of its feedstock matrix and strengthen its leadership in the Americas and in the biopolymers industry.
5 The project's fixed investment (capital expenditure) is estimated at US$3.2 billion. The total investment of US$ 4.5 billion includes the project's capex, working capital requirements and interest payments.
Project Capacity (kton/y)
Investment Cumulative
through Dec/13 Characteristics
Ethylene XXI (Integrated ethylene/PE project)
Location: Coatzacoalcos, Mexico
1,050 ~US$4.5 bn5
~US$2.5 bn
JV between Braskem (75%) and Idesa (25%).
Long-term contract (20 years) with PEMEX-Gás based on the Mont Belvieu reference gas price.
In addition to gaining access to feedstock at attractive conditions, the project aims to meet the growing demand in Mexico for PE of around 1.9 million tons, of which around 70% is currently met by imports.
Earthmoving works concluded.
In October 2012, the Engineering, Procurement and Construction (EPC) contract was signed with a consortium for the complex’s construction formed by Odebrecht (40%), Technip (40%) and ICA Fluor (20%).
The US$3.2 billion project finance structure was concluded in December 2012:
o SACE: US$600 million;
o IADB and IFC: US$570 million A loan to be complemented by a US$700 million B Loan;
o Brazilian Development Bank (BNDES): US$623

17
BRASKEM’S COMPETITIVE ADVANTAGES:
VISIO Program
Braskem continues to make progress in its commitment to develop
Brazil’s plastics chain and create value for its Clients. Some of the highlights in the quarter follow:
The Company was contacted by Natura, which aimed to find a partner company capable of developing an exclusive packaging for its line of hair care products. Braskem intermediated the
partnership with one of its clients, Grupo Albea.
In Alagoas, Braskem launched a competition for the development of a house made primarily
from PVC. After the competition, model homes will be built in partnership with Royal do
million;
o BancoMext and NAFIN: US$400 million;
o EDC: US$ 300 million.
Construction: in 4Q13, the project reached 58% physical completion. Start of electro-mechanical assembly of: (i) the power-generating unit, with the arrival of the steam-generating boilers; and (ii) the transformers of the complex’s main power substation. Over 330 pieces of equipment and 38,000 tons of material have already been delivered to the site, and around 400 people have been hired for the future industrial operation.
First disbursement of the Project Finance installment in in the amount of US$1,484 million on July 24. Second disbursement in the amount of US$547 million on November 6.
Priorities for 2014:
o Receiving the remaining materials and equipment to complete the works, such as gas and steam turbines for power generation, pumps, compressors, pressure vessels and transformers;
o Expanding the number of active clients, with a resulting increase in the volume of resin imports for resale and the structuring of the sales and logistics teams to support the growing pre-marketing demands;
o Training and development of the Team Members who will run the future industrial operation.
Comperj
Rio de Janeiro, Brazil
n/a To be determined
The project, which is still in the study phase, aims to meet the growing demand in Brazil, add value to the country’s natural resources and support its industrialization process.

18
Brasil, a Braskem’s client specialized in PVC construction systems. The initiative introduces Braskem clients to
new markets while promoting innovation in the plastics manufacturing industry.
Braskem joined the forces of three of its clients (Electro Plastic, Roma and Tropical Estufa) for the development of a pilot greenhouse for drying cocoa beans. The
model, which costs 60% less than a traditional greenhouse and operates on solar
power, was presented to cocoa bean producers during an event organized by the Company in the state of Bahia.
Innovation Pipeline
Polypropylene for the outdoor furniture segment: in order to respond to new market needs,
Braskem improved a PP resin to obtain increased stiffness and impact resistance compared to
the previous model. The new product prevents process losses for Clients, since it better meets the mechanical performance requirements demanded by the application.
Polyethylenes for water and sewer pipes: The portfolio of resins for pressure pipes was expanded with the launch of two new resins with higher resistance and that meet the
requirements demanded by the market.
OUTLOOK:
The improvement in the economy of developed countries led the International Monetary Fund (IMF) to revise
upward to 3.7% its forecast for world GDP growth in 2014. The United States and the euro zone are expected to maintain their recovery path, while the Chinese economy, despite its slower growth pace than in
previous years, continues to grow at a rate above 7%. The risk in this scenario continues to be associated with the fragility of the financial systems of certain countries caused by high debt levels and its impacts on
the recovery in mature markets and on growth in developing countries.
In the case of Brazil, the GDP growth forecast for this year was revised downwards to 2.3%. The main
factors are expectations of weaker domestic consumer spending due to scarcer credit and a lower consumer
confidence.
However, the federal government has pursued economic stimulus measures and, with the expiration of
certain stimulus programs implemented in 2012-13, it launched, in October 2013, the “Minha Casa Melhor” a program that provides credit to consumers for purchasing home electronics and appliances and furniture.
For the petrochemical industry, geopolitical issues in Iran, Siria and Libya should continue to affect the supply
and oil prices. The growth in U.S. oil production following the advances made in technological processes for its extraction will also be an important factor in this dynamic. Naphtha, the main feedstock used by the
petrochemical industry, should continue to follow this volatility. However, the improvement in the world economy is expected to have a positive impact on demand and on the recovery in industry profitability.
In this scenario, Braskem’s strategy remains centered on strengthening its business by: (i) increasing the competitiveness of its feedstock matrix by reducing its cost and diversifying its profile; (ii) continuing to
strengthen its relationships with Clients; (iii) supporting the creation of an industrial policy targeting the
development of Brazil’s petrochemical and plastics chain; (iv) pursuing operational efficiency by maintaining high capacity utilization rates; (v) continuing to make progress on the construction of the greenfield project
in Mexico known as Ethylene XXI; (vi) pursuing opportunities in Brazil based on the processing of natural gas

19
from the country's pre-salt oil deposits and in the U.S. petrochemical market based on the competitive
advantages of shale gas; and (vii) maintaining the Company’s financial health and cost discipline.
On the operational front, two maintenance shutdowns have been scheduled in the Rio Grande do Sul and
São Paulo crackers for March and September, respectively. Production planning for the year should partially offset the months of these maintenance shutdowns, with capacity utilization at Braskem’s crackers expected
to remain at around 90%.
Braskem follows with its commitment to growth and sustainable development, and will continue to act proactively in search of opportunities, aiming to create value to its Clients, Shareholders and all stakeholders,
withouth loosing focus in its financial health.
NOTE: (i) On December 31, 2013, the Brazilian real/U.S. dollar exchange rate was R$2.3426/US$1.00.

20
UPCOMING EVENTS:
4Q13 Earnings Conference Call
Portuguese
10:00 a.m. (Brasília)
7:00 a.m. (US EST)
4:00 p.m. (Los Angeles)
12:00 p.m. (London)
Dial-in +55 (11) 2188-0155
Code: Braskem
English
12:00 p.m. (Brasília)
9:00 a.m. (US EST)
6:00 a.m. (Los Angeles)
2:00 p.m. (London)
USA: +1 (866) 890-2584
Other countries: +55 (11) 2188-0155
Code: Braskem
INVESTOR RELATIONS TEAM:
Roberta Varella Fernando T. de Campos Head of IR IR Coordinator Tel: +55 (11) 3576-9266 Tel: +55 (11) 3576-9479 [email protected] [email protected]
Daniela Balle de Castro Pedro Gomes de Souza IR Analyst IR Analyst Tel: +55 (11) 3576-9615 Tel: +55 (11) 3576-9010 [email protected] [email protected]
www.braskem.com.br/ir

21
EXHIBITS LIST:
EXHIBIT I: Consolidated Income Statement 22
EXHIBIT II: EBITDA Calculation 23
EXHIBIT III: Consolidated Balance Sheet 24
EXHIBIT IV: Consolidated Cash Flow Statement 25
EXHIBIT V: Production Volume 26
EXHIBIT VI: Sales Volume – Domestic Market 27
EXHIBIT VII: Sales Volume – Export Market 28
EXHIBIT VIII: Consolidated Net Revenue 29
EXHIBIT IX: Consolidated Income Statement - Quantiq 30
EXHIBIT X: EBITDA Calculation - Quantiq 30
Braskem, a world-class Brazilian petrochemical company, is the leader in the thermoplastic resins segment in the Americas. With 36 industrial plants, of which 29 are in Brazil, 5 in the United States and 2 in Europe, the Company has
annual production capacity of 16 million tons of thermoplastic resins and other petrochemical products.
DISCLAIMER
This press release contains forward-looking statements. These forward-looking statements are not solely
historical data, but rather reflect the targets and expectations of Braskem’s management. Words such as "anticipate", "wish", "expect", "foresee", "intend", "plan", "predict", "project", "aim" and similar terms, written, seek to identify statements that necessarily involve known and unknown risks. Braskem does not undertake any responsibility for transactions or investment decisions based on the information contained in this document.

22
EXHIBIT I
Consolidated Income Statement
(R$ million)
Note: with the decision to maintain the investments in Quantiq, Braskem’s consolidated result reflects the consolidation of its result in 4Q13 and 2013 and the restatement of its quarterly and annual financial statements.
Income Statement 4Q13 3Q13 4Q12 Change (%) Change (%) 2013 2012 Change (%)
CONSOLIDATED (A) (B) (C ) (A)/(B) (A)/(C ) (D) (E) (D)/(E)
Gross Revenue 13,365 12,254 11,159 9% 20% 47,770 42,982 11%
Net Revenue 11,446 10,700 9,410 7% 22% 40,969 36,160 13%
Cost of Good Sold (10,028) (9,006) (8,377) 11% 20% (35,821) (32,709) 10%
Gross Profit 1,417 1,694 1,033 -16% 37% 5,149 3,451 49%
Selling Expenses (272) (242) (281) 12% -3% (1,001) (990) 1%
General and Administrative Expenses (378) (300) (299) 26% 26% (1,194) (1,177) 1%
Other Net Operating Income (expenses) (111) (46) 44 - - (211) 333 -
Investment in Subsidiary and Associated Companies (2) 1 13 - - (3) (26) -88%
Operating Profit Before Financial Result 655 1,108 510 -41% 29% 2,740 1,591 72%
Net Financial Result (467) (536) (610) -13% -23% (1,776) (3,394) -48%
Profit (loss) Before Tax and Social Contribution 188 573 (100) -67% - 964 (1,803) -
Income Tax / Social Contribution (173) (179) 109 -3% - (457) 783 -
Discontinued operations result - - 266 - - - 282 -
Net Profit (loss) 15 394 275 -96% 43% 507 (738) -
Earnings (loss) Per Share 0.03 0.49 0.35 -94% 40% 0.64 (0.92) -

23
EXHIBIT II
EBITDA CALCULATION
(R$ million)
(i) Represents accrual and reversal of provisions for the impairment of long-lived assets (investments, property, plant and
equipment and intangible assets) that were adjusted to form EBITDA since there is no expectation of their financial
realization and if in fact realized they would be duly recorded on the statement of operations.
(ii) Corresponds to the items current and deferred income and social contribution taxes, financial result, depreciation and
amortization and equity income, which are included in profit or loss from discontinued operations.
(iii) Corresponds to results from equity investments in associated companies and joint ventures.
EBITDA Statement 4Q13 3Q13 4Q12 Change (%) Change (%) 2013 2012 Change (%)
CONSOLIDATED (A) (B) (C ) (A)/(B) (A)/(C ) (D) (E) (D)/(E)
Net Profit 15 394 275 -96% -95% 507 (738) -
Income Tax / Social Contribution 173 179 (109) -3% - 457 (783) -
Financial Result 467 536 610 -13% -23% 1,776 3,394 -48%
Depreciation, amortization and depletion 545 544 488 0% 12% 2,056 1,924 7%
Cost 468 475 437 -1% 7% 1,832 1,733 6%
Expenses 76 69 50 11% 52% 224 191 17%
Basic EBITDA 1,200 1,652 1,263 -27% -5% 4,796 3,797 26%
Provisions for the impairment of long-lived assets (i) (27) (0) 2 - - 13 (10) -
Adjustments in discontinued operations result (i i) - - (13) - - - 26 -
Results from equity investments (i i i) 2 (1) 147 - -99% 3 146 -98%
Adjusted EBITDA 1,175 1,650 1,399 -29% -16% 4,813 3,958 22%
EBITDA Margin 10.3% 15.4% 14.9% -5.2 p.p. -4.6 p.p. 11.7% 10.9% 0.8 p.p.

24
EXHIBIT III
Consolidated Balance Sheet
(R$ million)
* Includes exchange variation from the liabilities designated for export hedge accounting (Note 20.2.1 to the Financial Statements).
12/31/2013 09/30/2013
(A) (B)
Current 14,997 14,268
Cash and Cash Equivalents 4,336 3,855
Marketable Securities/Held for Trading 87 62
Accounts Receivable 2,811 2,634
Inventories 5,034 4,897
Recoverable Taxes 2,237 1,710
Other Receivables 456 833
Non Current Assets Held for Sale 38 278
Non Current 33,349 31,517
Marketable Securities/ Held-to-Maturity 21 32
Compulsory Deposits and Escrow Accounts 210 183
Accounts Receivable 341 383
Deferred Income Tax and Social Contribution 2,654 2,480
Taxes Recoverable 1,286 1,395
Related Parties 134 132
Insurance claims 139 67
Investories 117 0
Investments 122 120
Property, Plant and Equipament 25,414 23,815
Intangible Assets 2,913 2,910
Total Assets 48,346 45,785
12/31/2013 09/30/2013
(A) (B)
Current 13,595 13,939
Suppliers 10,422 9,715
Financing/Debentures 1,249 2,492
Project Finance 26 16
Financial Opperations 95 116
Salary and Payroll Charges 491 459
Dividends and Interest on Equity 132 4
Taxes Payable 445 398
Advances from Customers 297 274
Sundry Provisions 106 52
Post-employment Benefit 158 188
Other Payable 174 115
Non Current Liabilities Held for Sale 0 110
Non Current 27,070 23,671
Financing/Debentures 17,354 15,671
Project Finance 4,706 3,284
Deferred Income Tax and Social Contribution 2,394 2,255
Taxes Payable 903 1,006
Sundry Provisions 450 378
Advances from Customers 153 163
Other Payable 662 505
Others 449 409
Shareholders' Equity 7,681 8,175
Capital 8,043 8,043
Capital Reserve 232 232
Profit Reserves 410 0
Treasury Shares (49) (49)
Other Comprehensive Income* (1,093) (685)
Retained Earnings (losses) - 507
Non Controlling Interest 137 127
Total Liabilities and Shareholders' Equity 48,346 45,785
ASSETS
LIABILITIES AND SHAREHOLDERS' EQUITY

25
EXHIBIT IV
Cash Flow
(R$ million)
Note: as a result of Management's decision to maintain the investments in Quantiq, Braskem’s consolidated result reflects the consolidation of Quantiq's result in 4Q13 and 2013 and the restatement of its 2012 quarterly and annual financial statements.
Cash Flow 4Q13 3Q13 4Q12 2013 2012
Profit (loss) Before Income Tax and Social Contribution 188 573 305 964 (1,378)
Adjust for Net Income Restatement
Depreciation and Amortization 545 544 488 2,056 1,924
Equity Result 2 (1) (13) 3 26
Interest, Monetary and Exchange Variation, Net 484 346 429 1,342 2,443
Others (2) (33) 305 9 294
Cash Generation before Working Capital 1,215 1,428 1,514 4,374 3,309
Operating Working Capital Variation
Market Securities (21) 18 64 98 17
Account Receivable (118) (292) 75 (493) (625)
Recoverable Taxes (391) 41 35 (448) (459)
Inventories (156) (502) (274) (927) (566)
Advanced Expenses 32 39 3 (9) 50
Other Account Receivables 67 (81) (457) (27) (529)
Suppliers 356 (151) (12) 743 2,166
Advances from Customers/Long-Term Incentives 11 (207) 121 5 201
Taxes Payable 9 (127) (151) (127) (431)
Other Account Payables 207 (263) 48 309 389
Other Provisions 125 57 77 140 94
Operating Cash Flow 1,335 (40) 1,043 3,636 3,616
Interest Paid (339) (272) (481) (1,124) (1,007)
Income Tax and Social Contribution (11) (9) (8) (55) (37)
Net Cash provided by operating activities 985 (321) 553 2,458 2,572
Proceeds from the sale of fixed assets 1 1 110 3 116
Proceeds from the capital reduction of associates 303 154 - 690 -
Additions to Investment (0) - - (0) -
Additions to Fixed Assets (1,735) (1,772) (942) (5,656) (2,793)
Additions to Intangible Assets (13) (4) (8) (26) (16)
Effect of incorporation (discontinuation) of associates cash 10 - (141) 10 (141)
Financial Assets Held to Maturity 16 (10) 6 26 (0)
Cash used in Investing Activities (1,419) (1,631) (975) (4,954) (2,834)
Obtained Borrowings 2,147 4,147 1,070 10,879 6,666
Payment of Borrowings (1,125) (1,794) (407) (7,301) (5,493)
Repurchase of Shares - - - - (37)
Dividends (0) (0) (482) (0) (482)
Non-controlling interests 3 - (38) 36 (20)
Cash used in Financing Activities 1,025 2,353 142 3,614 634
Exchange Variation on Cash of Foreign Subsidiaries and Jointly Controlled Companies (111) 53 (2) (70) (36)
Increase (decrease) in Cash and Cash Equivalents 481 455 (281) 1,048 335
Represented by
Cash and Cash Equivalents at The Beginning of The Year 3,855 3,400 3,569 3,288 2,952
Cash and Cash Equivalents at The End of The Year 4,336 3,855 3,288 4,336 3,288
Increase (Decrease) in Cash and Cash Equivalents 481 455 (281) 1,048 335

26
EXHIBIT V
Production Volume – Main Products
1T12tons 1Q12 2Q12 3Q12 4Q12 1Q13 2Q13 3Q13 4Q13
Polyolefins
PE's 656,359 637,216 666,380 579,520 632,257 658,317 661,780 627,936
PP 431,401 379,643 440,753 394,822 436,029 397,996 406,989 386,128
Vinyls
PVC 114,950 110,629 140,595 131,192 146,877 146,676 129,546 159,480
Caustic Soda 116,142 99,083 126,430 108,934 115,321 110,585 109,108 102,319
Chlorine 15,103 11,641 13,793 12,515 11,404 7,923 10,192 12,060
Basic Petrochemicals
Ethylene 870,154 819,825 868,891 770,887 835,531 875,943 865,868 795,483
Propylene 377,083 363,951 390,155 341,299 372,137 392,251 392,956 348,251
Benzene 212,173 196,181 211,096 184,735 215,095 210,225 204,750 195,315
Butadiene 78,132 75,927 106,597 95,047 100,850 104,759 88,129 96,116
Toluene 43,677 32,637 46,443 42,122 41,742 49,836 57,978 51,853
Fuel (m³) 204,444 199,333 205,932 210,297 221,317 225,235 242,856 244,282
Paraxylene 44,630 45,458 49,050 45,660 44,930 47,527 30,437 3,287
Orthoxylene 24,458 22,924 24,590 20,685 22,592 19,196 16,166 6,903
Butene 1 10,910 10,078 15,067 9,651 11,380 13,556 15,106 11,179
ETBE/ MTBE 71,525 59,017 78,890 76,818 78,403 81,981 77,561 68,686
Mixed Xylene 19,694 21,955 27,580 16,739 15,840 21,060 16,264 35,503
Cumene 63,697 63,804 64,406 54,335 73,138 43,145 57,809 55,593
Polybutene 5,222 6,317 6,010 3,495 9,778 1,240 5,936 6,032
LPG 11,170 6,892 4,533 2,870 6,533 8,299 6,940 7,701
Aromatic Residue 31,838 30,566 33,821 25,972 34,795 37,226 41,710 35,077
Petrochemical Resins 3,918 3,863 3,304 3,112 2,599 3,670 3,740 3,868
United States and Europe
PP 439,216 427,039 448,500 441,978 427,757 456,650 438,160 463,372
PRODUCTION CONSOLIDATED
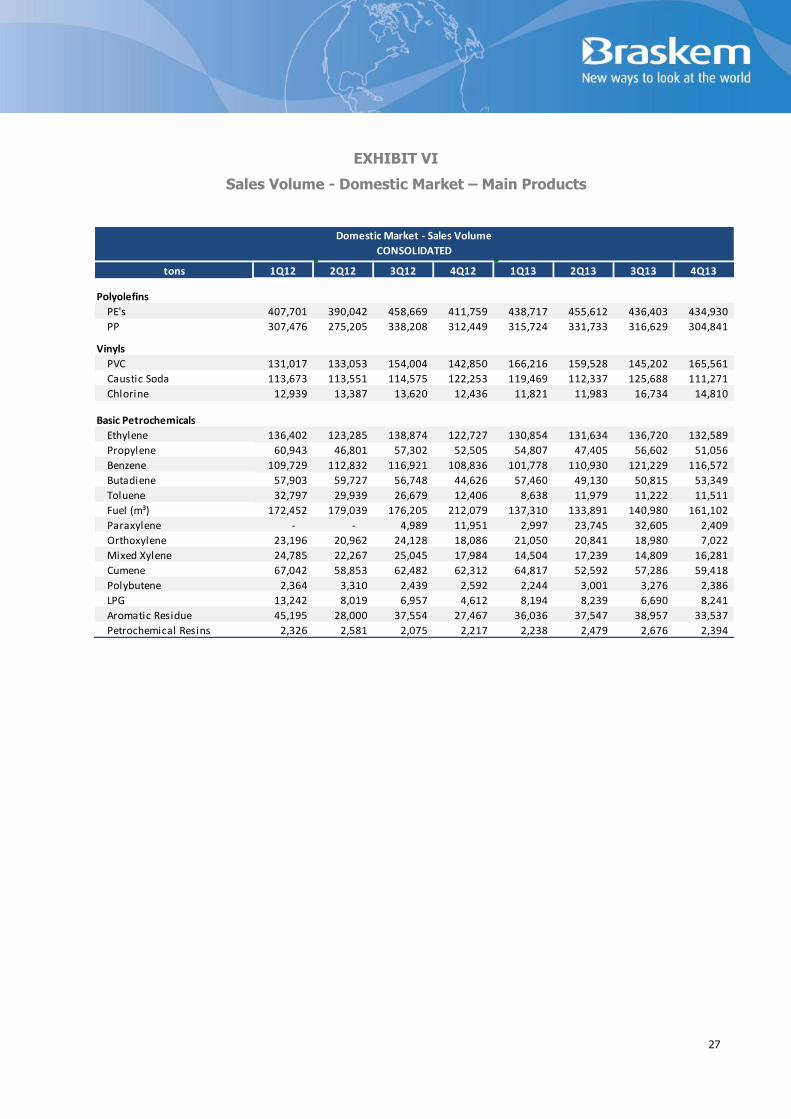
27
EXHIBIT VI
Sales Volume - Domestic Market – Main Products
#REF! #REF! #REF!
tons 1Q12 2Q12 3Q12 4Q12 1Q13 2Q13 3Q13 4Q13
Polyolefins
PE's 407,701 390,042 458,669 411,759 438,717 455,612 436,403 434,930
PP 307,476 275,205 338,208 312,449 315,724 331,733 316,629 304,841
Vinyls
PVC 131,017 133,053 154,004 142,850 166,216 159,528 145,202 165,561
Caustic Soda 113,673 113,551 114,575 122,253 119,469 112,337 125,688 111,271
Chlorine 12,939 13,387 13,620 12,436 11,821 11,983 16,734 14,810
Basic Petrochemicals
Ethylene 136,402 123,285 138,874 122,727 130,854 131,634 136,720 132,589
Propylene 60,943 46,801 57,302 52,505 54,807 47,405 56,602 51,056
Benzene 109,729 112,832 116,921 108,836 101,778 110,930 121,229 116,572
Butadiene 57,903 59,727 56,748 44,626 57,460 49,130 50,815 53,349
Toluene 32,797 29,939 26,679 12,406 8,638 11,979 11,222 11,511
Fuel (m³) 172,452 179,039 176,205 212,079 137,310 133,891 140,980 161,102
Paraxylene - - 4,989 11,951 2,997 23,745 32,605 2,409
Orthoxylene 23,196 20,962 24,128 18,086 21,050 20,841 18,980 7,022
Mixed Xylene 24,785 22,267 25,045 17,984 14,504 17,239 14,809 16,281
Cumene 67,042 58,853 62,482 62,312 64,817 52,592 57,286 59,418
Polybutene 2,364 3,310 2,439 2,592 2,244 3,001 3,276 2,386
LPG 13,242 8,019 6,957 4,612 8,194 8,239 6,690 8,241
Aromatic Residue 45,195 28,000 37,554 27,467 36,036 37,547 38,957 33,537
Petrochemical Resins 2,326 2,581 2,075 2,217 2,238 2,479 2,676 2,394
Domestic Market - Sales Volume
CONSOLIDATED

28
EXHIBIT VII
Sales Volume - Export Market – Main Products
tons 1Q12 2Q12 3Q12 4Q12 1Q13 2Q13 3Q13 4Q13
Polyolefins
PE's 230,155 227,230 233,607 170,843 174,247 189,692 210,338 203,774
PP 101,740 103,022 117,655 93,077 66,110 72,820 93,475 79,495
Basic Petrochemicals Unit
Propylene 46,216 36,796 60,847 43,885 40,288 54,582 43,902 40,396
Benzene 36,404 47,893 35,732 48,876 40,222 63,380 66,147 36,411
Butadiene 15,699 11,807 55,047 55,443 40,777 48,741 39,507 41,985
Toluene 9,239 6,479 10,748 40,413 24,821 31,621 38,947 44,239
Fuel (m³) 15,393 38,113 15,822 15,661 66,774 103,664 95,586 86,946
Paraxylene 36,572 44,526 46,546 38,601 31,395 25,559 9,895 -
Butene 1 1,009 2,040 - 1,499 - 3,175 1,680 40
ETBE/ MTBE 62,838 54,312 83,342 89,063 61,689 81,480 76,788 70,324
Mixed Xylene 239 133 80 556 451 5,497 482 14,587
Polybutene 3,292 3,364 3,050 3,475 3,829 3,802 3,313 3,620
United States and EuropePP 428,042 420,768 451,723 443,571 430,872 464,893 432,208 462,719
Export Market - Sales Volume
CONSOLIDATED
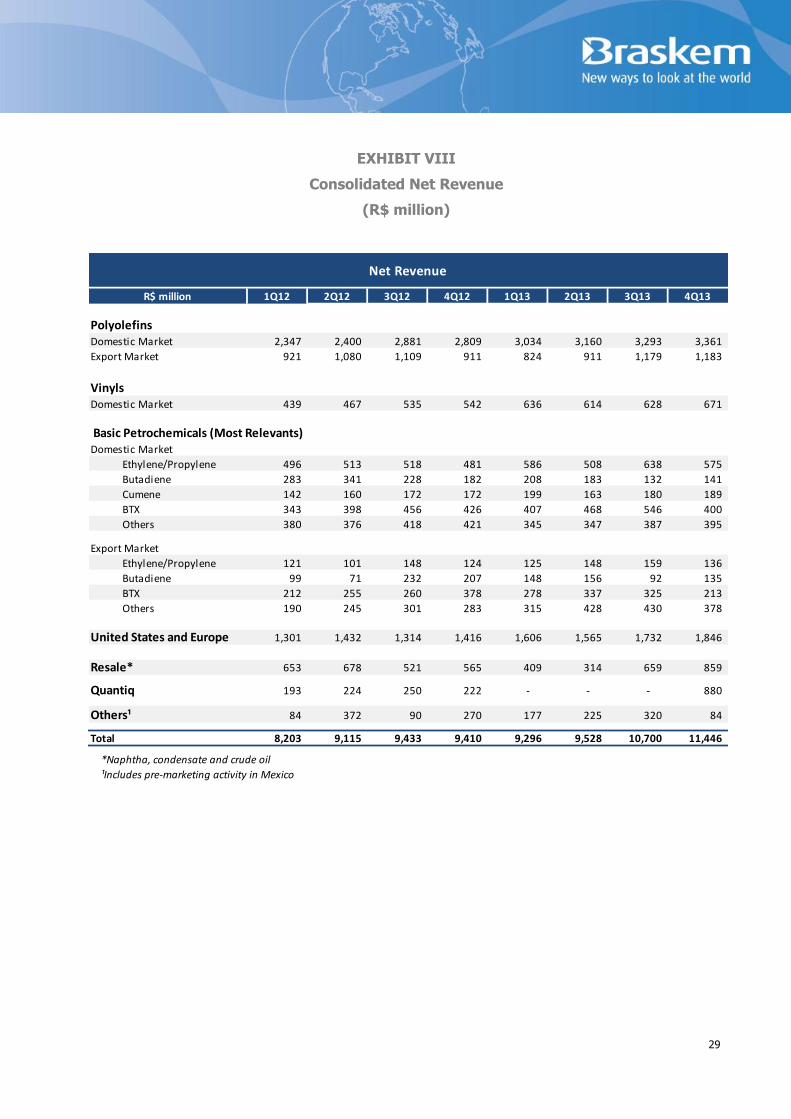
29
EXHIBIT VIII
Consolidated Net Revenue
(R$ million)
R$ million 1Q12 2Q12 3Q12 4Q12 1Q13 2Q13 3Q13 4Q13
PolyolefinsDomestic Market 2,347 2,400 2,881 2,809 3,034 3,160 3,293 3,361
Export Market 921 1,080 1,109 911 824 911 1,179 1,183
VinylsDomestic Market 439 467 535 542 636 614 628 671
Basic Petrochemicals (Most Relevants)Domestic Market
Ethylene/Propylene 496 513 518 481 586 508 638 575
Butadiene 283 341 228 182 208 183 132 141
Cumene 142 160 172 172 199 163 180 189
BTX 343 398 456 426 407 468 546 400
Others 380 376 418 421 345 347 387 395
Export Market
Ethylene/Propylene 121 101 148 124 125 148 159 136
Butadiene 99 71 232 207 148 156 92 135
BTX 212 255 260 378 278 337 325 213
Others 190 245 301 283 315 428 430 378
United States and Europe 1,301 1,432 1,314 1,416 1,606 1,565 1,732 1,846
Resale* 653 678 521 565 409 314 659 859
Quantiq 193 224 250 222 - - - 880
Others¹ 84 372 90 270 177 225 320 84
Total 8,203 9,115 9,433 9,410 9,296 9,528 10,700 11,446
*Naphtha, condensate and crude oil
¹Includes pre-marketing activity in Mexico
Net Revenue

30
EXHIBIT IX
Consolidated Income Statement - Quantiq
(R$ million)
EXHIBIT X
EBITDA Calculation - Quantiq
(R$ million)
Quantiq - Income Statement
CONSOLIDATED
Gross Revenue 1,180
Net Revenue 880
Cost of Good Sold (749)
Gross Profit 131
Selling Expenses (21)
General and Administrative Expenses (76)
Other Net Operating Income (expenses) (7)
Investment in Subsidiary and Associated Companies -
Operating Profit Before Financial Result 27
Net Financial Result (11)
Profit (loss) Before Tax and Social Contribution 16
Income Tax / Social Contribution (0)
Net Profit (loss) 16
2013
Quantiq - EBITDA Statement
CONSOLIDATED
Net Profit 16
Income Tax / Social Contribution 0
Financial Result 11
Depreciation, amortization and depletion 7
Cost -
Expenses 7
Basic EBITDA 35
Provisions for the impairment of long-lived assets (i) -
Adjustments in discontinued operations result (i i) -
Results from equity investments (i i i) -
Adjusted EBITDA 35
EBITDA Margin 3.9%
2013