brand awareness
DESCRIPTION
projectTRANSCRIPT
A STUDY ON BRAND AWARENESS OF “GETIT INFO
SERVICES” AMONG SMALL & MEDIUM SCALE
ENTERPRISES (SME’S), CHENNAI.
A PROJECT REPORT
Submitted by
MOHAMMAD RAFI.J
(Reg. No:21610631027)
in partial fulfillment for award of the degree
of
MASTER OF BUSINESS ADMINISTRATION
SAVEETHA ENGINEERING COLLEGE
THANDALAM, CHENNAI 602 105ANNA UNIVERSITY: CHENNAI 600 025
JUNE 2012
DECLARATION
I, MOHAMMAD Rafi.J , (21610631027) a bonafide student of Saveetha Management
School, Saveetha Engineering College, Chennai would like to declare that the project
entitled, “A STUDY ON BRAND AWARENESS OF GETIT INFO SERVICES
AMONG SMALL&MEDIUM SCALE ENTERPRISES (SME’S), CHENNAI” in partial
fulfillment of Master of Business Administration course of the Anna University is my
original project work.
Place :
Date : MOHAMMAD RAFI.J
BONAFIDE CERTIFICATE
Certified that this project report “A STUDY ON BRAND AWARENESS OF GETIT
INFO SERVICES AMONG SMALL & MEDIUM SCALE ENTERPRISES
(SME’S),CHENNAI” is the bonafide work of MOHAMMAD RAFI. J (21610631027)
who carried out the project work under my supervision.
SIGNATURE SIGNATURE
Mr A GANDHI MRS. A. ANUPAMA JULIET
HEAD OF THE DEPARTMENT Asst.PROFESSOR
SAVEETHA MANAGEMENT SAVEETHA MANAGEMENT SCHOOL SCHOOLSAVEETHA ENGINEERING SAVEETHA ENGINEERINGCOLLEGE COLLEGE
THANDALAM, CHENNAI. THANDALAM,CHENNAI.
ACKNOWLEDGEMENT
I take an opportunity to express my thanks to our President Mr. Dr. N.M.
VEERAIYAN and also to Director Dr.S.Rajesh.
I am thankful to Dr. R. VENKATASAMY, Principal of Saveetha
Engineering College and also to Dean Prof R. Dheenadayalu for providing the
required arrangements to carry out this project work.
I am grateful to thank Prof, A.GANDHI our Head of the Department of
Master of Business Administration.
I wish to express my gratitude to my project guide MRS. A.ANUPAMA
JULIET for her constant support and encouragement.
I am very much thankful to Mr. Vivek Marketing manager of GETIT
INFO SERVICES Chennai, for spending his valuable time and giving guidance
and cooperation to carry on this project.
MOHAMMAD RAFI.J
ABSTRACT
Brand awareness is the ultimate goal of most businesses is to increase sales and income.
Ideally, you want toattract new customers to your products and encourage repeat purchases.
The primary objectives to study the brand awareness of “getit info services” among small &
medium scale enterprises (sme’s), Chennai. The secondary objectives is to have a clear
understanding of the local search engine industry and getit info services position in market,
to increase sales of getit info services products-services, to retain other brand existing
customers and convert new customers for getit info services.
The sample size is chosen as 200. The statistical tools used for analysis of data are percentage
analysis, karl pearson's correlation coefficient (r) mann-whitney u-test. This study is made to
completely know about the Brand Awareness of Getit Info Services. Analysis and
interpretation is done from the view point of existing clients ofGetit Info Services and based
on their response the results are arrived.
The study reveals that the GETIT INFO SERVICES has built its brand awareness among a
relatively good number of people in an around Chennai, People prefer GETIT INFO
SERVICES due to its competitive package structures, fast reaching platform, prompt direct &
online response, apart from tips and guidance from the company
TABLE OF CONTENTS
Chapter No Description Page No
Title Page
Bonafide Certificate
Organization Certificate
Declaration
Acknowledgement
Abstract
Table of Contents
List of Tables
List of Charts
I. Introduction1.1 Introduction1.2 Objectives of the study1.3 Need for the study1.4 Scope of the study1.5 Limitations of the study1.6 Industry Profile1.7 Organisation Profile
II. Review of Literature
III. Research Methodology3.1 Sources of data3.2 Sample design3.3 Questionnaire design
IV. Data analysis and Interpretation
V. Findings, Suggestions and Conclusion
VI. Bibliography
VII. Annexure

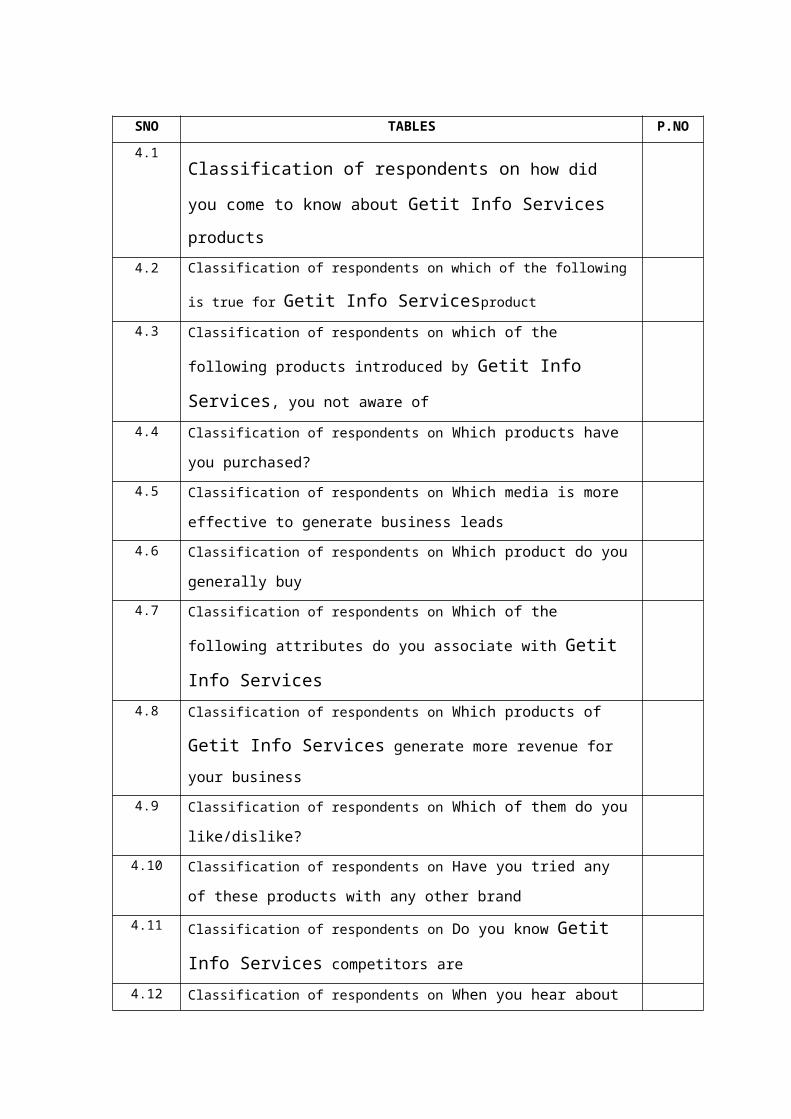
LIST OF TABLES
SNO TABLES P.NO
4.1Classification of respondents on how did you come to know about
Getit Info Services products
4.2 Classification of respondents on which of the following is true for Getit Info
Servicesproduct
4.3 Classification of respondents on which of the following products introduced by
Getit Info Services, you not aware of
4.4 Classification of respondents on Which products have you purchased?
4.5 Classification of respondents on Which media is more effective to generate
business leads
4.6 Classification of respondents on Which product do you generally buy
4.7 Classification of respondents on Which of the following attributes do you
associate with Getit Info Services
4.8 Classification of respondents on Which products of Getit Info Services
generate more revenue for your business
4.9 Classification of respondents on Which of them do you like/dislike?
4.10 Classification of respondents on Have you tried any of these products with any
other brand
4.11 Classification of respondents on Do you know Getit Info Services
competitors are
4.12 Classification of respondents on When you hear about a product category, can
you recall our products
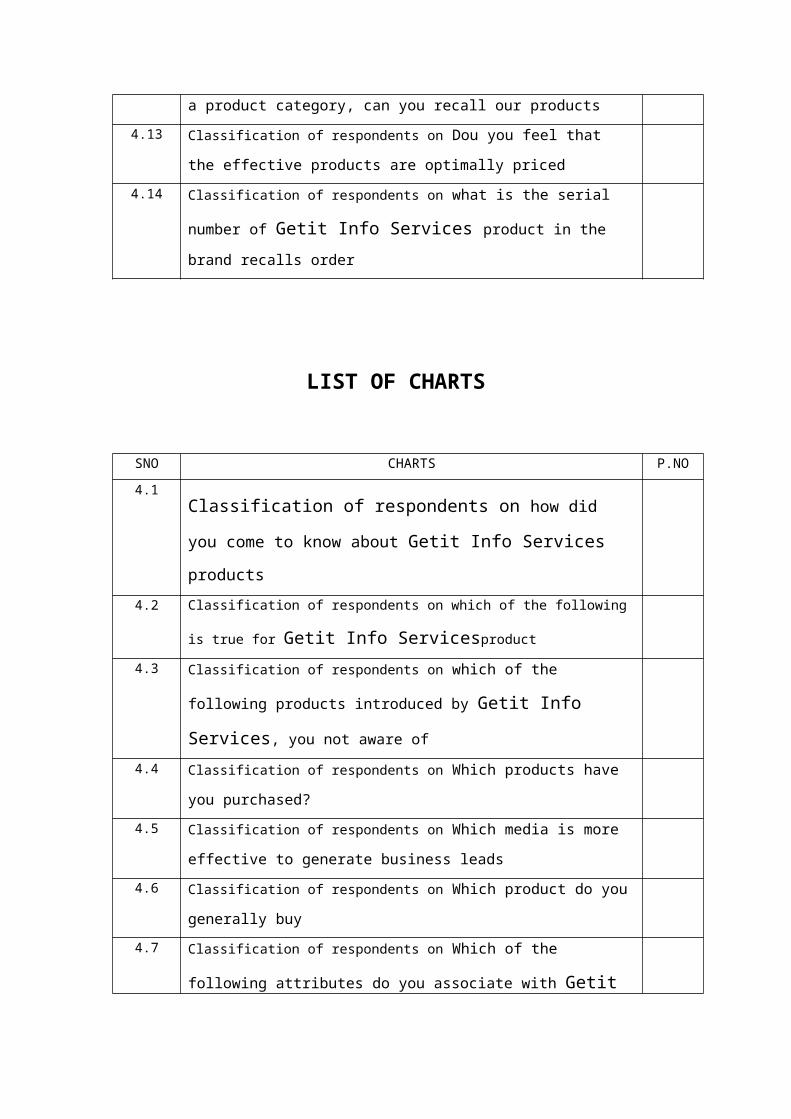
4.13 Classification of respondents on Dou you feel that the effective products are
optimally priced
4.14 Classification of respondents on what is the serial number of Getit Info
Services product in the brand recalls order
LIST OF CHARTS
SNO CHARTS P.NO
4.1Classification of respondents on how did you come to know about
Getit Info Services products
4.2 Classification of respondents on which of the following is true for Getit Info
Servicesproduct
4.3 Classification of respondents on which of the following products introduced by
Getit Info Services, you not aware of
4.4 Classification of respondents on Which products have you purchased?
4.5 Classification of respondents on Which media is more effective to generate
business leads
4.6 Classification of respondents on Which product do you generally buy
4.7 Classification of respondents on Which of the following attributes do you
associate with Getit Info Services
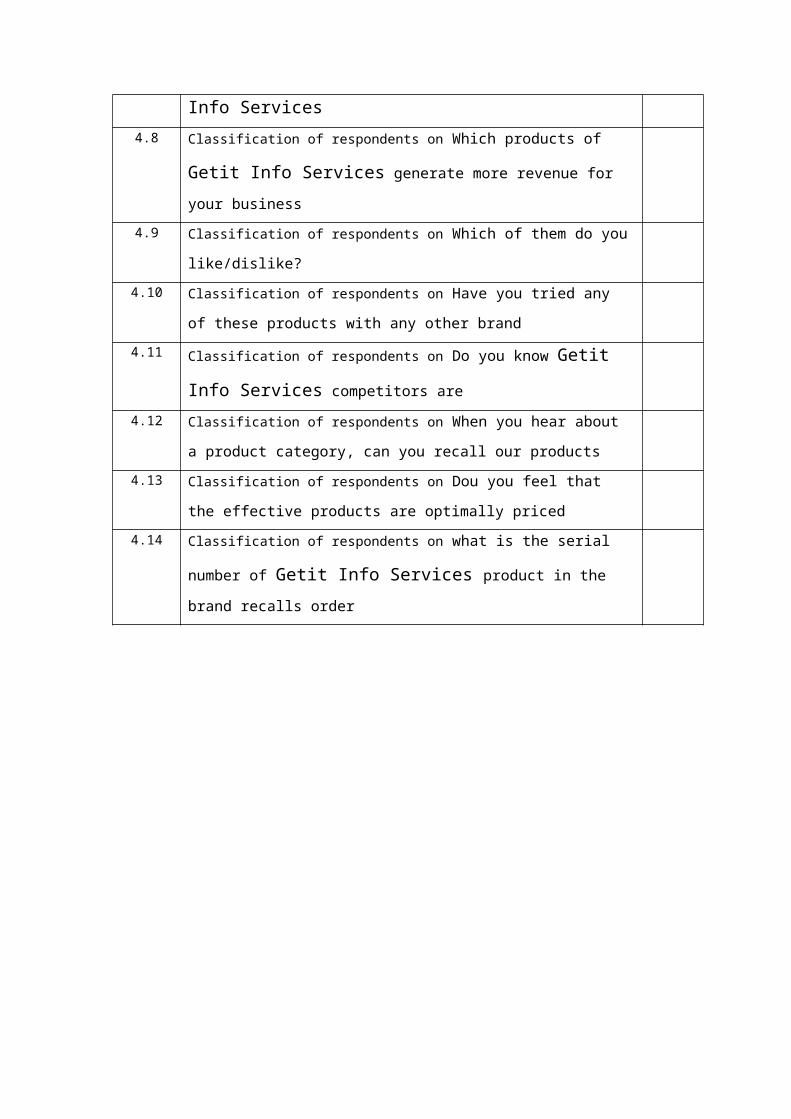
4.8 Classification of respondents on Which products of Getit Info Services
generate more revenue for your business
4.9 Classification of respondents on Which of them do you like/dislike?
4.10 Classification of respondents on Have you tried any of these products with any
other brand
4.11 Classification of respondents on Do you know Getit Info Services
competitors are
4.12 Classification of respondents on When you hear about a product category, can
you recall our products
4.13 Classification of respondents on Dou you feel that the effective products are
optimally priced
4.14 Classification of respondents on what is the serial number of Getit Info
Services product in the brand recalls order
CHAPTER-1INTRODUCTION
1.1 INTRODUCTION TO THE STUDY
Marketing:
According to Kotler “Marketing is a social and managerial process by which individual and
groups obtain what they need and want through creating, offering and exchanging products of
value with others” The American Marketing Association (AMA) defines marketing as the
performance of business activitiesthat direct the flow of goods and services from producer to
consumer or user”
Brand awareness:
The ultimate goal of most businesses is to increase sales and income. Ideally, you want
toattract new customers to your products and encourage repeat purchases. Brand
awarenessrefers to how aware customers and potential customers are of your business and its
products.Within a week after its introduction, surveys found that more than 90% of US
consumershad heard about the iPhone as a result of advertising and news reports. This is
exceptionallyhigh brand awareness Ultimately, achieving successful brand awareness means
that yourbrand is well known and is easily recognizable. Brand awareness is crucial to
differentiatingyour product from other similar products and competitors.What is Brand
Awareness?The ultimate goal of most businesses is to increase sales and income. Ideally, you
want toattract new customers to your products and encourage repeat purchases. Brand
awarenessrefers to how aware customers and potential customers are of your business and its
products.Within a week after its introduction, surveys found that more than 90% of US
consumershad heard abouthe iPhone as a result of advertising and news reports. This is
exceptionallyhigh brand awareness. Ultimately, achieving successful brand awareness means
that yourbrand is well known and is easily recognizable. Brand awareness is crucial to
differentiating your product from other similar products and competitors.
INDUSTRY PROFILE
ADVERTISING MEDIA
The media industry can be categorized into the following categories; filmed entertainment,
television, music, radio and print. As implied, many aspire to join this industry due to the
high visibility and glamour associated with many of the top jobs. That said, the opportunities
are many and varied, and not all focused on celebrity status, such as in the areas of mass
communication, content development, animation, production and event management.
Performance
The industry has suffered a great deal during the economic recession, with U.S. top media
companies managing flat revenues in 2008 and a 5% contraction in 2009 according to Ad
Age reports. Many players, dominated by those in the print industry, have plunged into
bankruptcy, primarily due to the shrinking revenues coupled with massive debt loads taken
on in the market boom. Though certain digital media firms such as Google fared well
(revenues up 23%), others such as Microsoft witnessed a flat top line.
Ad spending in the U.S. was also severely depressed, falling 4% in 2008 a further 14% in the
H1 2009, according to WPP's TNS Media Intelligence. Despite this sorry state, newspapers,
magazines and cable systems continue to operate and media companies have been trying to
slash their crippling debt. Analysts believe the worst is over, and globally, the industry is
poised to emerge with less debt and stronger balance sheets in the coming 6 months.
Growth Potential
The Indian entertainment and media sector is one of the fastest growing sectors in the
economy, and its segments have all witnessed tremendous double digit growth in the last few
years. The past 2 years were tumultuous, especially due to poor liquidity in the system for
financing big projects for the big and small screen. However, with global indicators
realigning themselves once again, the Indian media and advertising industry too looks poised
to resume where it left off pre 1H 2008.
According to a 2009 report jointly published by the Federation of Indian Chambers of
Commerce and Industry (FICCI) and KPMG, the media and entertainment industry in India is
likely to grow at ~13 % CAGR over 2009-13, touching US$ 20 billion by 2013.
The key reasons favoring the rapid growth of the Indian entertainment and media sector are
the demographic and economic factors buoying India’s development; with a majority of the
population below the age of 35, and increasing disposable income in Indian households, the

average spend on media and entertainment is likely to grow, according to the 2009 edition of
PricewaterhouseCoopers report. In addition, advances in technology, increasing penetration
of communication mediums, policy initiatives of the Indian government to increase FDI and
the increased participation of private media companies have been the other key drivers of the
industry.
As per current estimates the television industry is projected to grow by 22%, filmed
entertainment by 16%, radio by 18% and the Indian advertising industry 61% over the next 3
years. Given the lucrative prospects of this segment, international media giants are all vying
for a stake in the segment. In addition to domestic growth, the growing popularity of Indian
content in the world market and South Asia in particular, has encouraged Indian
entertainment industry players to also venture abroad to tap this booming segment; according
to a report by CII-AT Kearney, the share of international markets in total box office
collections is estimated to increase from 8% in 2006 to 15% in 2010.
Future Prospects
The greatest opportunities naturally lie in those sub-areas that are expected to grow the fastest
over the next few years, namely, in the development of digital distribution platforms for TV
such as DTH, digital music platforms, digital media advertising (internet, mobile and digital
signage) and global cinema content.
For new graduates, the industry poses great prospects for achievement given its growth
trajectory. On the flip side, it is extremely fast-paced and stressful as well. Additionally,
being creative on a tight schedule can be emotionally draining, especially because most of the
work includes long hours and meeting stringent deadlines.
COMPANY PROFILE
INTRODUCTION TO GETIT INFO SERVICES
GETIT Profile
The company
Established in 1986, GETIT Infoservices (P) Ltd pioneered Yellow Pages and later free-
classifieds in India. GETIT focuses on bringing buyers and sellers together through
information products and services. To users it offers high quality local search and classified
services that can be accessed through any media – online, voice, mobile & print. Alongside it
helps local businesses grow by bringing quality customers and enquiries. GETIT facilitates
local businesses to be present across all media and new social platforms and benefit from the
same in a transparent and measurable manner while taking away their pain and pressure of
keeping up with changing media and trends.
Focus
GETIT specialises in Directional media – products consumers turn to when they are ready to
buy and are looking for sellers. Consumers can turn to GETIT and access its quality
information irrespective of the medium they choose – voice services, online, mobile or print.
GETIT is now focussed on convergence of media in the local search and classifieds space.
With increasing usage of mobile phones & tablet devices the way consumers access
information and the way they shop/source is undergoing a huge change. GETIT is focussed
on developing solutions which best address the changing needs and desires of today’s
connected consumers and local businesses.
getitFREEADS is a classified ads bazaar and has served over 1,00,00,000 customers over the
last 14 years through its various print editions. It is now also available in a unique and
innovative phone service as well as online. Consumers can buy or sell anything through
getitFREEADS, without paying to advertise. Likewise, consumers desirous of purchasing
pre-owned goods, properties or finding jobs, can do so effortlessly, just by calling 4444-4444.
Background
Founded in 1986, GETIT is credited with pioneering and popularizing the concept of Yellow
Pages directories in India. It introduced and refined the concept over the past 3 decades and
leads the innovation in the Indian market – introduction of B2B & B2C yellow pages,
Findex(TM) – an international award winning categorization and cross referencing
innovation, re-scoped directories in major metros, TrustMe verification and certification
services and many more.
GETIT currently operates in 32 cities – where it brings out various print editions. It has to its
credit Over 25 years of service to Indian small businesses and consumers
Awards
For two consecutive years - 2002 and 2003- GETIT was the winner of the Industry
Excellence Award presented by YPIMA, USA. In 1997, GETIT, then known as M&N
Publications, was awarded the Jamnalal Bajaj Ethical Business Practice award, for fair
business practices.
Investors
GETIT investors include Malaysia based ASTRO group – a cross media group with presence
in DTH TV services, commercial radio and TV programming and HelionVenture Partners - a
leading VC fund.
Products
1. Local Search products
callGETIT: callGETITprovides 24x7 right answers and gives users access to any local
information on businesses across leading cities in multiple categories. It provides relevant
and updated search results
GETIT brings out its B2B and B2C yellow pages, aimed at the industrial and the consumer
market respectively as well as BizList which provides an alphabetical search for companies
and brands and thus is one common print directory for all telcos. www.getit.in is GETIT’s
online local search portal.
2. Classifieds products
getitFREEADS: Buy. Sell. Anything! : getitFREEADS™ makes buying and selling simple.
It is simple to use, quick with results, convenient and free of cost. Consumers can place free
ads in various categories like household goods, jobs, vehicles, properties, Education/Tuition,
Business/Service, Computers/mobile, Health/Holiday, personal etc. making buying and
selling easy and effective. getitFREEADS™ is available online at www.freeads.in
Both callGETIT™ and services can be accessed by consumers on dialing # 444 4444 from
anywhere across India. GETIT has thus created India’s largest
Bazaar on phone
FreeAds is available in print in 4 cities
GETIT also has various products for SMEs and Advertisers
More information is available on www.getitgroup.in
About us
Get what you want?
Looking for dealers for household appliances, hobby classes, furniture or maybe dealers for
industrial generators or anything you wish?
Your search ends here!!
Want to increase the number of clients for your business? Require an advertising medium
which will give you the best possible Return on Investment (ROI)? Need to arrange a party or
construct a building? So many requirements and only one answer – www.getit.in.
Getit.in?
www.getit.in provides an excellent local searching platform for businesses and users to meet
at a common junction. An ideal platform for the product & service providers in more than 30
cities in India.
Easy to use functionality, very simple to register and scores of options to advertise. An
advertiser pays only per click that is received on the ad! Pay only when the ad yields tangible
results and also get a performance report card in real time! Any user spends the minimum
amount of time on the search. Sounds good? Well, we are not done as yet. Getit™ is
developing continuously, for you.
Who we are?
Getit is the leading information service provider in India. We have built a strong national
infrastructure and professional team that delivers a high quality of service, offering value for
money. With a strong network of over 30 offices around the country & employee strength of
over 1000, what else can anyone expect?
Information, anytime anywhere….
The information is available across online, voice, mobile & print.
Try us on the :
Web: www.getit.in
Mobile: m.getit.in
Voice Getit™ Now, the 24 hrtele-service at 444 44444
SMS 5676722
Print Getit™ Yellow Pages, Bizlist
And, we can promise you that you will get what you are searching for.
1.2 OBJECTIVES OF THE STUDY
PRIMARY OBJECTIVES
A study on brand awareness of “Getit Info Services” among small & medium scale enterprises (SME’s), Chennai
SECONDARY OBJECTIVES
1. To have a clear understanding of the local search engine industry and Getit Info Services
position in market
2. To increase sales of Getit Info Services products-services
3. To retain other brand existing customers and convert new customers for Getit Info Services
4. To conduct an exhaustive market research on introduction of new products
5. To check awareness, price acceptance, innovation excitement among consumers
6. To check the awareness as well as level of satisfaction of customers & the company with
regards introduction of new products-services
1.3 NEED FOR THE STUDY
Brand awareness, as one of the fundamental dimensions of brand equity, is often considered
to be a prerequisite of consumers’ buying decision, as it represents the main factor for
including a brand in the consideration set. Brand awareness can also influence consumers’
perceived risk assessment and their confidence in the purchase decision, due to familiarity
with the brand and its characteristics. On the other hand, brand awareness can be depicted
into at least two facets – unaided (brand recall) and aided (brand recognition) – each of the
two facets having its more or less effective influence on buying decision and perceived risk
assessment.
Today investors are facing a growing range of choice for online trading of stocks. They are
making their choice on the basis of their perceptions of brand, quality service and value.
Every company has to adopt strategies to keep its brand in consumer’s memory. Strong brand
awareness means easy acceptance of new products. An organization has to measure the level
of awareness of the potential customers and has to adopt different strategies to enhance the
awareness level and to identify the appropriate promotional tool. Brand awareness is asset
which brand managers create and enhance to build brand equity. It is related to the nature and
features of product. It leads to brand strength which is constituted by measuring the variable
like leadership, stability, Market, geographic, trend, support and protection etc…
Creating brand awareness with the use of advertising, promotion event management etc. A
different brand has different kind of awareness which retains recognition.
Brand awareness satisfies a need of the consumer. A consumer as aims, ambitions,
motivation drives and desire. Consumer feels more powerful when he uses the brand.
Satisfactions or preference for a brand shows how loyal the consumer is likely to be brand.
In today’s competitive business scenario where every companies product is competing with
each other retaining loyal customer is an essence for which increasing the level of brand
awareness is very vital.
1.4 SCOPE OF THE STUDY
The study is an analysis of brand awareness of different products/services of Getit Info
Services with special regard to directional media.
The study is carried out by interviewing 200 existing clients. It has been deliberately decoded
to conduct the survey among this existing client group because they are the people who
generally look for expansion for their better visibility and brand image in the future.
1. The study has only made a humble attempt of evaluation of customer feedbackand
brand awareness based on different criteria.
2. The brand awareness towards directional media services is carried out in
mylaporeoffice of Chennai.
3. The survey conducted will provide the details about the brand awareness
levelsresponding to the products and services provided by Getit Info Services
1.5 LIMITATIONS OF THE STUDY
1. The time taken to interview each consumer was more as every consumer had to be
first explained everything and had to be dealt with patience.
2. The consumer’s opinion at times was very biased due to existence of Getit info
services in the market since many years.
3. The study covers the Chennai region only and due to the limited sample size, the facts
relabeled in the study may not generalize.
4. While calculating the percentages, approximations are made to the nearest figures, for
convenience in understanding.
5. The analysis is based on customer’s opinion at the time of survey. Suggestions and
conclusions are based on the limited data.
6. The companies selected for survey are heterogeneous, hence has variation in results.

CHAPTER-2REVIEW OF LITERATURE
2.1 Lance Leuthesser, et al (1995) writes that "brand equity represents the value (to a
consumer) of a product, above that which would result for an otherwise identical product
without the brand's name. In other words, brand equity represents the degree to which a
brand's name alone contributes value to the offering (again, from the perspective of the
consumer)."
2.2 The Marketing Science Institute (1988) defines brand equity as, "The set of
associations and behaviors on the part of the brand's customers, channel members, and parent
corporations that permit the brand to earn greater volume or greater margins than it could
without the brand name and that gives the brand a strong, sustainable, and differentiated
advantage over competitors.
2.3 Kotler (2000) writes that “The central concern of brand building literature experienced a
dramatic shift in the last decade. Branding and the role of brands, as traditionally understood,
were subject to constant review and redefinition.” A traditional definition of a brand was:
“the name, associated with one or more items in the product line, which is used to identify the
source of character of the item”
2.4 The American Marketing Association (AMA) definition of a brand is “a name, term,
sign, symbol, or design, or a combination of them, intended to identify the goods and services
of one seller or group of sellers and to differentiate them from those of competitors”.
2.5 Keller (2003) says, “Technically speaking, then, whenever a marketer creates a new
name, logo, or symbol for a new product, he or she has created a brand”. He recognizes,
however, that brands today are much more than that. As can be seen, according to these
definitions brands had a simple and clear function as identifiers.
2.6 Urde Brand Hexagon (1999) presents Brand Orientation as another brand building
model that focuses on brands as strategic resources. “Brand Orientation is an approach in
which the processes of the organization revolve around the creation, development, and
protection of brand identity in an ongoing interaction with target customers with the aim of
achieving lasting competitive advantages in the form of brands”. Brand orientation focuses
on developing brands in a more active and deliberate manner, starting with the brand identity
as a strategic platform. It can be said that as a consequence of this orientation the brand
becomes an “unconditional response to customer needs and wants”
2.7 Aaker and Joachimsthaler (2000) leave behind the traditional branding model and
introduce the brand leadership model, “which emphasizes strategy as well as tactics” In this
model, the brand management process acquires different characteristics: a strategic and
visionary perspective; the brand manager is higher in the organization, has a longer time job
horizon, and is a strategist as well as communications team leader; building brand equities
and developing brand equity measures is the objective; and, brand structures are complex,
as the focus is on multiple brands, multiple products, and multiple markets. In short, brand
identity and creating brand value become the drivers of strategy.
CHAPTER-3RESEARCH METHODOLOGY
3
Research methodology is a way to solve the problem systematically. It may be
understood as a science of studying how research is done scientifically. It consists of different

steps that are generally adopted by a researcher to study his research problem. It includes
research design, data collecting, research instrument, sampling plan, data analysis.
RESEARCH DESIGN:
“A research design is the arrangement of condition for collections and analysis of data
in a manner that aim to combine relevance to research purpose with economy in procure”.
Descriptive research design has been used for the study.
DESCRIPTIVE RESEARCH DESIGN:
Descriptive research study is concerned with describing the characteristic of particular
individuals or of a group. The main objective of descriptive research is to describe the
proportion in a specified population who behave in a certain way.
DATA COLLECTION:
A researcher has several ways of collecting the appropriate data, which differ
considerably in the context of money; cost, time, and other resources. Data is collected
through primary source as well as secondary source.
PRIMARY DATA: Primary data are original in character and are generated in large
number of survey conducted by government, and by some individuals, institutions and
research bodies. For the study, the method used to collect primary data is
questionnaire, Interview scheduling.
SECONDARY DATA: Secondary data means already available data. For the study,
the data is collected from company records, websites, and books.
RESEARCH INSTRUMENT:
The research instrument adopted in this study is questionnaire, which was
helpful in deriving the response of the clients in Chennai region. Questionnaire is the list of
questions to be asked to the respondents. It also contains suitable space where the answers
can be recorded.
SAMPLING PLAN:-
SAMPLE METHOD: The method used to collect the sample for the study was
convenience sampling. When the population elements are related for inclusion in the sample
based on ease of access, it is called convenient sampling.
SAMPLE UNIT: Clients in Chennai region.
SAMPLE SIZE: The size of the sample was 200 clients.
DATA ANALYSIS: The data after collection has to be processed and analyzed in
accordance with the outline laid down for the purpose at the time of developing research plan.
STATISTICAL TOOLS USED FOR ANALYSIS OF DATA:-
1. PERCENTAGE ANALYSIS: Percentage analysis shows entire population in
terms of percentage. It reveals the number of people belonging in a category or the
number of people preferring a particular thing, etc in terms of percentages. The
percentage analysis is obtained when 100 multiply ratios. Therefore, one figure is
taken as base and it is represented by 100.
PERCENTAGE = NUMBER OF RESPONDENTS X 100
TOTAL RESPONDENTS
2. KARL PEARSON'S
CORRELATION COEFFICIENT (r):---
In statistics, the Pearson product-moment correlation coefficient (r) is a common measure of the correlation between two variables X and Y. When measured in a population the Pearson Product Moment correlation is designated by the Greek letter rho (?). When computed in a sample, it is designated by the letter "r" and is sometimes called "Pearson's r." Pearson's correlation reflects the degree of linear relationship between two variables. It ranges from +1 to -1. A correlation of +1 means that there is a perfect positive linear relationship between variables. A correlation of -1 means that there is a perfect negative linear relationship between variables. A correlation of 0 means there is no linear relationship between the two variables. Correlations are rarely if ever 0, 1, or -1. If you get a certain outcome it could indicate whether correlations were negative or positive.
Mathematical Formula:--
The quantity r, called the linear correlation coefficient, measures the strength and the direction of a linear relationship between two variables. The linear correlation coefficient is sometimes referred to as the Pearson product moment correlation coefficient in honor of its developer Karl Pearson.
The mathematical formula for computing r is:
3. MANN-WHITNEY U-TEST
AKA MANN–WHITNEY–WILCOXON (MWW)
OR WILCOXON RANK-SUM TEST
Non-parametric tests are basically used in order to overcome the underlying assumption of
normality in parametric tests. Quite general assumptions regarding the population are used in
these tests. A case in point is the Mann-Whitney U-test (Also known as the Mann-Whitney-
Wilcoxon (MWW) or Wilcoxon rank-sum test).
The Mann-Whitney U-test is used to test whether two independent samples of observations
are drawn from the same or identical distributions. An advantage with this test is that the two
samples under consideration may not necessarily have the same number of observations.
This test is based on the idea that the particular pattern exhibited when ‘m’ number of X
random variables and ‘n’ number of Y random variables are arranged together in increasing
order of magnitude provides information about the relationship between their parent
populations.
The Mann-Whitney test criterion is based on the magnitude of the Y’s in relation to the X’s,
i.e. the position of Y’s in the combined ordered sequence. A sample pattern of arrangement
where most of the Y’s are greater than most of the X’s or vice versa would be evidence
against random mixing. This would tend to discredit the null hypothesis of identical
distribution.

CHAPTER – 4 DATA ANALYSIS & INTERPRETATION

TABLE 4.1
Table showing that how did you come to know about Getit Info Services products
S.no Media Number of responders Percentage of respondents
A Television 21 10
B Marketer’s Suggestion
39 19
C Radio 17 9
D Print 82 41
E Online 41 21
Total 200 100
11%
20%
9%41%
21%
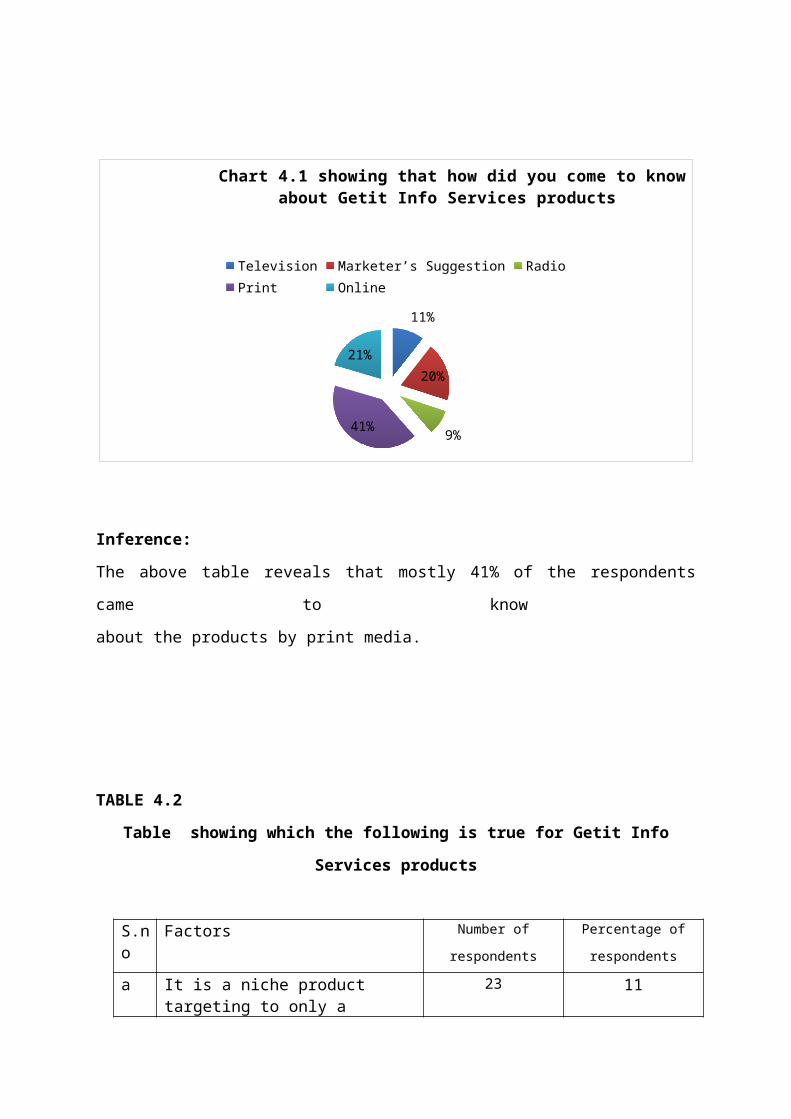
Chart 4.1 showing that how did you come to know about Getit Info Services products
Television Marketer’s Suggestion RadioPrint Online
Inference:
The above table reveals that mostly 41% of the respondents came to know
about the products by print media.

TABLE 4.2
Table showing which the following is true for Getit Info Services products
S.no Factors Number of respondents Percentage of
respondents
a It is a niche product targeting to only a particular segment 23
11
b It is a commodity product37
9
c It has a differentiation strategy for different segments 126
63
d None 14 7
Total200 100
12%
19%
63%
7%
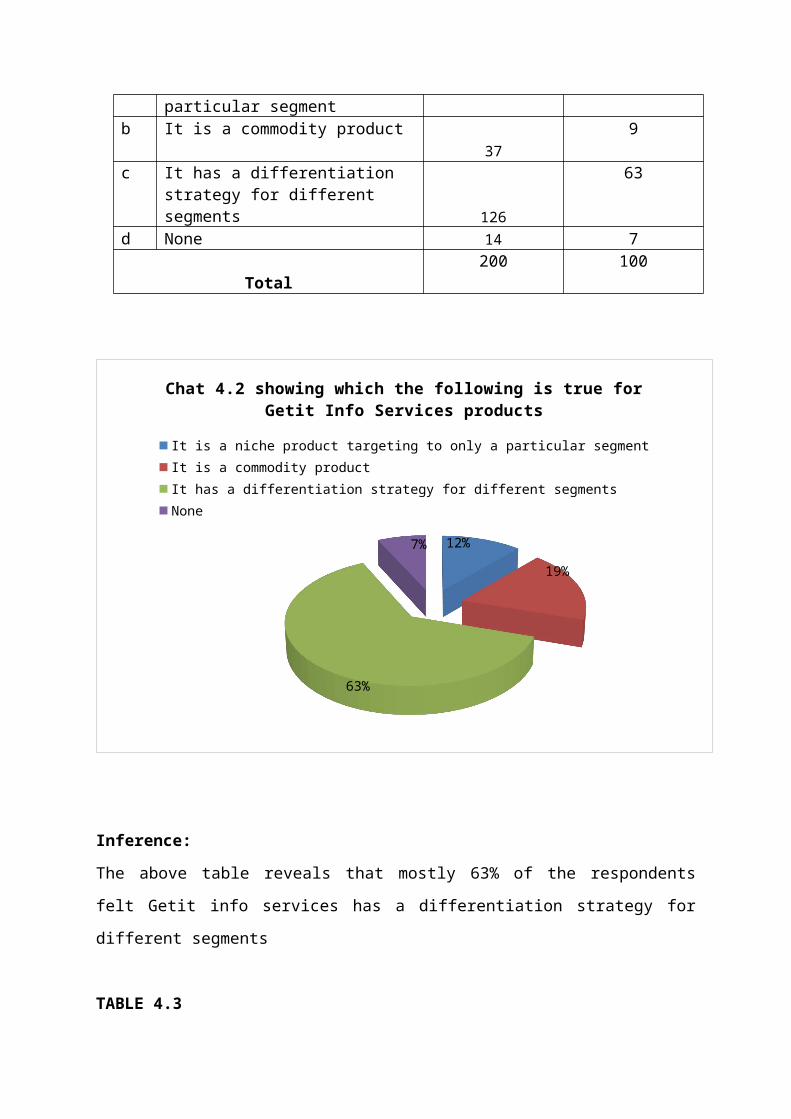
Chat 4.2 showing which the following is true for Getit Info Services products
It is a niche product targeting to only a particular segment
It is a commodity product
It has a differentiation strategy for different segments
None
Inference:
The above table reveals that mostly 63% of the respondents felt Getit info services has a
differentiation strategy for different segments
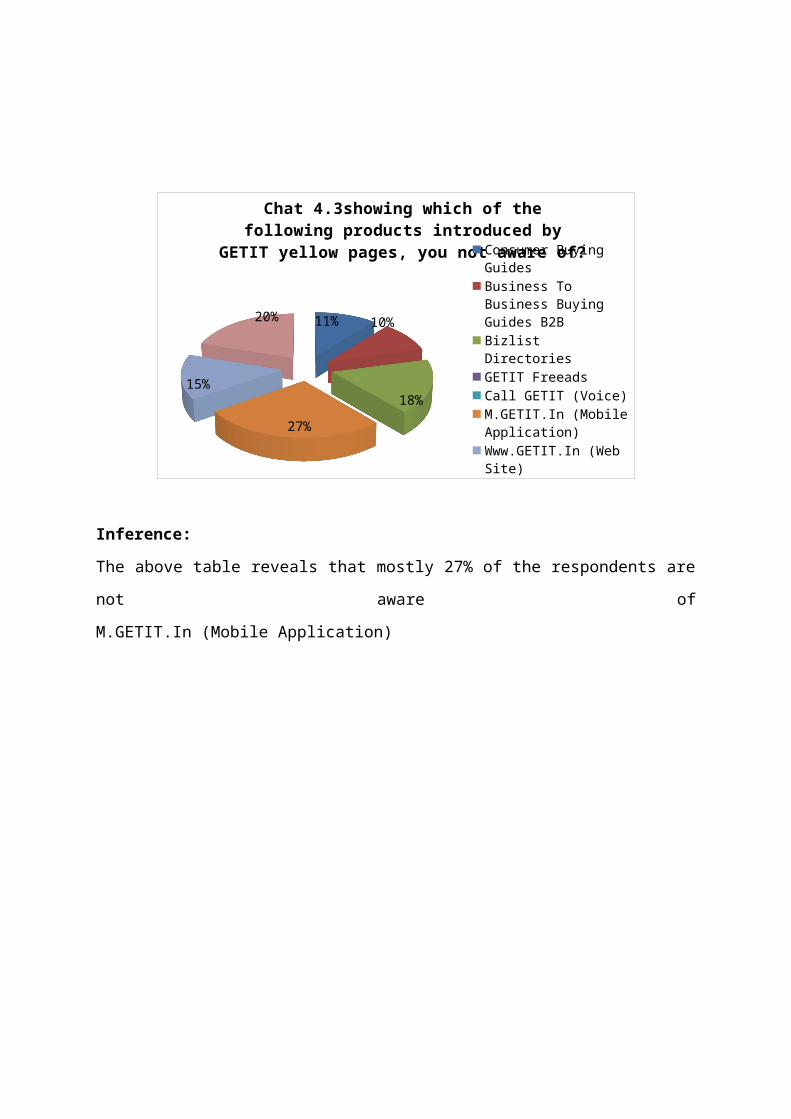
TABLE 4.3
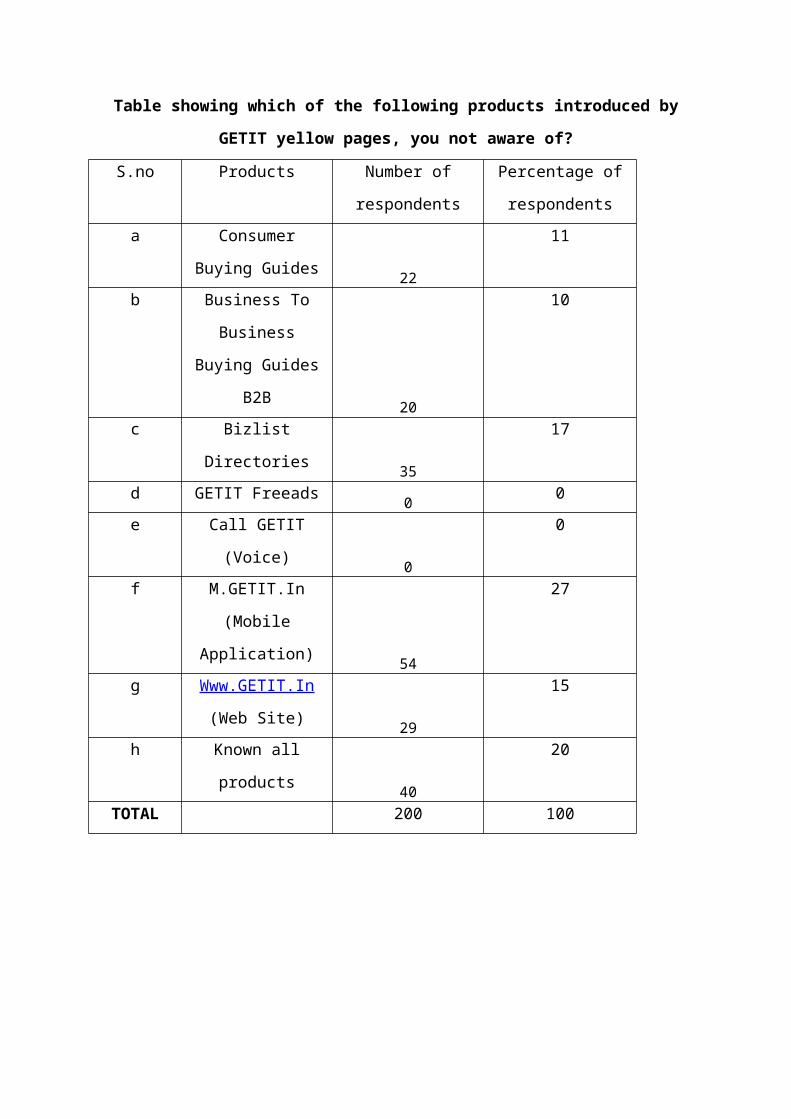
Table showing which of the following products introduced by GETIT yellow pages, you
not aware of?
S.no Products Number of
respondents
Percentage of
respondents
a Consumer Buying
Guides 22
11
b Business To
Business Buying
Guides B2B 20
10
c Bizlist Directories 35 17
d GETIT Freeads 0 0
e Call GETIT (Voice) 0 0
f M.GETIT.In
(Mobile
Application) 54
27
g Www.GETIT.In
(Web Site) 29
15
h Known all products 40 20
TOTAL 200 100

11% 10%
18%
27%
14%
20%
Chat 4.3showing which of the following products in-troduced by GETIT yellow pages, you not aware of?
Consumer Buying Guides
Business To Business Buying Guides B2B
Bizlist Directories
GETIT Freeads
Call GETIT (Voice)
M.GETIT.In (Mobile Applica-tion)
Www.GETIT.In (Web Site)
Known all products
Inference:
The above table reveals that mostly 27% of the respondents are not aware of
M.GETIT.In (Mobile Application)
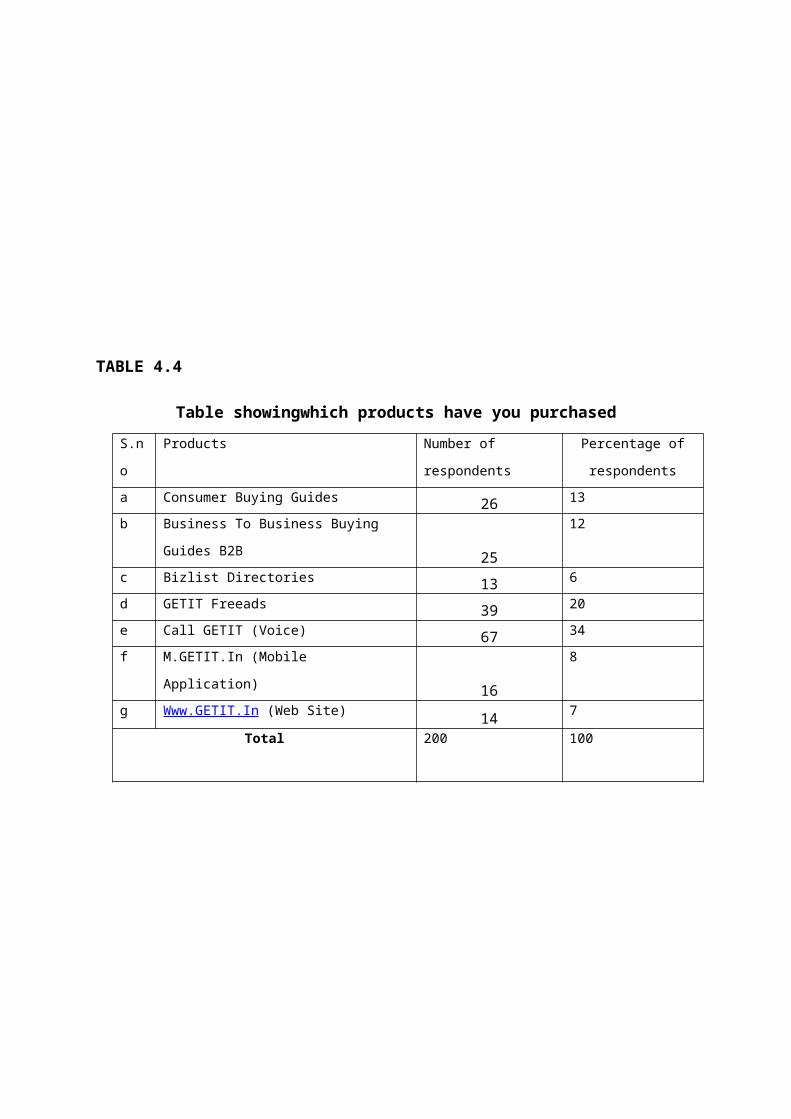
TABLE 4.4
Table showingwhich products have you purchased
S.no Products Number of respondents Percentage of
respondents
a Consumer Buying Guides 26 13
b Business To Business Buying Guides B2B 25 12
c Bizlist Directories 13 6
d GETIT Freeads 39 20
e Call GETIT (Voice) 67 34
f M.GETIT.In (Mobile Application) 16 8
g Www.GETIT.In (Web Site) 14 7
Total 200 100
13%13%
7%
20%
34%
8% 7%
Chart 4.4 showing which products have you purchased
Consumer Buying GuidesBusiness To Business Buy-ing Guides B2BBizlist DirectoriesGETIT FreeadsCall GETIT (Voice)M.GETIT.In (Mobile Ap-plication)Www.GETIT.In (Web Site)
Inference:
The above table reveals that mostly 34% of the respondents Call GETIT (Voice)
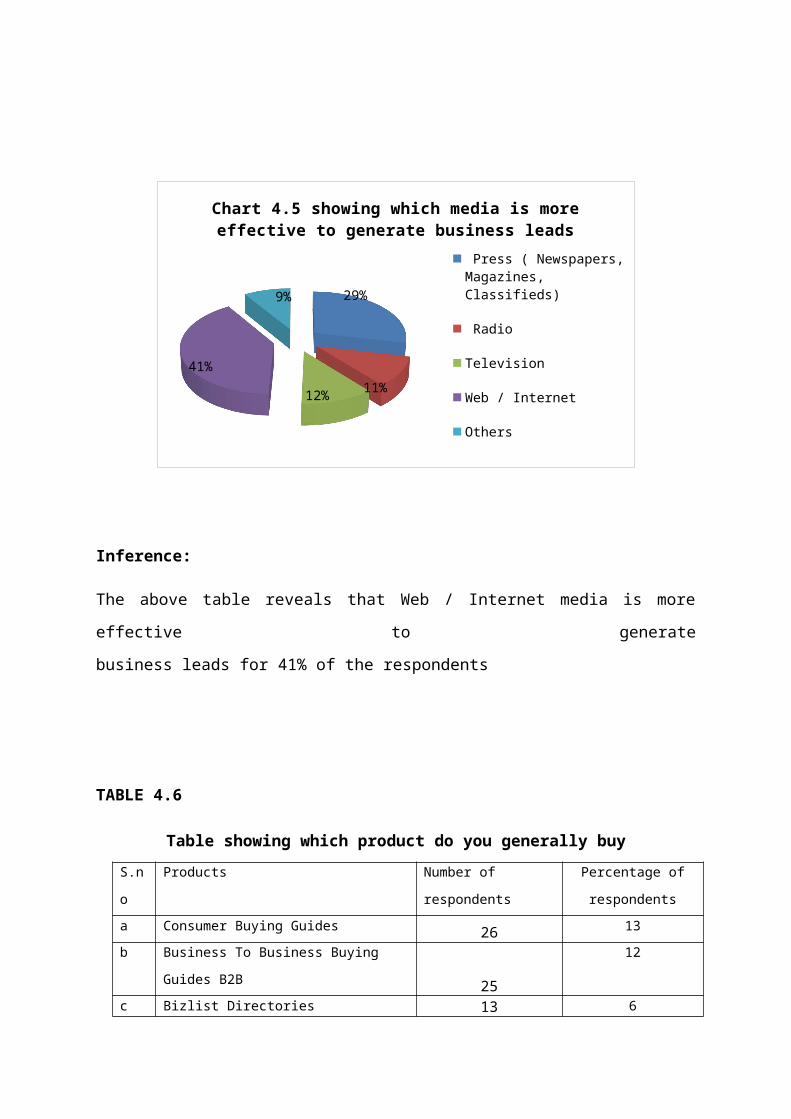
TABLE 4.5
Table showing which media is more effective to generate business leads

S.no Media Number of
respondents
Percentage of
respondents
a Press (Newspapers, Magazines, Classifieds) 57
28
b Radio 21 12
c Television 23 12
d Web / Internet 81 41
e Others 18 9
Total 200 100
28%
11%12%
41%
9%
Chart 4.5 showing which media is more effective to generate business leads
Press ( Newspapers, Mag-azines, Classifieds)
Radio
Television
Web / Internet
Others
Inference:
The above table reveals that Web / Internet media is more effective to generate
business leads for 41% of the respondents
TABLE 4.6
Table showing which product do you generally buy
S.no Products Number of respondents Percentage of

respondents
a Consumer Buying Guides 26 13
b Business To Business Buying Guides B2B 25 12
c Bizlist Directories 13 6
d GETIT Freeads 39 20
e Call GETIT (Voice) 67 34
f M.GETIT.In (Mobile Application) 16 8
g Www.GETIT.In (Web Site) 14 7
Total 200 100
13%
13%
7%
20%
34%
8%7%
Chart 4.6showing which product do you generally buy
Consumer Buying GuidesBusiness To Business Buying Guides B2BBizlist DirectoriesGETIT FreeadsCall GETIT (Voice)M.GETIT.In (Mobile Application)Www.GETIT.In (Web Site)
Inference:
The above table reveals that mostly 34% of the respondents generally buy
Call GETIT (Voice) followed by20% of the respondents buy GETIT Freeads.
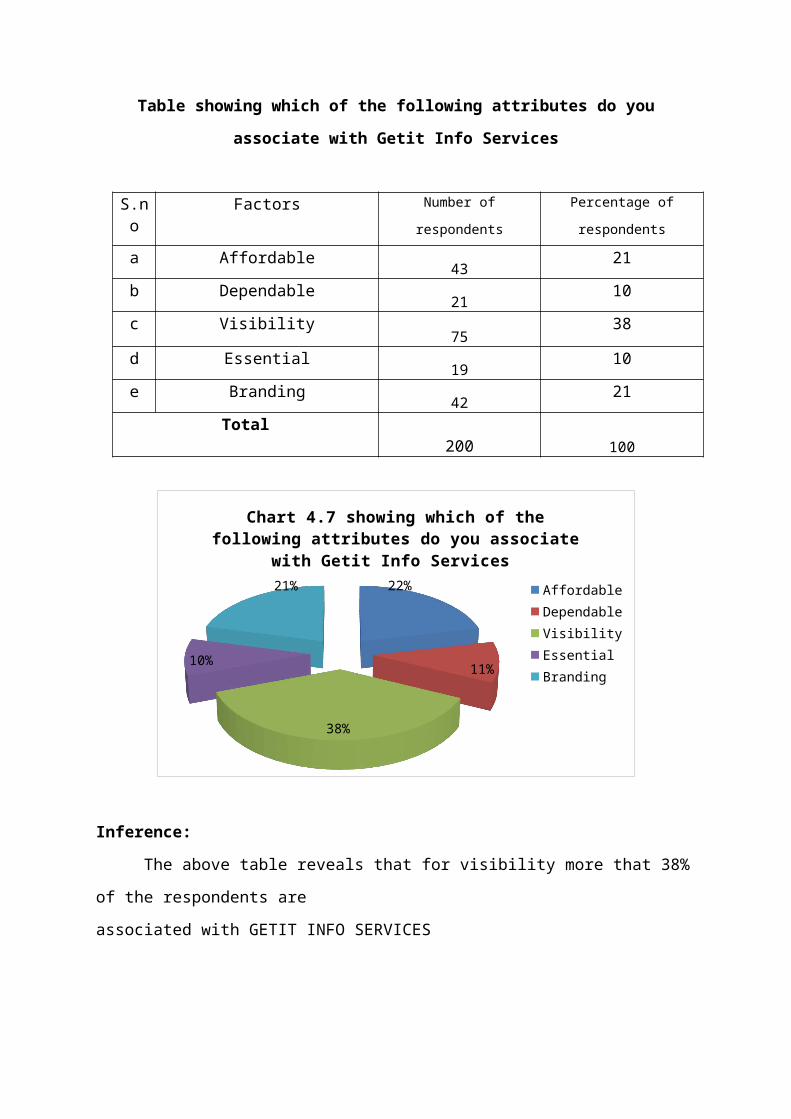
TABLE 4.7
Table showing which of the following attributes do you associate with Getit Info
Services
S.no Factors Number of respondents Percentage of respondents

a Affordable43
21
b Dependable21
10
c Visibility75
38
d Essential19
10
e Branding42
21
Total200 100
22%
11%
38%
10%
21%
Chart 4.7 showing which of the following attributes do you associate with Getit Info Services
AffordableDependableVisibilityEssentialBranding
Inference:
The above table reveals that for visibility more that 38% of the respondents are
associated with GETIT INFO SERVICES
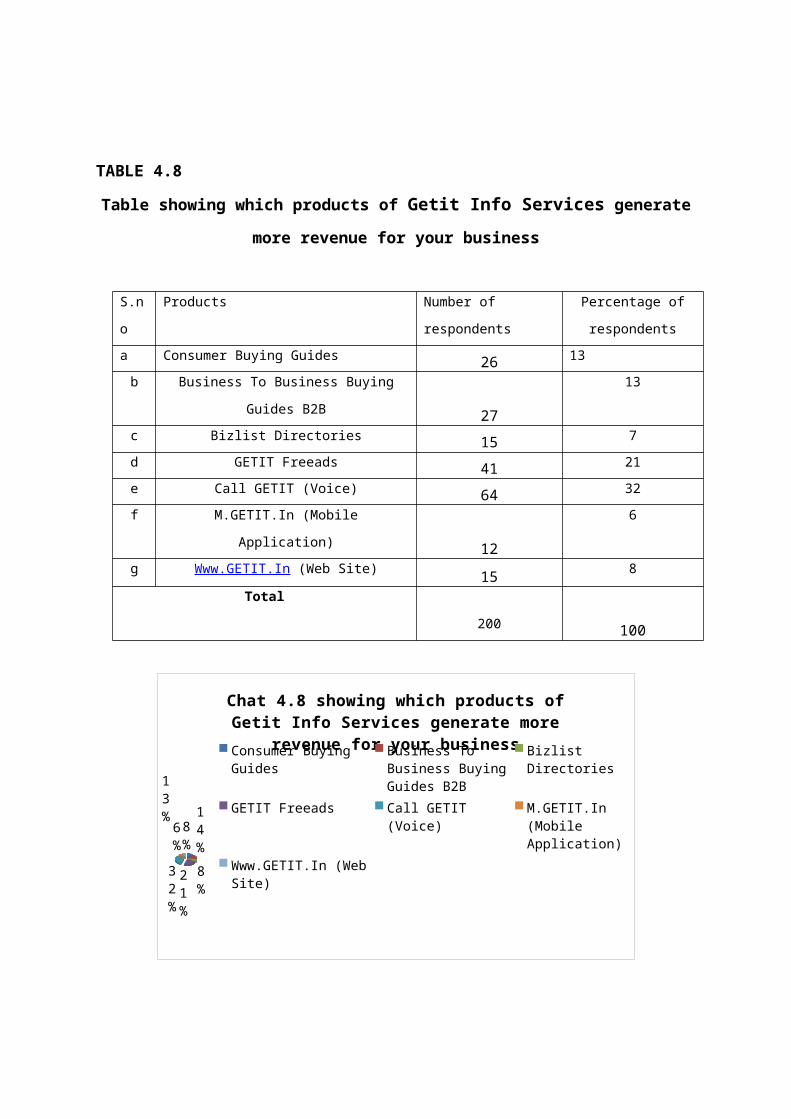
TABLE 4.8
Table showing which products of Getit Info Services generate more revenue for your
business
S.no Products Number of respondents Percentage of
respondents
a Consumer Buying Guides 26 13

b Business To Business Buying Guides B2B 27 13
c Bizlist Directories 15 7
d GETIT Freeads 41 21
e Call GETIT (Voice) 64 32
f M.GETIT.In (Mobile Application) 12 6
g Www.GETIT.In (Web Site) 15 8
Total
200 100
13%14%
8%
21%
32%
6% 8%
Chat 4.8 showing which products of Getit Info Services generate more revenue for your business
Consumer Buying GuidesBusiness To Business Buy-ing Guides B2BBizlist DirectoriesGETIT FreeadsCall GETIT (Voice)M.GETIT.In (Mobile Ap-plication)Www.GETIT.In (Web Site)
Inference:
The above table reveals that Call GETIT (Voice) product generating more
revenue for 32% of respondents
TABLE 4.9
Table showingwhich of them you like/dislike
S.no Products Like Dislike
a Consumer Buying Guides 22 25b Business To Business Buying Guides
B2B 24 30c Bizlist Directories 26 15d GETIT Freeads 40 0e Call GETIT (Voice) 55 0f M.GETIT.In (Mobile Application) 18 55
g Www.GETIT.In (Web Site) 15 0Total
200 125
0204060
Chart 4.9 showing which of them you like/dislike
lIKEDISLIKE
Products
Popu
lati
on s
ize
Inference:
The above table reveals that mostly27% of the respondents like Call GETIT
(Voice) &44% of the respondents dis-like M.GETIT.In (Mobile Application)
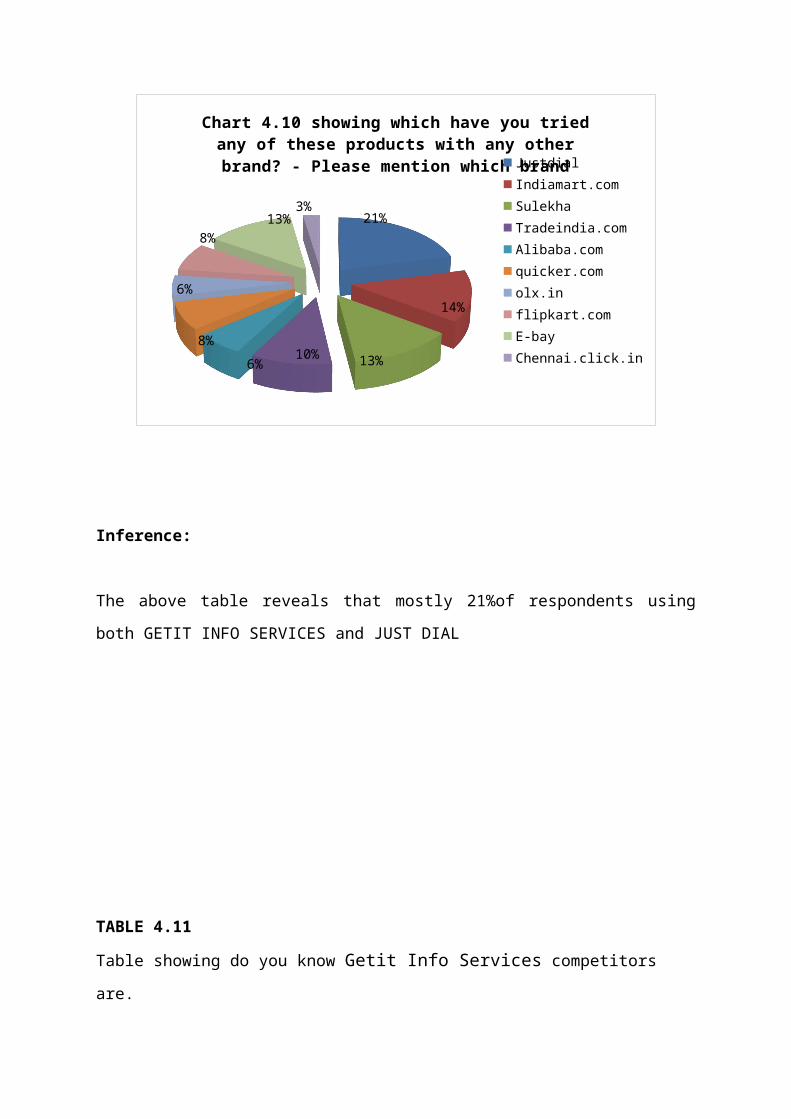
TABLE 4.10
Table showing which have you tried any of these products with any other brand- Please mention which brand
S.no Competitors Number of respondents Percentage of
respondents
aJustdial 42 21
b Indiamart.com 28 14c Sulekha 26 13d Tradeindia.com 20 10e Alibaba.com 12 6f quicker.com 15 7g olx.in 11 5h flipkart.com 15 8
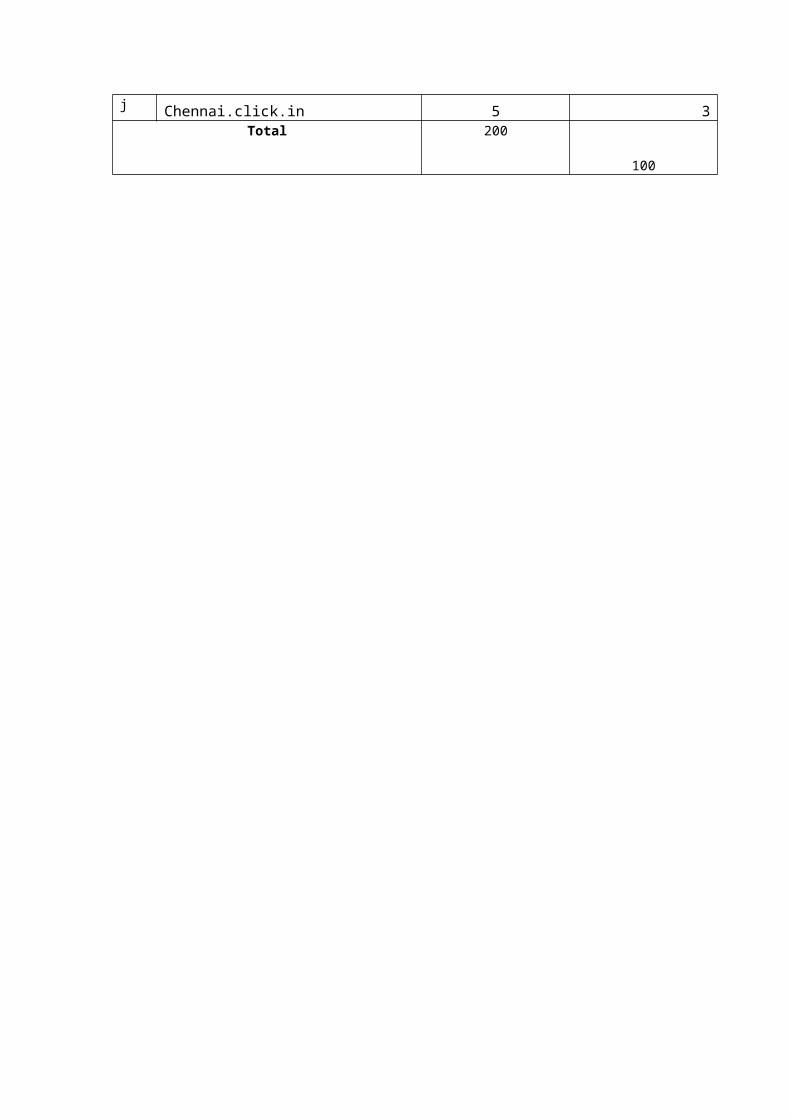
i E-bay 26 13j Chennai.click.in 5 3
Total 200
100

21%
14%
13%10%6%
8%
6%
8%
13% 3%
Chart 4.10 showing which have you tried any of these products with any other brand? - Please mention which
brand
JustdialIndiamart.comSulekhaTradeindia.comAlibaba.comquicker.comolx.inflipkart.comE-bayChennai.click.in
Inference:
The above table reveals that mostly 21%of respondents using both GETIT INFO SERVICES
and JUST DIAL
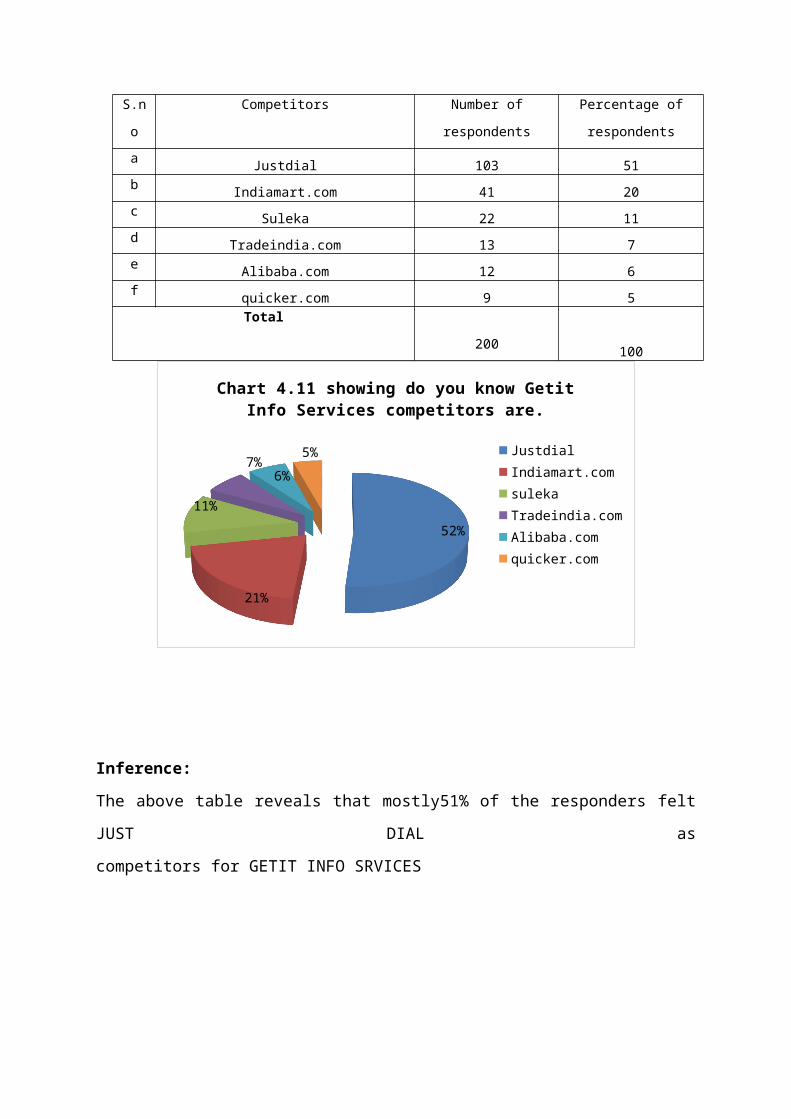
TABLE 4.11
Table showing do you know Getit Info Services competitors are.
S.no Competitors Number of respondents Percentage of
respondents
aJustdial 103 51
bIndiamart.com 41 20
cSuleka 22 11
dTradeindia.com 13 7
eAlibaba.com 12 6
fquicker.com 9 5
Total
200100
52%
21%
11%
7% 6%5%
Chart 4.11 showing do you know Getit Info Services competitors are.
JustdialIndiamart.comsulekaTradeindia.comAlibaba.comquicker.com
Inference:
The above table reveals that mostly51% of the responders felt JUST DIAL as
competitors for GETIT INFO SRVICES
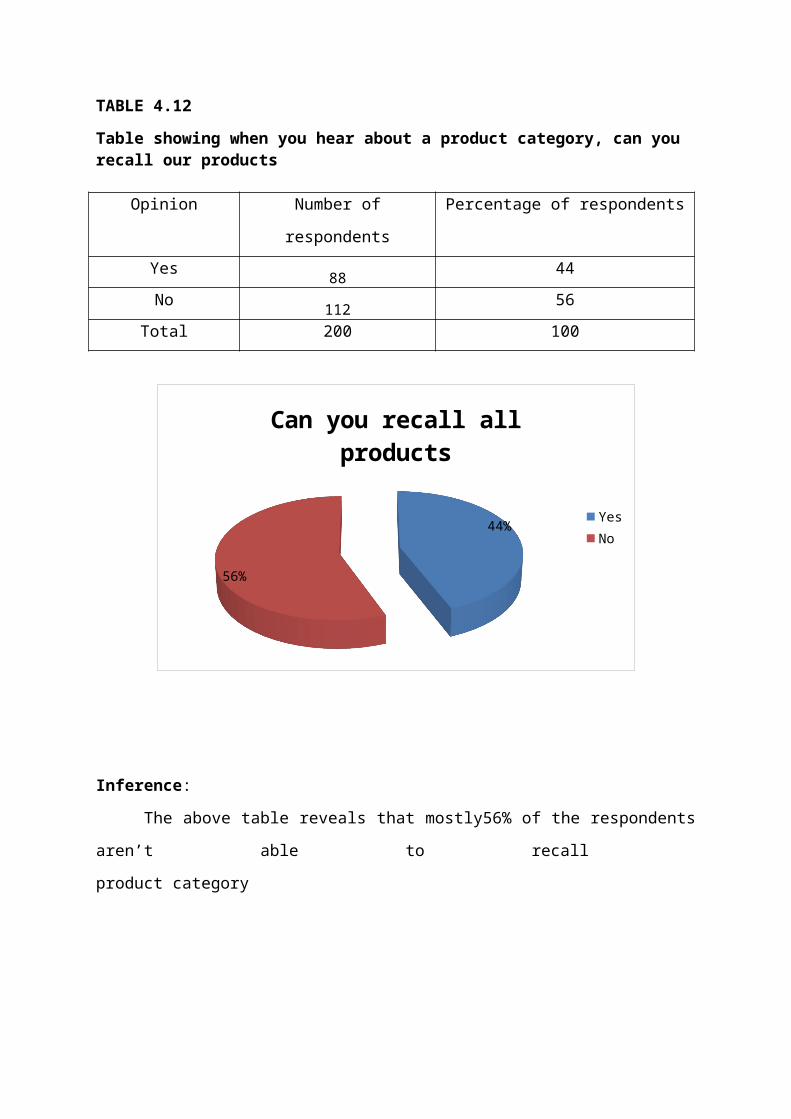
TABLE 4.12
Table showing when you hear about a product category, can you recall our products
Opinion Number of respondents Percentage of respondents
Yes 88 44
No 112 56
Total 200 100
44%
56%
Can you recall all products
YesNo
Inference:
The above table reveals that mostly56% of the respondents aren’t able to recall
product category
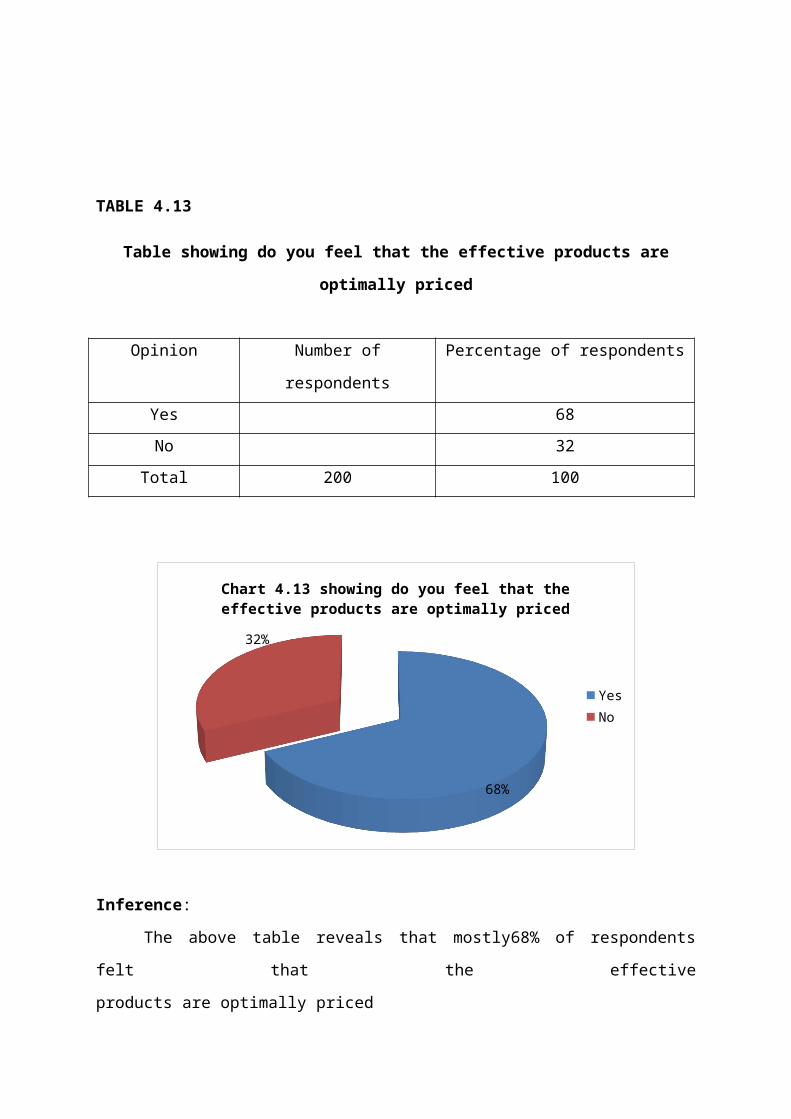
TABLE 4.13
Table showing do you feel that the effective products are optimally priced
Opinion Number of respondents Percentage of respondents
Yes 68
No 32
Total 200 100
68%
32%
Chart 4.13 showing do you feel that the effective products are optimally priced
YesNo
Inference:
The above table reveals that mostly68% of respondents felt that the effective
products are optimally priced
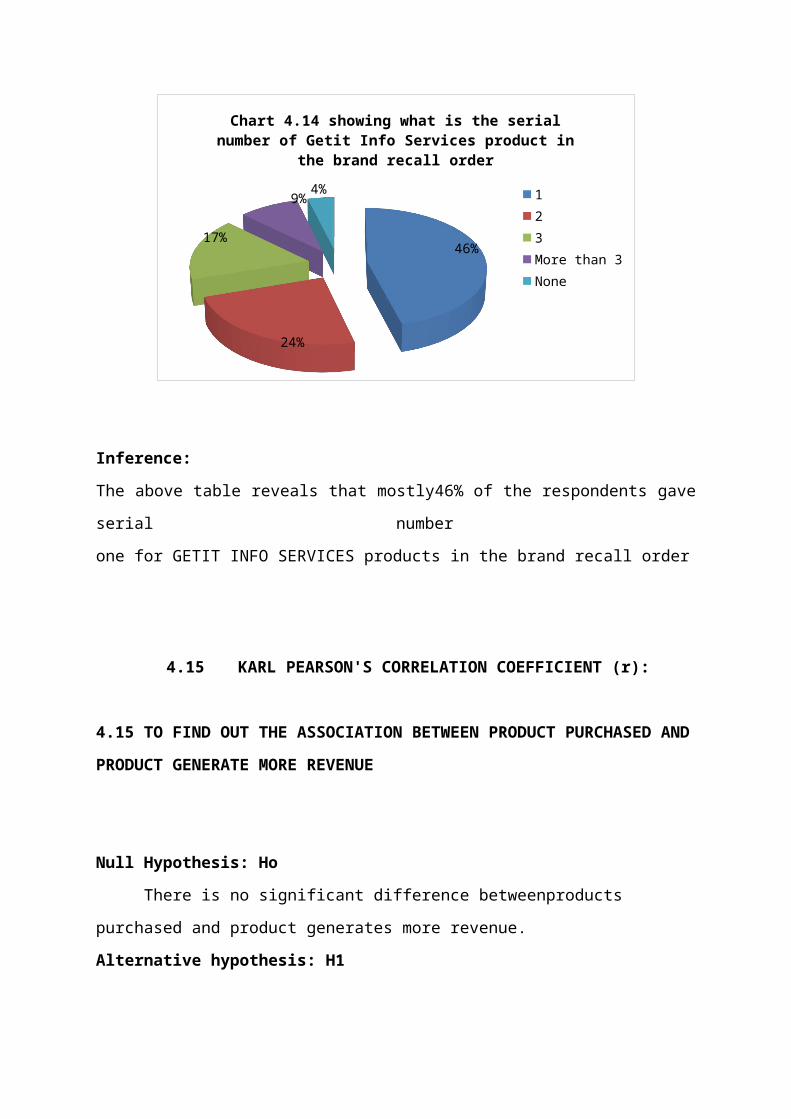
TABLE 4.14
Table showing what is the serial number of Getit Info Services product in the brand
recall orde
Grade
Number of
respondents
Percentage of
respondents
1 92 46
2 48 24
3 34 17
More than 3 18 9
None 8 4
TOTAL 200 100
46%
24%
17%
9% 4%
Chart 4.14 showing what is the serial number of Getit Info Services product in the brand recall order
123More than 3None
Inference:
The above table reveals that mostly46% of the respondents gave serial number
one for GETIT INFO SERVICES products in the brand recall order
4.15 KARL PEARSON'S CORRELATION COEFFICIENT (r):
4.15 TO FIND OUT THE ASSOCIATION BETWEEN PRODUCT PURCHASED AND
PRODUCT GENERATE MORE REVENUE
Null Hypothesis: Ho
There is no significant difference betweenproducts purchased and product generates
more revenue.
Alternative hypothesis: H1
There is significant difference between product purchased and product generates more
revenue.
7835 – 5714
=
2217.71 * 2061.71
r = 0.9918
Result:
The value of r = 0.9918 where r > 0 which indicates that there is high positive
correlation between the products purchased and product generates more revenue.
Inference
There is no significant difference between products purchased and product generates
more revenue.
4.16 TO FIND OUT THE ASSOCIATION BETWEEN PRODUCTS RECALL AND
EFFECTIVE PRODUCTS RAE OPTIMALLY CHARGED
Null Hypothesis: Ho
There is no significant difference betweenproducts recall and effective products are
optimally charged.
Alternative hypothesis: H1
There is significant difference between products recall and effective products are
optimally charged.

19136 – 20000
=
288* 2592
r = -1
Result:
The value of r = -1 where r < 0 which indicates that there is negative correlation
betweenproducts recall and effective products are optimally charged.
Inference
There is significant difference products recall and effective products are optimally
charged.
4.17 MANN-WHITNEY U-TEST
Null Hypothesis: Ho
There is no significant difference between advertisement and awareness
Alternative hypothesis: H1
There is significant difference between advertisement and awareness
U = 22
Mean of U = = 20
Variance of U = =23.33
Therefore the standard normal variant of U in
22 - 20
= 23.33
= -0. 414
Calculated value of IZI = 0.414
The critical value of z at 5% significance level (α) is 1.96
Result
Since the calculated value is lesser than the table value. Null hypothesis is accepted.
Inference
There is no significant difference between people of different experience source for
using job search.

CHAPTER – 5 FINDINGS, SUGGESTIONS & CONCLUSION
5.1 FINDINGS
1. Nearly half of the respondents came to know about the products by print media
2. More than half of the respondents said GETIT INFO SERVICES has a differentiation
strategy for different Segments
3. More than one-fourth of the respondents are not aware ofM.GETIT.In (Mobile
Application)
4. More than one-fourth of the respondents purchased both GETIT Freeads and Call
GETIT (Voice)
5. Web / Internet media is more effective to generate businessleads for nearly half of the
respondents
6. More than one-fourth of the respondents generally buy both GETIT Freeads and Call
GETIT (Voice)
7. For visibility more than one-fourth of the respondents are associated with GETIT
INFO SERVICES
8. More than half of the respondents like & dis-like Call GETIT(Voice) &M.GETIT.In
(Mobile Application) respectively
9. Nearly one-fourth of respondents using both GETIT INFO SERVICES and JUST
DIAL
10. Half of the responders felt JUST DIAL as competitors for GETIT INFO SERVICES
11. More than half of the respondents aren’t able to recallproduct category
12. Nearly one-third of respondents felt that the effective products are optimally priced
13. Call GETIT (Voice) product generate more revenue for more than one-fourth of
respondents
14. Nearly half of the respondents gave serial number one for GETIT INFO SERVICES
products in the brand recall order
5.2 SUGGESTIONS
1. There has to be enough promotional campaigns pre-launch so that consumers are
aware of the products.
2. Most of the new products have already been tried by consumers with rival brands.
Due to this, the consumers do not find the new products innovative enough and there
is no enthusiasm among consumers to try the new products.
3. The new products have to be introduced in free of cost so that consumers don’t think a
lot before purchasing it rather than spending to try a competitor’s product.
4. People from GETIT INFO SERVICES, salesmen, sales manager need to visit the field
on a daily basis as this is one of the most common complaints we came across that no
one from GETIT INFO SRVICES ever comes to visit and see how things are going
after sales.
5. GETIT INFO SERVICES is the leader in the local search engine industry so it should
think about more innovative ideas compared to its competitors to increase its market
share.
6. Local search engine industry is a service oriented market, so among competitors,
whoever puts their products innovative will be on profit side.
7. GETIT INFO SRVICES should come up with an incentive scheme for their salesmen
to motivate them. In market, salesmen are already aware of the incentive schemes
provided by other competitor companies, so they demand for incentive schemes like
them. This will benefit the company in the end.
8. The company should take proper feedback from existing clients from time to time. In
case they are facing any problem it can be solved timely, without delays.
5.3 CONCLUSION
Brands are now a central feature of business to business marketing& consumer
marketing, they are important in building long-term relationships with the consumer,
irrespective of the type of market. Their importance is now also being recognized in
other markets, including service and industrial. Investing in a brand builds consumer
confidence and loyalty and allows for brand stretching. It requires a consistent and

long-term strategy. A survey of the customers has been conducted to know the brand
awareness of the small and medium scale enterprises (SMES) firms available in the
market with special reference to GETIT INFO SERVICES Pvt Ltd.
1. GETIT INFO SERVICES has built its brand awareness among a relatively good
number of people in an around Chennai
2. The customers are aware of the services of GETIT INFO SERVICES with the help of
print and online media. The company now needs to focus on finding ways to increase
its advertising channels to reach the relatively large number of people
3. People prefer GETIT INFO SERVICES due to its competitive package structures, fast
reaching platform, prompt direct & online response, apart from tips and guidance
from the company

BIBILIOGRAPHY
Text Books:
1. Marketing Management Philip Kotler
2. Sample survey by questionnaire
Internet:
1. www.google.com
2. www.getit.in
3. www.slideshare.com
4. www.wikipedia.com
Magazines:
1. Companies Brochures & Manuals
ANNEXURE
QUESTIONNARE
A study on brand awareness of “Getit Info Services” among
Small & medium scale enterprise SME’s,Chennai.
Respected sir/madam
I am J. Mohammad Rafi an M.B.A student. I am undertaking a
project on “BRAND AWARENBESS”. In this context, I request you to spend
your valuable time in filling the questionnaire given below, which is used for
my project work.
(Part A)
Personal Data:
1. Name :
2. Address :
3. Phone Number :
4. Email id :
(Part B)
Q1. How did you come to know about Getit Info Services products?a Television 95
b Marketer’s Suggestion 12
c Radio 33
d Print 55
e Other 5
Total 200
Q2. Which of the following is true for Getit Info Servicesproduct?
a It is a niche product targeting to only a particular segment
b It is a commodity product
c It has a differentiation strategy for different segments
d None
Total
Q3. Which of the following products introduced by Getit Info Services, you not aware of?
a Consumer Buying Guides
b Business To Business Buying Guides B2B
c Bizlist Directories
d GETIT Freeads
e Call GETIT (Voice)
f M.GETIT.In (Mobile Application)
g Www.GETIT.In (Web Site)
Total
Q4. Which products have you purchased?a Consumer Buying Guidesb Business To Business Buying Guides B2Bc Bizlist Directoriesd GETIT Freeadse Call GETIT (Voice)f M.GETIT.In (Mobile Application)g Www.GETIT.In (Web Site)
Total
Q5. Which media is more effective to generate business leads?a Press (Newspapers, Magazines, Classifieds)
b Radio
c Television
d Web / Internet
e Others
Total
Q6. Which product do you generally buy?
a Consumer Buying Guidesb Business To Business Buying Guides B2Bc Bizlist Directoriesd GETIT Freeadse Call GETIT (Voice)f M.GETIT.In (Mobile Application)g Www.GETIT.In (Web Site)
Total
Q7. Which of the following attributes do you associate with Getit Info Services?
a Affordable
b Dependable
c Visibility
d Essential
e Branding
Total
Q8. Which products of Getit Info Services generate more revenue for your business?
A Consumer Buying Guides
B Business To Business Buying Guides B2B
C Bizlist Directories
D GETIT Freeads
E Call GETIT (Voice)
F M.GETIT.In (Mobile Application)
g Www.GETIT.In (Web Site)
Total
Q9. Which of them do you like/dislike?
a Consumer Buying Guides
LIKE DISLIKE
b Business To Business Buying Guides B2B
c Bizlist Directories
d GETIT Freeads
e Call GETIT (Voice)
f M.GETIT.In (Mobile Application)
g Www.GETIT.In (Web Site)
Total

Q10.Have you tried any of these products with any other brand? - Please mention which brand
PRODUCTS Other branda. Consumer Buying
Guidesb. Business To
Business Buying Guides B2B
c. Bizlist Directories
d. GETIT Freeadse. Call GETIT (Voice)f. M.GETIT.In
(Mobile Application)
g. Www.GETIT.In (Web Site)Total
Q11. Do you know Getit Info Services competitors are?
a) Yes b) No
Is yes, please name a few ___________________________________________
Q12. When you hear about a product category, can you recall our products?
a) Yes b) No
Q13. Dou you feel that the effective products are optimally priced?a) Yes b) No
Q14. What is the serial number of Getit Info Services product in the brand recall order?
a) 1 b) 2 c) 3d) More than 3 e) None
Q15. Feedback & Suggestion If Any…….
THANKS FOR SPENDING YOUR VALUABLE TIME WITH ME...