brake-wear pm research for california emission inventory
TRANSCRIPT

Brake-wear PM Research for
California Emission InventoryCARB: Sonya Collier, Seungju Yoon, Jeff Long, Sam Pournazeri, Jorn Herner
ERG: Alan Stanard, John Koupal, Sandeep Kishan and the rest of the ERG team
LINK: Carlos Agudelo, Ravi Vedula and the rest of the LINK team
CalTrans: Simon Bisrat, Yoojoong Choi, Mauricio Serrano
U.S. EPA1

CARB Goals
• Protect the public
from the harmful
effects of air pollution
• Regulatory measures
• Enforcement
• Setting standards
• Monitoring
• State
Implementation Plan
(SIP)0
10
20
30
40
50
60
1960 1980 2000 2020
South CoastSan Joaquin ValleySacramento ValleySan Francisco BaySan Diego
An
nu
al A
ve
rag
e P
M2.5
(m
g/m
3)
0
1
2
3
4
5
6
7
8
9
0
10
20
30
40
50
60
1960 1980 2000 2020
Nu
mb
er o
f truc
ks in
CA
(millio
ns)
2
1960s Bans on waste burning, incinerators
1980s Controls on boilers, turbines and kilns
LEV
ILEV
II
LEV
III
1993 Cleaner Diesel Fuel
2001 Truck engine emissions standards
2011 Truck and Bus Regulation
PM Regulatory Measures

CARB Goals
• Reduce exposure in
communities most
impacted by air
pollution
• Reduce air quality
disparity between
communities
3
0.0
0.5
1.0
1.5
2.0
2.5
3.0
3.5
1990 2000 2010
Die
sel P
M (
µg
/m3)
Year
Average of all EJ monitors*
Average of all non-EJ monitors
Estimated Diesel PM from EJ and
non-EJ monitoring sites
* EJ monitors are located in areas disproportionally impacted by environmental factors and have lower socioeconomic status
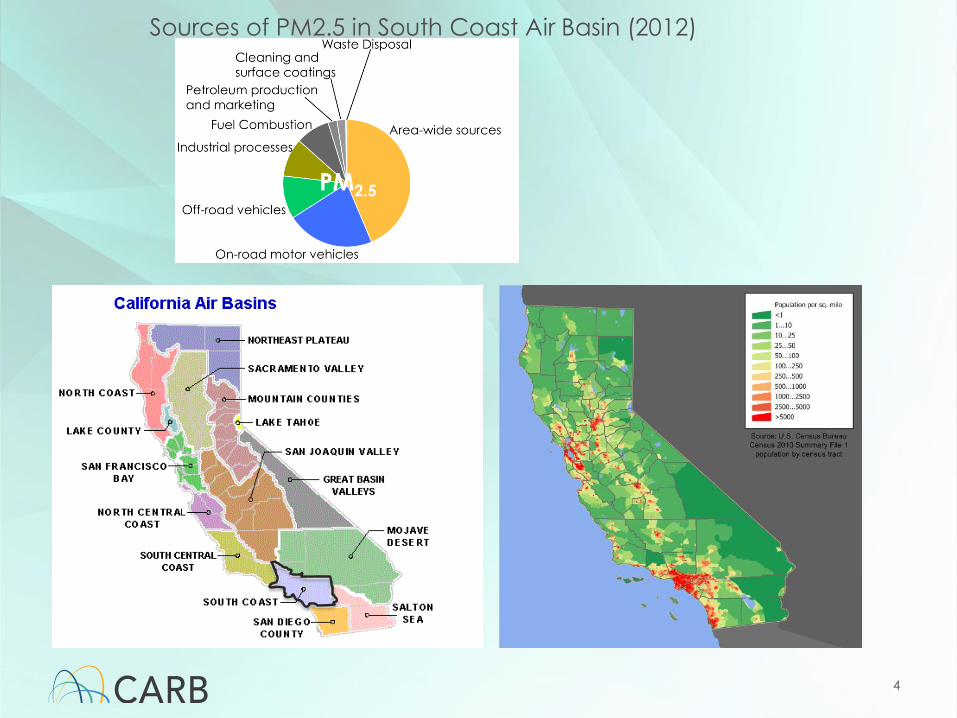
4
Sources of PM2.5 in South Coast Air Basin (2012)
PM2.5

5
EMFAC 2017
Mobile Source Inventory
Sources of PM2.5 in South Coast Air Basin (2012)
PM2.5

Inventory Basics: Brake Wear
# of braking
events per mile
PM emitted per braking event
from laboratory measurements
Miles driven per day
Emissions
in Tons/Day
Vehicle Population
VMT
6
# of brakes per vehicle
Unified Cycle
40
20
0
MP
H
8004000Seconds
Heavy Duty Urban Dynamometer Driving
Cycle
Cycle Averaged PM EF
X Airborne Factor

Source Data
• EMFAC 2007 and earlier: 1983 data
• EMFAC 2011 and later: 2000/2003 data
• NOTE! data source studies not designed specifically
to meet EMFAC needs (cycle based)
7
Reference Garg, et al. 2000 Sanders, et al. 2002 &
2003
Number of individual
brake pads
7 (Top GM models, >80%
of marketshare)
3 (LM-mid size, SM-
truck, NOA-full size)
Number of individual
tests
21 (varied brake id’s and
temperatures)
11 (3-4 UDP tests for 3
types of pads: LM, SM,
NAO)
Cycles/Total Brake
Events
BSL-035 (100, 200, 300, 400 °C) 500 km/hr, 0.3 g
UDP (24 brake events,
0.6-1.6 m/s2)
Method Enclosed brake dyno Enclosed brake dyno

Source Data Adaptation
• Data was extrapolated to cover all technology
groups and standard drive cycles
• Wheel load dependence extrapolated from
available data (linear fits)
8
Vehicle Type Braking Cycle Braking Frequency
(Apps/mile)
Passenger Cars and SUVs UC 4
Medium-HD Trucks ARB-MHD 5
Heavy-HD Trucks ARB-HD 1.2
Urban Transit Buses OCTA 8.2
School Buses MHD-LS Transient 14

Brake Wear PM Emission Factor
Summary
• HDVs have high EFs
• More brakes, different
cycle
• Buses have high EFs
• Many stops in typical
cycle
• Not speed dependent
9EMFAC 2017 Documentation

Priorities for new emission factor
development
• Use CA relevant vehicles and brake
components
• LDVs, MDVs, HDVs
• Identify speed dependent braking
cycle reflecting CA behavior
• Identify cycles for LDVs, MDVs and HDVs
• Use methods being adopted by JRC
(Enclosed brake dynamometer)
• Maintain realistic temperatures
• Develop method to simulate
regenerative braking
10
NYCC UC US06
40
30
20
10
0
Bra
kin
g e
ve
nts
p
er
mile
50
40
30
20
10
0
Cy
cle
Av
era
ge
Sp
ee
d (m
ph
)
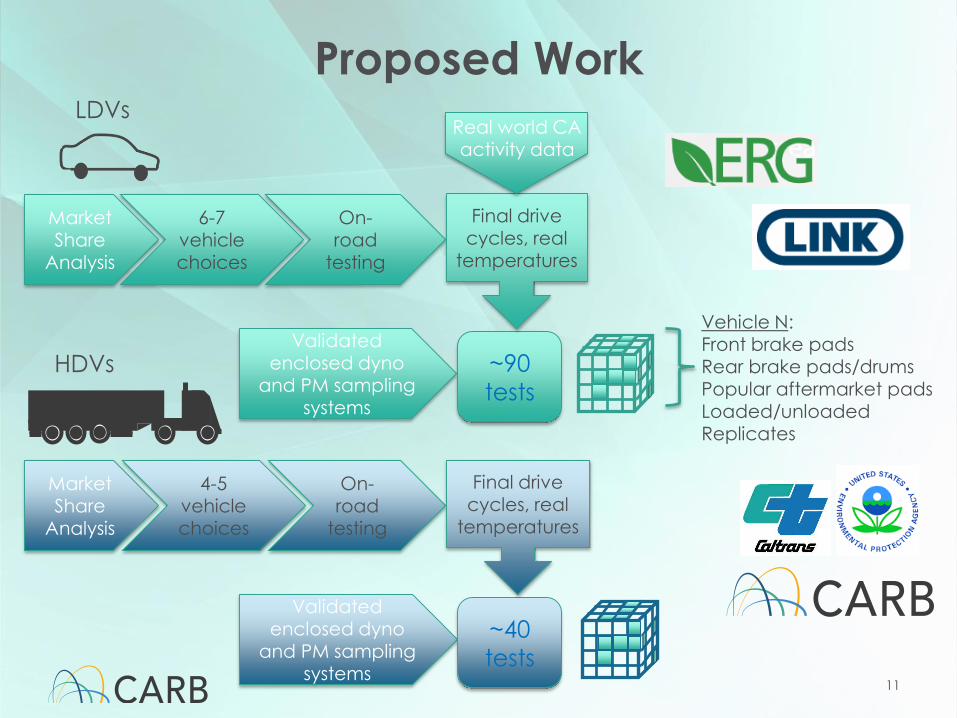
Proposed Work
11
LDVs
Market Share
Analysis
6-7 vehicle choices
On-road
testing
Validated
enclosed dyno and PM sampling
systems
~90
tests
Final drive cycles, real
temperatures
Market Share
Analysis
4-5 vehicle choices
On-road
testing
Validated enclosed dyno
and PM sampling systems
~40
tests
Final drive cycles, real
temperatures
HDVs
Vehicle N:Front brake padsRear brake pads/drumsPopular aftermarket padsLoaded/unloadedReplicates
Real world CA activity data

New project will capture larger
market, materials and conditions
12
Previous Source Data Current Project
Vehicles
represented
6 (LDA)
4 (LDT)
3 (LDA)
2 (LDT)
2-3 (LDA-regen capable)
4 (HDV)
Number of
individual brake
pads
10 (LDV) 24 (LDV)
12 (HDV, tractor and trailer)
Number of tests 32 130
Cycles/Total
Brake Events
UDP, BSL-035/~285 TBD/1000’s to 10,000’s
Test Conditions Discretized temperatures,
brake force
Continuous distribution,
focused on realistic conditions
Method Enclosed brake dyno Commonly accepted
enclosed brake dyno (TF2)

Results will include…
• Updated emission factors
• Cycle based - Speed dependent
• Regenerative braking effects
• Effects of load, vehicle type, pad type
• On different time scales, explore various effects on mass, PN, PM size:
• Chemical composition
13
Cycle Averaged Micro-trip Averaged Individual Brake
Events
Vehicle configuration
Pad material
Repeatability
Speed
Driving behavior
Repeatability
Braking power
Temperature
Repeatability

Comprehensive Research Approaches for
Brake PM in California
14
• Bottom up approach
• External contract with ERG/LINK
• Many advantages
• Some disadvantages
• Second bottom up approach
• In-house project
• Full chassis dyno tests
• Top down approach
• External contract with UC Riverside
• Roadside measurements
• Health effects
• External contract with UCLA
• Epidemiology study (LA)
Integrated:
PM2.5, PM10 (Mass,
Composition)
Real time:
PN, PM size, PM2.5,
PM10, composition
Traffic counts, met
data
Background PM
Calculate fraction of non-exhaust
Particle Diameter
Exhaust
Non-exhaust
Desired Results:
• EFs vs speed, fleet mix
• Fraction of non-
exhaust/exhaust PM
• Impact on downwind
communities

Closing remarks
15
Bottom up approach
Top down
approach
Health effects
Assess scope
of BWPM issues
Inform
programs and
policies for AQ
improvement
Provide much
needed information for
health related
projects
Updated
Inventory
Transportation
planning,
conformity

REFERENCES
• https://ww2.arb.ca.gov/
• Apte, Joshua S., et al. "Ambient PM2. 5 Reduces Global and Regional Life Expectancy." Environmental Science & Technology Letters (2018).
• Garg, B. D., et al. (2000). "Brake wear particulate matter emissions." Environmental science & technology 34(21): 4463-4469.
• EMFAC Documentation: https://www.arb.ca.gov/msei/categories.htm
• Sanders, P. G., et al. (2002). Brake Dynamometer Measurement of Airborne Brake Wear Debris, SAE International.
• Sanders, P. G., et al. (2003). "Airborne brake wear debris: size distributions, composition, and a comparison of dynamometer and vehicle tests." Environmental science & technology 37(18): 4060-4069.
• Schauer, J. J., et al. (2006). "Characterization of metals emitted from motor vehicles." Research report (Health Effects Institute)(133): 1-76; discussion 77-88.
16

Appendix: Research Approaches
17

Bottom Up Approach: External
Research Contracts with ERG/LINK
• Driving behavior• Representative CA
• EU: Novel World Harmonized Light Vehicle Test Program (WLTP) Brake Cycle
• Temperature range
• Modern materials and vehicles• Market-share Research
• Brake pads and rotors• Aftermarket parts
• CA fleet relevant vehicles• Range of vehicle weights
• Regenerative braking
• Collect brake wear PM in brake dyno• Simulate all of the above
parameters
Desired Results:
• Updated EFs: PM mass
per cycle, effects of
vehicle weight, cycle
speed
• PM mass, PM size, PN
per braking event,
material, weight, etc.
• Chemical composition
18

Bottom Up Approach: In-House
• Use sealed running loss-SHED
• Recruit representative vehicles
• Determine appropriate dilution
factors and particle loss rates
• Derive EFs per cycle
Desired Results:
• Cross-check with enclosed
dyno results
• PM mass, PM size, PN per
braking event, material,
weight, etc.
• Chemical composition
19
See also Schauer et al.

Top Down Approach: Roadside
Measurement + Dispersion Model
• Use laboratory derived source
profiles
• Location with
varying speeds and
fleet mixes
• Derive EFs
• Input into dispersion
model
Integrated:
PM2.5, PM10 (Mass,
Composition)
Real time:
PN, PM size, PM2.5,
PM10, composition
Traffic counts, met
data
Background PM
Calculate
fraction of non-
exhaust
Dp
Exhaust
Non-exhaust
Desired Results:
• EFs vs speed, fleet mix
• Fraction of non-exhaust/exhaust
PM
• Impact on downwind
communities 20