brajesh mrp1
TRANSCRIPT

8/6/2019 brajesh mrp1
http://slidepdf.com/reader/full/brajesh-mrp1 1/55
DEVI AHILYA VISHWAVIDYALAYA, INDORE
MAJOR RESEARCH PROJECT
On
A study of working women’s perception towards branded tea
and non branded tea---------------------------------------------------------------------------------
A Research Dissertation Submitted in Partial Fulfillment for the
Award of the Degree of Masters of Business Administration
(2009-2011)
Submitted to: Submitted by:
Prof. Neha Saxena Brajesh Kumar PadriyaMBA IV SEM
1111202411
1

8/6/2019 brajesh mrp1
http://slidepdf.com/reader/full/brajesh-mrp1 2/55
CERTIFICATE FROM INTERNAL & EXTERNAL EXAMINER
This is to certify that “Brajesh Kumar Padriya” of MBA (Full Time) Semester IV in Sanghvi
Institute of Management and Science, Indore has carried out a Major Research Project titled “ A
study of working women’s perception towards branded tea and non branded tea”. The work done
by him/her is genuine and authentic.
The work carried out by the student was found satisfactory. We wish him/her all the success in
career.
Internal Examiner External Examiner
2

8/6/2019 brajesh mrp1
http://slidepdf.com/reader/full/brajesh-mrp1 3/55
CERTIFICATE FROM CHAIRPERSON & FACULTY GUIDE
This is to certify that “Brajesh Kumar Padriya” of MBA (Full Time) Semester IV in Sanghvi
Institute of Management and Science, Indore has carried out a Major Research Project titled “A
study of working women’s perception towards branded tea and non branded tea”.
The work carried out by the student was found satisfactory and it is as per the guidance of faculty
guide.
Signature of Chairperson Signature of Faculty Guide
3

8/6/2019 brajesh mrp1
http://slidepdf.com/reader/full/brajesh-mrp1 4/55
DECLARATION
I, “Brajesh Kumar Padriya”, a student of School of Management, Sanghvi Institute of
Management & Science, Indore, hereby declare that the work done by me to do the Major
Research Project titled “A study of working women’s perception towards branded tea and non
branded tea” is genuine and authentic.
Signature of the Student
4

8/6/2019 brajesh mrp1
http://slidepdf.com/reader/full/brajesh-mrp1 5/55
ACKNOWLEDGEMENT
I sincerely and religiously devote this folio to all the gem of persons who have openly or
silently left an ineradicable mark on this research so that they may be brought into consideration
and given their share of credit, which they genuinely and outstandingly deserve.
This expedition of research encountered many trials, troubles and tortures along the way. I
am essentially indebted to my guide “Prof. Neha Saxena” for this sweating learning experience.
He/She overlooked my faults and follies, constantly inspired and mentored via his proficient
direction. It was a privilege to work under his/her sincere guidance.
I express my thanks to Dr. Prashant Gupta, Director (MBA / PGDM.), Sanghvi Institute of
Management and Science, Indore for his considerate support whenever and wherever needed. I
honestly acknowledge the support provided by the Chairperson, Prof. Gaurav Singh. I express
my indebtedness to the management of Sanghvi Institute of Management and Science, for
inspiring us to grab and utilize this opportunity.
With profound sense of gratitude, I would like to truthfully thank a recognizable number of
individuals whom I have not mentioned here, but who have visibly or invisibly facilitated in
transforming this research into a success saga.
Above all, I would like to conscientiously thank the Omnipotent, Omnipresent and
Omniscient God for His priceless blessings!
Signature of Student
5

8/6/2019 brajesh mrp1
http://slidepdf.com/reader/full/brajesh-mrp1 6/55
TABLE OF CONTENT
S.NO. Chapter Page No.
1. Introduction 8
Introduction of tea
History of tea industry
Introduction of working women’s buying behavior
2. Review of Literature 20
3. Rationale of study and 27
4. objectives 28
5. Methodology 29
Research Design
Data Collection
Data Analysis Tools
Sampling Plan
6. Data Analysis & interpretation 37
7. Results & findings 49
6

8/6/2019 brajesh mrp1
http://slidepdf.com/reader/full/brajesh-mrp1 7/55
8. Limitations 50
9. Conclusion 51
10. References 52
11. Bibliography 53
7

8/6/2019 brajesh mrp1
http://slidepdf.com/reader/full/brajesh-mrp1 8/55
INTRODUCTION
TEA
Tea is the agricultural product of the leaves, leaf buds, and internodes of various cultivars and
sub-varieties of the Camellia sinensis plant, processed and cured using various methods. "Tea"
also refers to the aromatic beverage prepared from the cured leaves by combination with hot or
boiling water, and is the common name for the Camellia sinensis plant itself. After water, tea is
the most widely consumed beverage in the world. It has a cooling, slightly bitter, astringent
flavour which many enjoy.
The term herbal tea usually refers to infusions of fruit or herbs containing no actual tea, such as
rosehip tea or chamomile tea. Alternative terms for this are tisane or herbal infusion, both
bearing an implied contrast with tea. This article is concerned exclusively with preparations and
uses of the tea plant, Camellia sinensis, the Minnan word for which is the etymological origin of
the English word tea.
There are at least six varieties of tea: white, yellow, green, oolong, black, and post-fermented
teas of which the most commonly found on the market are white, green, oolong, and black. Some
varieties, such as traditional oolong tea and Pu-erh tea, a post-fermented tea, can be used
medicinally.
A tea's type is determined by the processing which it undergoes. Leaves of Camellia sinensis
soon begin to wilt and oxidize, if not dried quickly after picking. The leaves turn progressively
darker as their chlorophyll breaks down and tannins are released. This enzymatic oxidation
process, known as fermentation in the tea industry, is caused by the plant's intracellular enzymes
and causes the tea to darken. In tea processing, the darkening is stopped at a predetermined stage
by heating, which deactivates the enzymes responsible. In the production of black teas, the
halting of oxidization by heating is carried out simultaneously with drying.
Without careful moisture and temperature control during manufacture and packaging, the tea
may become unfit for consumption, due to the growth of undesired molds and bacteria. At
minimum it may alter the taste and make it undesirable.
8

8/6/2019 brajesh mrp1
http://slidepdf.com/reader/full/brajesh-mrp1 9/55
Type of tea
1. White tea: Wilted and unoxidized
2. Yellow tea: Unwilted and unoxidized, but allowed to yellow
3. Green tea: Unwilted and unoxidized
4. Oolong: Wilted, bruised, and partially oxidized
5. Black tea: Wilted, sometimes crushed, and fully oxidized
6. Post-fermented tea: Green tea that has been allowed to ferment/compost
Origin and history
Tea plants are native to East and South Asia and probably originated around the point of
confluence of the lands of northeast India, north Burma, southwest China, and Tibet. Although
tales exist in regards to the beginnings of tea being used as a beverage, no one is sure of its exact
origins. The usage of tea as a beverage was first recorded in China, with the earliest records of
tea consumption with records dating back to the 10th century BC. It was already a common drink
during Qin Dynasty (around 200 BC) and became widely popular during Tang Dynasty, when it
was spread to Korea and Japan. Trade of tea by the Chinese to Western nations in the 19th
century spread tea and the tea plant to numerous locations around the world.
Tea was imported to Europe during the Portuguese expansion of the 16th century, at which time
it was termed chá. In 1750, tea experts traveled from China to the Azores Islands, and planted
tea, along with jasmines and mallows, to give the tea aroma and distinction. Both green tea and
black tea continue to grow in the islands, that are the main supplier to continental Portugal.
Catherine of Braganza, wife of Charles II, took the tea habit to Great Britain around 1660, but it
was not until the 19th century Britain that tea became as widely consumed as it is today. In
Ireland, tea had become an everyday beverage for all levels of society by the late 19th century,
but it was first consumed as a luxury item on special occasion such as religious festivals, wakes,
and domestic work gatherings such as quiltings.
9

8/6/2019 brajesh mrp1
http://slidepdf.com/reader/full/brajesh-mrp1 10/55
Health effects
The health benefits of tea is a controversial topic with many proponents and detractors. An article
from the journal Nutrition (1999, pp. 946–949) states:
The possible beneficial effects of tea consumption in the prevention of cancer and
cardiovascular diseases have been demonstrated in animal models and suggested by studies in
vitro. Similar beneficial effects, however, have not been convincingly demonstrated in humans:
beneficial effects have been demonstrated in some studies but not in others. If such beneficial
effects do exist in humans, they are likely to be mild, depending on many other lifestyle-related
factors, and could be masked by confounding factors in certain populations. Another concern is
that the amounts of tea consumed by humans are lower than the doses required for demonstrating
the disease-prevention effects in animal models. Caution should be applied, however, in the use
of high concentrations of tea for disease prevention. Ingestion of large amounts of tea may cause
nutritional and other problems because of the caffeine content and the strong binding activities of
tea polyphenols, although there are no solid data on the harmful effects of tea consumption. More
research is needed to elucidate the biologic activities of green and black tea and to determine the
optimal amount of tea consumption for possible health-beneficial effects.
History of tea in India
10

8/6/2019 brajesh mrp1
http://slidepdf.com/reader/full/brajesh-mrp1 11/55
The history of tea in India dates back to (750-500 BC). According to renowned researchers tea in
India has been cultivated and consumed for thousands of years. However commercial production
of tea in the country only began with the arrival of the British in India. Coming down from
centuries, consuming tea has almost become a part of the Indian culture.
Over the years, tea has evolved to become one of the most important commodities in India. India
is among the largest tea producers in the world with the highest rate of tea consumption being
within the country itself. India is home to numerous tea estates in Assam and especially in the
southern part of the country. Tea is native to India and some of the top Indian tea brands are
ranked among the best in the world. Being the second largest tea producing nation only after
China, India receives heavy revenues from its tea exports.
India Accounts for almost 30% of the global tea production. The tea industry in India has
remained among the most stable industries for more than a period of 150 years now. Be it tea
production, consumption or tea exports India is the leader in all aspects. The favorable climatic
conditions, vast terrains and tea technology in India facilitate the growth of a variety of tea
starting from black tea to green tea to herbal tea.
The growth of the tea industry in India has been phenomenal over the last 50 years and the tea
industry in India manages to churn out a total turnover of around Rs 10,000 crore. Tea
production since independence has grown by almost 250% while the land required for tea
cultivation has only grown by 40%. The rank of the top tea brand in India is undoubtedly held by
the FMCG giants Hindustan Unilever Limited. It is the largest producer and supplier of tea not
only in India but in the world. The brand is known as Lipton and it is the highest consumed tea in
and across the country.
11

8/6/2019 brajesh mrp1
http://slidepdf.com/reader/full/brajesh-mrp1 12/55
The other top tea brand in India is Tetley which is a product of Tata Tea Ltd. Tata Tea Ltd is the
second largest producer and supplier of a host of branded teas in the country. The company
produces almost 40 million kilograms annually. Tata Tea has a market share of almost 20.2% in
the Indian tea market.
Top Tea Brands in India
Tata Tea
Godrej Tea
Lipton
Brooke Bond
Twinnings
Last Updated on 20/06/2011
Top-Tea-Brands-in-India
• Tata Tea Ltd
• Lochan Tea
• North Western Cacher Tea
• Dhunseri Tea
• Thunderbolt Tea
12

8/6/2019 brajesh mrp1
http://slidepdf.com/reader/full/brajesh-mrp1 13/55
• Tata Tea
• Goodricke
• McLeod Russel India
TEA IN INDIA
Tea is one of the most important beverages in India and major foreign exchange earner. India is
the largest producer of tea in the world. The Indian states of Assam, West Bengal, Meghalaya,
Tripura and Sikkim in the north-east and Tamil Nadu, Karnataka and Kerala in the south
contribute significantly to the overall tea production in the country.
Tea is the agricultural product of the leaves, leaf buds, and internodes of various cultivars and
sub-varieties of the Camellia sinensis plant, processed and cured using various methods. "Tea"
also refers to the aromatic beverage prepared from the cured leaves by combination with hot or
boiling water and is the common name for the Camellia sinensis plant itself. After water, tea is
the most widely consumed beverage in the world. It has a cooling, slightly bitter, astringent
flavour which many enjoy.
There are at least six varieties of tea: white, yellow, green, oolong, black, and post-fermented
teas of which the most commonly found on the market are white, green, oolong, and black. Some
varieties, such as traditional oolong tea and Pu-erh tea, a post-fermented tea, can be used
medicinally.
The term "tea" is sometimes loosely used to refer to "herbal teas", which are an infusion or tisane
of leaves, flowers, fruit, herbs, or other plant material that contains no Camellia sinensis. In East
Asian culture, the term "red tea" has always been used to represent what the West understands as
13

8/6/2019 brajesh mrp1
http://slidepdf.com/reader/full/brajesh-mrp1 14/55
"black tea". This can be confusing in the English speaking world because the same term is now
also used to represent the drink made with the South African rooibos plant which contains no
Camellia sinensis.
The brewing and cultivation of Tea in India has a long history of applications in consumption
and for usage in the traditional system of medicine. Research show that tea is an important drink
in the northern and eastern states of India. Tea production in India began only after the arrival of
British East India Company and during that period large volume of lands was converted into
mass tea production sites. In addition, India is acting as one of the largest exporters of tea among
the other countries of the world.
Particularly some of the states in southern part of India are producing 200m kilograms of tea and
half of this production capacity from south India is used for exports. In the past, most of the tea
products produced in the Southern part of India were exported to the Soviet Union.
14
8/6/2019 brajesh mrp1
http://slidepdf.com/reader/full/brajesh-mrp1 15/55
Like other manufacturing sectors, tea manufacturing sector also has some top companies, whose
tea products are widely used not only in India, but also by the people of other countries as well
and the names of these companies are given below:
Top three branded tea producers in India:
• Godrej Tea Limited
• Tata Tea Limited
• Hindustan Unilever Limited
Some of the details regarding these top three players in the Indian Tea manufacturing sector are
given below:
Godrej Tea Limited:
Godrej Tea Limited belongs to the
popular Godrej Group, which is
operating from its headquarters in the
city of Mumbai. Godrej Group is a
million dollar company in India and
Godrej Tea Limited was established
by this group in the year 2002. Later
in the year 2006, food business was
merged with Godrej Tea Limited and the name of the company was changed as Godrej
Beverages and Foods Limited. They are engaged in the production of tea in the form of black tea,
15

8/6/2019 brajesh mrp1
http://slidepdf.com/reader/full/brajesh-mrp1 16/55
green tea, tea packets and tea bags. They are experts in catering to the tea requirements of the
people with 100% satisfaction in terms of price and quality.
Tata Tea Limited:
Tata Tea Limited also called as Tate-Tetly, holds the pride of being the second largest distributor
and manufacturer of tea. Teat Tea Limited is owned by India’s most famous Tata group and they
have business collaboration with some of the tea manufacturers in foreign countries like Tetley
and JEMCA. Some of the popular brand tea products produced by Tata Tea limited through the
business collaboration Tate Tetley and JEMCA. Tetley is a largest tea company in Canada and
the United Kingdom and JEMCA is a leading tea company in the Czech Republic. Some of the
other tea products of Tata Tea Limited are Good Earth Teas and Tata Tea.
16

8/6/2019 brajesh mrp1
http://slidepdf.com/reader/full/brajesh-mrp1 17/55
Hindustan Unilever Limited:
Hindustan Unilever is one among the top FMCG Companies in India and they also hold the pride
of being the world’s largest tea company since they are engaged in the production of quality tea
products through their tea estates in the northern and southern parts of India. They are also
engaged in the export of tea products and some of their popular tea products among the Indian
tea consumers are 3 Roses, Red Label, Brooke Bond Taj Mahal, Lipton, and Taaza and they offer
different flavors of tea under each of these popular brand names.
Tea being one of the most popular and refreshing beverages not only India, but also in other
countries of the world, these companies reach the homes of most of the people with a cup of tea
every morning. India’s tea is regarded as finest tea in different parts of the country and these
companies contribute towards this fame earned by the country. Moreover, these companies are
17

8/6/2019 brajesh mrp1
http://slidepdf.com/reader/full/brajesh-mrp1 18/55
also offering wide range of employment opportunities to people belonging to backward regions
of the country, wherein their tea estates are located.
Branded tea
Multinational fast moving consumer goods firm Unilever says demand for branded tea in the
local market is rising as consumers are becoming more quality and health conscious.
“Branded teas carry a 10 to 15 percent premium over unbranded teas,” said Samari Ihalagedara,
the category manager at Dutch and British multinational Unilever which markets 26 Fast Moving
Consumer Goods (FMCG) brands in Sri Lanka.
Unilever tea re-branded Lipton Ceylonta, one of its top brands, as Brooke Bond-Ceylonta and
launched it in a pack with better sealing. Brooke Bond, an independent tea manufacturer in the
UK was acquired by Unilever in 1984. The Brooke Bond brand is popular in India.
Working women buying behavior
Consumer behaviour can be defined as the acts of individuals directly involved in obtaining and
using economic and services, including the decision process that precede and determine these
acts.
Buyer behavior refers to the acts of individuals directly involved in the exchange of money for
economic goods and services and the decision process that determined these act. Both consumer
and buyer behavior differ amongst the population as people have different wants and needs.
Therefore it is untrue to say that working women buy products and services essentially the same
18

8/6/2019 brajesh mrp1
http://slidepdf.com/reader/full/brajesh-mrp1 19/55
as non working women. No two people are similar as physiological factors, cultural forces,
economic considerations, interpersonal relationships, personality, self-concept, and learning are
variables that shape goals and influence.
However consumers can be put into groups if they have similar characteristics, i.e. if they come
from the same social class, background, age, lifestyle. Working and non-working women can be
segmented in two separate groups. They are different because of many influences. Some are
external due their social environment. What they do with these social stimuli involves a
psychological process that differs from each other. These social influences and internal processes
may evolve into a decision by the consumer to make a purchase or not. (refer to table 1). (Engel
et al, 1968). As both groups possess different characteristics, it is necessary for marketers tounderstand that they will have different wants and needs.
19

8/6/2019 brajesh mrp1
http://slidepdf.com/reader/full/brajesh-mrp1 20/55
Factors influencing behavior
Age & Lifestyle Motivation Culture Reference groups
Occupation Perception Subculture Family
Economic Learning Social class Roles & status
Personality Beliefs
Self concept Attitudes
The buying decision often depends on the consumers demographic profile. Any of the below
variables can be relevant to an individuals buying decision.
20

8/6/2019 brajesh mrp1
http://slidepdf.com/reader/full/brajesh-mrp1 21/55
Lifestyle & age A working woman will lead a different lifestyle to a non working woman.
Working women will tend to spend money on lunch snacks from shops and eat out in restaurants
more than unemployed as working women avoid cooking and this is one reason for eating out.
However, consumers can be put into groups if they have similar characteristics, i.e. if they come
from the same social class, background, age, and lifestyle. Working and non-working women can
be segmented in two separate groups. They are different because of many influences. Some are
external due their social environment. What they do with these social stimuli involves a
psychological process that differs from each other.
Consumer behavior can be described as a decision process. The non-working women will have
limited resources where they will not be able to buy everything they want; the working woman
will have more of an opportunity due to more finance. Both groups will have to make decisions
as to which goods and services they will purchase. Even after the product or service has been
purchased, other decisions will remain. This is known as the decision process, which can be
broken into 5 steps. 2. Introduction to Perception:
21

8/6/2019 brajesh mrp1
http://slidepdf.com/reader/full/brajesh-mrp1 22/55
LITRETURE REVIEW
1. Thinking of Tea & Literature
By Laurie Nienhaus
Most of us Victoriana lovers do not realize that the passion for the 19th century partially began
with the renewed interest in the almost unknown women writers of the Victorian age.
In the 1970s and 1980s, scholars were looking for a feminist approach to literature. Once
writers such as Annie Besant, Mary Elizabeth Braddon, Ann Bronte, Ella D'Arcy, and Harriet
Martineau, to name only a few, were rediscovered, the door opened wide.
Now scholars wanted to investigate the rippling effect of women's writing - women editors,
women's newspapers, murder trials of women, New Women literature, attitudes towards
marriage and divorce.
This trend of studying the social history of the 19th century in order to understand its women
writers ultimately opened a room with a view not only for scholars, but also for the modern
magazine industry, the interior design world, and savvy entrepreneurs. And then, as you might
say, "We were hooked."
These facts combine with my love of books to lead me to my real point. An occasional book or
story discussion is a perfect teatime activity!
While the possibilities are endless, I would like to suggest a particular story for a beginning
book group or for a one-time event - The Yellow Wallpaper, by Charlotte Perkins Gilman.
Written in 1899, it is the story of a woman's descent into madness. Now, I know that does not
sound especially tea-ish, but wait! Let me tell you why I like this choice:
22
8/6/2019 brajesh mrp1
http://slidepdf.com/reader/full/brajesh-mrp1 23/55
It's short! It will take less than one hour to read and so does not require the commitment of Gone
With the Wind or George Elliot's Middlemarch. Even the busiest of women can fit this short
story into her schedule.
It is easy to find. An audio version can be found at www.scribblingwomen.org/cgwallpaper.htm.
It was considered to be incredibly controversial in its time, possesses tremendous symbolism,
and always elicits strong thoughts and emotions from readers. It's perfect for discussion!
There are many sources that can provide you with the details of how to run a book discussion. I
would suggest The Reading Group Handbook, by Rachel Jacobson. Charlotte Perkins Gilman
authored a helpful, short piece on why she wrote the story that can be found at the same location
as the readable text.
Basically you must remember that a successful book discussion needs a leader who has
researched a bit of background information about the book and the author, who has chosen
specific questions, and who is comfortable leading the group and keeping it on track. It is not
important that you are an expert on the book. What is important is that you encourage an
atmosphere where all ladies feel comfortable voicing their thoughts and opinions. Disagreements
are fine and can foster stimulating conversation.
I would suggest a book discussion be tied into a dessert tea. Have tea available during the
discussion and serve the desserts once the discussion has been completed.
And, if your ladies enjoyed the discussion and are pleased to keep on the path of controversy in
vintage literature, you can suggest Kate Chopin's The Awakening as further reading.
In the spirit of true tea adventurers, I urge you to give a book discussion a try!
This is the byline you must include if using this article:
Laurie Nienhaus is a public speaker, author, and Director of Gilded Lily Publishing. She is also
the editor of the free, online monthly newsletter, Sweet Willa's Review. Tea and history lovers
and those wishing to subscribe to Sweet Willa are invited to visit GLily.com.
23
8/6/2019 brajesh mrp1
http://slidepdf.com/reader/full/brajesh-mrp1 24/55
2. Mr. Sachen Verma, Senior Vice President – Marketing of JV Gokal &
Co.Pvt Ltd
The Indian branded tea market is highly vibrant and full of challenges. This article looks at someof the interesting aspects constituting the branded tea market in India in the packed, tea bag and
flavored tea segments.
Branded tea market of India: not everybody’s cup of tea
India is a vast country of 1.2 billion populations spread out in 5000 plus towns and
6 lakh villages. It not only has a wide geographical spread but also has complex demographics,
which lead to varied regional taste preferences creating challenges for any tea marketer. At least
6 months understanding and planning of the markets from a macro perspective is required to plan
the market of any branded tea across India. Things are more difficult with most of the branded
tea retail market in India being highly unorganized and being catered through 2.5 million
grocery/kirana outlets.
Industry segmentation and players
Packet tea market is highly proliferated, matured market with more than 300 brands in the
country though dominated by HLL and Tata tea which have presence in all pack size and price
variants and jointly control a market share of 40 per cent of the packet tea industry. The next
major players – Duncan’s, Eveready, Goodricke,
GPI, Waghbakri, Girnar, Sapat, Dhunseri,Mohini, Society, Marvel etc. have strong regional
presence. In this segment there are 40 mid-size players having 80 brands among them. The
remaining market is far more fragmented and shared between numerous small players. Tata Tea
has Agni brand as key growth driver in the economy segment within packaged tea. Hindustan
Lever has brands such as Taj Mahal, Red Label,Taaza, A1 and 3 Roses, which are all popular.
While packet tea segment has more than 300 brands and is characterized by severe price
competition, the teabag segment is a product category, which is not a mass product yet. The
largest tea bag manufacturer in India which packs several of the leading tea bag brands –
Lipton, Taj Mahal, Tetley, Nestle, Double diamond etc estimates 7000 tons/annum as the tea bag
24

8/6/2019 brajesh mrp1
http://slidepdf.com/reader/full/brajesh-mrp1 25/55
consumption in the Indian with an annual growth rate of 20 per cent of which majority comes
from the out of home segment. The current Indian tea bag market is similar to Russia in mid
nineties when it was in nascent state and then showed a meteoric rise. It is estimated that by 2015
the Indian teabag market shall touch the figure of 15000 tons/annum.
Market leaders of the packaged teas viz. HLL and Tatas hitherto had not shown much interest in
teabags but both of them have become aggressive in last three years, as they have realized the
potential of this category.
Regional preferences in branded tea
Major players are offering different types of tea in different parts of the country with a focus on
the quality perception of the particular demography. For example, in most cases the tea available
in the south of India is mainly dust, whereas the norths Indians prefer leaf tea. On the other hand,
western market of Gujarat and Maharashtra prefer good quality packet and loose tea while in MP
and Rajasthan CTC fanning is the choice. States like West Bengal and Assam do not hold packet
tea as a value for money and mostly go for loose tea.
Pack sizes
Most of the companies have tea in all pack size - 2kg, 1kg, 500gm, 250gm, 100gm, 50gm and
25gm packaging. There are also sachets, which are priced as low as Re.1. Various regions have
distinctive packaging preference for poly pack and box pack (mono cartons). 250 gm size is the
most preferred size. However, from the last two years on retail shelf one could find odd pack
weights like 180 gm, 225 gm etc as a part of strategy of cost cutting by several companies by
reducing the product quantity.
Branded tea penetration is quite high in cities like Delhi and Ahmedabadwhen compared to other
major cities in India.
25

8/6/2019 brajesh mrp1
http://slidepdf.com/reader/full/brajesh-mrp1 26/55
Flavored teas doing well
The product diversification strategy by big players in tea industry has also lead to pep
in flavoured tea production in last ten years. Tata Tea, Taj mahaland Twinings have
introduced flavoured teas in the market. The differentflavours that are available in Indian market
are that of ginger, cardamom, lemon, earl grey (with bergamot
essence), ashwaghandha, mulethi(yashtimadhu), and tulsi. On the other hand green teas sales
have picked up on health grounds. Though Indians are hard-core black tea consumers, their
interest in flavoured tea can be attributed to their curiosity to test new products and the change in
trend in consumption. Flavoured tea market in India is growing at the rate of 25 per cent
annually.
State No. of Household(in millions)
Branded Teapenetration per cent
Delhi 2.6 m 91 per cent
Ahmadabad 1.0 m 90 per cent
Bangalore 1.4 m 69 per cent
Chennai 1.4 m 72 per cent
Kolkata 2.9 m 20 per cent
Mumbai 3.7 m 72 per cent
Hyderabad 1.2 m 59 per cent
Pune 0.9 m 64 per cent
3. Chacko SM, Thambi PT, Kuttan R, Nishigaki I. Beneficial effects of green tea for
women: a literature review. Chinese Medicine. 2010;5:13-21.
Tea (Camellia sinensis, Theaceae), which is usually consumed as green (unfermented), black
(fully fermented), or Oolong (partially fermented) tea, is associated with many health benefits.The most significant beneficial effects have been reported with the consumption of green tea. 1
Among those health benefits are the risk reduction and prevention of several types of cancer and
prevention of cardiovascular diseases, as well as anti-inflammatory, antiarthritic, antibacterial,
antiangiogenic, antioxidative, antiviral, neuroprotective, and cholesterol-lowering effects. The
26

8/6/2019 brajesh mrp1
http://slidepdf.com/reader/full/brajesh-mrp1 27/55
authors of this article researched the available literature to highlight the efficacy, mechanisms of
action, and adverse side effects of green tea and its constituent catechins.
Green tea is composed of proteins (15-20% dry weight), amino acids (1-4% dry weight),
carbohydrates (5-7% dry weight), minerals and trace elements (5% dry weight), and trace
amounts of lipids, sterols, vitamins, xanthic bases, pigments, and volatile compounds. The health
benefits of green tea are attributed primarily to its polyphenol content. Most of the polyphenols
are flavonols, commonly known as catechins (epicatechin, epigallocatechin, epicatechin-3-
gallate, and (-)-epigallocatechin-3-gallate [EGCG]).
For this review, the authors searched PubMed, EMBASE, AMED, and China Academic Journals
Full Text Database. They included articles about green tea’s health benefits in humans and
animals, absorption of metal ions and drug-metabolizing enzymes, antioxidation and inhibition
of oxidative stress, carbohydrate metabolism and diabetes mellitus, and adverse effects. The
authors selected 105 peerreviewed articles in English for this review.
(Swift 1765: 199)
Tea had been consumed by the working women’s classes since the eighteenth century, as is
indicated by a tract written in 1765 against the usage of tea, as it created much expense for the
kingdom in that it was, "...the common luxury of every chambermaid, sempstress andtradesman's wife, both in town and country...". However, tea did not become widely available
and affordable to the working classes until the middle to late nineteenth century. By the 1830's
tea was a necessary "luxury" for many of the working class
(Harrison 1971: 38).
The 1870's and 1880's marked the introduction of cheap black tea from Sri Lanka on the market
in Britain. This tied with the increase in trade due to the tea clipper ships that began in the 1830's
and 1840's, meant that the price of tea was relatively low. A new emphasis on morality included
a popular temperance movement in the middle of the nineteenth century, and the working classes
needed to find a cheap substitute for alcohol. Inexpensive tea arrived at exactly the right moment
in history to take this place.
27

8/6/2019 brajesh mrp1
http://slidepdf.com/reader/full/brajesh-mrp1 28/55
RATIONALE OF THE STUDY
The Rationale of this research is to analysis working women’s perception towards branded & non
branded tea and also find out the difference between working and working women perception
towards branded and un branded tea. And also find out the difference between branded and
unbranded tea.
This research is conduct to understand the preference of the working women’s about branded or
non-branded tea.
28

8/6/2019 brajesh mrp1
http://slidepdf.com/reader/full/brajesh-mrp1 29/55
OBJECTIVE OF PROJECT WORK
How brand change perception of working women’s.
To predict post purchase satisfaction or dissatisfaction.
Why most of the working women are preferring branded tea
To study the difference of working women’s perception towards branded & non branded
tea.
To know the factor responsible for their buying behaviour.
Purchasing decisions of working women’s.
To study the brand loyalty.
29

8/6/2019 brajesh mrp1
http://slidepdf.com/reader/full/brajesh-mrp1 30/55
RESEARCH METHODOLOGY
Research Design
The design is the structure of any scientific work. It gives direction and systematizes the
research. This is a non probability judgmental research and aims to study the responses of
working women perception towards branded tea n unbranded tea.
For the consumer perception study a questionnaire was formulated containing 12 questions. The
questionnaires were filled by the respondents of various age groups working womens and income
levels.
This data was later analyzed through mean and percentage analysis pie chart.
Tools of Data Collection:
Primary Data Collection: The primary data for this research is collected through
questionnaires. A structured questionnaire was designed to find out responses for
various factors affecting working women’s perception towards branded and
unbranded tea.
Questionnaire: The questionnaire was formulated by keeping in mind the
following points: - : -
Giving the respondents clear comprehension of the question.
Giving instructions as to what is needed.
Secondary Data Collection: The sources of secondary data include
(a) Internet.
(b) Magazines.
(c) Books referred from the library.
30

8/6/2019 brajesh mrp1
http://slidepdf.com/reader/full/brajesh-mrp1 31/55
Data analysis tool :
Data analysis is an important function to find out true result so right tools were used to analysis
the data. To know the working women’s perception towards branded tea and unbranded tea
Sampling Plan:
Universe Population:
The respondents living in the city of Bhopal and Indore and availing branded tea or
unbranded tea been considered as the population for data collection in this study.
Sampling Unit:
The element or unit being studied in this case is an individual using bran.ded and
unbranded tea
Extent:
The extent of Universe in this study is the Indore city.
Sampling Method :
The sampling method is Non probability Convenience Sampling.
Sample Size:
Sample size of one hundred responses has been taken for conducting the research.
SAMPLING: Sampling is the use of a subset of the population to represent the whole
population.
31
8/6/2019 brajesh mrp1
http://slidepdf.com/reader/full/brajesh-mrp1 32/55
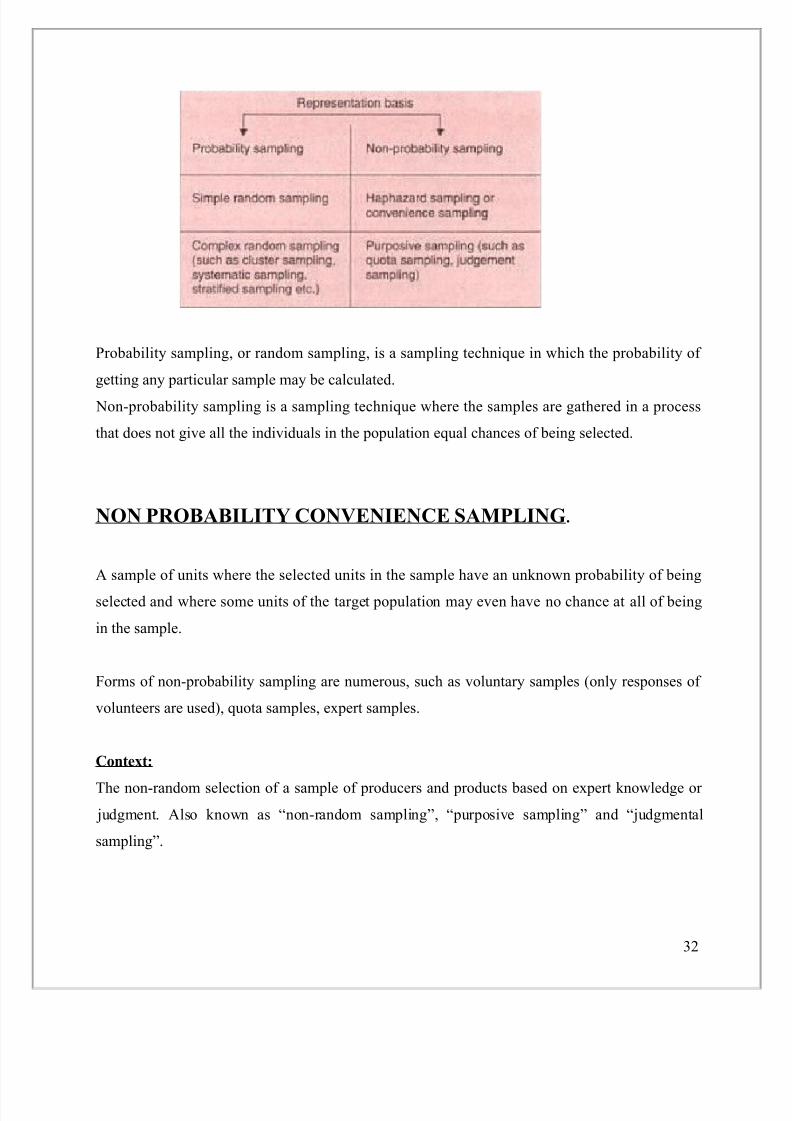
Probability sampling, or random sampling, is a sampling technique in which the probability of
getting any particular sample may be calculated.
Non-probability sampling is a sampling technique where the samples are gathered in a process
that does not give all the individuals in the population equal chances of being selected.
NON PROBABILITY CONVENIENCE SAMPLING.
A sample of units where the selected units in the sample have an unknown probability of being
selected and where some units of the target population may even have no chance at all of being
in the sample.
Forms of non-probability sampling are numerous, such as voluntary samples (only responses of
volunteers are used), quota samples, expert samples.
Context:
The non-random selection of a sample of producers and products based on expert knowledge or
judgment. Also known as “non-random sampling”, “purposive sampling” and “judgmental
sampling”.
32

8/6/2019 brajesh mrp1
http://slidepdf.com/reader/full/brajesh-mrp1 33/55
Convenience sampling is a non-probability sampling technique where subjects are selected
because of their convenient accessibility and proximity to the researcher.
CONVENIENCE SAMPLING APPLIED TO RESEARCH
The subjects are selected just because they are easiest to recruit for the study and the researcher
did not consider selecting subjects that are representative of the entire population.
In all forms of research, it would be ideal to test the entire population, but in most cases, the
population is just too large that it is impossible to include every individual. This is the reason
why most researchers rely on sampling techniques like convenience sampling, the most common
of all sampling techniques. Many researchers prefer this sampling technique because it is fast,
inexpensive, easy and the subjects are readily available.
EXAMPLES
One of the most common examples of convenience sampling is using student volunteers as
subjects for the research. Another example is using subjects that are selected from a clinic, a
class or an institution that is easily accessible to the researcher. A more concrete example is
choosing five people from a class or choosing the first five names from the list of patients.
In these examples, the researcher inadvertently excludes a great proportion of the population. A
convenience sample is either a collection of subjects that are accessible or a self selection of
individuals willing to participate which is exemplified by your volunteers.
USES
Researchers use convenience sampling not just because it is easy to use, but because it also has
other research advantages.
In pilot studies, convenience sample is usually used because it allows the researcher to obtain
basic data and trends regarding his study without the complications of using a randomized
sample.
33

8/6/2019 brajesh mrp1
http://slidepdf.com/reader/full/brajesh-mrp1 34/55
This sampling technique is also useful in documenting that a particular quality of a substance or
phenomenon occurs within a given sample. Such studies are also very useful for detecting
relationships among different phenomena.
CRITICISMS
The most obvious criticism about convenience sampling is sampling bias and that the sample is
not representative of the entire population. This may be the biggest disadvantage when using a
convenience sample because it leads to more problems and criticisms.
Systematic bias stems from sampling bias. This refers to a constant difference between the
results from the sample and the theoretical results from the entire population. It is not rare that
the results from a study that uses a convenience sample differ significantly with the results from
the entire population. A consequence of having systematic bias is obtaining skewed results.
Another significant criticism about using a convenience sample is the limitation in generalization
and inference making about the entire population. Since the sample is not representative of the
population, the results of the study cannot speak for the entire population. This results to a low
external validity of the study.
NOTES
When using convenience sampling, it is necessary to describe how your sample would differ
from an ideal sample that was randomly selected. It is also necessary to describe the individuals
who might be left out during the selection process or the individuals who are overrepresented in
the sample.
In connection to this, it is better if you can describe the possible effects of the people who were
left out or the subjects that are overrepresented to your results. This will allow the readers of your
research to get a good grasp of the sample that you were testing. It will also enable them to
estimate the possible difference between your results and the results from the entire population.
34

8/6/2019 brajesh mrp1
http://slidepdf.com/reader/full/brajesh-mrp1 35/55
NON-PROBABILITY SAMPLING
Non-probability sampling is a sampling technique where the samples are gathered in a process
that does not give all the individuals in the population equal chances of being selected.
In any form of research, true random sampling is always difficult to achieve.
Most researchers are bounded by time, money and workforce and because of these limitations, it
is almost impossible to randomly sample the entire population and it is often necessary to employ
another sampling technique, the non-probability sampling technique.
In contrast with probability sampling, non-probability sample is not a product of a randomized
selection processes. Subjects in a non-probability sample are usually selected on the basis of their
accessibility or by the purposive personal judgment of the researcher.
The downside of this is that an unknown proportion of the entire population was not sampled.
This entails that the sample may or may not represent the entire population accurately. Therefore,
the results of the research cannot be used in generalizations pertaining to the entire population.
TYPES OF NON-PROBABILITY SAMPLING
CONVENIENCE SAMPLING
Convenience sampling is probably the most common of all sampling techniques. With
convenience sampling, the samples are selected because they are accessible to the researcher.
Subjects are chosen simply because they are easy to recruit. This technique is considered easiest,
cheapest and least time consuming.
CONSECUTIVE SAMPLING
Consecutive sampling is very similar to convenience sampling except that it seeks to include
ALL accessible subjects as part of the sample. This non-probability sampling technique can be
considered as the best of all non-probability samples because it includes all subjects that are
available that makes the sample a better representation of the entire population.
35

8/6/2019 brajesh mrp1
http://slidepdf.com/reader/full/brajesh-mrp1 36/55
QUOTA SAMPLING
Quota sampling is a non-probability sampling technique wherein the researcher ensures equal or
proportionate representation of subjects depending on which trait is considered as basis of the
quota.
For example, if basis of the quota is college year level and the researcher needs equal
representation, with a sample size of 100, he must select 25 1st year students, another 25 2nd
year students, 25 3rd year and 25 4th year students. The bases of the quota are usually age,
gender, education, race, religion and socioeconomic status.
JUDGMENTAL SAMPLING
Judgmental sampling is more commonly known as purposive sampling. In this type of sampling,
subjects are chosen to be part of the sample with a specific purpose in mind. With judgmental
sampling, the researcher believes that some subjects are more fit for the research compared to
other individuals. This is the reason why they are purposively chosen as subjects.
SNOWBALL SAMPLING
Snowball sampling is usually done when there is a very small population size. In this type of
sampling, the researcher asks the initial subject to identify another potential subject who also
meets the criteria of the research. The downside of using a snowball sample is that it is hardly
representative of the population.
WHEN TO USE NON-PROBABILITY SAMPLING
1. This type of sampling can be used when demonstrating that a
particular trait exists in the population.
2. It can also be used when the researcher aims to do a qualitative, pilot
or exploratory study.
3. It can be used when randomization is impossible like when the
population is almost limitless.
36

8/6/2019 brajesh mrp1
http://slidepdf.com/reader/full/brajesh-mrp1 37/55
4. It can be used when the research does not aim to generate results that
will be used to create generalizations pertaining to the entire
population.
5. It is also useful when the researcher has limited budget, time and
workforce.
6. This technique can also be used in an initial study which will be
carried out again using a randomized, probability sampling.
37

8/6/2019 brajesh mrp1
http://slidepdf.com/reader/full/brajesh-mrp1 38/55
DATA ANALYSIS AND ITERPRETATION
After collecting the data from the various sources there is a need to data analysis andinterpretation. This data obtained from the various primary and secondary sources while doing
the study need to be analyze. This can be done with the help of various tables and charts.
For the purpose of the analyzing the data percentage has been calculated and this is shown with
the help of tables and charts.
Question 1:- what type of tea do you purchase?
Interpretation:-
According to this pie chart 89% working women prefer to purchase branded tea &remaining 11% purchase non branded tea.
38

8/6/2019 brajesh mrp1
http://slidepdf.com/reader/full/brajesh-mrp1 39/55
Question 2: - which attribute did attract you to purchase branded tea?
Interpretation:-
According to this pie chart percentage of factor which attract workin women to
purchase branded tea is following.
1. Brand name 20%
2. Transparency 6%
3. Price 32%
4. Hygiene 28%
5. Easy availavility 8%
6. Others 6%
39

8/6/2019 brajesh mrp1
http://slidepdf.com/reader/full/brajesh-mrp1 40/55
Question 3:- What was the reason for the delay between the purchase decision and
actual purchase?
Interpretation:-
According to this pie chart the percentage bar for delay between the purchase
decision and actual purchase is.
1. Financial constraints 35%
2. Waiting for more innovative product 18%
3. Waiting for market response 47%
40

8/6/2019 brajesh mrp1
http://slidepdf.com/reader/full/brajesh-mrp1 41/55
Question 4:- Is there any difference between working women and non working
women?
INTERPRETATION:-
According to this pie chart 66% working women strongly agree with the
difference between working women and non working women and 26% women is
only agree and 8% women is disagree.
41

8/6/2019 brajesh mrp1
http://slidepdf.com/reader/full/brajesh-mrp1 42/55
Question 5:- influence of brand name on purchasing decision?
INTERPRETATION:-
According to this pie chart 49% working women are strongly agree with the
influence of brand name and 43% are agree and remaining 8% are disagree.
42

8/6/2019 brajesh mrp1
http://slidepdf.com/reader/full/brajesh-mrp1 43/55
Question 6:- influence of quality on purchase decision?
Interpretation:-
According to this pie chart 46% working women are strongly agree with the
influence of quality and 20% are strongly disagree and 32% are agree and
remaining 2% are disagree.
43

8/6/2019 brajesh mrp1
http://slidepdf.com/reader/full/brajesh-mrp1 44/55
Question 7:- influence of price on purchasing decision?
Interpretation:-
According to this pie chart 4% working women are strongly agree with the
influence of price and 32% are strongly disagree and 41% are disagree and
remaining 4% are agree.
44

8/6/2019 brajesh mrp1
http://slidepdf.com/reader/full/brajesh-mrp1 45/55
Question 8 :- influence of product features on purchase decision?
INTERPRETATION:-
According to this pie chart 45% working women are agree with the influence of
product feature and 21% are strongly disagree and 16% are agree and remaining
18% are disagree.
45

8/6/2019 brajesh mrp1
http://slidepdf.com/reader/full/brajesh-mrp1 46/55
Question 9:- influence of family member on purchase decision?
Interpretation
According to this pie chart 25% working women are strongly agree with the
influence of family member and 12% are strongly disagree and 39% are agree and
remaining 24% are disagree.
46

8/6/2019 brajesh mrp1
http://slidepdf.com/reader/full/brajesh-mrp1 47/55
Question 10:- influence of peer group on purchase decision?
Interpretation
According to this pie chart 36% working women are strongly agree with the
influence of peer group and 25% are strongly disagree and 18% are agree and
remaining 21% are disagree.
47

8/6/2019 brajesh mrp1
http://slidepdf.com/reader/full/brajesh-mrp1 48/55
Question 11:- influence of advertisement on purchase decision?
Interpretation
According to this pie chart 52% working women are strongly agree with the
influence of advertisement and 6% are strongly disagree and 33% are agree and
remaining 9% are disagree.
48

8/6/2019 brajesh mrp1
http://slidepdf.com/reader/full/brajesh-mrp1 49/55
Question 12:- do u think branded tea are better than unbranded tea?
Interpretation
According to this pie chart 88% working women think that branded tea are better
than unbranded tea.
49

8/6/2019 brajesh mrp1
http://slidepdf.com/reader/full/brajesh-mrp1 50/55
Findings
1. This research is shown that most of working women’s are using branded tea because they
are aware of the branded tea and they also known the health effect of herbal tea also but a
non working women or un educated women are not able to what is the original
performance of branded tea. Sales of teas are booming as more working women cut out
caffeine in the quest for a healthier lifestyle.
2. Consumption of traditional tea has fallen by a third in five years, research shows because
now days most of working women’s preferring branded tea because they are well aware
about the key factor of branded tea and they highly influence about the quality and
services,
Some of key factor are.
1. Brand name
2. Images
3. Hygiene4. Transparency
3. This research is also showed that the most of working women’s are not aware about the
highest price of branded tea and they are mostly worry about the health benefit.
4. This research is also showed that perception of working women’s perception and non
working women’s perception are difference. And working women are more conscious
about the branded tea,
5. This research is also explain the perception of working women’s perception towards
branded tea. Most of working women are believe that branded tea is better than non
branded tea.
50

8/6/2019 brajesh mrp1
http://slidepdf.com/reader/full/brajesh-mrp1 51/55
Limitations of the report
The report also investigates the fact that the analysis conducted has limitations. Some of the
limitations include:
1. Forecasting figures are not provided nature and type of working women’s perception is
not sufficient to collect current economic conditions data.
2. For any working woman, her spouse should be very sensitive in sharing the responsibility
and burden at home and outside and both should be very sensitive and appreciative of each others help to make a decision but
3. Most of working women are not free to take their own decision and her family member
are highly involve in their decision.
4. Some of the working women are not ready to give their response
51

8/6/2019 brajesh mrp1
http://slidepdf.com/reader/full/brajesh-mrp1 52/55
Conclusion
India is one of the world's largest producers of tea; India is a country where tea is popular all
over as a breakfast and evening drink. It is often served as masala tea with milk and sugar, and
sometimes scented. Almost all the tea consumed is black Indian tea. Usually tea leaves are boiled
in water while making tea, and milk is added.
This research conclude that most of working women are mostly using branded tea than
unbranded tea and research is also shown that working women’s perception towards branded tea
is more positive than unbranded tea.
This research is also show that brand is matter to working women whether price is high or not.
This research is also conclude that working women’s perception in most of thr place is not match
to non working women.
The research is conclude that not only brand name is matter to working women, other feature is
also very important for them like.
1. Easy availability
2. Price
3. Hygiene
4. Transparency
5. Cleanliness
6. Brand value
52

8/6/2019 brajesh mrp1
http://slidepdf.com/reader/full/brajesh-mrp1 53/55
This research is conclude that most of working women is satisfied with branded tea but some of
the working women are use traditional tea too and they prefer to use unpacked or unbranded tea
because they feel that tea is more tastier than branded tea.
REFERENCE
1. Thinking of Tea & Literature, By Laurie Nienhaus
2. The Yellow Wallpaper, by Charlotte Perkins Gilman. Written in 1899.
3. Mr. Sachen Verma, Senior Vice President – Marketing of JV Gokal & Co.Pvt Ltd
4. Chacko SM, Thambi PT, Kuttan R, Nishigaki I. Beneficial effects of green tea for
women: a literature review. Chinese Medicine. 2010;5:13-21.
5. http://www.dailymail.co.uk/health/article-536208/Three-cups-tea-day-helps-stop-heart-
attacks-strokes-unless-youre-man.html
6. http://scholar.google.co.in/scholar?
q=literature+review+on+working+women+towards+branded+tea&hl=en&as_sdt=0&as_
vis=1&oi=scholart
53

8/6/2019 brajesh mrp1
http://slidepdf.com/reader/full/brajesh-mrp1 54/55
BIBLIOGRAPY
BOOKS
Women’s health, (green-tea-and-tai-chi-important-ingredients-for-womens-health)
Women to women (magazine), tea for women
Tea moderna (magazine).
Dailymail. (health/article-536208/Three-cups-tea-day-helps-stop-heart-attacks-strokes)
WEBSITE’S.
http://en.wikipedia.org/w/index.php?title=Special
%3ASearch&search=litreture+review+on+branded+tea
http://www.holisticfuture.com/2011/04/12/green-tea-and-tai-chi-important-ingredients-
for-womens-health/
http://www.google.co.in/#q=women+tea+articles&hl=en&prmd=ivns&ei=GkP7TaOrEIe
yuAPGj_y7Aw&start=10&sa=N&bav=on.2,or.r_gc.r_pw.&fp=28e6038a0ee82f9e&biw=
1366&bih=667
http://articles.timesofindia.indiatimes.com/2011-06-11/work/28378132_1_tea-office-
politics-drinks
http://www.google.co.in/search?
q=godrej+tea+brands+images&hl=en&biw=1024&bih=624&prmd=ivns&tbm=isch&tbo
=u&source=univ&sa=X&ei=vbP9TaKnJYyavgOKmqG4Aw&ved=0CCMQsAQ
http://www.google.co.in/#hl=en&q=hul+tea+brand&oq=hul+tea+&aq=0&aqi=g3g-
v2&aql=&gs_sm=e&gs_upl=221582l224057l8l8l7l0l0l0l0l285l1388l0.1.5l6&bav=on.2,o
r.r_gc.r_pw.&fp=26a8f397e4d8d9de&biw=1024&bih=624
http://en.wikipe dia.org/wiki/Tata_Tea
54

8/6/2019 brajesh mrp1
http://slidepdf.com/reader/full/brajesh-mrp1 55/55