brain mri - جدةkau.edu.sa/files/0012718/files/59224_brain mri.pdf · • check blood flow or...
TRANSCRIPT

BRAIN MRI
The application of magnetic resonance imaging has evolved rapidly since its clinical development in the early 1980s. Presently, examinations of the brain are the second most commonly requested MR study following spine examinations (Radiology Dept Statistics, 2001).
Most common indications for Brain MRI
• Look for the cause of headaches. • Help diagnose a stroke or blood vessel problems in the head. Problems with blood vessels may include an aneurysm or abnormal twisted blood vessels that are present at birth (this is called an arteriovenous [AV] malformation). • Check blood flow or blood clots to the brain. MRI can show bleeding in or around the brain. • Check symptoms of a known or suspected head injury. • Check symptoms such as change in consciousness, confusion, or abnormal movements. These symptoms may be caused by brain diseases, such as Huntington's disease, multiple sclerosis (MS), Parkinson's disease, or Alzheimer's disease. • Check for "water on the brain" (hydrocephaly). • Look for tumors, infections, an abscess, or conditions of the brain or brain stem, such as encephalitis or meningitis. • Check the eyes, the nerves from the eyes to the brain (optic nerves), the ears, and the nerves from the ears to the brain (auditory nerves). • Look for problems of the pituitary gland (macroadenoma and microadenoma). • Investigate or follow a finding seen on another test.
Suggested protocol for routine brain with planning method:
1‐ Sagittal SE/FSE T1
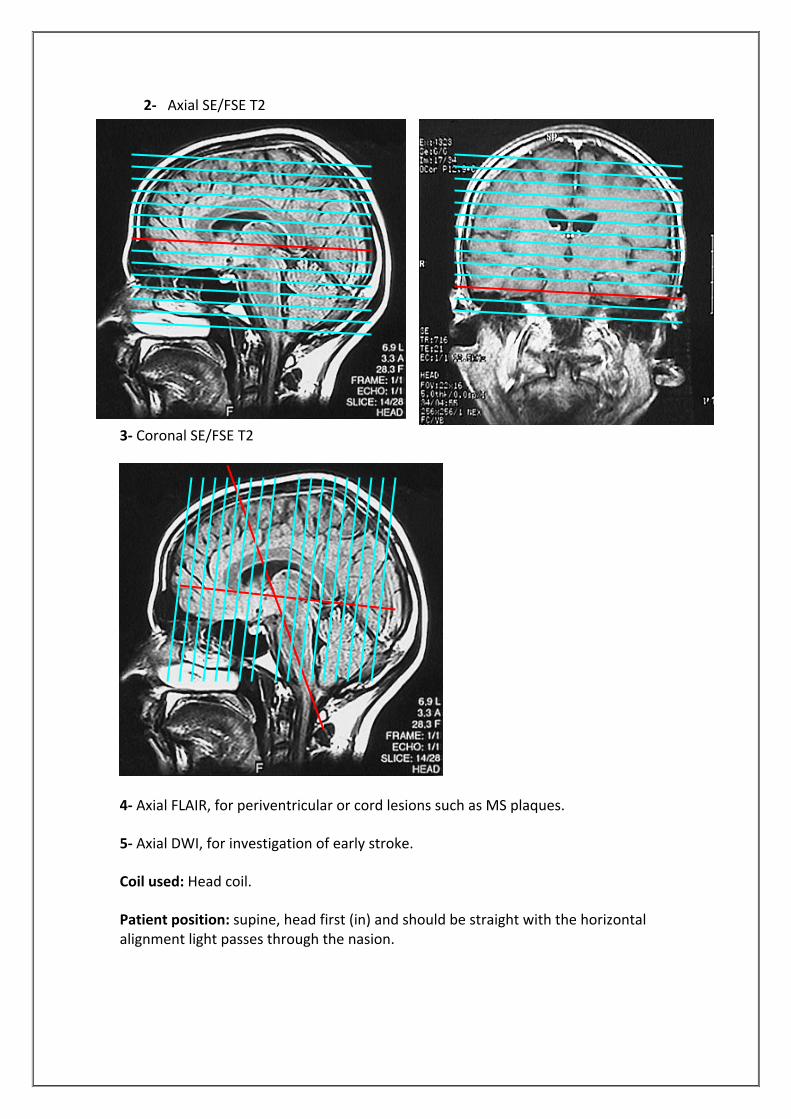
2‐ Axial SE/FSE T2
3‐ Coronal SE/FSE T2
4‐ Axial FLAIR, for periventricular or cord lesions such as MS plaques.
5‐ Axial DWI, for investigation of early stroke.
Coil used: Head coil.
Patient position: supine, head first (in) and should be straight with the horizontal alignment light passes through the nasion.

Types of image contrast weighting
1. T1 Weighting 2. T2 Weighting 3. Proton Density Weighting
Image Weighting: It is imaging technique where parameters are selected to weight the image towards one contrast mechanism and away from the other two.
T1 Weighted MRI
A T1 weighted image is an image whose contrast is predominantly due to the differences in T1 recovery times of tissues.
MRI scans can be acquired with various types of contrast. T1‐weighted images are weighted according to the so‐called spin‐lattice relaxation time (T1) of the protons that give rise to the MRI signals; such images provide good contrast between grey and white matter. T1 weighted images are typically used for anatomic information, providing also high sensitivity for paramagnetic contrast media that can show pathology, fat, fluids with high protein content and subacute haemorrhage. Signal Intensities in T1 wt Images:
• Tissues with short T1 relaxation times such as Fat, are bright (high signal), because they recover most of their longitudinal magnetization during the TR and therefore more magnetization available for next RF pulse
• Tissues with long T1 relaxation times such as water are dark (low signal).

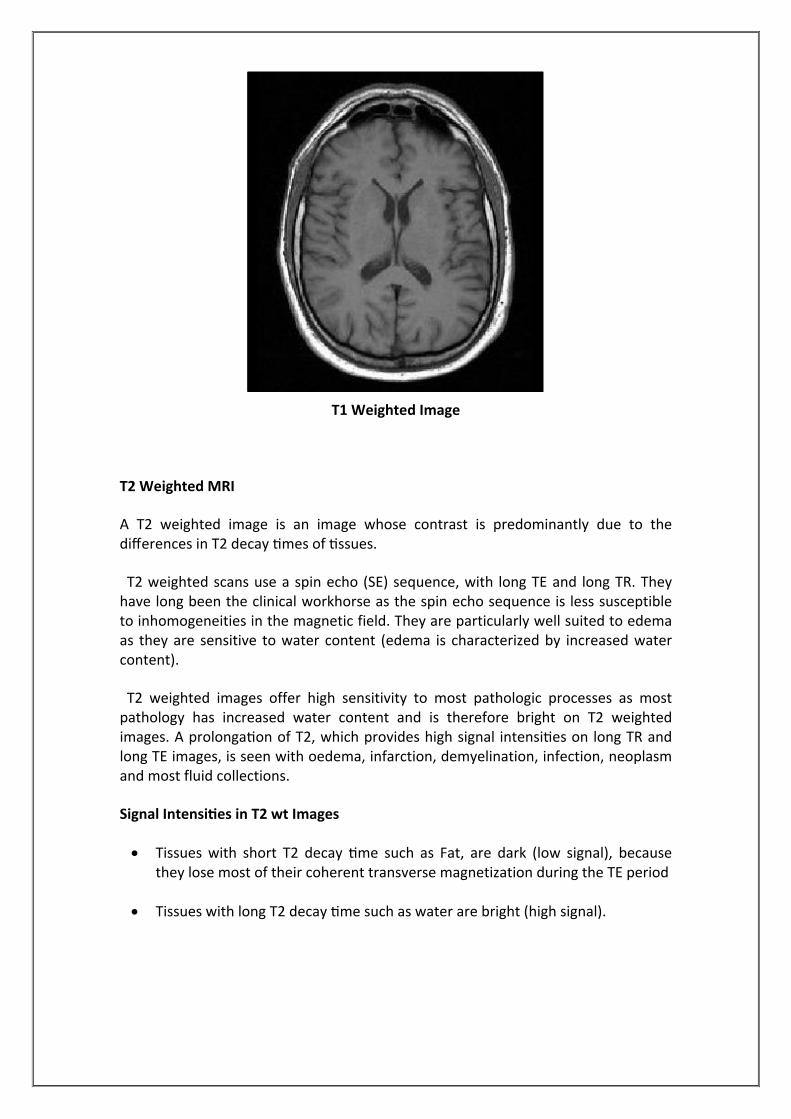
T1 Weighted Image
T2 Weighted MRI
A T2 weighted image is an image whose contrast is predominantly due to the differences in T2 decay times of tissues.
T2 weighted scans use a spin echo (SE) sequence, with long TE and long TR. They have long been the clinical workhorse as the spin echo sequence is less susceptible to inhomogeneities in the magnetic field. They are particularly well suited to edema as they are sensitive to water content (edema is characterized by increased water content).
T2 weighted images offer high sensitivity to most pathologic processes as most pathology has increased water content and is therefore bright on T2 weighted images. A prolongation of T2, which provides high signal intensities on long TR and long TE images, is seen with oedema, infarction, demyelination, infection, neoplasm and most fluid collections.
Signal Intensities in T2 wt Images
• Tissues with short T2 decay time such as Fat, are dark (low signal), because they lose most of their coherent transverse magnetization during the TE period
• Tissues with long T2 decay time such as water are bright (high signal).


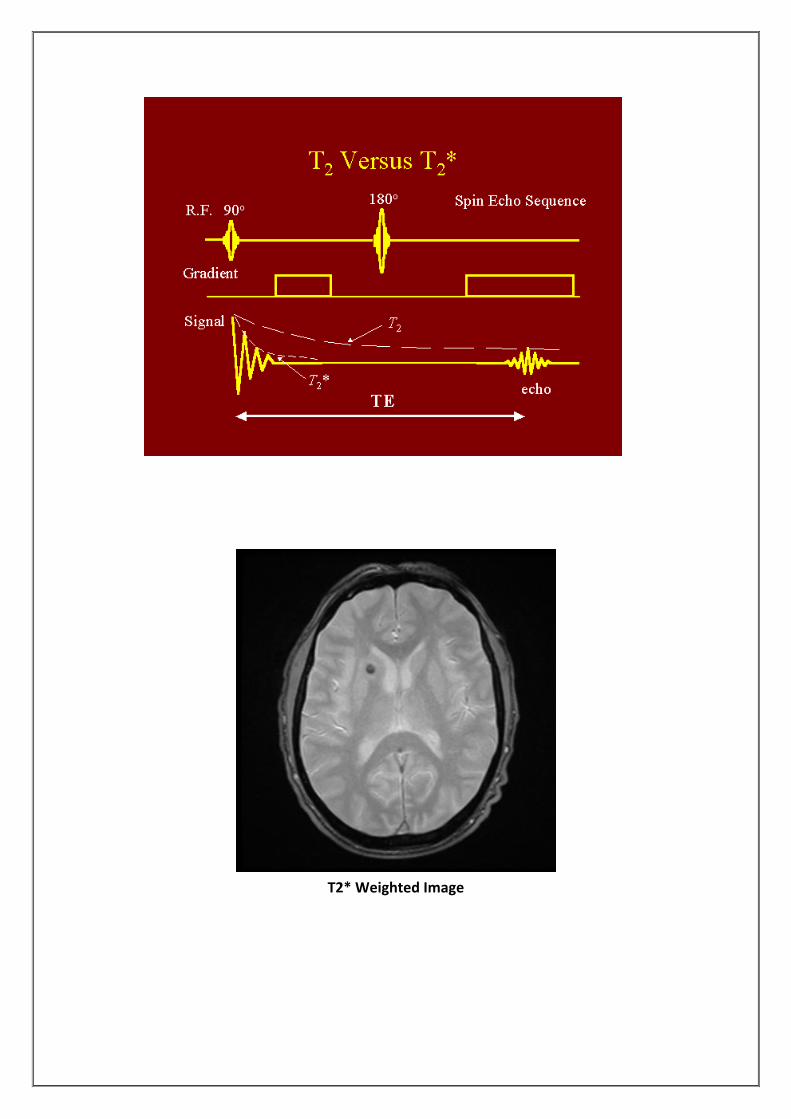
T2 Weighted Image
T2* Weighted MRI
T2* (pronounced "T2 star") weighted scans use a gradient echo (GRE) sequence, with long TE and long TR. The gradient echo sequence used does not have the extra refocusing pulse used in spin echo so it is subject to additional losses above the normal T2 decay (referred to as T2'), these taken together are called T2*. This also makes it more prone to susceptibility losses at air/tissue boundaries, but can increase contrast for certain types of tissue, such as venous blood.
The difference between T2 and T2*
T2 T2* 1. Time constant for loss of
(transverse magnetization) Mxy signal in a spin echo MRI sequence.
2. Is the transverse relaxation time.
1. Time constant for loss of (transverse magnetization) Mxy signal in a gradient echo MRI sequence.
2. Is the effective time of FID (free induction decay).
T2* Weighted Image

Fluid attenuated inversion recovery (FLAIR)
Fluid Attenuated Inversion Recovery (FLAIR) images are T2‐weighted with the CSF signal suppressed. This pulse sequence is used to null signal from fluids. For example, it can be used in brain imaging to suppress Cerebrospinal fluid (CSF) so as to bring out the periventricular hyperintense lesions, such as multiple sclerosis (MS) plaques. By carefully choosing the inversion time TI (the time between the inversion and excitation pulses), signal from any particular tissue can be suppressed.
Mechanism of Inversion Recovery (IR)
• IR is characterized by a 180° RF pulse to “flips” the net magnetization vector M then followed by 90° RF pulses.
• Time interval from inversion, this time interval is known as TI – Inversion time.
• Then the partially re‐grown longitudinal vector is flipped into the transverse plane by a 90° RF pulse.
FLAIR

Contrast with Different Sequences
TR TE TI ETL
T1
In spin echo
Fast inversion recovery
In gradient echo
< 800 ms
long
40‐150 ms
< 60 ms
10‐20 ms
5‐10 ms
…….
300‐700 ms
…….
…….
2‐6
…….
T2
In spin echo
> 1000 ms
> 70 ms
……
……
T2*
In gradient echo
500 ms
18‐40 ms
……
……
FLAIR
fast inversion recovery
Long
> 3000 ms
100‐120 ms
1500‐2000 ms
12‐20
Summary of MRI tissue characteristics of brain structures (Woodward, 2001) Relaxation Time
Image Contrast
T1 T2 PD T1 T2 CSF Long Long Grey Dark Bright
Gay Matter Intermediate Intermediate Isointense Grey Grey White Matter
Short Short Bright Bright Grey
Fat Short Intermediate Bright Bright Grey Cortical Bone
Long Short Dark Dark Dark
Air Long Short Dark Dark Dark Blood Fast Long Short Dark Dark Dark Oedema Long Long Bright/Grey Grey/Dark Bright Protein Short Long Bright/Grey Bright Bright
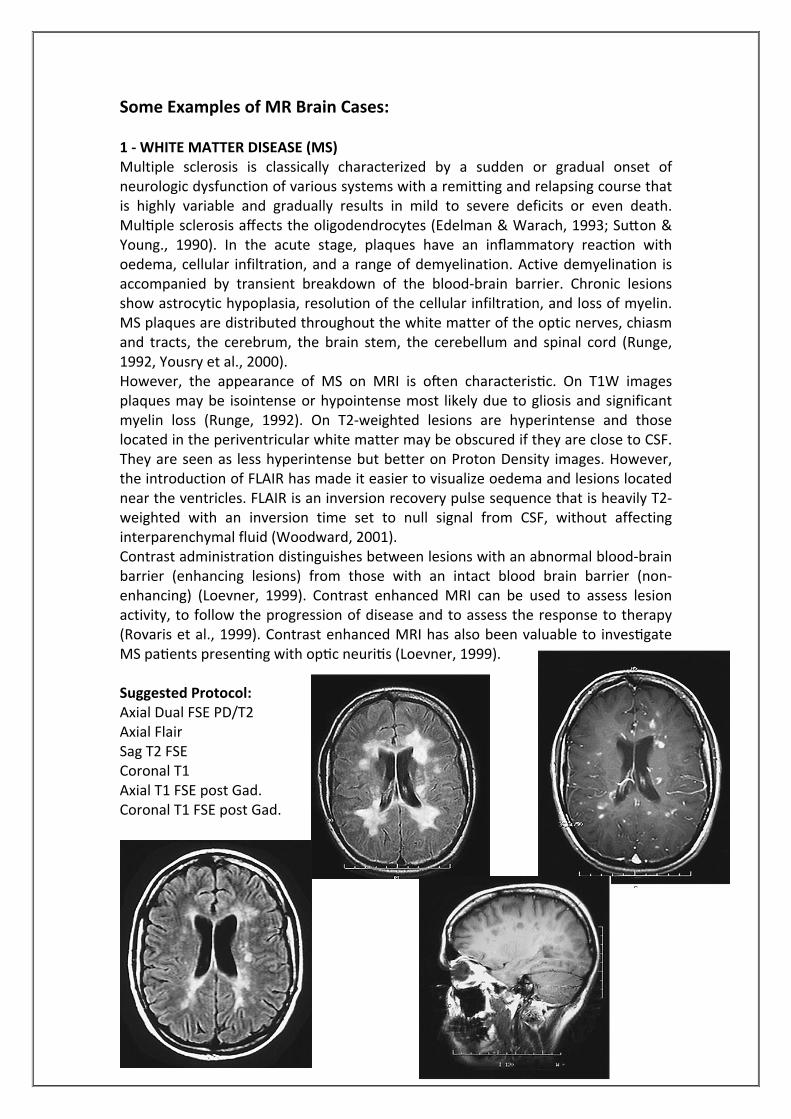
Some Examples of MR Brain Cases: 1 ‐ WHITE MATTER DISEASE (MS) Multiple sclerosis is classically characterized by a sudden or gradual onset of neurologic dysfunction of various systems with a remitting and relapsing course that is highly variable and gradually results in mild to severe deficits or even death. Multiple sclerosis affects the oligodendrocytes (Edelman & Warach, 1993; Sutton & Young., 1990). In the acute stage, plaques have an inflammatory reaction with oedema, cellular infiltration, and a range of demyelination. Active demyelination is accompanied by transient breakdown of the blood‐brain barrier. Chronic lesions show astrocytic hypoplasia, resolution of the cellular infiltration, and loss of myelin. MS plaques are distributed throughout the white matter of the optic nerves, chiasm and tracts, the cerebrum, the brain stem, the cerebellum and spinal cord (Runge, 1992, Yousry et al., 2000). However, the appearance of MS on MRI is often characteristic. On T1W images plaques may be isointense or hypointense most likely due to gliosis and significant myelin loss (Runge, 1992). On T2‐weighted lesions are hyperintense and those located in the periventricular white matter may be obscured if they are close to CSF. They are seen as less hyperintense but better on Proton Density images. However, the introduction of FLAIR has made it easier to visualize oedema and lesions located near the ventricles. FLAIR is an inversion recovery pulse sequence that is heavily T2‐weighted with an inversion time set to null signal from CSF, without affecting interparenchymal fluid (Woodward, 2001). Contrast administration distinguishes between lesions with an abnormal blood‐brain barrier (enhancing lesions) from those with an intact blood brain barrier (non‐enhancing) (Loevner, 1999). Contrast enhanced MRI can be used to assess lesion activity, to follow the progression of disease and to assess the response to therapy (Rovaris et al., 1999). Contrast enhanced MRI has also been valuable to investigate MS patients presenting with optic neuritis (Loevner, 1999). Suggested Protocol: Axial Dual FSE PD/T2 Axial Flair Sag T2 FSE Coronal T1 Axial T1 FSE post Gad. Coronal T1 FSE post Gad.

2 ‐ STROKE, CAROTID DISEASE Cerebrovascular disease can be divided into two major categories; ischaemic and haemorrhagic stroke. Ischaemic stroke accounts for approximately 80% of all strokes and is a result of occlusion of a blood vessel supplying an area of brain, depriving it of glucose and oxygen. Haemorrhagic stroke consist of either intraparenchymal or subarachnoid haemorrhage. Prompt differentiation between the two is of utmost importance to determine appropriate management. Ischaemic stroke can also be classified by anatomical distribution into anterior circulation or posterior circulation events (McCullough et al., 2001). Infarct appears dark on T1‐weighted images and bright on T2‐weighted images. Haemorrhage gives different signal depending whether it is acute, subacute or chronic. Acute haemorrhage appears dark on T1 and T2‐weighted images; Sub acute appears Bright Rim on T1 and Bright on T2‐weighted images; Chronic appears with a bright rim with a dark centre on both T1 and T2‐weighted images (Edelman & Warach, 1993). Suggested Protocol: Localizer‐3plan Axial‐STIR Sag‐T2‐FRFSE Cor‐T1‐FLAIR Axial‐T2‐FLAIR DWI 3D‐TOF for intracranial arteries (Circle of Willis) Sag‐2D‐TOF for neck vessels 3DCEMRA (with Fluoro‐triggering) and then followed by 3D FSPGR for plaque imaging.
STROKE: Two images of a parietal lobe stroke coupled with an old frontal lobe stroke. Stroke is often secondary to occlusion of the cerebral arteries due to cerebrovascular disease, atherosclerosis and vascular abnormalities of the heart or blood vessels. The blood vessels may become clogged by thrombi or emboli which break off from the inside of the heart or other blood vessels and which then travel
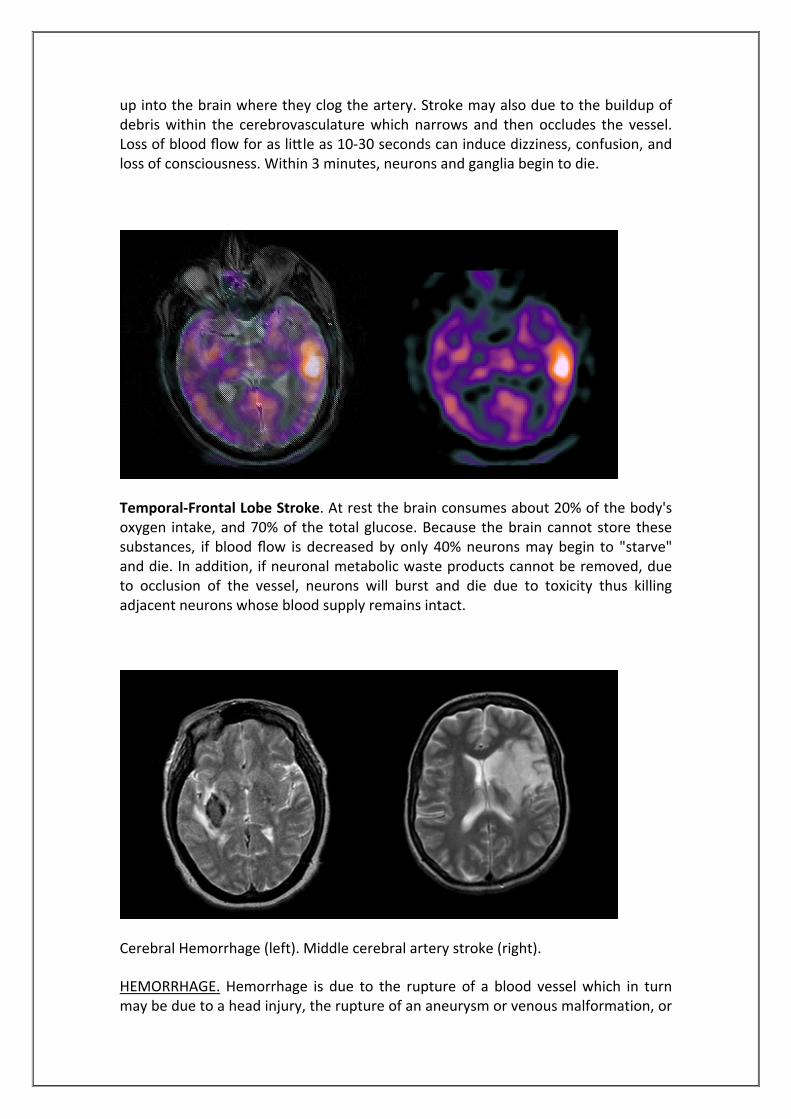
up into the brain where they clog the artery. Stroke may also due to the buildup of debris within the cerebrovasculature which narrows and then occludes the vessel. Loss of blood flow for as little as 10‐30 seconds can induce dizziness, confusion, and loss of consciousness. Within 3 minutes, neurons and ganglia begin to die.
Temporal‐Frontal Lobe Stroke. At rest the brain consumes about 20% of the body's oxygen intake, and 70% of the total glucose. Because the brain cannot store these substances, if blood flow is decreased by only 40% neurons may begin to "starve" and die. In addition, if neuronal metabolic waste products cannot be removed, due to occlusion of the vessel, neurons will burst and die due to toxicity thus killing adjacent neurons whose blood supply remains intact.
Cerebral Hemorrhage (left). Middle cerebral artery stroke (right).
HEMORRHAGE. Hemorrhage is due to the rupture of a blood vessel which in turn may be due to a head injury, the rupture of an aneurysm or venous malformation, or
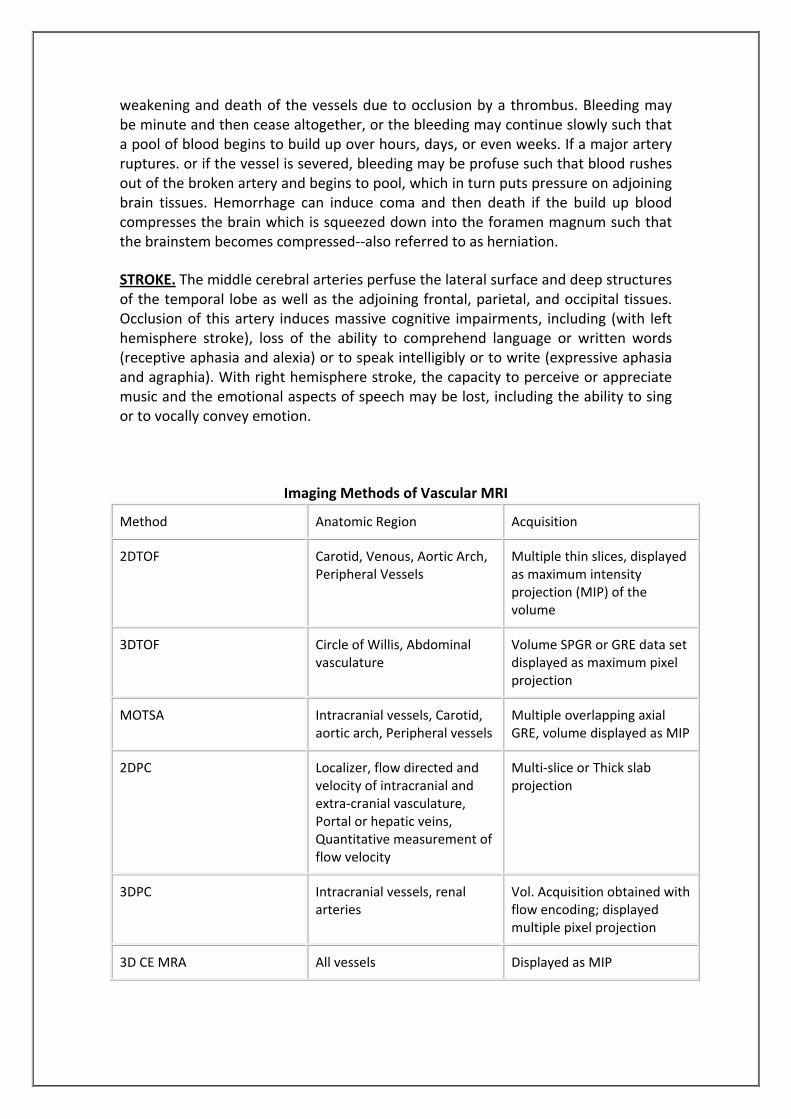
weakening and death of the vessels due to occlusion by a thrombus. Bleeding may be minute and then cease altogether, or the bleeding may continue slowly such that a pool of blood begins to build up over hours, days, or even weeks. If a major artery ruptures. or if the vessel is severed, bleeding may be profuse such that blood rushes out of the broken artery and begins to pool, which in turn puts pressure on adjoining brain tissues. Hemorrhage can induce coma and then death if the build up blood compresses the brain which is squeezed down into the foramen magnum such that the brainstem becomes compressed‐‐also referred to as herniation.
STROKE. The middle cerebral arteries perfuse the lateral surface and deep structures of the temporal lobe as well as the adjoining frontal, parietal, and occipital tissues. Occlusion of this artery induces massive cognitive impairments, including (with left hemisphere stroke), loss of the ability to comprehend language or written words (receptive aphasia and alexia) or to speak intelligibly or to write (expressive aphasia and agraphia). With right hemisphere stroke, the capacity to perceive or appreciate music and the emotional aspects of speech may be lost, including the ability to sing or to vocally convey emotion.
Imaging Methods of Vascular MRI
Method Anatomic Region Acquisition
2DTOF Carotid, Venous, Aortic Arch, Peripheral Vessels
Multiple thin slices, displayed as maximum intensity projection (MIP) of the volume
3DTOF Circle of Willis, Abdominal vasculature
Volume SPGR or GRE data set displayed as maximum pixel projection
MOTSA Intracranial vessels, Carotid, aortic arch, Peripheral vessels
Multiple overlapping axial GRE, volume displayed as MIP
2DPC Localizer, flow directed and velocity of intracranial and extra‐cranial vasculature, Portal or hepatic veins, Quantitative measurement of flow velocity
Multi‐slice or Thick slab projection
3DPC Intracranial vessels, renal arteries
Vol. Acquisition obtained with flow encoding; displayed multiple pixel projection
3D CE MRA All vessels Displayed as MIP

3 ‐ MENINGIOMA Meningioma account for 15% of all intracranial tumors and are the most common extra‐axial tumors (Engelhard, 2001, Grainger et al., 2001). They originate from the dura or arachnoids and occur in middle‐aged adults. Women are affected twice as often as men are. Meningiomas are well differentiated, benign, and encapsulated lesions that indent the brain as they enlarge. They are slow growers and may be present for many years before producing symptoms. The parasagittal region is the most frequent site for meningioma, followed by the sphenoid wing, parasellar region, olfactory groove, cerebellopontine angles and rarely the intraventricular region. They are hypervascular, receiving their blood supply predominantly from dural vessels (Runge, 1992). Most meningiomas are isointense with gray matter on T1 and T2‐weighted images and are difficult to detect without IV contrast medium (Bradley & Graeme, 1997, Haughton et al., 1988). A heterogeneous texture is found in all but the smallest meningiomas. The mottled appearance is likely due to a combination of flow void from vascularity, focal calcification, small cystic foci and entrapped CSF spaces. The appearance of meningiomas on T2‐weighted images has been correlated with the histological type: angioblastic meningiomas are frequently hyperintense to gray matter whereas fibroplastic lesion tends to be hypointense to gray matter (Engelhard, 2001). Meningiomas show intense enhancement with gadolinium and are sharply circumscribed. They have a broad base of attachment against a dural surface, which was thought to be a characteristic of meningioma. It has now been shown to occur with other tumors such as schwannoma or metastasis (Grainger et al., 2001). Suggested Protocols: for follow up tumors Axial PD/T2 Axial FLAIR Coronal T1 Sagittal T2 Axial T1 post gad Cor T1 post gad Sag T1 post gad Other protocol: Axial STAIR in case of oedema, do axial T2 FLAIR Cor T1 FLAIR Cor T1 FLAIR post gad Sag T1 FSE Axial T1 FSE
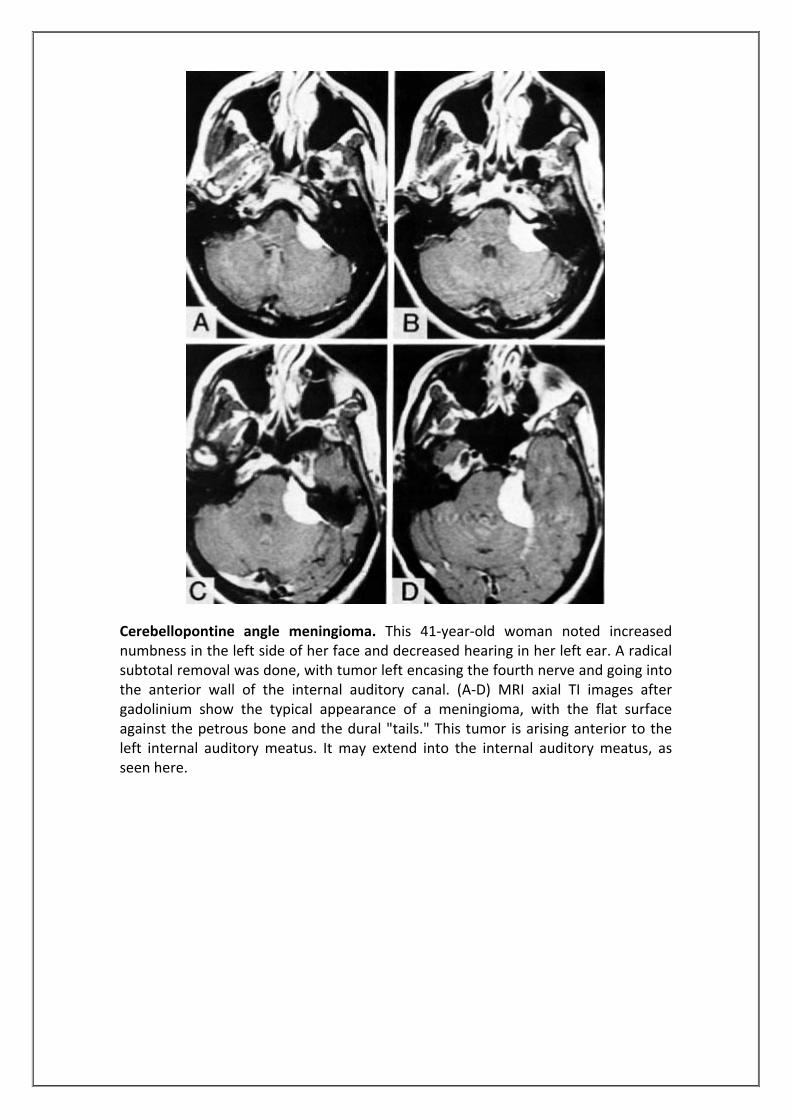
Cerebellopontine angle meningioma. This 41‐year‐old woman noted increased numbness in the left side of her face and decreased hearing in her left ear. A radical subtotal removal was done, with tumor left encasing the fourth nerve and going into the anterior wall of the internal auditory canal. (A‐D) MRI axial TI images after gadolinium show the typical appearance of a meningioma, with the flat surface against the petrous bone and the dural "tails." This tumor is arising anterior to the left internal auditory meatus. It may extend into the internal auditory meatus, as seen here.

MRI of a sphenoid wing meningioma. The tumor has filled the area where the temporal lobe normally lies and has compressed the arteries and nerves causing vision problems. 4‐ PITUITARY MICROADENOMA Microadenoma are tumours of the pituitary that measure less than 10mm. Normal appearance: On high resolution T1W images the anterior lobe is relatively isointense to gray matter except during neonatal period when it is hyperintense (Cox and Elster, 1991). The posterior lobe is hyperintense on T1W sequences due to phospholipid components of neurosecretory vesicles (Terano et al, 1996). On T2W images the anterior and posterior lobe appears isointense relative to gray matter. Microadenomas, being difficult to image, are usually hypointense on T1W images and do not immediately enhance after contrast media. The enhancement is usually delayed for 25 minutes. Signal intensity changes on T2W images are variable depending on the presence of blood, necrosis or fat. They may be hyperintense on T2W images. Suggested protocol: 1‐ Cor T2 FRFSE 2. Cor T1 FSE 3. Cor T1 FSE + Gadolinium 4. Sag T1 FSE + Gadolinium
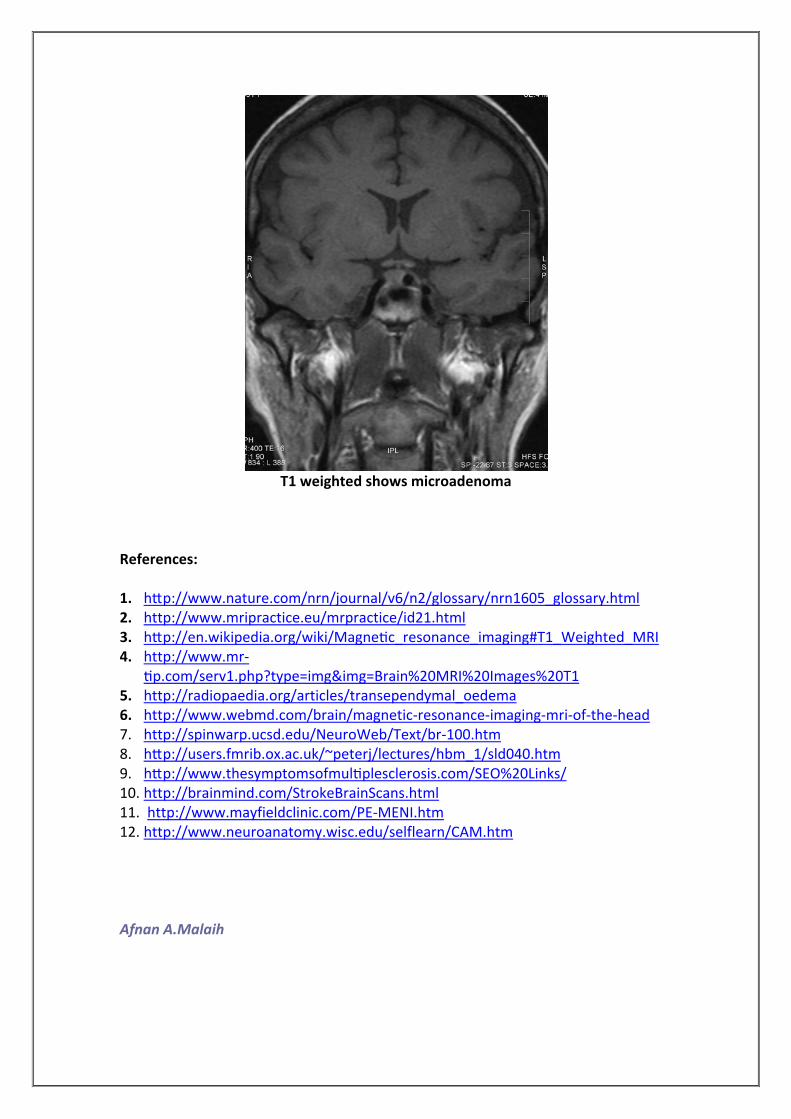
T1 weighted shows microadenoma
References: 1. http://www.nature.com/nrn/journal/v6/n2/glossary/nrn1605_glossary.html 2. http://www.mripractice.eu/mrpractice/id21.html 3. http://en.wikipedia.org/wiki/Magnetic_resonance_imaging#T1_Weighted_MRI 4. http://www.mr‐
tip.com/serv1.php?type=img&img=Brain%20MRI%20Images%20T1 5. http://radiopaedia.org/articles/transependymal_oedema 6. http://www.webmd.com/brain/magnetic‐resonance‐imaging‐mri‐of‐the‐head 7. http://spinwarp.ucsd.edu/NeuroWeb/Text/br‐100.htm 8. http://users.fmrib.ox.ac.uk/~peterj/lectures/hbm_1/sld040.htm 9. http://www.thesymptomsofmultiplesclerosis.com/SEO%20Links/ 10. http://brainmind.com/StrokeBrainScans.html 11. http://www.mayfieldclinic.com/PE‐MENI.htm 12. http://www.neuroanatomy.wisc.edu/selflearn/CAM.htm
Afnan A.Malaih