brain dynamics associated with graceful …...the stac theory 19 1.2.6. the cognitive reserve theory...
TRANSCRIPT

UNIVERSITÀ DEGLI STUDI DI MILANO-BICOCCA
Dottorato di Ricerca in Psicologia Sperimentale, Linguistica e Neuroscienze Cognitive
Ciclo XXI
BRAIN DYNAMICS ASSOCIATED WITH GRACEFUL AND PATHOLOGICAL AGING:
NEW MORPHOMETRIC AND fMRI EVIDENCE
Manuela Berlingeri matr: R00751
Tutor: Prof. E. Paulesu
A.A. 2008-2009

Ai mie genitori, per avermi insegnato ad essere testarda

TABLE OF CONTENTS
ABSTRACT 6
PROLOGUE 8
PART 1 – THEORETICAL FRAMEWORKS & LITTERATURE REVIEW 10
CHAPTER 1: AN INTRODUCTION TO THE COGNITIVE NEUROSCIENCE OF AGING 11
1.1. A DEFINITION OF THE WORD “AGING” FROM THE COGNITIVE NEUROSCIENCE PERSPECTIVE 11
1.2. THE AGING PROCESS AS DESCRIBED FROM COGNITIVE NEUROSCIENCE: THEORIES AND MODELS 13
1.2.1. The right hemi-aging model 14
1.2.2. The HAROLD model 15
1.2.3. The PASA pattern 16
1.2.4. The CRUNCH hypothesis 17
1.2.5. The STAC theory 19
1.2.6. The cognitive reserve theory 20
1.3. A BRIEF OVERVIEW 21
REFERENCES 22
CHAPTER 2: TASK-DEPENDENT AND TASK-INDEPENDENT AGE-RELATED EFFECTS: EVIDENCE
FROM A NEW QUANTITATIVE META-ANALYTIC APPROACH 25
2.1. INTRODUCTION 25
2.1.1. The state of the art in cognitive neuroscience of aging: some numbers 25
2.1.2. Qualitative or quantitative meta-analysis? 27
2.2. AIM 29
2.3. MATERIALS AND METHODS 30
2.3.1. Data 30
2.3.2. Conversion to MNI Template 31
2.3.4. Labeling clusters 33

2.3.5. Statistical analysis 33
2.4. RESULTS 34
2.5. DISCUSSION 40
2.5.1. Task-independent age effects 40
2.5.2. Task-dependent age effects 41
2.6. CONCLUSION 42
REFERENCES 44
PART 2 – NORMAL AGING 48
CHAPTER 3. WITH TIME ON OUR SIDE? TASK-DEPENDENT COMPENSATORY PROCESSES IN
GRACEFUL AGING 49
3.1. INTRODUCTION 49
3.1.1. Brain aging: one or several factors? 49
3.1.2. Age-related changes in cognition and neural activity: compensation or de-differentiation? 51
3.1.3. The relationship between age-related neurofunctional and neuromorphological changes 53
3.2. AIM OF THE STUDY 53
3.3. MATERIALS AND METHODS 56
3.3.1. Participants 56
3.3.2. Materials 56
3.3.2.1. Neuropsychological assessment 56
3.3.2.2. Experimental tasks 56
3.3.3. Procedure 58
3.3.4. fMRI methods 58
3.3.5. VBM methods 59
3.3.6. Statistical analyses 59
3.3.6.1. Behavioural data 59
3.3.6.2. fMRI data 60
II

3.3.6.3. VBM data and Small-volume correction analyses 61
3.4. RESULTS 64
3.4.1. Neuropsychological and behavioural results 64
3.4.2. fMRI results 64
3.4.2.1. Main effects 64
3.4.2.2. Neurofunctional age-related differences 65
3.4.2.3. Voxel-based morphometry results 71
3.4.2.4. Overlap between functional and grey matter atrophy findings: VBM-based small-
volume corrected fMRI results. 72
3.5. DISCUSSION 74
3.5.1. One or more neural patterns for compensatory processes in the aging brain? 75
3.5.2. Compensatory processes: attentional overload or adoption of multiple strategies, or both? 76
3.5.3. Grey matter atrophy and functional anatomical patterns of aging. 77
3.6. CONCLUSIONS 78
REFERENCES 79
APPENDIX A 85
CHAPTER 4: THE HAROLD MODEL: REAL OR APPARENT REDUCTION OF FUNCTIONAL
ASYMMETRIES? 91
4.1. INTRODUCTION 91
4.1.1. The Hemispheric Asymmetry Reduction in Older adults as described in the literature 91
4.1.2. Is HAROLD really HAROLD? Methodological issues in the assessment of functional
lateralization 94
4.1.3. What is missing in the HAROLD model? 97
4.2. AIM 98
4.3. MATERIALS AND METHODS 98
4.3.1. Participants 98
III

4.3.2. Materials, procedure and fMRI methods 98
4.3.3. Statistical analyses 99
4.4. RESULTS 101
4.4.1. Statistical Lateralization Map 101
4.4.2. Between-group comparisons 102
4.5 DISCUSSION 107
4.5.1. Reduction of functional lateralization and compatibility with the HAROLD model 107
4.5.2. Is the PFC the only target of HAROLD? 109
4.5.3. Does HAROLD manifest itself also in semantic memory tasks? 110
REFERENCES 113
PART 3 – PATHOLOGICAL AGING 115
CHAPTER 5: THE OLD BRAIN WHO STILL PLAYS AT BEING YOUNG: NEUROFUNCTIONAL AND
NEUROMORPHOLOGICAL EVIDENCE OF THE LACK OF COMPENSATION IN PATHOLOGICAL AGING
116
5.1. INTRODUCTION 116
5.1.1. Compensatory processes and the adaptive aged brain 116
5.1.2. What when something goes wrong: imaging studies on compensatory processes in MCI 120
5.1.3. Calls for a clarification of the concept 123
5.2. AIM OF THE STUDY 125
5.3. MATERIALS AND METHODS 126
5.3.2. Materials 127
5.3.3. Statistical analyses 127
5.3.3.1. Neuropsychological and Behavioural data 127
5.3.3.2. fMRI data 128
5.3.3.3. Small volume correction and the assessment of compensation 129
5.3.3.4. VBM data 130
IV

5.3.3.5. Correlational analyses 130
5.4. RESULTS 134
5.4.1. Neuropsychological and behavioural results 134
5.4.1.1. Neuropsychological battery 134
5.4.1.2. Behavioural performance 137
5.4.2. fMRI analyses and SVC results 137
5.4.2.1. Common Areas 138
5.4.2.2. Effect of Pathology 143
4.2.3. Assessment of compensation (small volume correction analysis) 144
5.4.3. Voxel-Based Morphometry results and correlational analyses 151
5.4.3.1. Voxel-Based Morphometry (VBM) results 151
5.4.3.2. Correlational analyses 152
5.5. DISCUSSION 153
5.5.1. Are aMCIs able to flexibly compensate? 154
5.5.2. Is there any link between functional inflexibility and neuroanatomical atrophy? 155
REFERENCES 158
CHAPTER 6: TAKE HOME MESSAGE 170
REFERENCES 173
VI

Abstract
In the last decade, graceful aging has often been associated with frontal hyperactivations in working- and episodic
long-term memory tasks, a compensatory process, according to some, that allows the best normal olders to perform
these tasks at a juvenile level, in spite of the natural cortical impoverishment.
It remains to be established, however, whether the frontal hyperactivation is the only possible neurofunctional
manifestation of compensatory processes in halthy aging.
In this thesis I present a systematic investigation of this issue and related issues on pathological aging seen in
MCI.
I first re-assessed the results of 23 recent neuroimaging papers on normal aging using a quantitative meta-
analytic approach that allowed us to distinguish between task-dependent and task-independent age-related
hyperactivations in healthy olders (Chapter 2). In particular, task-independent hyperactivations emerged in the
prefrontal cortex (PFC) in line with the results commonly described in international litterature, while task-dependent
hyperactivations emerged in brain regions beyond the prefrontal areas.
Further, we investigated more directly the existence of task-specific neurofunctional manifestations of
compensatory processes in a new fMRI / VBM study (Chapter 3). In this study, 24 young and 24 healthy elderly
participants were compared. Graceful aging was explored by investigating domains where most healthy olders perform
like youngers (e.g. lexical-semantic knowledge) and tasks that are typically more challenging, like episodic long-term
recognition memory tasks. With voxel-based morphometry we also studied to what extent changes of fMRI activation
were consistent with the pattern of brain atrophy. We found that hyperactivations in the group of healthy olders were
not restricted to the frontal lobes, rather they presented with task-dependent patterns. Moreover, only hypoactivations
did systematically overlap with regional atrophy. On the basis of these results we suggest that compensatory
processes associated with graceful aging are not necessarily a sign of early saturation of executive resources, if this
saturation was to be represented by a systematic frontal hyperactivation.
The role of the PFC over-recruitment and age-related neurofunctional changes in healthy olders was further
investigated in Chapter 4. In particular in this study we reviewed the neurofunctional data collected in the third Chapter
in the light of the HAROLD model (Hemispheric Asymmetry Reduction in Olders). Again, the data clearly suggested
that the manifestation of age-related neurofunctional changes of functional lateralization in healthy olders is not
6

exclusively restricted to the frontal areas, rather these are distributed across the entire brain volume in a task-related
manner.
Finally, in order to better address neurofunctional and neuroanatomical changes in pathological aging and to
create a link with theoretical frameworks that describe graceful aging, we compared behavioural, neurofunctional and
neuroanatomical data of 24 healthy olders and 9 aMCI patients, challenged with the same lexical-semantic and
episodic long-term memory tasks used in Chapter 3. The between groups differences were analysed in the light of our
previous findings on the neural pattern of compensatory processes in healthy aging (described in Chapter 3). A
systematic pattern emerged: aMCI patients showed over-activations in parts of the task-specific neural networks that
are dysfunctional in highly-performing healthy olders, while they under-recruited the task-specific compensatory neural
networks typically over-activated by healthy older controls. Moreover, the over-recruitments of areas which became of
no use in healthy aging showed a negative correlation with the gray matter density in the medial temporal lobe
structures. These results are discussed in terms of lack of neural plasticity in pathological aging.
I conclude my dissertation with chapter 6 where I propose a neurocognitive account of healthy and pathological
aging in terms of compensatory processes and neural plasticity.
7

Prologue
Maurice Chevalier said once: “Old age isn't so bad when you consider the alternative”. Actually he might
be right, but one has to admit that “old age” is a quite complicated period of the human life. When getting old
a person has necessarily to cope with a series of changes that can be more or less significant. This coping
process can be influenced by a large variety of factors making it more or less successful.
In a society that is projected to growing older and older in the next fifty years1, it is not surprising that the
study of these factors and of their interactions became, in the last decade, one of the most studied topics in
life sciences.
In this dissertation I will explore some of the different manifestations of the “old age” (healthy aging versus
pathological aging like the Mild Cognitive Impairment, MCI) looking at their cognitive and neuroanatomical
changes. These changes will be described in the light of recent neurocognitive theories and models with
particular attention to the concept of “compensatory processes”.
1 In the EUROPOP2008 convergence scenario, produced by Eurostat, the population projections describe the possible
future demographic developments in the European Union from 2008 to 2060. The researchers estimated that in the European Union the number of over-65 citizen will pass from the 17.1% of the 2008, to the 30% of the 2060.
8

9

PART 1 – THEORETICAL FRAMEWORKS & LITTERATURE REVIEW
- PART 1 -
THEORETICAL FRAMEWORKS
&
LITTERATURE REVIEW
10

CHAPTER 1: AN INTRODUCTION TO THE COGNITIVE NEUROSCIENCE OF AGING
1.1. A definition of the word “aging” from the cognitive neuroscience perspective
Aging has been defined as the accumulation of morphological and functional changes in cellular and
extracellular components, in regulatory systems and in homeostatic mechanisms that can be attributed to
genetic features, to the environment and to different experiences troughout the lifespan (Harman 2001),
i.e. a process that is genetically determined and environmentally modulated and that, as a consequence,
may manifest itself with several different outcomes. Although at a first sight this definition might seem
related only to the biological changes that occur during the life-span, the same definition may be applied
also to account for the cognitive changes that emerge in the “old-age”. Indeed, from a relatively simplistic
point of view, age-related changes within the cognitive domain are not anything else other than the
manifestation of underlying neural and biological changes that can be triggered either by genetic or by
environmental factors.
In the past, several studies have focused on cognitive and biological age-related changes, but the
relationships between these two aspects became a main topic just in the last decade (see Grady 2008 for a
recent review). The main boost to this area of research came from the development of neuroimaging
techniques that from the late ‘80s allowed researchers to explore the neural basis of cognitive aging in
healthy and pathological elderly people with relatively non-invasive methods. The new discipline binding
together the neuroscience of aging and the psychology of aging are nowadays called “cognitive
neuroscience of aging” and it is concerned with the question of how changes in neural structures and
processes map onto age-related behavioural changes (Figure 1.1).
11

Figure 1. 1. A simple model of neurocognitive aging (modified from Cabeza, in press).
Recently Cabeza has proposed a simple model of aging as described by cognitive neuroscience
(figure 1.1, Cabeza in press). This simple model presents two main components: brain and cognition, both
of them divided into structures and processes. The former, i.e. structures, represents the stable
components of the system, like neural cell in the brain or memory stores in cognition, the latter, i.e.
processes, represents the dynamic aspects, like for example blood flow in the brain and rehearsal process
in short-term memory. Although theoretically separated, processes and structures are inevitably related to
one another in a bidirectional way.
Moreover, there is a bidirectional connection between brain and cognition. As a consequence, two
distinct categories of age-related effects can exist: (i) neurogenic effects and (ii) psychogenic effects. The
neurogenic effects represent a change in the brain (either structures or processes) that leads to a change
in the cognitive domain. For example, a progressive loss of grey matter density in the hippocampal
structures that would cause progressive episodic long-term memory impairment. On the contrary, the term
12

psychogenic effect represents a change in cognition that affects the brain. For example, learning a new
skill may boost the creation of new neural networks.
These two effects (i.e. neurogenic and psychogenic) may influence each other giving rise to a chain of
events (Cabeza in press) that can resemble a chicken-egg problem (as it is difficult to disentangle whether
the change was at first due either to neurogenic or to psychogenic effects), but that can be explored using
different methodological approaches such as functional neuroimaging techniques, structural neuroimaging
methods, classical neuropscyhcological and behavioural studies.
Notwithstanding the different methodological approaches that can be used to explore the effects of
aging on brain and cognition, the identification of both psychogenic and neurogenic processes in aging
contributed to describe the aging brain as a dynamic organism that can respond to neural insults and
environmental challenges by engaging a continuous functional reorganization that can be more or less
successful in term of behavioural outcomes. This is to say that in the last decade, we’ve passed from a
description in term of losses and decline, to the realization that aging may show unexpected
manifestations of neural plasticity.
1.2. The aging process as described from cognitive neuroscience: theories
and models
With the development of neuroimaging techniques and as a consequence of cognitive neuroscience, a
large number of neurofunctional and neuromorphological evidence of the changes underlying healthy and
pathological aging were collected giving rise to different neurocognitive models and hypotheses.
Here I’ll provide a short review of the main ones.
13

1.2.1. The right hemi-aging model
One of the most reliable results in cognitive neuroscience is the fact that brain hemispheres are
functionally asymmetric (Rosen 1996). There is some evidence suggesting that the hemispheric functional
lateralization may be due to a reduced inter-hemispheric connectivity coupled with a greater intra-
hemispheric one (Rilling and Insel 1999). In particular, it is generally held that the left hemisphere is more
involved in the processing of verbal information, while the right hemisphere seems to be more related to
visuo-spatial processing (Galaburda, Rosen et al. 1990; Gazzaniga 2000).
Within this general theoretical framework, during the past thirty years it has been suggested that the
progressive cognitive decline in aging may be the result of a progressive neural impairment that would affect
predominantly the right hemisphere (Goldstein and Shelly 1981).
This assumption is nowadays known as the right hemi-aging model and it was originated mainly from
behavioural and neuropsychological studies that have tried to characterise the effect of aging on verbal and
spatial tasks.
For instance, Goldstein and Shelley (1981) used the Wechsler Adult Intelligence Scale (WAIS) to
explore the cognitive differences between young and elderly healthy adults. When compared with young
adults, elderly participants were more impaired in the visuo-spatial subtests rather than in the verbal ones,
suggesting that the right hemisphere - known to be predominantly involved in visuo-spatial processing - was
more affected by aging than the left one. The studies investigating the effect of aging on perceptive skills
used dichotic listening tasks to show that free-recall in elderly is influenced by the side of stimulation. In
particular, Clark and Knowles (1973) observed age-related declines in memory performance when verbal
material was presented to the left ear (and as a consequence mainly processed by the right hemisphere).
Weller & Latimer-Sayer (1985) investigated motor skills as functions of age showing that abilities
associated with the right hemisphere were more affected by aging when compared with those associated
with the left hemisphere.
The right hemi-aging hypothesis has also been studied in relation to emotional processing. For instance
McDowell and colleagues (1994) explored recognition of facial emotional expression both in young and
14

elderly participants showing that, while accurate in processing positive emotions, elderly subjects where
impaired in the perception of negative emotions. The authors interpreted these results within the context of
the right hemisphere hypothesis of emotional processing (i.e. emotions are predominantly processed in the
right hemisphere independently from the emotional valence) suggesting that the right-hemi aging model
does not completely fulfil this pattern of results.
To summarise, these findings seem to suggest that the right hemisphere is more affected by aging.
However, other studies (Elias and Kinsbourne 1974; Park, Lautenschlager et al. 2002) showed that the
difference between verbal and spatial tasks disappears when variables like task-complexity are matched, or
when their contribution to behavioural performance is controlled.
In addition, it should be also noted that this exquisitely anatomical hypothesis was not supported by
recent neurofunctional studies (Dolcos, Rice et al. 2002).
Thus, in the last few years this model has been relatively abandoned.
1.2.2. The HAROLD model
The problem of brain functional lateralization in aging has been recently further explored by Cabeza.
The author in 2001 proposed the so called HAROLD model, an acronym which stands for Hemispheric
Asimmetry Reduction in Older Adults (Cabeza 2002). This model is based on the results of activation
imaging studies within the episodic long-term memory (eLTM), working memory (WM), perception and
inhibitory control domains (see Cabeza 2001 for a review) and it suggests that older adults tend to have a
more bilateral pattern of neural activations, usually in the prefrontal cortex (PFC), when compared to young
participants. Moreover, the author suggests that the decrement in functional lateralization within the PFC is
modulated by the task.
For example, according to the well known HERA model (Hemispheric Encoding Retrieval Asymmetry,
Nyberg, Cabeza et al. 1996) eLTM encoding is left lateralized, while eLTM-retrieval is usually associated
with the activity of right PFC. In elderly participants this lateralization seems to disappear because of an
additional activation of the right PFC in eLTM encoding, and of an additional left PFC activation in eLTM
15

retrieval. The outcomes of these age-related neurofunctional changes end up in the same results, i.e. a
reduction of the PFC lateralization.
Contrary to the right-hemi aging model, the HAROLD model assumes that the change in brain activity
does not reflect a disruptive effect of aging over brain structures, but it rather represents the neural
manifestation of compensatory processes (Cabeza 2002), thus the author attribute the decrement in
functional lateralization to psychogenic effects rather than to neurogenic effects.
This model will be further described and discussed in the fourth chapter of this dissertation.
1.2.3. The PASA pattern
Another consistent pattern of neural activity associated with aging is the so called PASA pattern, i.e.
posterior-anterior shifting in aging, that represents a significant reduction of neural activity in occipito-
temporal areas coupled with a significant increment of frontal activations. This pattern was described for the
first time by Grady (1994) using a PET study based on a visual perception task. Since this initial paper, the
PASA pattern was replicated in several studies investigating age-related changes in neural activity during
visuo-spatial processing (Levine, Beason-Held et al. 2000; Madden, Whiting et al. 2004), working memory
tasks (Rypma and D'Esposito 2000; Grossman 2002), eLTM tasks (Cabeza, Grady et al. 1997; Anderson,
Iidaka et al. 2000; Morcom, Good et al. 2003).
This result has been traditionally interpreted in term of compensatory processes, i.e. the aging process
would led to an hypoactivation of the posterior areas that the olders would face by means of the additional
activation of frontal regions.
Although intriguing, this hypothesis has been recently debated. Indeed, some authors assumed that
the recruitment of frontal regions would be an effect of task difficulty rather than a specific effect of aging
(Davis, Dennis et al. 2008). This may be the case not only when the olders’ behavioural performance is
less adequate than the youngers’ one, but also when elderly participants perform similarly to young
people, as they might achieve a good level of accuracy by recruiting a greater amount of cognitive
resources (thus, in this case the task would be more demanding for elderly subjects).
16

Moreover, from the previous studies it was not possible to distinguish whether PASA reflects
compensation or de-differentiation processes2, or both.
These issues were recently addressed in an fMRI sudy by Davis and colleagues (2008). The authors
controlled both for performance accuracy, both for confidence rating in order to have a better measure of
objective and perceived tasks difficulty. Moreover, they directly correlated behavioural performance with
BOLD signal both in anterior and in posterior regions in order to evaluate whether the PASA pattern could
be interpreted in term of compensation processes. The results of the correlational analysis seem to
support the compensatory hypothesis, suggesting that the age-associated additional activation of frontal
regions reflects the ability to re-allocate the neural resources in order to face with the detrimental
functioning of the posterior regions.
1.2.4. The CRUNCH hypothesis
The issue about compensatory processes has been addressed also from a different perspective: the so
called CRUNCH hypothesis (compensatory-related utilization of neural circuits hypothesis, Reuter-Lorenz
and Cappell 2008). In this perspective, the aging brain would “recruit more neural resources to achieve
computational output equivalent to that of a younger brain” (Reuter-Lorenz et al 2008, page 179).
This assumption starts from the well known evidence of a direct correlation between task demand and
BOLD response in healthy young subjects. Such a correlation would exist also in healthy elderly, but with a
different slope and asymptote. Thus, the healthy elderly subjects would recruit additional areas even when
performing the task at the easier level. This early over-recruitment would allow the olders to maintain a level
of performance similar to the one of young subjects. However, as the task-demand increases, older adults
would reach a sort of plateau corresponding to the highest possible level of activation. At this point their
2 The compensation hypothesis (Grady, C. L. (2008). "Cognitive neuroscience of aging." Ann N Y Acad Sci 1124: 127-44.) assumes that the overactivated areas in elderly people represent the neurofunctional manifestation of compensatory processes that would allow old-adults to maintain a good level of performance. The de-differentiation hypothesis (Li, S. C. and U. Lindenberger (1999). Cross-level unification: A computational exploration of the link between deterioration of neurotransmitter systems dedifferentiation of cognitive abilities in old age. Cognitive Neuroscience of Memory. L. G. N. Markowitsch and J. H. Seattle, WA, US, Hogrefe & Huber Publishers: 103-146.) states that the hyperactivations in elderly would be the consequence of a progressive deterioration in neurotransmission that would led to a decrement in the signal-to-noise ratio. This process would cause the impossibility of recruiting specific neural networks when performing a task.
17

performance would inevitably fall because of the impossibility to meet the additional demands of the task
(figure 1.2).
This assumption has been recently tested in a study Schneider-Garces and colleagues (2009) where
elderly and young participants were invited to perform a working memory task at different cognitive loads.
Results showed that, contrary to young participants, elderly participants reached an asymptote in behaviour
and in the neural activity of the occpital cortex, PFC and dorso-lateral paietal cortex at lower cognitive loads
than young subjects. These findings are in line with Reuter-Lorenz’s proposal suggesting that the different
utilization of task-specific neural circuits in young and old healthy adults may be associated with task-
demand and behavioural outcome.
Figure 1.2. An exemplification of the age-related changes in the BOLD response and in the behavioural performance (modified from Reuter-Lorenz et al 2008).
Although intriguing, this recent hypothesis has been only partly explored. More work has to be done in
order to evaluate whether these results can be generalized even at the neurocognitive patterns emerging
from other cognitive domains.
18

1.2.5. The STAC theory
The most recent neurocognitive theory addressing the relationship between cognitive and
neurofunctional age related changes is the so called STAC theory (scaffolding theory of aging and cognition)
proposed by Park and Reuter-Lorenz (2009). This theory originates from the concept of scaffolding, i.e. “a
process that results in changes in brain function through strengthening of existing connections, formation of
new connections, and disuse of connections that have become weak or faulty” (Park and Reuter-Lorenz,
2009, page 175). The authors linked this supposed general property of the human brain to the aging
processes, suggesting that the olders may maintain a good level of performance, despite neural
impoverishment, thanks to the engagement of compensatory scaffolding that would manifest itself with the
recruitment of additional brain regions shoring up “the declining structures whose functioning has become
noisy, inefficient or both” (Park and Reuter-Lorenz, 2009, page 183).
Thus, this theory represents the first systematic attempt of linking functional, structural, cognitive
changes in aging, with particular attention to the concept of compensatory processes in healthy seniors
(Figure 1.3).
Moreover, the authors suggest that age-related scaffolding may be interpreted in term either of
complementary, or of alternative ways to perform a task.
On the basis of these assumptions, the authors proposed a series of predictions:
1) scaffolding is a direct response to the magnitude of neural insults that occur with age;
2) scaffolding is not arbitrary, thus the brain structures are not completely interchangeable;
3) age-related scaffolds may show more site variability than does the primary site of activation;
4) younger brain that use scaffolding characteristic of older adults are at risk for poorer performance and
accelerated aging;
5) compensatory scaffolding can both be created and dissipated by training.
The large part of these predictions still needs to be explored; part of them will be discussed in the third
chapter and in the fifth chapter of this dissertation.
19

Figure 1. 3. The conceptual model of the scaffolding theory of aging and cognition (STAC) as proposed by Park and Reuter-Lorenz (2009, page184).
1.2.6. The cognitive reserve theory
Contrary to the theoretical frameworks described so far, the cognitive reserve hypothesis is associated
with a more general cognitive and neuropsychological topic that stems from the observation of a non-
systematic relationship between the degree of brain pathology and its clinical and behavioural
manifestations. Classically, the models describing the concept of reserve can be classified in two distinct
categories: (i) passive models, (ii) active models.
The most articulated passive model is the one proposed by Satz (1993) which is based on the concept
of brain reserve capacity (BRC): a sort of theoretical capacity, that can be described in term of brain size
and synapses count, and that is considered as a protective factor. In this perspective, two patients having
the same amount of brain damage, could manifest different clinical pattern because of a different
underlying BRC, i.e. the patient having a higher BRC will be less impaired by the brain damage because
its higher BRC will partly protect him from the injury.
20

This model has been used also to account for the incidence of Alzheimer’s disease (AD), suggesting
that the neurobiological pathology typical of this dementia might start many years before its clinical
manifestation, and that the onset of dementia might be modulated by reserve factors such as brain size
and head circumference (Stern 2009).
On the contrary, the active models do not describe cognitive reserve as something predetermined, but
as the ability of a brain to face with its damage. In this perspective, the cognitive reserve has been defined
as “the ability to optimize or maximize performance trough differential recruitment of brain networks, which
perhaps reflects the use of alternative cognitive strategies” (Stern 2002). Within this model, the clinical
manifestation of pathological aging, like for example AD, would be explained in terms of impossibility to
recruit alternative brain networks to face with the progressive neurobiological impairment (this aspect will
be further discussed in the fifth chapter).
1.3. A brief overview
The theoretical frameworks described so far suggest that, notwithstanding the many structural,
functional and cognitive age-related changes, adult age may be characterized by the maintenance of an
adequate level of cognitive functioning. This seems to be related with the possibility of recruiting
compensatory processes and of maintaining a certain level of neural plasticity, i.e. of facing with the
challenges of everyday life by means of alternative neural “pathways”.
Although described by different models and theories, the role of compensatory processes in aging has
become a sort of “constant” in cognitive neuroscience of aging. Thus, in this dissertation compensatory
processes will be further investigated taking into account the theoretical frameworks described so far and
using different methodological approaches.
Starting from a quantitative meta-analytic approach that will help us in reviewing part of the large amount
of functional neuroimaging data collected in peer-reviewed literature, we will explicitly test some of the main
theories and models of cognitive neuroscience of aging both in healthy and in pathological samples.
21

References
Anderson, N. D., T. Iidaka, et al. (2000). "The effects of divided attention on encoding- and retrieval-related
brain activity: A PET study of younger and older adults." J Cogn Neurosci 12(5): 775-92.
Cabeza, R. Neuroscience frontiers of cognitive aging: approaches to cognitive neuroscience of aging. New
frontiers in cognitive aging. R. A. Dixon, L. Backman and L. G. Nilsson. Oxford, Oxford University Press.
Cabeza, R. (2001). Functional neuroimaging of cognitive aging. Handbook of functional neuroimaging of
cognition. R. K. A. Cabeza. Cambridge, MA, MIT Press: 331-377.
Cabeza, R. (2002). "Hemispheric asymmetry reduction in older adults: the HAROLD model." Psychol Aging
17(1): 85-100.
Cabeza, R., C. L. Grady, et al. (1997). "Age-related differences in neural activity during memory encoding
and retrieval: a positron emission tomography study." J Neurosci 17(1): 391-400.
Clark, L. and J. Knowles (1973). "Age differences in dichotic listening performance." J Gerontol 28(2): 173-8.
Davis, S. W., N. A. Dennis, et al. (2008). "Que PASA? The posterior-anterior shift in aging." Cereb Cortex
18(5): 1201-9.
Dolcos, F., H. J. Rice, et al. (2002). "Hemispheric asymmetry and aging: right hemisphere decline or
asymmetry reduction." Neurosci Biobehav Rev 26(7): 819-25.
Elias, M. and M. Kinsbourne (1974). "Age and sex differences in the processing of verbal and nonverbal
stimuli." J Gerontol 29(2): 162-71.
Galaburda, A., G. Rosen, et al. (1990). "Individual variability in cortical organization: its relationship to brain
laterality and implications to function." Neuropsychologia 28(6): 529-46.
Gazzaniga, M. (2000). "Cerebral specialization and interhemispheric communication: does the corpus
callosum enable the human condition?" Brain 123 ( Pt 7): 1293-326.
Goldstein, G. and C. Shelly (1981). "Does the right hemisphere age more rapidly than the left?" J Clin
Neuropsychol 3(1): 65-78.
Grady, C. L. (2008). "Cognitive neuroscience of aging." Ann N Y Acad Sci 1124: 127-44.
22

Grady, C. L., J. M. Maisog, et al. (1994). "Age-related changes in cortical blood flow activation during visual
processing of faces and location." J Neurosci 14(3 Pt 2): 1450-62.
Grossman, M., Cooke A., DeVita C., Alsop D., Detre J., Chen W, Gee J. (2002). "Age-related changes in
working memory during sentence comprehension: an fMRI study." Neuroimage 15: 302-317.
Harman, D. (2001). "Aging: overview." Ann N Y Acad Sci 928: 1-21.
Levine, B., L. Beason-Held, et al. (2000). "Age-related differences in visual perception: a PET study."
Neurobiol Aging 21(4): 577-84.
Li, S. C. and U. Lindenberger (1999). Cross-level unification: A computational exploration of the link between
deterioration of neurotransmitter systems dedifferentiation of cognitive abilities in old age. Cognitive
Neuroscience of Memory. L. G. N. Markowitsch and J. H. Seattle, WA, US, Hogrefe & Huber Publishers:
103-146.
Madden, D. J., W. L. Whiting, et al. (2004). "Age-related changes in neural activity during visual target
detection measured by fMRI." Cereb Cortex 14(2): 143-55.
McDowell, C., D. Harrison, et al. (1994). "Is right hemisphere decline in the perception of emotion a function
of aging?" Int J Neurosci 79(1-2): 1-11.
Morcom, A. M., C. D. Good, et al. (2003). "Age effects on the neural correlates of successful memory
encoding." Brain 126(Pt 1): 213-29.
Nyberg, L., R. Cabeza, et al. (1996). "PET studies of encoding and retrieval: the HERA model." Psychonom.
Bull. Rev 3: 135-148.
Park, D., G. Lautenschlager, et al. (2002). "Models of visuospatial and verbal memory across the adult life
span." Psychol Aging 17(2): 299-320.
Park, D. C. and P. Reuter-Lorenz (2009). "The adaptive brain: aging and neurocognitive scaffolding." Annu
Rev Psychol 60: 173-96.
Reuter-Lorenz, P. and K. Cappell (2008). "Neurocognitive aging and the compensation hypothesis." Current
Directions in Psychological Science 17(3): 177-182.
23

Rilling, J. and T. Insel (1999). "Differential expansion of neural projection systems in primate brain
evolution." Neuroreport 10(7): 1453-9.
Rosen, G. (1996). "Cellular, morphometric, ontogenetic and connectional substrates of anatomical
asymmetry." Neurosci Biobehav Rev 20(4): 607-15.
Rypma, B. and M. D'Esposito (2000). "Isolating the neural mechanisms of age-related changes in human
working memory." Nat Neurosci 3(5): 509-15.
Satz, P. (1993). "Brain reserve capacity on symptom onset after brain injury: A formulation and review of
evidence for threshold theory." Neuropsychology 7: 273-295.
Schneider-Garces, N., B. Gordon, et al. (2009). "Span, CRUNCH, and Beyond: Working Memory Capacity
and the Aging Brain." J Cogn Neurosci.
Stern, Y. (2002). "What is cognitive reserve? Theory and research application of the reserve concept." J Int
Neuropsychol Soc 8(3): 448-60.
Stern, Y. (2009). "Cognitive reserve." Neuropsychologia 47(10): 2015-28.
Weller, M. and D. Latimer-Sayer (1985). "Increasing right hand dominance with age on a motor skill task."
Psychol Med 15(4): 867-72.
24

CHAPTER 2: TASK-DEPENDENT AND TASK-INDEPENDENT AGE-
RELATED EFFECTS: EVIDENCE FROM A NEW QUANTITATIVE META-
ANALYTIC APPROACH
2.1. Introduction
2.1.1. The state of the art in cognitive neuroscience of aging: some numbers
During the last decades the study of age-related changes in brain functioning has become one of the
main topic in cognitive neuroscience, as demonstrated by the large number of papers published in the
international peer-reviewed literature. From 1992, when the first functional neuroimaging activation study on
this topic (Tempel and Perlmutter 1992) appeared in the international literature, to December 2008, about 80
papers exclusively comparing young versus elderly activations had been published3, i.e. a mean of 5 papers
per year, even though the largest part of these papers had been published from 2000 to 2008 (see Figure
2.1).
This large amount of neuroimaging findings, together with a large pool of behavioural studies contributed
to the development of a number of theories and models about the aging processes (see Dennis 2008 for a
review).
To have a clear view of such a wide range of data it is becoming difficult and distinguishing between
general and task-specific age-related effects is even more challenging. For example, several studies report
an age-related decrement of activation within the occipital regions (Grady, Maisog et al. 1994; Grady,
McIntosh et al. 1998; Gunning-Dixon, Gur et al. 2003); however it has still to be established whether this is a
general effect of aging emerging regardless of the task (task-independent age effect), or rather an
epiphenomenon driven by the nature of the task (task-dependent age effect).
3 About the 75% of the studies used fMRI and the remaining 15% used PET.
25

Figure 2.1. Mean number of papers investigating age-related neurofunctional changes comparing exclusively young versus healthy elderly participants.
This issue has been recently addressed by Cabeza and colleagues (Cabeza, Daselaar et al. 2004).
Using fMRI and a pool of three different tasks, i.e. a verbal working memory task, a visual attention task and
an episodic long-term memory retrieval task, they found task-dependent age effects in the right and left
frontal regions in the group of elderly participants, in particular a significant over-recruitment of the left PFC
in the working memory task on the one hand, and of the right PFC during the visual attention task on the
other hand. Moreover, two task-independent age effects were described, i.e. an age-related hypoactivation
in the occipital regions coupled with an age-related hyperactivation in PFC; these latter findings are in line
with the so called PASA pattern (Davis, Dennis et al. 2008; see section 1.2.3 for a brief description).
Accordingly, the authors concluded that both common factors and task-specific factors might play a role in
determining age-related neurofunctional changes.
Although, Cabeza and colleagues’ study (2004) represents a direct attempt to distinguish between task-
dependent and task-independent age effects, it remains a single study based on a sample of 20 young and
26

20 elderly subjects. This is to say that, notwithstanding its important contribution, it does not help in drawing
a clearer picture of the large amount of data collected so far.
Moreover, so far only few studies have tried to systematically review this topic and none of them used a
quantitative approach.
For example, in 2001 Cabeza reviewed a series of 19 PET and fMRI studies published in a period
between the 1994 and 2000. Using a qualitative approach, the author tried to sum up the neural localization
(in term of Brodmann’s regions) of the decrement and enhancement of activations in healthy elderly subjects
across four cognitive domains: visual perception, episodic LTM encoding, episodic LTM retrieval and
working memory (Cabeza 2001). Four years later, Rajha and D’esposito (Rajah and D'Esposito 2005)
reviewed 22 neuroimaging studies published between 1997 and 2004 which investigated age-related
changes in working memory and episodic LTM tasks. However, they focused only on the neurofunctional
changes within the PFC and used a qualitative approach similar to the one used by Cabeza in 2001.
Only recently, Peiffer and colleagues (Peiffer, Maldjian et al. 2008) tried to use a quantitative meta-
analytic approach to review the results of 4 detection tasks applying the Brinley Plot method (Brinley 1965)
to test the neural network underlying the cognitive slowing theory (Salthouse 2000). Although potentially
interesting and quantitatively-based, this method does not seem to be suitable for drawing a more general
picture of the age-related neurofunctional changes as it is based on the analysis of reaction time.
2.1.2. Qualitative or quantitative meta-analysis? As discussed above, it has not yet been drawn a clear edge between task-independent and task
dependent age effects. This lack of knowledge makes difficult to understand which kind of neurofunctional
patterns are typically related with aging across different cognitive domains. Thus, it might be useful to
identify the blueprint of the neurofunctional age-related changes characterized so far by functional
neuroimaging studies. Moreover, a brain-map illustrating consistent findings across tasks, parameters and
experimental designs may be used as a guide for planning new studies and interpreting new results.
27

Such a blueprint might be obtained with the classical review method, i.e. by creating either a table or a
figure containing all the activation peaks reported in the literature, and then by interpreting it at an arbitrary
level of spatial resolution without applying any kind of objective statistic method (see Cabeza et al 2001 for
an example). However, in this case we would be in front of a qualitative meta-analysis which, although
valuable, it would be inevitably invalidated by a certain level of subjectivity.
To overcome these limitations two new automatic methods, designed to classify the data reported in the
international literature, had been developed: (i) the activation likelihood estimation method (Turkeltaub, Eden
et al. 2002) and (ii) the metanalytic approach based on hierarchical clustering (Jobard, Crivello et al. 2003).
Although the starting point of these two automatic classification processes is exactly the same, i.e. the
collection of the activation peaks reported in the literature, they differ in the computational method applied for
calculating the concordance between studies.
In particular, the likelihood estimation method estimates inter-studies consistency by generating a
probability distribution map of the entire brain volume where the value of each voxel corresponds to the
probability that at least one of the points in the original data set (corresponding to the collection of activation
peaks) actually lays within that voxel. This probability is called by the authors “activation likelihood estimate”
(ALE). Once obtained the ALE-map a number between 5000 and 10,000 permutations of the original data
set is created. The average of these permutations constitutes the so called noisy-distribution. In the last
step, the ALE-map is compared to the noisy-distribution in order to evaluate whether it is significantly
different from the random distribution of the activation peaks at a certain threshold (usually p<.001). Thus,
the likelihood estimation method seems to be more appropriate for evaluating the degree of concordance
between studies and whether the resulting neural network is significantly localized or not. Although
potentially interesting this is not the main aim of our study.
A metanalytic approach based on spatial clustering (Jobard, Crivello et al. 2003), on the contrary,
permits to automatically create groups of spatially congruent activation peaks on the basis of the euclidean
distance between the stereotactic coordinates included in the database. The final result is a network of
clusters where each cluster contains a certain number of activation peaks. Even though the metanalytic
28

process based on spatial clustering seems to produce an output similar to the one obtained with the
likelihood estimation method, it has the advantage to permit a further statistical inference on the internal
composition of each cluster. In particular, the cluster composition analysis has the advantage to allow the
assessment of group and task effects, and of the interaction between these two factors. For this reason, the
metanalytic process based on the clustering method seems to be more suitable for distinguishing between
the brain regions (or the clusters) whose activity is modulated by the task (task-dependent age effects) from
those whose activity is systematically determined by the aging process irrespectively of the task of interest
(task-independent age effects).
2.2. Aim
As discussed above, there is some evidence in favour of the existence of task-independent and task-
dependent age effect in graceful aging.
The co-occurrence of these two effects in the aging brain might suggest that both common and specific
aging processes play a role in determining the neurofunctional differences between young and elderly
subjects.
However, this issue needs a more systematic exploration as the vast majority of the studies published
so far do not allow a direct assessment of task-by-age interaction effects.
A possible way to further explore this topic is to review the published studies using an automatic and
quantitative meta-analytic method. To this aim the stereotactic coordinates reported in 23 functional
neuroimaging studies, published between 2000 and 2008 and investigating the effects of aging by
comparing healthy young and elderly subjects, were processed by a hierarchical clustering algorithm. The
composition of each cluster was then further analyzed in order to isolate the clusters showing a significant
task-independent age effect from the clusters showing a significant age-by-task interaction effects. In
particular the former category of clusters was isolated by means of a binomial test, while the latter category
was isolated by means of an exact Fisher’s test.
29

Finally the clusters showing a significant task-independent age effect were further divided in two
categories: (i) clusters predominantly represented by young-related activation peaks and (ii) clusters
predominantly represented by elderly-related activation peaks. The former represents the brain regions
significantly less activated in elderly subjects when compared to young participants (we will refer to them as
hypoactivations), the latter corresponds to the area significantly more activated by elderly participants when
compared to young subjects (we will refer to them as hyperactivations).
2.3. Materials and Methods
2.3.1. Data
A sample including 23 neuroimaging studies, published on peer-reviewed journals from 2000 to 2008
and investigating the neurofunctional age-related changes using either PET or fMRI on young and healthy
elderly participants, was collected. Only the studies reporting the stereotactic coordinates were selected;
among these only the activation peaks emerging from simple effects of task (e.g. episodic long-term memory
encoding > baseline in elderly participants) and from the direct comparisons between groups (e.g. elderly
participants > young participants in episodic long-term memory encoding) were entered in the meta-analytic
process.
As a result, the final working dataset included 899 stereotactic peaks of activation, 468 associated with
young subjects’ neural activity and 431 with elderly participants’ activations. Activation peaks were also
classified according to the experimental task from which they were obtained. We considered as separate
categories in this variable: (a) episodic long-term memory (eLTM) encoding tasks; (b) eLTM retrieval tasks,
(c) semantic long-term memory (sLTM) tasks, (d) language tasks (in which the peaks coming from picture
naming task and lexical decision task were grouped), (e) working memory tasks, (f) executive tasks, (g)
motor tasks and (h) emotion processing tasks.
The main characteristics of these experiments are reported in Table 2.1; this includes the year of
publication, the imaging technique used, the experimental task, the participants sample size and the number
of activation peaks reported.
30

2.3.2. Conversion to MNI Template
Older studies generally reported activation peaks in terms of Talairach space (Talairach and Tournoux
1988), while more recent papers adopted normalization to the Montreal Neurological Institute (MNI) atlas;
therefore a conversion of the Talairach coordinates into the MNI space was applied in order to make the
activation data comparable and homogeneous. To this purpose a MATLAB script implementing the
transformation method as described in http://imaging.mrccbu.cam.ac.uk/imaging/MniTalairach was used.
Table.2. 1. List of the peer-reviewed papers included in the meta-analytic process.
First Author Year Technique Sample size Young
Sample size Elderly Cognitive Domains
Number of
peaks Anderson 2000 PET 12 12 eLTM encoding 75 Cabeza 2000 PET 12 12 eLTM retrieval 21 Reuter-Lorenz 2000 PET 8 16 Working Memory 34 Di Girolamo 2001 fMRI 8 8 Executive Functions 146 Cabeza 2002 PET 12 16 eLTM retrieval 10 Madden 2002 PET 12 12 Language 22 Milham 2002 fMRI 12 10 Executive Functions 72 Stebbins 2002 fMRI 15 15 eLTM encoding 19 Daselaar 2003 fMRI 26 39 eLTM encoding 55 Gunning-Dixon 2003 fMRI 8 8 Emotion Processing 53 Cabeza 2004 fMRI 20 20 Working Memory 21 Grady 2005 PET 12 12 eLTM retrieval 8 Guthches 2005 fMRI 14 13 eLTM retrieval 24 Heuninckx 2005 fMRI 11 10 Motor Control 18 Townsend 2006 fMRI 10 10 Executive Functions 41 Wierenga 2006 fMRI 20 20 Language 26 Dennis 2007 fMRI 16 17 eLTM encoding 52 Dennis 2007a fMRI 12 12 eLTM encoding 36 Davis 2008 fMRI 12 12 eLTM retrieval 5 Dennis 2008 fMRI 16 17 eLTM retrieval 55 Dennis 2008a fMRI 14 14 eLTM encoding 65 Emery 2008 fMRI 10 11 Working Memory 16 Paxton 2008 fMRI 21 20 Working Memory 25
31

2.3.3. Clustering procedure
The hierarchical clustering procedure was implemented under MATLAB 7. The clustering procedure is
based on the spatial proximity of data points, irrespective of their functional meaning (e.g., whether they are
associated with young or elderly participants). The algorithm first computes squared Euclidean distances
between each pair of input data, and then it merges, at each processing step, the two existing clusters
having minimum dissimilarity. Dissimilarity can be measured in several different ways4; here, we adopted the
Ward criterion (1963). This criterion selects, at each processing step, the two clusters whose merging will
produce the minimum increase in the total intra-cluster variance. This iterative process results in a tree
where leaves represent singletons (i.e. clusters made of just one peak of activation), and the root represents
one large cluster including all the 899 activation peaks input to the algorithm. Each level of the tree reports
the clusters created by the algorithm at a specific processing step, i.e. from the step where each cluster is
represented by individual peaks of activation to the big all-inclusive final cluster at the top of the tree (Figure
2.2). To determine the final set of clusters (i.e., the level at which we want to “cut” the cluster tree), we
averaged standard deviations over all clusters for each processing step; starting from the leaves, we moved
up the tree until the average standard deviation in each direction remained below 7.5 mm, following (Jobard,
Crivello et al. 2003); this was done in order to obtain clusters whose dispersion around the centre is
compatible with a standard neuroimaging spatial resolution of about 15 mm.
4 A detailed description of the different dissimilarities criterion that can be found, for instance, in the book: “Cluster analysis for researchers” Romesburg, H. C., Ed. (2004). Cluster analysis for researchers. Morrisville, Lulu Press.
32

Figure 2. 2. An example of dendrogram. At the bottom level the single activation-peaks are represented, while at the top there is a single cluster including all the peaks and intermediate clusters. The dotted line represents the cut-level, i.e. the level of the tree including the final set of clusters.
2.3.4. Labeling clusters
The mean coordinates of each cluster included in the final set were then passed as an input to a
MATLAB script that was developed on purpose for the automatic anatomical labeling of the activation
coordinates. This script interrogates the Automatic Anatomical Labeling (AAL, Tzourio-Mazoyer, Landeau et
al. 2002) template available in the MRIcro visualization software to generate a label for each individual
cluster on the basis of its mean coordinates.
2.3.5. Statistical analysis
Once isolated and labelled, each cluster was analyzed in order to assess the presence of the task-
independent and the task-dependent age-related effects.
To this aim, a contingency table - where columns represented the experimental groups (i.e. young vs
elderly participants) and rows represented the experimental tasks - was created for each cluster. The task-
independent age effects were assessed using a binomial test which allowed us to evaluate whether the
distribution of activation peaks within each cluster was significantly different from the overall proportion of
young- and elderly-related activations included in the whole sample of coordinates (468/899 = .52 for young
and 431/899 = .47 for elderly). The probability was calculated separately for the two groups, the number of
33

peaks associated with either elderly or young was considered as the number of successes in a series of
independent randomly-distributed trials.
On the contrary task-dependent age-related effects were assessed using the Fisher’s exact test (Fisher
1970); this statistical test assesses whether the distribution of one categorical variable (experimental group,
in our case) varies according to the levels of a second categorical variable (experimental task), thus
revealing clusters whose activation peaks are predominantly related with elderly participants in a given task
and with young participants in another task.
2.4. Results
The clustering algorithm identified 57 clusters. The smallest cluster included 5 activation peaks, the
largest 37 (mean cluster size = 15.78±6.7). The mean standard deviation along the three axes (i.e. the X, Y,
Z axes of the stereotactic space) was 7. Table 2.2 (section A, B and C) reports a complete description of the
57 clusters including the mean coordinate of each cluster, the standard deviation, the number of activation
peaks included and the corresponding brain region.
34

Table.2. 2. Neuroanatomical location, ID, central coordinate, standard deviation and cardinality of the 57 clusters that emerged from the meta-analytic process.
A Left hemisphere Right hemisphere Frontal lobe ID x y Z x y z N Superior Frontal gyrus 12 -22 60 -7 9 (11) (12) (7) Middle Frontal gyrus 46 -35 28 38 (7) (6) (7) 22 11 -32 50 12 9 (4) (6) (7) 55 36 50 4 22 (10) (7) (11) 10 33 29 38 17 (7) (6) (9) 40 26 7 50 14 (9) (4) (7) Middle Frontal gyrus/Rectus 29 -9 29 -13 10 (14) (5) (6) Anterior Cingulum 42 -4 52 11 16 (10) (12) (12) Inferior Frontal gyrus, pars orb. 19 37 29 -7 9 (6) (4) (8) Inferior Frontal gyrus, pars tri. 5 -48 33 11 18 (5) (7) (6) 6 -39 26 -1 24 (6) (8) (8) Inferior Frontal gyrus, pars tri. 9 47 27 26 12 (3) (6) (4) Inferior Frontal gyrus, pars op. 21 -49 14 12 11 (4) (6) (6) 20 47 18 9 22 (7) (4) (8) Supplementary Motor Area 23 -1 12 52 35 (4) (6) (8) Precentral gyrus 47 -41 9 31 37 (5) (6) (7) 50 -27 -3 57 13 (6) (9) (5) 41 33 -16 56 19 (8) (12) (8) 45 48 10 31 25 (5) (7) (6) Insula 54 -43 -10 7 24 (10) (8) (9) Rolandic Operculum 33 38 -21 24 8 (10) (7) (8)
35

B Left hemisphere Right hemisphere Parietal and temporal lobe ID x y Z x y z N Postcentral gyrus/Precentral gyrus 51 -45 -18 43 27 (9) (11) (7) 27 -34 -36 58 11 (5) (9) (4) Inferior Parietal lobule 28 -37 -52 43 22 (6) (7) (6) 44 40 -49 46 20 (7) (7) (5) SupraMarginal gyrus 48 -55 -46 25 10 (6) (6) (8) Middle Cingulum 3 0 -20 41 15 (5) (6) (7) 22 -3 31 33 5 (8) (4) (6) Posterior Cingulum 4 12 -38 30 6 (10) (8) (8) Precuneus 17 -6 -46 62 11 (10) (6) (7) 18 -5 -66 55 14 (10) (5) (7) Superior Temporal gyrus 34 51 -14 1 17 (7) (10) (7) Middle Temporal gyrus 52 42 -52 20 13 (12) (11) (7) Inferior Temporal gyrus 49 -55 -51 -6 18 (5) (9) (6) 38 -41 -6 -28 12 (9) (13) (6) 25 49 -56 -7 16 (7) (10) (4) Hippocampus 36 23 -15 -13 22 (7) (11) (8)
36

C Left hemisphere Right hemisphere Occipital lobe, subcortical areas and cerebellum ID x y Z x y z N
Inferior Occipital gyrus 53 -37 -75 -5 19 (4) (8) (5) 2 -19 -95 -7 19 (5) (6) (7) Middle Occipital gyrus 1 -24 -86 9 11 (7) (5) (6) 56 -28 -69 27 27 (8) (8) (12) 26 36 -79 16 9 (6) (4) (6) Superior Occipital gyrus 43 25 -67 45 21 (6) (5) (6) Cuneus 13 1 -91 23 8 (6) (6) (8) Calcarine 15 -6 -42 5 9 (8) (6) (8) 7 21 -93 2 11 (5) (5) (6) Lingual gyrus 31 -28 -43 -1 14 (5) (8) (7) 14 3 -81 4 20 (7) (9) (6) Fusiform gyrus 32 -32 -50 -21 20 (9) (11) (6) 24 29 -52 -8 13 (6) (9) (5) 8 29 -77 -9 12 (7) (6) (7) Amygdala 37 -19 -6 -15 14 (7) (8) (6) Caudate 30 -6 10 3 14 (6) (9) (9) Putamen 39 21 10 8 9 (6) (10) (6) Thalamus 16 -3 -21 2 14 (9) (5) (7) Cerebelum 57 6 -64 -28 11 (15) (7) (7) NoRegion 35 43 -2 -23 9 (7) (9) (6)
37

The statistical analysis on the task-independent age-related effects (i.e. the comparison between
elderly-related activation peaks and young-related one) revealed that three clusters out of 57 included
predominantly young-related activation peaks (cluster 2, 7 and 31), while two out of 57 included mostly
elderly-related activation peaks (cluster 29 and 33). The young-predominant clusters were located in the
posterior brain regions, in the cortex along the right calcarine sulcus, in the left inferior occipital gyrus and in
the left lingual gyrus (Figure 2.3A, in blue) and can be considered as brain regions significantly
hypoactivated by elderly participants. On the contrary the elderly-predominant clusters were located in the
frontal cortex of both hemispheres, in particular in the left middle frontal gyrus (pars orbitalis) and in the right
Rolandic Operculum at the edge with the right insula. (Figure 2.3A, in red). These clusters represent the
brain regions significantly hyperactivated by elderly participants when compared to young subjects. In table
2.3 the composition of each age-predominant cluster is reported.
Table.2. 3. Clusters showing a significant task-independent age effect.
ID Anatomical Label x y z Elderly Young TOT
2 Left Inferior Occipital gyrus -19 -95 -7 3 16 19
(1 Di Girolamo, 2 Madden) (2 Anderson, 2 Dennis, 3 Di
Girolamo, 3 Gunning-Dixon, 6 Madden)
31 Left Lingual gyrus -28 -43 -1 2 10 14
(1 Anderson, 1 Dennis_a) (2 Dennis, 6 Dennis_a, 3 DI Girolamo, 1 Gutches)
7 Right Calcarine Cortex 21 -93 2 2 9 11
(1 Anderson, 1 Madden) (2 Dennis, 3 Di Girolamo, 3 Gunning-Dixon, 1 Madden)
29 Left Middle Frontal gyrus, medial part -9 29 -13 8 2 10
(1 Cabeza, 1 Daselaar, 1
Dennis, 4 Paxton, 1 Wierenga)
(2 Dennis)
33 Right Opercular Cortex 38 -21 24 7 1 8
(3 Anderson,1 Desalaar, 1 Townsend, 1 Wierenga)
(1 Anderson)
38

Figure 2. 3. Clusters showing a significant task-independent (A) and task-dependent (B) effect of aging. Red areas represent clusters predominantly represented by olders' neural activity, while blue regions represent cluster predominantly related to young activations.
Three clusters out of 57 (namely the cluster number 51, 36 and 56) showed a significant age-by-task
interaction effect as revealed by the Fisher’s exact test. These clusters were located in the left postcentral
gyrus, in the right hyppocampus and in the left middle occipital gyrus respectively.
The distribution of the activation peaks across groups and tasks is reported in Table 2.4 and Figure
2.3B.
39

Table.2. 4. Clusters that show a significant task-dependent age effect.
Anatomical Label ID Task categories Hypoactivated by elderly (Young-related peaks)
Hyperactivated by elderly (Elderly-related peaks)
Left Postcentral gyrus/Precentral gyrus 51
eLTM encoding 5 6 11 eLTM retrieval 2 0 2 Executive Functions 6 0 6 Working Memory 0 1 1 Language 1 1 2 Motor Control 0 3 3 Emotion Processing 0 2 2 TOT 14 13 27 Right Hyppocampus/Amygdala 36
eLTM encoding 5 6 11 eLTM retrieval 1 3 4 Emotion Processing 6 0 6 TOT 12 9 22 Left Middle Occipital gyrus 56 eLTM encoding 1 6 7 Eltm retrieval 3 4 7 Executive Functions 5 0 5 Working Memory 0 3 3 Language 1 0 1 Motor Control 0 2 2 TOT 10 15 25
2.5. Discussion
2.5.1. Task-independent age effects
Using a quantitative meta-analytic approach, a sort of cerebral-map, that summarizes the distribution of
activation peaks reported in the literature on cognitive neuroscience of aging, has been drawn. As described
in Table 2.2 this is a quite distributed map, however only few clusters out of the 57 isolated by the clustering
algorithm turned out to be significantly predominant either for young participants or for elderly subjects, as
described in Table 2.3.
In particular, only three clusters, respectively centred in the left inferior occipital gyrus (cluster number
2), in the left lingual gyrus (cluster number 31) and in the right calcarine cortex (cluster number 7), included a
significantly higher number of young-related activation peaks, while only two clusters, centred in the frontal
lobes, were predominantly represented by elderly-related activation peaks (cluster number 29 and 33).
40

The three posterior clusters (i.e. cluster number 2, 31 and 7) represent the brain regions significantly
hypoactivated by elderly participants as they include a higher number of young-related activation peaks. On
the contrary the two anterior clusters (cluster number 29 and 33) represent the brain regions that across the
23 neuroimaging studies reviewed in this meta-analysis are significantly reported to be hyperactivated in
elderly participants.
The pattern of hypo- and hyperactivation that emerged from this clustering method is in line with the so
called PASA pattern, i.e. the posterior-anterior shifting in aging (Davis, Dennis et al. 2008).
Interestingly the replication of the PASA pattern with this quantitative meta-analytic approach is not
driven only by the activation peaks coming from Davis’ study, but it seems to be a rather consistent finding
across studies5. Accordingly, these results suggest that a common feature of healthy aging is the ability of
recruiting supportive neural network, typically located in the frontal regions, in order to face with the
progressive functional impairment of more posterior regions that are associated with early and associative
visual processing.
2.5.2. Task-dependent age effects
As described in the introduction, during the last decade a large number of neuroimaging studies
investigated the neurofunctional changes as the age goes by. However, the most of these studies assessed
age-related neurofunctional changes in healthy aging using only one category of task, thus making
impossible to explicitly test whether the differences between young and elderly subjects had to be
considered as a specific effect of aging (i.e. something general and not strictly dependent by the task of
interest), or rather an effect that is modulated by the experimental task used (task-dependent age effect).
Cabeza and colleagues (2004) explicitly tested this possibility using fMRI and three different cognitive
tasks. They demonstrated that the neurofunctional differences between young and elderly controls in some
brain regions, such as the PFC, may change on the basis of the experimental task. In particular the
5 Cluster number 2 included 19 activation peaks coming from 5 different studies, a similar pattern of activation peaks distribution was found in the cluster number 31, in the number 7 and in the cluster 29. Finally cluster 33 included 8 activation peaks coming from 4 different studies (see Table 2.4 for more details).
41

modulated recruitment of the PFC by elderly participants has been interpreted in terms of additional
recruitment of monitoring resources.
The results of our meta-analysis further support the existence of task-dependent age effects. Indeed, as
reported in Table 2.4, there are some clusters from whose composition emerges a clear task-by-age
interaction effect. Moreover, the 3 clusters showing a significant task-dependent age effect are not
exclusively located in the frontal lobe, extending the concept of age-related neurofunctional plasticity also to
other brain regions.
The existence of interaction effects implicitly suggests that the aging process is not a unitary process
that inevitably and irreversibly changes the activity of a brain region. On the contrary it looks like a complex
phenomenon modulating the brain activity in a task-related manner.
2.6. Conclusion
The results of this meta-analysis suggest that healthy aging is characterized by a co-occurrence of
general changes (i.e. neurofunctional changes that are not influenced by the task of interest) and of task-
dependent neurofunctional changes. This evidence further contributes at describing the aging process as a
complex phenomenon characterized by different level and categories of neurofunctional age-related
changes that may be described also in term of brain plasticity and of co-occurrence of dysfunctional and
functional neural changes. In particular, the first level of neural plasticity is represented by the
hyperactivation of the frontal regions in response to the progressive reduction of activation of the posterior
regions. These plasticity effects seem to be a quite consistent finding across studies and it is not influenced
by the experimental task used.
The second level of neural plasticity, on the contrary, is directly influenced by the task of interest. Thus,
it seems to support the possibility, also for an older brain, to re-allocate its cognitive resources in order to
face with the task-demand. Moreover, it is important to note that the clusters hyperactivated by elderly
participants are not exclusively located in the frontal regions, suggesting that the re-allocation of cognitive
42

resources has not to be intended uniquely as a consequence of difficulty, or controlled executive processes,
but rather as the possibility of recruiting different neural networks.
These issues will be discussed also in the next chapter.
Acknowledgement
The matlab scripts used for the clustering process and for the labeling process had been developped by
Isabella Cattinelli and Prof. Alberto Borghese from the Computer Science Department of the University of
Milano.
43

References
Anderson, N. D., T. Iidaka, et al. (2000). "The effects of divided attention on encoding- and retrieval-related
brain activity: A PET study of younger and older adults." J Cogn Neurosci 12(5): 775-792.
Brinley, J. F. (1965). Cognitive sets, speed and accuracy of performance
in the elderly. Behavior, Aging, and the Nervous System. A. T. Welford and J. E. Birren, Thomas, Springfield,
Ill, USA.
Cabeza, R. (2001). Functional neuroimaging of cognitive aging. Handbook of functional neuroimaging of
cognition. R. Cabeza, Kingstone, A. Cambridge, MA, MIT Press: 331-377.
Cabeza, R., N. Anderson, et al. (2002). "Aging gracefully: compensatory brain activity in high-performing
older adults." Neuroimage 17(3): 1394-1402.
Cabeza, R., N. D. Anderson, et al. (2000). "Age-related differences in neural activity during item and
temporal-order memory retrieval: a positron emission tomography study." J Cogn Neurosci 12(1): 197-
206.
Cabeza, R., S. M. Daselaar, et al. (2004). "Task-independent and task-specific age effects on brain activity
during working memory, visual attention and episodic retrieval." Cereb Cortex 14(4): 364-375.
Daselaar, S. M., D. J. Veltman, et al. (2003). "Neuroanatomical correlates of episodic encoding and retrieval
in young and elderly subjects." Brain 126: 43-56.
Davis, S. W., N. A. Dennis, et al. (2008). "Que PASA? The posterior-anterior shift in aging." Cereb Cortex
18(5): 1201-1209.
Dennis, N. A., Cabeza, R. (2008). Neuroimaging of healthy cognitive aging. Handbook of aging and
cognition. F. I. M. Craik, Salthouse, T. A. Mahwah, NJ, Erlbaum: 1-54.
Dennis, N. A., S. Daselaar, et al. (2007). "Effects of aging on transient and sustained successful memory
encoding activity." Neurobiol Aging 28(11): 1749-1758.
Dennis, N. A., S. M. Hayes, et al. (2008). "Effects of aging on the neural correlates of successful item and
source memory encoding." J Exp Psychol Learn Mem Cogn 34(4): 791-808.
44

Dennis, N. A., H. Kim, et al. (2007). "Effects of aging on true and false memory formation: an fMRI study."
Neuropsychologia 45(14): 3157-3166.
Dennis, N. A., H. Kim, et al. (2008). "Age-related differences in brain activity during true and false memory
retrieval." J Cogn Neurosci 20(8): 1390-1402.
DiGirolamo, G. J., A. F. Kramer, et al. (2001). "General and task-specific frontal lobe recruitment in older
adults during executive processes: a fMRI investigation of task-switching." Neuroreport 12(9): 2065-
2071.
Emery, L., T. J. Heaven, et al. (2008). "Age-related changes in neural activity during performance matched
working memory manipulation." Neuroimage 42(4): 1577-1586.
Fisher, R. A., Ed. (1970). Statistical Methods for Research Workers. Edinburgh, Oliver & Boyd
Grady, C. L., J. M. Maisog, et al. (1994). "Age-related changes in cortical blood flow activation during visual
processing of faces and location." J Neurosci 14(3 Pt 2): 1450-1462.
Grady, C. L., A. R. McIntosh, et al. (1998). "Age-related changes in regional cerebral blood flow during
working memory for faces." Neuroimage 8(4): 409-425.
Grady, C. L., A. R. McIntosh, et al. (2005). "Task-related activity in prefrontal cortex and its relation to
recognition memory performance in young and old adults." Neuropsychologia 43(10): 1466-1481.
Greenwood, P. M. (2007). "Functional plasticity in cognitive aging: review and hypothesis." Neuropsychology
21(6): 657-673.
Gunning-Dixon, F. M., R. C. Gur, et al. (2003). "Age-related differences in brain activation during emotional
face processing." Neurobiol Aging 24(2): 285-295.
Gunning-Dixon, F. M. and N. Raz (2003). "Neuroanatomical correlates of selected executive functions in
middle-aged and older adults: a prospective MRI study." Neuropsychologia 41(14): 1929-1941.
Gutchess, A. H., R. C. Welsh, et al. (2005). "Aging and the neural correlates of successful picture encoding:
frontal activations compensate for decreased medial-temporal activity." J Cogn Neurosci 17(1): 84-96.
45

Heuninckx, S., N. Wenderoth, et al. (2005). "Neural basis of aging: the penetration of cognition into action
control." J Neurosci 25(29): 6787-6796.
Jobard, G., F. Crivello, et al. (2003). "Evaluation of the dual route theory of reading: a metanalysis of 35
neuroimaging studies." Neuroimage 20(2): 693-712.
Madden, D. J., L. K. Langley, et al. (2002). "Adult age differences in visual word identification: functional
neuroanatomy by positron emission tomography." Brain Cogn 49(3): 297-321.
Milham, M. P., K. I. Erickson, et al. (2002). "Attentional control in the aging brain: insights from an fMRI study
of the stroop task." Brain Cogn 49(3): 277-296.
Paxton, J. L., D. M. Barch, et al. (2008). "Cognitive control, goal maintenance, and prefrontal function in
healthy aging." Cereb Cortex 18(5): 1010-1028.
Peiffer, A. M., J. A. Maldjian, et al. (2008). "Resurrecting brinley plots for a novel use: meta-analyses of
functional brain imaging data in older adults." Int J Biomed Imaging 2008: 167078.
Rajah, M. N. and M. D'Esposito (2005). "Region-specific changes in prefrontal function with age: a review of
PET and fMRI studies on working and episodic memory." Brain 128(Pt 9): 1964-1983.
Reuter-Lorenz, P. A., J. Jonides, et al. (2000). "Age differences in the frontal lateralization of verbal and
spatial working memory revealed by PET." J Cogn Neurosci 12(1): 174-187.
Romesburg, H. C., Ed. (2004). Cluster analysis for researchers. Morrisville, Lulu Press.
Salthouse, T. A. (2000). "Aging and measures of processing speed." Biol Psychol 54(1-3): 35-54.
Stebbins, G. T., M. C. Carrillo, et al. (2002). "Aging effects on memory encoding in the frontal lobes." Psychol
Aging 17(1): 44-55.
Talairach, J. and P. Tournoux (1988). A co-planar stereotactic atlas of the human brain. Stuttgart, Thieme
Verlag.
Tempel, L. W. and J. S. Perlmutter (1992). "Vibration-induced regional cerebral blood flow responses in
normal aging." J Cereb Blood Flow Metab 12(4): 554-561.
Townsend, J., M. Adamo, et al. (2006). "Changing channels: an fMRI study of aging and cross-modal
attention shifts." Neuroimage 31(4): 1682-1692.
46

Turkeltaub, P. E., G. F. Eden, et al. (2002). "Meta-analysis of the functional neuroanatomy of single-word
reading: method and validation." Neuroimage 16(3 Pt 1): 765-780.
Tzourio-Mazoyer, N., B. Landeau, et al. (2002). "Automated anatomical labeling of activations in SPM using
a macroscopic anatomical parcellation of the MNI MRI single-subject brain." Neuroimage 15(1): 273-
289.
Ward, J. H. (1963). "Hierarchical grouping to optimize an objective function." Journal of the American
Statistical Association 58(301): 236–244.
Wierenga, C. E., L. M. Maher, et al. (2006). "Neural substrates of syntactic mapping treatment: an fMRI study
of two cases." J Int Neuropsychol Soc 12(1): 132-146.
47

PART 2 – NORMAL AGING
- PART 2 -
NORMAL AGING
48
CHAPTER 3. WITH TIME ON OUR SIDE? TASK-DEPENDENT
COMPENSATORY PROCESSES IN GRACEFUL AGING
3.1. Introduction
3.1.1. Brain aging: one or several factors?
Brain aging continues to be the focus of much research for cognitive neuroscience and for psychology.
Its study has much capitalized on the availability of modern functional and brain morphometric imaging
techniques (see Cabeza, 2001 and Persson and Nyberg, 2006 for recent reviews). These, together with
refinements of behavioural investigations, are contributing to the development of theories about aging and,
most importantly, they are permitting the explicit testing of specific assumptions.
For example, the joint evidence of cognitive neuropsychology and of modern brain imaging makes it
unlikely interpretations of brain aging such as the one proposed in the so called “unitary factor framework”
(Huppert, 1994a; Huppert, 1994b): here aging was described as a unitary linear process which starts
gradually and in the same measure in all cognitive domains. The process would be similar to the one
observed in a much accelerated way in dementia: accordingly, by the age of 100, or so, almost everyone
should manifest a neurobiological impairment with synaptic loss similar to the one observed in Alzheimer’s
disease (Hedden and Gabrieli, 2004). Several arguments militate against this view: first and foremost, there
are several types of dementia and it is not clear how a global factor, shared by normal and pathological
aging, could bring about, for example, fronto-temporal dementia in one case and Alzheimer’s disease in
another case, or why normal aging should mimic one type of dementia rather than another one. Moreover,
normal elderly subjects can manifest a dissociated decline of either executive or memory function (Glisky et
al., 2001), a finding that cannot be easily accounted by a global effect; in the same vein, MRI voxel-based
morphometry and 18F-FDG PET scans have shown that global brain volume decreases with normal aging;
however, this is also associated with regional effects whereby certain brain regions undergo a progressive
functional and morphological decline while other areas remain relatively spared (Good et al., 2001;
49

Kalpouzos et al., 2009; Raz et al., 1997; Sowell et al, 2003); this is another observation that is incompatible
with a unitary factor framework.
There are more articulated interpretations of brain aging that are currently under the scrutiny of modern
cognitive neuroscience, as for the so-called “multiple factors framework” hypothesis (Buckner, 2004). Here
aging is described as the result of multi-factorial process where genetic, biological, psychological and
environmental factors interact, giving rise to different behavioural and neuropsychological outcomes.
Accordingly, different cognitive functions may be affected by the aging process in different measure, a well
established fact in pathological aging (Graham et al, 2004; Libon et al, 2007).
Inspired by a multiple factors framework, a number of studies classified the age-related cognitive
changes according to the onset of their decline. In particular, three categories of functions have been
proposed: (i) life-long declining functions, (ii) late-in-life declining functions and (iii) life-long stable functions
(see Hedden and Gabrieli, 2004 for a review).
The first category, the life-long declining functions, includes all those cognitive functions that
progressively change across the whole life span, like for example processing speed, working memory and
inductive reasoning (Park et al., 2002; Park et al., 1996).
On the contrary, there are some cognitive functions that decline only in the last decades of life, for
example short-term memory, vocabulary and semantic knowledge and numeric abilities. Data from cross-
sectional studies suggest that these functions remain relatively stable until 60-65 years old, with the slope of
the decline being relatively flat (Lovden et al., 2004). Accordingly, a sudden deterioration of these functions
may be the consequence of a pathological process.
Finally, functions such as autobiographical memory (Fromholt et al., 2003), emotional processing
(Wieser et al., 2006) and automatic memory processes (La Voie and Light, 1994) remain relatively stable
across the life-span. These fall in the life-long stable category, as suggested by Hedden and Gabrieli (2004).
This pattern of age-related cognitive changes is becoming well established in the literature; however, the
mechanisms underlying the differential changes of the different functions across life-span are still unclear.
These may be due to a variable manifestation of compensatory processes (Grady, 2008, Reuter-Lorenz
50

and Cappell, 2008); in other words, the disparity of age-related changes across different cognitive functions
might be mediated by the possibility or by the impossibilitry of finding either alternative or supportive
strategies to deal with the tasks used during psychological testing.
3.1.2. Age-related changes in cognition and neural activity: compensation or de-differentiation?
In the last few years there have been several reports describing patterns of age-related changes in
neural activity as studied by functional neuroimaging techniques (Rajah and D'Esposito, 2005; Grady et al,
2006). These changes can manifest themselves either as hypoactivations or as hyperactivations in specific
brain regions when comparing elderly with young controls.
So far two different mechanisms have been postulated to account for these age-related changes: (i)
compensatory processes and (ii) dedifferentiation processes (Cabeza, 2001).
Compensatory processes would manifest themselves with the recruitment of unusual6 neural networks
in order to face with task demands. This concept has been extensively used to explain data on recovery of
motor function (Rossini and Dal Forno, 2004; Silvestrini et al., 1998; Ward and Frackowiak, 2006) or of
linguistic functions (Belin et al, 1996; Cao et al., 1999; Heiss and Thiel, 2006, Warburton et al, 1999; Weiller
et al, 1995) after unilateral brain damage. In these instances, task performance during recovery would be
guaranteed by the recruitment of “unusual” regions, such as, for example, the homologue areas of the
undamaged right hemisphere.
In the literature on aging, the over-activation of new brain regions (e.g. prefrontal cortex and posterior
parietal cortex), in association with the maintenance of a good level of performance, is called
“compensation”, while the over-activation of a new set of cerebral areas associated with a behavioural failure
is defined as “compensation attempt” (Cabeza et al., 2002a).
6 To date most of the functional imaging literature is based on young normal controls. Their brain patterns have established what should be seen as a “usual” neural network for a given task. A challenge for cognitive neuroscience is to identify usual neural networks across different life stages and different variables like gender, schooling, and task proficiency.
51

The age-related changes in neural activity are differently interpreted by the “dedifferentiation hypothesis”
(Li and Lindenberger, 1999, Li and Sikstrom, 2002)7: this suggests that the hyperactivations may not
necessarily reflect a goal-driven activity (such as for a compensatory process), rather the difficulty in
recruiting task-specific neural networks with a decrease of the signal-to-noise ratio.
Thus, the over-activation of brain regions in elderly subjects would be the mere manifestation of a sort of
random activity, rather than the sign of reliance on specific alternative cognitive functions8. This view is
compatible with behavioural studies suggesting an age-related increasing correlation of the performance on
different psychological tests, a sign, according to some, of a progressive loss of cognitive specialization
(Baltes and Lindenberger, 1997; Salthouse, 2001).
A first attempt to assess the value of these two theories was made by Cabeza and colleagues (2002a).
Using fMRI, they described the neural networks activated by two groups, an “old-high” and a “old-low” group
of elderly subjects, so classified on the basis of their performance, within or below the range of young
controls. The results showed that during a source memory task9, “old-high” participants over-activated the
left prefrontal cortex when compared with young controls and the “old-low” group. The authors suggested
that this might be a neurophysiological manifestation of a compensatory process in the old-high group.
A similar conclusion was drawn by Davis and colleagues (2008): they studied brain aging with a visual
perception task and an episodic memory retrieval task; in this study, a well known fMRI pattern, the so called
PASA pattern (Posterior Anterior Shifting in Aging), was observed. Moreover, they showed that the
additional recruitment of frontal areas was significantly correlated with the decrement of brain activity in the
posterior brain regions concluding, like others (Cabeza et al, 2002a), that the additional prefrontal activity
may represent the neurofunctional manifestation of compensatory processes.
7 The authors suggest that “the computational theory relates the behavioural manifestations of these cognitive aging deficits with the less efficient neuromodulation of neuronal noise in information processing causing less distinctive neuronal representations.” (Li SC, Sikstrom S. Integrative neurocomputational perspectives on cognitive aging, neuromodulation, and representation. Neurosci Biobehav Rev 2002; 26: 795-808.) 8 This interpretation of the data is in contrast with the nature of group-based imaging data analysis whereby activations are detected only if shared by a large proportion of the experimental subjects. Accordingly, one may cast doubts about the randomness of the unusual activations for studies in which data were analysed on a group basis. 9 Participants were asked to remember whether the target stimulus had been either visually or auditorily presented during an encoding phase
52

3.1.3. The relationship between age-related neurofunctional and neuromorphological changes
The published results in the recent imaging literature on aging are somewhat paradoxical as in some
cases the brain regions found to have a significant age-related volume loss, seem to be those showing a
significant enhancement of task-related activation (Greenwood, 2007 for a review). Prefrontal cortex (PFC)
is one example of such paradox: the region has been found to be over-recruited by elderly subjects in a
large number of cognitive domains, such as visual perception (Grady et al., 1994), visual attention (Cabeza
et al., 2004; Madden et al., 2004) and working memory (Cabeza et al., 2004; Grady et al., 1998; Rypma and
D'Esposito, 2000); at the same time PFC has been often reported as one of the main targets of age-related
progressive grey matter atrophy (Good et al., 2001; Jernigan et al., 2001; Raz et al., 1997).
This paradox has been interpreted as a sign of a functional reorganization after microscopic brain
damage due to grey matter loss (Greenwood, 2007), a hypothesis that has not been explicitly tested yet.
Indeed, in the literature there are only few studies in which both brain volume and brain activity was
measured in the same sample of subjects (Aine et al., 2006; Colcombe et al., 2005). Thus, the relationship
between brain volume and regional neural activity in normal aging remains unclear.
3.2. Aim of the study
The evidence discussed so far suggests that behind maintenance of a good behavioural performance,
elderly subjects might show a significant change in the organization of the neural network typically
associated with specific cognitive tasks, a manifestation of compensatory processes usually visible in the
form of hyperativations in the frontal areas (Cabeza, 2001; Reuter-Lorenz and Lustig, 2005). However, this
data is mainly related to episodic memory, working memory and visual processing, i.e. to “life-long declining
functions” (Hedden and Gabrieli, 2004). On the other hand, it has still to be explored whether a similar
pattern of results may be seen for late-life declining functions (Hedden and Gabrieli, 2004) such as, for
example, semantic memory.
A connected issue is whether “compensatory processes” can be observed only in the prefrontal cortex
(PFC; Grady et al., 2003; Gutchess et al., 2005; Reuter-Lorenz et al., 2000) a brain region that, among many
53

other functions, subserves “controlled” processes, such as in the “executive” aspects of working memory
(WM) and episodic long-term memory (eLTM; Rajah and D'Esposito, 2005).
Finally, the relationship between focal atrophy and changes of brain activation clearly deserves a further
look. The proposal of Greenwood (2007) is based on a review of the literature rather than on systematic
empirical evidence from the same sample of subjects10.
These issues have been addressed in the present study by combining functional, morphological and
behavioural data. To this end, a group of healthy elderly subjects was compared with a group of healthy
young subjects in a range of tasks wider than ever before. The changes in BOLD (blood-oxygen-level-
dependent) signal, as recorded during two lexical-semantic knowledge tasks (i.e. picture naming task and
sentence judgement task) and two episodic long-term memory tasks (i.e. picture recognition task and
sentence recognition task), were assessed both as hypo- or hyperactivations.
One important aspect of the study was to frame the patterns of fMRI changes in the context of the
behavioural performance of the elderly subjects. Indeed, in our perspective, it is legitimate to discuss fMRI
differences as compensatory processes only when the elderly subjects’ performance is similar to the one of
young controls. Figure 3.1 illustrates the possible scenarios emerging from different combinations of
preserved/affected behaviour and normal/abnormal activations: a detailed list of these scenarios is reported
in the caption for Figure 3.1. Finally, the age-related neurofunctional changes seen in elderly participants were correlated with voxel-
based morphometry data whereby grey matter regional and global volumes were measured. In particular, we
explored whether hypo- or hyperactivations in the elderly subjects would overlap with regional atrophy.
These analyses allowed us to test previous hypotheses on the relationship between changes of fMRI
patterns and grey matter atrophy.
10 It is possible that the regions of frontal atrophy and those hyperactivated in fMRI experiments do not correspond when examined at a finer grain anatomical level. For example, when comparing the neuromorphological results from Sowell’s study (Sowell ER, Peterson BS, Thompson PM, Welcome SE, Henkenius AL, Toga AW. Mapping cortical change across the human life span. Nat Neurosci 2003; 6: 309-15) with the neurofunctional results from Davis’ study (Davis SW, Dennis NA, Daselaar SM, Fleck MS, Cabeza R. Que PASA? The posterior-anterior shift in aging. Cereb Cortex 2008; 18: 1201-9), the overlap between the atrophic regions and the hyperactivated areas in elderly participants is far from being obvious.
54

Figure 3.1. Theoretical framework for the interpretation of different combinations of behavioural and fMRI patterns in elderly subjects. Scenario #1, in the presence of behavioural difference: (I) inadequate recruitment of the “normal” neural network (no neurofunctional differences between young and elderly subjects), (II) de-differentiation processes (elderly subjects show both hypoactivation and hyperactivation), (III) specific age-associated deficit (isolated significant hypoactivation). Scenario #2, in the absence of behavioural differences: (IV) compensatory processes (elderly subjects show both hypoactivation and hyperactivation), while (V) hypoactivations in the absence of hyperactivations can be interpreted age-related neural changes not affecting behaviour or not captured by the task used for that experiment.
55

3.3. Materials and methods
3.3.1. Participants
Twenty-four healthy elderly participants (12 male and 12 female; mean age = 62 ± 7.6; educational level
= 12 ± 4.3) and twenty-four young controls (12 male and 12 female; mean age = 26.5 ± 4.4; educational
level = 13.5 ± 1.5) participated in the study.
All the participants were right-handed as assessed with the Oldfield scale (Oldfield, 1971).
None of the healthy elderly and young participants had any history of neurological disorders or learning
disabilities. Moreover, none of the elderly controls had diabetes, hypertension or other main medical
disorders.
All the participants gave their written consent to the experiment.
3.3.2. Materials
3.3.2.1. Neuropsychological assessment
Before the fMRI session, the elderly controls underwent a neuropsychological assessment to exclude
cognitive deficits.
The neuropsychological battery included a summary index of cognitive functioning, the Mini-Mental
State Examination (MMSE, Folstein et al., 1975), and a series of more specific neuropsychological tests
assessing memory functions, language, higher-order motor control and executive functions (see Table 1a
Appendix A for a detailed description).
3.3.2.2. Experimental tasks
The protocol included both tasks for the life-long stable and for the life-long declining functions: lexical-
semantic and episodic long-term memory tasks for pictures and for spoken sentences represented these
categories of tasks, respectively.
To collect an explicit behavioural response during the task assessing life-long declining functions, the
episodic long-term memory tasks were based on recognition processes rather than on retrieval.
56

A. Life-long stable tasks
Picture naming task. A total of 90 pictures from the Snodgrass and Vanderwart test (1980) were
selected (Italian norms in Nisi and colleagues, 2000). Participants were instructed to silently name the
pictures and to press a button whenever the item presented belonged to the semantic category “animals”.
There were 45 animals overall. This was done in order to have a behavioural control and to match the
procedure of this experimental task with the one of the other three tasks (see below).
During the control task (baseline condition) the participants were presented with a set of meaningless
figures resulting from scrambling the pictures used as experimental stimuli. In 45 out of 90 scrambled
pictures, a 2 cm red square was added to the centre of the picture. The participants were instructed to press
a button for the scrambled pictures containing the red square. As the scrambled stimuli were obtained from
the experimental pictures, the elementary aspects of visual stimulation were matched between the
experimental and the control condition.
Sentence judgement task. A set of 36 sentences was created for this task: eighteen sentences were
semantically true (e.g. birds fly in the sky) while the remaining eighteen were semantically incorrect (e.g.
cars run in the sea). For all the sentences the plausibility, or the lack of it, were revealed by the last word of
the sentence. Each sentence had a simple syntactic structure. The two sets of sentences were matched for
length (calculated as number of words): the mean length for the meaningful sentences was 5.16 (Sd =.5),
while for the meaningless sentences the mean length was 5.33 (Sd =.9)11. Participants were required to
listen to the sentences and to press a button when the stimulus was semantically plausible.
During the baseline condition participants were presented with pure tones in the range of human voice.
Tones were either flat, i.e. a long monotonous sound with no modulation, or modulated, i.e. ending with a
rise in pitch. Accordingly, there were 18 flat and 18 modulated tones, each matched for length with one of
the sentences. The onset and length of the rising tone was matched with the onset of one of the words that
revealed plausibility of the sentences. Participants were required to press a button when the ascending
sound was present. 11 A Mann-Whitney U test had been performer to exclude any significant difference between number of words included in the two sets of sentences (meaningful vs meaningless). The results confirmed that the two sets of stimuli did not differ (p =.74).
57

B. Life-long declining tasks
Picture recognition task. A total of 90 pictures from the Snodgrass and Vanderwart test (1980) were
selected. In particular, 45 pictures out of 90 had been presented during the picture naming test (old-figures)
while 45 pictures had been never presented (new-figures). Participants were instructed to press a button
whenever an old-figure was presented.
The control task here was the same one used during the picture naming test.
Sentence recognition task. Eighteen phrases (nine semantically correct and nine semantically incorrect)
were selected from the sentence judgement task (old-sentences) and were matched for length with eighteen
new phrases (nine semantically correct and nine semantically incorrect). Participants were instructed to
listen to the sentences and to press a button when an old-sentence was presented. Old and new items were
randomised within each block.
The control task here was the same one used during the sentence judgement task.
3.3.3. Procedure
During the fMRI sessions, stimuli were projected from a PC located outside the MR room and connected
via optical fibres to dedicated goggles (Visuastim XGA, Resonance Technology, www.mrivideo.com), using
Presentation 11.1 software. Auditory stimuli were presented through headphones. Participants were
instructed to perform each task silently in order to avoid artefacts due to mouth and head movements.
3.3.4. fMRI methods
MRI scans were performed on a 1.5 T Marconi-Philips Infinion Scanner, using an Echo Planar Imaging
(EPI) gradient echo sequence (Flip angle 90° TE = 60msec, TR = 3050msec, FOV = 240x240, matrix = 64 x
64). The selected volume consisted of 26 contiguous transverse images (thickness = 5 mm; gap = 0 mm),
acquired every 3.05 seconds. Each of the experiments described above generated 130 fMRI scans collected
in alternating blocks, 10 corresponding to the presentation of baseline stimuli and 10 corresponding to the
presentation of experimental stimuli.
58

The first 10 scans were collected in the absence of stimulation and discarded from further analyses.
3.3.5. VBM methods
After the fMRI sessions a high-resolution, T1-weighted anatomical scan was acquired for each subject
using an MPRAGE sequence (flip angle 35°, TE=5ms, TR=21ms, FOV=256x192mm, matrice 256x256,
TI=768ms), thus obtaining 132 axial slices with 1x1x1 mm voxels.
Data were analysed on a Windows XP-PC workstation using Matlab 6.5 (MatWorks, Natick, MA, USA)
and Statistical Parametric Mapping Software (SPM 2, Wellcome Department of Imaging Neuroscience,
London, UK, 2000).
MRI data were processed using an optimised VBM protocol, as described by Good (Good et al., 2001).
This procedure involves extraction of the brain from the native skull space to determine ideal stereotactic
normalization parameters. Further, the native MRI scans were stereotactically normalized and segmented
into grey matter (GM), white matter (WhM) and CSF compartments. Finally, a Jacobian modulation was
applied to the data to preserve the absolute regional amount of grey matter from the distortion introduced by
stereotactical normalization (Ashburner and Friston, 2000).
All the MRI data sets were acquired on the same scanner and with the same parameters, according to
strictly standardized procedures.
3.3.6. Statistical analyses
3.3.6.1. Behavioural data
The neuropsychological data were mainly used as a measure to evaluate whether an elderly participant
was performing in the normal range and whether he/she was eligible for the experiment; these data were
compared with the Italian normative data available for each test.
A d-prime (d’) analysis was used for the behavioural responses collected during the fMRI sessions of the
sentence judgement task, the picture recognition task and the sentence recognition task. The d’ was
59

calculated as follows: d' = Z(hit rate) - Z(false alarm rate) (Wickens, 2002). Accordingly, the higher the d’
value, the better the performance.
Behavioural differences between young and elderly subjects during fMRI were tested by comparing the
d’ scores using a Mann-Whitney U test. A correction for multiple comparisons was applied.
3.3.6.2. fMRI data
At first, a standard pre-processing was performed in order to realign the fMRI scans within each fMRI
session and to report each realigned scan within the same stereotaxic space (Ashburner and Friston, 1999).
Once normalized, the scans were smoothed through a Gaussian filter of 10x10x10 mm to improve signal-to-
noise ratio.
After this pre-processing steps, the four experimental conditions for each subject were modelled in a
block design, and the BOLD signal was convolved with a standard HRF (hemodynamic response function)
as implemented in the statistical parametric mapping software SPM2 (Friston et al., 1995). The convolved
signals were then further processed in order to control for the global differences (this was done using a
proportional scaling for all voxels) and to eliminate possible confounding contributions to the fMRI signal
coming from cardiac and respiratory cycles (this was done using a high-pass filtering technique).
A two-step statistical analysis, based on the general linear model (GLM, Friston, 2005), was then
performed.
The first step implied a fixed-effect analysis in which condition-specific effects were calculated. The
fixed-effect analyses were performed separately for each fMRI session of each participant allowing us to
generate individual contrast images (con_images) containing the voxel-by-voxel information about the effect
size of the difference between the experimental and the baseline conditions.
Second, a second-level ANOVA (Friston et al., 2005), conforming to random effect analysis, was
designed and estimated. The second-level analysis permits a generalization to the population level of the
statistical inferences.
In particular the following effects were calculated:
60

1) main effect for each task (e.g. combined “young” and “elderly” activations during picture naming
task), these contrasts were thresholded at p = .001 (uncorrected);
2) effects of normal aging, assessed in term of
a) hyperactivation in elderly (e.g. elderly subjects > young subjects in picture naming),
b) hypoactivation in elderly (e.g. elderly subjects < young subjects in picture naming);
3) age-by-task interactions within the two cognitive domains of interest (i.e. lexical-semantic and eLTM
functions). These interaction effects assessed the possibility that some between group differences were task
dependent.
The effects of aging were calculated by using inclusive masks. The masks restricted the analyses to the
voxels identifiied by the relevant task main effects (see above at #1) and they were thresholded at p<.05.
The contrasts described at the point 3 in the above list were masked using the between-group (elderly
vs young and viceversa) comparisons of interest (contrast at point 2).
After the masking procedure, each comparison was thresholded at p<.01 (uncorrected). The final
threshold for each contrast was p<.0005, as the masking effects and the actual comparisons were
orthogonal. The tables also indicate whether a coordinate survived either the family-wise error rate (FWE)
(Friston et al., 1996; Kiebel et al., 1999) or/and the false discovery rate (FDR) corrections (Genovese et al.,
2002). A spatial filter of 100 voxels was used. Smaller clusters were therefore ignored in the results section.
Finally, activations that were stable across different groups, i.e. the areas commonly activated by
youngers and olders, were explored by isolating the brain regions shared by the two groups in each
experimental task as conjunction effects. These conjunctions were calculated using an exclusive mask that
eliminated from the analysis hypo- and hyperactivated voxels in the elderly subjects. Here, we applied the
same thresholds and spatial constraint used to explore the effect of normal aging.
3.3.6.3. VBM data and Small-volume correction analyses
The anatomical differences between the two groups (namely the areas of significant GM reduction in
elderly participants as compared to the young ones) were estimated with a t-test analysis on a voxel-by-
61

voxel basis, once the intersubject variability of global brain volume was removed by correcting regional
values with a proportional scaling technique.
Regional effects were reported at p<0.05 using the Family-Wise Error correction (FWE) as implemented
in SPM2. Moreover, a spatial constraint was applied, so that only cluster including more than 100 voxels
were reported.
To assess the relationship between brain atrophy and functional changes seen with fMRI, the fMRI data
were reassessed using a small-volume correction based on the statistical image derived from the VBM
analyses (see Figure 3.2 left panel). A small-volume correction based on a brain image tests the hypothesis
of a significant effect within the anatomical space defined by the image for any given comparison. By using
this technique, we were able to test whether there was a significant overlap between VBM atrophy data and
age-related fMRI changes.
Finally, we assessed the relationship between the overall GM density reduction and the fMRI age-
related changes. We first calculated the individual rate of atrophy by performing two-sample t-tests of each
elderly individual versus the group of young controls; the volume of atrophy was re-expressed as the
percentage of grey matter reduction with reference to the whole grey matter brain volume. The same
procedure was used for the individual fMRI data. Thus, the number of voxels of hypo- and hyper-activation
of each elderly subject, compared with the young controls, was calculated and re-expressed as a
percentage with reference to the search volume identified by SPM for any given task. A threshold of p<0.001
was used for these SPM analyses. The percentage values of atrophy and hypo- or hyper-activations, after
log-transformation, were correlated using the Pearson’s r-test (see Figure 3.2, right panel).
62

Figure 3.2. Schematic representation of the small volume correction analyses (left panel) and of the subject-by-subject analyses (right panel). In particular, the small volume correction analysis was performed using as volume of interest the GM density reduction in elderly participants. This volume was overlapped to the age-related neurofunctional changes.
In the subject-by-subject analysis, the percentage values of atrophy and hypo- or hyper-activations were extracted for each elderly participant and, after log-transformation, were correlated using the Pearson’s r-test.
63

3.4. Results
3.4.1. Neuropsychological and behavioural results
All the participants included in the healthy elderly group had a neuropsychological profile completely
within the normal range according to the Italian normative data used for each neuropsychological test.
fMRI behavioural tasks: from the Mann-Whitney U tests, no significant difference emerged in any task
(Table 3.1), suggesting that the two groups were similar not only for lexical-semantic knowledge but also for
recognition episodic memory for pictures and sentences.
Table 3.1. Behavioural performance recorded during the fMRI scans for the two groups of participants (young controls and elderly participants).
Hits Omissions False
alarms Correct
rejections d’
SJT 17.8 (0.4)
0.2 (0.4)
0.3 (0.4)
17.7 (0.4)
4.3 (0.4)
PRT 38.3 (5.7)
6.7 (5.7)
2.04 (1.8)
42.9 (1.8)
2.8 (.54)
Youn
g co
ntrols
SRT 17.04 (1.02)
.9 (.94)
.33 (.48)
17.7 (.46)
4.1 (.5)
SJT 17.2 (1)
0.8 (1)
0.08 (0.4)
17.86 (0.4)
4.2 (0.6)
PRT 38.1 (6.06)
6.8 (6.06)
2.08 (4.1)
42.9 (4.1)
2.8 (1.1)
Elde
rly
partic
ipants
SRT 16.4 (2.5)
1.5 (2.5)
0.9 (2.6)
17.1 (2.6)
3.7 (1.3)
For the picture naming task it was not recorded an explicit measure of naming behaviour during the scan. Thus, the
performance at the picture naming subtest from the AAT was used as behavioural index. Elderly participants obtained a performance at the ceiling level (mean score = 89.04 (1.73) out of 90 stimuli).
3.4.2. fMRI results
3.4.2.1. Main effects
The main effects of each task (see figure 3) conform to previously described neurofunctional patterns for
sentence processing (Wingfield and Grossman, 2006), picture naming (Berlingeri et al., 2008; Liljestrom et
al, 2008) and recognition memory tasks (Golby et al., 2001; Kensinger et al., 2003; Tulving et al., 1996):
these results are reported in detaisl in the supporting materials (Table 2a appendix A).
In short, the picture naming task was associated with a large activation of the occipito-temporal cortex
bilaterally and of the left frontal and prefrontal cortex.
64

The sentence judgement task was associated with activation of the left frontal and prefrontal cortex, in
the left occipital areas and, massively, in the lateral-neocortical and medial-hippocampal temporal regions
bilaterally.
The activation pattern in the picture recognition task was very similar to the one observed for the picture
naming with additional activations of the prefrontal cortices and dorsal parietal cortices, bilaterally (see Table
3a appendix A).
Finally, the sentence recognition task revealed a similar patter of activation to the sentence judgement
task with more profound prefrontal and dorsal parietal involvement bilaterally (see Table 3a). On the other
hand, the sentence judgement task showed a more pronounced activation in the medial temporal regions
including the hippocampi (see Table 3a).
As expected, there was a substantial overlap of brain areas activated by both young and elderly subjects
(seeTable 4a appendix A).
However, there were also important differences. These will be the focus of our description below.
3.4.2.2. Neurofunctional age-related differences
Picture naming task. Healthy elderly participants showed a significant hypoactivation in the precental
gyrus, in the inferior temporal gyrus and in the lingual gyrus of the left hemisphere. A significant reduction of
brain activity was also found in the fusiform gyri, in the inferior and middle occipital gyri and in the
cerebellum bilaterally (Figure 3.3 and Table 3.2).
The opposite comparison (namely elderly>young) showed a significant enhancement of the neural
activity in the left inferior frontal gyrus (the dorsal part of the pars opercularis), in the left middle frontal gyrus
and in the left cuneus (Figure 3.3 and Table 3.2).
65

Table 3.2. Brain regions showing a significant effect of aging for the picture naming task.
Brain regions x y z Z score x y z Z score Left hemisphere Right hemisphere Picture naming task Hypoactivation (Elderly < Young) Precentral gyrus -52 -2 46 4.7*° Inferior Temporal gyrus -44 -64 -4 5.3*° Fusiform gyrus -38 -50 -16 4.2* 28 -58 -12 4.3* -34 -52 -16 4.2* 30 -68 -10 3.8* Lingual gyrus -30 -84 -12 2.8 Inferior Occipital gyrus -26 -88 -4 2.6 32 -84 -6 4.3* Middle Occipital gyrus -32 -86 6 3.8* 34 -84 4 3.9* -30 -86 12 3.5* 36 -84 18 3.2* Cerebellum -28 -48 -26 4.6*° 26 -44 -22 4.9*° -26 -62 -18 3.8* Hyperactivation (Elderly > Young) Inferior Frontal gyrus, pars opercularis -42 22 34 2.5 Middle Frontal gyrus -40 44 20 3.5* -44 26 34 2.7 Cuneus -14 -84 38 3.6*
x, y, and z are the stereotactic coordinates of the activations in the MNI space. Statistical threshold p<.001 uncorrected; cluster size ≥ 100.
° Z-score statistically significant also after the FWE (Family-wise Error) correction. * Z-score statistically significant also after the FDR (False Discovery Rate) correction.
Sentence judgement task. Elderly participants showed a significant hypoactivation in the inferior frontal
gyrus (pars opercularis) and in the precentral gyrus of the left hemisphere. A significant reduction of the
neural activity was also found in the pars orbitalis and triangularis of the inferior frontal gyrus, and in the
superior temporal pole bilaterally and in the right insula.
On the contrary a significant hyperactivation for elderly participants was found in the left superior
temporal gyrus, in the left fusiform gyrus, in the left middle and superior occipital gyri, in the right
parahippocampal gyrus and in the right cerebellum (Figure 3.3 and Table 3.3).
Picture recognition task. Elderly subjects showed a significant hypoactivation in the left inferior temporal
gyrus, in the left middle temporal gyrus, in the left middle occipital gyrus, in the right inferior parietal lobule, in
the right inferior occipital gyrus and bilaterally in the fusiform and lingual gyri, in a region near to the
calcarine fissure and in the cerebellum.
Healthy elderly participants hyperactivated the left inferior frontal gyrus (pars triangularis), the middle
frontal and precentral gyri bilaterally (Figure 3.3 and Table 3.4).
66

Table 3.3. Brain regions showing a significant effect of aging for the sentence judgement task.
Brain regions X y z Z score x y z Z score Left hemisphere Right hemisphere Sentence judgement task Hypoactivation (Elderly < Young) Inferior Frontal gyrus, pars orbitalis -36 22 -14 3.1 52 28 -10 3.1 Inferior Frontal gyrus, pars triangularis -56 24 10 3.1 58 26 12 2.9 -54 30 8 3.1 52 20 20 2.7 Inferior Frontal gyrus, pars opercularis -48 12 24 2.9 -56 18 26 2.7 Precentral gyrus -54 4 42 2.6 -52 8 34 2.5 Insula 40 20 -12 2.9 36 22 -10 2.9 Superior Temporal Pole -56 10 -16 2.6 54 18 -6 3.1 -52 22 -12 3.3 Hyperactivation (Elderly > Young) Superior Temporal gyrus -62 -30 10 4.2* Parahippocampal gyrus 22 -34 -10 4.4° 26 -28 -14 3.8* Fusiform gyrus -16 -40 -10 4.0* Middle Occipital gyrus -44 -80 28 3.8* -50 -76 16 3.7* Superior Occipital gyrus -22 -86 42 3.5 Vermis, Cerebellum 2 -42 -12 2.4
Table 3.4. Brain regions showing a significant effect of aging for the picture recognition task.
Brain regions X y z Z score x y z Z score Left hemisphere Right hemisphere Picture recognition task Hypoactivation (Elderly < Young) Inferior Parietal lobule 34 -52 52 4.0* Inferior Temporal gyrus -44 -50 -12 3.0 -40 -46 -14 3.4* Middle Temporal gyrus -44 -64 -2 4.0* Fusiform gyrus -32 -44 -16 3.3* 38 -44 -22 4.1* -36 -44 -14 3.3* 40 -46 -18 4.1* Lingual gyrus -22 -62 4 4.2* 16 -52 4 4.2* 20 -54 4 4.2* Inferior Occipital gyrus 30 -80 -10 2.9 32 -80 -6 3.0 Middle Occipital gyrus -46 -80 0 4.7*° -44 -84 0 4.5*° Calcarine Fissure -6 -80 16 3.0 8 -72 16 3.8* -10 -82 14 3.1 Cerebellum -30 -46 -26 3.1 34 -42 -24 3.9* -28 -62 -16 3.1 24 -42 -20 4.4* Hyperactivation (Elderly > Young) Inferior Frontal gyrus, pars triangularis -42 44 16 3.8* -42 36 24 3.5* Middle Frontal gyrus -40 20 44 4.2* 36 26 46 5.5*° -38 20 38 3.8* Precentral gyrus -38 10 44 5.4*° 42 6 48 3.9* -40 -60 42 3.6* 48 -66 44 4.7*° 50 -58 44 3.6*
x, y, and z are the stereotactic coordinates of the activations in the MNI space. Statistical threshold p<.001 uncorrected; cluster size ≥ 100.
° Z-score statistically significant also after the FWE (Family-wise Error) correction. * Z-score statistically significant also after the FDR (False Discovery Rate) correction.
67

Sentence recognition task results. Elderly participants had a significant hypoactivation in the left insula,
in the left superior temporal pole, in the right middle frontal gyrus and in the right angular gyrus, in the
inferior frontal gyri (pars orbitalis and pars triangularis) and in the inferior parietal lobules (Figure 3.3 and
Table 3.5) bilaterally.
On the other hand, we found a significant hyperactivation in elderly participants in the left angular gyrus
and in the left middle occipital gyrus (Figure 3.3 and Table 3.5).
Table 3.5. Brain regions showing a significant effect of aging for the sentence recognition task.
Brain regions x y z Z score x y z Z score Left hemisphere Right hemisphere Sentence recognition task Hypoactivation (Elderly < Young) Inferior Frontal gyrus, pars orbitalis -48 40 -16 3.1 32 24 -6 3.4* -38 28 -8 3.2* 46 24 -16 3.3* Inferior Frontal gyrus, pars triangularis -38 28 -2 3.1 40 24 28 3.4* -54 28 14 2.6 38 20 28 3.4* Middle Frontal gyrus 44 36 34 3.5* 32 52 -6 2.6 Insula -30 22 0 3.4* -42 14 -2 2.5 Superior Temporal Pole -54 16 -14 2.8 -52 20 -14 2.8 Inferior Parietal lobule -38 -52 56 5.9*° 44 -52 50 4.0* Angular gyrus 38 -56 46 4.5*° Hyperactivation (Elderly > Young) Angular gyrus -48 -76 28 3.6 Middle Occipital gyrus -38 -82 36 4.5°
x, y, and z are the stereotactic coordinates of the activations in the MNI space. Statistical threshold p<.001 uncorrected; cluster size ≥ 100.
° Z-score statistically significant also after the FWE (Family-wise Error) correction. * Z-score statistically significant also after the FDR (False Discovery Rate) correction.
68

Figure 3.3. fMRI results from the four experimental tasks.
69

Task dependent regional effects. There were brain regions where it was possible to identify task
dependent differences between young and elderly subjects. In particular in elderly participants, for LTM
tasks, the left inferior frontal cortex and left inferior parietal lobule were significantly hyperactivated in the
picture recognition task and hypoactivated in the sentence recognition task (Figure 3.4 and Table 3.6). No
other such interaction was found.
Figure 3.4. Task dependent regional brain effects within the eLTM domain. The two plots represent the fMRI response in the two groups of participants as recorded during the picture recognition and sentence recognition tasks in the left inferior frontal gyrus (left panel) and in the left inferior parietal lobule (right panel).
70

Table 3.6. Brain regions showing a significant task-dependent effect of aging within the memory domain.
Brain regions x y z Z score x y z Z score Left hemisphere Right hemisphere
Task dependent regional brain effects within the memory domain Inferior Frontal gyrus -48 40 -16 3.8* -46 38 -6 3.8* Inferior Parietal lobule -44 -50 44 4.6*° -44 -56 52 4.1*
x, y, and z are the stereotactic coordinates of the activations in the MNI space. Statistical threshold p<.001 uncorrected; cluster size ≥ 100.
° Z-score statistically significant also after the FWE (Family-wise Error) correction. * Z-score statistically significant also after the FDR (False Discovery Rate) correction. 3.4.2.3. Voxel-based morphometry results
Elderly participants showed a significant reduction of GM density in the left precentral gyrus and in the
left caudate nucleus. A significant age-related atrophy was also found in the right inferior frontal gyrus, in the
right superior frontal gyrus (pars orbitalis), in the right Rolandic opercular gyrus, in the right supramarginal
gyrus, in the right lingual gyrus and in the right superior occipital gyrus. Finally a bilateral reduction of GM
density was found in the middle frontal gyrus, in the superior frontal gyrus, in the insula and in the inferior
parietal lobule (Table 3.7).
Table 3.7. Brain regions showing a significant GM reduction in the group of healthy elderly as compared with young controls.
Brain regions x y z Z score x y z Z score Left hemisphere Right hemisphere Inferior Frontal gyrus pars triangularis 53 42 19 5.2 Inferior Frontal gyrus pars opercularis 63 14 26 5.5 63 15 15 5.3 Middle Frontal gyrus -43 57 7 6.2 47 16 52 5.8 -33 64 5 6.5 37 59 21 5.4 Superior Frontal gyrus pars orbitalis 23 70 -3 5.5 Superior Frontal gyrus -27 64 17 6.5 22 10 67 7.6 -22 6 69 5.9 18 29 58 5.7 Precentral gyrus -55 12 38 6.0 Insula -36 -1 19 6.3 39 -7 20 6.0 41 1 16 5.2 Rolandic opercular gyrus 45 -12 22 5.8 Supramarginal gyrus 65 -44 42 5.7 59 -27 31 5.2 Inferior Parietal lobule -48 -45 53 6.4 42 -52 56 6.3 -35 -63 53 6.3 Lingual gyrus 16 -77 -8 5.4 17 -87 -7 5.0 Superior Occipital gyrus 28 -73 45 5.4 Caudate nucleus -4 8 7 5.3
x, y, and z are the stereotactic coordinates of the activations in the MNI space. Statistical threshold p<.05 corrected for multiple comparisons (FWE); cluster size ≥ 100.
71

3.4.2.4. Overlap between functional and grey matter atrophy findings: VBM-based small-volume
corrected fMRI results.
The VBM data allowed us to further interpret the fMRI results and showed that brain atrophy in normal
aging can be associated to regional hypoactivations but also to some hyperactivations, in a task dependent
manner (see Table 3.8 and Figure 3.5 for details).
Table 3.8. Areas of overlap between fMRI changes and brain atrophy in elderly subjects.
x Y z Z score x y z Z score Brain regions Left hemisphere Right hemisphere
PNT Hypoactivation (Elderly < Young) -- -- -- -- -- -- -- -- -- Hyperactivation (Elderly > Young) -- -- -- -- -- -- -- -- -- SJT Hypoactivation (Elderly < Young) Inferior Frontal gyrus, pars triangularis 52 20 20 2.7 52 28 18 2.6 52 30 14 2.7 Inferior Frontal gyrus, pars opercularis -50 10 28 2.7 Hyperactivation (Elderly > Young) -- -- -- -- -- -- -- -- -- PRT Hypoactivation (Elderly < Young) Inferior Parietal lobule 34 -52 52 4 Lingual gyrus 16 -68 -10 2.6 Hyperactivation (Elderly > Young) Middle Frontal gyrus 40 20 44 3.9 38 18 48 4.5 Precentral gyrus -44 8 38 2.8 42 6 48 3.9 Inferior Parietal lobule 52 -50 42 2.5 Angular gyrus -42 -56 42 3.6 SRT Hypoactivation (Elderly < Young) Inferior Frontal gyrus, pars orbitalis -46 44 -2 2.4 -46 48 -4 2.4 Inferior Frontal gyrus, pars triangularis 52 30 14 2.8 50 26 22 2.4 48 32 12 2.8 Inferior Parietal lobule -36 -52 50 5.1 44 -52 50 4 Angular gyrus 38 -56 46 4.5 Hyperactivation (Elderly > Young) -- -- -- -- -- -- -- -- --
72

Figure 3.5. Brain regions showing a significant overlap between GM density reductions, areas effectively sampled by our fMRI experiments and age-related fMRI changes. The upper panel represents the distribution of GM density reductions (in blue) and of the overall neural activity from the four experimental tasks (in red) thresholded at p<.001. The lower panel represents the results of the VBM investigation at a more conservative threshold (p<.05 FEW-corrected), the same used to perform a VBM-based small-volume correction of the comparisons of the fMRI data from the controls and the elderly subjects. In blue: brain regions of significant GM density reduction in the group of healthy elderly controls. Red areas: brain areas of overlap between GM density reduction and hypoactivations in the sentence judgement task. Yellow: brain areas of overlap between GM density reduction and hypoactivations in the picture recognition task. Green: brain regions of overlap between GM density reduction and hyperactivations in the picture recognition task. Orange: brain areas of overlap between GM density reduction and hypoactivations in the sentence recognition task.
73

In addition we found that there was no systematic correlation between overall degree of grey matter
atrophy and the magnitude of the individual fMRI differences calculated on each single elderly subject after
comparison with the group of younger controls. (Table 3.9 for details).
Table 3.9. Correlation between global grey matter volume reductions and fMRI signal changes.
Hypoactivations Picture
naming Sentence judgement
Picture recognition
Sentence recognition
Pearson correlation .12 .05 -.19 .18
GM density p-value .58 .82 .38 .41
Hyperactivations
Picture naming
Sentence judgement
Picture recognition
Sentence recognition
Pearson correlation -.24 -.087 -.1 -.04
GM density
p-value .26 .7 .66 .85
A certain degree of overlap was also found between GM density reductions and brain regions having a
normal level of activations in the olders (i.e. the brain regions whose activity was shared by young and
elderly). These results are reported in the Table 4a in appendix A.
3.5. Discussion
fMRI patterns of brain activations in elderly people with normal performance in cognitive tasks may differ
from those of younger subjects so that hypoactivations of domain specific regions are accompanied by
hyperactivations primarily involving prefrontal cortex (Cabeza et al., 2002b). These patterns have been
interpreted as the neural hallmark of compensatory processes and have been tested for functions that
typically show a decline during the life span.
74

Aim of our study was to clarify whether compensatory processes, as defined above, can be observed
also for relatively stable cognitive functions, such as lexical-semantic knowledge, and to describe the
ensuing fMRI regional patterns.
We considered a number of possible scenarios on the basis of the presence of behavioural differences
between elderly and young controls and fMRI differences (see Figure 3.1); we also investigated whether
there is a systematic relationship between neurofunctional and volumetric age-related changes.
3.5.1. One or more neural patterns for compensatory processes in the aging brain?
The healthy elderly participants included in this study had a normal neuropsychological profile as
assessed through a set of neuropsychological tests.
Moreover, they reached an excellent level of performance not only in the lexical-semantic tasks (i.e.
picture naming tasks and semantic judgement task), as one would have expected, but also in the two LTM
tasks: a picture recognition task and a sentence recognition task12.
This by itself leads to consider only one of the possible scenarios described in Figure 3.1. Indeed, the
fMRI differences found between the two groups are not compatible with the concept of (i) a de-differentiation
process, nor of (ii) an inadequate recruitment of the typical neural network, nor of (iii) an isolated specific
degeneration of the typical neural network (i.e. the alternative explanations described in Figure 3.1, flowchart
on the top), as these require a behavioural difference between the two groups.
On the other hand, a comparable behavioural performance between the young and the elderly
participants together with the fMRI differences of the kind that we observed can be jointly interpreted as a
further evidence of “compensatory processes” for the elderly subjects, according to the definition given in the
incipit of this discussion and in previous literature (Reuter-Lorenz and Cappell, 2008). The compensatory
processes were characterized by both hypoactivation of the “normal young” neural network underlying the
task, and with a significant hyperactivation of additional brain regions in the group of elderly participants.
12 The lack of behavioural differences in a episodic memory task is most likely due to the simple format of recognition task.
75

Overall, these observations are consistent with previous proposals on this subject (see Grady, 2008 for
a recent review).
However, our data also suggest that compensatory processes may play a role not only in the so called
life-long declining functions (Hedden and Gabrieli, 2004), in this case eLTM-memory, but also in those
cognitive functions that remain relatively stable across life-span, in our case, lexical-semantic knowledge,
and that do not seem to typically require a high level of active cognitive control.
In addition, it is worth noting that the hyperactivations, that some interpret as the active and goal-driven
part of the compensatory process, were not confined to the prefrontal cortex (PFC), rather their regional
pattern was task-dependent. This suggests that there is not a single brain structure devoted to “compensate”
for progressive age-related decrease of modality specific neural activity as proposed by some authors
(Cabeza, 2002a; Davis et al., 2008; Greenwood, 2000).
In fact, our results suggest that the activity of the PFC is modulated by the nature of the task and its
hyperactivation is not the only neural hallmark of compensatory processes.
3.5.2. Compensatory processes: attentional overload or adoption of multiple strategies, or both?
As discussed, the available literature and the present data clearly show the existence of compensatory
processes in healthy aging; however, their manifestation is more complex than envisaged in earlier reports.
The initial proposal was conceptually simple and perhaps easier to maintain: a compensatory process in the
form of a systematic prefrontal hyperactivation has the natural appeal of offering an intuitive explanation, if
one makes the simple assumption that a prefrontal hyperactivation may represent a higher contribution of
attentional/working memory processes to face the impoverishment of domain specific brain regions (Cabeza
et al, 2002a).
Our data show that this may not be a rule as the age-related changes in prefrontal cortex activation
showed task dependent hyper- or hypo- activations. In addition, we found examples of hyperactivations
outside the frontal lobes. For example, in the sentence judgement tasks, based on auditory stimuli, the
elderly subjects hyperactivated higher-order visual cortices, the precuneus, and the medial temporal regions.
76

This pattern of hyperactivation was partly replicated in the sentence recognition task, where elderly
participants over-recruited once again extra-striate visual cortices. Taken together, this evidence may
support, as a tentative explanation, a larger reliance on mental imagery (where the extrastriate cortices are
known to play a role; Ganis, Thompson et al. 2004) and on encoding of complex memory engrams (a
cognitive process that usually requires the contribution of medial temporal lobe structures; Rand-Giovannetti
et al, 2006) in order to deal with the demands of these tasks, in particular of sentence judgement task.
Of course, to turn this into a more conclusive claim, an explicit demonstration is needed, perhaps by
challenging young and elderly subjects with ad-hoc dual task paradigms that interfere with mental imagery.
However, the evidence provided here is sufficient to propose that compensatory processes are complex
and not restricted to heavier demands on attentional networks located in the frontal lobes: we rather propose
that a combination of factors, including the adoption of ad-hoc additional strategies may contribute to
maintain behavioural performance at a quasi-young level. In this perspective, the increased frontal
activations may represent, when present, an ingredient for setting up the additional/alternative strategies
rather than a sign that attentional resources have been saturated; this would be in line with the hypotheses
advanced also by Reuter-Lorenz and Cappell (2008).
3.5.3. Grey matter atrophy and functional anatomical patterns of aging.
The results of our combined VBM/fMRI investigation are clear-cut: age related grey matter atrophy
overlapped not only to both hyper- and hypoactivations, but partly also with normal activations.
This pattern of results, per se, disconfirms Greenwood’s hypothesis (2007): the so called paradox in
cognitive neuroscience of aging, i.e. the proposal that a large degree of overlap between brain atrophy and
functional over-activation is a hallmark of normal aging. According to this proposal, hyperactivation within a
region of brain atrophy may represent a form of local compensation for grey matter loss.
We also assessed whether the global impoverishment of grey matter had an impact on the global
amount of hypo- and hyperactivations in each subject: such a systematic relationship was not found either.
77

On the other hand, the combined VBM/fMRI analyses showed a much more intuitive pattern, namely
that most hypoactivations were within regions of brain atrophy. However, there were also regions of normal
activation within the areas of grey matter atrophy.
It remains to be established whether a better match between regional brain atrophy and changes in fMRI
signal can be found in dementia.
The lack of any systematic association between regional and global atrophy and fMRI patterns in normal
aging suggests that other factors, like life-long experience and adoption of alternative strategies, or changes
in the distribution of neurochemical modulatation may also contribute to the functional changes observed in
aging, not necessarily mirrored by the simple index of regional atrophy.
3.6. Conclusions
By challenging elderly normal subjects with task tackling both life-long-stable and life-long-declining
functions we were able to confirm the existence of compensatory processes in normal aging and to show
that the fMRI patterns associated with a quasi-young level of performance do not correspond necessarily to
early saturation of attentional resources if these were to be represented by a systematic hyperactivation of
the prefrontal cortex. Frontal hyperactivity, when present, was not necessarily correlated with local atrophy.
The additional activation of higher order cortices of the occipitotemporal regions may represent reliance on
alternative strategies by the elderly. The ability to rely on multiple strategies may be a sign of time being on
our side when we age gracefully. Further studies are needed to test this hypothesis more extensively.
Funding
The study was supported by the Research Grant RF05.103 from the Ministero della Salute, Italy.
Acknowledgments
Part of this work has been presented at the 27th European Workshop on Cognitive Neuropsychology,
Bressanone (Italy) and at the 3rd meeting of the Italian Society of Psychology of Aging (SIPI), Brescia (Italy).
78

References
Aine, C. J., C. C. Woodruff, et al. (2006). "Aging: compensation or maturation?" Neuroimage 32(4): 1891-
904.
Ashburner, J. and K. J. Friston (1999). "Nonlinear spatial normalization using basis functions." Hum Brain
Mapp 7(4): 254-66.
Ashburner, J. and K. J. Friston (2000). "Voxel-based morphometry--the methods." Neuroimage 11(6 Pt 1):
805-21.
Baltes, P. B. and U. Lindenberger (1997). "Emergence of a powerful connection between sensory and
cognitive functions across the adult life span: a new window to the study of cognitive aging?" Psychol
Aging 12(1): 12-21.
Belin, P., P. Van Eeckhout, et al. (1996). "Recovery from nonfluent aphasia after melodic intonation therapy:
a PET study." Neurology 47(6): 1504-11.
Berlingeri, M., D. Crepaldi, et al. (2008). "Nouns and verbs in the brain: grammatical class and task specific
effects as revealed by fMRI." Cogn Neuropsychol 25(4): 528-58.
Buckner, R. L. (2004). "Memory and executive function in aging and AD: multiple factors that cause decline
and reserve factors that compensate." Neuron 44(1): 195-208.
Cabeza, R. (2001). "Cognitive neuroscience of aging: contributions of functional neuroimaging." Scand J
Psychol 42(3): 277-86.
Cabeza, R., N. D. Anderson, et al. (2002a). "Aging gracefully: compensatory brain activity in high-performing
older adults." Neuroimage 17(3): 1394-402.
Cabeza, R. (2002b). "Hemispheric asymmetry reduction in older adults: the HAROLD model." Psychol Aging
17(1): 85-100.
Cabeza, R., S. M. Daselaar, et al. (2004). "Task-independent and task-specific age effects on brain activity
during working memory, visual attention and episodic retrieval." Cereb Cortex 14(4): 364-75.
Cao, Y., E. M. Vikingstad, et al. (1999). "Cortical language activation in stroke patients recovering from
aphasia with functional MRI." Stroke 30(11): 2331-40.
79

Colcombe, S. J., A. F. Kramer, et al. (2005). "The implications of cortical recruitment and brain morphology
for individual differences in inhibitory function in aging humans." Psychol Aging 20(3): 363-75.
Davis, S. W., N. A. Dennis, et al. (2008). "Que PASA? The posterior-anterior shift in aging." Cereb Cortex
18(5): 1201-9.
Diana, R. A., L. M. Reder, et al. (2006). "Models of recognition: a review of arguments in favor of a dual-
process account." Psychon Bull Rev 13(1): 1-21.
Folstein, M. F., S. E. Folstein, et al. (1975). ""Mini-mental state". A practical method for grading the cognitive
state of patients for the clinician." J Psychiatr Res 12(3): 189-98.
Friston, K. J., A. Holmes, et al. (1996). "Detecting activations in PET and fMRI: levels of inference and
power." Neuroimage 4(3 Pt 1): 223-35.
Friston, K. J., A. P. Holmes, et al. (1995). "Analysis of fMRI time-series revisited." Neuroimage 2(1): 45-53.
Friston, K. J., K. E. Stephan, et al. (2005). "Mixed-effects and fMRI studies." Neuroimage 24(1): 244-52.
Fromholt, P., D. B. Mortensen, et al. (2003). "Life-narrative and word-cued autobiographical memories in
centenarians: comparisons with 80-year-old control, depressed, and dementia groups." Memory 11(1):
81-8.
Ganis, G., W. Thompson, et al. (2004). "Brain areas underlying visual mental imagery and visual perception:
an fMRI study." Brain Res Cogn Brain Res 20(2): 226-241.
Genovese, C. R., N. A. Lazar, et al. (2002). "Thresholding of statistical maps in functional neuroimaging
using the false discovery rate." Neuroimage 15(4): 870-8.
Glisky, E. L., S. R. Rubin, et al. (2001). "Source memory in older adults: an encoding or retrieval problem?" J
Exp Psychol Learn Mem Cogn 27(5): 1131-46.
Golby, A. J., R. A. Poldrack, et al. (2001). "Material-specific lateralization in the medial temporal lobe and
prefrontal cortex during memory encoding." Brain 124: 1841-1854.
Good, C. D., I. S. Johnsrude, et al. (2001). "A voxel-based morphometric study of ageing in 465 normal adult
human brains." Neuroimage 14: 21-36.
Grady, C. L. (2008). "Cognitive neuroscience of aging." Ann N Y Acad Sci 1124: 127-44.
80

Grady, C. L., J. M. Maisog, et al. (1994). "Age-related changes in cortical blood flow activation during visual
processing of faces and location." J Neurosci 14(3 Pt 2): 1450-62.
Grady, C. L., A. R. McIntosh, et al. (2003). "Evidence from functional neuroimaging of a compensatory
prefrontal network in Alzheimer's disease." J Neurosci 23(3): 986-93.
Grady, C. L., A. R. McIntosh, et al. (1998). "Age-related changes in regional cerebral blood flow during
working memory for faces." Neuroimage 8(4): 409-25.
Grady, C. L., M. V. Springer, et al. (2006). "Age-related changes in brain activity across the adult lifespan." J
Cogn Neurosci 18(2): 227-41.
Graham, N. L., T. Emery, et al. (2004). "Distinctive cognitive profiles in Alzheimer's disease and subcortical
vascular dementia." J Neurol Neurosurg Psychiatry 75(1): 61-71.
Greenwood, P. M. (2000). "The frontal aging hypothesis evaluated." J Int Neuropsychol Soc 6(6): 705-26.
Greenwood, P. M. (2007). "Functional plasticity in cognitive aging: review and hypothesis." Neuropsychology
21(6): 657-73.
Gutchess, A. H., R. C. Welsh, et al. (2005). "Aging and the neural correlates of successful picture encoding:
frontal activations compensate for decreased medial-temporal activity." J Cogn Neurosci 17(1): 84-96.
Hedden, T. and J. D. Gabrieli (2004). "Insights into the ageing mind: a view from cognitive neuroscience."
Nat Rev Neurosci 5(2): 87-96.
Heiss, W. D. and A. Thiel (2006). "A proposed regional hierarchy in recovery of post-stroke aphasia." Brain
Lang 98(1): 118-23.
Huppert, F. A., Brayne, C., O'Connor, D.W. (1994a). Memory function in dementia and normal aging—
dimension or dichotomy? In Dementia and Normal Aging. C. U. Press. Cambridge: 291-330.
Huppert, F. A., Brayne, C., O’Connor, D.W. (1994b). What is the relationship between dementia and normal
aging. In Dementia and Normal Aging. C. U. Press. Cambridge: 3-11.
Jernigan, T. L., S. L. Archibald, et al. (2001). "Effects of age on tissues and regions of the cerebrum and
cerebellum." Neurobiol Aging 22(4): 581-94.
81

Kalpouzos, G., G. Chetelat, et al. (2009). "Voxel-based mapping of brain gray matter volume and glucose
metabolism profiles in normal aging." Neurobiol Aging 30(1): 112-24.
Kensinger, E. A., R. J. Clarke, et al. (2003). "What neural correlates underlie successful encoding and
retrieval? A functional magnetic resonance imaging study using a divided attention paradigm." J
Neurosci 23(6): 2407-15.
Kiebel, S. J., J. B. Poline, et al. (1999). "Robust smoothness estimation in statistical parametric maps using
standardized residuals from the general linear model." Neuroimage 10(6): 756-66.
La Voie, D. and L. L. Light (1994). "Adult age differences in repetition priming: a meta-analysis." Psychol
Aging 9(4): 539-53.
Li, S. C. and U. Lindenberger (1999). Cross-level unification: A computational exploration of the link between
deterioration of neurotransmitter systems dedifferentiation of cognitive abilities in old age. Cognitive
Neuroscience of Memory. L.-G. N. H. J. Markowitsch. Seattle, WA, US, Hogrefe & Huber Publishers:
103-146.
Li, S. C. and S. Sikstrom (2002). "Integrative neurocomputational perspectives on cognitive aging,
neuromodulation, and representation." Neurosci Biobehav Rev 26(7): 795-808.
Libon, D. J., S. X. Xie, et al. (2007). "Patterns of neuropsychological impairment in frontotemporal dementia."
Neurology 68(5): 369-75.
Liljestrom, M., A. Tarkiainen, et al. (2008). "Perceiving and naming actions and objects." Neuroimage 41(3):
1132-41.
Lovden, M., M. Ronnlund, et al. (2004). "The extent of stability and change in episodic and semantic memory
in old age: demographic predictors of level and change." J Gerontol B Psychol Sci Soc Sci 59(3): P130-
4.
Madden, D. J., W. L. Whiting, et al. (2004). "Age-related changes in neural activity during visual target
detection measured by fMRI." Cereb Cortex 14(2): 143-55.
82
Nisi, M., A. M. Longoni, et al. (2000). "Misure italiane per l'accordo sul nome, familiarità ed età di
acquisizione per le 260 figure di Snodgrass e vanderwart (1980)." Giornale Italiano di Psicologia
XXVII(1): 205-217.
Oldfield, R. (1971). "The assessment and analysis of handedness: The Edinburgh inventory."
Neuropsychologia 9: 97-113.
Park, D. C., G. Lautenschlager, et al. (2002). "Models of visuospatial and verbal memory across the adult life
span." Psychol Aging 17(2): 299-320.
Park, D. C., A. D. Smith, et al. (1996). "Mediators of long-term memory performance across the life span."
Psychol Aging 11(4): 621-37.
Persson, J. and L. Nyberg (2006). "Altered brain activity in healthy seniors: what does it mean?" Prog Brain
Res 157: 45-56.
Prull, M. W., L. L. Dawes, et al. (2006). "Recollection and familiarity in recognition memory: adult age
differences and neuropsychological test correlates." Psychol Aging 21(1): 107-18.
Rajah, M. N. and M. D'Esposito (2005). "Region-specific changes in prefrontal function with age: a review of
PET and fMRI studies on working and episodic memory." Brain 128(Pt 9): 1964-83.
Rand-Giovannetti, E., E. F. Chua, et al. (2006). "Hippocampal and neocortical activation during repetitive
encoding in older persons." Neurobiology of Aging 27: 173-182.
Raz, N., F. M. Gunning, et al. (1997). "Selective aging of the human cerebral cortex observed in vivo:
differential vulnerability of the prefrontal gray matter." Cereb Cortex 7(3): 268-82.
Reuter-Lorenz, P. A., J. Jonides, et al. (2000). "Age differences in the frontal lateralization of verbal and
spatial working memory revealed by PET." J Cogn Neurosci 12(1): 174-87.
Reuter-Lorenz, P. A. and C. Lustig (2005). "Brain aging: reorganizing discoveries about the aging mind."
Curr Opin Neurobiol 15(2): 245-51.
Reuter-Lorenz, P. and K. Cappell (2008). "Neurocognitive aging and the compensation hypothesis." Current
Directions in Psychological Science 17(3): 177-182.
83

Rossini, P. M. and G. Dal Forno (2004). "Integrated technology for evaluation of brain function and neural
plasticity." Phys Med Rehabil Clin N Am 15(1): 263-306.
Rypma, B. and M. D'Esposito (2000). "Isolating the neural mechanisms of age-related changes in human
working memory." Nat Neurosci 3(5): 509-15.
Salthouse, T. A. (2001). "Structural models of the relations between age and measures of cognitive
functioning." Intelligence 29: 93-115.
Silvestrini, M., L. M. Cupini, et al. (1998). "Bilateral hemispheric activation in the early recovery of motor
function after stroke." Stroke 29(7): 1305-10.
Snodgrass, J. G. and M. Vanderwart (1980). "A standardized set of 260 pictures: norms for name
agreement, image agreement, familiarity, and visual complexity." J Exp Psychol [Hum Learn] 6(2): 174-
215.
Sowell, E. R., B. S. Peterson, et al. (2003). "Mapping cortical change across the human life span." Nat
Neurosci 6(3): 309-15.
Tulving, E., H. J. Markowitsch, et al. (1996). "Novelty and familiarity activations in PET studies of memory
encoding and retrieval." Cerebral Cortex 6: 71-79.
Warburton, E., C. J. Price, et al. (1999). "Mechanisms of recovery from aphasia: evidence from positron
emission tomography studies." J Neurol Neurosurg Psychiatry 66(2): 155-61.
Ward, N. S. and R. S. Frackowiak (2006). "The functional anatomy of cerebral reorganisation after focal
brain injury." J Physiol Paris 99(4-6): 425-36.
Weiller, C., C. Isensee, et al. (1995). "Recovery from Wernicke's aphasia: a positron emission tomographic
study." Ann Neurol 37(6): 723-32.
Wickens, T. D. (2002). Elementary signal detection theory. Oxford, Oxford University Press.
Wieser, M. J., A. Muhlberger, et al. (2006). "Is emotion processing affected by advancing age? An event-
related brain potential study." Brain Res 1096(1): 138-47.
Wingfield, A. and M. Grossman (2006). "Language and the aging brain: patterns of neural compensation
revealed by functional brain imaging." J Neurophysiol 96(6): 2830-9.
84

Appendix A
Table 1a. Neuropsychological performance of healthy elderly controls.
Cognitive functions Neuropsychological test Healthy elderly controls (mean and SD)
General cognitive functioning MMSE (Folstein et al., 1975) 28,75
(1,29) Short story recall (Spinnler and Tognoni, 1987) 12,08
(3,34) Immediate recall 15-word list (Carlesimo et al., 1996) 43,79
(10,98) Delayed recall 15-word list (Carlesimo et al., 1996) 9,17
(3,64) eLTM
Delayed recall of the complex Rey’s figure (Carlesimo GA et al., 2002)
18,92 (7,06)
Digit span FW (Orsini et al., 1987) 5,86 (1,08) STM
Corsi’s block test (Orsini et al., 1987) 5,18 (0,95)
Copy of drawings (Spinnler and Tognoni, 1987) 13,04 (1) Praxis
Copy of the complex Rey’s figure (Carlesimo GA et al., 2002) 31,77 (3,67)
Language comprehension Token test (Spinnler and Tognoni, 1987) 34,17
(1,18) Palms and Pyramids test (Horward D and K, 1992) 51,57
(1,08) Lexical and semantic knowledge Picture naming test (Luzzatti, Wilmes et al, 1987) 89,45
(1,17) Semantic Fluency (Novelli et al., 1986) 24,17
(5,39) Lexical and semantic knowledge + Executive functions Phonemic Fluency (Novelli et al., 1986) 36,25
(9,89) Visual search (Spinnler and Tognoni, 1987) 54,39
(5,36) Trail Making test A (Giovagnoli, 1996) 52,04
(16,09) Executive functions
Trail Making test B (Giovagnoli, 1996) 101,48 (47,14)
Abstract reasoning Raven’s Coloured Progressive Matrices (Raven 1984) 30,42 (4,03)
MMSE= Mini-Mental State Examination; eLTM= episodic long-term memory; STM= short-term memory
85

Table 2a. Main effects for the four experimental tasks
x y z Z score x y z Z score Brain regions Left hemisphere Right hemisphere Picture naming task Inferior Frontal gyrus, pars orbitalis -42 24 -2 3.8* Inferior Frontal gyrus, pars tri. -50 22 26 5.6*° -42 28 4 4.2*° Middle Frontal gyrus -44 42 18 3.4* SMA -4 12 50 6.0*° Precentral gyrus -44 6 32 6.4*° Postcentral gyrus -50 -6 48 6.6*° Inferior Parietal lobule -26 -70 48 4.2*° Superior Temporal pole -54 14 -2 5.3*° Parahippocampal gyrus -14 -34 -8 4.2*° Lingual gyrus -10 -42 -2 3.7* Fusiform gyrus -44 -54 -22 Inf*° Inferior Occipital gyrus -44 -72 -14 Inf*° -44 -82 -6 Inf*° Middle Occipital gyrus -42 -86 -2 Inf*° 32 -92 16 Inf*° Calcarine fissure -10 -78 8 4.0* Superior Occipital gyrus -26 -86 26 Inf*° 22 -90 34 5.9*° Cerebellum -36 -40 -28 7.6*° 36 -42 -24 7.5*° 26 -52 -18 5.4*° Sentence judgement task Inferior Frontal gyrus, pars orbitalis -46 24 -12 Inf*° Inferior Frontal gyrus, pars tri. -50 20 18 Inf*° Precentral gyrus -42 2 50 7.3*° Superior Temporal pole -52 12 -20 Inf*° 46 22 -16 5.9*° 44 24 -20 5.5*° Inferior Temporal gyrus -50 -58 -22 5.8*° Middle Temporal gyrus -62 -20 -6 Inf*° 60 -22 -8 Inf*°
62 -10 -10 Inf*° Parahippocampal gyrus 16 -30 -12 5.3*° 20 -24 -16 4.8*° Lingual gyrus -12 -34 -8 7.4*° -2 -64 4 5.0*° Middle Occipital gyrus -30 -84 42 4.3*° Calcarine fissure -2 -92 2 5.4*° -6 -96 -6 4.8*° Cerebellum -8 -36 -4 7.4*° 4 -76 -14 4.1* Thalamus -4 -16 10 5.6*° Amygdala -20 -4 -18 4.8*° IT FOLLOWS IN THE NEXT PAGE
86

Brain regions x y z Z score x y z Z score Left hemisphere Right hemisphere Picture recognition task Inferior Frontal gyrus, pars orbitalis 48 44 -12 4.2 46 48 -8 4.1 Inferior Frontal gyrus, pars op. -50 18 36 6.5*° 50 22 38 7.3*° Inferior Frontal gyrus, pars tri. -48 26 32 7*° 50 36 20 Inf*° -46 42 12 5*° Middle Frontal gyrus -48 14 36 6.4*° 42 42 32 Inf*° 48 26 34 7.7*° SMA 4 24 48 6.3*° Precentral gyrus -42 6 34 5.4*° -44 8 34 6.6*° Insula -34 22 -4 5.8*° 38 22 -6 7.5*° 36 22 -6 Inf*° Angular gyrus 36 -66 50 7.2*° Superior Parietal lobule -32 -62 50 6.3*° Fusiform gyrus -42 -74 -16 Inf*° -42 -58 -20 Inf*° Lingual gyrus -12 -36 -8 5.6*° 14 -36 -8 7.0*° Inferior Occipital gyrus -44 -72 -14 Inf*° 30 -80 -10 4.2 Middle Occipital gyrus -30 -88 18 Inf*° 30 -90 14 Inf*° 34 -90 12 Inf*° Calcarine fissure -6 -78 8 7.0*° 10 -80 10 6.7*° 4 -88 14 6.7*° Superior Occipital gyrus -24 -80 36 7.8*° Cerebellum -38 -64 -20 Inf*° 26 -52 -18 Inf*° -10 -40 -6 5.5*° 26 -48 -20 Inf*° Sentence recognition task Inferior Frontal gyrus, pars orbitalis -46 28 -10 Inf*° 48 24 -14 6.8*° 40 24 -10 6.2*° Inferior Frontal gyrus, pars tri. -50 20 20 Inf*° 48 28 30 6.5*° -48 22 24 Inf*° Inferior Frontal gyrus, pars op. -48 18 34 Inf*° 52 20 40 5.6*° Middle Frontal gyrus 50 16 48 5.8*° SMA 0 26 48 6.2*° Angular gyrus -38 -64 52 Inf*° 42 -68 50 7.5*° -52 -68 28 3.2 Inferior Temporal gyrus -58 -52 -20 6.3*° -50 -58 -22 5.4*° Middle Temporal gyrus -64 -20 -4 Inf*° 62 -10 -10 Inf*° -64 -36 -6 Inf*° 60 -22 -8 Inf*° Parahippocampal gyrus -20 -24 -16 3.8 Calcarine fissure -2 -86 -10 5.7*° 0 -94 0 5.3*° -4 -98 -2 5.0*° x, y, and z are the stereotactic coordinates of the activations in the MNI space. Statistical threshold p<.001 uncorrected;
cluster size ≥ 100. ° Z-score statistically significant also after the FWE (Family-wise Error) correction. * Z-score statistically significant also after the FDR (False Discovery Rate) correction.
87

Table 3a. Direct comparisons between the four experimental tasks masked on the main effect of each task Brain regions x y z Z score x y z Z score Left hemisphere Right hemisphere PNT > PRT Inferior Frontal gyrus, pars op. -50 12 12 3.7 Rolandic opercular gyrus -52 10 4 3.7 Postcentral gyrus -50 -12 44 5.6 SJT > SRT Superior Temporal gyrus 52 -2 -12 2.5 Middle Temporal gyrus -54 -4 -18 2.8 54 -2 -26 3.7 Inferior Temporal gyrus -54 0 -32 3.1 -48 6 -34 2.7 Parahippocampal gyrus -28 -18 -24 2.8 18 -32 -10 4.1 -18 -20 -16 2.6 Calcarine fissure -6 -58 6 3.4 Cerebellum -22 -28 -24 2.6 4 -58 4 2.6 -12 -40 -10 3.6 PRT > PNT Superior Frontal medial gyrus 4 28 48 5.1 Middle Frontal gyrus 46 12 48 5.9 44 26 40 6.1 Insula -34 20 -6 4.1 36 22 -8 Inf Inferior Parietal gyrus -36 -60 52 4.2 Angular gyrus 42 -66 50 6.0 Precuneus -8 -80 50 2.9 Cuneus 18 -76 42 4.9 12 -82 44 5.0 Superior Occipital gyrus -16 -76 42 3.8 Lingual gyrus -26 -78 -14 3.6 -22 -68 -12 3.2 Cerebellum -30 -66 -18 3.8 16 -50 -12 2.4 14 -38 -10 3.4 SRT > SJT Middle Frontal gyrus -44 24 38 3.1 44 22 46 3.9 42 14 48 3.9 Middle Frontal gyrus orb. -38 50 0 4.6 Inferior Frontal gyrus, pars 44 32 30 4.6 Angular gyrus -38 -60 48 Inf 40 -66 48 7.3 x, y, and z are the stereotactic coordinates of the activations in the MNI space. Statistical threshold p<.001 uncorrected;
cluster size ≥ 100. ° Z-score statistically significant also after the FWE (Family-wise Error) correction. * Z-score statistically significant also after the FDR (False Discovery Rate) correction.
88

Table 4a. Brain regions of shared activation in olders and youngers..
Brain regions x y z Z score x y Z Z score Left hemisphere Right hemisphere Picture naming task Inferior Frontal gyrus, pars tri. -50 24 30 3.7 -48 34 18 3.3 Precentral gyrus -42 8 34 3.6 Superior Occipital gyrus -20 -90 30 5.0 26 -94 20 5.7 Sentence judgement task Inferior Frontal gyrus, pars orbitalis -48 24 -4 5.6 Inferior Frontal gyrus, pars op. 54 6 -22 5.1 Inferior Frontal gyrus, pars tri. -50 20 16 6.5 -50 28 4 5.5 Precentral gyrus* -44 8 36 4.4 Superior Temporal pole -48 16 -22 5.4 Seperior Temporal gyrus* -52 -6 -4 4.1 Middle Temporal gyrus -60 -24 -4 Inf 60 -22 -8 Inf -60 -38 -4 Inf 62 -12 -10 Inf Parahippocampal gyrus -18 -20 -16 4.6 -14 -28 -14 4.5 Cerebellum -4 -36 -2 4.7 Picture Recognition Task Superior Frontal medial gyrus* 2 28 48 5.3 Middle Frontal gyrus 44 32 36 5.4 Inferior Frontal gyrus, pars orbitalis 42 22 -14 6.7 Inferior Frontal gyrus, pars tri.* 48 26 32 5.6 -46 22 26 3.6 48 32 22 5.6 Inferior Frontal gyrus, pars op. -50 18 34 4.0 Precentral gyrus* -44 6 34 4.8 Insula* -34 22 -6 5.1 Angular gyrus* 36 -66 48 5.3 Superior Occipital gyrus* 28 -68 40 3.8 Middle Occipital gyrus -30 -94 6 6.9 32 -92 14 7.0 Fusiform gyrus -42 -72 -16 Inf -42 -56 -20 Inf Cerebellum -36 -40 -28 4.5 Sentence Recognition Task Middle Frontal gyrus -46 12 40 6.0 Inferior Frontal gyrus, pars op. -50 18 18 5.6 Precentral gyrus* -42 6 44 6.3 Angular gyrus* -38 -66 52 5.3 44 -68 50 4.6 Superior Temporal pole -50 14 -20 4.7 Middle Temporal gyrus -64 -22 -4 Inf Middle Temporal gyrus -64 -38 -6 Inf Middle Occipital gyrus -34 -76 40 5.4
The communalities were calculated as conjunctions between the simple effect of group for each task using an exlusive
masking technique in order to exclude the contribution of the brain regions that were either hypo or hyperactivated. * = brain regions commonly activated by youngers and olders that fell within the pattern of GM density reduction
89

Test references
Carlesimo GA, Buccione I, et al. (2002). "Standardizzazione di due test di memoria per uso clinico: Breve
Racconto e Figura di Rey." Nuova Rivista di Neurologia 12: 1-13.
Carlesimo, G. A., C. Caltagirone, et al. (1996). "The Mental Deterioration Battery: normative data, diagnostic
reliability and qualitative analyses of cognitive impairment. The Group for the Standardization of the
Mental Deterioration Battery." Eur Neurol 36(6): 378-84.
Folstein, M. F., S. E. Folstein, et al. (1975). ""Mini-mental state". A practical method for grading the cognitive
state of patients for the clinician." J Psychiatr Res 12(3): 189-98.
Giovagnoli, A. R., M. Del Pesce, et al. (1996). "Trail making test: normative values from 287 normal adult
controls." Ital J Neurol Sci 17(4): 305-9.
Howard, D. and K. Patterson (1992). Pyramids and Palm Trees: A Test of Semantic Access from Pictures
and Words. Bury St Edmonds, Thames Valley Publ Co.
Luzzatti, C., Willmes, K., Bisiacchi, P., De Bleser, R., Faglia, L., Mazzucchi, A., et al. (1987). "The Aachen
Aphasia Test (AAT). II. Psychometric properties of the Italian version " Archivio di Psicologia, Neurologia
e Psichiatria 48 480–519.
Novelli, G., C. Papagno, et al. (1986). "Three clinical tests for the assessment of verbal long-term memory
function. Norms from 320 normal subjects." Archivio di Psicologia, Neurologia e Psiachiatria 47(2): 278-
296.
Orsini, A., D. Grossi, et al. (1987). "Verbal and spatial immediate memory span: normative data from 1355
adults and 1112 children." Ital J Neurol Sci 8(6): 539-48.
Raven , J. (1984). CPM. Coloured Progressive Matrices. OS, Firenze.
Spinnler, H. and G. Tognoni (1987). Standardizzazione e taratura italiana di test neuropsicologici. Milano,
Masson Italia Periodici.
90

CHAPTER 4: THE HAROLD MODEL: REAL OR APPARENT REDUCTION OF FUNCTIONAL ASYMMETRIES?
4.1. Introduction
4.1.1. The Hemispheric Asymmetry Reduction in Older adults as described in the literature
During the last decade a number of studies showed that, notwithstanding the old age, our brain is able
to maintain a certain level of plasticity (see Greenwood 2007 for a recent review). As described in the
previous chapters this plasticity may manifest it-self by recruiting additional brain regions in order to maintain
a good level of behavioural performance. This ability seems to be in a way peculiar of graceful aging, i.e. of
those elderly subjects that can maintain an adequate cognitive profile (as described by Cabeza, Anderson et
al. 2002 and in the Chapter 3 of this dissertation).
Among the several neurocognitive models and theoretical accounts that tried to characterize neural
plasticity in graceful aging, the most popular is the so called HAROLD13 model proposed by Cabeza (2002).
Starting from a qualitative review of 11 PET and fMRI studies investigating age-related changes in episodic
long-term memory (eLTM), working memory (WM), inhibitory control and perception, Cabeza suggested that
the age-related neurofunctional changes would be represented by a significant reduction of the functional
lateralization of the prefrontal cortex (PFC). Moreover, the author assumed that the age-related changes in
functional lateralization would be task-dependent. For example, the well known HERA model14 (Tulving,
Kapur et al. 1994; Nyberg, Cabeza et al. 1996) could not be applied to elderly people because the right PFC
– that is typically associated with retrieval processes – would play a role also in encoding tasks, while the left
PFC would be recruited also during the retrieval phase, giving rise to the same neurofunctional output, i.e. a
reduction of the functional lateralization of the PFC.
13 This acronym stands for Hemispheric Asymmetry Reduction in Older Adults. 14 The acronym stands for Hemispheric Encoding Retrieval Asymmetry. This model predicts that the left PFC is associated with the encoding of information in the episodic long-term memory, while the right PFC would be mostly involved in retrieval from episodic long-term memory.
91

A further step in the description of the HAROLD model was made in 2002, when Cabeza’s group
(Cabeza, Anderson et al. 2002) compared a group of high-functioning elderly subjects and a group of low-
functioning olders with a group of young controls in order to distinguish whether the loss of functional
lateralization in the PFC was to be interpreted in term either of compensation or of de-differentiation. The
results showed that only high-functioning olders had a reduction of hemispheric functional asymmetry,
supporting the idea that the HAROLD pattern was due to the recruitment of compensatory strategies that
would have helped the elderly subjects in maintaining a juvenile level of performance.
If this were the case, then one could predict that in high-functioning elderly subjects a transitional
disruption of the left PFC during the retrieval of stimuli from episodic long-term memory should cause a
significant reduction of their behavioural performance, as they would not be able to adequately recruit the
neural network underlying compensatory strategies.
On the basis of this simple logic, some years later Rossi and colleagues (2004) used the interfering
effect of rTMS on the right and left PFC to further assess the compensatory nature of the hemispheric
asymmetry reduction in aging. A group of young and a group of elderly participants were challenged with a
visuo-spatial recognition memory task, but in this sample of participants the Cabeza’s findings were only
partly replicated. Indeed, the results showed that, in the group of olders, the rTMS had a bilateral
detrimental effect in the recognition phase, but not in the encoding one; suggesting that the HAROLD
pattern was associated with compensatory processes in a task-related manner, at least in that specific
group of olders.
The compensatory role of hemispheric asymmetry reduction in olders was further investigated in a
recent paper by Duverne and colleagues (2009). In this fMRI study, a group of healthy olders and a group
of young controls were scanned while performing an animacy decision task with printed words. After the
scanning, the participants were required to judge whether a printed word presented on a PC-station was
either an old-word, i.e. a word seen during the scanning session, or a new-word. The authors’ aim was to
characterize the relationship between BOLD signal during incidental encoding and subsequent memory
performance. The results showed that the elderly participants that obtained a lower score at the
92

recognition tests had also a more bilateral pattern of activation during the encoding phase. These results
suggest once again that the hemispheric asymmetry reduction in healthy aging, when present, may not
necessarily have a compensatory nature.
In the light of these contradictory findings, it is necessary to make some methodological
considerations. Indeed, the published fMRI studies describing the reduction of functional asymmetry in
older adults do not explicitly test functional asymmetry by means of laterality indexes, rather they support
the HAROLD pattern only at a descriptive level. The choice of a qualitative approach to propose such a
precise anatomical model may be somehow misleading and may be the reason why different techniques
and different experimental tasks lead to these contradictions.
Moreover, the HAROLD pattern has been always described exclusively in the PFC and mainly using
episodic and working memory tasks (i.e. investigating cognitive functions that tend to progressively decline
as age-goes-by). Further, only one study reported a qualitative hemispheric asymmetry reduction during a
lexical-semantic task (abstract/concrete judgment), that corresponded to the encoding condition of a
memory task (Stebbins, Carrillo et al. 2002)15. Thus, it is still to be established whether the manifestation
of hemispheric asymmetry reduction in older adults can be triggered exclusively by tasks belonging to the
life-long declining category or also by relatively more stable cognitive functions (Hedden and Gabrieli
2004), while from the anatomical point of view it is still to be established whether reductions in functional
lateralization may be recorded also in other brain regions beyond PFC.
15 This means that form the cognitive point of view it is not clear whether to consider this task as belonging either to the so
called late-life declining functions (e.g. lexical-semantic memory, number knowledge etc..), or to the life-long declining functions (episodic long-term memory, working memory, perception etc..). The definition of late-life and life-long declining functions can be found in Hedden, T. and J. D. Gabrieli (2004). "Insights into the ageing mind: a view from cognitive neuroscience." Nat Rev Neurosci 5(2): 87-96.
93

4.1.2. Is HAROLD really HAROLD? Methodological issues in the assessment of functional
lateralization
The discussion of “hemispheric asymmetry reduction in older adults” requires a short description of the
methodological issues related with the assessment of functional lateralization.
In the functional neuroimaging literature the degree of lateralization of a specific cognitive function can
be assessed using two different approaches: (a) the voxel-count approach, and (b) the voxel-wise
approach.
With the voxel-count method, the functional lateralization is expressed in term of lateralization indexes
(LI) that can be calculated as follows:
LI = f QLH - QRH
QLH + QRH
In this formula “f” is a scaling factor, typically 1 or 100, which defines the range of LI values, while QLH
and QRH represent the number of activated voxels (surviving a fixed threshold) of the left and of the right
hemisphere respectively. If the LI value is a positive number, then the cognitive function is left lateralized,
while if the LI is negative, then the cognitive function is right lateralized (Binder, Swanson et al. 1996).
Using the voxel-wise method, on the contrary, a direct statistical comparison between the level of
activation of each voxel of the left hemisphere and the homologue voxel of the right hemisphere is
calculated. In this case the output is not represented by a number, but by a “statistical lateralization map”
(SLM, Liégeois, Connelly et al. 2002), i.e. by an anatomical map of the brain regions that are significantly
lateralized.
Notwithstanding the non-invasive nature of functional neuroimaging studies and the relatively intuitive
nature of the two approaches described above, the evaluation of hemispheric lateralization is not always
straightforward. As suggested by Seghier (2008), different methodological factors have to be taken into
account when assessing functional lateralization: (a) the method and the kind of index used, (b) the
volume of interest considered and (c) the threshold selected for the statistical comparisons. The pool of
94

methodological options that a researcher has to consider when assessing functional lateralization with
neuroimaging techniques is described in figure 4.1. The different methodological options can be combined
in different ways, giving rise to different procedures and in some cases different results (see Jansen,
Menke et al. 2006 for a recent review).
For example, it has been shown that the SLM has a number of advantages compared to the LI
approach. As described by Liègeois and colleagues (2002, page 1865), the SLM is based on a direct
statistical parametric comparison between left and right task-induced activation, while the calculation of LI
is based on the ratio between the numbers of right and left activated voxels. As a consequence, the
authors suggested that the voxel-count method may produce more false negative results than a voxel-wise
approach. For instance, consider a region of interest (ROI) “A” which includes 10 voxels and it is located in
the left precentral gyrus and its homologue ROI in the righ precentral gyrus (ROI “B”). In ROI “A” 6 voxels
out of 10 are activated during a picture naming task and the pattern of activation is the same also in ROI
“B”, in this case using the voxel-count approach the LI would be zero, suggesting that the cognitive
function investigated is not lateralized in that region. However, it might be the case that the 6 left voxels
are more active than the homologue voxels on the right. In this case, the voxel-wise method would not
produce a null result, but a SLM were the 6 left voxels have a higher intensity. Thus, it may be suggested
that the SLM approach has a lower probability of producing false negative results.
A further problem derives from the choice of the volume of interest. Both with the voxel-count method,
both with the voxel-wise one, functional lateralization can be assessed either in the whole brain, or in
specific region of interest (ROI). This is a generic issue in neuroimaging studies and the choice between
these two possibilities depends both on what the researchers are interested in, both on the state of
knowledge in that particular field of research. Thus, if there is a specific anatomical hypothesis to test, one
may explore functional lateralization using a ROI-based approach and by doing this there will be the
advantage of minimizing the problem of multiple comparisons. On the contrary, if one is interested in
exploring functional lateralization without any a-priori anatomical hypothesis, then the whole volume
analysis would be a better solution.
95

Figure 4. 1. Methodological issues that have to be taken into account when studying functional lateralization.
The last problem is the one related to the choice of the statistical threshold. In this regard, two different
approaches can be used: (a) to maintain a fixed threshold, in this case the result will be read in terms of
activated voxels, (b) to maintain a fixed percentage of activated voxels and, as a consequence, to express
the results in terms of probability.
When using the first approach, i.e. fixed threshold, a researcher can run into two opposite and
extreme situations. Indeed, the choice of a relatively low threshold (i.e. of an high p-value) will produce an
higher number of false positive voxels across the whole brain, thus giving rise to a bilateral pattern of
activation and, as a consequence, to a low level of functional lateralization, while the choice of a relatively
96

conservative threshold (i.e. of a lower p-value) will have the disadvantage of increasing the number of true
negative cases.
A possible solution to this dilemma has been proposed by Binder and colleagues (1996). The authors
plotted the LI as a function of statistical thresholds and showed that LI can reach a sort of plateau, where
the threshold basically has no more effect. On the basis of this observation, Jansen and colleagues (2006)
suggested that assessing functional laterality selecting a statistical threshold that correspond to the
plateau level could make the lateralization measure less dependent by the threshold per se.
Another possible solution to overcome the statistical threshold issue is to explore functional
lateralization at a fixed percentage of activated voxels (Knecht, Jansen et al. 2003). However, also in this
case the level of arbitrariness is as high as in the fixed threshold approach. Moreover, this approach has
the disadvantage of being relatively problematic when the level of activation is not particularly high, as
there may not be power enough to calculate the functional lateralization.
Thus, on the basis of the methodological issues discussed above, a question rises: if the explicit and
formal assessment of functional lateralization is such a delicate process, and the results of this process
have to be “taken with a grain of salt”, how can we be confident that HAROLD is really HAROLD?
That is to say, if the evidence collected so far about the hemispheric asymmetry reduction in older
adults comes from qualitative reports and not from statistical explicit comparisons, then it might be the
case that the HAROLD pattern is not as robust and reproducible as we’ve thought so far.
4.1.3. What is missing in the HAROLD model?
In this brief introduction a number of issues about the HAROLD model raised:
a) Does the HAROLD pattern represent a real decrement of functional lateralization?
b) Does the HAROLD pattern apply also to other brain regions than the PFC?
97

c) Does the HAROLD pattern can be applied also to cognitive tasks that do not required high level of
controlled processes and that remain relatively stable in aging, such as for example lexical-semantic
tasks?
4.2. Aim
In this study we addressed all the issues listed above. In particular, in order to quantitatively assess
the level of functional lateralization in elderly participants and to compare it to the one of young subjects,
an ad-hoc lateralization analysis based on a voxel-wise approach with a fixed statisti threshold was
adopted.
The lateralization analysis was applied to the BOLD signal collected during the 4 experimental tasks
described in Chapter 3. The re-assessment of those data in term of laterality measure allowed us to
evaluate whether the reduction of functional lateralization, when existent, may manifest itself not only
during rather controlled tasks – such as episodic long-term memory recognition – but also during relatively
automatic, or at least less controlled, assignments – such as lexical-semantic processing.
Finally, the adoption of a “whole brain volume” approach allowed us to explore whether a significant
reduction of functional lateralization in the olders may occur also in brain regions outside PFC.
4.3. Materials and methods
4.3.1. Participants
For a complete description of the participants please refer to section 3.3.1.
4.3.2. Materials, procedure and fMRI methods
The fMRI study included four different tasks, two related to lexical-semantic knowledge, i.e. picture
naming task and sentence judgement task, and two tasks tapping eLTM recognition, i.e. picture recognition
98

and sentence recognition. A complete description of the experimental tasks, of the experimental procedures
and of the fMRI methods can be found in the section 3.3.2, 3.3.3 and 3.3.4 of this dissertation respectively.
4.3.3. Statistical analyses
The fMRI data were at first converted from the DICOM to the ANALYZE format using the software
MRIcro (Rorden and Brett 2000). The converted images were rotated by 180° around the y (anterior-
posterior) axis so that the left and right hemispheres were reversed the resulting images were then saved in
the neurological convention (so that the right hemisphere is on the right side of the image). Afterwards all
time series were realigned to the first volume in order to account for any movement during the fMRI session.
After the realignment, the images were transformed to the stereotaxic space using a 16 parameters
normalization routine. It is worth noting that in order to better evaluate functional differences between the left
and the right hemispheres, a symmetrical template had been used during the normalization phase. The
stereotactically normalised scans were smoothed through a Gaussian filter of 10x10x10 mm to improve
signal to noise ratio. After this pre-processing steps, the four experimental conditions for each subject were
modelled in a block design, and the BOLD signal was convolved with a standard HRF (hemodynamic
response function) as implemented in the statistical parametric mapping software SPM2 (Friston, Holmes et
al. 1995) .
Finally, global differences in fMRI signal were compensated using proportional scaling for all voxels and
a high-pass filtering procedure was used to remove high peaks from the BOLD signal that could represent,
for example, physiological noise from cardiac and respiratory cycles rather than specific cognitive activity.
A three-step statistical analysis, based on the general linear model (GLM, Friston 2005), was then
performed.
The first step implied a fixed-effect analysis in which condition-specific effects were calculated. The
fixed-effect analyses were performed separately for each fMRI session of each participant allowing us to
generate individual contrast images (con_images) containing the voxel-by-voxel information about the effect
99

size of the difference between the experimental and the baseline conditions expressed in the neurological
convention (i.e. the right hemisphere is on the right side). These images are referred to as “neuro”.
Second, the con_images extracted from each subject in each experimental task were rotated of 180°
along the y (anterior-posterior) axis so that the left and right hemispheres were reversed (conforming the
images to the radiological convention, i.e. the right hemisphere is on the left side and vice versa). These
images are referred to as “radio”.
In the last step, a direct comparison of activations between homotopic voxels was obtained by
performing a second-level ANOVA (Friston, Stephan et al. 2005) conforming to random effect analysis. In
particular, the difference between homotopic voxels was performed comparing for each task separately the
neuro con_images with the radio ones. The result of these comparisons was a SLM caculated using a voxel-
wise approach with a fixed statistical threshold. The statistical threshold was set at p<.001 in order to
conform to the one adopted in the first neurofunctional study designed to explore the HAROLD model
(Cabeza, Anderson et al. 2002). The functional lateralization was assessed only in the voxels significantly
activated during the task at p < .01 by means of an inclusive masking technique.
The formal voxel-wise comparison between the healthy olders’ SLM and the young controls’ one was
calculated by comparing the two laterality maps with a voxel-by-voxel t-test; the statistical threshold for this
comparison was set at p < .05. Moreover, an inclusive masking technique was used in order to constrain the
statistical tests only to the voxels that were activated during the task, namely to the main effect of task. The
statistical threshold for the inclusive mask was set at p < .01. Although improbable, it might be the case that
from this comparison, regions significantly left-lateralized in the group of young subjects are visualized
together with regions that are significantly right-lateralized in the group of olders. Thus, in order to constrain
the contrast only to the brain regions significantly more lateralized in the group of youngers, a small volume
correction was applied considering as volume of interest the masked-SLM of the youngers at p<.001.
100

4.4. Results
4.4.1. Statistical Lateralization Map
Picture naming task. The group of young controls showed a predominantly left-lateralized pattern of
activation during the picture naming task. The left-lateralized network included the middle frontal gyrus, the
inferior frontal gyrus, the precentral gyrus and the SMA, the insula, the postcentral gyrus, the superior and
inferior parietal lobule, the supramarginal gyrus, the superior temporal pole and the middle temporal gyrus.
At the same threshold the group of healthy olders did not show any significant lateralization (see Table 4.1).
Sentence judgment task. In this task the group of young participants recruited a significant lef-lateralized
pool of areas including the inferior frontal gyrus, the precentral gyrus, the inferior parietal lobule, the
supramarginal gyrus and the lateral temporal cortices. Similarly, the group of healthy elderly participats
showed a significant left-lateralized network including the inferior frontal gyrus, the precentral gyrus, the
superior and inferior parietal lobule, the middle and inferior temporal gyrus, the parahippocampal gyrus and
the middle occipital gyrus (see Table 4.2).
Picture recognition task. When young participants were invited to recognize pictures, they activated a
predominantly right-lateralized set of brain regions which included the middle and the inferior frontal gyrus,
the inferior parietal lobule the angular gyrus, the fusiform gyrus, the middle occipital gyrus and part of the
calcarine region. A significant functional lateralization was also found in the left postecentral gyrus. Also in
this case, the group of olders did not show any significant functional lateralization (see Table 4.3).
Sentence recognition task. The youngers showed a significant left-lateralized pattern of activations that
included the middle and inferior frontal gyrus, the precentral gyrus, the insula, the superior and inferior
parietal lobule, the superior and middle temporal gyrus, the parahippocampla gyrus, the middle occipiatal
gyrus and the cerebellum. Although less extended, the group of healthy elderly participants recruited a
similar left-lateralized neural network which included the left inferior frontal gyrus, the precentral gyrus, the
angular gyrus, the middle temporal gyrus and the inferior temporal gyrus (see Table 4.4).
101

4.4.2. Between-group comparisons
Picture naming task. The statistical comparison between the youngers and olders’ SLM, showed that
elderly controls were significantly less left-lateralized in the inferior frontal gyrus (pars triangularis and pars
orbitalis), in the precentral gyrus, in the insula and in the middle occipital gyrus (See Table 4.1).
Table 4.1. Brain regions significantly lateralized in the group of young controls and in the group of healthy olders in the picture naming task. In the last part of the table, the regions significantly less lateralized in the group of elderly participants are reported
Brain regions x y z Z score x y z Z score Left hemisphere Right hemisphere Young participants Inferior Frontal gyrus, pars orbitalis -32 24 -8 3.1 Inferior Frontal gyrus, pars triangularis -46 36 0 4.6 -44 30 4 4.4 Inferior Frontal gyrus, pars opercularis -52 10 12 4.6 -48 16 20 4.5 Precentral gyrus -50 -4 48 6.6 -44 0 34 5.4 SMA -8 14 48 3.7 Insula -34 20 2 3.6 Superior Parietal lobule -18 -66 56 3.7 Superior Temporal Pole -52 12 -2 5.8 Middle Occipital gyrus -44 -64 0 4.0 38 -88 20 3.6 -24 -66 38 4.3 Cerebellum 30 -72 -20 3.1 Elderly participants -- -- -- -- -- -- -- -- -- Elderly < Young Inferior Frontal gyrus, pars triangularis -46 20 20 1.8 Inferior Frontal gyrus, pars opercularis -40 4 28 1.7 -36 4 28 1.7 Precentral gyrus -50 0 46 2.9 -56 10 34 1.8 Insula -46 10 -4 2.2 Middle Occipital gyrus -44 -64 0 2.4 -24 -66 38 2.2
Sentence judgment task. In this task the group of elderly participants resulted less left-lateralized in the
inferior frontal gyrus (pars opercularis), in the superior temporal pole, in the superior temporal gyrus and in
the middle one (Table 4.2).
102

Table 4.2. Brain regions significantly lateralized in the group of young controls and in the group of healthy olders in the sentence judgment task. In the last part of the table, the regions significantly less lateralized in the group of elderly participants are reported.
Brain regions x y z Z score x y z Z score Left hemisphere Right hemisphere Young participants Inferior Frontal gyrus, pars orbitalis -46 34 -6 5.0 Inferior Frontal gyrus, pars triangularis -50 24 10 4.7 -48 20 16 4.9 Inferior Frontal gyrus, pars opercularis -50 12 22 5.1 -52 14 4 5.1 Precentral gyrus -44 -4 50 5.1 Inferior Parietal lobule -28 -70 44 4.2 Supramarginal gyrus -52 -46 24 3.6 Superior Temporal gyrus -56 -2 -10 3.6 Middle Temporal gyrus -56 -46 -4 6.0 -58 -60 8 5.0 Inferior Temporal gyrus -56 -58 -4 5.4 -48 -56 -22 3.8 Elderly participants Inferior Frontal gyrus, pars orbitalis -48 32 -4 4.5 -46 36 -4 4.4 Inferior Frontal gyrus, pars triangularis -50 30 2 4.6 -46 32 18 4.8 Precentral gyrus -40 0 48 6.4 Middle Temporal gyrus -58 -54 8 6.0 -62 -38 4 5.6 Inferior Temporal gyrus -60 -52 -14 6.5 Parahippocampal gyrus -30 -18 -24 3.3 Middle Occipital gyrus -42 -80 30 4.9 -32 -84 40 5.0 Elderly < Young Inferior Frontal gyrus, pars opercularis -54 12 30 1.8 Superior Temporal pole -50 8 -14 2.1 Superior Temporal gyrus -54 -2 -8 3 Middle Temporal gyrus -58 -68 0 1.9
Picture recognition task. During the picture recognition task, the healthy olders showed a significant
reduction of the functional lateralization of the right hemisphere in the middle frontal gyrus, in the inferior
frontal gyrus (pars orbitalis), in the superior and inferior parietal lobule, in the angular gyrus, in the middle
occipital gyrus and around the calcarine fissure.
103

Table 4.3. Brain regions significantly lateralized in the group of young controls and in the group of healthy olders in the picture recognition task. In the last part of the table, the regions significantly less lateralized in the group of elderly participants are reported.
Brain regions x y z Z score x y z Z score Left hemisphere Right hemisphere Young participants Middle Frontal gyrus 38 38 28 4.9 Inferior Frontal gyrus, pars orbitalis 32 38 -18 3.4 44 24 -12 4.0 Inferior Parietal lobule 48 -50 52 3.5 Angular gyrus 42 -62 56 3.4 Fusiform gyrus 20 -38 -14 3.9 Middle Occipital gyrus 36 -70 32 4.4 Calcarine fissure 10 -72 16 4.0 Elderly participants -- -- -- -- -- -- -- -- -- Elderly < young Middle Frontal gyrus 40 36 30 2.2 42 46 18 2 Inferior Frontal gyrus, pars orbitalis 36 26 -6 1.8 44 26 -6 1.8 Superior Parietal lobule 38 -62 58 2.3 Inferior Parietal lobule 40 -52 48 3 Angular gyrus 40 -56 52 2.7 36 -86 22 1.7 Calcarine fissure 10 -72 16 2.2
Sentence recognition task. In this task, the group of healthy elderly participants showed a significant
reduction of the functional lateralization in the left insula, in the left superior and middle temporal gyrus.
104

Table 4.4. Brain regions significantly lateralized in the group of young controls and in the group of healthy olders in the sentence recognition task. In the last part of the table, the regions significantly less lateralized in the group of elderly participants are reported.
Brain regions x y z Z score X y z Z score Left hemisphere Right hemisphere Young participants Middle Frontal gyrus -30 8 48 3.5 Inferior Frontal gyrus, pars orbitalis -46 36 -2 7.2 Inferior Frontal gyrus, pars triangularis -48 22 12 5.3 -48 20 16 5.4 Inferior Frontal gyrus, pars opercularis -46 10 30 4.0 -48 16 18 5.3 Precentral gyrus -44 2 46 5.2 -44 0 40 5.0 Insula -32 20 6 3.5 -36 18 6 3.6 Superior Parietal lobule -28 -70 54 4.6 Inferior Parietal lobule -36 -56 56 3.3 Superior Temporal Pole -50 14 -4 5.8 Superior Temporal gyrus -56 -2 -10 4.3 -52 -44 22 4.3 Middle Temporal gyrus -56 -48 -2 5.8 -60 -60 0 5.9 Parahippocampal gyrus -18 -24 -18 3.5 Middle Occipital gyrus -30 -68 40 5.1 Cerebellum -48 -56 -24 3.5 Elderly participants Inferior Frontal gyrus, pars orbitalis -48 32 -6 3.8 Inferior Frontal gyrus, pars opercularis -54 18 12 4.3 Precentral gyrus -44 0 46 4.2 Angular gyrus -36 -58 40 3.5 Middle Temporal gyrus -58 -54 8 4.9 -62 -42 8 3.9 Inferior Temporal gyrus -60 -52 -8 5.1 Elderly < young Insula -44 14 -2 2.3 -44 12 -6 2 Superior Temporal gyrus -56 -2 -10 2.1 Middle Temporal gyrus -60 -12 -6 1.8
105

Figure 4.2. Statistical lateralization map of young participants (in yellow) and asymmetry reductions in olders adults (in red). The bar-graphs represent the magnitude of the BOLD effect in the stereotactic coordinate corresponding to the center of the blue-cross.
106

4.5 Discussion
4.5.1. Reduction of functional lateralization and compatibility with the HAROLD model
In 2002, Cabeza proposed the HaROLD model (Cabeza 2002) on the basis of the results of 11
neuroimaging studies investigating age-related neurofunctional changes in episodic long-term memory,
working memory, visual perception and inhibition.
As described in the introduction, the evaluation of functional asymmetry reduction in older adults has
always been reported only at descriptive level. However, notwithstanding the lack of quantitative evidence,
Cabeza (2002) described also a number of possible outcomes of parametric analyses that, in his opinion,
would be compatible with the HAROLD model and that we are going to review in the light of our results.
According to Cabeza’s proposal, the only incompatible scenario with the HAROLD model would be the
presence of a bilateral pattern of activation in the youngers and of a lateralized pattern of activation in the
olders (scenario 1, figure 4.3). Moreover, he suggested that a null result in the group of elderly subjects
would mean that the cognitive function investigated is not significantly lateralized at all (scenario 2 and 3)
and thus, also a null SLM would be compatible with the HAROLD model. However, in our opinion this may
not be the case as the olders’ SLM may be null because of a significant age-related decrement of the BOLD
signal (scenario 2). In this case, then it would not be correct to address the null result in term of the
HAROLD model.
This is the reason why in this study we did not exclusively look at the anatomical outcome of the SLMs,
but also at the BOLD level recorded in the regions significantly less lateralized in the group of elderly
subjects (see the bra-graphs in Figure 4.2).
107

Figure 4.3. Possible outcomes of the parametric assessment of functional lateralization (SLM) in healthy yougers and olders. The symbol “+” indicates that the scenario is compatible with the HAROLD model, while “-“ indicates that the scenario does not represents a reduction of functional lateralization in healthy olders.
The scenarios described in Figure 4.3 were then used to account for the results of our SLMs, and the
compatibility of our results with the HAROLD model were assessed not only by looking at the results of the
comparison between youngers’ and olders’ SLM, but also considering the level of activation extracted from
the most significant voxel.
On the basis of this logic, the results emerging from the sentence judgment task were close to the
situation described in the scenario number 4 and showed that in this task the reduction of functional
lateralization in the inferior frontal gyrus (pars opercularis), in the superior temporal pole, in the superior
temporal gyrus and in the middle temporal gyrus was due to the recruitment of the controlateral brain
regions (see the bar-graph Figure 4.2).
A similar pattern of results was found in the picture recognition task (scenario 3) and in the sentence
recognition task (scenario 4).
The only result that did not seem to fit with the HAROLD model was the one emerging from the picture
naming task. Indeed, in this case the difference between the SLM of the youngers and of the olders in the
108

inferior frontal gyrus (pars triangularis and opercularis), in the precentral gyrus, in the insula and in the
middle occipital gyrus did not reflect a reduction of functional lateralization due to the bilateral recruitment of
these brain regions, but it rather represented a significant lack of activation in the group of healthy olders
(see the bar graph in Figure 4.2). Thus, on the basis of this evidence, the results of the picture naming task
will not be further discussed.
Taken together, these results suggest that the reduction of functional lateralization in healthy olders
should be carefully addressed, in particular when the elderly participants’ SLM is a null-map. Indeed, in this
case the difference between the youngers’ and the olders’ SLM may reflect different underlying patterns: (i)
a real reduction of functional lateralization (like in the picture recognition task), (ii) an apparent reduction of
functional lateralization due to the lack of activation in the group of healthy elderly subjects (like in the picture
naming task).
4.5.2. Is the PFC the only target of HAROLD?
The original version of the HAROLD model referred to a specific anatomical substrate: the PFC.
However, as described in the introduction, a significant hemispheric asymmetry reduction in older adults
may manifest itself not only in the frontal lobes, but also in other brain regions.
In the neuroimaging literature on healthy aging there are some examples of age-related bilateral
recruitment of brain regions outside the frontal lobe. For example, in a recent paper Tyler and colleagues
(Tyler, Shafto et al. 2009) found that the elderly participants recruited more than youngers not only the right
frontal region, but also the right temporal areas during a syntactic task. Grady and colleagues (Grady,
Bernstein et al. 2002) found a positive correlation between face processing and the activity of occipito-
parietal cortices bilaterally only in the group of helthy olders and not in the group of youngers. Dennis and
colleagues (Dennis, Kim et al. 2007) found a bilateral activation of the middle temporal gyrus bilaterally
during false memory encoding only in the group of healthy elderly participants.
109

The results of our study statistically confirmed this evidence. Indeed, a significant decrement of
functional lateralization was found in the temporal regions - both in the sentence judgment task, both in the
sentence recognition task – and in the partieto-occipital regions during the picture recognition task.
These data suggest that the anatomical aspect of the HAROLD model should be extended also to other
brain regions beyond the frontal lobe.
4.5.3. Does HAROLD manifest itself also in semantic memory tasks?
In the first paper about the HAROLD model, Cabeza (2002) reported only one published study
investigating age-related changes in lexical-semantic processing and whose findings were compatible with
the HAROLD pattern (Stebbins, Carrillo et al. 2002). Moreover, the author suggested that although age-
related asymmetry reductions occur for a variety of different cognitive functions, up to this momento the
generalizability of the HAROLD model within cognition is not so straightforward (2002). In his opinion if the
HAROLD pattern is triggered exclusively by higher cognitive functions, such as memory, executive functions
and language, and not by lower level functions, such as sensory-motor processing, then this would be a
proof in favour of the psychogenic16 nature of HAROLD. However, if this were the case, then our parametric
assessment of functional lateralization should fit with the HAROLD pattern irrespectively by the task of
interest (i.e. we should find a significant HAROLD pattern in all the 4 experimental tasks as they all belong to
the so called higher-level cognitive functions category, according to Cabeza’s suggestion).
However, the results of our study do not fully support this idea. Indeed, the incompatibility between the
age-related changes in the picture naming task with the HAROLD pattern suggests that the division between
higher- and lower-order cognitive functions may be too simplistic. The same argument can be applied also to
the task-categorization that we described in the introduction: the division between life-long declining and
late-life declining functions. Indeed, if the HAROLD pattern would be triggered only by those cognitive
functions that progressively decline as we age, then our analyses should have shown a significant HAROLD
16 The term “psychogenic process” referes to a change in cognition that causes a change in the brain (e.g. a change of cogntive strategy that cause a change of neural activity), qhile the term “neurogenic process” referes to the opposite situation, i.e. a change in the brain that cause a change in cognition (e.g. a progressive decremento of GM density in frontal cortex that cause significant disexecutive symptoms).
110

pattern only in the two episodic long-term memory recognition tasks (as one would have expected).
However, once again, this was not the case as a significant reduction of functional lateralization was found
also in the sentence judgement task.
Thus, how to explain this pattern of results?
A possible solution may come from the concept of cognitive load and from the so called CRUNCH
hypothesis (compensatory-related utilization of neural circuits, Reuter-Lorenz and Cappell 2008). In this
perspective, the aging brain would “recruit more neural resources to achieve computational output
equivalent to that of a younger brain” (Reuter-Lorenz and Cappell 2008, page 179). In the case of HAROLD
the additional neural resources recruited to face with the task-demand could be the brain regions of the
controlateral hemisphere. Thus, it may be assumed that the factor triggering the recruitment of controlateral
brain regions in older adults is the overload of the “typical neural network” associated with the task. In this
case, then a reduction of functional lateralization would not emerge necessarily with higher-cognitive
functions, nor only with life-long declining functions, but it would rather manifests itself in particularly
challenging conditions. This proposal is in line with the results reported by Cabeza and colleagues (2002),
where the recruitment of controlateral PFC was manifested by the high-performing adults only in the most
demanding task (the source memory task) and not in the less demanding one (word-paired recall).
Moreover, this hypothesis would explain also why the results of fMRI and of TMS studies do not completely
fit17.
Indeed, if HAROLD is triggered by cognitive load, then the main responsible for controlateral recruitment
would not be the cognitive task per-se, but rather the particular condition in which the task is performed, the
selected material and the cognitive general profile of the older subjects selected for the experiment.
Further studies are needed in order to better address this hypothesis.
17 In the study by Rossi and colleagues (2004 "Age-related functional changes of prefrontal cortex in long-term memory: a repetitive transcranial magnetic stimulation study." J Neurosci 24(36): 7939-7944), the lack of HAROLD during the encoding phase may be actually explained in term low task-demand. Indeed, the encoding task was a simple discrimination task between out-door and in-door visual scene (a quite simple task).
111

Acknowledgments
This work will be presented at the 28th European Workshop on Cognitive Neuropsychology, Bressanone (Italy,
January 2010).
112

References
Binder, J., S. Swanson, et al. (1996). "Determination of language dominance using functional MRI: a
comparison with the Wada test." Neurology 46(4): 978-984.
Cabeza, R. (2002). "Hemispheric asymmetry reduction in older adults: the HAROLD model." Psychol Aging
17(1): 85-100.
Cabeza, R., N. Anderson, et al. (2002). "Aging gracefully: compensatory brain activity in high-performing older
adults." Neuroimage 17(3): 1394-1402.
Dennis, N. A., H. Kim, et al. (2007). "Effects of aging on true and false memory formation: an fMRI study."
Neuropsychologia 45(14): 3157-3166.
Duverne, S., S. Motamedinia, et al. (2009). "The relationship between aging, performance, and the neural
correlates of successful memory encoding." Cereb Cortex 19(3): 733-744.
Friston, K. J. (2005). "Models of brain function in neuroimaging." Annu Rev Psychol 56: 57-87.
Friston, K. J., A. P. Holmes, et al. (1995). "Analysis of fMRI time-series revisited." Neuroimage 2(1): 45-53.
Friston, K. J., K. E. Stephan, et al. (2005). "Mixed-effects and fMRI studies." Neuroimage 24(1): 244-252.
Grady, C. L., L. J. Bernstein, et al. (2002). "The effects of encoding task on age-related differences in the
functional neuroanatomy of face memory." Psychol Aging 17(1): 7-23.
Greenwood, P. M. (2007). "Functional plasticity in cognitive aging: review and hypothesis." Neuropsychology
21(6): 657-673.
Hedden, T. and J. D. Gabrieli (2004). "Insights into the ageing mind: a view from cognitive neuroscience." Nat
Rev Neurosci 5(2): 87-96.
Jansen, A., R. Menke, et al. (2006). "The assessment of hemispheric lateralization in functional MRI--
robustness and reproducibility." Neuroimage 33(1): 204-217.
Knecht, S., A. Jansen, et al. (2003). "How atypical is atypical language dominance?" Neuroimage 18(4): 917-
927.
Liégeois, F., A. Connelly, et al. (2002). "A direct test for lateralization of language activation using fMRI:
comparison with invasive assessments in children with epilepsy." Neuroimage 17(4): 1861-1867.
113

Nyberg, L., R. Cabeza, et al. (1996). "PET studies of encoding and retrieval: the HERA model." Psychonom.
Bull. Rev 3: 135-148.
Reuter-Lorenz, P. and K. Cappell (2008). "Neurocognitive aging and the compensation hypothesis." Current
Directions in Psychological Science 17(3): 177-182.
Rorden, C. and M. Brett (2000). "Stereotaxic display of brain lesions." Behav Neurol 12(4): 191-200.
Rossi, S., C. Miniussi, et al. (2004). "Age-related functional changes of prefrontal cortex in long-term memory:
a repetitive transcranial magnetic stimulation study." J Neurosci 24(36): 7939-7944.
Seghier, M. (2008). "Laterality index in functional MRI: methodological issues." Magn Reson Imaging 26(5):
594-601.
Stebbins, G. T., M. C. Carrillo, et al. (2002). "Aging effects on memory encoding in the frontal lobes." Psychol
Aging 17(1): 44-55.
Tulving, E., S. Kapur, et al. (1994). "Hemisperic encoding/retrieval asimmetry in episodic memory: Positron
emission tomography findings." Proc. Natl. Acad. Sci. USA 91: 2016-2020.
Tyler, L., M. Shafto, et al. (2009). "Preserving Syntactic Processing across the Adult Life Span: The
Modulation of the Frontotemporal Language System in the Context of Age-Related Atrophy." Cereb
Cortex.
Wada, J. and T. Rasmussen (2007). "Intracarotid injection of sodium amytal for the lateralization of cerebral
speech dominance. 1960." J Neurosurg 106(6): 1117-1133.
114

PART 3 – PATHOLOGICAL AGING
- PART 3 -
PATHOLOGICAL AGING
115

CHAPTER 5: The old brain who still plays at being young:
neurofunctional and neuromorphological evidence of the lack of
compensation in pathological aging
5.1. Introduction
5.1.1. Compensatory processes and the adaptive aged brain
“To compensate” literally means making amends for loss or injury.
In cognitive neuropsychology, this term has been applied to all processes that allow a subject to
counterbalance an impairment by developing new skills or finding different strategies; from the neuroscience
perspective, the phenomenon has been related to the ability of an injured brain to remodel its functional
networks to face with a particular cognitive task. For instance, “compensatory processes” have been
associated with any kind of reorganization following a neurological damage, as in the post-stroke condition
(Rossini and Dal Forno 2004; Heiss and Thiel 2006; Ward and Frackowiak 2006), or in case of sensory loss
following deafferentation (Ramachandran and Hirstein 1998; Elbert, Sterr et al. 2002).
However, experience alone can also lead to functional cortical reorganization associated with better
behavioural outcomes. An extensive animal literature demonstrates that both exercise (Cotman and
Berchtold 2002; Kramer, Bherer et al. 2004; Zhou and Merzenich 2007) and an enriched environment
(Kempermann, Kuhn et al. 1998; Kempermann, Gast et al. 2002; Kobayashi, Ohashi et al. 2002; Sale,
Berardi et al. 2009) can improve learning and lead to remodelling of brain structures, in old age just as
during development. In the same vein, neuroimaging studies on humans show that training and learning may
not only induce functional changes in task-specific neural networks, but they may also modify structural
measures as gray and white matter density, and enhance behavioural performance (Maguire, Gadian et al.
2000; Elbert, Sterr et al. 2002; Draganski, Gaser et al. 2004).
116

Thus, adaptive behaviours seem to occur in humans as in a wide variety of species (Cecchi, Petreanu et
al. 2001; Duffau 2006). Essentially, they are regarded as striking evidence in favour of the possibility to
maintain a certain level of plasticity over the adult life span (Burke and Barnes 2006).
Cognitive Neuroscience of Aging is a recent discipline in which authors have largely addressed the
concept of “compensation”. This fruitful research area includes the study of age-related changes in both
brain and cognition which occur as the time goes by (Cabeza 2004), and, by doing so, it has to focus not
only on loss but also on adaptation to loss, proving the remarkable capability for reorganization of the aged
brain.
Indeed, post-mortem and in vivo studies show a structural decline in the older brain, resulting in lower
gray matter (GM) volume that seems to be due to synaptic density loss (Terry and Katzman 2001); these
effect seems to be regionally specific, with medial-frontal lobe and in some cases medial temporal structures
being more affected, while posterior areas as occipital visual cortices remain relatively stable (Good,
Johnsrude et al. 2001; Grieve, Clark et al. 2005; Raz, Lindenberger et al. 2005; Kalpouzos, Chetelat et al.
2009). Other structural measures such as cortical thinning (Head, Buckner et al. 2004; Salat, Buckner et al.
2004) and white matter integrity (Bartzokis, Cummings et al. 2003; Head, Buckner et al. 2004) confirm this
“complex patchwork of decline and stability” (Raz 2007), with an anterior-to-posterior gradient of structural
decay. Besides, functional studies indicate neurotransmitter depletion, especially in the dopamine levels
(Braver and Barch 2002; Li and Sikstrom 2002) and in serotonin receptor availability (Wang, Volkow et al.
1995), while the BOLD signal connected with the “default mode” network (Raichle, MacLeod et al. 2001)
shows significantly less suppression, a fact that has been related to a decreased specificity of neural activity
with a lower signal-to-noise ratio (Grady, Springer et al. 2006; Persson, Lustig et al. 2007); likewise,
functional connectivity between many cortical and subcortical areas appears to be less efficient (Achard and
Bullmore 2007).
However, none of these evidence of age-related impairments in the hard-wired components of cognition
shows a consistent correlation with cognitive performance, nor they suffice to account for inter- and intra-
individual variability (Salat, Kaye et al. 2002; Rodrigue and Raz 2004; Van Petten 2004).
117

Moreover, a large body of behavioural research has found that the impact of aging on cognition is far
from having a global effect. As described in the previous chapters, Hedden and Gabrieli (2004) resume
these variable outcomes in three patterns of age-related changes in cognition: (i) life-long declining functions
(processing speed, working memory and episodic memory encoding), (ii) late-life declining functions (short-
term phonological memory, vocabulary and semantic knowledge), and (iii) life-long stable functions
(autobiographical memory, emotional processing and implicit and automatic memory).
What remains unclear, yet, is the neural process underlying differences among cognitive domains and
individuals, and what allows satisfying performance (at least in term of accuracy) in spite of the previously
described neurobiological decay. Some authors refer to “compensation” to address this issue (Cabeza,
Anderson et al. 2002).
Functional neuroimaging studies have reported age-related changes in neural activity in a variety of
tasks (see for a review Greenwood 2007). In healthy aging, these neurofunctional alterations can be
classified either as hypoactivations in the task-specific neural networks typically recruited by young controls
or as hyperactivations; these latter can be located either in task-specific brain regions recruited by young
controls, or in brain areas that fall outside the typical neural network. Moreover, while hypoactivations are
typically considered sings of age-induced inefficiency in dedicated cortical circuits, it is still under debate how
to interpret hyperactivations. Indeed, they could reflect compensatory processes as well as ineffective
recruitment of neural resource, or progression towards dedifferentiation. To sum up, it is suggested that
hyperactivation are likely to be “compensatory” only in the presence of relatively preserved performance
(Grady 2008; see table 5.2 in the third paragraph).
The description of hyperactivations can not be easily accounted for by earlier neurocognitive theories of
aging which typically focus on a defective “common cause”, such as the inhibition hypothesis (Hasher,
Stoltzfus et al. 1991), the hypofrontality hypothesis (West 1996), or the processing speed theory (Salthouse,
Hancock et al. 1996).
For this reason, new theoretical frameworks have been recently proposed. In particular, the most
influential imaging-based theories and models are the HAROLD model (Hemispheric Asymmetry Reduction
118

in OLder Adults; Cabeza 2002) and the PASA pattern (Posterior-Anterior Shift in Aging; Davis, Dennis et al.
2008), which make precise predictions on the compensatory role of the Prefrontal Cortex (PFC). In the latter
view, the PFC over-activations are supposed to be not only coupled with under-activations in posterior
temporal and occipital cortices, but also positively correlated with higher performances. The HAROLD model
rather concentrates on the more bilateral activation patterns specifically shown by high-performing healthy
olders (but not by low-performing ones) when compared with younger controls (Cabeza, Anderson et al.
2002; Rosen, Prull et al. 2002). Thus, these models militate against the so called “de-differentiation account”
(Li and Lindenberger 1999; Duverne, Motamedinia et al. 2009), which interprets over-activations as an age-
related difficulty in engaging specialized neural mechanisms, possibly linked to a more general degradation
of transcallosal inhibition and cortical network disruption (O'Sullivan, Jones et al. 2001; Buckner and Logan
2002).
However, other data suggest that compensatory processes could be more task-specific, since many
alternative neural networks - beyond PFC alone - could be differently involved, according to the peculiar
demands related to the task (Chapter 3).
Moreover, in our previous study age-related atrophy has been found having no linear correlation with
hypo- or hyperactivations either at whole brain volume level or at regional level. These results implicitly
suggest that there is not a direct relationship between structural changes and functional reorganization.
Recently, the interpretation of hyperactivations in olders has also been explained in terms of Functional
Plasticity (Greenwood 2007) and Cognitive Scaffolding (STAC, Scaffolding Theory of Aging and Cognition;
Park and Reuter-Lorenz 2009). These approaches try to describe compensation as the result of both
experience (including application of different strategies) and impairment-driven processes, and refer to
internally- and externally-induced modifications. Particularly, Park & Reuter-Lorenz (2009) interpret age-
related changes as part of a broader life-long process due to the dynamic and adaptive features of the brain,
which allow us to cope with external and internal challenges, e.g. during learning and in neurofunctional
reorganisation after both brain and peripheral damage.
119

5.1.2. What when something goes wrong: imaging studies on compensatory processes in MCI
Although recent theoretical frameworks put forward explicit assumptions on what allows high
performance in graceful healthy aging, to date this area of knowledge has not been systematically linked to
studies on pathological aging.
Since the Multiple Factor Framework has been proposed (Gabrieli 1996; Albert 1997), normal
senescence and dementia are not considered anymore as a single continuum of severity (Huppert 1994);
instead, distinct factors are thought to interact18, generating, as a consequence, age-associated cascades
that can affect several neural systems in different measures.
Within this theoretical framework, Buckner (2004) raised an interesting and provocative issue: if the
same elements differently combined can generate variable outcomes, one might enquire which specific
processes lead some individuals to grow old remaining highly-functioning -with the only detectable changes
in cognitive slowing and in most attention-demanding tasks- while others show sever memory impairments
and dementia early in senescence. One may assume that the possibility of recruiting compensatory
processes plays a role in supporting graceful aging. However, a question remains open: which factors
promote or prevent “wise” healthy compensation?
So far, behavioural and neuroimaging research on degenerative pathologies took no notice of such a
perspective. A clear example of this attitude can be found in research on the Alzheimer’s disease (AD), the
most examined form of dementia19, and on its prodromal form, the amnestic Mild Cognitive Impairment
(aMCI; Petersen, Smith et al. 1999). In most cases, these studies focus on clinically relevant analyses aimed
at isolating possible early diagnostic hallmarks (see for a recent review Schroeter, Stein et al. 2009). By
doing so, they obviously compare behavioural and neurofunctional data of healthy olders with the ones of
pathological subjects, finding differences in performance and in patterns of activations; nevertheless, they
rarely refer to the mechanisms beneath such a difference. This fact turns out to be particularly misleading
18 These variables -each with distinct causes and risk factors- range from genetic predisposition (e.g. APOE genotype) to environmental causes and life-experience (e.g. educational level). When co-occurrent, these factors may interact each-others, causing different pathologic behavioural outcomes. 19 2334 investigate neurofunctional changes in AD, out of the 6135 studies including the keywords “fMRI” and “dementia” (Results from PubMED)
120

when authors invoke the presence of “compensatory processes” to justify the maintenance of some degree
of accuracy in behavioural tasks (e.g. Smith, Pankratz et al. 2007), without an explanation of what prevents
those processes to occur later on along the illness progression, or in the cognitive domains where the
performance actually decreases.
For the reason that episodic memory is the cognitive function most characteristically impaired in AD,
research on this pathology usually applies both encoding and retrieval tasks to investigate episodic and
semantic memory domains, and they often focus on the role of MTL dysfunction. When AD patients are
compared with elderly controls, hippocampus and parahippocampal areas constantly show distinctive
patterns of hypoactivations, interpreted as a sign of the disease progression (Rombouts, Barkhof et al. 2000;
Machulda, Ward et al. 2003). In some cases the impairment in MTL networks is associated with over-
activations in parietal and frontal areas (Sperling, Bates et al. 2003), which are interpreted by some in terms
of compensatory processes (Pariente, Cole et al. 2005), and by others in terms of a pathological alteration of
the “default network” (Lustig, Snyder et al. 2003; Buckner, Snyder et al. 2005).
Furthermore, when MCI patients are included in the studies, the picture becomes even less clear.
Indeed, conclusions range from descriptions of MCI patients as functionally already impaired individuals
(Small, Perera et al. 1999; Machulda, Ward et al. 2003; Johnson, Schmitz et al. 2006; Petrella, Wang et al.
2007), to opposite accounts, where MCI are reported to be functionally preserved (Dickerson, Salat et al.
2004; Dickerson, Salat et al. 2005; Hamalainen, Pihlajamaki et al. 2007; Gigi, Babai et al. 2009; Woodard,
Seidenberg et al. 2009). See Table 5.1 for a summary.
Dickerson & Sperling (2008) suggest that the variability of behavioural task used during fMRI scanning
and of the degree of pathology progression may contribute to determine this inconsistent pattern of results.
Since these patients are characterised by an higher degree of atrophy in the MTL, especially in the
anterior hippocampus (Bottino, Castro et al. 2002; Pennanen, Testa et al. 2005; Whitwell, Przybelski et al.
2007), recent studies have tried to relate functional measures either with structural ones, or with clinical rate
of memory decline. Once again these studies obtained quite contradictory results. A possible explanation for
this variability has been proposed by Sperling’s group: they describe an apparently paradoxical “inverse U-
121

shaped” curve, with MCI subjects showing over-activations compared with both clinical AD patients and
normal old controls at early stages of the disease (Sperling 2007; Dickerson and Sperling 2008). The
correlation between the over-activations and the degree of atrophy within the MTL would follow the same
trend, with an initial positive relation which then turns into a negative one at later stages of the illness.
Table 5.1. Summary of functional studies with MCI patients.
Authors Method Subjects Task Perf Struct Conclusions Woodard et al. (2009) fMRI 19 MCI
19 HC Semantic memory + Y Compensation Gigi et al. (2009) fMRI 6 MCI
6 HC Semantic memory + N Compensation Laine et al. (2009) PET* 6 MCI
6 HC Dual task - N Impairment Bokde et al. (2008) fMRI 16 MCI
19 HC Visual processing + N Compensation Kaufmann et al. (2008) fMRI 6 MCI
9 HC Numerical stroop - N Impairment (cognitive effort)
Hämäläinen et al.(2007) fMRI 14 MCI 21 HC Encoding + Y Compensation
Heun et al. (2007) fMRI 21 MCI 29 HC Retrieval - N Compensation
Petrella et al. (2007) fMRI 34 MCI 28 HC Encoding - N Impairment
Jhonson et al. (2006) fMRI 14 MCI 14 HC Encoding + N Impairment
Celone et al. (2006) fMRI 27 MCI 15 HC Encoding + N “Inverse-U shaped”
curve Yetkin et al. (2006) fMRI 9 MCI
8 HC Working memory + N Compensation Dickerson et al. (2005) fMRI* 9 MCI
10 HC Encoding + Y “Inverse-U shaped” curve
Rombouts et al. (2005) fMRI 28 MCI 41 HC
Encoding, Working memory
- - N Impairment
(default network) Machulda et al. (2003) fMRI* 9 MCI
11 HC Encoding - N Impairment Small et al. (1999) fMRI* 12 MCI
4 HC Encoding ? N Impairment
The * refers to studies which have focused their statistical analyses on selected regions of interest. Namely, prefrontal
lobe (Laine et al., 2009), and different parts of the MTL (Small, Perera et al. 1999; Machulda, Ward et al. 2003; Dickerson, Salat et al. 2005). The column “Perf” reports whether the patients’ behavioural performance was preserved (+) or impaired (-), while the column “Struct” reports when the study included (Y) or not included (N) structural measures such as VBM (Hamalainen, Pihlajamaki et al. 2007; Woodard, Seidenberg et al. 2009) or the rate of hippocampal volume (Dickerson, Salat et al. 2005).
MCI = Mild Cognitive Impairment; HC = Healthy Controls
Moreover, the relation between structural measures, functional patterns of activation and behavioural
outcomes at short and long term (Celone, Calhoun et al. 2006; Miller, Fenstermacher et al. 2008) is still far
from being clear. Therefore, it might be suggested that the mere progression of atrophy in medial temporal
122

structure cannot be considered the direct cause of the functional decay shown at a certain point of the illness
progression.
Finally, so far it is impossible to assess whether the type of “compensation” sometimes found in MCI
patients is qualitatively different from the one found in healthy olders (for a description of the different types
of compensation see Table 5.2). Indeed, to date a direct comparison of the so called “compensatory” over-
activations in MCIs and healthy older subjects has never been reported, notwithstanding MCI patients,
young and old controls may be contemporary present in the same study (e.g. Sperling, Bates et al. 2003).
For these reasons, the study of compensatory processes in the MCI condition might be particularly
suitable, since it constitutes the “missing link” between an adaptive healthy neural senescence and cognitive
decline.
5.1.3. Calls for a clarification of the concept
The evidence discussed so far suggests that between behavioural, neuroanatomical and
neurofunctional (in particular expressed in term of over-activations) age-related changes there is a nonlinear
and somehow confused relationship. This lack of knowledge makes an explicit definition of the concept of
“compensation” to be worthwhile, especially when it is applied to neuroimaging studies.
Indeed, additional neural activity in olders is not always compensatory (Logan, Sanders et al. 2002;
Colcombe, Kramer et al. 2005), since it could be simply linked to dedifferentiation processes (Li and
Lindenberger 1999). According to Grady (2008), when elderly participants over-activate an area which is
also part of the task-specific neural network typically recruited by young controls, data always need to be
interpreted as an index of inefficiency of the task-specific neural network, regardless of the performance.
Indeed, this pattern would show that olders need an increased cognitive effort in order to face with the same
cognitive challenge. This cognitive effort would be considered successful or useless according to the
behavioural performance. Instead, when olders recruit brain regions which are not activated by younger
adults, the over-recruitment represents the neurofunctional correlate of either effective flexible compensation
or compensatory attempt (Cabeza, Anderson et al. 2002; Rosen, Prull et al. 2002), depending on the
123

presence of successful behavioural outcomes. Only in the latter case, it would be difficult to distinguish
between compensatory and dedifferentiation processes. In summary, the key point is the engagement of
areas that are not typically activated by younger adults coupled with successful behavioural performance.
See Table 5.2 for a detailed outline of these operational definitions.
Table 5.2. The cognitive interpretation of over-recruitment in aging.
Behavioural performance
Neurofunctional over-recruitment
Flexible compensation Similar accuracy – juvenile level New task-specific brain regions
Inflexible compensation (or successful cognitive effort) Similar accuracy – juvenile level Same task-specific brain regions
Useless cognitive effort Lower accuracy Same task-specific brain regions Dedifferentiation (or compensatory attempt) Lower accuracy Nonselective activation
The term “over-recruitment” refers here to the hyperactivations shown by older subjects compared with younger controls. The terms “similar accuracy” and “lower accuracy” refer to the possible results of the comparison (calculated with a t-test or Mann-Whitney U test) between behavioural performance of the youngers and the olders collected during fMRI/PET scans.
Lastly, the evidence of successful age-related compensation (and against the dedifferentiation account)
is brought when the activity in the “compensatory” neural network recruited by olders is associated with the
maintenance of an adequate level of performance in olders but not in younger controls. In this case, it would
be possible to invoke both a brain remodelling which includes useful additional support from compensatory
cortical regions and the possibility of an age-related adaptation to new strategies in order to face with the
task demands (as suggested in chapter 3).
This approach produces a pattern of results that should be kept separated from the amount of data
coming from studies applying event-related fMRI designs, in which authors typically isolate the neural
networks associated with correct responses to the task of interest (e.g. Heun, Freymann et al. 2007;
Woodard, Seidengerg et al. 2009). Indeed, the event-related approach necessitates caution as it may be
questioned why in some subjects the neural network associated with correct responses is not systematically
recruited in order to maintain a good level of performance.
124

5.2. Aim of the study
In the light of the literature discussed above, this study intends to investigate the neurocognitive
differences between pathological and healthy aging with particular attention to compensatory processes,
neural plasticity and their neurofunctional markers.
In particular, the aim of our analyses is to address three specific issues: (i) is an aMCI patient able to
recruit compensatory processes? (ii) when present, are aMCIs’ compensatory processes qualitatively
different from the ones proved to be present in healthy older subjects? (iii) could the lack of flexible
compensation in aMCIs be related to the structural impairment typical of the aMCI pathology?
To this end, the patterns of activation shown by a group of aMCI patients during two lexical-semantic
and two episodic long-term memory tasks have been directly compared to the activations of a group of
healthy older controls (the same helthy olders studied in Chapter 3). The logic underlying our analyses is
explained below.
Firstly, we investigated whether our aMCI patients can manifest a behavioural-neurofunctional pattern
that matches the definition of compensation as expressed by Grady (2008). We would like to remark that in
our theoretical perspective the pattern of neurofunctional over-recruitments in the aMCI group can
correspond to the manifestation of either flexible compensatory processes (in case of accurate performance)
or flexible compensatory attempts (the latter resulting from significant decrement of performance), only when
it resembled the ones found in healthy older subjects. On the contrary, over-recruitments in the brain regions
typically activated by young subjects (but no longer recruited by healthy older controls) coupled with the
maintenance of an adequate level of accuracy would correspond to inflexible compensation (or successful
cognitive effort)20.
We used these operational definitions to classify the neurofunctional differences between patients and
elderly controls in the light of our previous findings on the neural blue-print of compensatory processes in
healthy aging (Chapter 3).
20 With the term “inflexible compensation” or “effective cognitive effort” we refer to the impossibility for an aMCI patient of recruiting an alternative neural network to perform the task of interest. Thus, in this situation the patient would try to adequately perform the task simply by over-recruiting the task-specific functional neural network typically activated by young subjects.
125

Then, using a correlational approach, we assessed whether the impossibility of manifesting neural
plasticity (i.e. the pattern of neurofunctional differences between aMCIs and healthy olders that have been
classified as successful or useless cognitive effort) may be linked to the neuromorphological impairments
typical of the aMCI condition.
We predict that the impossibility for an aMCI brain of “being plastic” -and hence of recruiting alternative
neural networks to perform a given task- may be related to the neuroanatomical impairments typical of the
aMCI condition, such as the GM density loss in medial temporal areas. If this were the case, one may
expect: (i) a significant positive correlation between the amount of GM density in the medial temporal lobes
and the recruitment of the task-specific compensatory neural network, (ii) a significant negative correlation
between the amount of GM density in the medial temporal lobes and the recruitment of the dysfunctional
neural network21. Accordingly, none of these neurofunctional data should correlate with the GM density in
other brain regions that are typically found to be atrophic also in healthy aging, such as the prefrontal cortex
(these predictions are described in figure 5.1d).
5.3. Materials and Methods
5.3.1. Participants
Twenty-four healthy elderly participants (for a detailed description see section 3.3.1 in Chapter 3) and
nine patients (4 male and 5 female; mean age=71 ± 8.5; educational level= 10 ± 3.2) with a
neuropsychological profile consistent with the diagnosis of amnestic Mild Cognitive Impairment (aMCI) as
described by Petersen's diagnostic criteria (Petersen, Smith et al. 1999) took part in the study.
None of the aMCI and healthy elderly participants had any history of neurological disorders or learning
disabilities; moreover, none had diabetes, hypertension or other main medical disorders.
21 In particular, the expression “dysfunctional neural network” refers to the task-specific pool of brain regions that are typically recruited by young healthy subjects but not by highly-performing healthy olders when facing with a specific cognitive task. Besides, the term “compensatory neural network” stands for the brain regions that are over-recruited by healthy olders when compared to young controls, and that have been considered as the neural blue-print of compensatory processes in graceful aging (Chapter 3). See Material and Methods section for an operational definition.
126

All the participants were right-handed as assessed through the Oldfield scale (Oldfield 1971), and gave
their written consent to the experiment.
5.3.2. Materials
The same neuropsychological battery, experimental tasks, procedures, fMRI methods and VBM
methods described in Chapter 3 were used here.
5.3.3. Statistical analyses
5.3.3.1. Neuropsychological and Behavioural data
The neuropsychological data were mainly used as a measure to evaluate whether aMCI patients were
eligible for this study. Thus, they were firstly compared with the Italian normative data available for each test.
Moreover, in order to evaluate whether aMCIs significantly differed from healthy older controls, a series
of Mann-Whitney U test was calculated per each demographic variable (i.e. age and educational level) and
neuropsychological test. Having run 19 comparisons, a Bonferroni correction was applied and, as a result,
the corrected p-value was pcorrected < .002.
The score obtained at the Picture Naming Test from the AAT (Luzzati, Wilmes, Bisiacchi et al, 1987)
was also considered as the behavioural index for the picture naming task performed during the scanning.
A different approach was applied to analyze the behavioural responses collected during the fMRI
sessions corresponding to the sentence judgement task, the picture recognition task and the sentence
recognition task. At first, for each participant the behavioural responses were divided into 4 categories: (i)
correct responses, (ii) correct rejections, (iii) false alarms and (iv) omissions. These categories were then
used to calculate a global index of accuracy, the “d-prime (d')”, computed as follows: d' = Z(hit rate) - Z(false
alarm rate); (Wickens 2002).
The presence of significant behavioural differences between aMCI patients and healthy elderly controls
was then tested by comparing the d’ scores using the Mann-Whitney U test. Again, a correction for multiple
comparisons was applied (pcorrected <.01).
127

5.3.3.2. fMRI data
At first, a standard pre-processing was performed in order to realign the fMRI scans within each fMRI
session and to report each realigned scan within the same stereotaxic space (normalization; Ashburner and
Friston 1999). Once normalized, the scans were smoothed through a Gaussian filter of 10x10x10 mm to
improve signal-to-noise ratio.
After the pre-processing steps, for each subject the four experimental conditions were modelled in a
block design, and the BOLD (blood-oxygen-level-dependent) signal was convolved with a standard HRF
(hemodynamic response function) as implemented in the statistical parametric mapping software SPM2
(Friston, Holmes et al. 1995). The convolved signals were further processed in order to control for the global
differences (this was done using a proportional scaling for all voxels) and to eliminate possible confounding
contributions to the fMRI signal coming from cardiac and respiratory cycles (this was done using a high-pass
filtering technique).
Once modelled and cleaned the BOLD signals, a two-steps statistical analysis, based on the general
linear model (GLM, Friston, Stephan et al. 2005), was performed.
The first step corresponded to a fixed-effect analysis in which condition-specific effects were calculated.
The fixed-effect analysis was performed as described in Chapter 3.
Secondly, a second-level ANOVA (Friston, Stephan et al. 2005) was designed and estimated,
conforming to random effect analysis. In particular, the following effects were calculated:
1) Main effect for each task (e.g. both aMCI and healthy olders activations during PNT); these contrasts
were thresholded at p < .001 (uncorrected), the cluster-size level was set at 20 so that only clusters
containing more than 20 contiguous voxels are reported;
2) Common areas not affected by pathology; these were assessed by a global conjunction analysis of
the simple effects of group in each task (i.e. in picture naming, aMCIs > baseline & Olders > baseline).
These contrasts were thresholded at p < .001 (uncorrected) with a cluster size level of minimum 20
contiguous voxels, and were masked in order to exclude from this results the voxels that were significantly
128

over- or under-recruited by aMCIs (namely the contrasts described at point 3 thresholded at p < .05); by
doing so, only the voxels having the same degree of activation in the two groups were considered;
3) Effect of pathology, assessed in term of:
a) under-recruitments, i.e. a task-specific reduction of activation (e.g. aMCI < healthy olders in PNT),
b) over-recruitments, i.e. a task-specific enhancement of activation (e.g. aMCI > healthy olders in PNT),
Contrasts described at point 3 (i.e. the effects of pathology) were calculated using an inclusive masking
technique. The mask for each contrast was constituted by the main effect of each task (contrasts at point 1)
thresholded at p < .05. This was done in order to restrict each comparison to the neural network of interest,
thus reducing the problem of multiple comparisons. Once applied the inclusive masking procedure, each
contrast had been thresholded at p < .05 (uncorrected). Once more, a spatial constraint was applied
(minimum cluster-size set at 20 contiguous voxels). See also figure 5.1a.
5.3.3.3. Small volume correction and the assessment of compensation
We then verified whether the “effect of pathology” seen in aMCIs (contrasts at point 3 above) fell within
the areas that contribute to flexible compensatory processes in healthy aging (assessed in the same sample
of healthy olders when compared with young volunteers).
At a technical level, this was done by using a small volume correction (SVC; Worsley, Marrett et al.
1996)22 based on the t-maps of the compensatory and dysfunctional task-specific neural networks emerged
from the healthy elderly subjects’ neurofunctional data as described in the results section of Chapter 3.
In particular, the expression dysfunctional neural network refers to the task-specific pool of brain regions
that are typically recruited by young healthy subjects but not by highly-performing healthy olders when facing
with a specific cognitive task. Besides, the term compensatory neural network stands for the brain regions
that are over-recruited by healthy olders when compared to young controls, and that have been considered
as the neural blue-print of compensatory processes in graceful aging.
22 The use of a small volume correction approach permits to assess the degree of overlap between different contrasts, and in doing so it also reduces the problem of multiple comparisons as the volume of interest is no longer the entire brain volume, but rather a limited part of it.
129

Specifically, the searching volumes applied for the SVC corresponded to the t-maps of the hypo- and
hyper-activations described in Chapter 3 and thresholded at p<.002523 and with a spatial constraint of 50
contiguous voxels (see figure 5.1b and 5.1c).
It is worth noting that the scanner, the experimental tasks and stimuli, and the group of healthy elderly
controls were the same as the ones of the above mentioned study. As a consequence, this particular
experimental setting allowed us to directly overlap the neurofunctional differences between aMCIs and
healthy elderly controls with the neurofunctional data of our previous study.
5.3.3.4. VBM data
The anatomical differences between the two groups (namely, the areas of significant GM reduction in
aMCI patients when compared with healthy olders) were estimated with a t-test analysis on a voxel-by-voxel
basis, once the inter-subject variability of global brain volume was removed by correcting regional values
with a proportional scaling technique.
Regional effects have been reported at p < .001(uncorrected); however, it has also been reported when
a stereotactic coordinate survived the corrections for multiple comparisons available in SPM2, i.e. the Family
Wise Error correction (FWE; Kiebel, Poline et al. 1999) and the False Discovery Rate correction (FDR;
Genovese, Lazar, et al. 2002). A spatial constraint was applied, so that only clusters including more than
100 contiguous voxels are reported (see figure 5.1d).
5.3.3.5. Correlational analyses
The relationship between brain atrophy and functional changes corresponding to the lack of flexible
compensation was assessed by a correlation analysis performed using the statistical software SPSS 15.0
(Copyright © SPSS inc. 1989-2006) and following the logic described in the Aims section.
23 The value of the critical threshold results from the product of the contrast threshold (p < .05) and of the inclusive mask threshold (p<.05). The inclusive masks corresponded to the neural networks emerging from the main effect of each task.
130

131
To this end, for each task, the values of the BOLD signal of the most significant voxel that emerged from
the over-recruitments (aMCI > Healthy Olders) of the dysfunctional neural network and from the under-
recruitment (aMCI < healthy Olders) of the compensatory neural network were extracted from SPM2, as well
as the values corresponding to the GM density of the most significantly atrophic voxel in both the
hippocampi and in neocortical frontal areas.
Secondly, using SPSS we explored whether the functional values extracted correlated with the degree
of GM density of the three region of interest at whole group level, considering both patients and healthy
elderly controls. In all cases, a correction for multiple comparisons was applied, so that the final threshold
was set at p-value < .01 (see figure 5.1e).

132

Figure 5.1. Schematic representation of statistical analyses. Firstly, the neurofunctional correlates of the effect of pathology (a) in each task were assessed in terms of aMCIs over-recruitments (BLUE) and under-recruitments (YELLOW). Secondly, using a small volume correction approach, these contrasts were compared with the neurofunctional correlates of compensatory processes in healthy aging, as assessed in (b). By so doing, the overlapping coordinates included both in each contrast and in the task-specific compensatory (GREEN) and dysfunctional (VIOLET) neural networks emerged (c). Thus, we could extract the BOLD signal of the most significant voxel that emerged from the over-recruitments (aMCI > Healthy Olders) in the dysfunctional neural network and from the under-recruitments (aMCI < healthy Olders) in the compensatory neural network.
Moreover, we assessed through a VBM analysis (d) the areas showing a significant degree of atrophy in the aMCI group (RED), and we extracted the values corresponding to the gray matter density of the most significantly atrophic voxel in both the hippocampi and in neocortical frontal areas.
Finally, the presence of any significant correlation between the extracted BOLD and GM density values was assessed. The graphs at the right bottom of the figure (e) illustrate our expectation, as described in the Aims section (see p. 18). We expected significant results only when the hippocampal grey matter density was considered; in particular, we predicted a positive correlation between hippocampal GM density and the BOLD signal in the task-specific compensatory neural networks, and a negative correlation in case of the dysfunctional ones. In the graphs, each subject corresponds to a little circle; aMCI patients are represented blue, while healthy olders are in yellow (hypothetical data).
133

5.4. Results
5.4.1. Neuropsychological and behavioural results
5.4.1.1. Neuropsychological battery
The results of the neuropsychological assessment confirmed that the 9 patients included in the study
met the Petersen’s criteria for aMCI (Petersen, Smith et al. 1999). Indeed, all the aMCIs were
significantly impaired in at least one of the episodic long term memory (eLTM) tasks included in the
neuropsychological battery, notwithstanding the adequate performance at the MMSE (Table 5.3). It has
to be noticed that three out of nine patients could not adequately perform also one of the other tests
included in the neuropsychological battery. In particular, patients 2 and 5 were not able to properly
understand the procedure underlying the Trail Making Test (part B). However, the conspicuous length of
the neuropsychological battery may account for these unexpected results as the Trail Making Test (part
B) was the very last test to be performed. Finally, patient 4 obtained a score just below the cut-off at the
Copy of the Rey Complex (i.e. the patient's score was 28,5 with a cut-off of 29 at the Copy of the Rey
complex figure).
Besides, all the healthy elder controls had a neuropsychological profile completely within the normal
range, according to the Italian normative data used for each neuropsychological test.
The comparison between aMCIs and healthy olders confirmed that the two groups differed only for
the performance at the long-term memory tests. Se Table 5.4 for more details.
134

Table 5.3. Neuropsychological profile of the 9 aMCI patients. Only tests associated with pathological performance are reported
aMCI patients’ ID MMSE eLTM tests Other tests
1 29,00 IR and DR of the 15-word list
2 28,00 Short story recall Trail Making test B
3 30,00 Short story recall DR of the complex Rey’s figure
4 28,00 Short story recall DR of the complex Rey’s figure
Copy of the complex Rey’s figure
5 28,00 Short story recall DR of the complex Rey’s figure Trail Making test B
6 26,00 IR and DR of the 15-word list
Short story recall DR of the complex Rey’s figure
7 26,00 IR and DR of the 15-word list
Short story recall DR of the complex Rey’s figure
8 26,00 IR and DR of the 15-word list
9 26,00 IR and DR of the 15-word list
Short story recall DR of the complex Rey’s figure
135

Table 5.4. Comparison between the two groups’ average scores at neuropsychological tests and average demographic variable.
Healthy Olders
(mean and SD)
aMCI patients
(mean and SD)
Demographic variables
Age 62 (7,6)
71 (8,5)
Educational level 12 (4,3)
10 (3,2)
Cognitive functions Neuropsychological test
General cognitive functioning
MMSE (Folstein, Folstein et al. 1975)
28,75 (1,29)
27,44 (1,5)
Short story recall (Spinnler and Tognoni 1987)
12,08 (3,34)
5,71* (2,23)
Immediate recall 15-word list (Carlesimo, Caltagirone et al. 1996)
43,79 (10,98)
24* (8,37)
Delayed recall 15-word list (Carlesimo, Caltagirone et al. 1996)
9,17 (3,64)
2,75* (2,55)
eLTM
Delayed recall of the complex Rey’s figure (Carlesimo, Buccione et al. 2002)
18,92 (7,06)
10,11* (5,16)
Digit span FW (Orsini, Grossi et al. 1987)
5,86 (1,08)
5,37 (0,74) STM Corsi’s block test
(Orsini, Grossi et al. 1987) 5,18
(0,95) 4,37
(0,74) Copy of drawings (Spinnler and Tognoni, 1987)
13,04 (1)
12,12 (1,64) Praxis Copy of the complex Rey’s figure
(Carlesimo, Buccione et al., 2002) 31,77 (3,67)
28,89 (6,73)
Language comprehension Token test (Spinnler and Tognoni 1987)
34,17 (1,18)
32,5 (1,84)
Palms and Pyramids test (Howard and Patterson 1992)
51,57 (1,08)
48,67 (3,39) Lexical and semantic
knowledge Picture naming test (Luzzatti, Willmes, Bisiacchi et al. 1987)
89,04 (1,73)
85 (4,2)
Semantic Fluency (Novelli, Papagno et al. 1986)
21,17 (5,39)
17,14 (6,27) Lexical and semantic
knowledge & Executive functions Phonemic Fluency
(Novelli, Papagno et al. 1986) 36,25 (9,89)
26,11 (8,07)
Visual search (Spinnler and Tognoni, 1987)
54,39 (5,36)
47,67 (8,97)
Trail Making test A (Giovagnoli, Del Pesce et al. 1996)
52,04 (16,09)
79,67 (36,71) Executive functions
Trail Making test B (Giovagnoli, Del Pesce et al. 1996)
101,48 (47,14)
123,28 (28,66)
Abstract reasoning Raven’s Coloured Progressive Matrices (Raven 1984)
30,42 (4,03)
26,78 (6,36)
(*) for p-value <.002 (Bonferroni correction)
136

5.4.1.2. Behavioural performance
The analyses of the behavioural responses collected during the fMRI scans revealed a significant
difference between aMCI patients and healthy older controls not only in the two eLTM tasks, as
expected, but also in the SJT (see Table 5.5 for more details). In particular, the Mann-Withney U test
calculated for the SJT reached a significant level of p < .001 (with U=25.5, Z=-3.48); likewise, the p-value
for the PRT and the SRT was <.001 (with U=26, Z=-3.33 and U=21.5, Z=-3.56, respectively).
Table 5.5. Behavioural performance recorded during the fMRI scans
Hits Omissions False alarms Correct rejections d’
SJT 17.2 (1)
0.8 (1)
0.08 (0.4)
17.86 (0.4)
4.2 (0.6)
PRT 38.1 (6.06)
6.8 (6.06)
2.08 (4.1)
42.9 (4.1)
2.8 (1.1) Healthy Olders
SRT 16.4 (2.5)
1.5 (2.5)
0.9 (2.6)
17.1 (2.6)
3.7 (1.3)
SJT 13.9 (5.7)
4.1 (5.7)
3.5 (6.0)
14.5 (6.0)
2.2 * (1.5)
PRT 21.75 (13.9)
23.25 (13.9)
7.0 (10.9)
38.0 (10.9)
1.4* (0.5) aMCI
SRT 9.25 (5.9)
8.75 (5.9)
5.0 (5.1)
13.0 (5.1)
1.15* (1.6)
(*) for p-value < .01 (Bonferroni correction)
As described in the neuropsychological section, the performance at the picture naming subtest from
the AAT - used as behavioural index of naming abilities - did not show significant difference between the
two groups (U = 32.5, Z = -2.6; p-value < .021).
5.4.2. fMRI analyses and SVC results
A detailed description of the main effect for each task can be found in the Appendix B. Here we
concentrate on the results emerging from the assessment of the common areas, effects of pathology and
on the assessment of compensation (i.e. SVC analyses).
137

5.4.2.1. Common Areas
Picture Naming Task (PNT). aMCI patients and healthy olders showed the same level of activation in
the inferior frontal gyrus (pars triangularis), in the precentral gyrus, in the superior parietal lobule, in the
temporal pole, and in the fusiform gyrus of the left hemisphere. Moreover, aMCIs and healthy olders
commonly activated the left cerebellum, the right cuneus, and bilaterally the middle occipital gyrus. See
Table 5.6 and figure 5.2.
Table 5.6. Common Areas in PNT (i.e. the conjunction “aMCIs & Healthy Olders” exclusively masked with the effect of pathology).
Brain regions x y z Z score x y z Z score Left hemisphere Right hemisphere PNT Inferior Frontal gyrus, pars triangularis -42 26 22 3.6* Precentral gyrus -40 6 40 3.4* Superior Parietal lobule -22 -76 48 3.6* -20 -78 52 3.5* Superior Temporal pole -50 14 -16 3.7* Fusiform -42 -78 -16 Inf.*° -42 -48 -24 6.8*° Middle Occipital gyrus -26 -80 30 4.5*° 30 -92 12 5.9*° -38 -84 8 5.9*° Cuneus 10 -90 20 3.2* Cerebellum -38 -44 -26 6.8*°
x, y, and z are the stereotactic coordinates of the activations in the MNI space. Statistical threshold p < .001 uncorrected; cluster size ≥ 20. ° Z-score statistically significant also after the FWE (Family-wise Error) correction. * Z-score statistically significant also after the FDR (False Discovery Rate) correction
Sentence Judgement Task (SJT). aMCI patients and olders controls showed a similar pattern of
activation in a wide left-lateralized fronto-temporal network including the left inferior frontal gyrus (pars
orbitalis and triangularis), the left SMA, the left superior and inferior parietal lobule, the left middle
temporal pole, the left inferior temporal gyrus, the left hippocampus, the left middle occipital and lingual
gyri, and the left cerebellum. Moreover, a common level of activation was found in the right postcentral
gyrus, in the right superior temporal gyrus, and finally in the precentral gyrus, in the middle temporal
gyrus and in the superior temporal pole bilaterally. See Ttable 5.7 and figure 5.2.
138

Table 5.7. Common Areas in SJT (i.e. the conjunction “aMCIs & Healthy Olders” exclusively masked with the effect of pathology).
Brain regions x y z Z score X y z Z score Left hemisphere Right hemisphere SJT Inferior Frontal gyrus, pars orbitalis -52 26 -6 6.0*° Inferior Frontal gyrus, pars triangularis -56 18 8 6.0*° -54 24 0 5.8*° Precentral gyrus -44 -12 60 5.5*° 52 -10 58 4.3* -42 -8 58 5.4*° SMA -2 -6 64 4.5*° Postcentral gyrus 58 -12 50 4.2* Superior Parietal lobule -20 -80 54 3.9* Inferior Parietal lobule -32 -82 46 4.1* Superior Temporal pole -40 26 -18 4.6*° 48 14 -20 4.2* -40 16 -24 3.8* 44 22 -20 4.0* Superior Temporal gyrus 66 -16 8 4.7*° Middle Temporal pole -44 16 -36 4.8*° -48 14 -34 4.8*° Middle Temporal gyrus -64 -20 -4 Inf*° 62 -10 -12 6.3*° -54 -32 -4 Inf*° 56 2 -18 6.0*° Inferior Temporal gyrus -50 8 -34 4.1* Hippocampus -20 -16 -16 4.9*° Middle Occipital gyrus -28 -86 42 4.3* Lingual gyrus -10 -64 -4 3.3* -14 -56 -6 3.2* Cerebellum -16 -34 -16 4.6*° -14 -44 -12 4.4*
x, y, and z are the stereotactic coordinates of the activations in the MNI space. Statistical threshold p < .001 uncorrected; cluster size ≥ 20. ° Z-score statistically significant also after the FWE (Family-wise Error) correction. * Z-score statistically significant also after the FDR (False Discovery Rate) correction
Picture Recognition Task (PRT). Areas of shared activations between aMCIs and healthy olders
were found in the left inferior frontal gyrus (pars triangularis), in the left insula, in the left superior and
inferior parietal lobule, in the left angular gyrus, in the left superior temporal pole and inferior temporal
gyrus, and in the left inferior occipital and lingual gyri. Moreover, the contrast showed common areas of
activation in the right inferior frontal gyrus (pars opercularis), in the right superior occipital gyrus, and
finally in the middle frontal gyrus, in the precentral gyrus, in the SMA, in the insula, in the superior
temporal pole, in the fusiform gyrus, in the calcarine fissure and in the cerebellum bilaterally. See Table
5.8 and figure 5.2.
139

Table 5.8. Common Areas in PRT (i.e. the conjunction “aMCIs & Healthy Olders” exclusively masked with the effect of pathology).
Brain regions x y z Z score x y z Z score Left hemisphere Right hemisphere PRT Middle Frontal gyrus -48 18 38 6.0*° 40 24 48 4.3* Inferior Frontal gyrus, pars triangularis -58 18 4 3.7* Inferior Frontal gyrus, pars opercularis 42 14 38 3.4* Precentral gyrus -46 2 52 3.3* 56 6 48 4.3* 44 4 38 3.3* SMA -6 22 48 3.8* 6 18 50 3.3* -8 8 54 3.7* Insula -38 18 6 3.6* Superior Parietal lobule -22 -74 54 4.9*° Inferior Parietal lobule -28 -72 48 4.7*° -30 -72 44 4.6*° Angular gyrus -42 -62 48 3.8* Superior Temporal pole -48 18 -10 4.0* -52 16 -12 4.0* Inferior Temporal gyrus -48 -52 -24 3.7* Fusiform gyrus -42 -78 -16 Inf*° 38 -40 -24 4.8*° -40 -62 -18 5.7*° Superior Occipital gyrus 20 -86 38 4.0* Middle Occipital gyrus -34 -92 4 6.8*° 28 -90 14 7.4*° -34 -92 -2 6.4*° Calcarine fissure -14 -78 6 3.3* 12 -78 8 4.4* 10 -94 12 4.1* Inferior Occipital gyrus -34 -90 -6 6.5*° Lingual gyrus -34 -88 -12 6.5*° -16 -80 -14 4.6*° Cerebellum -44 -68 -18 6.6*° 26 -56 -16 5.0*° -36 -48 -24 4.4* 28 -40 -26 3.3*
x, y, and z are the stereotactic coordinates of the activations in the MNI space. Statistical threshold p < .001 uncorrected; cluster size ≥ 20. ° Z-score statistically significant also after the FWE (Family-wise Error) correction. * Z-score statistically significant also after the FDR (False Discovery Rate) correction
Sentence Recognition Task (SRT). aMCI patients and healthy olders showed common areas of
activation in many regions in the left hemisphere, namely, in the left inferior frontal gyrus (pars orbitalis
and triangularis), in the left precentral gyrus, in the left angular gyrus, in the left inferior parietal lobule, in
the left middle occipital gyrus, in the left calcarine fissure and in the left cerebellum. Moreover, a bilateral
pattern of shared activation was found in the middle temporal gyrus. See Table 5.9 and figure 5.2.
140

Table 5.9. Common Areas in SRT (i.e. the conjunction “aMCIs & Healthy Olders” exclusively masked with the effect of pathology).
Brain regions x y z Z score x y z Z score Left hemisphere Right hemisphere SRT Inferior Frontal gyrus, pars orbitalis -48 28 -6 5.7*° Inferior Frontal gyrus, pars triangularis -46 18 32 5.4*° -56 18 2 5.1*° Precentral gyrus -44 -6 58 4.5*° -42 2 38 4.2* Angular gyrus -50 -64 46 4.5*° Inferior Parietal lobule -46 -60 54 5.8*° -32 -76 52 5.5*° Middle Temporal gyrus -64 -20 -2 Inf*° 66 -28 0 6.6 *° -62 -12 -6 7.3*° 62 -10 -12 6.2 *° Middle Occipital gyrus -32 -72 36 3.2* Calcarine fissure -2 -88 -6 4.0* Cerebellum -28 -84 -44 4.9*°
x, y, and z are the stereotactic coordinates of the activations in the MNI space. Statistical threshold p < .001 uncorrected; cluster size ≥ 20. ° Z-score statistically significant also after the FWE (Family-wise Error) correction. * Z-score statistically significant also after the FDR (False Discovery Rate) correction
141

Figure 5.2. Direct comparisons between aMCIs and healthy olders. Each row illustrates the neurofunctional data emerged during a specific experimental task. RED areas represent brain regions that are equally activated by patients and controls, areas in YELLOW represent the regions that are significantly under-recruited by aMCIs when compared to healthy elderly controls (i.e. aMCI < healthy olders), while areas in BLUE represent the opposite contrast, namely, aMCIs’ over-recruitments (i.e. aMCIs > healthy olders).
142

5.4.2.2. Effect of Pathology
As described in the method section, the effect of pathology in each task was assessed in terms of
neurofunctional under- and over-recruitments in the aMCI group (i.e. aMCI < Healthy Olders and aMCI >
Healthy Olders).
Picture Naming Task (PNT). aMCI patients showed significant reduction of the neural activity in the
left prefrontal areas, and in the left fusiform and superior occipital gyri. The reverse contrast (namely
aMCI > healthy olders) showed an enhancement of neural activity in the left superior parietal lobule, in
the left inferior temporal gyrus and in a large bilateral network located in the occipital lobe. See Table
5.10 and figure 5.2.
Sentence Judgement Task (SJT). aMCI patients significantly under-recruited the left inferior frontal
gyrus (pars triangularis), the left lingual gyrus and the right superior temporal gyrus and bilaterally the
inferior temporal gyrus. On the contrary, a significant over-recruitment (aMCI > healthy olders) was found
in the left inferior frontal gyrus (pars opercularis and orbitalis), in the left supplementary motor area
(SMA), in the left postcentral gyrus, in the left middle temporal gyrus, in the left inferior temporal, in the
left hippocampus, in the left fusiform gyrus, in the left lingual gyrus, in the right middle frontal gyrus, in the
right precentral gyrus and finally in the right superior parietal lobule. Moreover, a bilateral pattern of over-
recruitment was found in the superior temporal pole, in the parahippocampal gyrus and in the precuneus.
See Table 5.11 and figure 5.2.
Picture Recognition Task (PRT). When compared with healthy elderly controls, aMCI patients
showed a significant reduction of the neural activity in the left inferior temporal gyrus, in the left middle
and inferior occipital areas, in the left cerebellum, in the medial part of the right superior frontal gyrus, in
the right middle frontal gyrus, in the right inferior frontal gyrus (pars opercularis), in the right precentral
gyrus, in the right insula and in the right angular gyrus. Moreover, a bilateral under-activation was found
in the inferior frontal gyrus (pars orbitalis and triangularis) and in the superior parietal lobule and in the
superior occipital girus. On the contrary, aMCIs showed a significant enhancement of the neural activity
in the right fusiform gyrus, in the right middle occipital gyrus, in the right cuneus and in the right lingual
143

gyrus, and bilaterally in the calcarine fissure and in the inferior occipital gyrus. See Table 5.12 and figure
5.2.
Sentence Recognition Task (SRT). aMCI patients showed a reduction of neural activation only in the
left angular gyrus. On the contrary, a significant over-recruitment was found in the left calcarine fissure, in
the left lingual gyrus and in the right superior temporal gyrus. See Table 5.13 and figure 5.2.
4.2.3. Assessment of compensation (small volume correction analysis)
The presence of flexible compensatory processes has been assessed through a small-volume
correction (SVC) approach and using as volumes of interest the t-maps corresponding to the age-related
hyper- and hypo-activations described in the Chapter 3.
In general, aMCI patients tended to under-recruit the task-specific compensatory neural networks,
while the over-recruitments always fell within parts of the task-specific dysfunctional neural networks.
Picture Naming Task (PNT). aMCI patients under-recruited both one brain region included in the
compensatory neural network (i.e. the left superior occipital gyrus) and one brain region included in the
dysfunctional neural network (i.e. the left fusiform gyrus). Instead, the opposite contrast (namely, aMCI >
healthy olders) included only brain regions belonging to the dysfunctional neural network: the left fusiform
gyrus, the left superior occipital gyrus, the left calcarine fissure, the left lingual gyrus and the left
cerebellum, and the middle and inferior occipital gyri of both hemispheres. See Table 5.10 and figure
5.3a.
144

Table 5.10. Effect of pathology in PNT in terms of under-recruitments (i.e. the contrast aMCIs < Healthy Olders) and over-recruitments (i.e. the contrast aMCIs > Healthy Olders) in the aMCI group, and assessment of compensation (SVC results).
Brain regions X y z Z score x y z Z score Left hemisphere Right hemisphere PNT aMCI < Healthy Olders Inferior Frontal gyrus, pars triangularis -50 16 28 1.9 -50 18 24 1.9 Inferior Frontal gyrus, pars opercularis -44 10 30 2.0 Precentral gyrus -44 6 32 1.7 Fusiform gyrus -46 -56 -20 1.9 (-) Superior Occipital gyrus -16 -88 40 2.2 (+) -20 -94 30 1.8 (+) aMCI > Healthy Olders Superior Parietal lobule -16 -74 54 2.3 Inferior Temporal gyrus -42 -34 -22 2.6 Fusiform gyrus -28 -52 -6 3.3 (-) -36 -40 -18 2.7 (-) Superior Occipital gyrus -16 -80 12 2.5 (-) 22 -92 8 1.9 Middle Occipital gyrus -20 -80 14 2.5 (-) 26 -90 10 2.1 -38 -70 6 2.6 (-) 28 -86 6 2.0 (-) Cuneus 22 -90 12 2.0 Calcarine fissure -6 -60 10 2.1 -18 -76 10 2.5 (-) Inferior Occipital gyrus -34 -68 -6 2.5 (-) 32 -88 -2 2.0 (-) -32 -74 -4 2.5 (-) Lingual gyrus -30 -86 -12 2.2 -20 -44 -4 3.0 (-) Lingual gyrus/Hippocampus -16 -38 2 2.6 Cerebellum -26 -38 -22 2.2 (-)
x, y, and z are the stereotactic coordinates of the activations in the MNI space. Statistical threshold p<.0025 uncorrected; cluster size ≥ 20. (+) stereotactic coordinates which survived the SVC for the compensatory neural network. (-) stereotactic coordinates which survived the SVC for the dysfunctional neural network.
Sentence Judgement Task (SJT). aMCI patients significantly under-recruited the lingual gyrus, which
is a brain region included in the task-specific compensatory neural network. They also under-recruited
part of the task-specific dysfunctional neural network, in particular the left inferior frontal gyrus (pars
triangularis), and the right middle and inferior temporal gyri.
Finally, a complex pattern of overlaps between aMCIs over-recruitments and the two task-specific
neural networks (i.e. the dysfunctional and the compensatory one) emerged. In particular, aMCIs over-
recruited many regions included in the dysfunctional neural network, such as the left inferior frontal gyrus
(pars orbitalis and opercularis), the left precuneus and bilaterally the superior temporal pole, and one
region included in the compensatory neural network (i.e. the left middle temporal gyrus).
See Table 5.11 and figure 5.3b.
145

Table 5.11. Effect of pathology in SJT in terms of under-recruitments (i.e. the contrast aMCIs < Healthy Olders) and over-recruitments (i.e. the contrast aMCIs > Healthy Olders) in the aMCI group, and assessment of compensation (SVC results).
Brain regions X y Z Z scores x y z Z score Left hemisphere Right hemisphere SJT aMCI < Healthy Olders Inferior Frontal gyrus, pars triangularis -54 28 18 2.2 (-) Superior Temporal gyrus 54 -6 -8 2.6 58 -4 -8 2.5 Middle Temporal gyrus 58 -24 -14 2.1 (-) Inferior Temporal gyrus -62 -60 14 2.6 54 -16 -18 2.1 (-) Lingual gyrus -10 -42 2 1.9 (+) aMCI > Healthy Olders Middle Frontal gyrus 46 -2 60 2.3 Inferior Frontal gyrus, pars orbitalis -30 28 -22 2.3 -34 26 -18 1.9 (-) Inferior Frontal gyrus,pars opercularis -60 16 6 2.5 -58 18 4 2.4 (-) Precentral gyrus 46 -18 64 2.6 SMA -2 -12 62 2.4 Postcentral gyrus -50 -18 44 2.2 Superior Parietal lobule 44 -44 66 3.6 Precuneus -10 -54 76 2.6 8 -50 76 2.9 -10 -68 68 2.6 Superior Temporal pole -34 10 -22 2.5 40 22 -24 2.3 (-) -34 16 -20 2.0 (-) 30 18 -28 2.0 Middle Temporal gyrus -46 -32 -2 2.4 -48 -26 -10 2.3 -66 -24 6
2.0 (+)
Inferior Temporal gyrus -46 14 -38 2.3 Fusiform gyrus -28 -2 -34 2.5 Hippocampus -30 -6 -12 2.0 Parahippocampal gyrus -20 4 -28 2.3 28 4 -28 2.8 18 -6 -18 1.9 Lingual gyrus -18 -62 -8 1.9
x, y, and z are the stereotactic coordinates of the activations in the MNI space. Statistical threshold p<.0025 uncorrected; cluster size ≥ 20. (+) stereotactic coordinates which survived the SVC for the compensatory neural network (-) stereotactic coordinates which survived the SVC for the dysfunctional neural network
Picture recognition task (PRT). aMCI patients under-recruited a broad pool of regions included in the
compensatory neural network: the left inferior frontal gyrus (pars triangularis), the right middle frontal and
inferior frontal (pars opercularis) gyri, the right precentral lobule, the right insula, the right angular gyrus,
and bilaterally the inferior frontal gyrus (pars orbitalis) and the superior occipital gyrus. They also under-
recruited the right portions of the superior occipital gyrus, the left middle and inferior occipital gyri and the
left cerebellum, which were included in the dysfunctional neural network.
146

Conversely, the SVC applied on the opposite contrast (aMCI > healthy olders) gave significant results
only when the dysfunctional neural network was considered as volume of interest, which included the left
inferior occipital gyrus, the right fusiform and lingual gyri, and the calcarine fissure and cuneus of both
hemispheres. See Table 5.12 and figure 5.3c.
Sentence recognition task (SRT). In the sentence recognition task, a significant overlap between the
aMCI’s under-recruitments and the dysfunctional neural network was found only in the angular gyrus.
Moreover part of the same volume of interest, namely the calcarine fissure, was significantly over-
recruited by the group of patients. See Table 5.13 and figure 5.3d.
Table 5.13. Effect of pathology in SRT in terms of under-recruitments (i.e. the contrast aMCIs < Healthy Olders) and over-recruitments (i.e. the contrast aMCIs > Healthy Olders) in the aMCI group, and assessment of compensation (SVC results).
Brain regions x y z Z score x y z Z score Left hemisphere Right hemisphere SRT aMCI < Healthy Olders Angular gyrus -36 -62 40 2.1 -36 -64 44 2.1 (-) aMCI > Healthy Olders Superior Temporal gyrus 66 -28 4 2.3 Calcarine fissure -2 -74 8 1.8 (-) Lingual gyrus -2 -68 10 2.3
x, y, and z are the stereotactic coordinates of the activations in the MNI space. Statistical threshold p<.0025 uncorrected; cluster size ≥ 20. (+) stereotactic coordinates which survived the SVC for the compensatory neural network. (-) stereotactic coordinates which survived the SVC for the dysfunctional neural network.
147

Table 5.12. Effect of pathology in PRT in terms of under-recruitments (i.e. the contrast aMCIs < Healthy Olders) and over-recruitments (i.e. the contrast aMCIs > Healthy Olders) in the aMCI group, and assessment of compensation (SVC results).
Brain regions x y z Z score x y z Z score Left hemisphere Right hemisphere PRT aMCI < Healthy Olders Superior Frontal medial gyrus 4 34 42 2.0 Middle Frontal gyrus 48 40 20 3.5 48 38 24 3.5 48 24 34 2.3 (+) Inferior Frontal gyrus, pars orbitalis -48 44 -2 2.0 (+) 38 22 -14 2.8 (+) Inferior Frontal gyrus, pars triangularis -42 42 14 2.5 (+) 48 24 32 2.4 -48 42 2 2.3 (+) 50 34 18 3.6 Inferior Frontal gyrus, pars opercularis 58 18 28 1.7 (+) Precentral gyrus 42 4 50 2.7 (+) Insula 36 22 -10 2.7 24 22 -8 2.6 (-) Superior Parietal lobule -34 -60 56 2.4 (+) 28 -72 56 2.9 32 -70 56 2.9 (+) Angular gyrus 36 -68 54 2.7 (+) 46 -60 50 2.7 (+) Inferior Temporal gyrus -46 -52 -16 2.9 (-) Superior Occipital gyrus -20 -80 42 2.0 (+) 36 -74 48 2.5 (+) -14 -86 46 1.7 32 -78 42 2.5 26 -90 32 2.2 (-) Middle Occipital gyrus -28 -96 20 2.7 Inferior Occipital gyrus -46 -70 -8 3.1 (-) Cerebellum -30 -58 -22 2.7 (-) -34 -66 -20 2.2 -30 -42 -28 2.1 (-) aMCI > Healthy Olders Fusiform gyrus 30 -72 -10 2.2 (-) 26 -70 -12 2.1 (-) 30 -78 -8 2.1 Middle Occipital gyrus 26 -90 10 1.9 Calcarine fissure -4 -88 -8 2.2 12 -70 6 2.1 (-) -4 -80 -8 2.0 (-) Cuneus 16 -98 12 2.1 12 -96 12 1.7 (-) Inferior Occipital gyrus -24 -98 -8 2.5 26 -88 -4 2.0 -22 -98 -4 2.3 -26 -86 -6 2.4 (-) Lingual gyrus 24 -84 -8 2.0 (-) 26 -88 -6 2.0 (-)
x, y, and z are the stereotactic coordinates of the activations in the MNI space. Statistical threshold p<.0025 uncorrected; cluster size ≥ 20. (+) stereotactic coordinates which survived the SVC for the compensatory neural network. (-) stereotactic coordinates which survived the SVC for the dysfunctional neural network.
148

A
Figure 5.3a and b. Brain regions emerged from the SVC applied on the patterns of activation corresponding to the effect of pathology for the PNT (a) and the PRT (b). For each task, the upper row illustrates the areas corresponding to aMCIs under-recruitments (aMCI < Healthy olders, YELLOW), while the bottom row represents the aMCIs over-recruitments (aMCI > Healthy olders, BLUE). The SVC results are illustrated by the overlapped coloured blobs: they indicate the brain regions which survived the SVC having as volumes of interest the dysfunctional task-specific neural networks (VIOLET) or the compensatory task-specific neural network (GREEN).
B
A
B
149

D
Figure 5.3c and d. Brain regions emerged from the SVC applied on the patterns of activation corresponding to the effect of pathgy for the SJT (c) and the SRT (d). For each task, the upper row illustrates the areas corresponding to aMCIs under-recruitments (aMCI < Healthy olders, YELLOW), while the bottom row represents the aMCIs over-recruitments (aMCI > Healthy olders, BLUE). The SVC results are illustrated by the overlapped coloured blobs: they indicate the brain regions which survived the SVC having as volumes of interest the dysfunctional task-specific neural networks (VIOLET) or the compensatory task-specific neural network (GREEN).
150

5.4.3. Voxel-Based Morphometry results and correlational analyses
5.4.3.1. Voxel-Based Morphometry (VBM) results
The voxel-by-voxel comparison of the grey matter (GM) density of the two groups (namely, aMCIs
and healthy olders) showed a significant regional reduction of GM density in the patients’ group in the left
olfactory cortex, in the left middle temporal gyrus, in the left caudate nucleus and in the right middle
frontal gyrus. Moreover, a bilateral significant GM reduction was found in the superior temporal gyrus and
in a large portion of the medial temporal lobes, including the hippocampus and the parahippocampal
gyrus. See Table 5.14 and figure 5.4 for more details.
Table 5.14. Grey matter density reduction in the group of aMCI patients when compared to healthy age-matched olders.
x y z Z score x y z Z score Brain regions Left hemisphere Right hemisphere
Middle Frontal gyrus 51 26 35 3.4* Olfactory cortex -1 13 -8 3.5* Superior Temporal gyrus -64 -23 6 3.7 49 -11 -6 3.6* Middle Temporal gyrus -64 -23 -8 3.7* -63 -63 6 3.5* -62 -29 -2 3.5* Hippocampus -14 -7 -17 5.2*° 14 -6 -15 5.0*° -27 -13 -12 4.7*° 40 -32 -10 3.7* Parahippocampal gyrus -20 -25 -23 4.5* 20 -16 -23 3.2 Caudate nucleus -2 5 -5 3.1
Statistical threshold p(uncorrected) < .001. MNI stereotactic are coordinates are reported. ° Z-score statistically still significant after the FWE (Family-Wise Error) correction * Z-score statistically still significant after the FDR (False Discovery Rate) correction
Figure 5.4. Brain regions of significant GM density reduction in aMCI patients. The yellow circles indicate the location of the coordinates which entered the correlational analysis.
151

5.4.3.2. Correlational analyses
For each task, the level of GM density reduction in the hippocampi (MNI coordinates -14, -7, -17 and
14, -6, -15) and in the frontal cortex (MNI coordinate 51, 26, 35) have been correlated with the BOLD
signal extracted from the most significant voxel survived the SVC for the aMCIs over-recruitments in the
dysfunctional task-specific neural networks and under-recruitments in the compensatory task-specific
neural networks. Results for significant correlations are summarised in Table 5.15.
In particular, the BOLD signals extracted from the task-specific dysfunctional neural networks were
negatively correlated with the GM density in the right hippocampus for the PNT, and in the left
hippocampus for the SJT and PRT. Moreover, the BOLD extracted from the task-specific compensatory
neural network showed a positive correlation with the GM density in the left hippocampus in the PRT.
With regard to the SRT, any significant correlation was found.
Table 5.15. Correlational analyses results.
LH hippocampus (-14, -7, -17)
RH hippocampus (14, -6, -15)
RH frontal gyrus (51, 26, 35)
PNT Compensatory neural network (-16, -88, 40) - - - Dysfunctional neural network (-36, -40, -18) - -.444 (p < .01)* - SJT Compensatory neural network (-10, -42, 2) - - - Dysfunctional neural network (-58, 18, 4) - .353 (p < .05) - - PRT Compensatory neural network (32, -72, 54) .367 (p < .05) - - Dysfunctional neural network (30, -72, -10) - .428 (p < .01)* - - SRT Compensatory neural network (No region) - - - Dysfunctional neural network (-2, -74, 8) - - -
(*) for p-value < .01 (Bonferroni correction)
152

5.5. Discussion
Recent neurocognitive theoretical frameworks interpret neurofunctional age-related changes in
highly-performing healthy olders in terms of compensatory processes (Cabeza 2004; Grady 2008).
Experimental data confirm this perspective, leading some authors to speculate that functional plasticity
can alter the course of cognitive aging (Greenwood 2007). Nevertheless, to date imaging studies on
degenerative pathologies did not explicitly refer to any of these theoretical frames, and, as a
consequence, gave rise to a quite contradictory pattern of results and interpretations24. We suggest that
this inconsistency may be due to the lack of a general frame of reference to account for neurocognitive
changes in degenerative diseases. For instance, it may be possible to integrate the neurofunctional and
neuromorphometrical changes typical of pathological aging in a more comprehensive version of the
theoretical models describing compensatory processes in healthy older subjects, such as the STAC
theory (Park and Reuter-Lorenz 2009).
Thus, in order to address this issue, a group of aMCI patients was compared with a group of age-
matched healthy individuals. In particular, our analyses were focused on the qualitative differences in the
neurofunctional correlates of “compensatory processes” aMCIs would apply, i.e. whether a patient could
recruit flexible or inflexible compensatory processes (for an operational definition of these concepts see
table 2).
The particular experimental setting adopted here allowed us to directly overlap the neurofunctional
differences between healthy olders and aMCIs with the neurofunctional correlates of compensatory
processes in healthy aging described in Chapter 3.
Our patients differed from healthy controls only for the presence of a domain-specific cognitive
impairment, as it was confirmed by the neuropsychological data analyses. This point is worth noticing,
since the quasi-adequate aMCIs’ cognitive functioning allowed us to investigate the functional impact of
the presence of pathology without the confounding factor of floor-level performance, as it often occurs
when studying subjects with a fully evident degenerative disease. Neurofunctional data confirmed this
24 See table 5.1 for more details.
153

partially spared profile, since widespread networks of task-specific common areas not affected by
pathology emerged from the analysis of fMRI common areas.
Notwithstanding these commonalities, as expected, some neurofunctional differences emerged
between the two groups. In the next sections, these differences will be extensively described in the light
of the behavioural performances.
5.5.1. Are aMCIs able to flexibly compensate?
Despite their neuropsychological profile, aMCIs showed a lower accuracy in the behavioural
performance recorded during fMRI scans not only in the episodic long-term memory domain (i.e. PRT
and SRT), but also in one of the semantic-memory task (namely, the SJT25). On the contrary, no
significant difference emerged from the comparison of the behavioural performance during the picture
naming sub-test of the AAT. Thus, on the basis of the operational definitions proposed in the introduction
of this paper, we could define aMCIs’ over-recruitments as “compensatory” in none but this latter case,
while the others would be regarded as “compensatory attempts” at the best.
Nevertheless, the focus of our interest is the qualitative difference between healthy olders and aMCIs
activations. With regards to this issue, in each task the SVC applied on the effect of pathology revealed a
systematic scenario: aMCIs tended to under-recruit areas included in the compensatory task-specific
neural networks, while their over-recruitments always overlapped with parts of the dysfunctional neural
network26 typically activated by young subjects, but not as much activated by healthy olders. Accordingly,
the patterns of behavioural and neurofunctional results emerging from the SJT, the PRT and the SRT can
be interpreted as cases of inflexible compensatory attempts (or unsuccessful cognitive effort). On the
contrary, the maintenance of a juvenile level of accuracy in the PNT associated both with the over-
25 The aMCIs’ lower accuracy at the SJT may be explained in terms of binding deficit. Indeed, an off-line sentence comprehension tasks may imply the creation of mental images and complex episodes, a cognitive ability that typically recruits the support of the anterior part of the hippocampus. See Henke, K., B. Weber, et al. (1999). "Human hippocampus associates information in memory." Proc Natl Acad Sci U S A 96(10): 5884-9. See also Mitchell, K., M. Johnson, et al. (2000). "fMRI evidence of age-related hippocampal dysfunction in feature binding in working memory." Brain Res Cogn Brain Res 10(1-2): 197-206. 26 For a detailed definition of the terms compensatory and dysfunctional neural network see the Materials and Methods section. In the SJT we found also the over-recruitment of one area included in the compensatory neural network, but in this case only three voxels survived the SVC.
154

recruitment of the dysfunctional neural network, and with the under-recruitment of the compensatory
neural network, can be interpreted in terms of inflexible compensation (or successful cognitive effort) in
aMCIs.
In general, these results suggest that our patients fail to successfully recruit alternative neural
networks when challenged with the task demands, whereas they rigidly rely on the “usual” task-specific
neural networks which probably become ineffective as the time goes by, since healthy highly-performing
old adults do not need to recruit them to successfully overcome the task. From a cognitive point of view,
the pattern of results may reflect the inability to find alternative strategies to perform the tasks. This
“neurocognitive inflexibility” does not seem to be a task-specific process, since it is manifested in both the
eLTM and the semantic memory domain, and with different input modalities (i.e. visual and auditory). The
evidence discussed so far might suggest that pathological aging could be characterized in terms of a
general lack of adaptive plasticity, at least in this sample of aMCI patients.
5.5.2. Is there any link between functional inflexibility and neuroanatomical atrophy?
By means of a correlational approach, we assessed the relation between the ability of being plastic
and the neuromorphometrical changes typical of the aMCI condition (as reported in literature and
confirmed by our VBM data). According to our prediction, the recruitment of the dysfunctional task-
specific neural networks was negatively correlated with the hippocampal GM density in three out of four
tasks; moreover, the latter variable was also positively correlated with the recruitment of the PRT
compensatory neural network. In other words, the more MTL structures are impaired, the more our
subjects apply an inflexible neural behaviour to face with the task. This pattern of correlations seems to
be specific for the MTL regions, as it was never replicated when the GM density extracted from a
coordinate in the right PFC (a region that is typically reported to be a target of age-related decline in
healthy aging; Salat, Buckner et al. 2004) was considered.
It is worth noticing that our correlational data neither prove any causal and unilateral relationship
between morphological impairment and neurofunctional patterns, nor try to explain in functional terms the
155
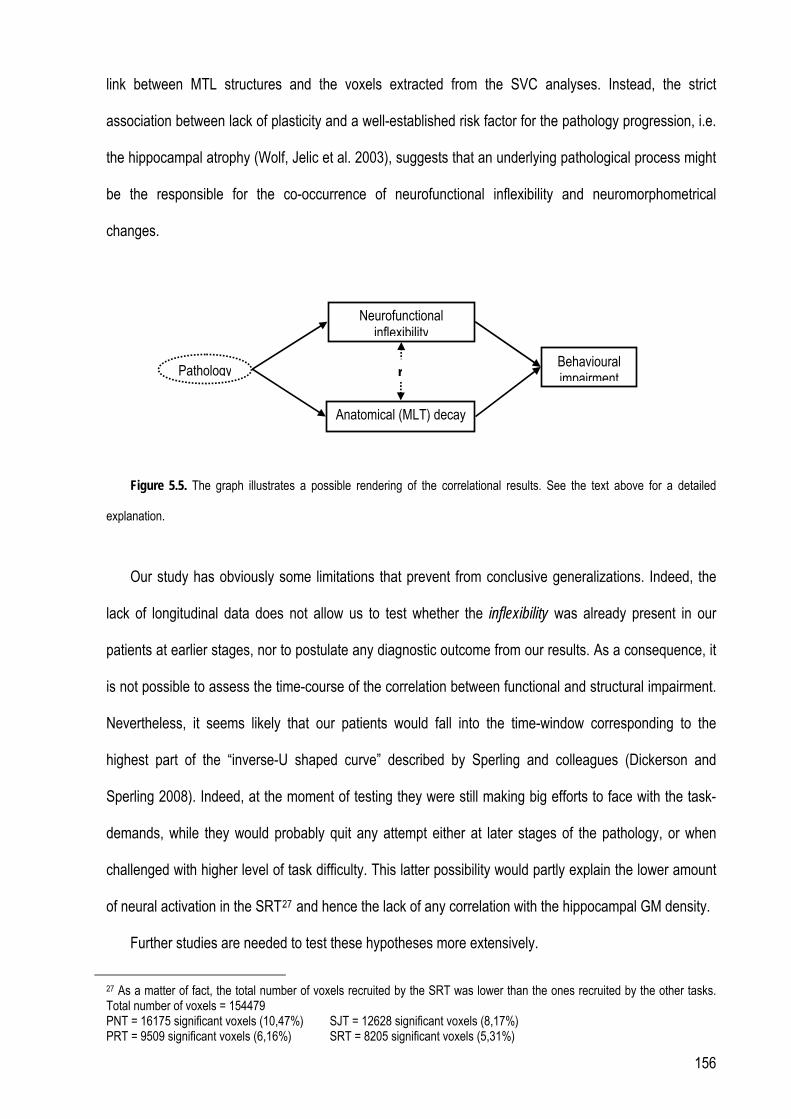
link between MTL structures and the voxels extracted from the SVC analyses. Instead, the strict
association between lack of plasticity and a well-established risk factor for the pathology progression, i.e.
the hippocampal atrophy (Wolf, Jelic et al. 2003), suggests that an underlying pathological process might
be the responsible for the co-occurrence of neurofunctional inflexibility and neuromorphometrical
changes.
Neurofunctional
inflexibility
Pathology
Anatomical (MLT) decay
Behavioural impairment r
Figure 5.5. The graph illustrates a possible rendering of the correlational results. See the text above for a detailed
explanation.
Our study has obviously some limitations that prevent from conclusive generalizations. Indeed, the
lack of longitudinal data does not allow us to test whether the inflexibility was already present in our
patients at earlier stages, nor to postulate any diagnostic outcome from our results. As a consequence, it
is not possible to assess the time-course of the correlation between functional and structural impairment.
Nevertheless, it seems likely that our patients would fall into the time-window corresponding to the
highest part of the “inverse-U shaped curve” described by Sperling and colleagues (Dickerson and
Sperling 2008). Indeed, at the moment of testing they were still making big efforts to face with the task-
demands, while they would probably quit any attempt either at later stages of the pathology, or when
challenged with higher level of task difficulty. This latter possibility would partly explain the lower amount
of neural activation in the SRT27 and hence the lack of any correlation with the hippocampal GM density.
Further studies are needed to test these hypotheses more extensively.
27 As a matter of fact, the total number of voxels recruited by the SRT was lower than the ones recruited by the other tasks. Total number of voxels = 154479 PNT = 16175 significant voxels (10,47%) SJT = 12628 significant voxels (8,17%) PRT = 9509 significant voxels (6,16%) SRT = 8205 significant voxels (5,31%)
156

Funding
The study was supported by the Research Grant RF05.103 from the Ministero della Salute, Italy.
Acknowledgments
Part of this work has been presented at the 27th European Workshop on Cognitive Neuropsychology, Bressanone (Italy).
157

References
Achard, S. and E. Bullmore (2007). "Efficiency and cost of economical brain functional networks." PLoS
Comput Biol 3(2): e17.
Albert, M. S. (1997). "The ageing brain: normal and abnormal memory." Philos Trans R Soc Lond B Biol
Sci 352(1362): 1703-9.
Ashburner, J. and K. J. Friston (1999). "Nonlinear spatial normalization using basis functions." Hum Brain
Mapp 7(4): 254-66.
Bartzokis, G., J. L. Cummings, et al. (2003). "White matter structural integrity in healthy aging adults and
patients with Alzheimer disease: a magnetic resonance imaging study." Arch Neurol 60(3): 393-8.
Bokde, A. L., P. Lopez-Bayo, et al. (2008). "Functional abnormalities of the visual processing system in
subjects with mild cognitive impairment: an fMRI study." Psychiatry Res 163(3): 248-59.
Bottino, C. M., C. C. Castro, et al. (2002). "Volumetric MRI measurements can differentiate Alzheimer's
disease, mild cognitive impairment, and normal aging." Int Psychogeriatr 14(1): 59-72.
Braver, T. S. and D. M. Barch (2002). "A theory of cognitive control, aging cognition, and
neuromodulation." Neurosci Biobehav Rev 26(7): 809-17.
Buckner, R. and G. Logan (2002). Frontal contributions to episodic memory encoding in the young and
elderly. The cognitive neuroscience of memory encoding and retrieval. A. E. Parker, E. L. Wilding
and T. Bussey. Philadelphia (PA), Psychology Press: 59—81.
Buckner, R. L. (2004). "Memory and executive function in aging and AD: multiple factors that cause
decline and reserve factors that compensate." Neuron 44(1): 195-208.
Buckner, R. L., A. Z. Snyder, et al. (2005). "Molecular, structural, and functional characterization of
Alzheimer's disease: evidence for a relationship between default activity, amyloid, and memory." J
Neurosci 25(34): 7709-17.
Burke, S. and C. Barnes (2006). "Neural plasticity in the ageing brain." Nat Rev Neurosci 7(1): 30-40.
158

Cabeza, R. (2002). "Hemispheric asymmetry reduction in older adults: the HAROLD model." Psychol
Aging 17(1): 85-100.
Cabeza, R. (2004). Commentary: Neuroscience frontiers of cognitive aging: approaches to cognitive
neuroscience of aging. New frontiers in cognitive aging. R. A. Dixon, L. Bäckman and L.-G. Nilsson.
Oxford, University Press. 1: 179-198.
Cabeza, R., N. D. Anderson, et al. (2002). "Aging gracefully: compensatory brain activity in high-
performing older adults." Neuroimage 17(3): 1394-402.
Carlesimo, G., I. Buccione, et al. (2002). "Standardizzazione di due test di memoria per uso clinico: Breve
Racconto e Figura di Rey." Nuova Rivista di Neurologia 12: 1-13.
Carlesimo, G. A., C. Caltagirone, et al. (1996). "The Mental Deterioration Battery: normative data,
diagnostic reliability and qualitative analyses of cognitive impairment. The Group for the
Standardization of the Mental Deterioration Battery." Eur Neurol 36(6): 378-84.
Cecchi, G. A., L. T. Petreanu, et al. (2001). "Unsupervised learning and adaptation in a model of adult
neurogenesis." J Comput Neurosci 11(2): 175-82.
Celone, K. A., V. D. Calhoun, et al. (2006). "Alterations in memory networks in mild cognitive impairment
and Alzheimer's disease: an independent component analysis." J Neurosci 26(40): 10222-31.
Colcombe, S. J., A. F. Kramer, et al. (2005). "The implications of cortical recruitment and brain
morphology for individual differences in inhibitory function in aging humans." Psychol Aging 20(3):
363-75.
Cotman, C. W. and N. C. Berchtold (2002). "Exercise: a behavioral intervention to enhance brain health
and plasticity." Trends Neurosci 25(6): 295-301.
Davis, S. W., N. A. Dennis, et al. (2008). "Que PASA? The posterior-anterior shift in aging." Cereb Cortex
18(5): 1201-9.
159

Dickerson, B. C., D. H. Salat, et al. (2004). "Medial temporal lobe function and structure in mild cognitive
impairment." Ann Neurol 56(1): 27-35.
Dickerson, B. C., D. H. Salat, et al. (2005). "Increased hippocampal activation in mild cognitive
impairment compared to normal aging and AD." Neurology 65(3): 404-11.
Dickerson, B. C. and R. A. Sperling (2008). "Functional abnormalities of the medial temporal lobe
memory system in mild cognitive impairment and Alzheimer's disease: insights from functional MRI
studies." Neuropsychologia 46(6): 1624-35.
Draganski, B., C. Gaser, et al. (2004). "Neuroplasticity: changes in grey matter induced by training."
Nature 427(6972): 311-2.
Duffau, H. (2006). "Brain plasticity: from pathophysiological mechanisms to therapeutic applications." J
Clin Neurosci 13(9): 885-97.
Duverne, S., S. Motamedinia, et al. (2009). "The relationship between aging, performance, and the neural
correlates of successful memory encoding." Cereb Cortex 19(3): 733-44.
Elbert, T., A. Sterr, et al. (2002). "Expansion of the tonotopic area in the auditory cortex of the blind." J
Neurosci 22(22): 9941-4.
Folstein, M. F., S. E. Folstein, et al. (1975). ""Mini-mental state". A practical method for grading the
cognitive state of patients for the clinician." J Psychiatr Res 12(3): 189-98.
Friston, K. J., A. P. Holmes, et al. (1995). "Analysis of fMRI time-series revisited." Neuroimage 2(1): 45-
53.
Friston, K. J., K. E. Stephan, et al. (2005). "Mixed-effects and fMRI studies." Neuroimage 24(1): 244-52.
Gabrieli, J. D. (1996). "Memory systems analyses of mnemonic disorders in aging and age-related
diseases." Proc Natl Acad Sci U S A 93(24): 13534-40.
Genovese, C. R., N. A. Lazar, et al. (2002). "Thresholding of statistical maps in functional neuroimaging
using the false discovery rate." Neuroimage 15(4): 870-8.
160

Gigi, A., R. Babai, et al. (2009). "Prefrontal Compensatory Mechanism May Enable Normal Semantic
Memory Performance in Mild Cognitive Impairment (MCI)." J Neuroimaging.
Giovagnoli, A. R., M. Del Pesce, et al. (1996). "Trail making test: normative values from 287 normal adult
controls." Ital J Neurol Sci 17(4): 305-9.
Good, C. D., I. S. Johnsrude, et al. (2001). "A voxel-based morphometric study of ageing in 465 normal
adult human brains." Neuroimage 14: 21-36.
Grady, C. L. (2008). "Cognitive neuroscience of aging." Ann N Y Acad Sci 1124: 127-44.
Grady, C. L., M. V. Springer, et al. (2006). "Age-related changes in brain activity across the adult
lifespan." J Cogn Neurosci 18(2): 227-41.
Greenwood, P. M. (2007). "Functional plasticity in cognitive aging: review and hypothesis."
Neuropsychology 21(6): 657-73.
Grieve, S. M., C. R. Clark, et al. (2005). "Preservation of limbic and paralimbic structures in aging." Hum
Brain Mapp 25(4): 391-401.
Hamalainen, A., M. Pihlajamaki, et al. (2007). "Increased fMRI responses during encoding in mild
cognitive impairment." Neurobiol Aging 28(12): 1889-903.
Hasher, L., E. R. Stoltzfus, et al. (1991). "Age and inhibition." J Exp Psychol Learn Mem Cogn 17(1):
163-9.
Head, D., R. L. Buckner, et al. (2004). "Differential vulnerability of anterior white matter in nondemented
aging with minimal acceleration in dementia of the Alzheimer type: evidence from diffusion tensor
imaging." Cereb Cortex 14(4): 410-23.
Hedden, T. and J. D. Gabrieli (2004). "Insights into the ageing mind: a view from cognitive neuroscience."
Nat Rev Neurosci 5(2): 87-96.
Heiss, W. D. and A. Thiel (2006). "A proposed regional hierarchy in recovery of post-stroke aphasia."
Brain Lang 98(1): 118-23.
161

Heun, R., K. Freymann, et al. (2007). "Mild cognitive impairment (MCI) and actual retrieval performance
affect cerebral activation in the elderly." Neurobiol Aging 28(3): 404-13.
Howard, D. and K. Patterson (1992). Pyramids and Palm Trees: A Test of Semantic Access from
Pictures and Words. Bury St Edmonds, Thames Valley Publ Co.
Huppert, F. A., Brayne, C., O’Connor, D.W. (1994). What is the relationship between dementia and
normal aging. In Dementia and Normal Aging. C. U. Press. Cambridge: 3-11.
Johnson, S. C., T. W. Schmitz, et al. (2006). "Activation of brain regions vulnerable to Alzheimer's
disease: the effect of mild cognitive impairment." Neurobiol Aging 27(11): 1604-12.
Kalpouzos, G., G. Chetelat, et al. (2009). "Voxel-based mapping of brain gray matter volume and glucose
metabolism profiles in normal aging." Neurobiol Aging 30(1): 112-24.
Kaufmann, L., A. Ischebeck, et al. (2008). "An fMRI study of the numerical Stroop task in individuals with
and without minimal cognitive impairment." Cortex 44(9): 1248-55.
Kempermann, G., D. Gast, et al. (2002). "Neuroplasticity in old age: sustained fivefold induction of
hippocampal neurogenesis by long-term environmental enrichment." Ann Neurol 52(2): 135-43.
Kempermann, G., H. G. Kuhn, et al. (1998). "Experience-induced neurogenesis in the senescent dentate
gyrus." J Neurosci 18(9): 3206-12.
Kiebel, S. J., J. B. Poline, et al. (1999). "Robust smoothness estimation in statistical parametric maps
using standardized residuals from the general linear model." Neuroimage 10(6): 756-66.
Kobayashi, S., Y. Ohashi, et al. (2002). "Effects of enriched environments with different durations and
starting times on learning capacity during aging in rats assessed by a refined procedure of the Hebb-
Williams maze task." J Neurosci Res 70(3): 340-6.
Kramer, A. F., L. Bherer, et al. (2004). "Environmental influences on cognitive and brain plasticity during
aging." J Gerontol A Biol Sci Med Sci 59(9): M940-57.
162
Laine, M., T. Tuokkola, et al. (2009). "Central executive function in mild cognitive impairment: a PET
activation study." Scand J Psychol 50(1): 33-40.
Li, S. C. and U. Lindenberger (1999). Cross-level unification: A computational exploration of the link
between deterioration of neurotransmitter systems dedifferentiation of cognitive abilities in old age.
Cognitive Neuroscience of Memory. L. G. N. Markowitsch and J. H. Seattle, WA, US, Hogrefe &
Huber Publishers: 103-146.
Li, S. C. and S. Sikstrom (2002). "Integrative neurocomputational perspectives on cognitive aging,
neuromodulation, and representation." Neurosci Biobehav Rev 26(7): 795-808.
Logan, J. M., A. L. Sanders, et al. (2002). "Under-recruitment and nonselective recruitment: dissociable
neural mechanisms associated with aging." Neuron 33(5): 827-40.
Lustig, C., A. Z. Snyder, et al. (2003). "Functional deactivations: change with age and dementia of the
Alzheimer type." Proc Natl Acad Sci U S A 100(24): 14504-9.
Luzzatti, C., Willmes, K., Bisiacchi, P., De Bleser, R., Faglia, L., Mazzucchi, A., . and et al. (1987). "The
Aachen Aphasia Test (AAT). II. Psychometric properties of the Italian version." Archivio di Psicologia,
Neurologia e Psichiatria 48: 480–519.
Machulda, M. M., H. A. Ward, et al. (2003). "Comparison of memory fMRI response among normal, MCI,
and Alzheimer's patients." Neurology 61(4): 500-6.
Maguire, E. A., D. G. Gadian, et al. (2000). "Navigation-related structural change in the hippocampi of
taxi drivers." Proc Natl Acad Sci U S A 97(8): 4398-403.
Miller, S. L., E. Fenstermacher, et al. (2008). "Hippocampal activation in adults with mild cognitive
impairment predicts subsequent cognitive decline." J Neurol Neurosurg Psychiatry 79(6): 630-5.
Novelli, G., C. Papagno, et al. (1986). "Three clinical tests for the assessment of verbal long-term
memory function. Norms from 320 normal subjects." Archivio di Psicologia, Neurologia e Psiachiatria
47(2): 278-296.
163

O'Sullivan, M., D. K. Jones, et al. (2001). "Evidence for cortical "disconnection" as a mechanism of age-
related cognitive decline." Neurology 57(4): 632-8.
Oldfield, R. (1971). "The assessment and analysis of handedness: The Edinburgh inventory."
Neuropsychologia 9: 97-113.
Orsini, A., D. Grossi, et al. (1987). "Verbal and spatial immediate memory span: normative data from
1355 adults and 1112 children." Ital J Neurol Sci 8(6): 539-48.
Pariente, J., S. Cole, et al. (2005). "Alzheimer's patients engage an alternative network during a memory
task." Ann Neurol 58(6): 870-9.
Park, D. C. and P. Reuter-Lorenz (2009). "The adaptive brain: aging and neurocognitive scaffolding."
Annu Rev Psychol 60: 173-96.
Pennanen, C., C. Testa, et al. (2005). "A voxel based morphometry study on mild cognitive impairment."
J Neurol Neurosurg Psychiatry 76(1): 11-4.
Persson, J., C. Lustig, et al. (2007). "Age differences in deactivation: a link to cognitive control?" J Cogn
Neurosci 19(6): 1021-32.
Petersen, R. C., G. E. Smith, et al. (1999). "Mild cognitive impairment: clinical characterization and
outcome." Arch Neurol 56(3): 303-8.
Petrella, J. R., L. Wang, et al. (2007). "Cortical deactivation in mild cognitive impairment: high-field-
strength functional MR imaging." Radiology 245(1): 224-35.
Raichle, M. E., A. M. MacLeod, et al. (2001). "A default mode of brain function." Proc Natl Acad Sci U S A
98(2): 676-82.
Ramachandran, V. S. and W. Hirstein (1998). "The perception of phantom limbs. The D. O. Hebb
lecture." Brain 121 ( Pt 9): 1603-30.
Raven , J. (1984). CPM. Coloured Progressive Matrices. OS, Firenze.
164

Raz, N. (2007). "Comment on Greenwood (2007): Which side of plasticity?" Neuropsychology 21(6): 676-
7; discussion 680-3.
Raz, N., U. Lindenberger, et al. (2005). "Regional brain changes in aging healthy adults: general trends,
individual differences and modifiers." Cereb Cortex 15(11): 1676-89.
Rodrigue, K. M. and N. Raz (2004). "Shrinkage of the entorhinal cortex over five years predicts memory
performance in healthy adults." J Neurosci 24(4): 956-63.
Rombouts, S. A., F. Barkhof, et al. (2005). "Altered resting state networks in mild cognitive impairment
and mild Alzheimer's disease: an fMRI study." Hum Brain Mapp 26(4): 231-9.
Rombouts, S. A., F. Barkhof, et al. (2000). "Functional MR imaging in Alzheimer's disease during
memory encoding." AJNR Am J Neuroradiol 21(10): 1869-75.
Rosen, A. C., M. W. Prull, et al. (2002). "Variable effects of aging on frontal lobe contributions to
memory." Neuroreport 13(18): 2425-8.
Rossini, P. M. and G. Dal Forno (2004). "Integrated technology for evaluation of brain function and neural
plasticity." Phys Med Rehabil Clin N Am 15(1): 263-306.
Salat, D. H., R. L. Buckner, et al. (2004). "Thinning of the cerebral cortex in aging." Cereb Cortex 14(7):
721-30.
Salat, D. H., J. A. Kaye, et al. (2002). "Greater orbital prefrontal volume selectively predicts worse
working memory performance in older adults." Cereb Cortex 12(5): 494-505.
Sale, A., N. Berardi, et al. (2009). "Enrich the environment to empower the brain." Trends Neurosci 32(4):
233-9.
Salthouse, T. A., H. E. Hancock, et al. (1996). "Interrelations of age, visual acuity, and cognitive
functioning." J Gerontol B Psychol Sci Soc Sci 51(6): P317-30.
165

Schroeter, M. L., T. Stein, et al. (2009). "Neural correlates of Alzheimer's disease and mild cognitive
impairment: a systematic and quantitative meta-analysis involving 1351 patients." Neuroimage 47(4):
1196-206.
Small, S. A., G. M. Perera, et al. (1999). "Differential regional dysfunction of the hippocampal formation
among elderly with memory decline and Alzheimer's disease." Ann Neurol 45(4): 466-72.
Smith, G. E., V. S. Pankratz, et al. (2007). "A plateau in pre-Alzheimer memory decline: evidence for
compensatory mechanisms?" Neurology 69(2): 133-9.
Sperling, R. (2007). "Functional MRI studies of associative encoding in normal aging, mild cognitive
impairment, and Alzheimer's disease." Ann N Y Acad Sci 1097: 146-55.
Sperling, R. A., J. F. Bates, et al. (2003). "fMRI studies of associative encoding in young and elderly
controls and mild Alzheimer's disease." J Neurol Neurosurg Psychiatry 74(1): 44-50.
Spinnler, H. and G. Tognoni (1987). Standardizzazione e taratura italiana di test neuropsicologici. Milano,
Masson Italia Periodici.
Terry, R. D. and R. Katzman (2001). "Life span and synapses: will there be a primary senile dementia?"
Neurobiol Aging 22(3): 347-8; discussion 353-4.
Van Petten, C. (2004). "Relationship between hippocampal volume and memory ability in healthy
individuals across the lifespan: review and meta-analysis." Neuropsychologia 42(10): 1394-413.
Wang, G. J., N. D. Volkow, et al. (1995). "Evaluation of age-related changes in serotonin 5-HT2 and
dopamine D2 receptor availability in healthy human subjects." Life Sci 56(14): PL249-53.
Ward, N. S. and R. S. Frackowiak (2006). "The functional anatomy of cerebral reorganisation after focal
brain injury." J Physiol Paris 99(4-6): 425-36.
West, R. L. (1996). "An application of prefrontal cortex function theory to cognitive aging." Psychol Bull
120(2): 272-92.
166

Whitwell, J. L., S. A. Przybelski, et al. (2007). "3D maps from multiple MRI illustrate changing atrophy
patterns as subjects progress from mild cognitive impairment to Alzheimer's disease." Brain 130(Pt
7): 1777-86.
Wickens, T. D. (2002). Elementary signal detection theory. Oxford, Oxford University Press.
Wolf, H., V. Jelic, et al. (2003). "A critical discussion of the role of neuroimaging in mild cognitive
impairment." Acta Neurol Scand Suppl 179: 52-76.
Woodard, J. L., M. Seidenberg, et al. (2009). "Semantic memory activation in amnestic mild cognitive
impairment." Brain 132(Pt 8): 2068-78.
Worsley KJ Marrett S Neelin P Vandal AC Friston KJ and Evans AC. (1996). “A unified statistical
approach for determining significant signals in images of cerebral activation.” Hum. Brain Mapp. 4:
58-73
Yetkin, F. Z., R. N. Rosenberg, et al. (2006). "FMRI of working memory in patients with mild cognitive
impairment and probable Alzheimer's disease." Eur Radiol 16(1): 193-206.
Zhou, X. and M. M. Merzenich (2007). "Intensive training in adults refines A1 representations degraded in
an early postnatal critical period." Proc Natl Acad Sci U S A 104(40): 15935-40.
167

Appendix B
Appendix B.1. Main effect of tasks
Table 1b. Main effects for the PNT and SJT.
x Y z Z score x y z Z score Brain regions Left hemisphere Right hemisphere
PNT Inferior Frontal gyrus, pars triangularis -44 30 22 3.6* Precentral gyrus -40 6 38 3.4* Fusiform gyrus -42 -50 -24 7.0*° -40 -62 -20 6.6*° Middle Occipital gyrus -40 -88 -4 Inf *° 28 -94 16 5.8*° 36 -90 10 5.2*° Inferior Occipital gyrus -44 -76 -14 Inf *° SJT Inferior Frontal gyrus, pars orbitalis -48 24 -10 5.8*° Inferior Frontal gyrus, pars triangularis -54 18 4 5.8*° -48 20 22 5.1*° SMA -2 0 64 4.0* Precentral gyrus 52 -10 58 3.6* 42 -20 68 3.5* Postcentral gyrus -42 -8 58 5.5*° 48 -18 62 3.7* Superior parietal lobule -20 -80 54 3.5* -24 -80 52 3.3* Superior Temporal pole -52 14 -16 5.4*° 40 24 -24 4.2* 46 16 -22 4.0° Middle Temporal pole -46 16 -36 4.4*° Middle Temporal gyrus -56 -32 -4 Inf *° 62 -8 -10 7.5*° -64 -18 -6 Inf *° 60 -24 -6 6.7*° Fusiform gyrus -16 -34 -14 4.6*° Hippocampus -20 -20 -16 4.5*° 16 -10 -18 3.4* Middle Occipital gyrus -28 -86 42 4.3* Lingual gyrus -2 -64 4 3.4*
Statistical threshold p(uncorrected) < .001. MNI stereotactic are coordinates are reported. ° Z-score statistically still significant after the FWE (Family-Wise Error) correction * Z-score statistically still significant after the FDR (False Discovery Rate) correction
168

Table 2b. Main effects for the PRT and SRT.
x Y z Z score x y z Z score Brain regions Left hemisphere Right hemisphere
PRT Middle Frontal gyrus -48 18 38 6.0*° 40 24 50 5.4*° 48 16 44 4.2* Inferior Frontal gyrus, pars orbitalis -46 18 -10 4.5*° 44 20 -14 4.9*° Inferior frontal, pars triangularis -58 18 2 3.7* Inferior Frontal gyrus, pars opercularis 56 22 34 4.1* SMA -4 20 50 4.0* 4 22 50 3.9* -4 14 54 3.9* Precentral gyrus -46 2 52 3.4* 48 10 48 4.4*° Insula -36 22 0 3.8* Superior Parietal lobule 24 -78 50 4.3* Inferior Parietal lobule -30 -70 48 4.9*° Angular gyrus 36 -72 42 4.8*° Fusiform gyrus -44 -56 -22 7.2*° Superior Occipital gyrus 24 -86 38 5.6*° Middle Occipital gyrus -26 -90 16 6.8*° 28 -92 16 7.3*° -32 -92 8 Inf*° Lingual gyrus -20 -80 -14 4.3* 14 -72 4 4.0* Cerebellum -38 -64 -20 7.8*° 36 -42 -24 4.5*° 26 -56 -16 4.5*° SRT Inferior Frontal gyrus, pars orbitalis -48 28 -8 5.9*° Inferior Frontal gyrus, pars triangularis -54 18 10 5.1*° Inferior Frontal gyrus, pars opercularis, -46 18 34 5.9*° Precentral gyrus -42 2 52 5.1*° -42 -2 54 5.1*° Inferior Parietal lobule -34 -72 54 5.8*° -44 -62 54 5.3*° Angular gyrus 44 -66 52 3.9* 38 -72 50 3.9* Middle Temporal gyrus -64 -20 -2 Inf*° 62 -8 -10 7.2*° -62 -12 -6 Inf*° 64 -26 -8 6.8*° Calcarine fissure -4 -88 -10 4.1* -2 -94 -2 3.5*
Statistical threshold p(uncorrected) < .001. MNI stereotactic are coordinates are reported. ° Z-score statistically still significant after the FWE (Family-Wise Error) correction * Z-score statistically still significant after the FDR (False Discovery Rate) correction
169

CHAPTER 6: Take home message
In the light of the data presented in this dissertation and of the findings described in the peer-
reviewed literature, it seems possible to propose some theoretical considerations to merge the amount of
knowledge on graceful aging with the empirical evidence about pathological aging and its different
neurofunctional, neuroanatomical and behavioural outcomes.
To this end, both recent neurocognitive models of healthy aging and animal studies on degenerative
pathologies may prompt interesting suggestions. Indeed, while neurocognitive models of healthy aging
stress on the role of functional plasticity (Greenwood 2007), its behavioural outcomes and the factors
which may reinforce it over time (Stern 2009), animal studies with knockout mice show that degenerative
pathologies similar to Alzheimer’s disease are characterized by the lack of this adaptive feature at both
molecular and neuronal level of analysis.
On the one hand, for instance, one of the most recent model of cognitive aging, the Scaffolding
Theory of Cognitive Aging (STAC, that is briefly described in Chapter 1), highlights the brain life-long
ability to actively reorganize its pathways through the continuous “strengthening of existing connections,
formation of new connection and disuse of connections that have become impaired” (Park and Reuter-
Lorenz 2009). Within this view, the same mechanisms which firstly support learning during childhood and
early adult life permit an adaptive reaction to age-related decline later in life. The key word here is the
presence of “challenges”: (i) environmental challenges, e.g. new learning, engagement, exercise and
cognitive training; (ii) biological challenges (as with regard to age-related neurobiological decays), e.g.
neurotransmitter depletion, cortical thinning and white matter changes. The main idea is that the more
“challenging” life experiences the more the brain would become able to develop coping strategies to
master demanding situations.
On the other hand, animal studies with knockout mice have shown a link between genetic risk-factors
for Alzheimer’s disease (apoE ε4 allele) and defective mechanisms of neural repairs and remodelling
170

after brain injury (Horsburgh, McCarron et al. 2000; White, Nicoll et al. 2001). This findings are in line with
the presumed role of the apolipoprotein E (apoE) in stimulating neuronal regeneration (e.g. neurite
sprouting), and they have been interpreted in terms of reduction in brain plasticity (Teter 2004).
Moreover, experiments on animals and humans suggest that while AD is characterized by losses in
functional capacity of still-existing synapses which occur years before full blown neuronal death (see
Coleman, Federoff et al. 2004 for a recent review), graceful aging manifests extremely region-specific
decays (e.g. in dendritic extent and spine density), with even an age-related increase in the number of
gap junctions in some hippocampal areas such as CA3 (Burke and Barnes 2006).
On the basis of these considerations, it seems possible to suggest a general model for cognitive
aging which may include health and pathology: Assuming that compensatory scaffolding exists in any
brain, genetic predisposition and life experiences may enhance or reduce this adaptive mechanism;
moreover, the presence of a degenerative pathology may impair this ability to such an extent that any
neural reorganisation remains feasible (see figure 6.1). Thus, graceful aging seems to be characterised
by “wise”, successful and task-specific processes of neurofunctional reorganization and cognitive
flexibility, which permit to reach, with some limitations, a quasi-juvenile level of accuracy in spite of
anatomical and neurofunctional decays (in line with the results of Chapter 3); instead, pathological aging
seems to manifest itself with the inability to compensate, to reorganise and, finally, to cope with
challenging situation, which results in inflexible and non-adaptive behaviours, namely, the attitude of
“playing at being young” described in Chapter 5.
Thus, although this model is surely incomplete, it permits to merge together the results described in
this dissertation within a unique theorethical framework stressing, one again, the role of compensatory
processes in aging.
171

172
AGING
Neural challenges
Functional deterioration
Compensatory scaffolding
Cognitive functioning
Pathological processes
--
+
Scaffolding enhancement
Figure 6.1 A conceptual model to explain how the presence of pathology could be included in a wider theoretical framework of cognitive aging. While “external challenges” (e.g. new learning, engagement, exercise and cognitive training) help to maintain high level of compensatory scaffolding in elderly subjects, the pathological process would heavily impact on this ability. Indeed, it not only causes cascades of neural and functional deteriorations, but it also prevents the brain from coping with them, thus causing a remarkable decline in performance. Modified from Park and Reuter-Lorentz 2009.

173
References Burke, S. and C. Barnes (2006). "Neural plasticity in the ageing brain." Nat Rev Neurosci 7(1): 30-40
Coleman, P., H. Federoff, et al. (2004). "A focus on the synapse for neuroprotection in Alzheimer disease
and other dementias." Neurology 63(7): 1155-62.
Greenwood, P. M. (2007). "Functional plasticity in cognitive aging: review and hypothesis."
Neuropsychology 21(6): 657-73.
Horsburgh, K., M. McCarron, et al. (2000). "The role of apolipoprotein E in Alzheimer's disease, acute
brain injury and cerebrovascular disease: evidence of common mechanisms and utility of animal
models." Neurobiol Aging 21(2): 245-55.
Park, D. C. and P. Reuter-Lorenz (2009). "The adaptive brain: aging and neurocognitive scaffolding."
Annu Rev Psychol 60: 173-96.
Stern, Y. (2009). "Cognitive reserve." Neuropsychologia 47(10): 2015-28.
Teter, B. (2004). "ApoE-dependent plasticity in Alzheimer's disease." J Mol Neurosci 23(3): 167-79.
White, F., J. Nicoll, et al. (2001). "Impaired neuronal plasticity in transgenic mice expressing human
apolipoprotein E4 compared to E3 in a model of entorhinal cortex lesion." Neurobiol Dis 8(4): 611-25.