brain connectivity and postural control in young traumatic ... · brain connectivity and postural...
TRANSCRIPT
NeuroImage: Clinical 1 (2012) 106–115
Contents lists available at ScienceDirect
NeuroImage: Clinical
j ourna l homepage: www.e lsev ie r .com/ locate /yn ic l
Brain connectivity and postural control in young traumatic brain injurypatients: A diffusion MRI based network analysis☆,☆☆
K. Caeyenberghs a,⁎, A. Leemans b, C. De Decker a, M. Heitger a, D. Drijkoningen a, C. Vander Linden c,S. Sunaert d, S.P. Swinnen a,e
a Motor Control Laboratory, Research Center for Movement Control and Neuroplasticity, KU Leuven, Belgiumb Image Sciences Institute, University Medical Center Utrecht, Utrecht, The Netherlandsc Child Rehabilitation Centre, Department of Physical Medicine and Rehabilitation, Ghent University Hospital, Belgiumd Department of Radiology, University Hospital, KULeuven, Belgiume Leuven Research Institute for Neuroscience & Disease (LIND), KU Leuven, Belgium
☆ This is an open-access article distributed under the tAttribution-NonCommercial-ShareAlike License, whichdistribution, and reproduction in any medium, providedare credited.☆☆ Funding: Thisworkwas supported by a grant from thesearch Foundation-Flanders (FWO) (G.0482.010 and G.A11Interuniversity Attraction Poles program of the Belgian fedK. is funded by a postdoctoral fellowship of the Research F
⁎ Corresponding author at: Laboratory of Motor ContControl and Neuroplasticity, Group Biomedical Scienc101, B-3001 Heverlee, Belgium. Tel.: 32 16 32 91 14.
E-mail address: [email protected] (K.
2213-1582/$ – see front matter © 2012 The Authors. Puhttp://dx.doi.org/10.1016/j.nicl.2012.09.011
a b s t r a c t
a r t i c l e i n f oArticle history:Received 29 July 2012Received in revised form 15 September 2012Accepted 20 September 2012Available online 2 October 2012
Keywords:Diffusion tensor imagingGraph theoretical network analysisMotor controlStructural networkTraumatic brain injuryPostural control
Our previous research on traumatic brain injury (TBI) patients has shown a strong relationship between specificwhite matter (WM) diffusion properties and motor deficits. The potential impact of TBI-related changes in net-work organization of the associated WM structural network on motor performance, however, remains largelyunknown. Here, we used diffusion tensor imaging (DTI) based fiber tractography to reconstruct the humanbrain WM networks of 12 TBI and 17 control participants, followed by a graph theoretical analysis. A force plat-form was used to measure changes in body posture under conditions of compromised proprioceptive and/orvisual feedback. Findings revealed that compared with controls, TBI patients showed higher betweenness cen-trality and normalized path length, and lower values of local efficiency, implying altered network organization.These results were not merely a consequence of differences in number of connections. In particular, TBI patientsdisplayed reduced structural connectivity in frontal, parieto-premotor, visual, subcortical, and temporal areas. Inaddition, the decreased connectivity degree was significantly associated with poorer balance performance. Weconclude that analyzing the structural brain networks with a graph theoretical approach provides new insightsinto motor control deficits following brain injury.
© 2012 The Authors. Published by Elsevier Inc. All rights reserved.
1. Introduction
Traumatic brain injury (TBI) is a common cause of disability in chil-dren and adolescentsworldwide (Kraus andMcArthur, 1996), and has adramatic impact on the developing brain. Besides neurobehavioral andcognitive deficits, TBI results in motor disorders including instabilityduring postural control and gait, which can severely affect the child'slevel of independence and can increase the risk of falls. Up to 70% ofchildren, who sustain a TBI, present some balance deficits (Black et al.,2000).
erms of the Creative Commonspermits non-commercial use,the original author and source
Research Programmeof theRe-4.11) and Grant P6/29 from theeral government. Caeyenberghsoundation-Flanders (FWO).rol, Research Center for Motores, K.U.Leuven, Tervuursevest
Caeyenberghs).
blished by Elsevier Inc. All rights re
Our previous studies in TBI patients have relatedmotor functioning todifferent structural and functional properties of the brain. Using fMRI, in-creased recruitment of neural resources for attentional deployment andsomatosensory processing was found in children with TBI during motorcoordination tasks (Caeyenberghs et al., 2009). It was hypothesizedthat these modified recruitment patterns might compensate for diffuseaxonal injuries (DAI) and disruptions ofwhitematter (WM) connections.Another functional imaging study in adults with TBI (Leunissen et al.,2012) revealed that the neural circuitry supporting motor switchingwas altered after TBI and that this altered functional engagementwas re-lated to behavioral performance across TBI patients and controls. Finally,diffusion tensor imaging (DTI) studies of our group have shown reducedfractional anisotropy values in thewhole brain and specific tracts and re-gions. These studies demonstrated significant correlations between DTImetrics and fine (manual dexterity) and gross (postural control) motorperformance, such that increased WM pathology predicts larger motordeficits in children with TBI (e.g., Caeyenberghs et al., 2010a,b, 2011).
Despite these advances in TBI research, however, little is knownabout the abnormalities in topological organization of brain networksin TBI and whether these are related to motor deficits. Graph theoret-ical analysis provides a powerful tool to characterize the topologicalorganization of complex networks, and has recently been applied to
served.

107K. Caeyenberghs et al. / NeuroImage: Clinical 1 (2012) 106–115
the study of human brain networks in health and disease (Bullmoreand Sporns, 2009). With respect to TBI, only a few studies have dem-onstrated small-world alterations and increased connectivity in func-tional brain networks (Caeyenberghs et al., 2012; Castellanos et al.,2011; Nakamura et al., 2009). To our knowledge, no studies havereported TBI-related changes in the topological properties of WMstructural networks. Here, we present the first study using DTItractography combined with such a graph theoretical approach toinvestigate the network organization of the WM networks in youngpatients with TBI and healthy controls.
The present study was based on two main hypotheses:
(i) Relying on our previous study on network functionality in TBIadults (Caeyenberghs et al., 2012), we expected a decrease instructural connectivity in the WM networks. We suggest thathigher functional connectivity (i.e., a higher synchronizationbetween activity levels across neural network nodes) may bedirectly related to a poorer neurobiological substrate, i.e., structur-al disconnection between areas. As described above, TBI is associ-ated with WM abnormalities that might disrupt neuronalconnections. This hypothesis included the consideration thatbrain injury will not only alter existing structural connectionsbut will also result in a decrease of number of edges betweenbrain areas. This will manifest in measurable changes in meangraph-theoretical network measures when assessing overall net-work connectivity. Therefore, we sought to determine herewhether TBI patients would show abnormal small-world organi-zation, reduced network efficiency and altered nodal efficiencyin WM networks.
(ii) Furthermore, we expected a relation between the degree of net-work connectivity and motor performance in patients with TBI,whereby decreased connectivity degree would be associatedwith poorer balance. We focused on postural control becausethis task is a prototype of complex sensorimotor integration,requiring exchange of information among several brain areas.
2. Materials and methods
2.1. Participants
Twenty-nine children and adolescents participated in the study,including 12 subjects with TBI (mean age 14.8 years, SE 1 year1 month, range 8–20 years of age, seven boys and five girls) and 17controls (mean age 12.4 years, SE 6 months, range 9–16 years ofage; nine boys and eight girls). The TBI patients were classified as‘moderate-to-severe’ based on several factors: the Glasgow ComaScale score after resuscitation (a subgroup of five children had aGCS of 8 or below), the anatomical features of the injury based oninspection by an expert neuroradiologist (see below), and the injurymechanism (traffic accidents and falls), or combinations thereof.The demographic and clinical characteristics of the TBI group areshown in Table 1. The TBI patients were recruited from different reha-bilitation centers in Belgium. All were assessed at least six monthspost-injury, when neurological recovery was stabilized. The intervalbetween injury and scanning (age of injury) was on average3 years, 6 months (SE 9 months). Their age at injury was on average10 years, 6 months (SE 3 years, 2 months). Participants were exclud-ed if they had pre-existing developmental or intellectual disabilities, aprogressive disease, or were taking medication. All control subjectswere screened to ensure that they had no history of neurologicaldamage.
2.2. Posturography
The equipment, paradigm parameters, and dependent variableswere identical to our previous DTI study in typically developing
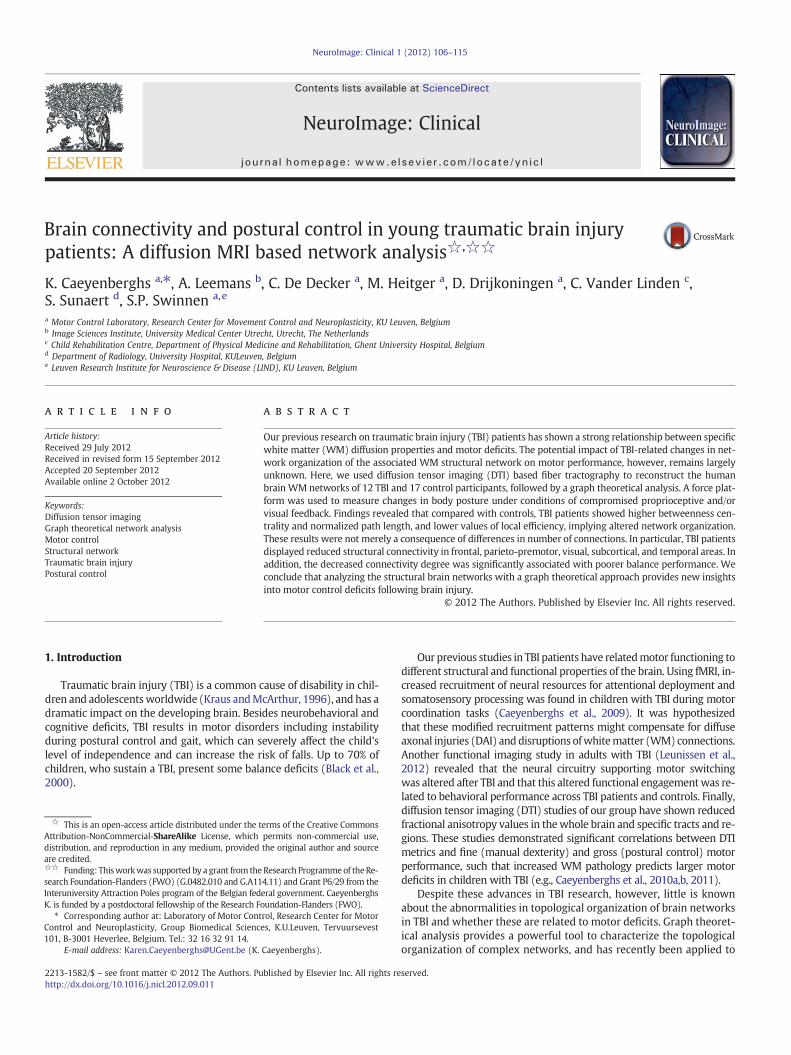
children and children with brain injury (Caeyenberghs et al., 2010a).Specifically, the Sensory Organization Test (SOT) of the EquiTest System(Neurocom International Inc.) was used in this study. The equilibriumscore indicating postural stability compared the subject's sway to thetheoretical limits of stability. The subject's sway was calculated fromthe maximum anterior and posterior center of gravity (COG) displace-ments occurring over the 20-s trial period. The theoretical maximumdisplacement without losing balance was assumed to be a range of12.5° (6.25 anterior, 6.25 posterior). The results were expressed as per-centages, 0 indicating sway exceeding the limit of stability and 100indicating perfect stability.
The equilibrium score was examined with 4 different sensory con-ditions (see Fig. 1). In condition A, when the participant stood on afixed platform with the eyes open, all three sensory systems (vision,vestibular, and somatosensory) were operational and a baseline mea-sure of stability was obtained. Condition B was the same as conditionA but with eyes closed. In condition C, the participant stood with theeyes open and the platform moved in response to his/her sway suchthat the ankle joints did not bend in response to the sway, whichreduced proprioceptive input to the brain. Condition D was identicalto condition C except that the eyes were now closed, such that onlythe vestibular system provided reliable sensory information. Thetest protocol consisted of three repetitions of each condition,resulting in 12 trials. A composite equilibrium score, describing aperson's overall level of performance during all the SOT trials wasalso calculated, with higher scores being indicative of better balanceperformance.
2.3. MRI data acquisition
MR examination took place without sedation on a 3 T scanner(Intera, Philips, Best, The Netherlands) with an eight channel phased-array head coil. A DTI SE-EPI (diffusion weighted single shot spin-echoechoplanar imaging) was acquired with data acquisition matrix=112×112; field of view (FOV)=220×220 mm2; TR=7916 ms, TE=68 ms, parallel imaging factor 2.5, and 68 contiguous sagittal slices(slice thickness=2.2 mm; voxel size=2×2×2.2 mm3) covering theentire brain and the brainstem (Jones and Leemans, 2011). Diffusiongradients were applied along 45 non-collinear directions with ab-value of 800 s/mm2. Additionally, one set of images with no diffusionweighting (b=0 s/mm2) was acquired.
A T1-weighted coronal 3D-TFE (182 contiguous coronal slices cov-ering the whole brain and brainstem; FOV=250 mm; TE=4.6 ms;TR=9.7 ms; slice thickness=1.2 mm; matrix size=256×256;voxel size=0.98×0.98×1.2 mm3) was consequently acquired foranatomical detail (Table 1). These structural MRI scans were investi-gated by an expert neuro-radiologist to indicate location and type ofpathology (e.g., gliosis, shearing, haemorrhage) (see Table 1).
2.4. DTI preprocessing
The DTI data were analyzed and processed in ExploreDTI(Leemans et al., 2009), as described previously (Caeyenberghs et al.,2010a,b, 2011): (a) subject motion and eddy-current induced geo-metrical distortions were corrected (Leemans and Jones, 2009), and(b) the diffusion tensors were calculated using a non-linearregression procedure (Basser and Pierpaoli, 1996).
2.5. White matter tractography
For each individual dataset, WM tracts of the brain network werereconstructed using a deterministic streamline fiber tractographyapproach (Basser et al., 2000). Fiber pathways were reconstructedby defining seed points distributed uniformly throughout the dataat 2 mm isotropic resolution and by following the main diffusiondirection (as defined by the principal eigenvector) until the fiber

Table 1Summary of demographic and injury characteristics for the TBI group.
TBI patient #Age/gender/handedness
GCS Acute scan within 24 h after injuryLesion location/pathology
MRI scan at examinationLesion location/pathology
TBI 115,7/F/RH
8 (R) FL subdural hematoma (R) FL, splenium corpus callosum shearing injuries
TBI 29,9/F/RH
5 (R) TL/PL subdural hematoma and (R)cerebellar contusion
(R) TL/PL subdural hematoma and (R) cerebellar contusion
TBI 313,1/M/LH
Lesion and location not specified inavailable records
Hemosiderin deposits (R) thalamus and (R) posterior limb of the internal capsule, shearing injuries corpuscallosum
TBI 416,6/M/RH
7 Enlarged (R) lateral ventricle,(R ) hematoma occipital horn lateralventricle, hyperdensity (L)thalamus, (LH) shearing injuries
Enlarged (R) lateral ventricle, (RH) atrophy, hemosiderin deposits (splenium corpus callosum, (R) coronaradiata), asymmetry cerebral peduncles, (L) contusion pons
TBI 514,1/F/RH
3 (R) FL/PL/OL contusion; contusion basalganglia (thalamus, (R)nucleus caudatus)
Atrophy (R) FL/TL, nucleus caudatus, lentiformis, thalamus, internal capsule, atrophy (R) amygdala,hippocampus, cerebellum; asymmetry lemniscus, cerebral peduncles, pons; shearing injuries corpuscallosum
TBI 616,8/M/RH
8 (L) TL contusion, (L) FL punctiform contu-sion, (R) contusion mesencephalon, (L) FL hemorrhagic injuries and(L) thalamus
Enlarged ventricles, (L) FL hemosiderin deposits
TBI 719,1/M/RH
Lesion and location not specified inavailable records
Shearing injury splenium corpus callosum
TBI 820,4/M/RH
(R ) FL hematoma, enlarged ventricles Atrophy RH, (R) contusion superior frontal gyrus, atrophy (R) nucleus caudatus, (R) nucleus lentiformis,injured corpus callosum
TBI 917,2/M/RH
Contusions (L) FL, TL, (R) PL, subduralhematoma
Contusion (L) PL inferior, (L) LH hemosiderin deposits, (R) TL contusion,atrophy (L) lateral TL, atrophy (L) FL
TBI 1011,5/F/RH
(R) FL subdural hematoma, hemorrhagicinjuries thalamus, fornix, corpus callosum
(R) FL subdural hematoma
TBI 1118,7/F/RH
Enlarged ventricles, atrophy PL, FL, RH WM,atrophy (L) hippocampus, shearing injuries
Enlarged ventricles, atrophy LH, (L) PL inferior contusion, injuries superior frontal sulcus, contusion RH,orbitofronal contusion, (R) nucleus lentiformis contusion, asymmetry cerebral peduncles, atrophy (R)cerebellum
TBI 128,9/M/RH
Hemorrhagic injuries RH/LH, FL/TLcontusion, (L) FL subdural hematoma
(L) FL contusion and subdural hematoma, (R) TL contusion and subdural hematoma
Anatomy codes: WM=white matter; GM= gray matter; RH= right hemisphere; LH = left hemisphere; FL = frontal lobe; TL = temporal lobe; PL = parietal lobe; OL = occipitallobe; R= right; L= left. Other codes: TBI= traumatic brain injury; GCS, GlasgowComa Scale score;MRI=magnetic resonance imaging; RH=right-handed; LH= left-handed;M=male;F = female.
108 K. Caeyenberghs et al. / NeuroImage: Clinical 1 (2012) 106–115
tract entered a voxel with FAb0.20 or made a high angular turn(angle>45°) considered to be not anatomically plausible. The stepsize was set at 1 mm.
2.6. Network construction
The whole-brain fiber tract reconstructions of the previous stepwere parcellated using the automated anatomical labeling atlas (AAL,Tzourio-Mazoyer et al., 2002). This procedure of defining the nodeshas beenpreviously described in Bassett et al. (2011a). Using this proce-dure, we obtained 116 cortical, subcortical and cerebellar regions (58for each hemisphere), each ROI of the AAL template representing anode of the network (see Figs. 2 and 3), and the edges between twonodes v and u reflecting a reconstructed WM tract.
Inter-regional connectivity was then examined by determiningthe connection density (number of fiber connections per unit surface)between any two masks (i.e. any two regions of the AAL template)(Hagmann et al., 2008). This value became the edge weight w(e) inan N×N connectivity matrix and was calculated as follows:
w eð Þ ¼ 2Sv þ Su
∑f∈Fe
1l fð Þ
where Sv and Su denote the cortical surfaces of AAL regions v and u,respectively. Fe denotes the set of all fibers connecting regions v andu and hence contributing to the edge e, and l(f) denotes the lengthof fiber f along its trajectory. This correction term l(f) in the denomi-nator was needed to eliminate the bias towards longer fibers intro-duced by the tractography algorithm. Moreover, the sum Sv+Sucorrects for the variable size of the cortical ROIs of the AAL template(Hagmann et al., 2008).
In themain analysis, aweighted graph approachwas used. To test therole of the weighting on possible organizational differences between thebrain networks of patients and healthy controls, an additional test wasperformed in which the weighting was omitted from the analysis. Foreach individual dataset, all nonzero weights (i.e., all connections) wereset to 1 and to 0 otherwise (van den Heuvel et al., 2010). The end resultof this procedure was an unweighted binary network. As a result, foreach participant, there were 2 different kinds of WM networks(density-weighted and binary), each of which was represented by asymmetric 116×116 matrix.
2.7. Graph theory analysis
We investigated the properties of the structural network at theglobal and regional (nodal) levels using the Brain Connectivity Tool-box (Rubinov and Sporns, 2010, https://sites.google.com/a/brain-connectivity-toolbox.net/bct/), quantifying the global networkarchitecture in terms of small-worldness, normalized clusteringcoefficient, normalized path length, and global efficiency. Wedescribed the regional properties in terms of strength, local efficien-cy, and betweenness centrality. Based on the constructed structuralnetwork, we looked for significant differences in global and nodalproperties between the TBI children and controls. In the Supplemen-tal material, we only provide brief, formal definitions of each of thenetwork properties used in this study. For more details and in-depth discussion of these metrics, the interested reader is referredto Rubinov and Sporns (2010).
2.8. Density of structural networks
It has been shown that manipulating the connection density (thenumber of edges) in a network by varying the number of valid
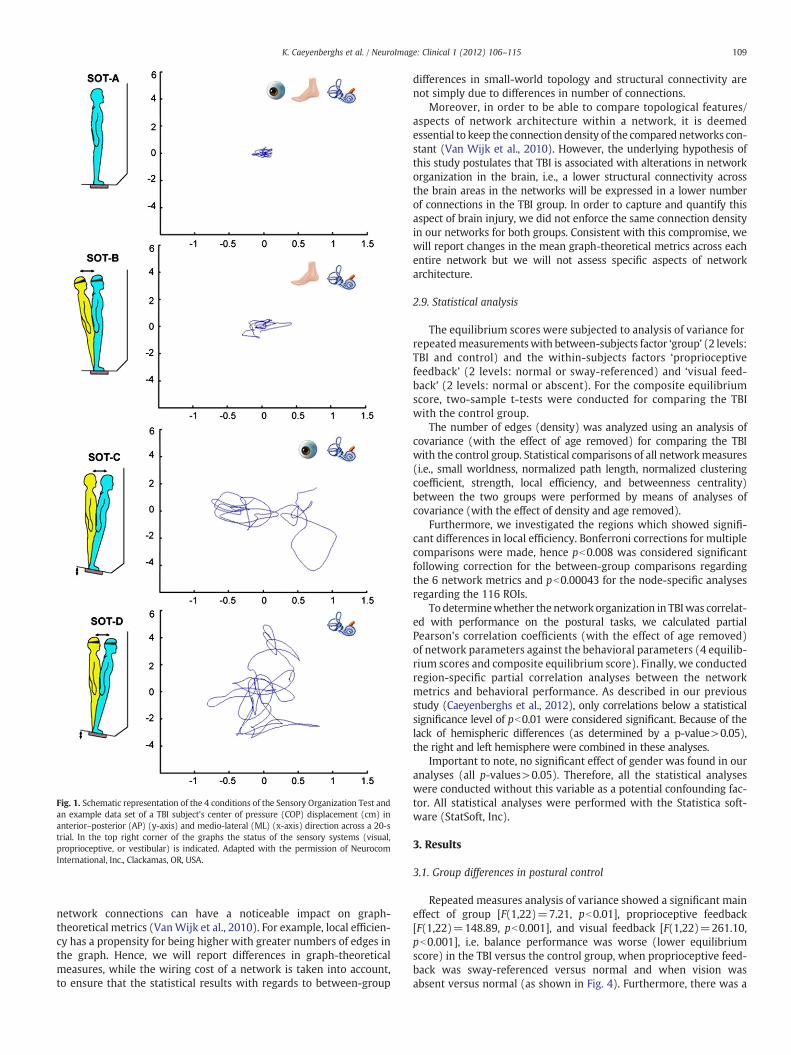
Fig. 1. Schematic representation of the 4 conditions of the Sensory Organization Test andan example data set of a TBI subject's center of pressure (COP) displacement (cm) inanterior–posterior (AP) (y-axis) and medio-lateral (ML) (x-axis) direction across a 20-strial. In the top right corner of the graphs the status of the sensory systems (visual,proprioceptive, or vestibular) is indicated. Adapted with the permission of NeurocomInternational, Inc., Clackamas, OR, USA.
109K. Caeyenberghs et al. / NeuroImage: Clinical 1 (2012) 106–115
network connections can have a noticeable impact on graph-theoretical metrics (VanWijk et al., 2010). For example, local efficien-cy has a propensity for being higher with greater numbers of edges inthe graph. Hence, we will report differences in graph-theoreticalmeasures, while the wiring cost of a network is taken into account,to ensure that the statistical results with regards to between-group
differences in small-world topology and structural connectivity arenot simply due to differences in number of connections.
Moreover, in order to be able to compare topological features/aspects of network architecture within a network, it is deemedessential to keep the connection density of the compared networks con-stant (Van Wijk et al., 2010). However, the underlying hypothesis ofthis study postulates that TBI is associated with alterations in networkorganization in the brain, i.e., a lower structural connectivity acrossthe brain areas in the networks will be expressed in a lower numberof connections in the TBI group. In order to capture and quantify thisaspect of brain injury, we did not enforce the same connection densityin our networks for both groups. Consistent with this compromise, wewill report changes in the mean graph-theoretical metrics across eachentire network but we will not assess specific aspects of networkarchitecture.
2.9. Statistical analysis
The equilibrium scores were subjected to analysis of variance forrepeatedmeasurementswith between-subjects factor ‘group’ (2 levels:TBI and control) and the within-subjects factors ‘proprioceptivefeedback’ (2 levels: normal or sway-referenced) and ‘visual feed-back’ (2 levels: normal or abscent). For the composite equilibriumscore, two-sample t-tests were conducted for comparing the TBIwith the control group.
The number of edges (density) was analyzed using an analysis ofcovariance (with the effect of age removed) for comparing the TBIwith the control group. Statistical comparisons of all networkmeasures(i.e., small worldness, normalized path length, normalized clusteringcoefficient, strength, local efficiency, and betweenness centrality)between the two groups were performed by means of analyses ofcovariance (with the effect of density and age removed).
Furthermore, we investigated the regions which showed signifi-cant differences in local efficiency. Bonferroni corrections for multiplecomparisons were made, hence pb0.008 was considered significantfollowing correction for the between-group comparisons regardingthe 6 network metrics and pb0.00043 for the node-specific analysesregarding the 116 ROIs.
To determinewhether the network organization in TBIwas correlat-ed with performance on the postural tasks, we calculated partialPearson's correlation coefficients (with the effect of age removed)of network parameters against the behavioral parameters (4 equilib-rium scores and composite equilibrium score). Finally, we conductedregion-specific partial correlation analyses between the networkmetrics and behavioral performance. As described in our previousstudy (Caeyenberghs et al., 2012), only correlations below a statisticalsignificance level of pb0.01 were considered significant. Because of thelack of hemispheric differences (as determined by a p-value>0.05),the right and left hemisphere were combined in these analyses.
Important to note, no significant effect of gender was found in ouranalyses (all p-values>0.05). Therefore, all the statistical analyseswere conducted without this variable as a potential confounding fac-tor. All statistical analyses were performed with the Statistica soft-ware (StatSoft, Inc).
3. Results
3.1. Group differences in postural control
Repeated measures analysis of variance showed a significant maineffect of group [F(1,22)=7.21, pb0.01], proprioceptive feedback[F(1,22)=148.89, pb0.001], and visual feedback [F(1,22)=261.10,pb0.001], i.e. balance performance was worse (lower equilibriumscore) in the TBI versus the control group, when proprioceptive feed-back was sway-referenced versus normal and when vision wasabsent versus normal (as shown in Fig. 4). Furthermore, there was a
Fig. 2. Flow chart of constructing a DTI-based network. First, for each DTI dataset (A) whole brain deterministic tractography (B) was performed using ExploreDTI (see Materials andmethods). The voxel-based reconstruction was then parcellated using the AAL template consisting of 118 unique brain regions (C-D). Fig. 1D shows the AAL labels overlayed on theT1 single subject template provided by MRIcroN. Fig. 1E shows an example of cortical connections and their corresponding WM fibers, linking the right anterior cingulum with theright posterior cingulum. We next determined the number of connections per unit surface between any two masks (any two regions of the AAL template), this value became theedge weight in an 116×116 connectivity matrix (F). Alternatively, an unweighted network analysis was performed, whereby we considered the existence/absence of connections,creating a binary matrix, in which the network edges were defined as 1 if there was at least one connection between both regions and as 0 otherwise. Next, from the resulting brainnetwork (G) overall organizational characteristics and node-specific organizational characteristics were computed and compared between patients and healthy controls.
110 K. Caeyenberghs et al. / NeuroImage: Clinical 1 (2012) 106–115
significant interaction effect between proprioceptive feedback andvisual feedback, F(1,22)=7.21, pb0.01. Post hoc (Tukey) testingrevealed that all participants showed more sway when propriocep-tive feedback was compromised, and that sway additionally increasedwhen vision was absent (all p'sb0.001). Omission of vision alone didnot have a significant effect on balance. Finally, the interactionbetween proprioceptive feedback and group was also significant,F(1,22)=6.62, pb0.05. Post hoc (Tukey) testing showed that the TBIgroup performed significantly worse than the controls on the sway-referenced conditions (all p'sb0.001). Moreover, post hoc Tukey testsrevealed significant differences between normal and sway-referencedfeedback within each group (all p'sb0.001).
The mean composite SOT balance score (average across all fourconditions) from the Equitest systemalso differed significantly betweenthe TBI patients (mean=67.1%; range 46.3–84.0%) and the controls(mean=77.0%; range 66.6–82.7%), t(22)=−2.69, pb0.01, with thelower scores in the TBI subjects indicating poorer balance (largeranterior/posterior body sway) than in the controls.
3.2. Density of structural brain networks
A significant effect for group was seen on density, representing thetotal “wiring cost” of the network [F(1,26)=46.43, pb0.001]. In other
words, the average number of edges was significantly lower in TBIpatients (mean=4857, SD=2193) compared with controls (mean=9702, SD=1254). Therefore, our main analyses regarding between-group differences in small-world topology and structural connectivitywere conducted by including density as covariate in each analysis.
3.3. Small-world properties and organization of structural brainnetworks
3.3.1. Small world topologyThe small-world attributes reflect the need of the structural net-
work to satisfy the opposing demands of local and global processing(Kaiser and Hilgetag, 2006). In other words, an optimal brain requiresa suitable balance between local specialization, supported by higherabsolute clustering coefficients, and global integration, supported byshorter absolute path lengths. This balance of global and local connec-tivity was abnormally shifted toward the global end of the scale in TBIpatients. This could be quantified by a change in the small-worldnessparameter σ. Although networks in both groups were small-world(σ>1), indicating that they had generally greater-than-random clus-tering (γ>>1) (TBI group: mean=5.94, SD=1.71; control group:mean=3.88, SD=0.32), but near-random path length (λ≈1) (TBIgroup: mean=1.01, SD=0.06; control group: mean=1.04, SD=

Fig. 3. Cortical and subcortical regions (58 in each hemisphere; 118 in total) as anatomically defined by a prior template image in standard stereotaxic space.
111K. Caeyenberghs et al. / NeuroImage: Clinical 1 (2012) 106–115
0.02), small-worldness was marginally increased [F(1,25)=5.41,pb0.05] because of the increase in normalized path length[F(1,25)=8.66, pcorrb0.008] in the TBI group.
3.3.2. TBI-related alterations in structural connectivityUsing ANOVA's with age and density as covariate, we observed that
the TBI group showed decreased values of local efficiency [F(1,25)=10.46, pcorrb0.008] in their WM networks as compared to the controls.We further compared the nodal efficiency of (sub)cortical regions inWM networks between the two groups. We found that TBI networksshowed decreased local efficiency (all pcorrb0.00043) predominantlylocated in the occipital regions (including the calcarine fissure, leftcuneus, lingual gyrus, superior, middle and inferior occipital gyrus),and subcortical regions (including the left olfactory cortex, left caudatenucleus, left putamen, left thalamus, cerebellum Crus I, and right cere-bellum Crus II). Additionally, we also found decreased local efficiency(all pcorrb0.00043) in frontal regions (the left superior frontal gyrus,orbital part of the left middle frontal gyrus, triangular part of the leftinferior frontal gyrus, medial (orbital) part of the superior frontal gyrus,left gyrus rectus, right anterior cingulate gyrus), parietal-(pre)motorregions (i.e., right precentral gyrus, postcentral gyrus, superior parietal
gyrus, right supramarginal gyrus, right angular gyrus, left precuneus),and fourmedial temporal lobe regions (left parahippocampal gyrus, tem-poral pole of the superior andmiddle temporal gyrus, left middle tempo-ral gyrus). Node specific values of local efficiency of both groups arepresented in Fig. 5.
WM networks of TBI patients showed an increased betweennesscentrality compared with controls [F(1,25)=7.76, pcorrb0.008].Furthermore, structural network analysis estimated for TBI and controlsrevealed that both groups exhibited hubs. In particular, 5 hub regionswere shared by both groups, i.e., the bilateral precuneus, right superiorfrontal gyrus, left middle occipital gyrus, and left thalamus. Of note,three brain regions, the left superior frontal gyrus, right superior parie-tal gyrus, and right postcentral gyrus,were identified as hubs in the con-trol group but not in the TBI group. Three other brain regions, the leftprecentral gyrus, right supplementary motor area, and left putamen,were identified as hubs in the TBI group but not in the control group.
3.4. Network properties correlation with postural control
We next examined the relationships between the network metricsand postural control. We considered only connectivity degree as a

Fig. 4. Behavioral task performance. The TBI group performed significantly worse thanthe controls on the sway referenced conditions and on the composite balance score.TBI, black bars; control, white bars; **pb0.01, ***pb0.001 for the TBI group comparedto controls; TBI, traumatic brain injury.
112 K. Caeyenberghs et al. / NeuroImage: Clinical 1 (2012) 106–115
network property in these analyses because it has been suggested tobe the most important measure of network analysis which is alsoassigned a straightforward neurobiological interpretation (Rubinovand Sporns, 2010): nodes with a high connectivity degree are struc-turally interacting with many other nodes in the network. Moreover,network degree is most commonly used as a measure of density, orthe total “wiring cost” of the network (Rubinov and Sporns, 2010).To determine the relationships, partial correlation analysis with ageas confounding covariate were separately performed for the TBI andcontrol groups. In the control group, none of the balance measuresshowed significant correlations with the networkmetrics. The follow-ing descriptions focus on the results in the TBI group. Fig. 6 shows the
Fig. 5. Group differences in local efficiency. Upper panel: controls, lower panel: TBI patientsto: yellow, significant after correction for multiple comparisons, pb0.0043; blue, not signifi
significant correlations between balance scores and connectivitydegree across the whole network on the one hand and regional con-nectivity degree on the other hand.
A significant positive correlation was found between mean con-nectivity degree of the network in the TBI group and mean compositeSOT score (r=0.65, pb0.05). In other words, increase in connectivitydegree was associated with better balance performance (i.e., loweranterior/posterior body sway). Significant correlations between con-nectivity degree across the whole network and equilibrium scoresfor the separate conditions were only found for the condition whereproprioceptive feedback and visual feedback were compromised(condition D), i.e., higher connectivity degree was associated withbetter performance on the postural task (r=0.62, pb0.05).
A more stringent threshold criterion (pcorrb0.01) was used to fur-ther determine the associations between specific nodes on one handand the composite score and equilibrium score of condition D on theother hand. Significant correlations were obtained between the com-posite score and connectivity degree of the superior parietal gyrus(r=0.73, pcorrb0.01). Also, we found that the equilibrium score of con-dition D (eyes closed, sway-referenced platform) was significantly pos-itively correlatedwith connectivity degree of the superior parietal gyrus(r=0.78, pcorrb0.01) and cerebellar lobule IX (r=0.71, pcorrb0.01).
4. Discussion
We compared the WM networks between young TBI patientsand healthy controls using DTI tractography and graph theoreticalapproaches. Both groups exhibited small-world properties in theirWM networks. However, efficiency was significantly decreased in theTBI patients compared with controls, with pronounced changes in thefrontal, occipital, parieto-premotor, subcortical, and medial-temporalareas. Moreover, connectivity degree was significantly correlated withthe balance scores. Our data show disrupted network organization ofWM networks in TBI patients, which may contribute to their persistentmotor disabilities.
. Size of the ROIs (spheres) represents the local efficiency. The colors of the nodes refercant.

Fig. 6. Plots indicating the relationships between the balance scores (mean composite score and equilibrium score of condition 4) and connectivity degree across the whole network(upper panel) and regional connectivity degree (lower panel).
113K. Caeyenberghs et al. / NeuroImage: Clinical 1 (2012) 106–115
4.1. Group differences in postural control
Our results suggest that the integration of sensory inputs is dis-turbed following TBI. In other words, TBI patients showed deficits inselecting the accurate and suppressing the compromised sensoryinputs. Lower scores on the SOT have been well documented in TBIpatients, especially in conditions where visual and vestibular inputsmust be relied upon to produce stability, even in the absence of anyclinically detectable neurological problem (Geurts et al., 1996;Guskiewicz et al., 1997). These results are consistent with previousstudies using clinical tests of postural control in TBI. For example,abnormally increased sway and reduced time scores during the Clin-ical Test for Sensory Interaction in Balance have been reported previ-ously (Ingersoll and Armstrong, 1992; Lehmann et al., 1990; Rubin etal., 1995).
4.2. Group differences in structural WM networks
We identified that both TBI patients and controls displayed prom-inent small-world properties in the WM networks. This finding isconsistent with previous structural network studies of the humanbrain using diffusion tractography in normal adults (Gong et al.,2009; Hagmann et al., 2007, 2008; Iturria-Medina et al., 2008) andin patient populations (Lo et al., 2010; Shu et al., 2009, 2011; vanden Heuvel et al., 2010; Wen et al., 2011). We found that, althoughWM networks of young TBI patients showed prominent small-worldproperties, several network parameters were found to be significantlyaltered, such as the normalized path length, local efficiency, andbetweenness centrality. Important to note, these differences in net-work topology were not only due to differences in number ofconnections.
Compared with the small-world properties of matched random net-works, an increased normalized path length (along with a marginalincrease in small-worldness) was observed in the TBI group. Giventhat the small-world topology is an optimal balance between local spe-cialization and global integration as networks evolved over time to copewith high complexity of dynamic behavior (Bullmore and Sporns,2009), our findings of increased normalized path length and small-worldness in TBI networks indicate a shift away from an optimal‘small world’ network organization towards an imbalanced structuralarchitecture with a more random configuration in WM networks.
Furthermore, lower efficiency was found in five distinct systems:frontal, occipital, parieto-premotor, subcortical, and medial-temporal
systems. Hence, our data support the notion of TBI as a ‘disconnectionsyndrome’ from a network perspective. The observed increasedbetweenness centrality in the TBI group may indicate a possible com-pensatory mechanism for decreased structural connectivity.
4.3. Importance of specific brain regions for network functionality
Structural network analyses conducted in TBI and controlsrevealed that both groups exhibit hubs. In particular, five hub regionswere shared by both groups, the bilateral precuneus, right superiorfrontal gyrus, left middle occipital gyrus, and left thalamus. It isworth noting that the precuneus was identified as the most importantregion in WM networks of TBIs and controls. The precuneus is part ofthe posterior parietal cortex which belongs to a widespread networkof higher association structures (Cavanna and Trimble, 2006), indicat-ing its central role across a broad spectrum of highly integrative tasks.The precuneus has also been ranked as the most pivotal region in pre-vious diffusion-MRI tractography network analyses in healthy adults(Hagmann et al., 2007; Gong et al., 2009; Shu et al., 2009), and anequivalent region to the precuneus (Brodmann area 7) was also iden-tified as a hub in the macaque cortical network (Sporns et al., 2007).
One brain region, the left putamen,was identified as a hub in the TBIgroup but not in the control group. The putamen, togetherwith the cau-date nucleus, makes up the striatum, amajor site of cortical and subcor-tical input into the basal ganglia as part of a cortico-striatal loop(Alexander et al., 1990). Its role has been implicated in a number ofimportant motor functions (Coghill et al., 1994; Jones et al., 1991), inparticular in the initiation of motor responses (Coxon et al., 2010;Toxopeus et al., 2007). Moreover, two other sensorimotor regions,which are implicated in planning ofmotor actions and bimanual control(including the left precentral gyrus and right supplementary motorarea) were also identified as hubs in the TBI group. Although, to thebest of our knowledge, no study has so far investigated structural orfunctional changes in these three regions in TBI patients, we hypothe-size that the increased betweenness centrality of these regions in thestructural network may be linked to compensatory reorganizationaiming to alleviate the reduced capacity for movement initiation inTBI patients.
4.4. Behavioral relevance of network alterations in TBI
Previously unreported, we have now shown associations betweenmotor disabilities and structural brain organization in TBI patients
114 K. Caeyenberghs et al. / NeuroImage: Clinical 1 (2012) 106–115
from a network perspective. Our results indicated that the TBI-relatedalterations in network properties were associated with balance deficits.We found that young TBI patients with decreased structural connec-tivity degree in WM networks displayed lower balance performance(i.e. higher anterior/posterior body sway).
Node-specific correlation analyses performed within the TBIgroup revealed significant correlations between the composite equi-librium score and the equilibrium score of condition 4 on one handand connectivity degree of a subset of brain regions on the otherhand, including cortical regions located in the superior parietal lob-ule, as well as subcortical structures such as the cerebellar lobule IX.
First, the correlation analyses provided evidence that deficits in pos-tural control are related to lower connectivity degree in the superiorparietal lobule. The superior parietal lobule is a major componentof a distributed spatial attention network (Pollmann et al., 2003;Vandenberghe et al., 2001; Yantis et al., 2002). More specifically,Molenberghs et al. (2007) have suggested that the function of thesuperior parietal lobule is closely related to the modification of spa-tial coordinates linked to attentional priorities (spatial shifting). Thisis consistent with the notion that the postural control task in ourstudy required seeking and selectively attending to significantextrapersonal stimuli in a dynamic environment, which in turnrequires updating the attentional priority map.
Secondly, the equilibrium score of condition D (eyes closed, sway-referenced platform) was also significantly correlated to connectivitydegree in subcortical structures, such as lobule IX of the cerebellum.Lobule IX has been implicated in various functional tasks including sen-sation (Hui et al., 2005), motor synchronization (Jantzen et al., 2004),working memory (Desmond et al., 1997), and perception of change instimulus timing (Liu et al., 2008). Interestingly, this result is in agree-ment with our previous DTI study (Caeyenberghs et al., 2010a), show-ing associations between the SOT balance scores and fractionalanisotropy in the cerebellar peduncles and cerebellum. Specifically, per-formance on condition D was positively related to mean fractionalanisotropy in the superior cerebellar peduncle, with better balancebeing associated with higher WM anisotropy. These results suggestthat evaluation of key motor control brain areas such as the cerebellumusing DTI tractography combined with a graph theoretical approachcould be helpful in developing imaging biomarkers for diagnostics/prognosis in patients with balance deficits following TBI.
All these node-specific results are consistent with the notion that pos-tural control is an extremely complex function that requires the intensivecooperation of cortical and subcortical structures to support intersensoryintegration for action. Important to note, connectivity degreewas not sig-nificantly correlated with the other balance conditions. We assume thatbalance conditionshave to be sufficiently challenging (i.e., under deprivedsensory conditions) for significant network organization-balance rela-tions to emerge.
4.5. Study limitations and considerations for interpreting the currentfindings
Limitations of the current study pertain to the relatively smallsample size and the cross sectional design. Despite the clear findings,their replication in a larger sample is mandatory. In addition, it hasbeen shown recently that there are many brain regions with complexfiber architecture, also referred to as “crossing fibers” (Jeurissen et al.,2011; Tournier et al., 2011). In these regions, where the diffusion ten-sor model has been shown to be inadequate (Frank, 2002; Tuch et al.,2002), partial volume effects exist (Alexander et al., 2001; Vos et al.,2011) that can adversely affect the estimation of diffusivity metrics(Wheeler-Kingshott and Cercignani, 2009; Vos et al., 2012). In thiscontext, tractography approaches based on more advanced diffusionmodels (e.g., Behrens et al., 2007; Descoteaux et al., 2009; Jeurissenet al., 2011) may provide more accurate anatomical connectivity pat-terns of brain networks.
Our main analyses showed consistent changes in structural connec-tivity between controls and patients that manifested across multiplegraph-theoretical metrics, showing that this decrease in mean structur-al connectivity could be captured across multiple (albeit inter-related)sub-domains of structural connectivity. However, it has to be empha-sized that in the present exploratory analysis the number of networkconnections was different between the two groups indicating the effectof brain injury in their networks. A disadvantage of having a differentnumber of connections (i.e., not limiting the network connections to aconstant number in both groups) in our networks is that we cannotmake inferences about specific topological aspects of the networks(see van Wijk et al., 2010). Hence, the present findings do not provethat the reduced structural connectivity in TBI patients is due to signif-icant changes in network topology but might have been carried sub-stantially by a decrease in number of network connections. Includingdensity as a covariate is not sufficient to control for differences in num-ber of edges, because most graphmeasures are non-linearly dependenton density.
Furthermore, for computational reasons normal theory based teststatistics were conducted instead of permutation testing (Ginestetand Simmons, 2011; van Wijk et al., 2010). Correction for multiplecomparisons on one hand and correction for density on the otherhand were used, but future studies are needed to determine the opti-mal methodology to control for multiple testing in a network settingand differences in network costs respectively. Alternative correctionmethods (Zalesky et al., 2010) and formal methods to the comparisonof several families of networks (Bassett et al., 2011b; Ginestet et al.,2011) have been suggested. Finally, longitudinal studies are neededto determine how changes in topological structure of WM networksare related to recovery and objective measures of postural control.
4.6. Conclusions
Taking into account these limitations, the present study is the firstreport illustrating associations between network metrics and posturalcontrol scores in a young TBI group. Although small-world propertieswere present for both patient and control networks, the architectureof the structural networks was significantly altered in TBI patients. Spe-cifically, TBI patients showed decreased connectivity degree, strength,and lower values of local efficiency. Furthermore, thedecreased connec-tivity degree was significantly associated with postural control perfor-mance. These brain-behavior relations pave the way for topology-based brain network analyses that may ultimately serve as biomarkersto improve TBI diagnostics/prognosis and for follow-up of balancedeficits.
Conflict of Interest
There are no conflicts of interest.
Appendix A. Supplementary data
Supplementary data to this article can be found online at http://dx.doi.org/10.1016/j.nicl.2012.09.011.
References
Alexander, G.E., Crutcher, M.D., DeLong, M.R., 1990. Basal ganglia–thalamocorticalcircuits: parallel substrates formotor, oculomotor, “prefrontal” and “limbic” functions.Progress in Brain Research 85, 119–146.
Alexander, A.L., Hasan, K.M., Lazar, M., Tsuruda, J.S., Parker, D.L., 2001. Analysis of partial vol-ume effects in diffusion-tensor MRI. Magnetic Resonance in Medicine 45, 770–780.
Basser, P.J., Pierpaoli, C., 1996. Microstructural and physiological features of tissueselucidated by quantitative-diffusion-tensor MRI. Journal of Magnetic Resonance.Series B 111, 209–219.
Basser, P.J., Pajevic, S., Pierpaoli, C., Duda, J., Aldroubi, A., 2000. In vivo fibertractography using DT-MRI data. Magnetic Resonance in Medicine 44, 625–632.
Bassett, D.S., Brown, J.A., Deshpande, V., Carlson, J.M., Grafton, S.T., 2011a. Conserved andvariable architecture of humanwhite matter connectivity. NeuroImage 54, 1262–1279.
115K. Caeyenberghs et al. / NeuroImage: Clinical 1 (2012) 106–115
Bassett, D.S., Wymbs, N.F., Porter, M.A., Mucha, P.J., Carlson, J.M., Grafton, S.T., 2011b.Dynamic reconfiguration of human brain networks during learning. Proceedings ofthe National Academy of Sciences of the United States of America 108, 7641–7646.
Behrens, T.E.J., Berg, H.J., Jbabdi, S., Rushworth, M.F.S., Woolrich, M.W., 2007. Probabilisticdiffusion tractographywithmultiplefibre orientations:what canwe gain?NeuroImage34, 144–155.
Black, K., Zafonte, R.,Millis, S., Desantis, N., Harrison-Felix, C.,Wood, D.,Mann, N., 2000. Sittingbalance following brain injury: does it predict outcome? Brain Injury 14, 141–152.
Bullmore, E., Sporns, O., 2009. Complex brain networks: graph theoretical analysis ofstructural and functional systems. Nature Reviews. Neuroscience 10, 186–198.
Caeyenberghs, K., Wenderoth, N., Smits-Engelsman, B.C., Sunaert, S., Swinnen, S.P.,2009. Neural correlates of motor dysfunction in children with traumatic brain injury:exploration of compensatory recruitment patterns. Brain 132, 684–694.
Caeyenberghs, K., Leemans, A., Geurts, M., Taymans, T., Linden, C.V., Smits-Engelsman,B.C., Sunaert, S., Swinnen, S.P., 2010a. Brain–behavior relationships inyoung traumaticbrain injury patients: DTI metrics are highly correlated with postural control. HumanBrain Mapping 31, 992–1002.
Caeyenberghs, K., Leemans, A., Geurts, M., Taymans, T., Vander, L.C., Smits-Engelsman,B.C., Sunaert, S., Swinnen, S.P., 2010b. Brain–behavior relationships in young traumaticbrain injury patients: fractional anisotropy measures are highly correlated withdynamic visuomotor tracking performance. Neuropsychologia 48, 1472–1482.
Caeyenberghs, K., Leemans, A., Geurts, M., Linden, C.V., Smits-Engelsman, B.C., Sunaert, S.,Swinnen, S.P., 2011. Correlations between white matter integrity and motor functionin traumatic brain injury patients. Neurorehabilitation andNeural Repair 25, 492–502.
Caeyenberghs, K., Leemans, A., Heitger, M.H., Leunissen, I., Dhollander, T., Sunaert, S.,Dupont, P., Swinnen, S.P., 2012. Graph analysis of functional brain networks forcognitive control of action in traumatic brain injury. Brain 135, 1293–1307.
Castellanos, N.P., Leyva, I., Buldu, J.M., Bajo, R., Paul, N., Cuesta, P., Ordonez, V.E., Pascua,C.L., Boccaletti, S., Maestu, F., del-Pozo, F., 2011. Principles of recovery from traumaticbrain injury: reorganization of functional networks. NeuroImage 55, 1189–1199.
Cavanna, A.E., Trimble, M.R., 2006. The precuneus: a review of its functional anatomyand behavioural correlates. Brain 129, 564–583.
Coghill, R.C., Talbot, J.D., Evans, A.C., Meyer, E., Gjedde, A., Bushnell, M.C., Duncan, G.H.,1994. Distributed processing of pain and vibration by the human brain. The Journalof Neuroscience 14, 4095–4108.
Coxon, J.P., Goble, D.J., Van Impe, A., De Vos, J., Wenderoth, N., Swinnen, S.P., 2010.Reduced Basal Ganglia FunctionWhen Elderly Switch betweenCoordinatedMovementPatterns. Cerebral Cortex 20, 2368–2379.
Descoteaux, M., Deriche, R., Knosche, T.R., Anwander, A., 2009. Deterministic andProbabilistic Tractography Based on Complex Fibre Orientation Distributions.IEEE Transactions on Medical Imaging 28, 269–286.
Desmond, J.E., Gabrieli, J.D.E., Wagner, A.D., Ginier, B.L., Glover, G.H., 1997. Lobular patternsof cerebellar activation in verbal working-memory and finger-tapping tasks asrevealed by functional MRI. The Journal of Neuroscience 17, 9675–9685.
Frank, L.R., 2002. Characterization of anisotropy in high angular resolution diffusion-weighted MRI. Magnetic Resonance in Medicine 47, 1083–1099.
Geurts, A.C., Ribbers, G.M., Knoop, J.A., van Limbeek, J., 1996. Identification of static anddynamic postural instability following traumatic brain injury. Archives of PhysicalMedicine and Rehabilitation 77, 639–644.
Ginestet, C.E., Simmons, A., 2011. Statistical parametric network analysis of functionalconnectivity dynamics during a working memory task. NeuroImage 55, 688–704.
Ginestet, C.E., Nichols, T.E., Bullmore, E.T., Simmons, A., 2011. Brain Network Analysis:Separating Cost from Topology Using Cost-Integration. PLoS One 6 (7), e21570(Electronic publication ahead of print 2011 Jul 28).
Gong, G., He, Y., Concha, L., Lebel, C., Gross, D.W., Evans, A.C., Beaulieu, C., 2009.Mapping anatomical connectivity patterns of human cerebral cortex using invivo diffusion tensor imaging tractography. Cerebral Cortex 19, 524–536.
Guskiewicz, K.M., Riemann, B.L., Perrin, D.H., Nashner, L.M., 1997. Alternativeapproaches to the assessment of mild head injury in athletes. Medicine and Sciencein Sports and Exercise 29, S213–S221.
Hagmann, P., Kurant, M., Gigandet, X., Thiran, P., Wedeen, V.J., Meuli, R., Thiran, J.P., 2007.Mapping human whole-brain structural networks with diffusion MRI. PloS One 2, e597.
Hagmann, P., Cammoun, L., Gigandet, X., Meuli, R., Honey, C.J.,Wedeen, V., Sporns, O., 2008.Mapping the structural core of human cerebral cortex. PLoS Biology 6, 1479–1493.
Hui, K.K.S., Liu, J.,Marina, O., Napadow, V., Haselgrove, C., Kwong, K.K., Kennedy, D.N.,Makris,N., 2005. The integrated response of the human cerebro-cerebellar and limbic systemsto acupuncture stimulation at ST 36 as evidenced by fMRI. NeuroImage 27, 479–496.
Ingersoll, C.D., Armstrong, C.W., 1992. The Effects of Closed-Head Injury on PosturalSway. Medicine and Science in Sports and Exercise 24, 739–743.
Iturria-Medina, Y., Sotero, R.C., Canales-Rodriguez, E.J., Aleman-Gomez, Y., Melie-Garcia, L., 2008. Studying the human brain anatomical network via diffusion-weighted MRI and Graph Theory. NeuroImage 40, 1064–1076.
Jantzen, K.J., Steinberg, F.L., Kelso, J.A.S., 2004. Brain networks underlying humantiming behavior are influenced by prior context. Proceedings of the NationalAcademy of Sciences of the United States of America 101, 6815–6820.
Jeurissen, B., Leemans, A., Jones, D.K., Tournier, J.D., Sijbers, J., 2011. Probabilistic FiberTracking Using the Residual Bootstrap with Constrained Spherical Deconvolution.Human Brain Mapping 32, 461–479.
Jones, D.K., Leemans, A., 2011. Diffusion tensor imaging. Methods in Molecular Biology711, 127–144.
Jones, A.K., Brown, W.D., Friston, K.J., Qi, L.Y., Frackowiak, R.S., 1991. Cortical andsubcortical localization of response to pain inman using positron emission tomography.Proceedings. Biological sciences / The Royal Society 244, 39–44.
Kaiser, M., Hilgetag, C.C., 2006. Nonoptimal component placement, but short processingpaths, due to long-distance projections in neural systems. PLoS ComputationalBiology 2, 805–815.
Kraus, J.F., McArthur, D.L., 1996. Epidemiologic aspects of brain injury. NeurologicClinics 14, 435–450.
Leemans, A., Jones, D.K., 2009. The B-matrix must be rotated when correcting for subjectmotion in DTI data. Magnetic Resonance in Medicine 61, 1336–1349.
Leemans, A., Jeurissen, B., Sijbers, J., Jones, D.K., 2009. ExploreDTI: a graphical toolboxfor processing, analyzing, and visualizing diffusion MR data. In: 17th Annual Meet-ing of Intl Soc Mag Reson Med. p. 3537, Hawaii, USA.
Lehmann, J.F., Boswell, S., Price, R., Burleigh, A., Delateur, B.J., Jaffe, K.M., Hertling, D., 1990.Quantitative-evaluation of sway as an indicator of functional balance in posttraumaticbrain injury. Archives of Physical Medicine and Rehabilitation 71, 955–962.
Leunissen, I., Coxon, J.P., Geurts, M., Caeyenberghs, K., Michiels, K., Sunaert, S., Swinnen,S.P., 2012. Disturbed cortico-subcortical interactions during motor task switchingin traumatic brain injury. Human Brain Mapping. http://dx.doi.org/10.1002/hbm.21508 (Electronic publication ahead of print 2012 Jan 30).
Liu, T., Xu, D., Ashe, J., Bushara, K., 2008. Specificity of inferior olive response to stimulustiming. Journal of Neurophysiology 100, 1557–1561.
Lo, C.Y., Wang, P.N., Chou, K.H., Wang, J., He, Y., Lin, C.P., 2010. Diffusion tensortractography reveals abnormal topological organization in structural corticalnetworks in Alzheimer's disease. The Journal of Neuroscience 30, 16876–16885.
Molenberghs, P., Mesulam, M.M., Peeters, R., Vandenberghe, R.R.C., 2007. Remappingattentional priorities: Differential contribution of superior parietal lobule andintraparietal sulcus. Cerebral Cortex 17, 2703–2712.
Nakamura, T., Hillary, F.G., Biswal, B.B., 2009. Resting network plasticity following braininjury. PLoS One 4, e8220.
Pollmann, S., Weidner, R., Humphreys, G.W., Olivers, C.N.L., Muller, K., Lohmann, G.,Wiggins, C.J., Watson, D.G., 2003. Separating distractor rejection and target detectionin posterior parietal cortex — an event-related fMRI study of visual marking.NeuroImage 18, 310–323.
Rubin, A.M., Woolley, S.M., Dailey, V.M., Goebel, J.A., 1995. Postural stability followingmild head or whiplash injuries. The American Journal of Otology 16, 216–221.
Rubinov, M., Sporns, O., 2010. Complex network measures of brain connectivity: usesand interpretations. NeuroImage 52, 1059–1069.
Shu, N., Liu, Y., Li, J., Li, Y.H., Yu, C.S., Jiang, T.Z., 2009. Altered anatomical network inearly blindness revealed by diffusion tensor tractography. PLoS One 4, e7228.
Shu, N., Liu, Y., Li, K., Duan, Y., Wang, J., Yu, C., Dong, H., Ye, J., He, Y., 2011. Diffusiontensor tractography reveals disrupted topological efficiency inwhitematter structuralnetworks in multiple sclerosis. Cerebral Cortex 21, 2565–2577.
Sporns, O., Honey, C.J., Kotter, R., 2007. Identification and classification of hubs in brainnetworks. PLoS One 2, e1049.
Tournier, J.D., Mori, S., Leemans, A., 2011. Diffusion tensor imaging and beyond.Magnetic Resonance in Medicine 65, 1532–1556.
Toxopeus, C.M., de Vries, P.M., de Jong, B.M., Johnson, K.A., George, M.S., Bohning, D.E.,Walker, J., Leenders, K.L., 2007. Cerebral activation patterns related to initiationand inhibition of hand movement. Neuroreport 18, 1557–1560.
Tuch, D.S., Reese, T.G., Wiegell, M.R., Makris, N., Belliveau, J.W., Wedeen, V.J., 2002. Highangular resolution diffusion imaging reveals intravoxelwhitematterfiber heterogeneity.Magnetic Resonance in Medicine 48, 577–582.
Tzourio-Mazoyer, N., Landeau, B., Papathanassiou, D., Crivello, F., Etard, O., Delcroix, N.,Mazoyer, B., Joliot, M., 2002. Automated anatomical labeling of activations in SPMusing a macroscopic anatomical parcellation of the MNI MRI single-subject brain.NeuroImage 15, 273–289.
van den Heuvel, M.P., Mandl, R.C., Stam, C.J., Kahn, R.S., Hulshoff Pol, H.E., 2010.Aberrant frontal and temporal complex network structure in schizophrenia: agraph theoretical analysis. The Journal of Neuroscience 30, 15915–15926.
vanWijk, B.C.M., Stam, C.J., Daffertshofer, A., 2010. Comparing brain networks of differentsize and connectivity density using graph theory. PLoS One 5, e13701.
Vandenberghe, R., Gitelman, D.R., Parrish, T.B., Mesulam, M.M., 2001. Functional specificityof superior parietal mediation of spatial shifting. NeuroImage 14, 661–673.
Vos, S.B., Jones, D.K., Viergever, M.A., Leemans, A., 2011. Partial volume effect as a hiddencovariate in DTI analyses. NeuroImage 55, 1566–1576.
Vos, S.B., Jones, D.K., Jeurissen, B., Viergever, M.A., Leemans, A., 2012. The influence ofcomplex white matter architecture on the mean diffusivity in diffusion tensorMRI of the human brain. NeuroImage 59, 2208–2216.
Wen, W., Zhu, W., He, Y., Kochan, N.A., Reppermund, S., Slavin, M.J., Brodaty, H.,Crawford, J., Xia, A., Sachdev, P., 2011. Discrete neuroanatomical networks areassociated with specific cognitive abilities in old age. The Journal of Neuroscience31, 1204–1212.
Wheeler-Kingshott, C.A.M., Cercignani, M., 2009. About “axial” and “radial” diffusivities.Magnetic Resonance in Medicine 61, 1255–1260.
Yantis, S., Schwarzbach, J., Serences, J.T., Carlson, R.L., Steinmetz, M.A., Pekar, J.J.,Courtney, S.M., 2002. Transient neural activity in human parietal cortex duringspatial attention shifts. Nature Neuroscience 5, 995–1002.
Zalesky, A., Fornito, A., Bullmore, E.T., 2010. Network-based statistic: identifying differencesin brain networks. NeuroImage 53, 1197–1207.