brain characteristics of individuals resisting age-related cognitive
TRANSCRIPT

Behavioral/Cognitive
Brain Characteristics of Individuals Resisting Age-RelatedCognitive Decline over Two Decades
Sara Pudas,1,6 Jonas Persson,1,2,6 Maria Josefsson,3,6 Xavier de Luna,3 Lars-Goran Nilsson1, and Lars Nyberg4,5,6
1Department of Psychology, Stockholm University, 10691 Stockholm, Sweden, 2Aging Research Center, Karolinska Institute, 11330 Stockholm, Sweden, and3Department of Statistics, Umeå School of Business and Economics, 4Department of Integrative Medical Biology (Physiology), 5Department of RadiationSciences (Radiology), and 6Umeå Center for Functional Brain Imaging, Umeå University, 90187 Umeå, Sweden
Some elderly appear to resist age-related decline in cognitive functions, but the neural correlates of successful cognitive aging are not wellknown. Here, older human participants from a longitudinal study were classified as successful or average relative to the mean attrition-corrected cognitive development across 15–20 years in a population-based sample (n � 1561). Fifty-one successful elderly and 51age-matched average elderly (mean age: 68.8 years) underwent functional magnetic resonance imaging while performing an episodicmemory face–name paired-associates task. Successful older participants had higher BOLD signal during encoding than average partic-ipants, notably in the bilateral PFC and the left hippocampus (HC). The HC activation of the average, but not the successful, older groupwas lower than that of a young reference group (n � 45, mean age: 35.3 years). HC activation was correlated with task performance, thuslikely contributing to the superior memory performance of successful older participants. The frontal BOLD response pattern mightreflect individual differences present from young age. Additional analyses confirmed that both the initial cognitive level and the slope ofcognitive change across the longitudinal measurement period contributed to the observed group differences in BOLD signal. Further, thedifferences between the older groups could not be accounted for by differences in brain structure. The current results suggest that onemechanism behind successful cognitive aging might be preservation of HC function combined with a high frontal responsivity. Thesefindings highlight sources for heterogeneity in cognitive aging and may hold useful information for cognitive intervention studies.
IntroductionAging is accompanied by an average decline in mental abilitiessuch as processing speed, attention, and episodic memory(Schaie, 1994; Verhaeghen and Salthouse, 1997; Ronnlund et al.,2005). However, there is substantial heterogeneity in cognitiveaging trajectories (Christensen et al., 1999; Wilson et al., 2002),with some individuals showing minimal or no decline (Habib etal., 2007). Predictors of successful cognitive aging include higheducational attainment, good health, large social network, andlifestyle and genetic factors (Barnes et al., 2007; Habib et al., 2007;Yaffe et al., 2009; Josefsson et al., 2012). However, despite exten-sive literature on the neural correlates of cognitive decline inaging (Buckner, 2004), the neural bases of successful aging re-main unclear.
Successfully aged individuals could have maintained brain in-tegrity (Nyberg et al., 2012), thus being spared from structuraland functional alterations of the PFC and MTL that typically
accompany age-related cognitive decline (Golomb et al., 1994;Rajah and D’Esposito, 2005; Persson et al., 2012). Successful ag-ing could also be enabled by an innate or acquired resilience tobrain pathology, such as cognitive (Stern, 2009) or brain (Satz,1993) reserve. Few neuroimaging studies have explicitly investi-gated successful aging, but elderly participants have been charac-terized as cognitively high or low performing. Commonly,greater brain activation in elderly, especially in the PFC, iscorrelated with higher cognitive performance (Eyler et al.,2011), which has been interpreted as compensatory recruit-ment to maintain performance. However, contradicting re-sults have been found (Persson et al., 2006) and, for areas suchas the MTL, the results are inconsistent (Eyler et al., 2011).Further, consistent with the notion of brain maintenance,some studies instead indicate more youth-like brain activationpatterns in high-performing elderly (Waiter et al., 2008; Duzelet al., 2011).
The mixed findings may stem from inadequate or inconsistentdefinitions of successful aging. Defining successfully aged as thetop-performing individuals in an elderly sample is inadequatebecause it ignores performance levels of younger individuals, anddefinitions relative to the performance of younger persons mightbe biased by cohort effects (Ronnlund et al., 2005). Longitudinaldesigns are advocated for studying both usual aging (Raz andLindenberger, 2011) and successful aging (Fiocco and Yaffe,2010). Such designs, however, also face challenges such as selec-tive attrition and psychometric artifacts. The latter include ceilingand floor effects, regression toward the mean artifacts, and mea-
Received June 18, 2012; revised March 26, 2013; accepted April 10, 2013.Author contributions: J.P., L.-G.N., and L.N. designed research; S.P. performed research; M.J. and X.d.L. contrib-
uted unpublished reagents/analytic tools; S.P., M.J., and X.d.L. analyzed data; S.P., J.P., and L.N. wrote the paper.This work was supported by the Swedish Research Council (grants to L.N. and J.P.) and the Knut and Alice
Wallenberg Foundation (grant to L.N.). The Betula project is supported by a grant from the Swedish Research Council(to L.N. and L.-G.N.). We thank the staff of the Betula project, Micael Andersson, Alireza Salami, and our collaboratorsat the Umeå Center for Functional Brain Imaging.
The authors declare no competing financial interests.Correspondence should be addressed to Sara Pudas, Department of Integrative Medical Biology, Umeå Univer-
sity, 901 87 Umeå, Sweden. E-mail: [email protected]:10.1523/JNEUROSCI.2900-12.2013
Copyright © 2013 the authors 0270-6474/13/338668-10$15.00/0
8668 • The Journal of Neuroscience, May 15, 2013 • 33(20):8668 – 8677

surement scales with varying sensitivity to change at differentlevels (Proust-Lima et al., 2007).
Here we addressed some of these issues by defining successfulaging relative to the average, attrition-corrected episodic mem-ory development in a large population-based sample (n � 1561;Nilsson et al., 1997). Successfully aged individuals were identifiedwith a statistical classification method (Little, 1995; Josefsson etal., 2012) and the neural correlates of successful aging were inves-tigated with fMRI in a subsample of elderly (n � 102). We fo-cused on areas important for episodic memory and with adocumented sensitivity to aging: the MTL and the PFC (Golombet al., 1994; Rajah and D’Esposito, 2005; Persson et al., 2012).
Materials and MethodsParticipants and selection procedures. The data reported in the presentstudy were derived from three samples from the longitudinal,population-based Betula study (Nilsson et al., 1997). Samples 1 and 3were recruited at the first and second measurement points, respectively(T1: 1988 –1990 and T2: 1993–1995) and formed the basis for the statis-tical classification model described below. At recruitment, the samplescomprised 1000 individuals each, with subjects evenly distributed over10 age cohorts ranging from 35 to 80 years of age and approximately evengender distributions (full sample characteristics are given by Nilsson etal., 1997). These samples had been followed longitudinally for 15–20years and cognitively tested every fifth year. In connection with the fifthmeasurement point, T5 (2008 –2010) in Betula, 292 participants fromSamples 1 and 3 were scanned with structural and functional MRI. Anadditional 83 participants from a new sample (sample 6, recruited at T5)were also included in the imaging study, adding up to 375 persons intotal. Participation in the imaging sample was randomly offered to par-ticipants who had completed cognitive testing at T5 until a pre-allottednumber of slots were filled, which were stratified by age and gender.
The final groups, on which the imaging analyses were based, are pre-sented in the Results section. The successful aging group consisted of allelderly participants in the imaging sample who had been classified ascognitive maintainers in our previous study (Josefsson et al., 2012; clas-sification procedures described below) and did not meet the exclusioncriteria described in the next paragraph. The control group consisted ofparticipants who were classified as having average cognitive developmentover 15–20 years, and these were age-matched person by person to theincluded successful agers. Selection of participants from the imagingsample into the average control group was based on the shortest stan-dardized Euclidian distance to the average baseline cognitive test scoreand the average slope of cognitive change. This metric was calculated foreach age cohort in the full Betula sample (1954 participant baseline scoresand the slopes of 1561 participants with two or more measurements).This procedure ensured that the most representative participants (i.e.,those closest to the average baseline score and slope) from the imagingsample were selected into the control group. Whenever a participant withthe shortest Euclidian distance met any of the exclusion criteria, theperson with the next shortest distance was selected instead. In addition tothe two elderly groups, fMRI data from a young reference group wereused to interpret the group differences between the successful and aver-age elderly. This group included data from all participants in the imagingsample who did not meet exclusion criteria and were 45 years of age oryounger.
Before imaging analyses, 24 successful agers were excluded for thefollowing reasons: problems with visual acuity (n � 4), poor-qualitystructural T1 image preventing satisfactory normalization (e.g., outlierstatus, or missing data; n � 6), not fulfilling preestablished performancecriteria for the scanner task (�42% correct responses and �50% missingresponses; n � 9), and health-related issues or remarks from the radiol-ogist screening the structural scans for abnormities (n � 5). Further, 29participants classified as having average cognitive development wereomitted from the average control group for the following reasons: notreaching performance criteria (n� 26), problems with visual acuity (n �2), and misunderstanding the scanner task (n � 1). An additional averageparticipant was excluded after preliminary imaging analyses due to out-
lier status across all voxels/clusters. The young group was subjected to thesame exclusion criteria as the older groups, but only one young partici-pant had to be excluded due to a technical problem with responsecollection.
All included participants were in good general health, without majorneurological impairments or diagnoses, and had normal, or corrected tonormal, vision. Participants signed a written informed consent form andwere financially compensated for their participation. The study was ap-proved by the local ethics board at Umeå University.
Cognitive measures and classification of cognitive change. Cognitivechange was assessed with a composite of five episodic memory scores,measured at 5-year intervals during 20 years of the Betula study (Nilssonet al., 1997). The composite consisted of: (1) immediate free recall of 16imperative verb–noun sentences that were enacted by the participant, (2)delayed cued recall of nouns from the previously enacted sentences, (3)immediate free recall of 16 verbally and visually presented verb–nounsentences, (4) delayed cued recall of nouns from the previously presentedsentences, and (5) immediate free recall of 12 verbally presented nouns.Testing procedures remained constant across measurement occasionsand full details have been given previously (Nilsson et al., 1997).
The statistical classification procedures have previously been de-scribed in full detail (Josefsson et al., 2012) and encompassed baselinememory scores of all 1954 participants in Samples 1 and 3 from theBetula study and the slopes of 1561 participants with two or more mea-surement points. The slopes (i.e., linear rates of cognitive change over15–20 years) were computed for each participant through ordinary least-squares regression of the episodic memory composite on time. Theslopes and baseline scores were then entered into a random-effectspattern-mixture model (Little, 1995) to estimate an attrition-corrected average memory development in each of 10 age cohorts inour full sample.
Significant negative correlations between baseline level and rate ofchange in our cognitive scores were observed for every age cohort (with rranging from �0.22 to �0.43) in the Betula samples. Individuals startingwith high levels of performance tended to display more decline, whereasindividuals with low initial performance seemed to improve or declineless rapidly. Rather than being indicative of true biological processes,these associations likely reflect a combination of statistical and psycho-metric artifacts, such as regression toward the mean or functional floorand ceiling effects (Salthouse, 2012), or that the tests have varying sensi-tivity to change depending on the level of the scale (Proust-Lima et al.,2007). For the purposes of our classification, this entails that a zero orpositive slope alone is not an adequate definition of successful aging,because that would lead to an overrepresentation of individuals withapparent improvement from a low level in the successful aging group.Therefore, we wanted to define a successful ager as a person with a mod-erate/high initial memory score and a better than average slope for agiven baseline score.
Therefore, each participant was classified based on how his/her initialbaseline memory score and estimated rate of change compared with theaverage for his/her age cohort as estimated from the pattern-mixturemodel. To obtain an outcome measure that accounted for both initiallevel and slope of change in memory scores, we used the predicted finalscore as a cutoff measure because the predicted final score, by definition,is a linear combination of the baseline score plus rate of change multi-plied by time in the study (i.e., 15 or 20 years). This allowed us to considercognitive performance across the entire 15–20 years that the participantshad been followed in our definition of successful aging. All individualswith predicted final scores greater than 1 SD from the estimated averagescore in each respective age cohort were classified as successful agers(denoted as “maintainers” in Josefsson et al., 2012). Individuals withfinal scores below 1 SD from the average were classified as decliners andexcluded from the present study. The remaining participants wereclassified as average and formed the basis for the average controlgroup in the imaging analyses. The reason for not including the de-cliners in subsequent analyses was that only seven decliners remainedin our imaging sample after applying the exclusion criteria. Theseindividuals were also, on average, 8.1 years younger than the success-ful agers in the sample.
Pudas et al. • Brain Characteristics of Successful Aging J. Neurosci., May 15, 2013 • 33(20):8668 – 8677 • 8669

In the current application of our statistical classification model, and incontrast to our previous study (Josefsson et al., 2012), separate modelswere estimated for each sample (831 persons in Sample 1, and 730 inSample 3) because the samples had different numbers of measurementpoints.
In-scanner memory task. Participants performed a face–name paired-associates task (Kauppi et al., 2011; Persson et al., 2011; Salami et al.,2012b) implemented in E-prime software (Psychology Software Tools).This task comprised of blocks of encoding and retrieval and an activebaseline task involving simple perceptual discrimination (e.g., subjectshad to press a button when the fixation cross was replaced by a circle).Encoding stimuli were photographs of unfamiliar faces presented sepa-rately, together with a common first name. In the retrieval blocks, thepreviously presented faces reappeared together with three letters. Partic-ipants were instructed to indicate the correct first letter of the name bypressing one of three buttons. If unsure, they were instructed to guess.Presentation time was 4 s per face in both encoding and retrieval condi-tions, with 1.5– 4.5 s randomized interstimulus intervals (allowing forboth event-related and blocked analyses). The mean duration betweenencoding and retrieval of a given face was 85.1 s (SD � 26.1). A total of 24face–name pairs were presented throughout the task, which lasted �10min. Block and stimulus order was pseudorandomized and constantacross all participants. Before scanning, participants were familiarizedwith the task by completing a short practice version of it.
The scanner task was presented to the participants on a computerscreen, seen through a tilted mirror on the head coil. Responses werecollected on a scanner-compatible response pad. Participants were givenheadphones and earplugs to dampen scanner noise, and cushions insidethe head coil minimized head movements.
MRI acquisition. Structural and functional imaging was performed ona 3 tesla General Electric scanner equipped with a 32 channel head coil.Functional data were acquired with a gradient echoplanar imaging se-quence (37 transaxial slices, thickness: 3.4 mm, gap: 0.5 mm, TR 2000 ms,TE 30 ms, flip angle 80°, field of view 25 � 25 cm). To allow for progres-sive saturation of the fMRI signal, 10 dummy scans were collected anddiscarded before experimental image acquisition. High-resolution T1-weighted structural images were collected with a 3D fast spoiled gradientecho sequence (180 slices with a 1 mm thickness, TR 8.2 ms, TE 3.2 ms,flip angle 12°, field of view 25 � 25 cm). Finally, white matter integritywas assessed with a diffusion tensor imaging (DTI) T2-weighted spin-echoplanar sequence (64 slices, TR 8000 ms, TE 84.4 ms, flip angle90°, field of view 25 � 25 cm, b � 1000 s/mm 2; six B0 images werecollected). Images were acquired in three repetitions, with 32 inde-pendent directions.
Data preprocessing and analysis. Preprocessing and analysis of imagingdata were done in SPM8 (Wellcome Department of Imaging Science,Functional Imaging Laboratory, http://www.fil.ion.ucl.ac.uk/spm) im-plemented in MATLAB 7.11 (MathWorks). Batching of analyses, visual-ization, and extraction of median parameter estimates across clusterswere performed with software developed inhouse (DataZ).
Functional data. The fMRI data were preprocessed to correct for dif-ferences in within-volume slice acquisition times and head movement(by realignment and unwarping). The functional images were coregis-tered to each participant’s structural T1 image. First-order statisticalanalyses were set up, using voxelwise general linear models with theexperimental conditions (i.e., encoding, retrieval, and baseline) as re-gressors, modeled as boxcars, and convolved with the standard hemody-namic response function. An event-related control analysis was alsoperformed for the encoding condition, including only subsequently re-membered items. For this analysis, trials were categorized based on re-sponses in the retrieval condition. Separate regressors were constructedfor items that were later recalled and items that were forgotten. Each trialwas treated as an impulse, and these events were convolved with thestandard hemodynamic response function. Linear contrasts were per-formed to generate SPM maps representing the differences in brain acti-vation between subsequently recalled items compared with the baseline.The statistical models contained the six realignment parameters as cova-riates of no interest. The resulting contrast images were then nonlinearlynormalized to a local, age-representative template (see below). Finally,
the images were affinely aligned to the MNI standard space andsmoothed with an 8 mm FWHM Gaussian kernel. All reported coordi-nates are in MNI space.
Second-level analyses were set up with random-effects models to dis-play the main effects of the tasks across all 147 participants (i.e.,encoding-baseline and retrieval-baseline) using one-sample t tests. Thesewere corrected for multiple comparisons using the FWE rate at p � 0.05.Two-sample t tests were used to test group differences between successfuland average older participants in the encoding-baseline and retrieval-baseline contrasts. An uncorrected statistical threshold of p � 0.001 andan extent threshold of 10 contiguous voxels were used for these contrasts.Significant clusters were localized with automated anatomical labeling(Tzourio-Mazoyer et al., 2002). Finally, for ROI analyses, brain-behaviorcorrelations, and visualization of results, median BOLD effect sizes wereextracted across significant clusters and across a hippocampus (HC)mask generated from our sample template with FreeSurfer software(http://surfer.nmr.mgh.harvard.edu). Voxel-level BOLD effects werecalculated using the formula ([�Encoding � �Baseline]/�Constant) � 100,where the �s are the regression coefficients for the encoding and baselineexperimental conditions from the first-level analyses and �Constant is themean intensity across the session. Values were then averaged across theextent of the cluster for each participant and entered into SPSS statisticssoftware for testing. For the ROI analyses, a Bonferroni-corrected statis-tical threshold was used, which was based on the number of clusters (i.e.,5: 0.05/5 � 0.01). SPSS software was also used to test differences inbehavioral data and background variables (one-way unrelated ANOVAswith Dunnett’s T3 method for multiple comparisons, independent sam-ple t tests and Pearson’s correlations).
Creation of sample-specific template. The template was created fromhigh-resolution T1 images of 292 healthy individuals (51% female) ages25– 81 years (mean, 60.5 � 13.1) selected from the imaging cohort (n �375 in total). Participants were omitted from the template if they did notmeet performance criteria on the scanner task (n � 63), did not performthe scanner task (n � 10), had reported health problems or visible brainpathologies (n � 2), or were structural outliers (n � 8). Structural out-liers were defined by the “Sample Homogeneity” function in the voxel-based morphometry (VBM) toolbox for SPM8. The T1 images of theselected participants were segmented (using the “New Segment” optionin SPM8), and the resulting gray and white matter partitions averaged toa mean template using the DARTEL toolbox (Ashburner, 2007). Subject-specific deformation parameters to the mean template were then com-puted and the inverse of these applied to each participant’s structuralimage. These warped images were again averaged to a new mean tem-plate and the procedure was iterated six times in total, resulting in afinal sample-representative template.
Multimodal imaging analyses. The coregistered structural T1-weightedimages were preprocessed with the VBM toolbox in SPM8. They weresegmented (with the “New Segment” option), normalized to the sample-specific template, and smoothed with an 8 mm FWHM Gaussian kernel.After modulation, in which individual volumetric information was rein-troduced after normalization by multiplying with the Jacobian determi-nants, the images were entered as covariates of no interest in anANCOVA model in the biological parametric mapping (BPM) toolbox(Casanova et al., 2007), with the fMRI data as the primary modality. Aseparate preprocessing was performed on the functional data (followingthe above-described procedures), specifying the voxel size to match theresolution of the structural data. BPM employs the same general linearmodel approach as SPM, but allows each voxel to have a different designmatrix based on each participant’s gray matter voxel values. The resultsfrom such an analysis can be interpreted as reflecting group differences inbrain activation that cannot be accounted for by differences in local graymatter volume. The results were thresholded at p � 0.001 (uncorrected).
DTI data. The DTI-weighted data were preprocessed and subjected toa tract-based analysis using the University of Oxford’s Center for Func-tional Magnetic Resonance Imaging of the Brain (FMRIB) software li-brary (Wakana et al., 2003) package (http://www.fmrib.ox.ac.uk/fsl),specifically tract-based spatial statistics (Smith et al., 2006). Exact proce-dures were described previously (Salami et al., 2012a). In brief, meanfractional anisotropy (FA) values for 12 white matter tracts were ex-
8670 • J. Neurosci., May 15, 2013 • 33(20):8668 – 8677 Pudas et al. • Brain Characteristics of Successful Aging

tracted for each participant by averaging across the length of the tract andacross hemispheres. Tracts were defined according to JHU ICBM-DTI-81 white matter labels, which are included in the FMRIB softwarelibrary atlas tools (Wakana et al., 2003), and the following were includedin the analyses: genu, body, and splenium of the corpus callosum, cingu-lum, corona radiata, corticospinal tract, external and internal capsule,superior/inferior fronto-occipital fasciculus, superior longitudinal fas-ciculus, sagittal striatum, and the uncinate fasciculus. Group differencesbetween the successful and average older participants were tested in SPSSstatistics software using a multivariate ANOVA. Due to poor image qual-ity, two participants were excluded from DTI analyses (one successfuland one average participant).
ResultsClassification outcomeThe application of the statistical classification method on thelongitudinal Betula Samples 1 and 3 (n � 1561) resulted in 22%successful agers, 67% average individuals and 11% decliners,which approximates the percentages reported in our previousstudy (Josefsson et al., 2012). In the subset of individuals thatcomprised our imaging sample (n � 292 from Samples 1 and 3),the proportion of successful agers was 25%; 7% were classed asdecliners and the remaining 68% had average cognitive develop-ment. The slight differences might reflect the fact that the imag-ing sample was more selected, although it is important toremember that the imaging participants were defined in rela-tion to the full population-based samples.
After the exclusion procedures and selection of age-matchedcontrols (described in Materials and Methods), the resultinggroups consisted of 51 successful agers (mean age, 68.8 � 7.1years) and 51 average-classed elderly. The cognitive developmentacross 20 years for each age cohort within the successful andaverage groups can be seen in Figure 1. Note that, consistent withprevious longitudinal reports (Schaie, 1994; Ronnlund et al.,2005), the expected age-related memory decline in the averagegroup only becomes evident after the age of 60 – 65 years.
Group-level cognitive variables are shown in Table 1, whichadditionally displays demographics and scores for the young ref-erence group. Overall, the two older groups differed significantlyon both initial memory performance and slope of memorychange over time (Table 1). Note that the difference in slope wasobserved despite the wide within-group age range and the inclu-sion of individuals younger than 65 years, who are not expectedto have experienced age-related cognitive decline. In these
younger age groups, successful individuals mainly differed fromaverage individuals by having a more positive rate of change (Fig.1). The positive slopes are likely driven by retest effects that aretypical for longitudinal datasets (Ronnlund et al., 2005). There-fore, the values of the slopes reported here should not be inter-preted literally. Nevertheless, the slope for the average group,�0.084, was very close to the mean attrition-corrected slope forall individuals in the full population-based sample: �0.078 (age-cohorts, 65–70 years, n � 361). This confirms the representative-ness of the individuals selected into the average control group.Overall, there was a significant improvement in cognitive scoresacross time for the successful group (t(50) � 4.94, p � 0.001,paired samples t test), whereas the average group displayed asignificant decrease (t(50) � 2.41, p � 0.05). In addition, note thatthe lack of group differences between successful and average in-dividuals on a global cognitive screening measure, the Mini-Mental State Examination (Folstein et al., 1975), indicates thatthe average group by no means was cognitively impaired despitethe decline in episodic memory performance.
Scanner task performanceAs can be seen in Table 1, task accuracy of successful agers wasslightly higher than that of average agers, although the differencewas not significant. There was no difference in reaction times(RTs). Young participants performed better than both oldergroups both in terms of accuracy and RTs (all statistics are re-ported in Table 1).
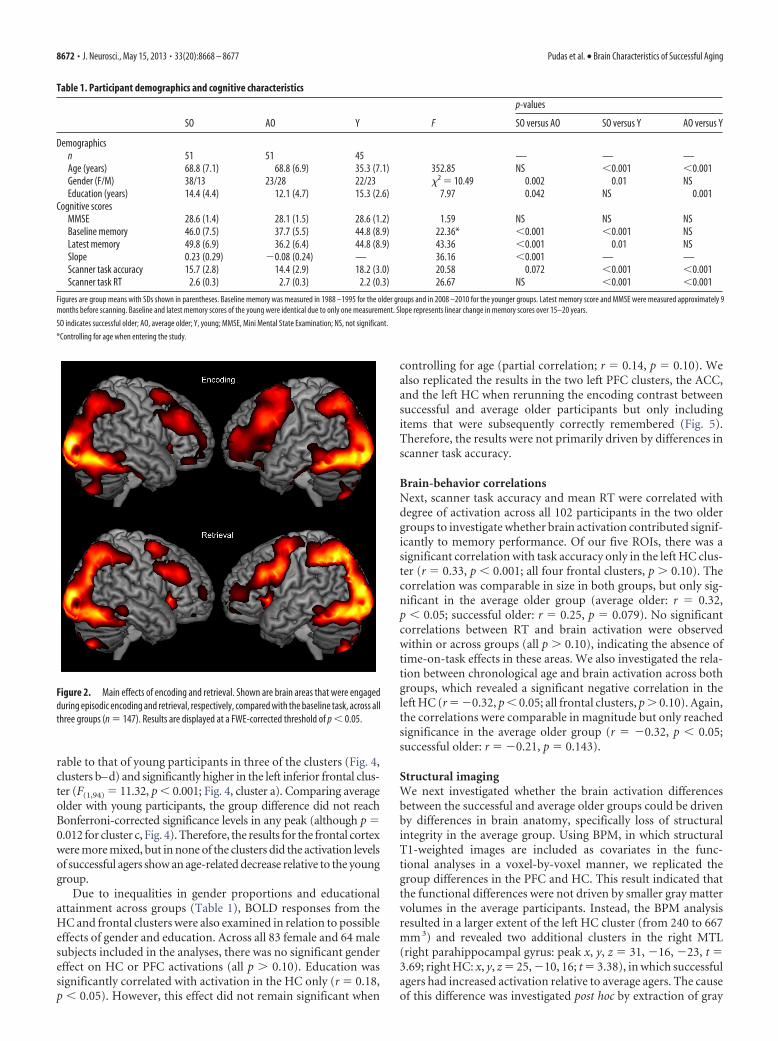
Functional imagingAcross all 147 participants, similar to what was found previouslyfor other subsamples (Kauppi et al., 2011; Salami et al., 2012b),the face–name task engaged a widespread network of brain areastypical for episodic memory tasks, including the occipital, pari-etal, frontal, and temporal areas and the cerebellum (forencoding- and retrieval-related activations, see Fig. 2). In addi-tion, there was robust activation of bilateral HC in all threegroups (for encoding-related HC activation, see Fig. 3A). Con-trasting the successful and the average older participants for epi-sodic encoding relative to baseline showed that successful agershad stronger activation in several regions (Table 2), notably in theleft PFC and the left HC. No regions showed significantly higheractivation in average participants compared with successful ag-ers. For the retrieval-baseline contrast, no areas were found inwhich successful agers displayed increased activation relative toaverage controls. The reverse retrieval contrast (average �successful) produced one significant cluster (280 mm 3) in theventral/medial PFC (BA 11; peak x, y, z � 8, 32, �30; t � 4.15,p � 0.001). This effect was driven by higher baseline-relatedactivation in the successful relative to the average older groupand will not be discussed further. No differences in eitherdirection were seen in the MTL during retrieval.
To facilitate interpretation of the observed differences be-tween the successful and average agers, their encoding-relatedactivation (median parameter estimates) across the left HC andPFC clusters was extracted and compared with the activation of ayoung reference group. First, in the left HC, young participantshad a comparable degree of activation to that of successful oldersubjects, but they differed from average older subjects (F(1,94) �8.08, p � 0.005; Fig. 3B). This indicates that successful agers hadpreserved HC activation in this cluster relative to young partici-pants, whereas the average older individuals failed to reach theactivation levels of the young group. Second, across the four PFCclusters (Fig. 4), the response of the successful agers was compa-
Figure 1. Longitudinal memory change. Average memory slopes for each age cohort in thesuccessful and average older groups. n � 6 –16 for age cohorts 55–75 years of age at lastmeasurement; the 80-year-old cohorts contained one average and three successful older par-ticipants. Episodic memory scores represent a composite of five episodic memory tasks (maxi-mum � 76).
Pudas et al. • Brain Characteristics of Successful Aging J. Neurosci., May 15, 2013 • 33(20):8668 – 8677 • 8671
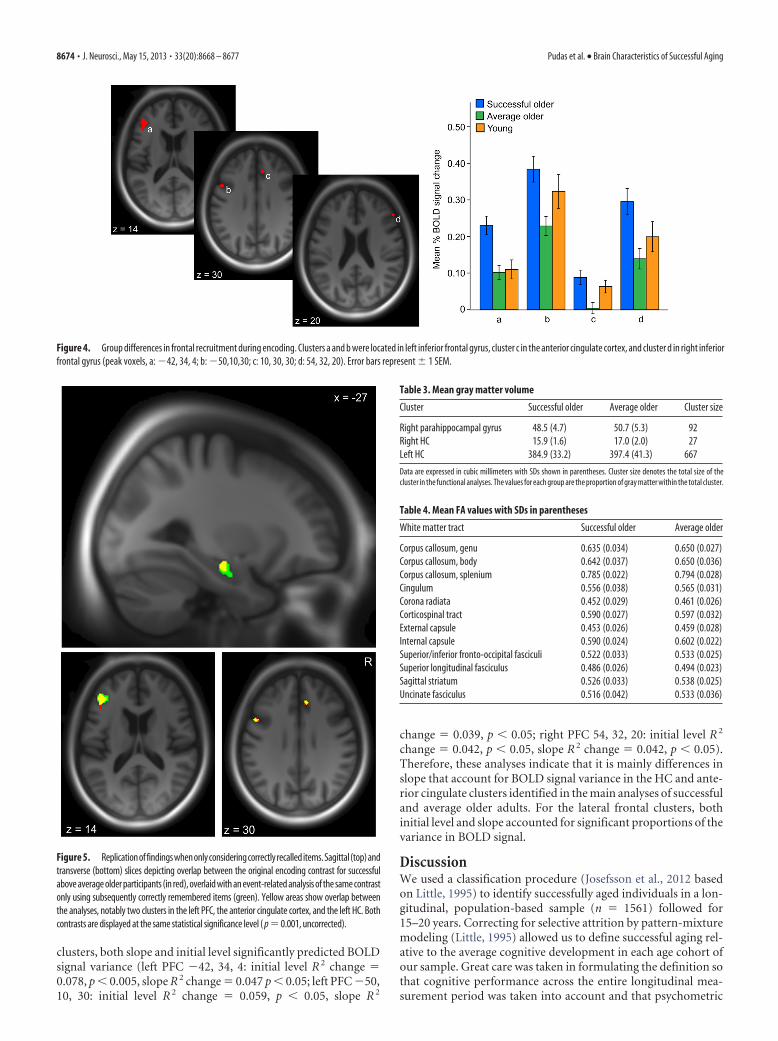
rable to that of young participants in three of the clusters (Fig. 4,clusters b–d) and significantly higher in the left inferior frontal clus-ter (F(1,94) � 11.32, p � 0.001; Fig. 4, cluster a). Comparing averageolder with young participants, the group difference did not reachBonferroni-corrected significance levels in any peak (although p �0.012 for cluster c, Fig. 4). Therefore, the results for the frontal cortexwere more mixed, but in none of the clusters did the activation levelsof successful agers show an age-related decrease relative to the younggroup.
Due to inequalities in gender proportions and educationalattainment across groups (Table 1), BOLD responses from theHC and frontal clusters were also examined in relation to possibleeffects of gender and education. Across all 83 female and 64 malesubjects included in the analyses, there was no significant gendereffect on HC or PFC activations (all p � 0.10). Education wassignificantly correlated with activation in the HC only (r � 0.18,p � 0.05). However, this effect did not remain significant when
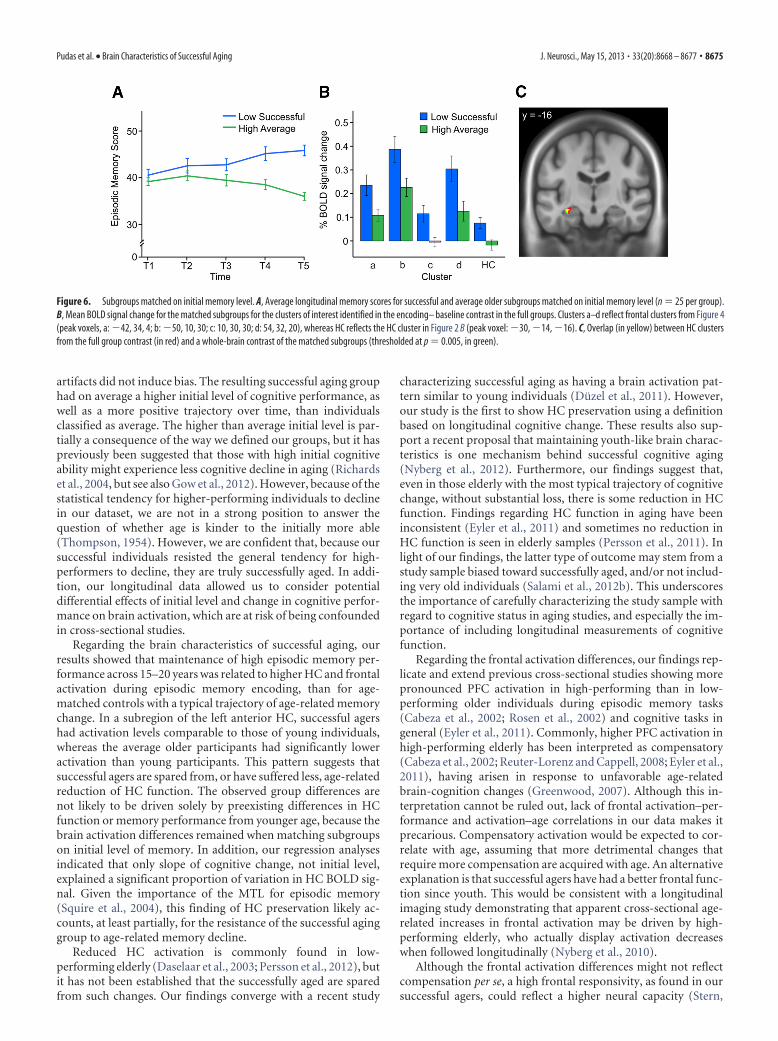
controlling for age (partial correlation; r � 0.14, p � 0.10). Wealso replicated the results in the two left PFC clusters, the ACC,and the left HC when rerunning the encoding contrast betweensuccessful and average older participants but only includingitems that were subsequently correctly remembered (Fig. 5).Therefore, the results were not primarily driven by differences inscanner task accuracy.
Brain-behavior correlationsNext, scanner task accuracy and mean RT were correlated withdegree of activation across all 102 participants in the two oldergroups to investigate whether brain activation contributed signif-icantly to memory performance. Of our five ROIs, there was asignificant correlation with task accuracy only in the left HC clus-ter (r � 0.33, p � 0.001; all four frontal clusters, p � 0.10). Thecorrelation was comparable in size in both groups, but only sig-nificant in the average older group (average older: r � 0.32,p � 0.05; successful older: r � 0.25, p � 0.079). No significantcorrelations between RT and brain activation were observedwithin or across groups (all p � 0.10), indicating the absence oftime-on-task effects in these areas. We also investigated the rela-tion between chronological age and brain activation across bothgroups, which revealed a significant negative correlation in theleft HC (r � �0.32, p � 0.05; all frontal clusters, p � 0.10). Again,the correlations were comparable in magnitude but only reachedsignificance in the average older group (r � �0.32, p � 0.05;successful older: r � �0.21, p � 0.143).
Structural imagingWe next investigated whether the brain activation differencesbetween the successful and average older groups could be drivenby differences in brain anatomy, specifically loss of structuralintegrity in the average group. Using BPM, in which structuralT1-weighted images are included as covariates in the func-tional analyses in a voxel-by-voxel manner, we replicated thegroup differences in the PFC and HC. This result indicated thatthe functional differences were not driven by smaller gray mattervolumes in the average participants. Instead, the BPM analysisresulted in a larger extent of the left HC cluster (from 240 to 667mm 3) and revealed two additional clusters in the right MTL(right parahippocampal gyrus: peak x, y, z � 31, �16, �23, t �3.69; right HC: x, y, z � 25, �10, 16; t � 3.38), in which successfulagers had increased activation relative to average agers. The causeof this difference was investigated post hoc by extraction of gray
Table 1. Participant demographics and cognitive characteristics
SO AO Y F
p-values
SO versus AO SO versus Y AO versus Y
Demographicsn 51 51 45 — — —Age (years) 68.8 (7.1) 68.8 (6.9) 35.3 (7.1) 352.85 NS �0.001 �0.001Gender (F/M) 38/13 23/28 22/23 �2 � 10.49 0.002 0.01 NSEducation (years) 14.4 (4.4) 12.1 (4.7) 15.3 (2.6) 7.97 0.042 NS 0.001
Cognitive scoresMMSE 28.6 (1.4) 28.1 (1.5) 28.6 (1.2) 1.59 NS NS NSBaseline memory 46.0 (7.5) 37.7 (5.5) 44.8 (8.9) 22.36* �0.001 �0.001 NSLatest memory 49.8 (6.9) 36.2 (6.4) 44.8 (8.9) 43.36 �0.001 0.01 NSSlope 0.23 (0.29) �0.08 (0.24) — 36.16 �0.001 — —Scanner task accuracy 15.7 (2.8) 14.4 (2.9) 18.2 (3.0) 20.58 0.072 �0.001 �0.001Scanner task RT 2.6 (0.3) 2.7 (0.3) 2.2 (0.3) 26.67 NS �0.001 �0.001
Figures are group means with SDs shown in parentheses. Baseline memory was measured in 1988 –1995 for the older groups and in 2008 –2010 for the younger groups. Latest memory score and MMSE were measured approximately 9months before scanning. Baseline and latest memory scores of the young were identical due to only one measurement. Slope represents linear change in memory scores over 15–20 years.
SO indicates successful older; AO, average older; Y, young; MMSE, Mini Mental State Examination; NS, not significant.
*Controlling for age when entering the study.
Figure 2. Main effects of encoding and retrieval. Shown are brain areas that were engagedduring episodic encoding and retrieval, respectively, compared with the baseline task, across allthree groups (n � 147). Results are displayed at a FWE-corrected threshold of p � 0.05.
8672 • J. Neurosci., May 15, 2013 • 33(20):8668 – 8677 Pudas et al. • Brain Characteristics of Successful Aging

matter volume values from the segmented and normalized struc-tural images using the MTL clusters from the BPM analyses asmasks. Successful agers were found to have smaller gray mattervolumes in these areas than average participants (Table 3), but forthe clusters in left HC and right parahippocampal gyrus, the dif-ference did not remain significant after adding gender into thestatistical model (p � 0.281 and 0.168, respectively). For the rightHC cluster in the BPM analyses, the group difference in volumeremained after controlling for gender (F(1,98) � 4.46, p � 0.05).We also investigated group differences in white matter integritymeasured with DTI across 12 white matter tracts specified in theMaterials and Methods section. There were no significant differ-ences in average FA values between the two older groups, as as-sessed with a multivariate ANOVA (including gender as a factor),Pillai’s trace (F(12,85) � 1.41, p � 0.176). Group-level FA valuesare given in Table 4.
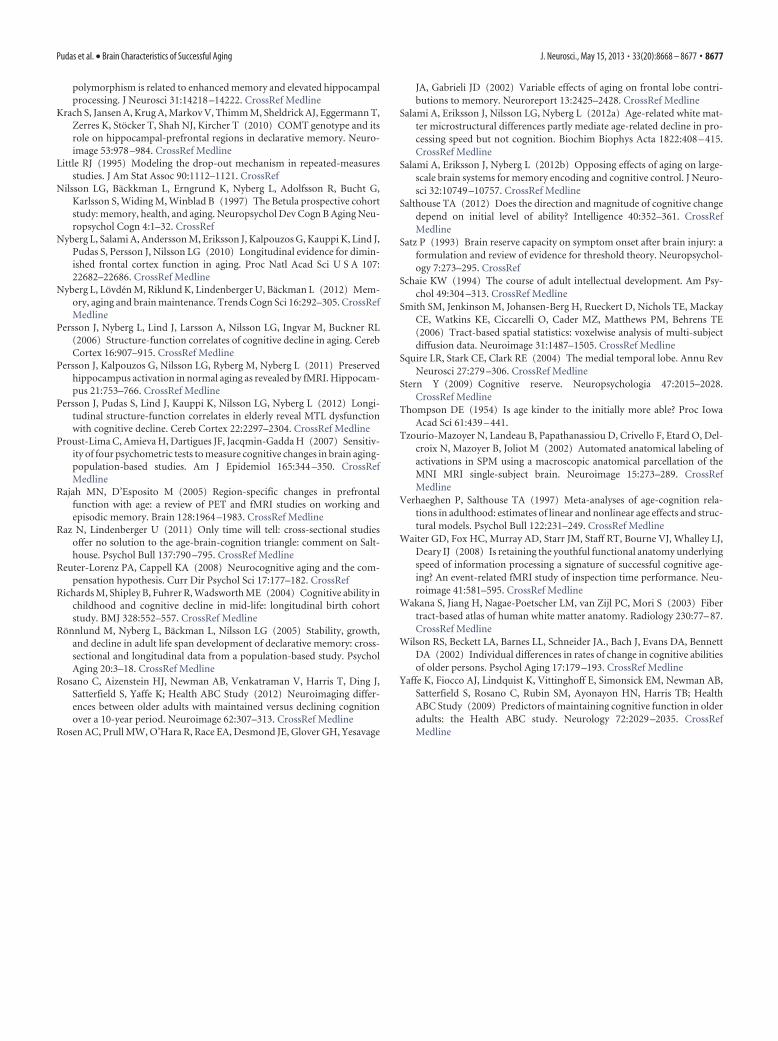
Separating the contributions of level and slopeBecause our successful and average aging groups differed both oninitial level and change in cognitive scores, it could be argued thatthe observed group differences in BOLD signal could have beendriven mainly by the difference in initial level. We therefore per-formed two sets of additional analyses to clarify the contributionof initial level and slope to the observed group differences in brainactivation. First, we selected subgroups of successful and averageelderly participants matched on initial level. The age range ofthese subgroups was restricted to 65 years and older, because thisis the age range during which memory decline can be expected.The resulting groups comprised 25 individuals each, with thesuccessful agers being slightly, but not significantly, older (72.7 vs
70.5 years; t(48) � 1.68; p � 0.1). The groups did not differ ininitial memory level (successful older: 40.0, SD � 5.0; averageolder: 39.6, SD � 2.6; t(48) � 0.28, p � 0.78). They did, however,differ on slope of memory change (successful older: 0.33, SD �0.30; average older: �0.21, SD � 0.20), t(48) � 7.5, p � 0.001).Longitudinal cognitive scores can be seen in Figure 6A. Figure 6Bdisplays group differences in encoding-related BOLD signal inthe clusters of interest from the original analysis. As can be seenfrom the figure, the subgroups differed significantly in all clusters(with t ranging from 2.4 to 2.9, all p � 0.05). On a whole-brainlevel, at p � 0.005 (uncorrected), there was also a significant HCcluster overlapping with the cluster from the original analysis(Fig. 6C). In addition, the remaining successful older participantswho were initially high performing (n � 13, 65 years or older) didnot differ from the initially lower-performing successful individ-uals in any cluster (all p � 0.4). However, the high-performingsuccessful group did differ from the average individuals with highinitial levels in three of the clusters (HC, anterior cingulate, andright PFC, p � 0.05), which approached significance in the largerleft PFC cluster (�42, 34, 4; p � 0.083).
Second, we performed a set of hierarchical regression analyseson the individual BOLD values to investigate whether both theslope and initial level of cognitive performance contributed tobrain activation in each of the clusters observed in our mainanalysis. All participants across the successful and average oldergroups were included in these analyses (n � 102). Because chro-nological age was correlated with initial level of cognitive perfor-mance (r � �0.52, p � 0.001), we controlled for age in theseregressions by entering it before initial level and slope. Among the102 participants included in our imaging analyses, there was nocorrelation between slope and initial level (r � 0.0, p � 0.997), incontrast to our full sample of 1561 individuals. In the regressionanalyses, we entered initial level before slope to investigatewhether slope explained a significant proportion of the varianceafter accounting for initial level. The results indicated that for theleft HC cluster, although age accounted for a significant propor-tion of the variance (R 2 � 0.06, p � 0.05), the initial level failed toreach significance when entered after age (R 2 change � 0.024,p � 0.108). Slope, however, did explain a significant proportionof the remaining variance in HC BOLD signal (R 2 change �0.048, p � 0.05). The same pattern of results emerged for theanterior cingulate cluster (except for age not reaching signifi-cance, p � 0.087; initial level R 2 change � 0.024, p � 0.117; slopeR 2 change � 0.062, p � 0.05). For all of the three lateral PFC
Figure 3. Group differences in HC recruitment during encoding. Shown are the HC BOLD signal changes from the encoding– baseline contrast for the entire HC formation (A) and the left HC clusterfrom the group contrast between successful and average older participants (B). The HC activation in A was calculated within left and right HC masks generated with FreeSurfer software. B displaysa coronal slice at y � �18 and a sagittal slice at x � �27. Error bars represent � 1 SEM.
Table 2. Brain regions more recruited by the successful agers compared withaverage agers during episodic encoding
Side Region BA x y zVolume(mm 3) t
Right Cerebellum 30 �72 �36 376 3.89Left Inferior frontal gyrus 45 �42 34 4 1368 3.81Right Occipital 18/19 42 �88 8 81 3.80Left Inferior frontal gyrus 44 �50 10 30 648 3.78Right Cerebellum 2 �76 �34 224 3.76Left HC �30 �14 �16 240 3.58Right Anterior cingulate 32 10 30 30 120 3.57Right Supplementary motor area 6 4 14 68 80 3.56Right Inferior frontal gyrus 45 54 32 20 80 3.47
Coordinates are in MNI space.
Pudas et al. • Brain Characteristics of Successful Aging J. Neurosci., May 15, 2013 • 33(20):8668 – 8677 • 8673
clusters, both slope and initial level significantly predicted BOLDsignal variance (left PFC �42, 34, 4: initial level R 2 change �0.078, p � 0.005, slope R 2 change � 0.047 p � 0.05; left PFC �50,10, 30: initial level R 2 change � 0.059, p � 0.05, slope R 2
change � 0.039, p � 0.05; right PFC 54, 32, 20: initial level R 2
change � 0.042, p � 0.05, slope R 2 change � 0.042, p � 0.05).Therefore, these analyses indicate that it is mainly differences inslope that account for BOLD signal variance in the HC and ante-rior cingulate clusters identified in the main analyses of successfuland average older adults. For the lateral frontal clusters, bothinitial level and slope accounted for significant proportions of thevariance in BOLD signal.
DiscussionWe used a classification procedure (Josefsson et al., 2012 basedon Little, 1995) to identify successfully aged individuals in a lon-gitudinal, population-based sample (n � 1561) followed for15–20 years. Correcting for selective attrition by pattern-mixturemodeling (Little, 1995) allowed us to define successful aging rel-ative to the average cognitive development in each age cohort ofour sample. Great care was taken in formulating the definition sothat cognitive performance across the entire longitudinal mea-surement period was taken into account and that psychometric
Figure 4. Group differences in frontal recruitment during encoding. Clusters a and b were located in left inferior frontal gyrus, cluster c in the anterior cingulate cortex, and cluster d in right inferiorfrontal gyrus (peak voxels, a: �42, 34, 4; b: �50,10,30; c: 10, 30, 30; d: 54, 32, 20). Error bars represent � 1 SEM.
Figure 5. Replicationoffindingswhenonlyconsideringcorrectlyrecalleditems.Sagittal(top)andtransverse (bottom) slices depicting overlap between the original encoding contrast for successfulabove average older participants (in red), overlaid with an event-related analysis of the same contrastonly using subsequently correctly remembered items (green). Yellow areas show overlap betweenthe analyses, notably two clusters in the left PFC, the anterior cingulate cortex, and the left HC. Bothcontrasts are displayed at the same statistical significance level ( p � 0.001, uncorrected).
Table 3. Mean gray matter volume
Cluster Successful older Average older Cluster size
Right parahippocampal gyrus 48.5 (4.7) 50.7 (5.3) 92Right HC 15.9 (1.6) 17.0 (2.0) 27Left HC 384.9 (33.2) 397.4 (41.3) 667
Data are expressed in cubic millimeters with SDs shown in parentheses. Cluster size denotes the total size of thecluster in the functional analyses. The values for each group are the proportion of gray matter within the total cluster.
Table 4. Mean FA values with SDs in parentheses
White matter tract Successful older Average older
Corpus callosum, genu 0.635 (0.034) 0.650 (0.027)Corpus callosum, body 0.642 (0.037) 0.650 (0.036)Corpus callosum, splenium 0.785 (0.022) 0.794 (0.028)Cingulum 0.556 (0.038) 0.565 (0.031)Corona radiata 0.452 (0.029) 0.461 (0.026)Corticospinal tract 0.590 (0.027) 0.597 (0.032)External capsule 0.453 (0.026) 0.459 (0.028)Internal capsule 0.590 (0.024) 0.602 (0.022)Superior/inferior fronto-occipital fasciculi 0.522 (0.033) 0.533 (0.025)Superior longitudinal fasciculus 0.486 (0.026) 0.494 (0.023)Sagittal striatum 0.526 (0.033) 0.538 (0.025)Uncinate fasciculus 0.516 (0.042) 0.533 (0.036)
8674 • J. Neurosci., May 15, 2013 • 33(20):8668 – 8677 Pudas et al. • Brain Characteristics of Successful Aging
artifacts did not induce bias. The resulting successful aging grouphad on average a higher initial level of cognitive performance, aswell as a more positive trajectory over time, than individualsclassified as average. The higher than average initial level is par-tially a consequence of the way we defined our groups, but it haspreviously been suggested that those with high initial cognitiveability might experience less cognitive decline in aging (Richardset al., 2004, but see also Gow et al., 2012). However, because of thestatistical tendency for higher-performing individuals to declinein our dataset, we are not in a strong position to answer thequestion of whether age is kinder to the initially more able(Thompson, 1954). However, we are confident that, because oursuccessful individuals resisted the general tendency for high-performers to decline, they are truly successfully aged. In addi-tion, our longitudinal data allowed us to consider potentialdifferential effects of initial level and change in cognitive perfor-mance on brain activation, which are at risk of being confoundedin cross-sectional studies.
Regarding the brain characteristics of successful aging, ourresults showed that maintenance of high episodic memory per-formance across 15–20 years was related to higher HC and frontalactivation during episodic memory encoding, than for age-matched controls with a typical trajectory of age-related memorychange. In a subregion of the left anterior HC, successful agershad activation levels comparable to those of young individuals,whereas the average older participants had significantly loweractivation than young participants. This pattern suggests thatsuccessful agers are spared from, or have suffered less, age-relatedreduction of HC function. The observed group differences arenot likely to be driven solely by preexisting differences in HCfunction or memory performance from younger age, because thebrain activation differences remained when matching subgroupson initial level of memory. In addition, our regression analysesindicated that only slope of cognitive change, not initial level,explained a significant proportion of variation in HC BOLD sig-nal. Given the importance of the MTL for episodic memory(Squire et al., 2004), this finding of HC preservation likely ac-counts, at least partially, for the resistance of the successful aginggroup to age-related memory decline.
Reduced HC activation is commonly found in low-performing elderly (Daselaar et al., 2003; Persson et al., 2012), butit has not been established that the successfully aged are sparedfrom such changes. Our findings converge with a recent study
characterizing successful aging as having a brain activation pat-tern similar to young individuals (Duzel et al., 2011). However,our study is the first to show HC preservation using a definitionbased on longitudinal cognitive change. These results also sup-port a recent proposal that maintaining youth-like brain charac-teristics is one mechanism behind successful cognitive aging(Nyberg et al., 2012). Furthermore, our findings suggest that,even in those elderly with the most typical trajectory of cognitivechange, without substantial loss, there is some reduction in HCfunction. Findings regarding HC function in aging have beeninconsistent (Eyler et al., 2011) and sometimes no reduction inHC function is seen in elderly samples (Persson et al., 2011). Inlight of our findings, the latter type of outcome may stem from astudy sample biased toward successfully aged, and/or not includ-ing very old individuals (Salami et al., 2012b). This underscoresthe importance of carefully characterizing the study sample withregard to cognitive status in aging studies, and especially the im-portance of including longitudinal measurements of cognitivefunction.
Regarding the frontal activation differences, our findings rep-licate and extend previous cross-sectional studies showing morepronounced PFC activation in high-performing than in low-performing older individuals during episodic memory tasks(Cabeza et al., 2002; Rosen et al., 2002) and cognitive tasks ingeneral (Eyler et al., 2011). Commonly, higher PFC activation inhigh-performing elderly has been interpreted as compensatory(Cabeza et al., 2002; Reuter-Lorenz and Cappell, 2008; Eyler et al.,2011), having arisen in response to unfavorable age-relatedbrain-cognition changes (Greenwood, 2007). Although this in-terpretation cannot be ruled out, lack of frontal activation–per-formance and activation–age correlations in our data makes itprecarious. Compensatory activation would be expected to cor-relate with age, assuming that more detrimental changes thatrequire more compensation are acquired with age. An alternativeexplanation is that successful agers have had a better frontal func-tion since youth. This would be consistent with a longitudinalimaging study demonstrating that apparent cross-sectional age-related increases in frontal activation may be driven by high-performing elderly, who actually display activation decreaseswhen followed longitudinally (Nyberg et al., 2010).
Although the frontal activation differences might not reflectcompensation per se, a high frontal responsivity, as found in oursuccessful agers, could reflect a higher neural capacity (Stern,
Figure 6. Subgroups matched on initial memory level. A, Average longitudinal memory scores for successful and average older subgroups matched on initial memory level (n � 25 per group).B, Mean BOLD signal change for the matched subgroups for the clusters of interest identified in the encoding– baseline contrast in the full groups. Clusters a–d reflect frontal clusters from Figure 4(peak voxels, a: �42, 34, 4; b: �50, 10, 30; c: 10, 30, 30; d: 54, 32, 20), whereas HC reflects the HC cluster in Figure 2 B (peak voxel: �30, �14, �16). C, Overlap (in yellow) between HC clustersfrom the full group contrast (in red) and a whole-brain contrast of the matched subgroups (thresholded at p � 0.005, in green).
Pudas et al. • Brain Characteristics of Successful Aging J. Neurosci., May 15, 2013 • 33(20):8668 – 8677 • 8675

2009), and might contribute to the preservation of cognitive abil-ities during the course of aging. In general, neural capacity de-notes a capability to recruit more neural resources to cope with achallenging task, and is hypothesized to be a manifestation ofcognitive reserve (Stern, 2009). Interestingly, cognitive reserve iscommonly associated with high educational attainment (Stern,2009), as was also found in our successful agers (Table 1). Ourprevious study identified a number of additional significant pre-dictors of being classified as a successful ager in relation to our fullpopulation-based sample (Josefsson et al., 2012). These includedfemale gender, living together with someone, being physicallyactive, and being a carrier of the met-allele of the COMT gene.These factors are known to be associated with beneficial effects oncognitive and brain function (Fratiglioni et al., 2004; de Frias etal., 2004; Hillman et al., 2008; Andreano and Cahill, 2009; Krachet al., 2010), which further validates our definition of successfulaging. Our results thus suggest that many factors, some of whichare amendable, may contribute to successful cognitive aging andthat these manifest neurally as high HC and prefrontal function.
Previous successful aging studies have compared successfulindividuals with those with decline on global cognitive screeningtests (Yaffe et al., 2009; Rosano et al., 2012), but our study con-trasted successfully aged with the most average performers onmore sensitive measures of episodic memory ability. Despite thistight comparison, our findings were robust and could not beexplained by differences in structural brain integrity, gender, ed-ucation, or differences in scanner task performance. Further, ourresults were not solely driven by differences in initial level ofmemory performance, as demonstrated by first replicating thegroup differences in frontal and HC BOLD response in sub-groups matched on initial memory level. Second, regression anal-yses on the individual BOLD values converged to show thatcognitive change also contributed significantly to the observedgroup differences. Third, splitting the successful group by initiallevel of performance revealed a similar response profile in ini-tially higher- and lower-performing successful individuals rela-tive to an initially high-performing average subgroup. Theseobservations demonstrate that both a high initial level and a morepositive than average slope of cognitive change contribute to thesuccessful aging brain phenotype found here. Our definition ofsuccessful aging did not include maintenance of low levels ofperformance, however. It thus remains to be elucidated whetherour results also generalize to individuals with such a pattern.Furthermore, in binary classification procedures like the currentone, misclassification of individuals is possible. However, thelarge sample size should have minimized the influence of suchvalidity threats on the overall results. Future studies with longi-tudinal imaging data will be needed to shed light on the causalmechanisms behind the differential brain activation pattern ob-served here.
In conclusion, the present results are noteworthy for severalreasons. First, they highlight the importance of preserved HC andhigh frontal function for the maintenance of good memory func-tion in aging. By including longitudinal measures of cognitivechange in our definition of successful cognitive aging, these re-sults substantiate and extend previous findings (Cabeza et al.,2002; Duzel et al., 2011; Eyler et al., 2011). Further, the currentresults complement our previous longitudinal imaging findingsthat implicate HC dysfunction in cognitive decline (Persson et al.,2012). This strongly suggests that HC function is a key source ofheterogeneity in cognitive aging trajectories. The findings alsohelp to delineate the boundaries of what constitutes typical cog-nitive aging, and therefore have general significance for the cog-
nitive neuroscience of aging. Finally, the study of successful agingin itself is an important complement to the abundant literatureon age-related cognitive decline. Identifying predictors and neu-ral correlates of successful cognitive aging might take us one stepcloser toward tackling the increased societal burden of an agingpopulation.
ReferencesAndreano JM, Cahill L (2009) Sex influences on the neurobiology of learn-
ing and memory. Learn Mem 16:248 –266. CrossRef MedlineAshburner J (2007) A fast diffeomorphic image registration algorithm.
Neuroimage 38:95–113. CrossRef MedlineBarnes DE, Cauley JA, Lui LY, Fink HA, McCulloch C, Stone KL, Yaffe K
(2007) Women who maintain optimal cognitive function into old age.J Am Geriatr Soc 55:259 –264. CrossRef Medline
Buckner RL (2004) Memory and executive function in aging and AD: mul-tiple factors that cause decline and reserve factors that compensate. Neu-ron 44:195–208. CrossRef Medline
Cabeza R, Anderson ND, Locantore JK, McIntosh AR (2002) Aging grace-fully: compensatory brain activity in high-performing older adults. Neu-roimage 17:1394 –1402. CrossRef Medline
Casanova R, Srikanth R, Baer A, Laurienti PJ, Burdette JH, Hayasaka S, Flow-ers L, Wood F, Maldjian JA (2007) Biological parametric mapping: Astatistical toolbox for multimodality brain image analysis. Neuroimage34:137–143. CrossRef Medline
Christensen H, Mackinnon AJ, Korten AE, Jorm AF, Henderson AS, JacombP, Rodgers B (1999) An analysis of diversity in the cognitive perfor-mance of elderly community dwellers: individual differences in changescores as a function of age. Psychol Aging 14:365–379. CrossRef Medline
Daselaar SM, Veltman DJ, Rombouts ARB, Raaijmakers JG, Jonker C (2003)Neuroanatomical correlates of episodic encoding and retrieval in youngand elderly subjects. Brain 126:43–56. CrossRef Medline
de Frias CM, Annerbrink K, Westberg L, Eriksson E, Adolfsson R, Nilsson LG(2004) COMT Gene Polymorphism Is Associated with DeclarativeMemory in Adulthood and Old Age. Behav Genet 34:533–539. CrossRefMedline
Duzel E, Schutze H, Yonelinas AP, Heinze HJ (2011) Functional phenotyp-ing of successful aging in long-term memory: preserved performance inthe absence of neural compensation. Hippocampus 21:803– 814.CrossRef Medline
Eyler LT, Sherzai A, Kaup AR, Jeste DV (2011) A review of functional brainimaging correlates of successful cognitive aging. Biol psychiatry 70:115–122. CrossRef Medline
Fiocco AJ, Yaffe K (2010) Defining successful aging: the importance of in-cluding cognitive function over time. Arch Neurol 67:876 – 880. CrossRefMedline
Folstein MF, Folstein SE, McHugh PR (1975) “Mini-mental state”: A prac-tical method for grading the cognitive state of patients for the clinician.J Psychiatr Res 12:189 –198. CrossRef Medline
Fratiglioni L, Paillard-Borg S, Winblad B (2004) An active and socially inte-grated lifestyle in late life might protect against dementia. Lancet Neurol3:343–353. CrossRef Medline
Golomb J, Kluger A, de Leon MJ, Ferris SH, Convit A, Mittelman MS, CohenJ, Rusinek H, De Santi S, George AE (1994) Hippocampal formation sizein normal human aging: a correlate of delayed secondary memory perfor-mance. Learn Mem 1:45–54. CrossRef Medline
Gow AJ, Johnson W, Mishra G, Richards M, Kuh D, Deary IJ; HALCyonStudy Team (2012) Is age kinder to the initially more able?: Yes, and no.Intelligence 40:49 –59. CrossRef
Greenwood PM (2007) Functional plasticity in cognitive aging: review andhypothesis. Neuropsychology 21:657– 673. CrossRef Medline
Habib R, Nyberg L, Nilsson LG (2007) Cognitive and non-cognitive factorscontributing to the longitudinal identification of successful older adults inthe Betula study. Neuropsychol Dev Cogn B Aging Neuropsychol Cogn14:257–273. CrossRef Medline
Hillman CH, Erickson KI, Kramer AF (2008) Be smart, exercise your heart:exercise effects on brain and cognition. Nat Rev Neurosci 9:58 – 65.CrossRef Medline
Josefsson M, de Luna X, Pudas S, Nilsson LG, Nyberg L (2012) Genetic andlifestyle predictors of 15-year longitudinal change in episodic memory.J Am Geriatr Soc 60:2308 –2312. CrossRef Medline
Kauppi K, Nilsson LG, Adolfsson R, Eriksson E, Nyberg L (2011) KIBRA
8676 • J. Neurosci., May 15, 2013 • 33(20):8668 – 8677 Pudas et al. • Brain Characteristics of Successful Aging
polymorphism is related to enhanced memory and elevated hippocampalprocessing. J Neurosci 31:14218 –14222. CrossRef Medline
Krach S, Jansen A, Krug A, Markov V, Thimm M, Sheldrick AJ, Eggermann T,Zerres K, Stocker T, Shah NJ, Kircher T (2010) COMT genotype and itsrole on hippocampal-prefrontal regions in declarative memory. Neuro-image 53:978 –984. CrossRef Medline
Little RJ (1995) Modeling the drop-out mechanism in repeated-measuresstudies. J Am Stat Assoc 90:1112–1121. CrossRef
Nilsson LG, Backkman L, Erngrund K, Nyberg L, Adolfsson R, Bucht G,Karlsson S, Widing M, Winblad B (1997) The Betula prospective cohortstudy: memory, health, and aging. Neuropsychol Dev Cogn B Aging Neu-ropsychol Cogn 4:1–32. CrossRef
Nyberg L, Salami A, Andersson M, Eriksson J, Kalpouzos G, Kauppi K, Lind J,Pudas S, Persson J, Nilsson LG (2010) Longitudinal evidence for dimin-ished frontal cortex function in aging. Proc Natl Acad Sci U S A 107:22682–22686. CrossRef Medline
Nyberg L, Lovden M, Riklund K, Lindenberger U, Backman L (2012) Mem-ory, aging and brain maintenance. Trends Cogn Sci 16:292–305. CrossRefMedline
Persson J, Nyberg L, Lind J, Larsson A, Nilsson LG, Ingvar M, Buckner RL(2006) Structure-function correlates of cognitive decline in aging. CerebCortex 16:907–915. CrossRef Medline
Persson J, Kalpouzos G, Nilsson LG, Ryberg M, Nyberg L (2011) Preservedhippocampus activation in normal aging as revealed by fMRI. Hippocam-pus 21:753–766. CrossRef Medline
Persson J, Pudas S, Lind J, Kauppi K, Nilsson LG, Nyberg L (2012) Longi-tudinal structure-function correlates in elderly reveal MTL dysfunctionwith cognitive decline. Cereb Cortex 22:2297–2304. CrossRef Medline
Proust-Lima C, Amieva H, Dartigues JF, Jacqmin-Gadda H (2007) Sensitiv-ity of four psychometric tests to measure cognitive changes in brain aging-population-based studies. Am J Epidemiol 165:344 –350. CrossRefMedline
Rajah MN, D’Esposito M (2005) Region-specific changes in prefrontalfunction with age: a review of PET and fMRI studies on working andepisodic memory. Brain 128:1964 –1983. CrossRef Medline
Raz N, Lindenberger U (2011) Only time will tell: cross-sectional studiesoffer no solution to the age-brain-cognition triangle: comment on Salt-house. Psychol Bull 137:790 –795. CrossRef Medline
Reuter-Lorenz PA, Cappell KA (2008) Neurocognitive aging and the com-pensation hypothesis. Curr Dir Psychol Sci 17:177–182. CrossRef
Richards M, Shipley B, Fuhrer R, Wadsworth ME (2004) Cognitive ability inchildhood and cognitive decline in mid-life: longitudinal birth cohortstudy. BMJ 328:552–557. CrossRef Medline
Ronnlund M, Nyberg L, Backman L, Nilsson LG (2005) Stability, growth,and decline in adult life span development of declarative memory: cross-sectional and longitudinal data from a population-based study. PsycholAging 20:3–18. CrossRef Medline
Rosano C, Aizenstein HJ, Newman AB, Venkatraman V, Harris T, Ding J,Satterfield S, Yaffe K; Health ABC Study (2012) Neuroimaging differ-ences between older adults with maintained versus declining cognitionover a 10-year period. Neuroimage 62:307–313. CrossRef Medline
Rosen AC, Prull MW, O’Hara R, Race EA, Desmond JE, Glover GH, Yesavage
JA, Gabrieli JD (2002) Variable effects of aging on frontal lobe contri-butions to memory. Neuroreport 13:2425–2428. CrossRef Medline
Salami A, Eriksson J, Nilsson LG, Nyberg L (2012a) Age-related white mat-ter microstructural differences partly mediate age-related decline in pro-cessing speed but not cognition. Biochim Biophys Acta 1822:408 – 415.CrossRef Medline
Salami A, Eriksson J, Nyberg L (2012b) Opposing effects of aging on large-scale brain systems for memory encoding and cognitive control. J Neuro-sci 32:10749 –10757. CrossRef Medline
Salthouse TA (2012) Does the direction and magnitude of cognitive changedepend on initial level of ability? Intelligence 40:352–361. CrossRefMedline
Satz P (1993) Brain reserve capacity on symptom onset after brain injury: aformulation and review of evidence for threshold theory. Neuropsychol-ogy 7:273–295. CrossRef
Schaie KW (1994) The course of adult intellectual development. Am Psy-chol 49:304 –313. CrossRef Medline
Smith SM, Jenkinson M, Johansen-Berg H, Rueckert D, Nichols TE, MackayCE, Watkins KE, Ciccarelli O, Cader MZ, Matthews PM, Behrens TE(2006) Tract-based spatial statistics: voxelwise analysis of multi-subjectdiffusion data. Neuroimage 31:1487–1505. CrossRef Medline
Squire LR, Stark CE, Clark RE (2004) The medial temporal lobe. Annu RevNeurosci 27:279 –306. CrossRef Medline
Stern Y (2009) Cognitive reserve. Neuropsychologia 47:2015–2028.CrossRef Medline
Thompson DE (1954) Is age kinder to the initially more able? Proc IowaAcad Sci 61:439 – 441.
Tzourio-Mazoyer N, Landeau B, Papathanassiou D, Crivello F, Etard O, Del-croix N, Mazoyer B, Joliot M (2002) Automated anatomical labeling ofactivations in SPM using a macroscopic anatomical parcellation of theMNI MRI single-subject brain. Neuroimage 15:273–289. CrossRefMedline
Verhaeghen P, Salthouse TA (1997) Meta-analyses of age-cognition rela-tions in adulthood: estimates of linear and nonlinear age effects and struc-tural models. Psychol Bull 122:231–249. CrossRef Medline
Waiter GD, Fox HC, Murray AD, Starr JM, Staff RT, Bourne VJ, Whalley LJ,Deary IJ (2008) Is retaining the youthful functional anatomy underlyingspeed of information processing a signature of successful cognitive age-ing? An event-related fMRI study of inspection time performance. Neu-roimage 41:581–595. CrossRef Medline
Wakana S, Jiang H, Nagae-Poetscher LM, van Zijl PC, Mori S (2003) Fibertract-based atlas of human white matter anatomy. Radiology 230:77– 87.CrossRef Medline
Wilson RS, Beckett LA, Barnes LL, Schneider JA., Bach J, Evans DA, BennettDA (2002) Individual differences in rates of change in cognitive abilitiesof older persons. Psychol Aging 17:179 –193. CrossRef Medline
Yaffe K, Fiocco AJ, Lindquist K, Vittinghoff E, Simonsick EM, Newman AB,Satterfield S, Rosano C, Rubin SM, Ayonayon HN, Harris TB; HealthABC Study (2009) Predictors of maintaining cognitive function in olderadults: the Health ABC study. Neurology 72:2029 –2035. CrossRefMedline
Pudas et al. • Brain Characteristics of Successful Aging J. Neurosci., May 15, 2013 • 33(20):8668 – 8677 • 8677