bradley international airport improvements: an economic
TRANSCRIPT

Bradley International Airport Improvements: An Economic Impact Analysis
February 15, 2001
Fred Carstensen, Director William F. Lott, Director of Research
Connecticut Center for Economic Analysis Department of Economics, U-1063
University of Connecticut Storrs, CT 06269 (860) 486-3885

Page i
Executive Summary
The Connecticut Department of Transportation (DOT) has committed to major improvements at Bradley International Airport. These improvements include and are not limited to construction of a new terminal and renovation of the existing terminals and a new parking garage. In addition, several million dollars have been allocated each year between 2000 and 2030 for maintenance and updating of the existing capital structure. Improvements at Bradley International have prompted at least one company, Bombardier to expand its operations at the airport. The Connecticut Department of Economic and Community Development and the Connecticut Department of Transportation have requested the Connecticut Center for Economic Analysis (CCEA) to develop an analysis of the likely economic consequences of the proposed improvements at Bradley and the economic development they are encouraging. CCEA performed the analysis using the REMI model of the Connecticut economy, a model Regional Economic Models, Inc. of Amherst, Massachusetts, developed and that CCEA maintains at the University of Connecticut. The Connecticut Center for Economic Analysis considered two scenarios relative to the impact of these improvements on the Connecticut economy. We refer to these two scenarios as the conservative and optimistic scenarios. They reflect basic differences in the forecasted increased utilization of Bradley as a result of the expansion.
Both the conservative and optimistic scenarios show the Bradley improvements having a positive economic impact on Connecticut. Table 1 gives a summary of CCEA’s findings.
Scenario:
Variable AveragePresent Value Average
Present Value
Private Non-Farm Employment 4,690 - 9,352 -Gross State Product (Mil 99$) $225.76 $4,408.31 $428.66 $8,372.45Personal Income (Mil 99$) $252.35 $4,905.68 $495.97 $9,566.14Disposable Income (Mil 99$) $139.99 $2,668.33 $276.31 $5,233.64Population 5,500 - 10,994 -State Revenues at State Average Rates (Mil 99$) 27.91$ $542.85 $56.23 $1,084.84State Expenditures at State Average Rates (Mil 99$) 27.17$ $477.65 $54.38 $957.43Net New State Tax Revenue (Mil 99$) $0.74 $65.20 $1.84 $127.41
OptimisticTable 1: Economic Impact Bradley Airport Expansion
Conservative

Page ii
Table of Contents
Executive Summary ............................................................................................................. i Table of Contents................................................................................................................ ii Bradley International Airport Improvements: Economic Analysis .................................... 1
Basic Inputs .................................................................................................................. 1 Results .......................................................................................................................... 3 Summary ...................................................................................................................... 5
REMI OUTPUT.................................................................................................................. 6
Page 1
Bradley International Airport Improvements: Economic Analysis
The Connecticut Department of Transportation (DOT) has committed $235.6 million to major improvements at Bradley International Airport. These improvements include and are not limited to construction of a new terminal and renovation of the existing terminals and a new parking garage. These improvements are needed not only to permit expansion of present service levels but also to avoid some level of lose of the present utilization due to deterioration of the existing facilities. In addition, several million dollars have been allocated each year between 2000 and 2030 for maintenance and updating of the existing capital structure. Improvements at Bradley International have prompted at least one company, Bombardier to expand its operations at the airport. The Connecticut Department of Economic and Community Development and the Connecticut Department of Transportation have requested the Connecticut Center for Economic Analysis (CCEA) to develop an analysis of the likely economic consequences of the proposed improvements at Bradley and the economic development they are encouraging. CCEA performed the analysis using the REMI model of the Connecticut economy, a model Regional Economic Models, Inc. of Amherst, Massachusetts, developed and that CCEA maintains at the University of Connecticut. Basic Inputs The Connecticut Department of Transportation plans to spend $186.3 million on the terminal improvement program. In addition, another $10.2 million will be spend to build a new maintenance facility to replace the exist facility that has been demolished in order to build the new concourse. Along with the new concourse and improvements to the existing concourses, DOT has already started work on 3500 space parking garage for Bradley. This garage will cost $39.1 million to plan and construct. One private enterprise expansion at the airport that has already been announced is that of Bombardier. Bombardier will expend $16 million to expand its existing service facility and increase employment at the airport by 300 positions by 2004. At present, DOT has three forecasts of anticipated growth in the use of the airport over the next thirty years. A very conservative estimate has enplanements at the airport growing at an annual rate of 1.5%. This forecast is at or below the traditional growth rate used by the FAA for new enplanements at airports that haven’t planned any improvements. This simply reflect anticipated growth in population and income that cause a natural increase in air travel given that it is a normal good. We will use this forecast as the baseline in our analysis. As part of the Financial Feasibility Analysis for the planned expansion at Bradley International, a forecast of enplanements for the airport was prepared. This forecast looked at market growth and ability of the expanded Bradley to attract new passengers and provide the services they need. The difference between this new base case forecast based on an expanded Bradley and the conservative estimate that sees only growth due to

Page 2
population and income will be our conservative estimate of net new enplanements due to the Bradley expansion. The Financial Feasibility Analysis document also contains a second forecast for new enplanements. This forecast takes into account what is known as the “Southwest Effect.” History tells us that airport utilization grow much more rapidly when Southwest Airlines services the airport. The competition that Southwest introduces to a market drives down fares and causes a substantial growth in passengers. The difference between the “With Southwest” forecast and the conservative estimate will be out optimistic estimate of the number of new enplanements associated with the Bradley Airport expansion. In addition to the new concourse, the terminal improvements and the new garage, DOT plans to expend several million dollars each year for capital maintenance, updating and general improvements. This on going commitment to modernization of Bradley will have a continued impact on the Connecticut’s economy. Many of the new enplanements that will occur at Bradley will be visitors to our area. A recent survey by Wilbur Smith Associates found that 41.5% of the enplanements at Bradley our by visitors to our area. The destination of 71.5% of these visitors is Connecticut. The average visitor that passes through Bradley stays in our area 6.2 days and spends nearly $134 per day while here. This spending will affect a number of sectors in Connecticut. With the expansion of Bradley will come the need to have added people online to service these new passengers. Growth will occur not only with the airport’s own staff but will be coupled with growth in employment at the airlines and the firms that service Bradley. DOT provided us with direct estimates of their added costs to service an expanded Bradley. We have estimate the growth in other employment at the airport need for the added enplanements using a Leontiff production function. The opening of the new garage had Bradley will have an initial negative impact on private parking service in the Bradley area. It is estimated that these companies will see a 11% decline in their parking revenue when the garage is fully operational. However, as time passes and the utilization of Bradley grows the revenues of these private parking firms will return to their previous level and ultimately grow when the use of state parking facilities reach their capacity. Funding for the new garage and the expansion at Bradley will come from revenue bonds that will be paid for by parkers, passengers and the airlines. There is no commitment of general obligation state bonds or general appropriations to this project. We have converted the above information in dynamic inputs for the REMI model. Inputs and results were derived for the period 2000 to 2030.
Page 3
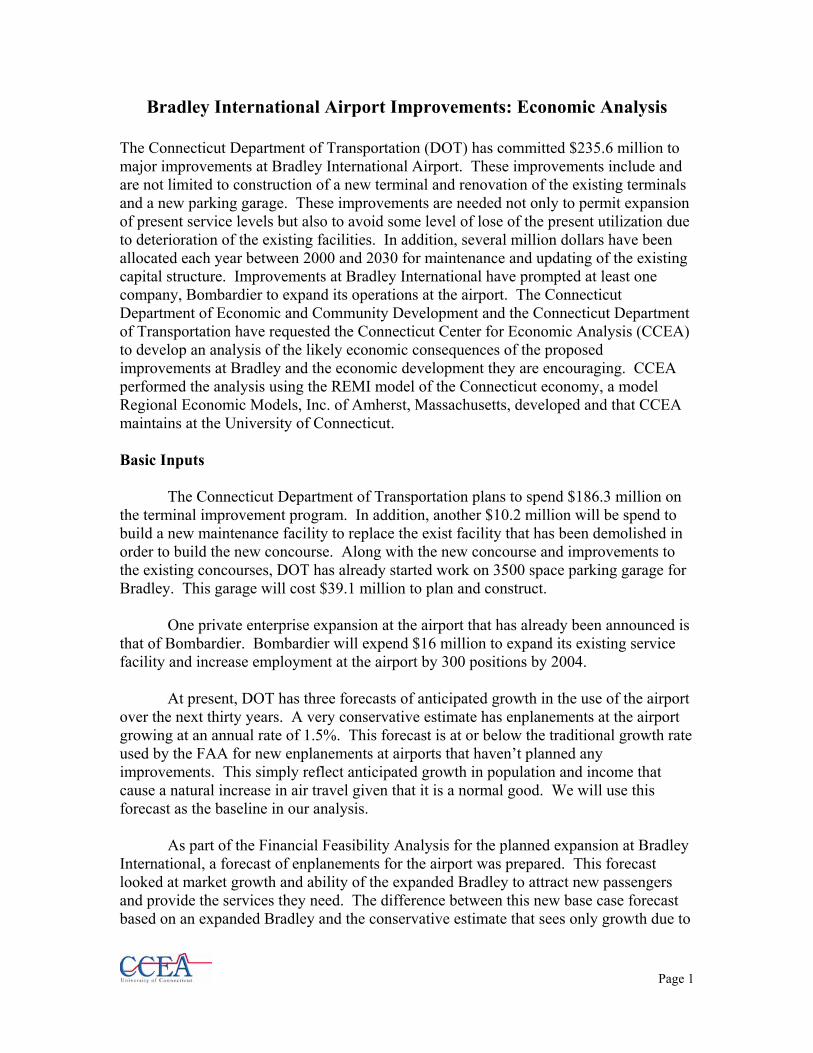
Results The improvement of Bradley International Airport and the private sector expansion of Bombardier will have a positive impact on Connecticut’s economy. Over the period 2000 to 2030, private sector employment in Connecticut will average 4,690 more than would have been the case without the expansion at Bradley under the conservative scenario and 9,352 more under the optimistic scenario. Population will also grow. It will average 5,500 more per year over the period 2000 to 2030 than the base forecast for the conservative scenario and 10,994 more for the optimistic forecast. Chart 1 shows the impact of the expansion at Bradley on employment and population for both scenarios.
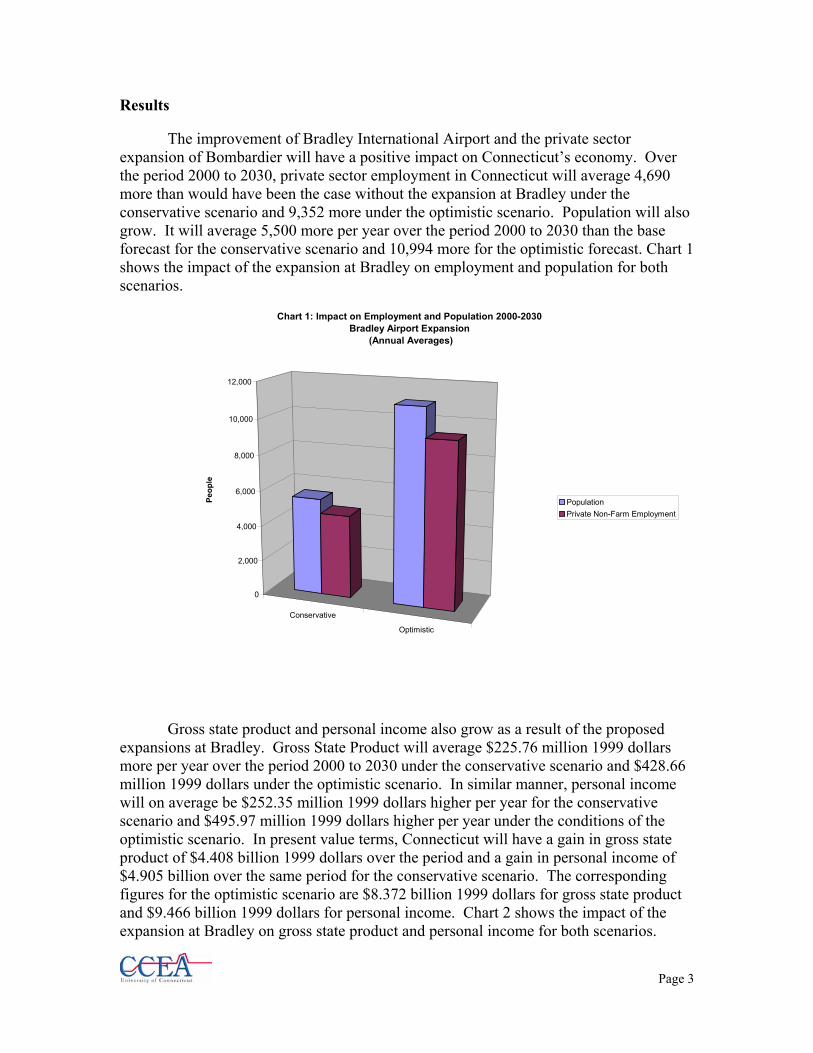
Gross state product and personal income also grow as a result of the proposed expansions at Bradley. Gross State Product will average $225.76 million 1999 dollars more per year over the period 2000 to 2030 under the conservative scenario and $428.66 million 1999 dollars under the optimistic scenario. In similar manner, personal income will on average be $252.35 million 1999 dollars higher per year for the conservative scenario and $495.97 million 1999 dollars higher per year under the conditions of the optimistic scenario. In present value terms, Connecticut will have a gain in gross state product of $4.408 billion 1999 dollars over the period and a gain in personal income of $4.905 billion over the same period for the conservative scenario. The corresponding figures for the optimistic scenario are $8.372 billion 1999 dollars for gross state product and $9.466 billion 1999 dollars for personal income. Chart 2 shows the impact of the expansion at Bradley on gross state product and personal income for both scenarios.
Conservative
Optimistic
0
2,000
4,000
6,000
8,000
10,000
12,000
Peop
le
Chart 1: Impact on Employment and Population 2000-2030 Bradley Airport Expansion
(Annual Averages)
PopulationPrivate Non-Farm Employment

Page 4
Fiscally, Bradley’s improvements will increase state tax revenues, both gross and
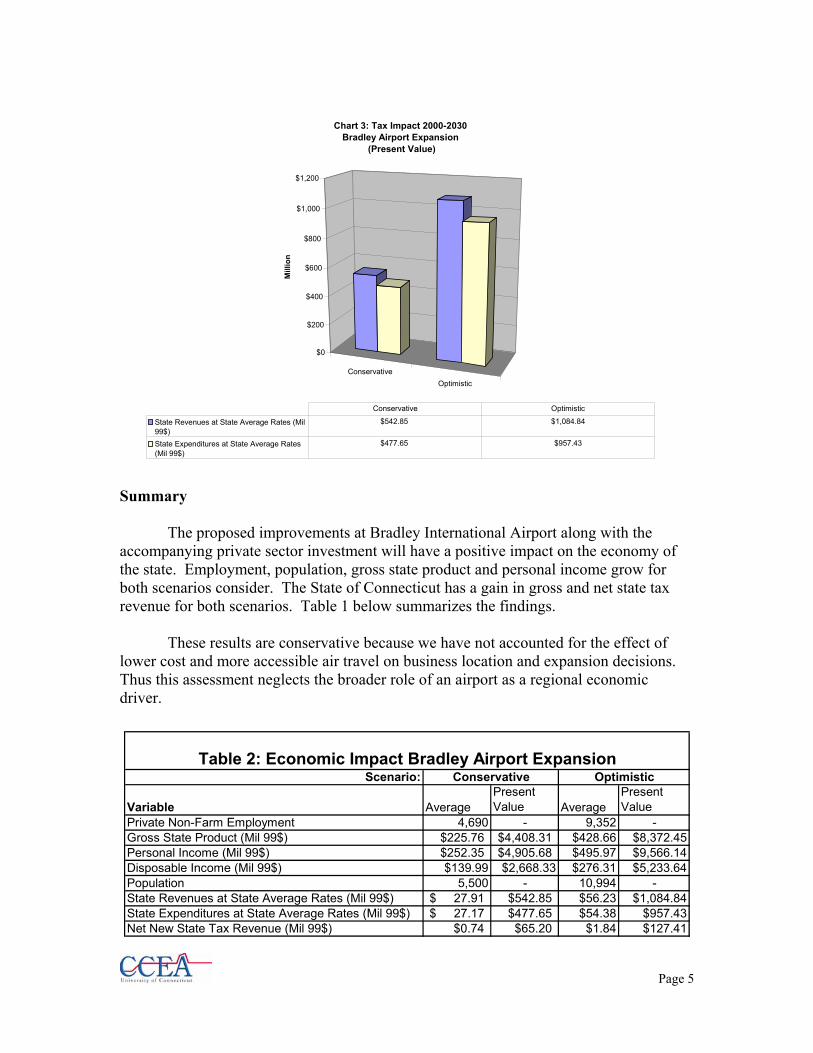
net. Over the thirty-one year period under study, gross new state tax revenues will average $27.91 million 1999 dollars more per year than under the control forecast for the conservative scenario and $56.23 million 1999 dollars more per year for the optimistic scenario. The growth in population associated with the expansion of Bradley will create a demand for new state government services. Under the conservative scenario, we estimate that state government spending will average $27.17 million 1999 dollars more per year than for the baseline forecast. This figures increases to $54.38 million 1999 dollars on average per year for optimistic scenario. These figures convert to a net increase in state revenues on average of $.74 million 1999 dollars per year for the conservative scenario and $1.84 million 1999 dollars on average per year for the optimistic scenario. Chart 3 shows the fiscal impact of Bradley’s expansion.
Conservative
Optimistic
$0
$1,000
$2,000
$3,000
$4,000
$5,000
$6,000
$7,000
$8,000
$9,000
$10,000M
illio
n 99
$
Chart 2: Economic Impact on Gross State Product and Personal Income 2000-2030Bradley Airport Expansion
(Present Value )
Gross State Product (Mil 99$)Personal Income (Mil 99$)
Page 5
Summary The proposed improvements at Bradley International Airport along with the accompanying private sector investment will have a positive impact on the economy of the state. Employment, population, gross state product and personal income grow for both scenarios consider. The State of Connecticut has a gain in gross and net state tax revenue for both scenarios. Table 1 below summarizes the findings.
These results are conservative because we have not accounted for the effect of lower cost and more accessible air travel on business location and expansion decisions. Thus this assessment neglects the broader role of an airport as a regional economic driver.
ConservativeOptimistic
$0
$200
$400
$600
$800
$1,000
$1,200
Mill
ion
Chart 3: Tax Impact 2000-2030Bradley Airport Expansion
(Present Value)
State Revenues at State Average Rates (Mil99$)
$542.85 $1,084.84
State Expenditures at State Average Rates(Mil 99$)
$477.65 $957.43
Conservative Optimistic
Scenario:
Variable AveragePresent Value Average
Present Value
Private Non-Farm Employment 4,690 - 9,352 -Gross State Product (Mil 99$) $225.76 $4,408.31 $428.66 $8,372.45Personal Income (Mil 99$) $252.35 $4,905.68 $495.97 $9,566.14Disposable Income (Mil 99$) $139.99 $2,668.33 $276.31 $5,233.64Population 5,500 - 10,994 -State Revenues at State Average Rates (Mil 99$) 27.91$ $542.85 $56.23 $1,084.84State Expenditures at State Average Rates (Mil 99$) 27.17$ $477.65 $54.38 $957.43Net New State Tax Revenue (Mil 99$) $0.74 $65.20 $1.84 $127.41
OptimisticTable 2: Economic Impact Bradley Airport Expansion
Conservative

Page 6
REMI OUTPUT

Page 7
Conservative Primary:Super Summary Table Differences as Compared to REMI Standard Reg Control
Variable 2000 2001 2002 2003 2004 2005 2006 Total Emp (Thous) 3.114 4.513 4.591 4.069 4.199 4.587 4.766 Total Emp As % of US 0.001872 0.002682 0.002697 0.002367 0.002419 0.002616 0.002692 Priv Non-Farm Emp (Thous) 3.087 4.438 4.474 3.922 4.026 4.386 4.539 Priv Non-Farm Emp As % of US 0.002188 0.003104 0.003091 0.002682 0.002726 0.00294 0.003012 GRP (Bil Fixed 92$) 0.1264 0.187 0.1896 0.1638 0.1683 0.1851 0.1932 Pers Inc (Bil Nom $) 0.1229 0.2021 0.2222 0.2046 0.2144 0.2392 0.2562 Pers Inc As % of US 0.00151 0.002366 0.002481 0.002182 0.002184 0.002328 0.002381 Disp Pers Inc (Bil Nom $) 0.09461 0.1567 0.1729 0.1599 0.1679 0.1875 0.2011 PCE-Price Index (Fixed 92$) 0.02448 0.04445 0.05406 0.05402 0.05513 0.05803 0.05965 Real Disp Pers Inc (Bil Fixed 92$) 0.05704 0.08894 0.09177 0.07957 0.08183 0.09067 0.09583 Real Disp Pers Inc Per Cap (Thous Fixed 92$) 0.01345 0.0163 0.01101 0.002892 -0.0002384 -0.001711 -0.004313 Population (Thous) 0.4961 1.34 2.086 2.611 3.042 3.498 3.945 Pop As % of US 0.0001802 0.0004824 0.0007445 0.0009235 0.001067 0.001216 0.00136
Variable 2007 2008 2009 2010 2011 2012 2013 Total Emp (Thous) 5.011 5.401 5.531 5.871 5.983 5.84 5.839 Total Emp As % of US 0.002803 0.002992 0.003043 0.00321 0.003247 0.003144 0.003119 Priv Non-Farm Emp (Thous) 4.758 5.121 5.226 5.542 5.631 5.469 5.454 Priv Non-Farm Emp As % of US 0.003126 0.003331 0.003375 0.003557 0.003585 0.003453 0.003413 GRP (Bil Fixed 92$) 0.2049 0.224 0.2289 0.2497 0.2568 0.2506 0.2522 Pers Inc (Bil Nom $) 0.2772 0.308 0.3247 0.3545 0.3763 0.3798 0.3907 Pers Inc As % of US 0.00246 0.002613 0.002638 0.002758 0.002805 0.002715 0.00268 Disp Pers Inc (Bil Nom $) 0.2179 0.2423 0.2559 0.2795 0.2972 0.3007 0.3098 PCE-Price Index (Fixed 92$) 0.06149 0.06494 0.0661 0.06889 0.07025 0.06862 0.06735 Real Disp Pers Inc (Bil Fixed 92$) 0.1025 0.1126 0.1169 0.1259 0.1318 0.1309 0.133 Real Disp Pers Inc Per Cap (Thous Fixed 92$) -0.006464 -0.007881 -0.01085 -0.01246 -0.0149 -0.01864 -0.02091 Population (Thous) 4.376 4.822 5.248 5.669 6.074 6.401 6.66 Pop As % of US 0.001496 0.001636 0.001766 0.001892 0.002012 0.002103 0.002172

Page 8
Conservative Primary:Super Summary Table Differences as Compared to REMI Standard Reg Control
Variable 2014 2015 2016 2017 2018 2019 2020 Total Emp (Thous) 5.877 5.917 5.735 5.574 5.428 5.31 5.187 Total Emp As % of US 0.003114 0.003111 0.002995 0.002894 0.002804 0.002732 0.00266 Priv Non-Farm Emp (Thous) 5.481 5.511 5.323 5.16 5.016 4.902 4.783 Priv Non-Farm Emp As % of US 0.0034 0.00339 0.00325 0.00313 0.003026 0.002944 0.002864 GRP (Bil Fixed 92$) 0.2564 0.261 0.2548 0.2503 0.2474 0.2466 0.2461 Pers Inc (Bil Nom $) 0.4044 0.4186 0.4196 0.4214 0.4237 0.4283 0.433 Pers Inc As % of US 0.002662 0.002644 0.002544 0.002452 0.002367 0.002297 0.00223 Disp Pers Inc (Bil Nom $) 0.321 0.3326 0.334 0.3361 0.3384 0.3424 0.3465 PCE-Price Index (Fixed 92$) 0.06631 0.0652 0.06209 0.05876 0.05525 0.05219 0.04921 Real Disp Pers Inc (Bil Fixed 92$) 0.136 0.139 0.1377 0.1369 0.1363 0.1362 0.1362 Real Disp Pers Inc Per Cap (Thous Fixed 92$) -0.02262 -0.02399 -0.02601 -0.02734 -0.02809 -0.02831 -0.02822 Population (Thous) 6.881 7.067 7.188 7.244 7.246 7.209 7.141 Pop As % of US 0.002226 0.002269 0.00229 0.00229 0.002273 0.002245 0.002207
Variable 2021 2022 2023 2024 2025 2026 2027 Total Emp (Thous) 5.053 4.938 4.82 4.707 4.579 4.576 4.563 Total Emp As % of US 0.002586 0.002521 0.002456 0.002394 0.002325 0.002318 0.002305 Priv Non-Farm Emp (Thous) 4.657 4.55 4.44 4.336 4.218 4.225 4.22 Priv Non-Farm Emp As % of US 0.002781 0.002712 0.002642 0.002576 0.002502 0.002501 0.002491 GRP (Bil Fixed 92$) 0.2455 0.2464 0.2474 0.2488 0.2496 0.2576 0.2651 Pers Inc (Bil Nom $) 0.4373 0.4445 0.4518 0.4604 0.468 0.4876 0.5097 Pers Inc As % of US 0.002163 0.00211 0.002058 0.002011 0.001961 0.00196 0.001962 Disp Pers Inc (Bil Nom $) 0.3504 0.3564 0.3625 0.3696 0.376 0.3917 0.4095 PCE-Price Index (Fixed 92$) 0.04649 0.04398 0.04166 0.03967 0.03764 0.03738 0.03755 Real Disp Pers Inc (Bil Fixed 92$) 0.1358 0.1362 0.1365 0.137 0.1371 0.14 0.1433 Real Disp Pers Inc Per Cap (Thous Fixed 92$) -0.02794 -0.02726 -0.02643 -0.0254 -0.02431 -0.02257 -0.02094 Population (Thous) 7.044 6.928 6.793 6.645 6.484 6.33 6.19 Pop As % of US 0.002161 0.002109 0.002053 0.001993 0.00193 0.00187 0.001814

Page 9
Conservative Primary:Super Summary Table Differences as Compared to REMI Standard Reg Control
Variable 2028 2029 2030 Total Emp (Thous) 4.539 4.501 4.454 Total Emp As % of US 0.002283 0.002254 0.002218 Priv Non-Farm Emp (Thous) 4.203 4.172 4.131 Priv Non-Farm Emp As % of US 0.002471 0.002442 0.002405 GRP (Bil Fixed 92$) 0.2715 0.2769 0.2817 Pers Inc (Bil Nom $) 0.5321 0.5544 0.5766 Pers Inc As % of US 0.001962 0.001957 0.001949 Disp Pers Inc (Bil Nom $) 0.4275 0.4456 0.4638 PCE-Price Index (Fixed 92$) 0.03798 0.03848 0.03894 Real Disp Pers Inc (Bil Fixed 92$) 0.1463 0.149 0.1515 Real Disp Pers Inc Per Cap (Thous Fixed 92$) -0.0195 -0.01827 -0.01709 Population (Thous) 6.062 5.941 5.825 Pop As % of US 0.001763 0.001715 0.001668

Page 10
Conservative Fiscal (Bil 99$) Differences as Compared to REMI Standard Reg Control
Variable 2000 2001 2002 2003 2004 2005 2006 State Revenues at State Average Rates 0.01404 0.0219 0.02277 0.02016 0.02086 0.02303 0.0242 Local Revenues at Adjusted State Average Rates 0.002318 0.004606 0.00612 0.00693 0.007961 0.009205 0.01035 State Expenditures at State Average Rates -0.007319 -0.005681 -0.0000837 0.006063 0.009133 0.01151 0.01468 Local Expenditures at Adjusted State Average Rates 0.0006496 0.003081 0.005709 0.007841 0.009464 0.01113 0.01288
Variable 2007 2008 2009 2010 2011 2012 2013 2014 State Revenues at State Average Rates 0.0257 0.02802 0.02893 0.03116 0.03222 0.03163 0.03179 0.03222 Local Revenues at Adjusted State Average Rates 0.01153 0.01284 0.01392 0.01515 0.01625 0.01703 0.01777 0.01845 State Expenditures at State Average Rates 0.01752 0.01997 0.02307 0.02535 0.02842 0.03179 0.03398 0.03568 Local Expenditures at Adjusted State Average Rates 0.01459 0.01634 0.01794 0.0195 0.02108 0.02244 0.02347 0.02434
Variable 2015 2016 2017 2018 2019 2020 2021 2022 State Revenues at State Average Rates 0.0327 0.0319 0.03123 0.03068 0.03033 0.02997 0.02952 0.02922 Local Revenues at Adjusted State Average Rates 0.01909 0.01948 0.01976 0.01993 0.02004 0.02008 0.02004 0.01997 State Expenditures at State Average Rates 0.03707 0.03878 0.03985 0.04037 0.04044 0.04027 0.03989 0.03932 Local Expenditures at Adjusted State Average Rates 0.02506 0.02561 0.02591 0.02596 0.02585 0.02562 0.02527 0.02487
Variable 2023 2024 2025 2026 2027 2028 2029 2030 State Revenues at State Average Rates 0.02888 0.02855 0.02811 0.02848 0.02888 0.02918 0.02938 0.02949 Local Revenues at Adjusted State Average Rates 0.01986 0.01971 0.01951 0.01939 0.01932 0.01925 0.01919 0.01913 State Expenditures at State Average Rates 0.03861 0.03779 0.03692 0.03564 0.03459 0.03367 0.03287 0.03215 Local Expenditures at Adjusted State Average Rates 0.02439 0.02385 0.02328 0.02268 0.02218 0.02172 0.02129 0.02089

Page 11
Conservative State Revenues at State Average Rates Differences as Compared to REMI Standard Reg Control
Variable 2000 2001 2002 2003 2004 2005 2006 Federal Intergovernmental 0.0004648 0.001235 0.001908 0.002369 0.002739 0.003126 0.003498 Local Intergovernmental 0.00000089 0.00000241 0.00000382 0.00000486 0.00000575 0.00000672 0.00000769 Property Tax 0 0 0.00000001 0.00000001 0.00000001 0.00000002 0.00000002 General Sales Tax 0.003628 0.005414 0.005206 0.004241 0.004284 0.00472 0.004855 Motor Fuel Sales Tax 0.0004096 0.0005944 0.0005639 0.0004336 0.0004172 0.0004477 0.0004496 Alcoholic Bev Sales Tax 0.00004027 0.00005838 0.00005445 0.00004113 0.00003906 0.00004148 0.00004117 Tobacco Sales Tax 0.0000416 0.00008591 0.0001139 0.0001281 0.000145 0.0001656 0.0001845 Public Utility Sales Tax 0.0001451 0.0002208 0.000228 0.0002055 0.0002133 0.0002341 0.0002431 Other Sales Tax 0.0009403 0.001403 0.001349 0.001099 0.00111 0.001223 0.001258 Individual Income Tax 0.002947 0.004497 0.004585 0.003915 0.003981 0.004376 0.004572 Corporate Income Tax 0.0006076 0.0009353 0.0009823 0.0008966 0.000963 0.001094 0.001176 Motor Vehicle License 0.0001831 0.0002835 0.0002917 0.000252 0.0002585 0.0002859 0.0003014 Other Tax 0.0003777 0.0005846 0.0006016 0.0005198 0.0005331 0.0005897 0.0006216 Education Charges 0.0003992 0.0007036 0.0008126 0.0007733 0.0007861 0.0008288 0.00084 Other Charges & Rev 0.001301 0.002014 0.002072 0.00179 0.001836 0.002031 0.002141 Utility&Liquor Store Rev 0.00001907 0.00002952 0.00003038 0.00002625 0.00002692 0.00002978 0.00003139 Unemployment Comp. 0.001457 0.002187 0.002267 0.001993 0.002017 0.002173 0.002237 Employee Retirement 0.0008147 0.001261 0.001298 0.001121 0.00115 0.001272 0.001341 Workers' Comp. 0.000259 0.0003887 0.0004028 0.0003541 0.0003584 0.0003862 0.0003976 Other Ins. Trust Rev 0 0 0 0 0 0 0

Page 12
Conservative State Revenues at State Average Rates Differences as Compared to REMI Standard Reg Control
Variable 2007 2008 2009 2010 2011 2012 2013 Federal Intergovernmental 0.003853 0.004215 0.004537 0.004861 0.005167 0.0054 0.00557 Local Intergovernmental 0.00000866 0.00000968 0.00001056 0.00001146 0.00001232 0.00001303 0.00001358 Property Tax 0.00000002 0.00000003 0.00000003 0.00000003 0.00000004 0.00000004 0.00000004 General Sales Tax 0.005082 0.005545 0.005629 0.0061 0.006165 0.005784 0.005668 Motor Fuel Sales Tax 0.0004629 0.0004984 0.000489 0.0005134 0.0005164 0.0004781 0.0004649 Alcoholic Bev Sales Tax 0.00004195 0.00004473 0.00004364 0.00004568 0.00004577 0.00004214 0.00004088 Tobacco Sales Tax 0.0002034 0.0002243 0.0002416 0.0002612 0.0002791 0.0002915 0.0003021 Public Utility Sales Tax 0.0002559 0.0002762 0.000287 0.000314 0.0003243 0.0003205 0.0003246 Other Sales Tax 0.001317 0.001437 0.001459 0.001581 0.001598 0.001499 0.001469 Individual Income Tax 0.004844 0.005291 0.005431 0.005819 0.006027 0.005896 0.005927 Corporate Income Tax 0.001278 0.001415 0.001488 0.001704 0.00178 0.001792 0.001837 Motor Vehicle License 0.0003217 0.000353 0.0003654 0.0003931 0.0004105 0.0004065 0.0004121 Other Tax 0.0006635 0.000728 0.0007535 0.0008108 0.0008467 0.0008384 0.0008499 Education Charges 0.0008618 0.0009131 0.0009204 0.0009652 0.0009885 0.0009565 0.0009461 Other Charges & Rev 0.002286 0.002508 0.002596 0.002793 0.002917 0.002888 0.002928 Utility&Liquor Store Rev 0.00003351 0.00003676 0.00003805 0.00004094 0.00004276 0.00004234 0.00004292 Unemployment Comp. 0.002337 0.002512 0.002561 0.002716 0.002776 0.002695 0.002684 Employee Retirement 0.001431 0.00157 0.001625 0.001749 0.001826 0.001808 0.001833 Workers' Comp. 0.0004153 0.0004464 0.0004551 0.0004826 0.0004934 0.000479 0.0004769 Other Ins. Trust Rev 0 0 0 0 0 0 0

Page 13
Conservative State Revenues at State Average Rates Differences as Compared to REMI Standard Reg Control
Variable 2014 2015 2016 2017 2018 2019 2020 Federal Intergovernmental 0.005708 0.005815 0.005869 0.005874 0.005833 0.005763 0.005669 Local Intergovernmental 0.00001405 0.00001445 0.00001471 0.00001484 0.00001485 0.00001477 0.00001462 Property Tax 0.00000004 0.00000005 0.00000005 0.00000005 0.00000005 0.00000005 0 General Sales Tax 0.005653 0.005652 0.005213 0.004831 0.004512 0.004275 0.004052 Motor Fuel Sales Tax 0.0004606 0.0004586 0.0004316 0.000412 0.0003978 0.00039 0.0003841 Alcoholic Bev Sales Tax 0.00004039 0.00004014 0.0000377 0.00003593 0.00003466 0.00003394 0.00003346 Tobacco Sales Tax 0.0003117 0.0003199 0.0003242 0.0003259 0.0003256 0.0003239 0.0003209 Public Utility Sales Tax 0.0003321 0.0003401 0.0003313 0.0003239 0.0003183 0.0003148 0.0003111 Other Sales Tax 0.001465 0.001465 0.001351 0.001252 0.001169 0.001108 0.00105 Individual Income Tax 0.006009 0.006098 0.005962 0.005857 0.005773 0.005727 0.005686 Corporate Income Tax 0.001894 0.001948 0.001933 0.001918 0.001907 0.0019 0.001887 Motor Vehicle License 0.0004206 0.0004293 0.0004242 0.0004206 0.0004179 0.000417 0.0004162 Other Tax 0.0008674 0.0008855 0.0008749 0.0008674 0.0008618 0.0008601 0.0008584 Education Charges 0.0009677 0.001032 0.001091 0.001171 0.001286 0.001421 0.001547 Other Charges & Rev 0.002988 0.00305 0.003014 0.002988 0.002969 0.002963 0.002957 Utility&Liquor Store Rev 0.0000438 0.00004471 0.00004418 0.0000438 0.00004352 0.00004343 0.00004335 Unemployment Comp. 0.002697 0.002717 0.002633 0.002564 0.00251 0.002478 0.002452 Employee Retirement 0.001871 0.00191 0.001887 0.001871 0.001859 0.001855 0.001851 Workers' Comp. 0.0004793 0.0004828 0.0004679 0.0004557 0.0004461 0.0004404 0.0004358 Other Ins. Trust Rev 0 0 0 0 0 0 0

Page 14
Conservative State Revenues at State Average Rates Differences as Compared to REMI Standard Reg Control
Variable 2021 2022 2023 2024 2025 2026 2027 Federal Intergovernmental 0.005556 0.005435 0.005303 0.005163 0.005017 0.004878 0.00476 Local Intergovernmental 0.00001441 0.00001418 0.0000139 0.0000136 0.00001326 0.00001295 0.00001268 Property Tax 0.00000005 0 0.00000005 0.00000005 0.00000005 0.00000005 0.00000005 General Sales Tax 0.003824 0.003655 0.003492 0.003346 0.003181 0.003312 0.003426 Motor Fuel Sales Tax 0.0003781 0.0003786 0.0003799 0.0003829 0.0003852 0.0004029 0.0004215 Alcoholic Bev Sales Tax 0.00003291 0.00003297 0.00003308 0.00003333 0.00003351 0.00003509 0.00003669 Tobacco Sales Tax 0.0003166 0.0003121 0.0003068 0.0003008 0.0002945 0.0002891 0.0002848 Public Utility Sales Tax 0.0003069 0.0003044 0.0003018 0.0002993 0.0002959 0.0003038 0.0003115 Other Sales Tax 0.0009912 0.0009473 0.000905 0.0008673 0.0008245 0.0008585 0.0008878 Individual Income Tax 0.005633 0.005622 0.005608 0.005605 0.005584 0.005711 0.005842 Corporate Income Tax 0.001868 0.001852 0.001834 0.001812 0.001787 0.001799 0.00181 Motor Vehicle License 0.0004145 0.0004154 0.000416 0.0004171 0.0004171 0.000426 0.0004359 Other Tax 0.0008548 0.0008566 0.0008579 0.0008602 0.0008602 0.0008787 0.0008991 Education Charges 0.001639 0.0017 0.001735 0.001747 0.001717 0.001688 0.001666 Other Charges & Rev 0.002944 0.002951 0.002955 0.002963 0.002963 0.003027 0.003097 Utility&Liquor Store Rev 0.00004317 0.00004326 0.00004332 0.00004344 0.00004344 0.00004437 0.0000454 Unemployment Comp. 0.002426 0.002419 0.002414 0.002415 0.002411 0.002479 0.002548 Employee Retirement 0.001844 0.001848 0.00185 0.001855 0.001855 0.001895 0.001939 Workers' Comp. 0.0004311 0.0004299 0.0004289 0.0004292 0.0004285 0.0004405 0.0004528 Other Ins. Trust Rev 0 0 0 0 0 0 0

Page 15
Conservative State Revenues at State Average Rates Differences as Compared to REMI Standard Reg Control
Variable 2028 2029 2030 Federal Intergovernmental 0.004652 0.004552 0.004457 Local Intergovernmental 0.00001243 0.00001219 0.00001197 Property Tax 0.00000005 0.00000005 0.00000005 General Sales Tax 0.0035 0.003535 0.003546 Motor Fuel Sales Tax 0.0004373 0.0004508 0.0004632 Alcoholic Bev Sales Tax 0.00003806 0.00003922 0.00004026 Tobacco Sales Tax 0.0002808 0.0002772 0.0002735 Public Utility Sales Tax 0.0003177 0.0003224 0.0003263 Other Sales Tax 0.0009071 0.0009162 0.0009191 Individual Income Tax 0.005956 0.006049 0.006129 Corporate Income Tax 0.001815 0.001815 0.001812 Motor Vehicle License 0.000445 0.0004529 0.0004601 Other Tax 0.0009177 0.000934 0.0009489 Education Charges 0.001646 0.00161 0.001549 Other Charges & Rev 0.003161 0.003217 0.003269 Utility&Liquor Store Rev 0.00004634 0.00004716 0.00004792 Unemployment Comp. 0.002609 0.002661 0.002705 Employee Retirement 0.001979 0.002014 0.002047 Workers' Comp. 0.0004637 0.0004728 0.0004807 Other Ins. Trust Rev 0 0 0

Page 16
Conservative State Expenditures at State Average Rates Differences as Compared to REMI Standard Reg Control
Variable 2000 2001 2002 2003 2004 2005 Intergovernmental 0.0004081 0.001106 0.001752 0.002229 0.002639 0.003082 Higher Education 0.0001702 0.0004616 0.0007311 0.0009306 0.001102 0.001286 Elementary & Secondary Education; Libraries 0.0000018 0.0000049 0.00000776 0.00000988 0.0000117 0.00001366 Welfare -0.005386 -0.005895 -0.003856 -0.001114 -0.0001161 0.0003854 Health 0.0002023 0.0005486 0.0008689 0.001106 0.001309 0.001529 Transportation 0.0001154 0.0003128 0.0004955 0.0006307 0.0007466 0.0008719 Police, Fire, Correction 0.0000984 0.0002668 0.0004227 0.000538 0.0006368 0.0007437 Natural Resources, Parks, Housing 0.00003314 0.00008988 0.0001424 0.0001812 0.0002145 0.0002505 Sewerage, Solid Waste 0.00002185 0.00005926 0.00009386 0.0001195 0.0001414 0.0001652 Administration & Unallocable 0.0002239 0.0006072 0.0009618 0.001224 0.001449 0.001692 Interest on Debt 0.0001336 0.0003623 0.0005739 0.0007305 0.0008647 0.00101 Utilities, Transit 0.00003203 0.00008686 0.0001376 0.0001751 0.0002073 0.0002421 Insurance Trusts -0.003374 -0.003692 -0.002415 -0.0006978 -0.0000727 0.0002414
Variable 2006 2007 2008 2009 2010 2011 Intergovernmental 0.003527 0.003971 0.004437 0.004839 0.00525 0.005648 Higher Education 0.001472 0.001657 0.001852 0.00202 0.002191 0.002357 Elementary & Secondary Education; Libraries 0.00001564 0.0000176 0.00001967 0.00002145 0.00002327 0.00002503 Welfare 0.001363 0.002149 0.00264 0.003673 0.004184 0.005208 Health 0.00175 0.00197 0.002201 0.0024 0.002605 0.002802 Transportation 0.0009979 0.001123 0.001255 0.001369 0.001485 0.001598 Police, Fire, Correction 0.0008512 0.0009582 0.001071 0.001168 0.001267 0.001363 Natural Resources, Parks, Housing 0.0002867 0.0003227 0.0003606 0.0003933 0.0004267 0.000459 Sewerage, Solid Waste 0.000189 0.0002128 0.0002377 0.0002593 0.0002813 0.0003026 Administration & Unallocable 0.001937 0.00218 0.002436 0.002657 0.002883 0.003101 Interest on Debt 0.001156 0.001301 0.001454 0.001585 0.00172 0.00185 Utilities, Transit 0.0002771 0.0003119 0.0003485 0.0003801 0.0004124 0.0004436 Insurance Trusts 0.0008539 0.001346 0.001654 0.002301 0.002621 0.003262

Page 17
Conservative State Expenditures at State Average Rates Differences as Compared to REMI Standard Reg Control
Variable 2012 2013 2014 2015 2016 2017 Intergovernmental 0.00597 0.006222 0.00644 0.006622 0.006741 0.006801 Higher Education 0.002492 0.002597 0.002688 0.002764 0.002814 0.002838 Elementary & Secondary Education; Libraries 0.00002646 0.00002758 0.00002854 0.00002935 0.00002988 0.00003015 Welfare 0.006584 0.007377 0.007951 0.00841 0.009202 0.009732 Health 0.002961 0.003087 0.003194 0.003285 0.003344 0.003374 Transportation 0.001689 0.00176 0.001822 0.001873 0.001907 0.001924 Police, Fire, Correction 0.00144 0.001501 0.001554 0.001598 0.001627 0.001641 Natural Resources, Parks, Housing 0.0004852 0.0005057 0.0005234 0.0005382 0.0005479 0.0005527 Sewerage, Solid Waste 0.0003199 0.0003334 0.0003451 0.0003548 0.0003612 0.0003644 Administration & Unallocable 0.003278 0.003416 0.003536 0.003636 0.003701 0.003734 Interest on Debt 0.001956 0.002039 0.00211 0.00217 0.002209 0.002228 Utilities, Transit 0.0004689 0.0004887 0.0005058 0.0005201 0.0005295 0.0005342 Insurance Trusts 0.004124 0.004621 0.00498 0.005268 0.005764 0.006096
Variable 2018 2019 2020 2021 2022 2023 2024 Intergovernmental 0.006804 0.006768 0.006701 0.006606 0.006497 0.00637 0.006231 Higher Education 0.00284 0.002825 0.002797 0.002757 0.002712 0.002659 0.0026 Elementary & Secondary Education; Libraries 0.00003016 0 0.0000297 0.00002928 0.0000288 0.00002824 0.00002762 Welfare 0.01005 0.01017 0.01021 0.01018 0.01007 0.009906 0.009702 Health 0.003375 0.003357 0.003324 0.003277 0.003223 0.00316 0.003091 Transportation 0.001925 0.001915 0.001896 0.001869 0.001838 0.001802 0.001762 Police, Fire, Correction 0.001642 0.001633 0.001617 0.001594 0.001568 0.001537 0.001503 Natural Resources, Parks, Housing 0.000553 0.0005501 0.0005446 0.0005369 0.0005281 0.0005178 0.0005064 Sewerage, Solid Waste 0.0003646 0.0003627 0.0003591 0.000354 0.0003482 0.0003414 0.0003339 Administration & Unallocable 0.003736 0.003716 0.003679 0.003627 0.003567 0.003498 0.003421 Interest on Debt 0.002229 0.002218 0.002196 0.002164 0.002129 0.002087 0.002041 Utilities, Transit 0.0005344 0.0005316 0.0005263 0.0005189 0.0005103 0.0005004 0.0004894 Insurance Trusts 0.006293 0.006367 0.006393 0.006378 0.006306 0.006205 0.006077

Page 18
Conservative State Expenditures at State Average Rates Differences as Compared to REMI Standard Reg Control
Variable 2025 2026 2027 2028 2029 2030 Intergovernmental 0.006079 0.005932 0.005809 0.005694 0.005587 0.005483 Higher Education 0.002537 0.002476 0.002425 0.002377 0.002332 0.002289 Elementary & Secondary Education; Libraries 0.00002694 0.0000263 0.00002575 0.00002524 0.00002477 0.00002431 Welfare 0.009497 0.009028 0.00865 0.008335 0.008076 0.007857 Health 0.003015 0.002943 0.002882 0.002825 0.002772 0.00272 Transportation 0.00172 0.001678 0.001643 0.001611 0.001581 0.001551 Police, Fire, Correction 0.001467 0.001432 0.001402 0.001374 0.001348 0.001323 Natural Resources, Parks, Housing 0.0004941 0.0004822 0.0004721 0.0004628 0.0004541 0.0004457 Sewerage, Solid Waste 0.0003257 0.0003179 0.0003113 0.0003051 0.0002994 0.0002938 Administration & Unallocable 0.003338 0.003257 0.003189 0.003126 0.003068 0.003011 Interest on Debt 0.001992 0.001944 0.001903 0.001866 0.001831 0.001797 Utilities, Transit 0.0004775 0.000466 0.0004563 0.0004472 0.0004389 0.0004307 Insurance Trusts 0.005949 0.005655 0.005418 0.005221 0.005059 0.004922

Page 19
Conservative Local Revenues at Adjusted State Average Rates Differences as Compared to REMI Standard Reg Control
Variable 2000 2001 2002 2003 2004 2005 2006 2007 Federal Intergovernmental 0.0000479 0.0001273 0.0001966 0.0002442 0.0002822 0.0003221 0.0003605 0.000397 State Intergovernmental 0.0003809 0.001032 0.001635 0.002081 0.002463 0.002877 0.003293 0.003707 Property Tax 0.0005833 0.001412 0.002183 0.002776 0.00334 0.003938 0.004521 0.005107 General Sales Tax 0 0.00000005 0.00000005 0.00000004 0.00000004 0 0.00000005 0.00000005 Motor Fuel Sales Tax 0 0 0 0 0 0 0 0 Alcoholic Bev Sales Tax 0 0 0 0 0 0 0 0 Tobacco Sales Tax 0 0 0 0 0 0 0 0 Public Utility Sales Tax 0 0 0 0 0 0 0 0 Other Sales Tax 0.0000001 0.00000016 0.00000015 0.00000012 0.00000012 0.00000013 0.00000014 0 Individual Income Tax 0 0 0 0 0 0 0 0 Corporate Income Tax 0 0 0 0 0 0 0 0 Motor Vehicle License 0 0 0 0 0 0 0 0 Other Tax 0.00004907 0.00007595 0.00007816 0.00006752 0.00006925 0.0000766 0.00008075 0.0000862 Education Charges 0.00005637 0.00009934 0.0001147 0.0001092 0.000111 0.000117 0.0001186 0.0001217 Other Charges & Rev 0.0006729 0.001041 0.001072 0.0009259 0.0009496 0.00105 0.001107 0.001182 Utility&Liquor Store Rev 0.0003339 0.0005168 0.0005318 0.0004594 0.0004712 0.0005212 0.0005494 0.0005865 Unemployment Comp. 0 0 0 0 0 0 0 0 Employee Retirement 0.0001938 0.0002999 0.0003086 0.0002666 0.0002735 0.0003025 0.0003189 0.0003404
Page 20
Conservative Local Revenues at Adjusted State Average Rates Differences as Compared to REMI Standard Reg Control
Variable 2008 2009 2010 2011 2012 2013 2014 Federal Intergovernmental 0.0004344 0.0004676 0.0005009 0.0005325 0.0005565 0.000574 0.0005882 State Intergovernmental 0.004142 0.004517 0.004901 0.005272 0.005572 0.005808 0.006011 Property Tax 0.005723 0.006313 0.006925 0.007503 0.007995 0.008438 0.008848 General Sales Tax 0.00000006 0.00000006 0.00000006 0.00000006 0 0.00000006 0.00000006 Motor Fuel Sales Tax 0 0 0 0 0 0 0 Alcoholic Bev Sales Tax 0 0 0 0 0 0 0 Tobacco Sales Tax 0 0 0 0 0 0 0 Public Utility Sales Tax 0 0 0 0.000000001 0 0.000000001 0.000000001 Other Sales Tax 0.00000016 0.00000016 0 0.00000018 0.00000017 0.00000016 0.00000016 Individual Income Tax 0 0 0 0 0 0 0 Corporate Income Tax 0 0 0 0 0 0 0 Motor Vehicle License 0 0 0 0 0 0 0 Other Tax 0.00009458 0.00009789 0.0001053 0.00011 0.0001089 0.0001104 0.0001127 Education Charges 0.0001289 0.0001299 0.0001363 0.0001396 0.000135 0.0001336 0.0001366 Other Charges & Rev 0.001297 0.001342 0.001444 0.001508 0.001494 0.001514 0.001545 Utility&Liquor Store Rev 0.0006435 0.0006661 0.0007167 0.0007484 0.0007411 0.0007513 0.0007668 Unemployment Comp. 0 0 0 0 0 0 0 Employee Retirement 0.0003735 0.0003865 0.0004159 0.0004343 0.0004301 0.000436 0.000445
Page 21
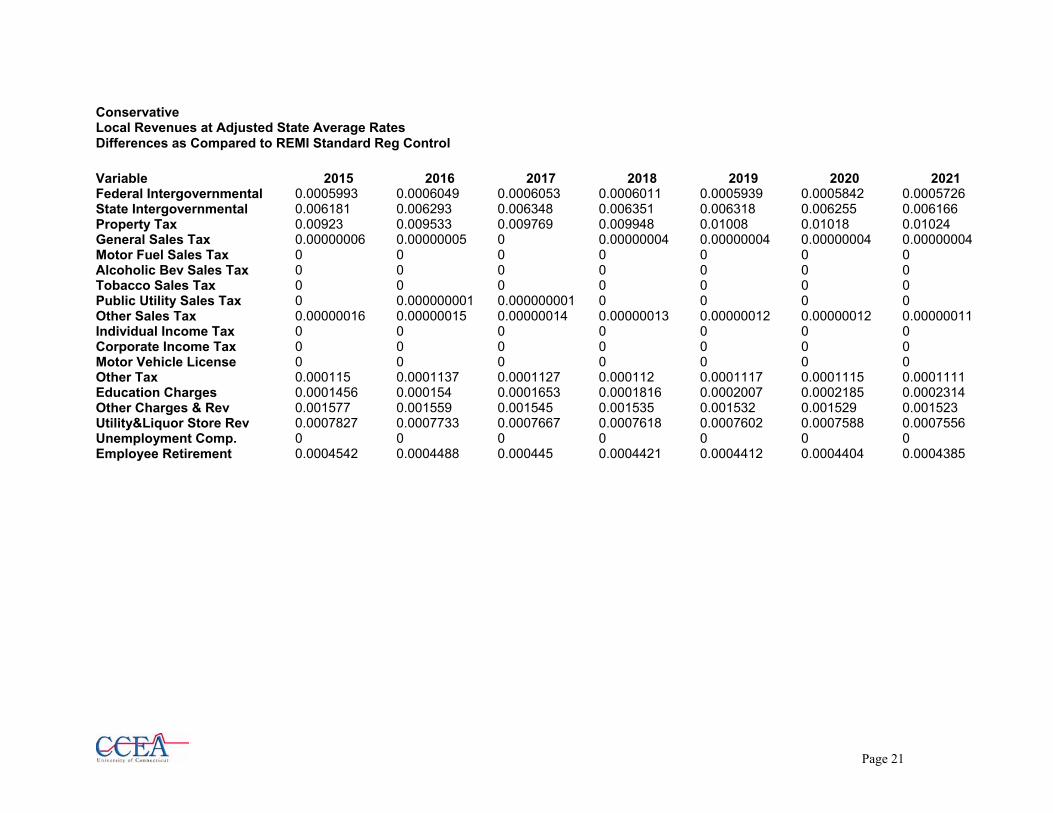
Conservative Local Revenues at Adjusted State Average Rates Differences as Compared to REMI Standard Reg Control
Variable 2015 2016 2017 2018 2019 2020 2021 Federal Intergovernmental 0.0005993 0.0006049 0.0006053 0.0006011 0.0005939 0.0005842 0.0005726 State Intergovernmental 0.006181 0.006293 0.006348 0.006351 0.006318 0.006255 0.006166 Property Tax 0.00923 0.009533 0.009769 0.009948 0.01008 0.01018 0.01024 General Sales Tax 0.00000006 0.00000005 0 0.00000004 0.00000004 0.00000004 0.00000004 Motor Fuel Sales Tax 0 0 0 0 0 0 0 Alcoholic Bev Sales Tax 0 0 0 0 0 0 0 Tobacco Sales Tax 0 0 0 0 0 0 0 Public Utility Sales Tax 0 0.000000001 0.000000001 0 0 0 0 Other Sales Tax 0.00000016 0.00000015 0.00000014 0.00000013 0.00000012 0.00000012 0.00000011 Individual Income Tax 0 0 0 0 0 0 0 Corporate Income Tax 0 0 0 0 0 0 0 Motor Vehicle License 0 0 0 0 0 0 0 Other Tax 0.000115 0.0001137 0.0001127 0.000112 0.0001117 0.0001115 0.0001111 Education Charges 0.0001456 0.000154 0.0001653 0.0001816 0.0002007 0.0002185 0.0002314 Other Charges & Rev 0.001577 0.001559 0.001545 0.001535 0.001532 0.001529 0.001523 Utility&Liquor Store Rev 0.0007827 0.0007733 0.0007667 0.0007618 0.0007602 0.0007588 0.0007556 Unemployment Comp. 0 0 0 0 0 0 0 Employee Retirement 0.0004542 0.0004488 0.000445 0.0004421 0.0004412 0.0004404 0.0004385

Page 22
Conservative Local Revenues at Adjusted State Average Rates Differences as Compared to REMI Standard Reg Control
Variable 2022 2023 2024 2025 2026 2027 2028 Federal Intergovernmental 0.0005601 0.0005465 0.0005321 0.000517 0.0005027 0.0004905 0.0004794 State Intergovernmental 0.006065 0.005946 0.005816 0.005674 0.005537 0.005422 0.005315 Property Tax 0.01027 0.01028 0.01027 0.01023 0.01021 0.0102 0.01019 General Sales Tax 0.00000003 0.00000003 0.00000003 0.00000003 0.00000003 0.00000003 0.00000003 Motor Fuel Sales Tax 0 0 0 0 0 0 0 Alcoholic Bev Sales Tax 0 0 0 0 0 0 0 Tobacco Sales Tax 0 0 0 0 0 0 0 Public Utility Sales Tax 0 0 0 0 0 0 0 Other Sales Tax 0.0000001 0.0000001 0.00000009 0.00000009 0.00000009 0.0000001 0.0000001 Individual Income Tax 0 0 0 0 0 0 0 Corporate Income Tax 0 0 0 0 0 0 0 Motor Vehicle License 0 0 0 0 0 0 0 Other Tax 0.0001113 0.0001115 0.0001118 0.0001117 0.0001141 0.0001168 0.0001192 Education Charges 0.0002401 0.0002449 0.0002466 0.0002425 0.0002383 0.0002352 0.0002323 Other Charges & Rev 0.001526 0.001528 0.001532 0.001532 0.001565 0.001602 0.001635 Utility&Liquor Store Rev 0.0007572 0.0007583 0.0007604 0.0007603 0.0007767 0.0007947 0.0008112 Unemployment Comp. 0 0 0 0 0 0 0 Employee Retirement 0.0004394 0.0004401 0.0004413 0.0004412 0.0004507 0.0004612 0.0004708

Page 23
Conservative Local Revenues at Adjusted State Average Rates Differences as Compared to REMI Standard Reg Control
Variable 2029 2030 Federal Intergovernmental 0.0004691 0.0004593 State Intergovernmental 0.005215 0.005118 Property Tax 0.01019 0.01019 General Sales Tax 0.00000003 0.00000003 Motor Fuel Sales Tax 0 0 Alcoholic Bev Sales Tax 0 0 Tobacco Sales Tax 0 0 Public Utility Sales Tax 0 0.000000001 Other Sales Tax 0.0000001 0.0000001 Individual Income Tax 0 0 Corporate Income Tax 0 0 Motor Vehicle License 0 0 Other Tax 0.0001213 0.0001233 Education Charges 0.0002274 0.0002187 Other Charges & Rev 0.001664 0.00169 Utility&Liquor Store Rev 0.0008256 0.0008388 Unemployment Comp. 0 0 Employee Retirement 0.0004791 0.0004868

Page 24
Conservative Local Expenditures at Adjusted State Average Rates Differences as Compared to REMI Standard Reg Control
Variable 2000 2001 2002 2003 2004 2005 Intergovernmental 0.00000033 0.00000089 0.00000141 0.0000018 0.00000213 0.00000249 Higher Education 0 0 0 0 0 0 Elementary & Secondary Education; Libraries 0.0007463 0.002024 0.003206 0.00408 0.00483 0.005641 Welfare -0.0004631 -0.0005068 -0.0003315 -0.00009579 -0.00000998 0.00003313 Health 0.00001377 0.00003735 0.00005916 0.0000753 0.00008913 0.0001041 Transportation 0.00006008 0.000163 0.0002581 0.0003285 0.0003888 0.0004541 Police, Fire, Correction 0.0001521 0.0004125 0.0006534 0.0008316 0.0009844 0.00115 Natural Resources, Parks, Housing 0.00008212 0.0002227 0.0003527 0.000449 0.0005314 0.0006207 Sewerage, Solid Waste 0.00008643 0.0002344 0.0003712 0.0004725 0.0005593 0.0006533 Administration & Unallocable 0.0002162 0.0005864 0.0009287 0.001182 0.001399 0.001634 Interest on Debt 0.00004008 0.0001087 0.0001721 0.0002191 0.0002594 0.0003029 Utilities, Transit 0.00006756 0.0001832 0.0002902 0.0003694 0.0004373 0.0005107 Insurance Trusts -0.0003523 -0.0003856 -0.0002522 -0.00007288 -0.00000759 0.00002521
Variable 2006 2007 2008 2009 2010 2011 Intergovernmental 0.00000285 0.00000321 0.0000035 0.00000391 0.00000424 0.0000045 Higher Education 0 0 0 0 0 0 Elementary & Secondary Education; Libraries 0.006456 0.007267 0.00812 0.008856 0.009609 0.01034 Welfare 0.0001172 0.0001847 0.000227 0.0003158 0.0003597 0.0004478 Health 0.0001191 0.0001341 0.0001498 0.0001634 0.0001773 0.0001907 Transportation 0.0005198 0.0005851 0.0006537 0.000713 0.0007736 0.0008321 Police, Fire, Correction 0.001316 0.001481 0.001655 0.001805 0.001958 0.002107 Natural Resources, Parks, Housing 0.0007104 0.0007996 0.0008935 0.0009745 0.001057 0.001137 Sewerage, Solid Waste 0.0007477 0.0008416 0.0009404 0.001026 0.001113 0.001197 Administration & Unallocable 0.00187 0.002105 0.002352 0.002566 0.002784 0.002994 Interest on Debt 0.0003467 0.0003902 0.000436 0.0004756 0.000516 0.000555 Utilities, Transit 0.0005845 0.0006579 0.0007351 0.0008018 0.0008699 0.0009357 Insurance Trusts 0.00008916 0.0001406 0.0001727 0.0002403 0.0002737 0.0003407

Page 25
Conservative Local Expenditures at Adjusted State Average Rates Differences as Compared to REMI Standard Reg Control
Variable 2012 2013 2014 2015 2016 2017 Intergovernmental 0.0000048 0.00000503 0.00000521 0.00000535 0.00000545 0.0000055 Higher Education 0 0 0 0 0 0 Elementary & Secondary Education; Libraries 0.01093 0.01139 0.01179 0.01212 0.01234 0.01245 Welfare 0.0005661 0.0006342 0.0006836 0.0007231 0.0007911 0.0008368 Health 0.0002016 0.0002102 0.0002175 0.0002236 0.0002277 0.0002297 Transportation 0.0008796 0.0009168 0.0009488 0.0009757 0.0009933 0.001002 Police, Fire, Correction 0.002227 0.002321 0.002402 0.00247 0.002515 0.002537 Natural Resources, Parks, Housing 0.001202 0.001253 0.001297 0.001333 0.001358 0.001369 Sewerage, Solid Waste 0.001265 0.001319 0.001365 0.001403 0.001429 0.001441 Administration & Unallocable 0.003165 0.003299 0.003414 0.003511 0.003574 0.003606 Interest on Debt 0.0005867 0.0006115 0.0006329 0.0006508 0.0006625 0.0006683 Utilities, Transit 0.0009891 0.001031 0.001067 0.001097 0.001117 0.001127 Insurance Trusts 0.0004307 0.0004825 0.0005201 0.0005501 0.0006019 0.0006366
Variable 2018 2019 2020 2021 2022 2023 Intergovernmental 0.0000055 0.00000547 0.00000542 0.00000534 0.00000525 0.00000515 Higher Education 0 0 0 0 0 0 Elementary & Secondary Education; Libraries 0.01245 0.01239 0.01226 0.01209 0.01189 0.01166 Welfare 0.0008637 0.000874 0.0008775 0.0008754 0.0008655 0.0008517 Health 0.0002298 0.0002286 0.0002263 0.0002231 0.0002194 0.0002152 Transportation 0.001003 0.0009973 0.0009874 0.0009733 0.0009573 0.0009387 Police, Fire, Correction 0.002538 0.002525 0.0025 0.002464 0.002424 0.002376 Natural Resources, Parks, Housing 0.00137 0.001363 0.001349 0.00133 0.001308 0.001283 Sewerage, Solid Waste 0.001442 0.001435 0.00142 0.0014 0.001377 0.00135 Administration & Unallocable 0.003607 0.003589 0.003553 0.003502 0.003445 0.003378 Interest on Debt 0.0006687 0.0006652 0.0006585 0.0006492 0.0006385 0.0006261 Utilities, Transit 0.001127 0.001121 0.00111 0.001094 0.001076 0.001056 Insurance Trusts 0.0006571 0.0006649 0.0006676 0.000666 0.0006585 0.000648

Page 26
Conservative Local Expenditures at Adjusted State Average Rates Differences as Compared to REMI Standard Reg Control
Variable 2024 2025 2026 2027 2028 2029 Intergovernmental 0.00000504 0.00000491 0.000004 0.000004 0.0000046 0.00000452 Higher Education 0 0 0 0 0 0 Elementary & Secondary Education; Libraries 0.0114 0.01113 0.01086 0.01063 0.01042 0.01023 Welfare 0.0008341 0.0008165 0.0007762 0.0007437 0.0007166 0.0006944 Health 0.0002104 0.0002053 0.0002004 0.0001962 0.0001923 0.0001887 Transportation 0.000918 0.0008957 0.0008741 0.0008558 0.000839 0.0008232 Police, Fire, Correction 0.002324 0.002267 0.002213 0.002167 0.002124 0.002084 Natural Resources, Parks, Housing 0.001255 0.001224 0.001195 0.00117 0.001147 0.001125 Sewerage, Solid Waste 0.001321 0.001288 0.001257 0.001231 0.001207 0.001184 Administration & Unallocable 0.003303 0.003223 0.003145 0.00308 0.003019 0.002962 Interest on Debt 0.0006123 0.0005974 0.000583 0.0005708 0.0005596 0.0005491 Utilities, Transit 0.001032 0.001007 0.0009829 0.0009624 0.0009435 0.0009257 Insurance Trusts 0.0006346 0.0006212 0.0005905 0.0005658 0.0005452 0.0005283
Variable 2030 Intergovernmental 0.00000443 Higher Education 0 Elementary & Secondary Education; Libraries 0.01004 Welfare 0.0006755 Health 0.0001852 Transportation 0.0008079 Police, Fire, Correction 0.002045 Natural Resources, Parks, Housing 0.001104 Sewerage, Solid Waste 0.001162 Administration & Unallocable 0.002907 Interest on Debt 0.0005389 Utilities, Transit 0.0009085 Insurance Trusts 0.000514

Page 27
Optimistic Primary:Super Summary Table Differences as Compared to REMI Standard Reg Control
Variable 2000 2001 2002 2003 2004 2005 2006 Total Emp (Thous) 7.145 8.79 8.99 8.474 8.569 9.038 9.27 Total Emp As % of US 0.004295 0.005224 0.005281 0.00493 0.004936 0.005155 0.005236 Priv Non-Farm Emp (Thous) 7.084 8.636 8.751 8.168 8.205 8.621 8.801 Priv Non-Farm Emp As % of US 0.005022 0.006039 0.006046 0.005587 0.005556 0.005778 0.005839 GRP (Bil Fixed 92$) 0.2763 0.3488 0.3581 0.3328 0.3352 0.3559 0.3665 Pers Inc (Bil Nom $) 0.2662 0.3762 0.4161 0.4109 0.4292 0.4661 0.4938 Pers Inc As % of US 0.003271 0.004404 0.004647 0.004383 0.004371 0.004535 0.004588 Disp Pers Inc (Bil Nom $) 0.2045 0.2916 0.3238 0.321 0.3362 0.3656 0.3881 PCE-Price Index (Fixed 92$) 0.05421 0.08511 0.1008 0.1039 0.106 0.1097 0.1114 Real Disp Pers Inc (Bil Fixed 92$) 0.1225 0.1638 0.1721 0.1626 0.1666 0.179 0.1872 Real Disp Pers Inc Per Cap (Thous Fixed 92$) 0.02878 0.0279 0.01801 0.005329 -0.001949 -0.006533 -0.01202 Population (Thous) 1.076 2.741 4.243 5.409 6.376 7.296 8.147 Pop As % of US 0.0003908 0.0009868 0.001514 0.001913 0.002236 0.002537 0.002809
Variable 2007 2008 2009 2010 2011 2012 2013 Total Emp (Thous) 9.604 10.12 10.37 10.88 11.01 10.9 10.96 Total Emp As % of US 0.005372 0.005607 0.005702 0.005952 0.005976 0.00587 0.005856 Priv Non-Farm Emp (Thous) 9.088 9.555 9.759 10.24 10.33 10.19 10.22 Priv Non-Farm Emp As % of US 0.00597 0.006215 0.006302 0.00657 0.006575 0.00643 0.006397 GRP (Bil Fixed 92$) 0.383 0.4092 0.4195 0.4547 0.4633 0.4597 0.4658 Pers Inc (Bil Nom $) 0.5274 0.5732 0.6054 0.655 0.6886 0.7039 0.7285 Pers Inc As % of US 0.004681 0.004862 0.004917 0.005096 0.005133 0.005032 0.004997 Disp Pers Inc (Bil Nom $) 0.4152 0.4516 0.4777 0.5173 0.5447 0.5579 0.5781 PCE-Price Index (Fixed 92$) 0.1134 0.1173 0.1188 0.1226 0.1239 0.122 0.1205 Real Disp Pers Inc (Bil Fixed 92$) 0.1977 0.2122 0.221 0.236 0.2444 0.2462 0.2514 Real Disp Pers Inc Per Cap (Thous Fixed 92$) -0.01659 -0.02007 -0.02488 -0.02785 -0.03235 -0.03782 -0.04144 Population (Thous) 8.938 9.713 10.44 11.16 11.82 12.36 12.81 Pop As % of US 0.003056 0.003294 0.003514 0.003724 0.003914 0.004063 0.004177

Page 28
Optimistic Primary:Super Summary Table Differences as Compared to REMI Standard Reg Control
Variable 2014 2015 2016 2017 2018 2019 2020 Total Emp (Thous) 11.04 11.14 10.94 10.77 10.64 10.51 10.39 Total Emp As % of US 0.005849 0.005859 0.005712 0.005592 0.005494 0.005405 0.005329 Priv Non-Farm Emp (Thous) 10.28 10.37 10.15 9.979 9.845 9.719 9.607 Priv Non-Farm Emp As % of US 0.006376 0.006376 0.006197 0.006053 0.005939 0.005837 0.005752 GRP (Bil Fixed 92$) 0.4731 0.4827 0.4762 0.4724 0.4717 0.4715 0.473 Pers Inc (Bil Nom $) 0.7548 0.7836 0.7939 0.8068 0.8214 0.8376 0.8562 Pers Inc As % of US 0.004968 0.004949 0.004814 0.004693 0.004588 0.004492 0.00441 Disp Pers Inc (Bil Nom $) 0.5997 0.6231 0.6323 0.6434 0.6558 0.6694 0.6847 PCE-Price Index (Fixed 92$) 0.119 0.1178 0.1136 0.1091 0.1046 0.1007 0.09702 Real Disp Pers Inc (Bil Fixed 92$) 0.257 0.2631 0.2631 0.2641 0.2655 0.2671 0.2691 Real Disp Pers Inc Per Cap (Thous Fixed 92$) -0.04435 -0.04663 -0.04972 -0.05172 -0.05289 -0.0535 -0.05351 Population (Thous) 13.2 13.52 13.74 13.87 13.92 13.92 13.88 Pop As % of US 0.004269 0.00434 0.004378 0.004385 0.004369 0.004335 0.004289
Variable 2021 2022 2023 2024 2025 2026 2027 Total Emp (Thous) 10.27 10.16 10.06 9.941 9.808 9.858 9.891 Total Emp As % of US 0.005253 0.005188 0.005123 0.005056 0.00498 0.004993 0.004995 Priv Non-Farm Emp (Thous) 9.49 9.393 9.297 9.192 9.07 9.129 9.17 Priv Non-Farm Emp As % of US 0.005668 0.005599 0.005531 0.005461 0.00538 0.005404 0.005412 GRP (Bil Fixed 92$) 0.4744 0.4774 0.4805 0.4828 0.4843 0.497 0.5085 Pers Inc (Bil Nom $) 0.8757 0.8998 0.9251 0.9521 0.9784 1.024 1.074 Pers Inc As % of US 0.004331 0.004271 0.004213 0.00416 0.0041 0.004115 0.004135 Disp Pers Inc (Bil Nom $) 0.7007 0.7204 0.7411 0.7631 0.7846 0.8208 0.8614 PCE-Price Index (Fixed 92$) 0.09355 0.09073 0.08833 0.08612 0.08406 0.08458 0.08578 Real Disp Pers Inc (Bil Fixed 92$) 0.2711 0.2742 0.2772 0.2804 0.283 0.2899 0.2976 Real Disp Pers Inc Per Cap (Thous Fixed 92$) -0.05318 -0.05239 -0.0514 -0.05018 -0.04893 -0.04672 -0.04471 Population (Thous) 13.79 13.69 13.56 13.41 13.26 13.11 12.99 Pop As % of US 0.004231 0.004167 0.004097 0.004023 0.003945 0.003873 0.003809
Page 29
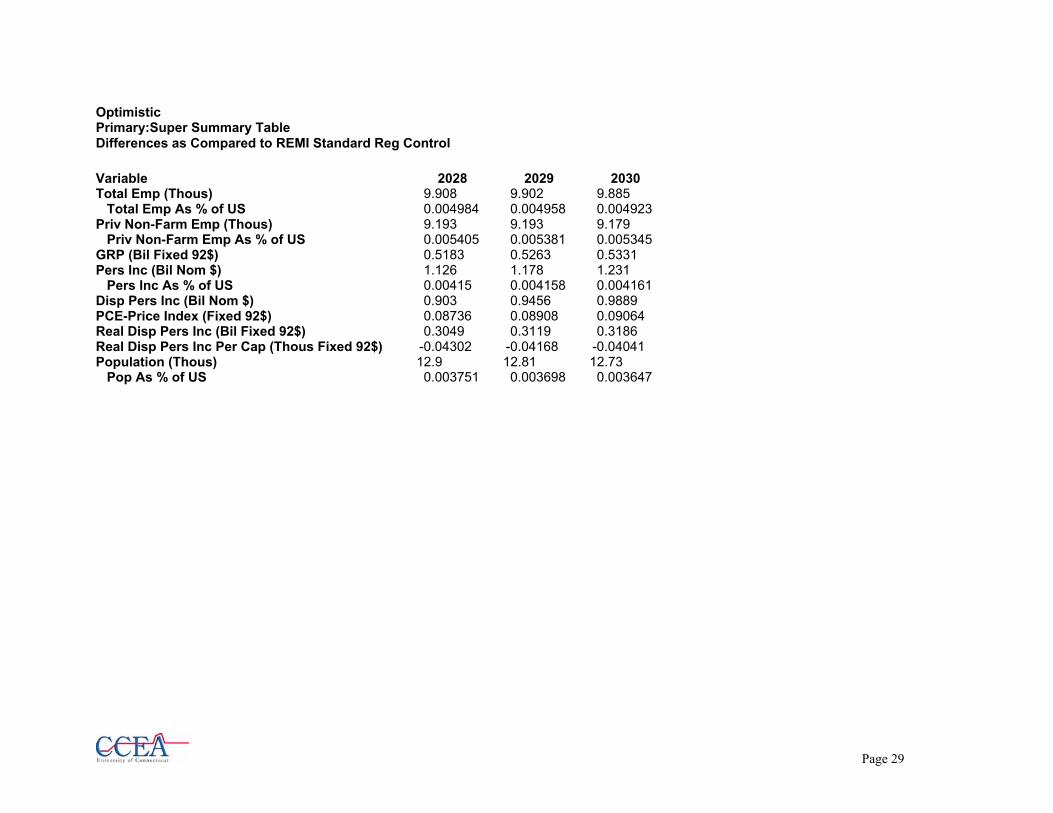
Optimistic Primary:Super Summary Table Differences as Compared to REMI Standard Reg Control
Variable 2028 2029 2030 Total Emp (Thous) 9.908 9.902 9.885 Total Emp As % of US 0.004984 0.004958 0.004923 Priv Non-Farm Emp (Thous) 9.193 9.193 9.179 Priv Non-Farm Emp As % of US 0.005405 0.005381 0.005345 GRP (Bil Fixed 92$) 0.5183 0.5263 0.5331 Pers Inc (Bil Nom $) 1.126 1.178 1.231 Pers Inc As % of US 0.00415 0.004158 0.004161 Disp Pers Inc (Bil Nom $) 0.903 0.9456 0.9889 PCE-Price Index (Fixed 92$) 0.08736 0.08908 0.09064 Real Disp Pers Inc (Bil Fixed 92$) 0.3049 0.3119 0.3186 Real Disp Pers Inc Per Cap (Thous Fixed 92$) -0.04302 -0.04168 -0.04041 Population (Thous) 12.9 12.81 12.73 Pop As % of US 0.003751 0.003698 0.003647

Page 30
Optimistic Fiscal (Bil 99$) Differences as Compared to REMI Standard Reg Control
Variable 2000 2001 2002 2003 2004 2005 2006 State Revenues at State Average Rates 0.03193 0.0422 0.04453 0.0425 0.04334 0.04611 0.0477 Local Revenues at Adjusted State Average Rates 0.005244 0.009372 0.01255 0.01478 0.01705 0.01945 0.02164 State Expenditures at State Average Rates -0.01743 -0.0102 0.0009175 0.01225 0.01994 0.02597 0.03249 Local Expenditures at Adjusted State Average Rates 0.001262 0.006433 0.01171 0.01621 0.01991 0.0234 0.02681
Variable 2007 2008 2009 2010 2011 2012 2013 2014 State Revenues at State Average Rates 0.04979 0.05289 0.05454 0.05803 0.05942 0.05922 0.05992 0.06077 Local Revenues at Adjusted State Average Rates 0.02381 0.02608 0.02801 0.03012 0.03195 0.03339 0.03474 0.03599 State Expenditures at State Average Rates 0.03822 0.0432 0.04842 0.05253 0.05776 0.06287 0.06641 0.06932 Local Expenditures at Adjusted State Average Rates 0.03003 0.03319 0.03594 0.03862 0.04124 0.04348 0.04525 0.04676
Variable 2015 2016 2017 2018 2019 2020 2021 2022 State Revenues at State Average Rates 0.06185 0.06122 0.06086 0.06077 0.06074 0.06084 0.06087 0.06103 Local Revenues at Adjusted State Average Rates 0.03716 0.03799 0.03866 0.03921 0.03965 0.04001 0.04027 0.04051 State Expenditures at State Average Rates 0.07161 0.07423 0.0759 0.07674 0.07709 0.07701 0.07665 0.0761 Local Expenditures at Adjusted State Average Rates 0.04802 0.04898 0.04957 0.04982 0.04984 0.04967 0.04935 0.04898
Variable 2023 2024 2025 2026 2027 2028 2029 2030 State Revenues at State Average Rates 0.06112 0.06114 0.06096 0.06194 0.06298 0.06389 0.06463 0.06526 Local Revenues at Adjusted State Average Rates 0.04068 0.04081 0.04087 0.04106 0.04134 0.04163 0.04194 0.04225 State Expenditures at State Average Rates 0.07538 0.07458 0.07375 0.07237 0.07139 0.07063 0.07007 0.06963 Local Expenditures at Adjusted State Average Rates 0.04851 0.04799 0.04742 0.04685 0.04645 0.04611 0.04584 0.0456

Page 31
Optimistic State Revenues at State Average Rates Differences as Compared to REMI Standard Reg Control
Variable 2000 2001 2002 2003 2004 2005 2006 Federal Intergovernmental 0.001007 0.002527 0.00388 0.004907 0.005741 0.006519 0.007225 Local Intergovernmental 0.00000192 0.00000493 0.00000777 0.00001008 0.00001207 0.00001403 0.0000159 Property Tax 0 0.00000001 0.00000002 0.00000003 0.00000004 0.00000004 0.00000005 General Sales Tax 0.00902 0.01104 0.01086 0.00968 0.009403 0.009724 0.009724 Motor Fuel Sales Tax 0.0008793 0.001078 0.001037 0.0008819 0.0008382 0.0008588 0.0008501 Alcoholic Bev Sales Tax 0.0000864 0.0001059 0.0001002 0.00008381 0.00007861 0.00007963 0.00007789 Tobacco Sales Tax 0.00008956 0.0001682 0.0002262 0.0002651 0.0003026 0.000342 0.0003774 Public Utility Sales Tax 0.0003926 0.0004813 0.000492 0.0004663 0.0004681 0.0004895 0.0004981 Other Sales Tax 0.002338 0.002862 0.002814 0.002509 0.002437 0.00252 0.00252 Individual Income Tax 0.006391 0.008325 0.008606 0.007992 0.008064 0.008566 0.008845 Corporate Income Tax 0.001456 0.001877 0.002003 0.001958 0.002047 0.002231 0.00236 Motor Vehicle License 0.0003942 0.0005228 0.0005471 0.0005149 0.0005257 0.0005633 0.0005876 Other Tax 0.0008129 0.001078 0.001128 0.001062 0.001084 0.001162 0.001212 Education Charges 0.0008605 0.001335 0.001565 0.00159 0.001621 0.001662 0.001656 Other Charges & Rev 0.0028 0.003714 0.003887 0.003658 0.003734 0.004002 0.004174 Utility&Liquor Store Rev 0.00004105 0.00005445 0.00005698 0.00005362 0.00005475 0.00005867 0.00006119 Unemployment Comp. 0.00306 0.003992 0.004154 0.003891 0.003899 0.004084 0.004164 Employee Retirement 0.001753 0.002326 0.002434 0.00229 0.002338 0.002506 0.002614 Workers' Comp. 0.0005438 0.0007094 0.0007382 0.0006915 0.0006929 0.0007259 0.0007399 Other Ins. Trust Rev 0 0 0 0 0 0 0

Page 32
Optimistic State Revenues at State Average Rates Differences as Compared to REMI Standard Reg Control
Variable 2007 2008 2009 2010 2011 2012 2013 Federal Intergovernmental 0.007869 0.00849 0.009029 0.009567 0.01005 0.01043 0.01072 Local Intergovernmental 0.0000177 0.0000195 0.00002101 0.00002255 0.00002398 0.00002516 0.00002612 Property Tax 0.00000006 0.00000006 0.00000007 0.00000007 0.00000008 0.00000008 0.00000009 General Sales Tax 0.009886 0.01036 0.01047 0.01111 0.01113 0.01074 0.01069 Motor Fuel Sales Tax 0.00086 0.0008984 0.0008906 0.0009272 0.0009216 0.0008772 0.0008636 Alcoholic Bev Sales Tax 0.00007797 0.00008063 0.00007951 0.00008252 0.00008166 0.0000774 0.000076 Tobacco Sales Tax 0.0004115 0.0004467 0.0004771 0.0005102 0.000539 0.0005608 0.0005799 Public Utility Sales Tax 0.0005127 0.0005368 0.000554 0.0005958 0.0006115 0.0006143 0.0006275 Other Sales Tax 0.002562 0.002686 0.002713 0.00288 0.002884 0.002783 0.00277 Individual Income Tax 0.00924 0.009847 0.01015 0.01078 0.01105 0.01098 0.01112 Corporate Income Tax 0.002518 0.002719 0.002845 0.003224 0.003343 0.003402 0.003502 Motor Vehicle License 0.0006189 0.0006634 0.0006893 0.0007351 0.0007596 0.0007629 0.0007776 Other Tax 0.001276 0.001368 0.001422 0.001516 0.001567 0.001573 0.001604 Education Charges 0.001662 0.001702 0.001705 0.001763 0.001779 0.001742 0.001738 Other Charges & Rev 0.004397 0.004713 0.004897 0.005222 0.005397 0.00542 0.005524 Utility&Liquor Store Rev 0.00006446 0.00006909 0.00007179 0.00007656 0.00007911 0.00007945 0.00008099 Unemployment Comp. 0.004297 0.004528 0.004636 0.004886 0.004954 0.004885 0.004902 Employee Retirement 0.002753 0.002951 0.003066 0.00327 0.003379 0.003394 0.003459 Workers' Comp. 0.0007637 0.0008046 0.0008239 0.0008684 0.0008803 0.0008682 0.0008711 Other Ins. Trust Rev 0 0 0 0 0 0 0

Page 33
Optimistic State Revenues at State Average Rates Differences as Compared to REMI Standard Reg Control
Variable 2014 2015 2016 2017 2018 2019 2020 Federal Intergovernmental 0.01094 0.01113 0.01122 0.01125 0.01121 0.01113 0.01102 Local Intergovernmental 0.00002695 0.00002765 0.00002813 0.00002842 0.00002853 0.00002852 0.00002841 Property Tax 0.00000009 0.0000001 0.0000001 0.0000001 0.0000001 0.00000011 0.00000011 General Sales Tax 0.01069 0.01077 0.0103 0.009933 0.009677 0.009457 0.009306 Motor Fuel Sales Tax 0.0008573 0.0008575 0.0008233 0.0008014 0.000788 0.0007785 0.0007752 Alcoholic Bev Sales Tax 0.00007525 0.00007512 0.00007198 0.00006999 0.00006873 0.00006785 0.00006753 Tobacco Sales Tax 0.0005968 0.0006113 0.0006198 0.000625 0.0006271 0.0006269 0.0006251 Public Utility Sales Tax 0.0006423 0.0006597 0.0006556 0.0006545 0.0006568 0.0006592 0.0006634 Other Sales Tax 0.002771 0.002792 0.00267 0.002574 0.002508 0.002451 0.002412 Individual Income Tax 0.01128 0.01147 0.01135 0.01129 0.01127 0.01127 0.0113 Corporate Income Tax 0.003603 0.003708 0.003719 0.003734 0.003757 0.003771 0.003786 Motor Vehicle License 0.0007937 0.0008114 0.0008096 0.0008111 0.0008143 0.000818 0.0008235 Other Tax 0.001637 0.001673 0.00167 0.001673 0.001679 0.001687 0.001698 Education Charges 0.001793 0.001934 0.002086 0.002289 0.002568 0.002873 0.003163 Other Charges & Rev 0.005639 0.005764 0.005752 0.005762 0.005785 0.005812 0.00585 Utility&Liquor Store Rev 0.00008266 0.0000845 0.00008432 0.00008447 0.00008481 0.0000852 0.00008576 Unemployment Comp. 0.004934 0.004987 0.004888 0.004819 0.004776 0.004747 0.00474 Employee Retirement 0.003531 0.003609 0.003601 0.003608 0.003622 0.003639 0.003663 Workers' Comp. 0.0008768 0.0008862 0.0008687 0.0008565 0.0008487 0.0008437 0.0008424 Other Ins. Trust Rev 0 0 0 0 0 0 0

Page 34
Optimistic State Revenues at State Average Rates Differences as Compared to REMI Standard Reg Control
Variable 2021 2022 2023 2024 2025 2026 2027 Federal Intergovernmental 0.01088 0.01074 0.01058 0.01042 0.01026 0.0101 0.009992 Local Intergovernmental 0.00002823 0.00002801 0.00002774 0.00002745 0.00002712 0.00002682 0.00002661 Property Tax 0.00000011 0.00000011 0.00000011 0.00000011 0.00000011 0.00000012 0.00000012 General Sales Tax 0.009168 0.009083 0.009009 0.008927 0.008817 0.009108 0.009358 Motor Fuel Sales Tax 0.0007744 0.0007806 0.000788 0.0007967 0.0008035 0.0008346 0.0008673 Alcoholic Bev Sales Tax 0.0000674 0.00006794 0.00006855 0.00006927 0.00006984 0.00007254 0.00007535 Tobacco Sales Tax 0.0006217 0.0006181 0.0006136 0.0006085 0.0006026 0.0005987 0.0005968 Public Utility Sales Tax 0.0006677 0.0006738 0.0006801 0.0006855 0.0006897 0.0007097 0.0007294 Other Sales Tax 0.002376 0.002354 0.002335 0.002314 0.002285 0.002361 0.002425 Individual Income Tax 0.01133 0.01142 0.0115 0.01159 0.01166 0.01195 0.01225 Corporate Income Tax 0.003795 0.003805 0.003813 0.00381 0.003803 0.003852 0.003897 Motor Vehicle License 0.0008289 0.0008377 0.0008462 0.0008554 0.0008626 0.0008838 0.0009071 Other Tax 0.00171 0.001728 0.001745 0.001764 0.001779 0.001823 0.001871 Education Charges 0.003381 0.003526 0.003604 0.00362 0.003541 0.003454 0.00338 Other Charges & Rev 0.005889 0.005951 0.006012 0.006077 0.006128 0.006279 0.006445 Utility&Liquor Store Rev 0.00008633 0.00008724 0.00008813 0.00008908 0.00008984 0.00009205 0.00009448 Unemployment Comp. 0.004739 0.004763 0.00479 0.004822 0.004845 0.004979 0.005117 Employee Retirement 0.003687 0.003726 0.003764 0.003805 0.003837 0.003931 0.004035 Workers' Comp. 0.0008422 0.0008465 0.0008512 0.000857 0.000861 0.0008849 0.0009094 Other Ins. Trust Rev 0 0 0 0 0 0 0

Page 35
Optimistic State Revenues at State Average Rates Differences as Compared to REMI Standard Reg Control
Variable 2028 2029 2030 Federal Intergovernmental 0.009896 0.009815 0.009742 Local Intergovernmental 0.00002643 0.00002629 0.00002616 Property Tax 0.00000012 0.00000012 0.00000012 General Sales Tax 0.009551 0.00968 0.009779 Motor Fuel Sales Tax 0.0008957 0.0009199 0.0009434 Alcoholic Bev Sales Tax 0.00007779 0.00007986 0.00008187 Tobacco Sales Tax 0.0005953 0.0005943 0.0005937 Public Utility Sales Tax 0.0007471 0.0007626 0.0007772 Other Sales Tax 0.002475 0.002509 0.002534 Individual Income Tax 0.01253 0.01278 0.01301 Corporate Income Tax 0.003935 0.003965 0.003992 Motor Vehicle License 0.0009291 0.0009497 0.0009696 Other Tax 0.001916 0.001959 0.002 Education Charges 0.003309 0.00322 0.003096 Other Charges & Rev 0.006601 0.006747 0.006888 Utility&Liquor Store Rev 0.00009677 0.00009891 0.000101 Unemployment Comp. 0.005241 0.005351 0.005449 Employee Retirement 0.004133 0.004224 0.004313 Workers' Comp. 0.0009315 0.0009509 0.0009683 Other Ins. Trust Rev 0 0 0

Page 36
Optimistic State Expenditures at State Average Rates Differences as Compared to REMI Standard Reg Control
Variable 2000 2001 2002 2003 2004 2005 Intergovernmental 0.0008841 0.002262 0.003563 0.004618 0.005532 0.006428 Higher Education 0.0003689 0.0009441 0.001487 0.001927 0.002309 0.002683 Elementary & Secondary Education; Libraries 0.00000391 0.00001003 0.00001579 0.00002047 0.00002452 0.00002849 Welfare -0.01264 -0.01118 -0.007173 -0.002494 0.0002469 0.002008 Health 0.0004385 0.001122 0.001767 0.002291 0.002744 0.003189 Transportation 0.00025 0.0006399 0.001008 0.001306 0.001565 0.001818 Police, Fire, Correction 0.0002133 0.0005458 0.0008596 0.001114 0.001335 0.001551 Natural Resources, Parks, Housing 0.00007184 0.0001838 0.0002895 0.0003753 0.0004496 0.0005224 Sewerage, Solid Waste 0.00004736 0.0001212 0.0001909 0.0002474 0.0002964 0.0003444 Administration & Unallocable 0.0004853 0.001242 0.001956 0.002535 0.003037 0.003529 Interest on Debt 0.0002896 0.0007411 0.001167 0.001513 0.001812 0.002106 Utilities, Transit 0.00006942 0.0001777 0.0002798 0.0003627 0.0004345 0.0005049 Insurance Trusts -0.007915 -0.007005 -0.004493 -0.001562 0.0001547 0.001258
Variable 2006 2007 2008 2009 2010 2011 2012 Intergovernmental 0.007286 0.00811 0.008937 0.00963 0.01033 0.01099 0.01153 Higher Education 0.003041 0.003385 0.00373 0.004019 0.004313 0.004587 0.004812 Elementary & Secondary Education; Libraries 0.0000323 0.00003595 0.00003961 0.00004268 0.0000458 0.00004871 0.0000511 Welfare 0.004155 0.005887 0.007152 0.008855 0.009858 0.01165 0.01362 Health 0.003614 0.004023 0.004433 0.004777 0.005126 0.005451 0.005719 Transportation 0.002061 0.002294 0.002528 0.002724 0.002923 0.003109 0.003261 Police, Fire, Correction 0.001758 0.001957 0.002156 0.002324 0.002494 0.002652 0.002782 Natural Resources, Parks, Housing 0.0005922 0.0006592 0.0007264 0.0007827 0.0008399 0.0008932 0.000937 Sewerage, Solid Waste 0.0003904 0.0004346 0.0004789 0.000516 0.0005537 0.0005889 0.0006178 Administration & Unallocable 0.004001 0.004453 0.004907 0.005287 0.005674 0.006034 0.00633 Interest on Debt 0.002387 0.002657 0.002928 0.003155 0.003386 0.003601 0.003777 Utilities, Transit 0.0005723 0.000637 0.0007019 0.0007564 0.0008116 0.0008632 0.0009055 Insurance Trusts 0.002602 0.003687 0.00448 0.005547 0.006175 0.007298 0.00853

Page 37
Optimistic State Expenditures at State Average Rates Differences as Compared to REMI Standard Reg Control
Variable 2013 2014 2015 2016 2017 2018 Intergovernmental 0.01197 0.01235 0.01267 0.01289 0.01302 0.01307 Higher Education 0.004996 0.005154 0.005288 0.00538 0.005435 0.005457 Elementary & Secondary Education; Libraries 0.00005306 0.00005474 0.00005616 0.00005713 0.00005772 0.00005795 Welfare 0.01483 0.0158 0.01651 0.01765 0.01839 0.01879 Health 0.005938 0.006126 0.006285 0.006394 0.00646 0.006486 Transportation 0.003386 0.003493 0.003584 0.003646 0.003684 0.003699 Police, Fire, Correction 0.002889 0.00298 0.003057 0.00311 0.003142 0.003155 Natural Resources, Parks, Housing 0.0009729 0.001004 0.00103 0.001048 0.001058 0.001063 Sewerage, Solid Waste 0.0006414 0.0006617 0.0006789 0.0006907 0.0006978 0.0007006 Administration & Unallocable 0.006572 0.00678 0.006956 0.007077 0.00715 0.007179 Interest on Debt 0.003922 0.004046 0.004151 0.004223 0.004267 0.004284 Utilities, Transit 0.0009402 0.0009699 0.0009952 0.001012 0.001023 0.001027 Insurance Trusts 0.009292 0.0099 0.01034 0.01105 0.01152 0.01177
Variable 2019 2020 2021 2022 2023 2024 Intergovernmental 0.01307 0.01302 0.01293 0.01284 0.01271 0.01258 Higher Education 0.005455 0.005435 0.005399 0.005357 0.005307 0.00525 Elementary & Secondary Education; Libraries 0.00005794 0.00005772 0.00005734 0.0000569 0.00005636 0.00005575 Welfare 0.01901 0.01907 0.01904 0.01891 0.01873 0.01854 Health 0.006484 0.006459 0.006416 0.006367 0.006307 0.006239 Transportation 0.003698 0.003684 0.003659 0.003631 0.003597 0.003558 Police, Fire, Correction 0.003154 0.003142 0.003121 0.003097 0.003068 0.003035 Natural Resources, Parks, Housing 0.001062 0.001058 0.001051 0.001043 0.001033 0.001022 Sewerage, Solid Waste 0.0007004 0.0006978 0.0006931 0.0006878 0.0006813 0.000674 Administration & Unallocable 0.007177 0.007149 0.007102 0.007047 0.006981 0.006906 Interest on Debt 0.004283 0.004266 0.004238 0.004206 0.004166 0.004121 Utilities, Transit 0.001027 0.001023 0.001016 0.001008 0.0009986 0.0009879 Insurance Trusts 0.01191 0.01195 0.01193 0.01185 0.01174 0.01161

Page 38
Optimistic State Expenditures at State Average Rates Differences as Compared to REMI Standard Reg Control
Variable 2025 2026 2027 2028 2029 2030 Intergovernmental 0.01243 0.01229 0.01219 0.01211 0.01205 0.01199 Higher Education 0.005186 0.005129 0.005089 0.005056 0.005028 0.005003 Elementary & Secondary Education; Libraries 0.00005508 0.00005447 0.00005405 0.00005369 0.0000534 0.00005313 Welfare 0.01836 0.01781 0.01741 0.01712 0.01692 0.01678 Health 0.006164 0.006096 0.006049 0.006009 0.005976 0.005946 Transportation 0.003515 0.003476 0.00345 0.003427 0.003408 0.003391 Police, Fire, Correction 0.002999 0.002965 0.002942 0.002923 0.002907 0.002892 Natural Resources, Parks, Housing 0.00101 0.0009988 0.0009911 0.0009845 0.0009791 0.0009742 Sewerage, Solid Waste 0.0006659 0.0006585 0.0006534 0.0006491 0.0006455 0.0006423 Administration & Unallocable 0.006823 0.006747 0.006695 0.006651 0.006615 0.006581 Interest on Debt 0.004071 0.004026 0.003995 0.003969 0.003947 0.003927 Utilities, Transit 0.000976 0.0009652 0.0009578 0.0009514 0.0009462 0.0009415 Insurance Trusts 0.0115 0.01115 0.01091 0.01072 0.0106 0.01051

Page 39
Optimistic Local Revenues at Adjusted State Average Rates Differences as Compared to REMI Standard Reg Control
Variable 2000 2001 2002 2003 2004 2005 2006 2007 Federal Intergovernmental 0.0001038 0.0002604 0.0003998 0.0005057 0.0005916 0.0006718 0.0007446 0.0008109 State Intergovernmental 0.0008253 0.002111 0.003325 0.00431 0.005163 0.006 0.006801 0.00757 Property Tax 0.001504 0.003244 0.004867 0.006229 0.007477 0.008701 0.009855 0.01097 General Sales Tax 0.00000009 0.00000011 0.00000011 0.0000001 0.0000001 0.0000001 0.0000001 0.0000001 Motor Fuel Sales Tax 0 0 0 0 0 0 0 0 Alcoholic Bev Sales Tax 0 0 0 0 0 0 0 0 Tobacco Sales Tax 0 0 0 0 0 0 0 0 Public Utility Sales Tax 0 0 0 0 0 0 0 0 Other Sales Tax 0.00000026 0.00000032 0.00000032 0.00000028 0.00000027 0.00000028 0.00000028 0.00000029 Individual Income Tax 0 0 0 0 0 0 0 0 Corporate Income Tax 0 0 0 0 0 0 0 0 Motor Vehicle License 0 0 0 0 0 0 0 0 Other Tax 0.0001056 0.0001401 0.0001466 0.000138 0.0001408 0.0001509 0.0001574 0.0001658 Education Charges 0.0001215 0.0001885 0.0002209 0.0002244 0.0002288 0.0002347 0.0002339 0.0002346 Other Charges & Rev 0.001448 0.001921 0.00201 0.001892 0.001931 0.00207 0.002159 0.002274 Utility&Liquor Store Rev 0.0007186 0.0009531 0.0009973 0.0009387 0.0009583 0.001027 0.001071 0.001128 Unemployment Comp. 0 0 0 0 0 0 0 0 Employee Retirement 0.000417 0.0005531 0.0005788 0.0005447 0.0005561 0.000596 0.0006216 0.0006548

Page 40
Optimistic Local Revenues at Adjusted State Average Rates Differences as Compared to REMI Standard Reg Control
Variable 2008 2009 2010 2011 2012 2013 2014 2015 Federal Intergovernmental 0.0008749 0.0009304 0.0009859 0.001036 0.001075 0.001104 0.001128 0.001147 State Intergovernmental 0.008342 0.008989 0.009645 0.01026 0.01076 0.01117 0.01153 0.01183 Property Tax 0.01209 0.01315 0.01422 0.01522 0.0161 0.01691 0.01766 0.01838 General Sales Tax 0.0000001 0.00000011 0 0.00000012 0.0000001 0.00000011 0.00000011 0.00000011 Motor Fuel Sales Tax 0 0 0 0 0 0 0 0 Alcoholic Bev Sales Tax 0 0 0 0 0 0 0 0 Tobacco Sales Tax 0 0 0 0 0 0 0 0 Public Utility Sales Tax 0 0 0 0 0 0 0 0 Other Sales Tax 0.0000003 0.0000003 0.00000032 0.00000032 0.00000031 0.00000031 0.00000031 0.00000031 Individual Income Tax 0 0 0 0 0 0 0 0 Corporate Income Tax 0 0 0 0 0 0 0 0 Motor Vehicle License 0 0 0 0 0 0 0 0 Other Tax 0.0001777 0.0001847 0.000197 0.0002035 0.0002044 0.0002084 0.0002127 0.0002174 Education Charges 0.0002403 0.0002407 0.0002489 0.0002512 0.000246 0.0002454 0.0002532 0.0002731 Other Charges & Rev 0.002437 0.002532 0.002701 0.002791 0.002803 0.002857 0.002916 0.002981 Utility&Liquor Store Rev 0.001209 0.001257 0.00134 0.001385 0.001391 0.001418 0.001447 0.001479 Unemployment Comp. 0 0 0 0 0 0 0 0 Employee Retirement 0.0007018 0.0007293 0.0007777 0.0008037 0.0008071 0.0008227 0.0008397 0.0008584

Page 41
Optimistic Local Revenues at Adjusted State Average Rates Differences as Compared to REMI Standard Reg Control
Variable 2016 2017 2018 2019 2020 2021 2022 2023 Federal Intergovernmental 0.001156 0.001159 0.001155 0.001147 0.001135 0.001121 0.001107 0.001091 State Intergovernmental 0.01203 0.01216 0.0122 0.0122 0.01215 0.01207 0.01198 0.01187 Property Tax 0.01898 0.01949 0.01994 0.02032 0.02065 0.02095 0.02121 0.02144 General Sales Tax 0.00000011 0.0000001 0.0000001 0.0000001 0.0000001 0.00000009 0.00000009 0.00000009 Motor Fuel Sales Tax 0 0 0 0 0 0 0 0 Alcoholic Bev Sales Tax 0 0 0 0 0 0 0 0 Tobacco Sales Tax 0 0 0 0 0 0 0 0 Public Utility Sales Tax 0 0 0 0 0 0 0 0 Other Sales Tax 0.0000003 0.00000029 0.00000028 0.0000002 0.00000027 0.00000027 0.0000002 0.00000026 Individual Income Tax 0 0 0 0 0 0 0 0 Corporate Income Tax 0 0 0 0 0 0 0 0 Motor Vehicle License 0 0 0 0 0 0 0 0 Other Tax 0.0002169 0.0002173 0.0002182 0.0002192 0.0002206 0.0002221 0.0002245 0.0002267 Education Charges 0.0002946 0.0003232 0.0003626 0.0004057 0.0004465 0.0004774 0.0004978 0.0005088 Other Charges & Rev 0.002974 0.00298 0.002992 0.003005 0.003025 0.003045 0.003078 0.003109 Utility&Liquor Store Rev 0.001476 0.001479 0.001485 0.001491 0.001501 0.001511 0.001527 0.001543 Unemployment Comp. 0 0 0 0 0 0 0 0 Employee Retirement 0.0008565 0.0008581 0.0008615 0.0008655 0.0008712 0.000877 0.0008863 0.0008953

Page 42
Optimistic Local Revenues at Adjusted State Average Rates Differences as Compared to REMI Standard Reg Control
Variable 2024 2025 2026 2027 2028 2029 2030 Federal Intergovernmental 0.001074 0.001057 0.001041 0.00103 0.00102 0.001011 0.001004 State Intergovernmental 0.01174 0.0116 0.01147 0.01138 0.01131 0.01125 0.01119 Property Tax 0.02165 0.02183 0.02203 0.02226 0.0225 0.02275 0.02301 General Sales Tax 0.00000009 0.00000009 0.00000009 0.0000001 0.0000001 0.0000001 0.0000001 Motor Fuel Sales Tax 0 0 0 0 0 0 0 Alcoholic Bev Sales Tax 0 0 0 0 0 0 0 Tobacco Sales Tax 0 0 0 0 0 0 0 Public Utility Sales Tax 0 0 0 0 0 0 0 Other Sales Tax 0.00000026 0.00000026 0.00000026 0.00000027 0.00000028 0.00000028 0.00000028 Individual Income Tax 0 0 0 0 0 0 0 Corporate Income Tax 0 0 0 0 0 0 0 Motor Vehicle License 0 0 0 0 0 0 0 Other Tax 0.0002292 0.0002311 0.0002368 0.0002431 0.0002489 0.0002545 0.0002598 Education Charges 0.0005111 0.0005 0.0004877 0.0004772 0.0004671 0.0004546 0.0004371 Other Charges & Rev 0.003143 0.003169 0.003247 0.003333 0.003414 0.003489 0.003562 Utility&Liquor Store Rev 0.001559 0.001573 0.001611 0.001654 0.001694 0.001731 0.001768 Unemployment Comp. 0 0 0 0 0 0 0 Employee Retirement 0.000905 0.0009126 0.000935 0.0009597 0.000983 0.001005 0.001026

Page 43
Optimistic Local Expenditures at Adjusted State Average Rates Differences as Compared to REMI Standard Reg Control
Variable 2000 2001 2002 2003 2004 2005 Intergovernmental 0.00000071 0.0000018 0.00000288 0.00000373 0.00000447 0.0000052 Higher Education 0 0 0 0 0 0 Elementary & Secondary Education; Libraries 0.001618 0.00414 0.00652 0.008451 0.01012 0.01176 Welfare -0.001086 -0.0009615 -0.0006167 -0.0002144 0.00002122 0.0001726 Health 0.00002985 0.0000764 0.0001203 0.000156 0.0001868 0.0002171 Transportation 0.0001302 0.0003333 0.0005249 0.0006804 0.0008151 0.0009471 Police, Fire, Correction 0.0003297 0.0008438 0.001329 0.001722 0.002063 0.002398 Natural Resources, Parks, Housing 0.000178 0.0004555 0.0007174 0.0009299 0.001114 0.001294 Sewerage, Solid Waste 0.0001873 0.0004794 0.000755 0.0009787 0.001172 0.001362 Administration & Unallocable 0.0004686 0.001199 0.001889 0.002448 0.002933 0.003408 Interest on Debt 0.00008686 0.0002223 0.0003501 0.0004538 0.0005436 0.0006317 Utilities, Transit 0.0001464 0.0003748 0.0005902 0.0007651 0.0009165 0.001065 Insurance Trusts -0.0008266 -0.0007315 -0.0004692 -0.0001631 0.00001615 0.0001314
Variable 2006 2007 2008 2009 2010 2011 Intergovernmental 0.00000589 0.00000656 0.00000723 0.00000779 0.00000836 0.00000889 Higher Education 0 0 0 0 0 0 Elementary & Secondary Education; Libraries 0.01334 0.01484 0.01636 0.01762 0.01891 0.02011 Welfare 0.0003572 0.0005061 0.000615 0.0007614 0.0008476 0.001002 Health 0.0002461 0.0002739 0.0003018 0.0003252 0.000349 0.0003712 Transportation 0.001074 0.001195 0.001317 0.001419 0.001523 0.001619 Police, Fire, Correction 0.002718 0.003025 0.003334 0.003592 0.003855 0.004099 Natural Resources, Parks, Housing 0.001467 0.001633 0.0018 0.001939 0.002081 0.002213 Sewerage, Solid Waste 0.001544 0.001719 0.001894 0.002041 0.00219 0.002329 Administration & Unallocable 0.003863 0.0043 0.004738 0.005106 0.005479 0.005827 Interest on Debt 0.0007161 0.000797 0.0008783 0.0009463 0.001016 0.00108 Utilities, Transit 0.001207 0.001344 0.001481 0.001595 0.001712 0.001821 Insurance Trusts 0.0002718 0.0003851 0.0004679 0.0005792 0.0006449 0.0007621

Page 44
Optimistic Local Expenditures at Adjusted State Average Rates Differences as Compared to REMI Standard Reg Control
Variable 2012 2013 2014 2015 2016 2017 Intergovernmental 0.00000932 0.00000968 0.00000999 0.00001025 0.00001043 0.00001054 Higher Education 0 0 0 0 0 0 Elementary & Secondary Education; Libraries 0.0211 0.02191 0.0226 0.02319 0.02359 0.02383 Welfare 0.001171 0.001275 0.001359 0.00142 0.001517 0.001581 Health 0.0003894 0.0004043 0.0004171 0.0004279 0.0004353 0.0004398 Transportation 0.001699 0.001764 0.00182 0.001867 0.001899 0.001919 Police, Fire, Correction 0.0043 0.004465 0.004606 0.004726 0.004808 0.004857 Natural Resources, Parks, Housing 0.002322 0.002411 0.002487 0.002551 0.002596 0.002622 Sewerage, Solid Waste 0.002443 0.002537 0.002617 0.002685 0.002732 0.00276 Administration & Unallocable 0.006112 0.006347 0.006547 0.006717 0.006834 0.006904 Interest on Debt 0.001133 0.001176 0.001214 0.001245 0.001267 0.00128 Utilities, Transit 0.00191 0.001983 0.002046 0.002099 0.002136 0.002158 Insurance Trusts 0.0008908 0.0009704 0.001034 0.00108 0.001154 0.001203
Variable 2018 2019 2020 2021 2022 2023 Intergovernmental 0.00001058 0.00001058 0.00001054 0.00001047 0.00001039 0.00001029 Higher Education 0 0 0 0 0 0 Elementary & Secondary Education; Libraries 0.02393 0.02392 0.02383 0.02367 0.02349 0.02327 Welfare 0.001616 0.001634 0.00164 0.001637 0.001626 0.001611 Health 0.0004416 0.0004414 0.0004398 0.0004369 0.0004335 0.0004294 Transportation 0.001926 0.001926 0.001919 0.001906 0.001891 0.001873 Police, Fire, Correction 0.004877 0.004876 0.004857 0.004825 0.004788 0.004743 Natural Resources, Parks, Housing 0.002633 0.002632 0.002622 0.002605 0.002585 0.00256 Sewerage, Solid Waste 0.002771 0.00277 0.00276 0.002741 0.00272 0.002695 Administration & Unallocable 0.006932 0.00693 0.006904 0.006858 0.006805 0.006741 Interest on Debt 0.001285 0.001285 0.00128 0.001271 0.001261 0.001249 Utilities, Transit 0.002166 0.002166 0.002157 0.002143 0.002127 0.002107 Insurance Trusts 0.001229 0.001244 0.001247 0.001245 0.001237 0.001226

Page 45
Optimistic Local Expenditures at Adjusted State Average Rates Differences as Compared to REMI Standard Reg Control
Variable 2024 2025 2026 2027 2028 2029 Intergovernmental 0.00001018 0.00001006 0.00000994 0.00000986 0.0000098 0.00000974 Higher Education 0 0 0 0 0 0 Elementary & Secondary Education; Libraries 0.02302 0.02274 0.02249 0.02232 0.02217 0.02205 Welfare 0.001594 0.001578 0.001531 0.001497 0.001472 0.001455 Health 0.0004248 0.0004197 0.000415 0.0004118 0.0004091 0.0004069 Transportation 0.001853 0.001831 0.001811 0.001797 0.001785 0.001775 Police, Fire, Correction 0.004692 0.004635 0.004584 0.004549 0.004518 0.004494 Natural Resources, Parks, Housing 0.002533 0.002502 0.002475 0.002456 0.002439 0.002426 Sewerage, Solid Waste 0.002666 0.002634 0.002605 0.002585 0.002567 0.002553 Administration & Unallocable 0.006669 0.006588 0.006516 0.006465 0.006422 0.006387 Interest on Debt 0.001236 0.001221 0.001208 0.001198 0.00119 0.001184 Utilities, Transit 0.002084 0.002059 0.002036 0.00202 0.002007 0.001996 Insurance Trusts 0.001213 0.001201 0.001165 0.001139 0.00112 0.001107
Variable 2030 Intergovernmental 0.00000969 Higher Education 0 Elementary & Secondary Education; Libraries 0.02194 Welfare 0.001443 Health 0.0004048 Transportation 0.001766 Police, Fire, Correction 0.004471 Natural Resources, Parks, Housing 0.002414 Sewerage, Solid Waste 0.00254 Administration & Unallocable 0.006355 Interest on Debt 0.001178 Utilities, Transit 0.001986 Insurance Trusts 0.001098

Page 46